J.S. Colton, ODMR of self-assembled InAs QDs Optically-Detected Electron Spin Resonance of Self-Assembled InAs Quantum Dots Talk for APS March Meeting, Mar 15, 2010 John S. Colton, Brigham Young University Undergraduate students: Mitch Jones, Steve Brown, Dallas Smith, Scott Thalman, and Ken Clark Samples provided by Allan Bracker, Naval Research Laboratory (ODESR = ODMR, “optically- detected magnetic resonance”)
Transcript
J.S. Colton, ODMR of self-assembled InAs QDs
Optically-Detected Electron Spin Resonance of
Self-Assembled InAs Quantum Dots
Talk for APS March Meeting, Mar 15, 2010
John S. Colton, Brigham Young UniversityUndergraduate students: Mitch Jones, Steve Brown,
Dallas Smith, Scott Thalman, and Ken Clark
Samples provided by Allan Bracker, Naval Research Laboratory
(ODESR = ODMR, “optically-detected magnetic resonance”)
J.S. Colton, ODMR of self-assembled InAs QDs
Two things we easily learn from ODMR:• g-factor via peak position
– hf = gBBresonant
• T2* spin lifetime (“inhomogeneous
dephasing time”) via peak width– (T2
*)-1 = gBBhalfwidth
• |g| = 0.349, T2* 9.4 ns
14 nm GaAs quantum well
Energy
B
+½
–½
E = g B B
Spin Resonance: Zeeman effect
J.S. Colton, ODMR of self-assembled InAs QDs
Compare to time-resolved Faraday/Kerr rotation:
• g-factor through frequency of oscillation– hf = gBB
• T2* through decay of oscillation
– e-t/T2*
Kikkawa & Awschalom, 1997
Two things we easily learn from ODMR:• g-factor via peak position
• T2* spin lifetime via peak width
Bloch Sphere
J.S. Colton, ODMR of self-assembled InAs QDs
ODMR with Kerr rotation detection
Sample in cryostat/superconductingmagnet
Difference signal
Computer
data
control
Microwave source/amplifier
Resonantcavity
Microwave resonance affectsspin polarization
horiz
Linearly polarizedcw probelaser
Polarizingbeam splitter
Balanced detector
vert
PIN diode switch
reference
Lockin amplifier
Pulse sequencegenerator
control
proportional to polarization angle proportional to spin polarization
J.S. Colton, ODMR of self-assembled InAs QDs
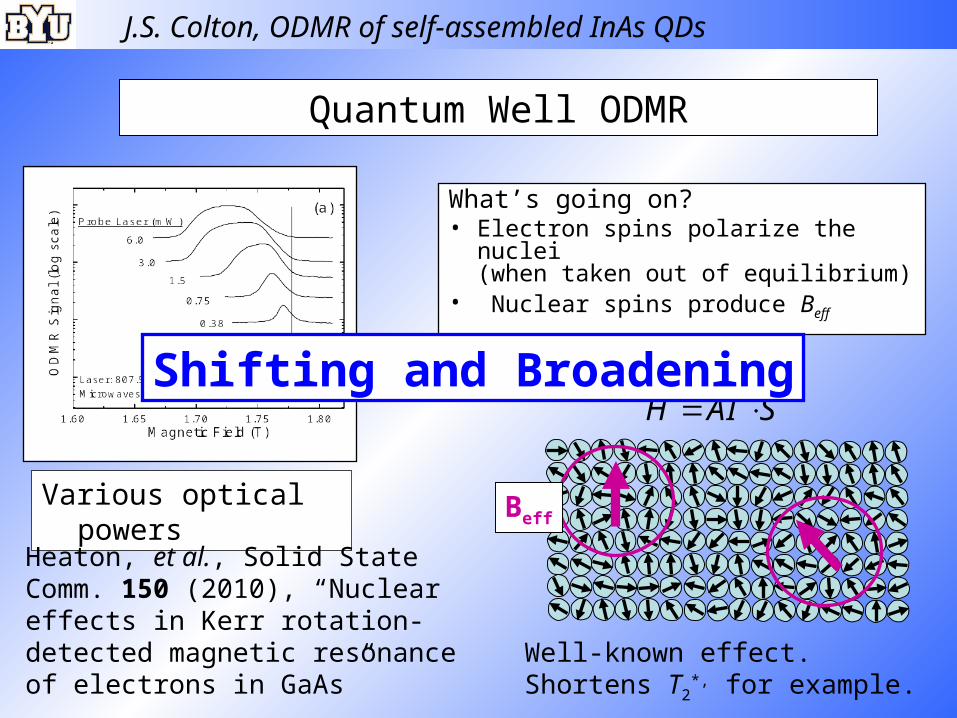
Quantum Well ODMR
What’s going on?• Electron spins polarize the nuclei
(when taken out of equilibrium)• Nuclear spins produce Beff
Various optical powers
Heaton, et al., Solid State Comm. 150 (2010), “Nuclear effects in Kerr rotation-detected magnetic resonance of electrons in GaAs”
Beff
Well-known effect. Shortens T2
*, for example.
SIAH
Shifting and Broadening
J.S. Colton, ODMR of self-assembled InAs QDs
Quantum well, cont.: Wavelength Dependence
Idea: select out particular QDs via wavelength
Kerr.Rot. (non-resonant) Kerr.Rot. ODMR
Exciton Trion
Tune laser to here:
J.S. Colton, ODMR of self-assembled InAs QDs
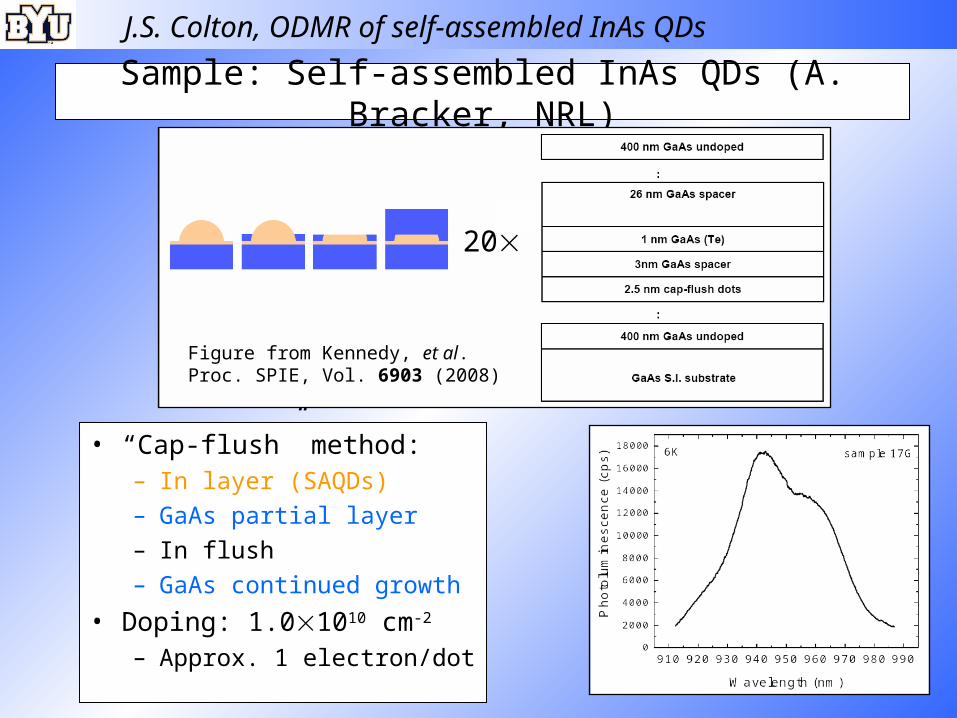
Sample: Self-assembled InAs QDs (A. Bracker, NRL)
• “Cap-flush” method: – In layer (SAQDs)– GaAs partial layer– In flush– GaAs continued growth
• Doping: 1.01010 cm-2
– Approx. 1 electron/dot
20
Figure from Kennedy, et al.Proc. SPIE, Vol. 6903 (2008)
J.S. Colton, ODMR of self-assembled InAs QDs
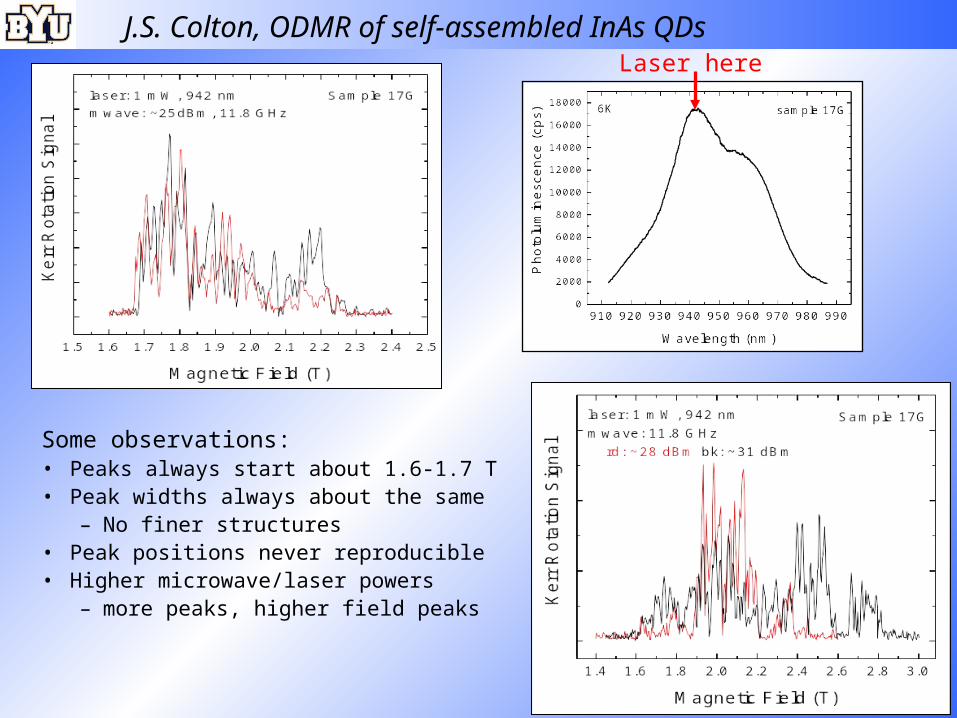
Some observations:• Peaks always start about 1.6-1.7 T• Peak widths always about the same
– No finer structures • Peak positions never reproducible• Higher microwave/laser powers
– more peaks, higher field peaks
Laser here
J.S. Colton, ODMR of self-assembled InAs QDs
• Peak position: |g//| = 0.485 • Peak width: T2
* = 2.9 ns
• Frequency: |g| = 0.43
• Decay at 2T: T2* = 0.4 ns
• Faster decay at high fields due to g-factor inhomogenity– In a more heavily doped sample,
g 0.1 (possibly less than that, here)– Pulsed laser (more spectral bandwidth)
From Kennedy, et al. (unpublished)
Compare to time-resolved Kerr.Rot. of this sample:
Weakest microwave power:
J.S. Colton, ODMR of self-assembled InAs QDs
What’s going on here?
• Single peak T2* values of ~3 ns (vs. 0.4 ns) argue that
we are seeing signal from a much more homogeneous subset of QDs, perhaps individual dots– Close to theoretical value expected for isolated QDs
(from nuclear spin fluctuations changing during measurement)
• T2* = 4.6 ns for nearly isolated donors in GaAs
- Colton et al., Solid State Comm (2004)
• Peaks from 1.6 - 2.8 T would correspond to |g| = 0.30 to 0.53.– A bit higher than g = 0.1 from time-resolved Kerr rot.– Are these the true resonant fields? Or shifted due to
Beff (nuclear)?
J.S. Colton, ODMR of self-assembled InAs QDs
The $64,000 questions
• Are we seeing spin resonance of individual QDs at these different fields?– Don’t know– Would be remarkable– If not, each peak is at least from a very
homogeneous group, with essentially the same g-factor
• Could nuclear polarization perhaps explain why peaks are occurring at different fields?– Don’t know– Would require all electrons in group to be shifting
together (peaks are apparently merging together, not broadening)
J.S. Colton, ODMR of self-assembled InAs QDs
Conclusion
• Saw ODMR from doped electrons in an InAs SAQD sample.
• Wavelength selected out a small subset of QDs– Individual QDs?
• May/may not have had nuclear spin effects causing ODMR peaks to shift
• At the very least, it’s interesting!
Where do we go from here?
• More precise optical/microwave power dependence• Simultaneous rf to resonate nuclei• Sample with density gradient?