Page 1
PNNL-22135
Prepared for the U.S. Army Corps of Engineers, Portland District under an Interagency Agreement with the U.S. Department of Energy Contract DE-AC05-76RL01830
JSATS Detector Software Manual EY Choi AE Flory BL LaMarche MA Weiland June 2014
Page 3
PNNL-22135
JSATS Detector Software Manual
EY Choi
AE Flory
BL LaMarche
MA Weiland
June 2014
Prepared for
the U.S. Department of Energy
under Contract DE-AC05-76RL01830
Pacific Northwest National Laboratory
Richland, Washington 99352
Page 4
iii
Preface
The Juvenile Salmon Acoustic Telemetry System (JSATS) software user’s manual presented here
describes the installation and use of the JSATS detector software. The software was developed for use
with the JSATS cabled array system for detecting acoustic signals from acoustic micro-transmitters
implanted in fish and digitizing the acoustic signal. A complementary manual describes the use of the
decoder software used for decoding the digitized acoustic signals and recording the decoded information
to file. This software was developed by the Pacific Northwest National Laboratory (PNNL) for the U.S.
Army Corps of Engineers, Portland District (USACE) to assist with estimating dam passage survival and
other performance measures stipulated by the 2008 Federal Columbia River Power System Biological
Opinion (BiOp) and the 2008 Columbia Basin Fish Accords.
Many others made significant contributions to the development and testing of this software, including
Tom Carlson, Daniel Deng, Tao Fu, Jayson Martinez, Tylor Abel, Yong Yuan, and Tom Seim.
Page 5
iv
Acronyms and Abbreviations
ADC analog-to-digital converter
AGC automated gain control
AMT acoustic micro-transmitter
bwm binary waveform
CSV or .csv comma separated value
dB decibel
DC direct current
DIP switch dual inline package switch
DSP digital signal processor
FPGA field programmable gate array
GB gigabyte(s)
GHz gigahertz
GMT Greenwich Mean Time
GPS global positioning system
GUI graphical user interface
JSATS Juvenile Salmon Acoustic Telemetry System
LED light-emitting diode
mV millivolt(s)
PC personal computer
PCI peripheral component interconnect
RMS root mean square
SNR signal-to-noise ratio
TOA time of arrival
USACE U.S. Army Corps of Engineers
UTC Coordinated Universal Time
Vrms volts root mean square
Page 6
v
Contents
Preface .................................................................................................................................................. iii
Acronyms and Abbreviations ............................................................................................................... iv
1.0 Introduction .................................................................................................................................. 1
2.0 System Requirements ................................................................................................................... 2
2.1 Hardware Requirements ....................................................................................................... 3
2.2 Operating System Requirements .......................................................................................... 3
2.3 Required Utility Packages .................................................................................................... 3
3.0 Installation .................................................................................................................................... 4
3.1 Required Utility Software Installation ................................................................................. 4
3.1.1 .net Framework 4.0 .................................................................................................... 4
3.1.2 Meinberg Radio Clock Monitoring Software and Board Installation ....................... 4
3.1.3 P25M Innovative Integration Software Installation .................................................. 5
3.2 GPS and DSP Board Installation .......................................................................................... 8
3.3 Detector Software Installation .............................................................................................. 8
4.0 JSATS Detector Software Interface.............................................................................................. 12
4.1 File Menu ............................................................................................................................. 12
4.2 Configure Settings ................................................................................................................ 13
4.2.1 Logic File (exo file) ................................................................................................... 13
4.2.2 Coff File (out file) ..................................................................................................... 13
4.2.3 Save Directory ........................................................................................................... 13
4.2.4 Base Waveform Filename and Board Number .......................................................... 14
4.3 Capture Settings ................................................................................................................... 14
4.3.1 Channel Naming ........................................................................................................ 15
4.3.2 Threshold Settings ..................................................................................................... 16
4.3.3 Noise Level ............................................................................................................... 17
4.3.4 Voltage Set ................................................................................................................ 17
4.4 Voltage Control Settings ...................................................................................................... 17
4.4.1 Voltage Control 1 ...................................................................................................... 17
4.4.2 Voltage Control 2 ...................................................................................................... 19
4.4.3 Automated Gain Control ........................................................................................... 20
4.4.4 RMS and Voltage Recording .................................................................................... 20
4.5 Auto Restart Controls ........................................................................................................... 20
4.5.1 File Menu .................................................................................................................. 20
4.5.2 Enabling Auto Restart ............................................................................................... 21
4.5.3 Edit Restart Time Option .......................................................................................... 21
5.0 Detection of Candidate JSATS Tag Signals ................................................................................. 21
Page 7
vi
5.1 Starting JSATS Tag Detection ............................................................................................. 22
6.0 File Formats .................................................................................................................................. 27
6.1 BWM Files ........................................................................................................................... 27
6.2 RMS CSV Files .................................................................................................................... 28
7.0 References .................................................................................................................................... 29
Figures
1.1 Flowchart Depicting the Flow of Data for the JSATS Cabled Receiver. .................................... 1
1.2. Structure of the JSATS Cabled Array System and JSATS Software. ......................................... 2
3.1. Command Prompt Running Setup Batch File. ............................................................................ 5
3.2. Installation of Drivers, Security Warning. .................................................................................. 5
3.3. Main Installation Menu for Installation of the P25M2 DSP Boards. .......................................... 6
3.4. Malibu RED Installation progress Bar During Installation of the Files for
the P25M2 DSP Boards. ............................................................................................................. 7
3.5. Second Popup Window During the MalibuRed Installation Process for
Visual C++ Installation. .............................................................................................................. 7
3.6. Installation Complete Dialog Requesting Shutdown of the Computer. ...................................... 8
3.7. To Begin Installation Double-Click on the JSATS Installer Package. ........................................ 9
3.8. To Begin Installation Double-Click on the JSATS Installer Package. ........................................ 9
3.9. Select the Folder Installation Location for the JSATS Detector (first install screen). ................ 10
3.10. Select the Next Button in the Confirm Installation Dialog Box to Initiate the
Install Process (second install screen). ........................................................................................ 10
3.11. Installation Progress is Indicated in the Installing JSATS Detector Dialog Box
by the Progress Bar (third install screen). ................................................................................... 11
3.12. The Successful Installation of the JSATS Detector Will Be Indicated in the
Installation Complete Dialog Box (final install screen). ............................................................. 11
4.1. JSATS Detector Window and Three Main Tabs; Configure, Capture and
Voltage Control. .......................................................................................................................... 12
4.2. The Dropdown File Menu in the JSATS Detector Startup Window Allows Settings
to Be Loaded or Saved. ............................................................................................................... 13
4.3. Example of the Save Directory and Base Waveform Filename Sections of the
Configure Tab Populated with Variable Names. ........................................................................ 14
4.4. The Capture Tab in the JSATS Detector Startup Window Allows the User to
Select Settings and Track Capture Status. ................................................................................... 15
4.5. Examples of Channel Naming in the Capture Tab ...................................................................... 16
4.6. The Voltage Control 1 Tab in the Voltage Control Section of the JSATS
Detector Window Allows Parameter Modifications for the Receiving Channels
of DSP Board 1. .......................................................................................................................... 18
Page 8
vii
4.7. The Voltage Control 2 Tab in the Voltage Control Section of the JSATS
Detector Window Allows Parameter Modifications for the Receiving
Channels of DSP Board 2. .......................................................................................................... 19
4.8. The File Menu for the JSATS Auto Restart Detector Function. ................................................. 21
4.9. The Detector Auto Restart File Menu Showing the Auto Restart Function Enabled ................. 21
4.10. The Edit System Restart Time Dialog Box ................................................................................. 21
5.1. Select the Coefficient File by Choosing the Gear Icon Button Found in the
Detector Toolbar Located near the Top of the JSATS Detector Window .................................. 22
5.2. The JSATS Detector Dialog Box Showing the exo File-Loading Progress Bar. ........................ 22
5.3. The JSATS Detector Window Toolbar Showing the Location of the Go Icon Button. .............. 23
5.4. The JSATS Auto Restart Dialog Box Showing the Typical Detector Screen
Immediately Following Auto Start with the “GPS Synchronize Time” Displayed
at the Bottom. .............................................................................................................................. 23
5.5. The JSATS Detector Dialog Box Showing Green LEDs Indicating DSP Board 1 .....................
Is Receiving Data Packets Containing Candidate JSATS Tag Signals. ...................................... 24
5.6. The JSATS Detector Dialog Box Showing the Green LEDs that Indicate that
Both DSP Boards are Enabled and are Receiving Data Packets Containing
Candidate JSATS Tag Signals. ................................................................................................... 25
5.7. The Capture Tab JSATS Detector Dialog Box Indicates Detector Noise and
Threshold Status. ......................................................................................................................... 26
5.8. The JSATS Detector Window Toolbar Showing the Location of the Stop Button ..................... 26
5.9. The JSATS Auto Restart Detector Menu Screen after the Detector Has Been Stopped. ........ 27
Tables
2.1. Minimum Computer Requirements for Operation of the JSATS Detector with
GPS and P25M2 DSP Boards. .................................................................................................... 3
6.1. Noise File Data Showing DC Input and RMS Noise Levels for Two Channels of a
Single DSP Board. ...................................................................................................................... 28
Page 9
1
1.0 Introduction
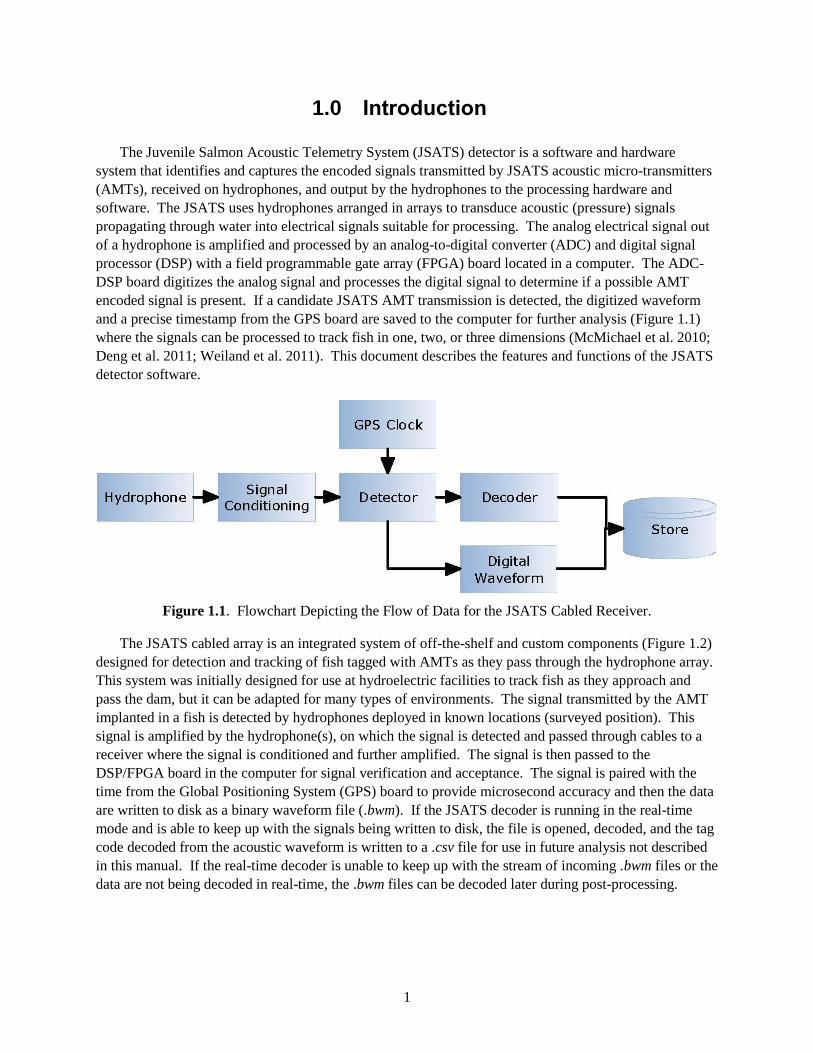
The Juvenile Salmon Acoustic Telemetry System (JSATS) detector is a software and hardware
system that identifies and captures the encoded signals transmitted by JSATS acoustic micro-transmitters
(AMTs), received on hydrophones, and output by the hydrophones to the processing hardware and
software. The JSATS uses hydrophones arranged in arrays to transduce acoustic (pressure) signals
propagating through water into electrical signals suitable for processing. The analog electrical signal out
of a hydrophone is amplified and processed by an analog-to-digital converter (ADC) and digital signal
processor (DSP) with a field programmable gate array (FPGA) board located in a computer. The ADC-
DSP board digitizes the analog signal and processes the digital signal to determine if a possible AMT
encoded signal is present. If a candidate JSATS AMT transmission is detected, the digitized waveform
and a precise timestamp from the GPS board are saved to the computer for further analysis (Figure 1.1)
where the signals can be processed to track fish in one, two, or three dimensions (McMichael et al. 2010;
Deng et al. 2011; Weiland et al. 2011). This document describes the features and functions of the JSATS
detector software.
Figure 1.1. Flowchart Depicting the Flow of Data for the JSATS Cabled Receiver.
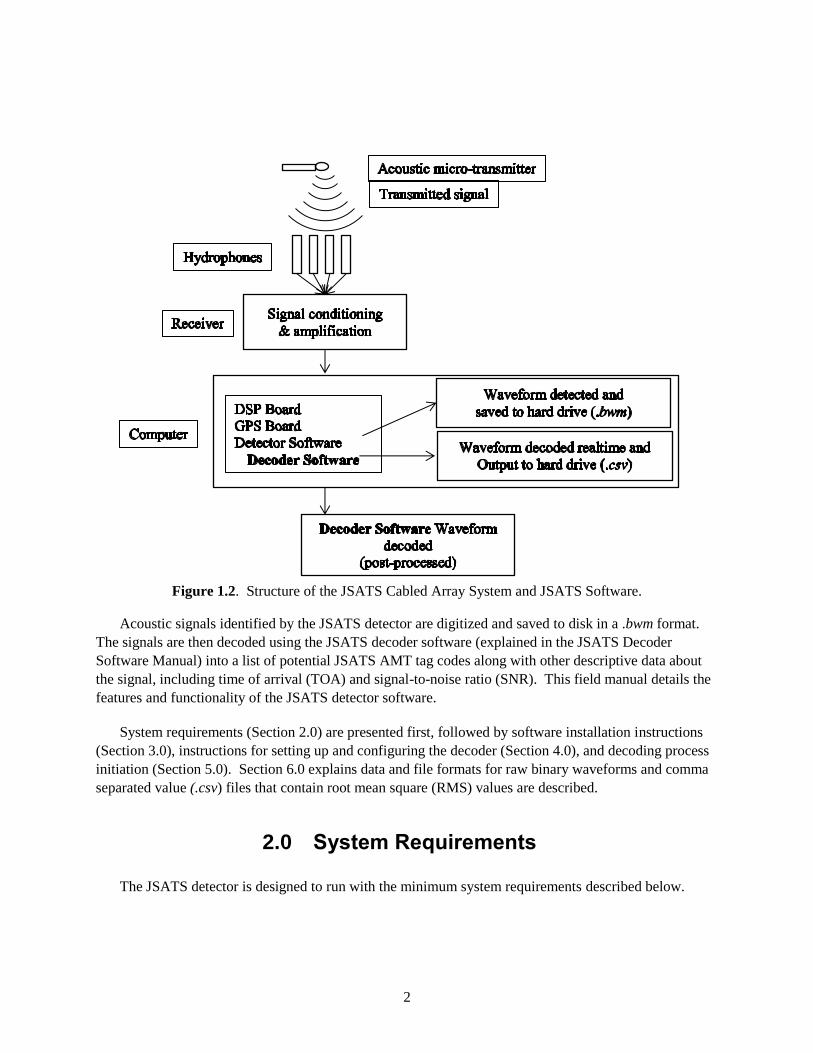
The JSATS cabled array is an integrated system of off-the-shelf and custom components (Figure 1.2)
designed for detection and tracking of fish tagged with AMTs as they pass through the hydrophone array.
This system was initially designed for use at hydroelectric facilities to track fish as they approach and
pass the dam, but it can be adapted for many types of environments. The signal transmitted by the AMT
implanted in a fish is detected by hydrophones deployed in known locations (surveyed position). This
signal is amplified by the hydrophone(s), on which the signal is detected and passed through cables to a
receiver where the signal is conditioned and further amplified. The signal is then passed to the
DSP/FPGA board in the computer for signal verification and acceptance. The signal is paired with the
time from the Global Positioning System (GPS) board to provide microsecond accuracy and then the data
are written to disk as a binary waveform file (.bwm). If the JSATS decoder is running in the real-time
mode and is able to keep up with the signals being written to disk, the file is opened, decoded, and the tag
code decoded from the acoustic waveform is written to a .csv file for use in future analysis not described
in this manual. If the real-time decoder is unable to keep up with the stream of incoming .bwm files or the
data are not being decoded in real-time, the .bwm files can be decoded later during post-processing.
Page 10
2
Figure 1.2. Structure of the JSATS Cabled Array System and JSATS Software.
Acoustic signals identified by the JSATS detector are digitized and saved to disk in a .bwm format.
The signals are then decoded using the JSATS decoder software (explained in the JSATS Decoder
Software Manual) into a list of potential JSATS AMT tag codes along with other descriptive data about
the signal, including time of arrival (TOA) and signal-to-noise ratio (SNR). This field manual details the
features and functionality of the JSATS detector software.
System requirements (Section 2.0) are presented first, followed by software installation instructions
(Section 3.0), instructions for setting up and configuring the decoder (Section 4.0), and decoding process
initiation (Section 5.0). Section 6.0 explains data and file formats for raw binary waveforms and comma
separated value (.csv) files that contain root mean square (RMS) values are described.
2.0 System Requirements
The JSATS detector is designed to run with the minimum system requirements described below.
Page 11
3
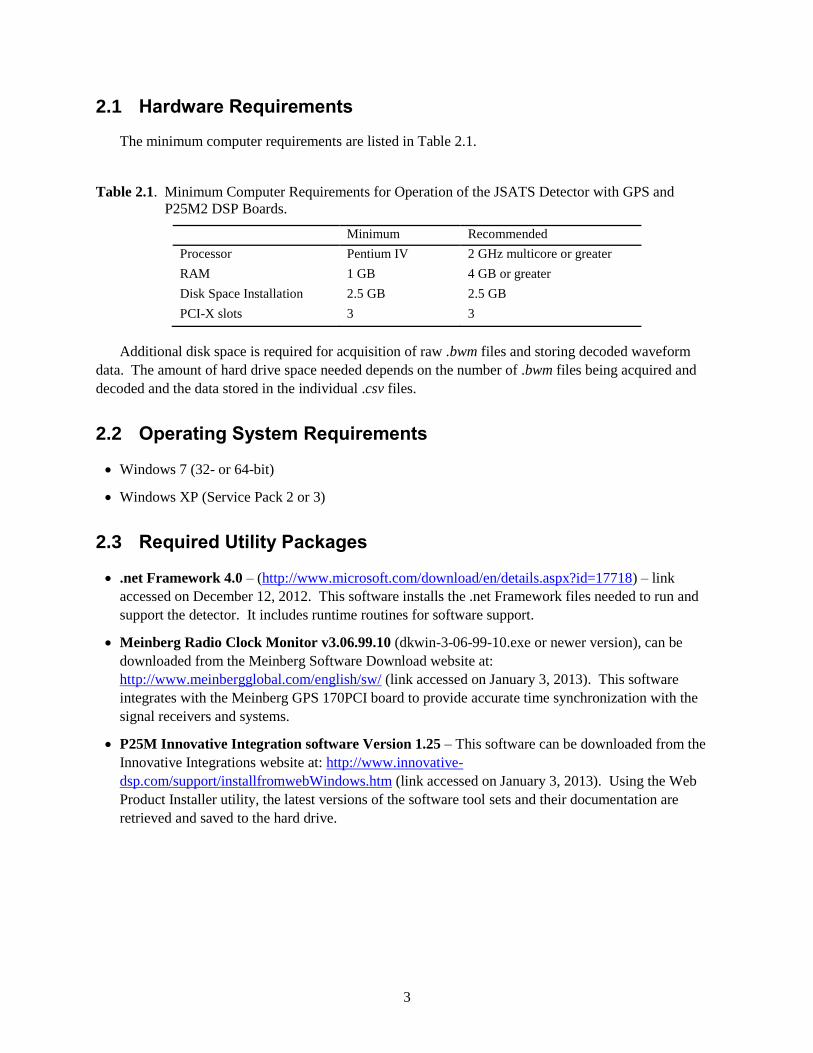
2.1 Hardware Requirements
The minimum computer requirements are listed in Table 2.1.
Table 2.1. Minimum Computer Requirements for Operation of the JSATS Detector with GPS and
P25M2 DSP Boards.
Minimum Recommended
Processor Pentium IV 2 GHz multicore or greater
RAM 1 GB 4 GB or greater
Disk Space Installation 2.5 GB 2.5 GB
PCI-X slots 3 3
Additional disk space is required for acquisition of raw .bwm files and storing decoded waveform
data. The amount of hard drive space needed depends on the number of .bwm files being acquired and
decoded and the data stored in the individual .csv files.
2.2 Operating System Requirements
Windows 7 (32- or 64-bit)
Windows XP (Service Pack 2 or 3)
2.3 Required Utility Packages
.net Framework 4.0 – (http://www.microsoft.com/download/en/details.aspx?id=17718) – link
accessed on December 12, 2012. This software installs the .net Framework files needed to run and
support the detector. It includes runtime routines for software support.
Meinberg Radio Clock Monitor v3.06.99.10 (dkwin-3-06-99-10.exe or newer version), can be
downloaded from the Meinberg Software Download website at:
http://www.meinbergglobal.com/english/sw/ (link accessed on January 3, 2013). This software
integrates with the Meinberg GPS 170PCI board to provide accurate time synchronization with the
signal receivers and systems.
P25M Innovative Integration software Version 1.25 – This software can be downloaded from the
Innovative Integrations website at: http://www.innovative-
dsp.com/support/installfromwebWindows.htm (link accessed on January 3, 2013). Using the Web
Product Installer utility, the latest versions of the software tool sets and their documentation are
retrieved and saved to the hard drive.
Page 12
4
3.0 Installation
To install and use the JSATS detector, the three software packages listed above in Section 2.3 need to
be installed on the acquisition computer prior to installing the Innovative Integration P25M2 DSP boards
into the computer.
3.1 Required Utility Software Installation
The required utility packages are installed as described below.
3.1.1 .net Framework 4.0
The .net Framework 4.0 software is installed on the JSATS acquisition computer without any
configuration needed.
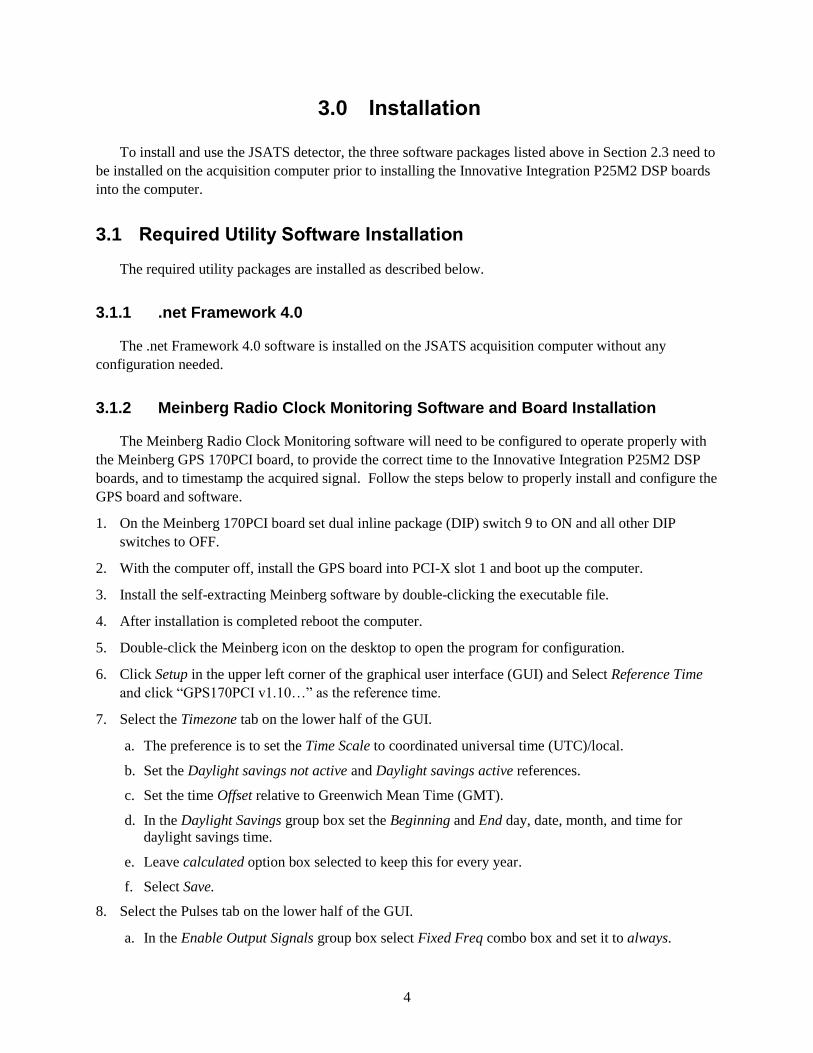
3.1.2 Meinberg Radio Clock Monitoring Software and Board Installation
The Meinberg Radio Clock Monitoring software will need to be configured to operate properly with
the Meinberg GPS 170PCI board, to provide the correct time to the Innovative Integration P25M2 DSP
boards, and to timestamp the acquired signal. Follow the steps below to properly install and configure the
GPS board and software.
1. On the Meinberg 170PCI board set dual inline package (DIP) switch 9 to ON and all other DIP
switches to OFF.
2. With the computer off, install the GPS board into PCI-X slot 1 and boot up the computer.
3. Install the self-extracting Meinberg software by double-clicking the executable file.
4. After installation is completed reboot the computer.
5. Double-click the Meinberg icon on the desktop to open the program for configuration.
6. Click Setup in the upper left corner of the graphical user interface (GUI) and Select Reference Time
and click “GPS170PCI v1.10…” as the reference time.
7. Select the Timezone tab on the lower half of the GUI.
a. The preference is to set the Time Scale to coordinated universal time (UTC)/local.
b. Set the Daylight savings not active and Daylight savings active references.
c. Set the time Offset relative to Greenwich Mean Time (GMT).
d. In the Daylight Savings group box set the Beginning and End day, date, month, and time for
daylight savings time.
e. Leave calculated option box selected to keep this for every year.
f. Select Save.
8. Select the Pulses tab on the lower half of the GUI.
a. In the Enable Output Signals group box select Fixed Freq combo box and set it to always.
Page 13
5
b. In the Enable Output Signals group box select Pulses combo box and set it to after sync.
c. On the Out3 tab within the Pulses Tab set Function to DCF77 Marks and timeout to “0” [min].
3.1.3 P25M Innovative Integration Software Installation
The Innovative Integration software and drivers need to be installed on the data acquisition computer
prior to installation of the DSP boards. Follow the steps below to properly install and configure the DSP
boards.
1. Open the CD provided by Innovative Integration, Version 4.53 with the Innovative Integration P25M
drivers.
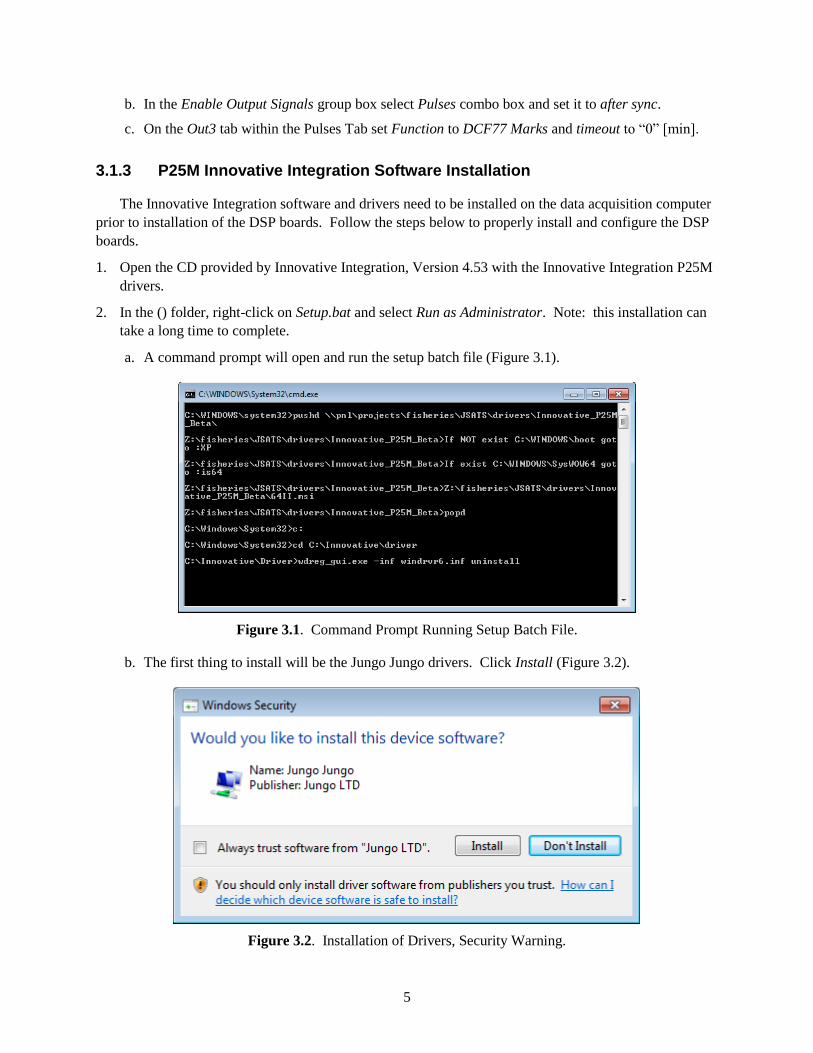
2. In the () folder, right-click on Setup.bat and select Run as Administrator. Note: this installation can
take a long time to complete.
a. A command prompt will open and run the setup batch file (Figure 3.1).
Figure 3.1. Command Prompt Running Setup Batch File.
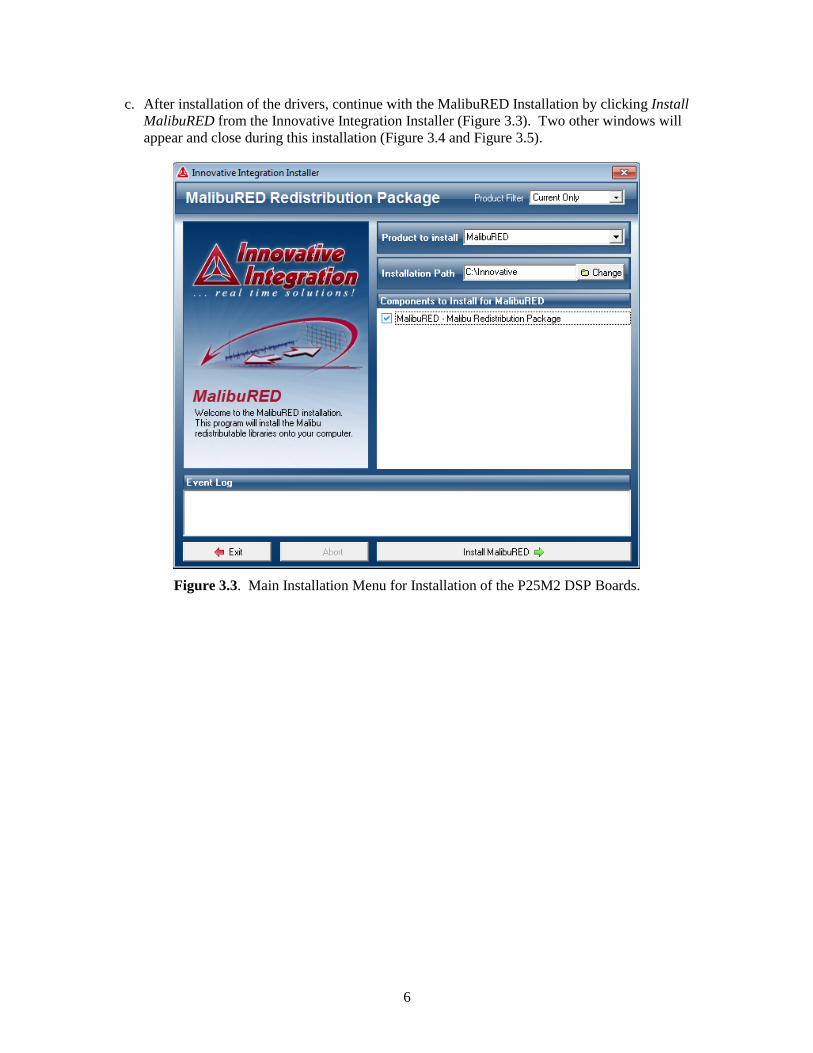
b. The first thing to install will be the Jungo Jungo drivers. Click Install (Figure 3.2).
Figure 3.2. Installation of Drivers, Security Warning.
Page 14
6
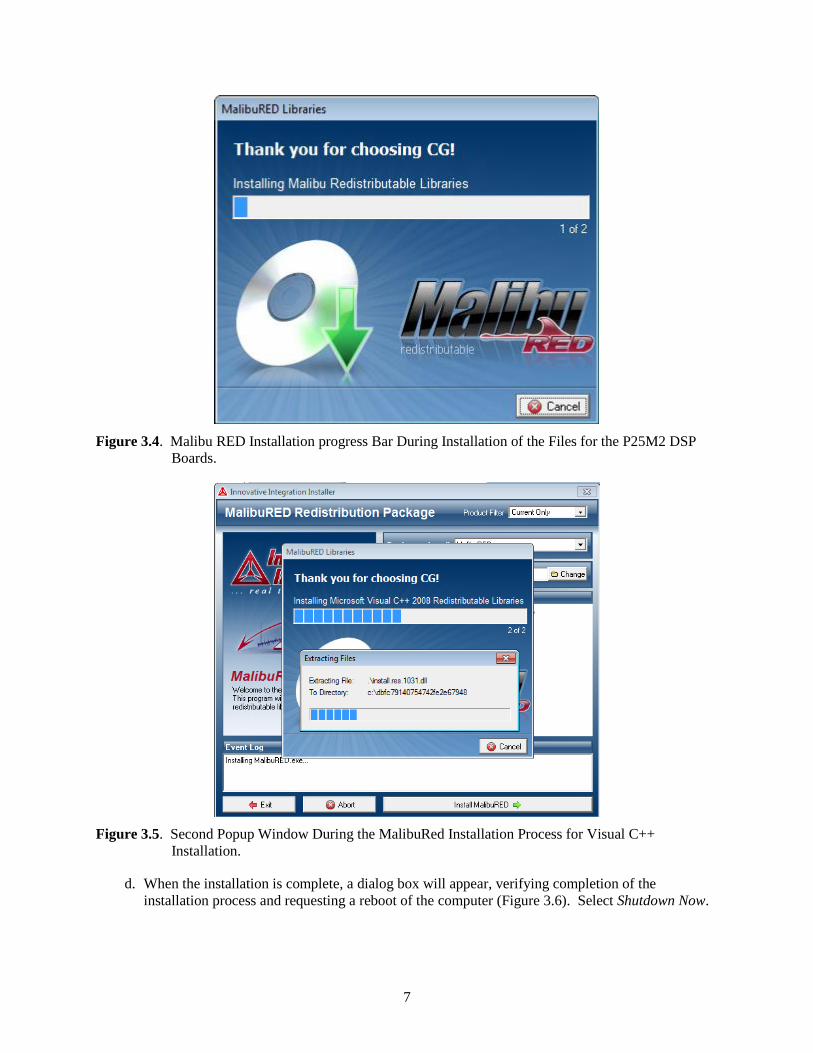
c. After installation of the drivers, continue with the MalibuRED Installation by clicking Install
MalibuRED from the Innovative Integration Installer (Figure 3.3). Two other windows will
appear and close during this installation (Figure 3.4 and Figure 3.5).
Figure 3.3. Main Installation Menu for Installation of the P25M2 DSP Boards.
Page 15
7
Figure 3.4. Malibu RED Installation progress Bar During Installation of the Files for the P25M2 DSP
Boards.
Figure 3.5. Second Popup Window During the MalibuRed Installation Process for Visual C++
Installation.
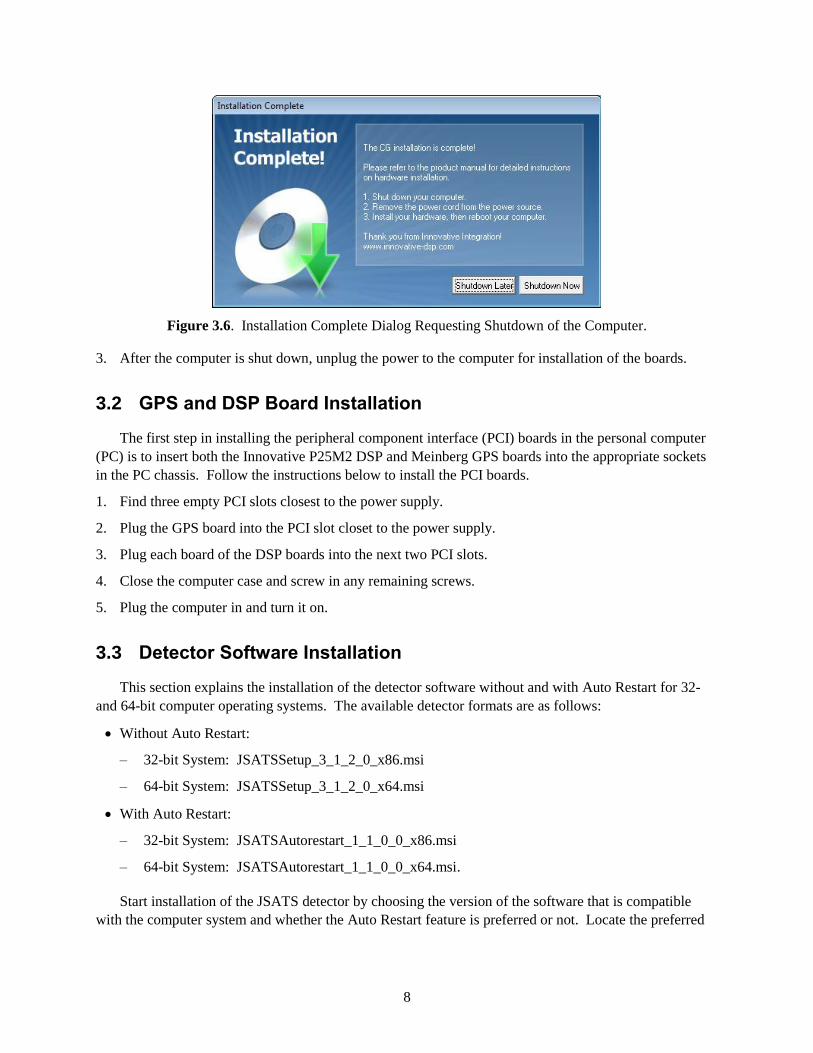
d. When the installation is complete, a dialog box will appear, verifying completion of the
installation process and requesting a reboot of the computer (Figure 3.6). Select Shutdown Now.
Page 16
8
Figure 3.6. Installation Complete Dialog Requesting Shutdown of the Computer.
3. After the computer is shut down, unplug the power to the computer for installation of the boards.
3.2 GPS and DSP Board Installation
The first step in installing the peripheral component interface (PCI) boards in the personal computer
(PC) is to insert both the Innovative P25M2 DSP and Meinberg GPS boards into the appropriate sockets
in the PC chassis. Follow the instructions below to install the PCI boards.
1. Find three empty PCI slots closest to the power supply.
2. Plug the GPS board into the PCI slot closet to the power supply.
3. Plug each board of the DSP boards into the next two PCI slots.
4. Close the computer case and screw in any remaining screws.
5. Plug the computer in and turn it on.
3.3 Detector Software Installation
This section explains the installation of the detector software without and with Auto Restart for 32-
and 64-bit computer operating systems. The available detector formats are as follows:
Without Auto Restart:
– 32-bit System: JSATSSetup_3_1_2_0_x86.msi
– 64-bit System: JSATSSetup_3_1_2_0_x64.msi
With Auto Restart:
– 32-bit System: JSATSAutorestart_1_1_0_0_x86.msi
– 64-bit System: JSATSAutorestart_1_1_0_0_x64.msi.
Start installation of the JSATS detector by choosing the version of the software that is compatible
with the computer system and whether the Auto Restart feature is preferred or not. Locate the preferred
Page 17
9
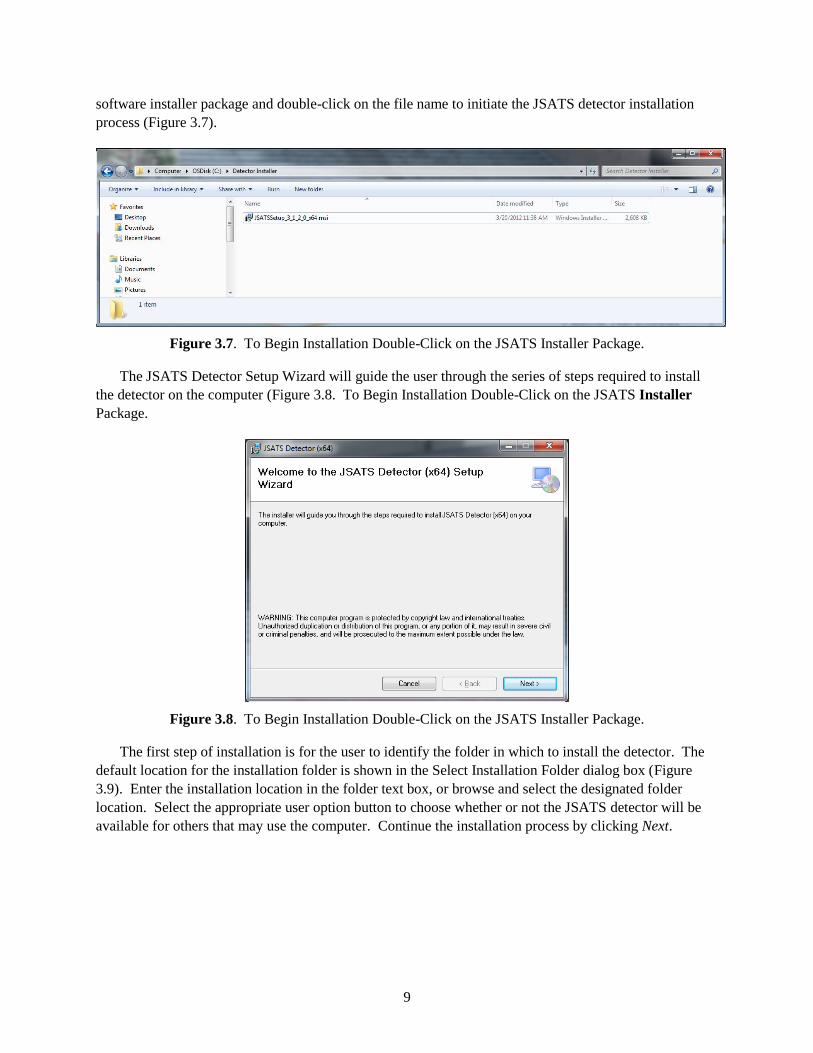
software installer package and double-click on the file name to initiate the JSATS detector installation
process (Figure 3.7).
Figure 3.7. To Begin Installation Double-Click on the JSATS Installer Package.
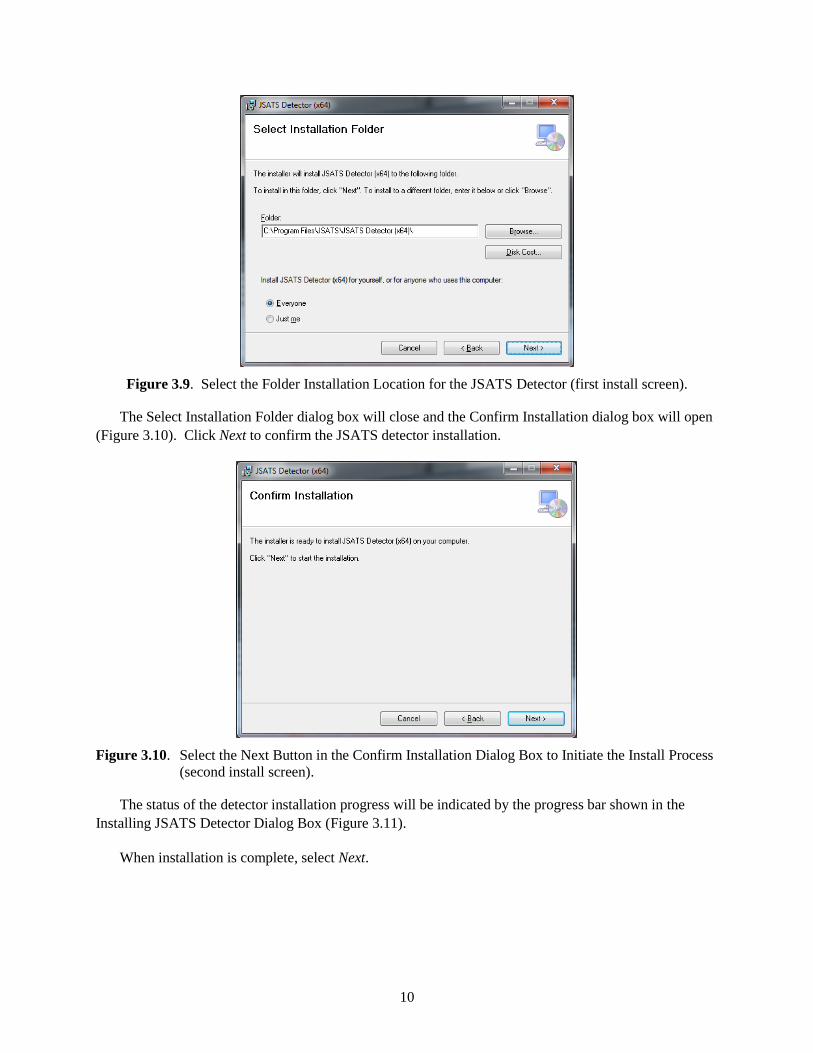
The JSATS Detector Setup Wizard will guide the user through the series of steps required to install
the detector on the computer (Figure 3.8. To Begin Installation Double-Click on the JSATS Installer
Package.
Figure 3.8. To Begin Installation Double-Click on the JSATS Installer Package.
The first step of installation is for the user to identify the folder in which to install the detector. The
default location for the installation folder is shown in the Select Installation Folder dialog box (Figure
3.9). Enter the installation location in the folder text box, or browse and select the designated folder
location. Select the appropriate user option button to choose whether or not the JSATS detector will be
available for others that may use the computer. Continue the installation process by clicking Next.
Page 18
10
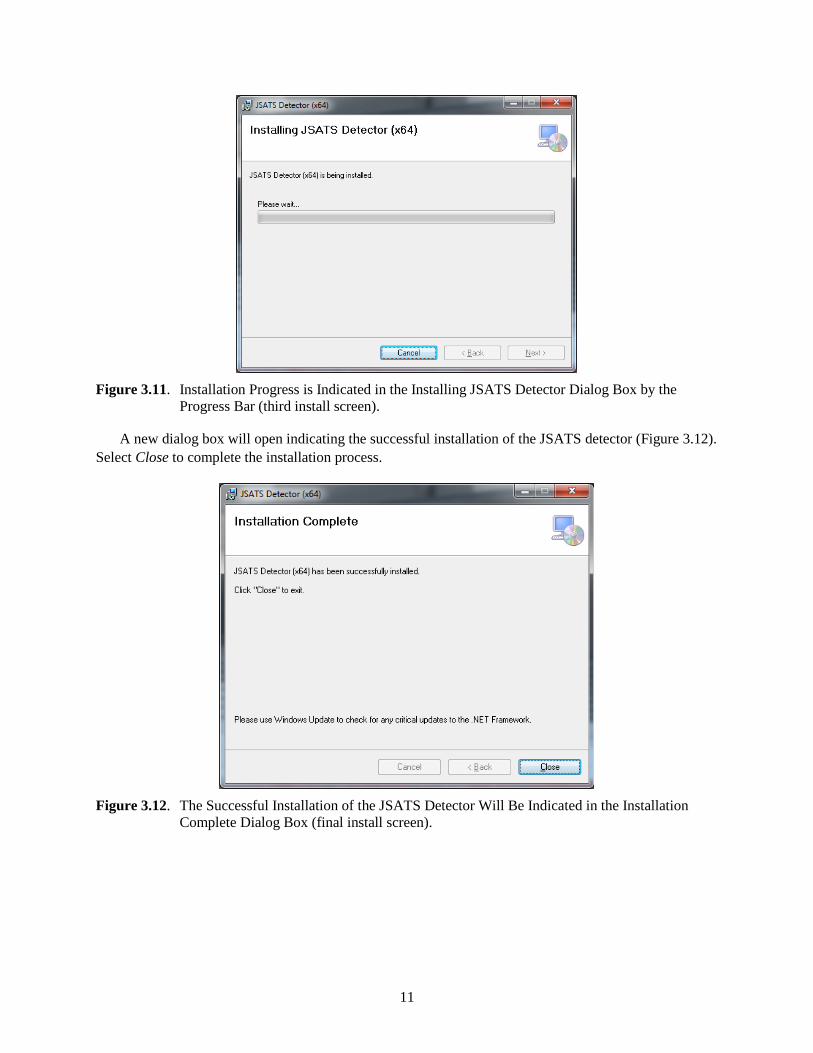
Figure 3.9. Select the Folder Installation Location for the JSATS Detector (first install screen).
The Select Installation Folder dialog box will close and the Confirm Installation dialog box will open
(Figure 3.10). Click Next to confirm the JSATS detector installation.
Figure 3.10. Select the Next Button in the Confirm Installation Dialog Box to Initiate the Install Process
(second install screen).
The status of the detector installation progress will be indicated by the progress bar shown in the
Installing JSATS Detector Dialog Box (Figure 3.11).
When installation is complete, select Next.
Page 19
11
Figure 3.11. Installation Progress is Indicated in the Installing JSATS Detector Dialog Box by the
Progress Bar (third install screen).
A new dialog box will open indicating the successful installation of the JSATS detector (Figure 3.12).
Select Close to complete the installation process.
Figure 3.12. The Successful Installation of the JSATS Detector Will Be Indicated in the Installation
Complete Dialog Box (final install screen).
Page 20
12
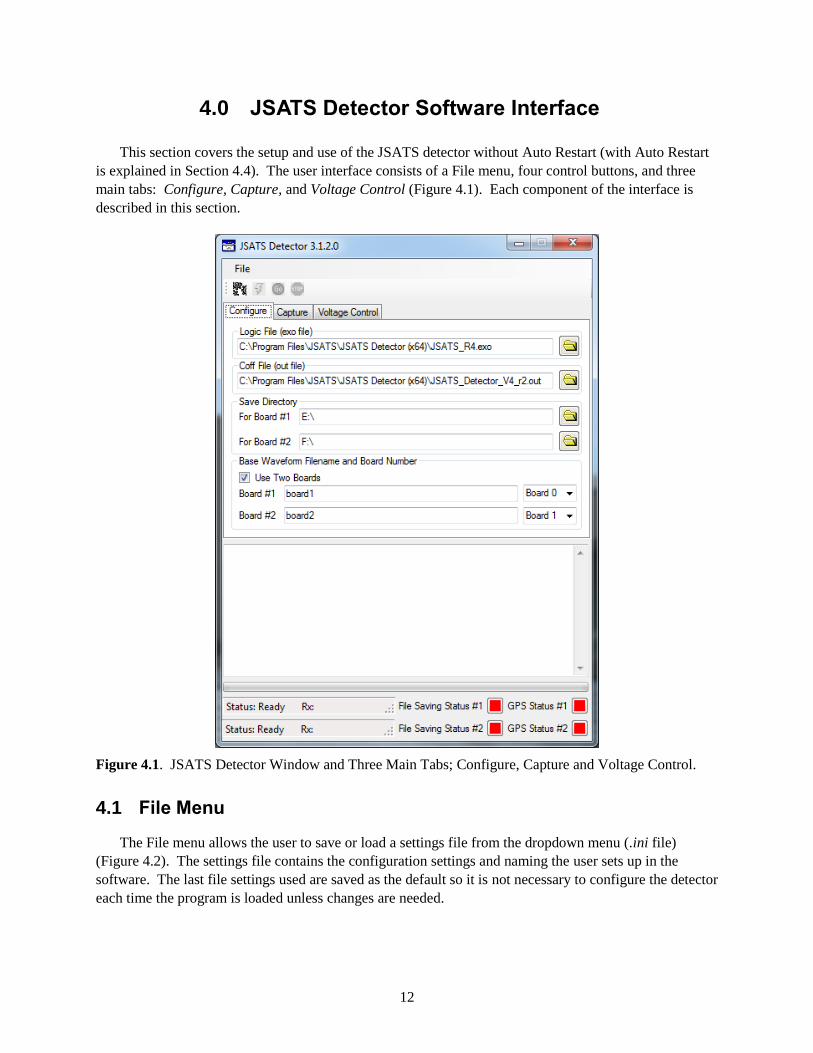
4.0 JSATS Detector Software Interface
This section covers the setup and use of the JSATS detector without Auto Restart (with Auto Restart
is explained in Section 4.4). The user interface consists of a File menu, four control buttons, and three
main tabs: Configure, Capture, and Voltage Control (Figure 4.1). Each component of the interface is
described in this section.
Figure 4.1. JSATS Detector Window and Three Main Tabs; Configure, Capture and Voltage Control.
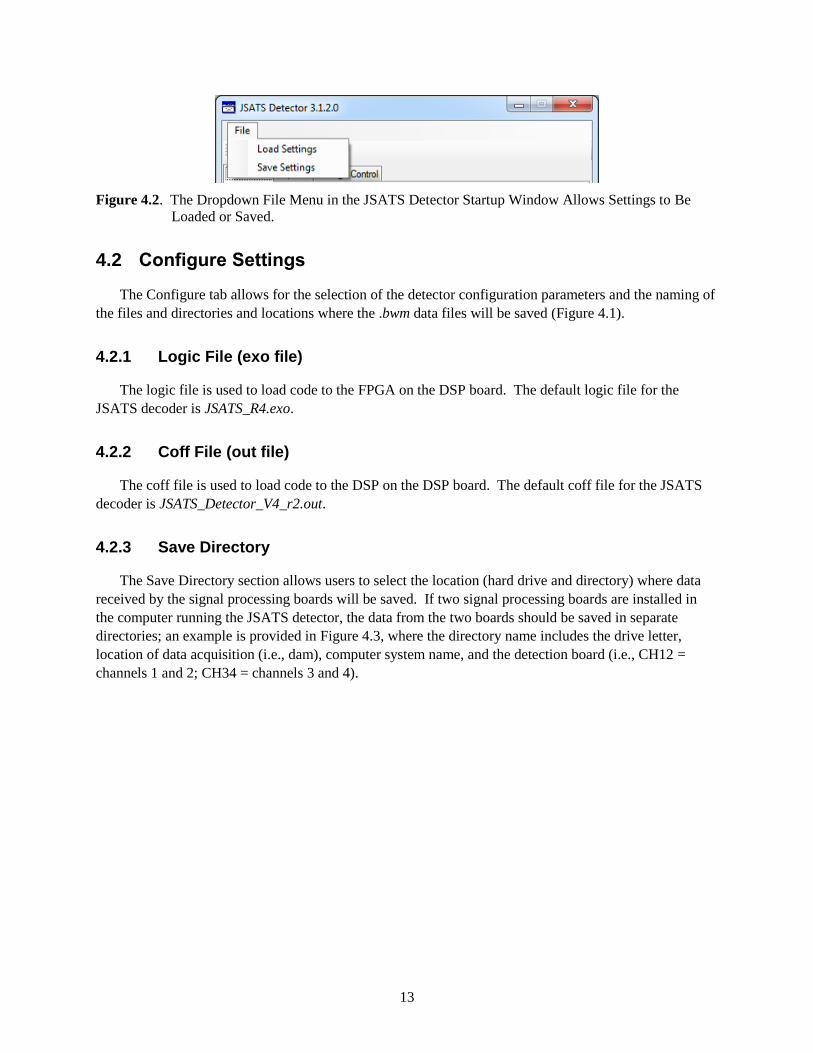
4.1 File Menu
The File menu allows the user to save or load a settings file from the dropdown menu (.ini file)
(Figure 4.2). The settings file contains the configuration settings and naming the user sets up in the
software. The last file settings used are saved as the default so it is not necessary to configure the detector
each time the program is loaded unless changes are needed.
Page 21
13
Figure 4.2. The Dropdown File Menu in the JSATS Detector Startup Window Allows Settings to Be
Loaded or Saved.
4.2 Configure Settings
The Configure tab allows for the selection of the detector configuration parameters and the naming of
the files and directories and locations where the .bwm data files will be saved (Figure 4.1).
4.2.1 Logic File (exo file)
The logic file is used to load code to the FPGA on the DSP board. The default logic file for the
JSATS decoder is JSATS_R4.exo.
4.2.2 Coff File (out file)
The coff file is used to load code to the DSP on the DSP board. The default coff file for the JSATS
decoder is JSATS_Detector_V4_r2.out.
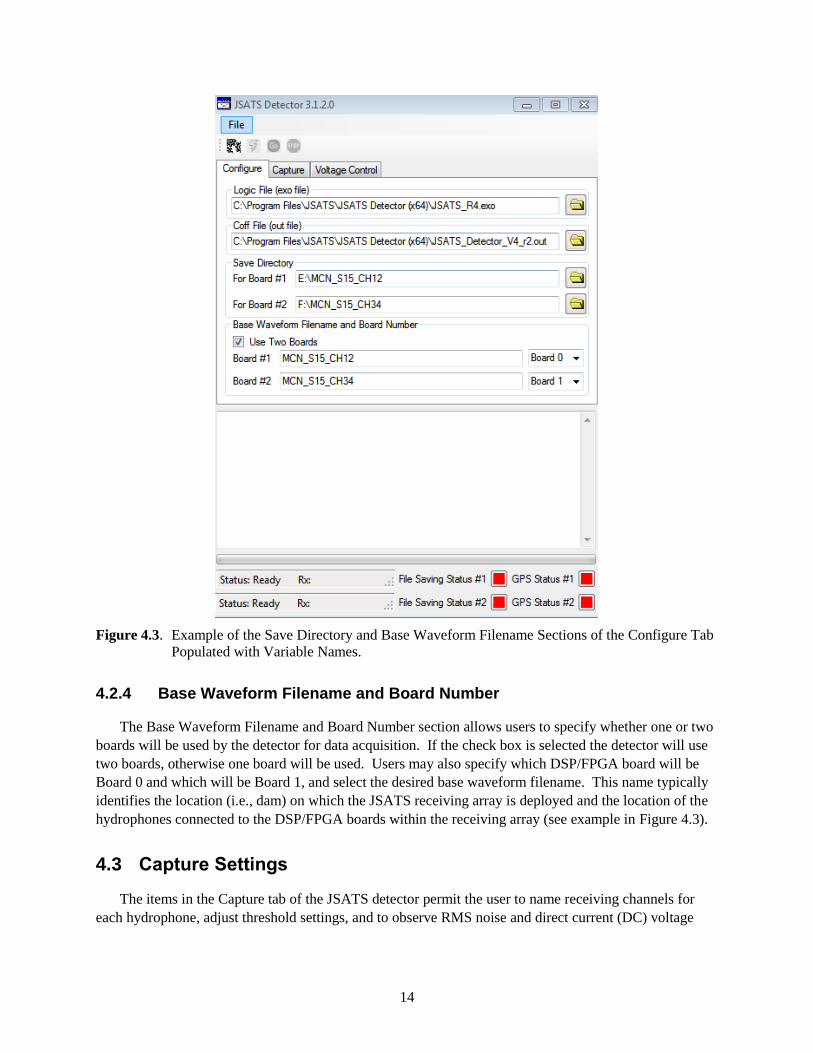
4.2.3 Save Directory
The Save Directory section allows users to select the location (hard drive and directory) where data
received by the signal processing boards will be saved. If two signal processing boards are installed in
the computer running the JSATS detector, the data from the two boards should be saved in separate
directories; an example is provided in Figure 4.3, where the directory name includes the drive letter,
location of data acquisition (i.e., dam), computer system name, and the detection board (i.e., CH12 =
channels 1 and 2; CH34 = channels 3 and 4).
Page 22
14
Figure 4.3. Example of the Save Directory and Base Waveform Filename Sections of the Configure Tab
Populated with Variable Names.
4.2.4 Base Waveform Filename and Board Number
The Base Waveform Filename and Board Number section allows users to specify whether one or two
boards will be used by the detector for data acquisition. If the check box is selected the detector will use
two boards, otherwise one board will be used. Users may also specify which DSP/FPGA board will be
Board 0 and which will be Board 1, and select the desired base waveform filename. This name typically
identifies the location (i.e., dam) on which the JSATS receiving array is deployed and the location of the
hydrophones connected to the DSP/FPGA boards within the receiving array (see example in Figure 4.3).
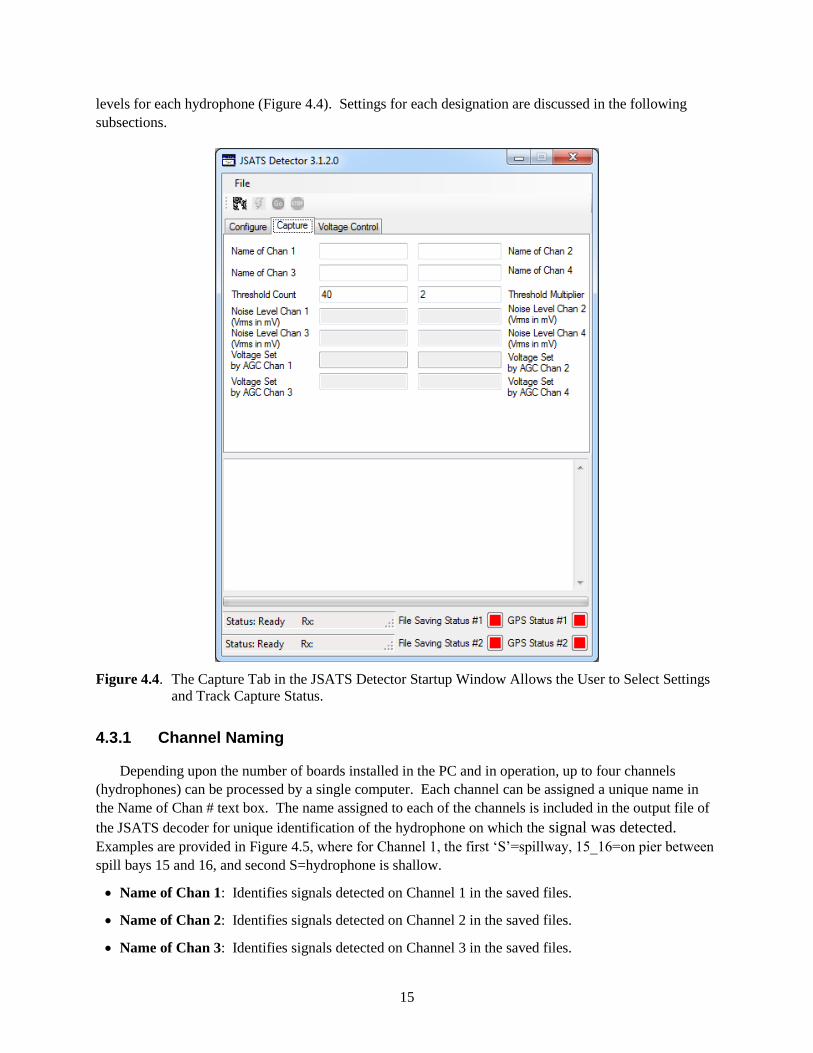
4.3 Capture Settings
The items in the Capture tab of the JSATS detector permit the user to name receiving channels for
each hydrophone, adjust threshold settings, and to observe RMS noise and direct current (DC) voltage
Page 23
15
levels for each hydrophone (Figure 4.4). Settings for each designation are discussed in the following
subsections.
Figure 4.4. The Capture Tab in the JSATS Detector Startup Window Allows the User to Select Settings
and Track Capture Status.
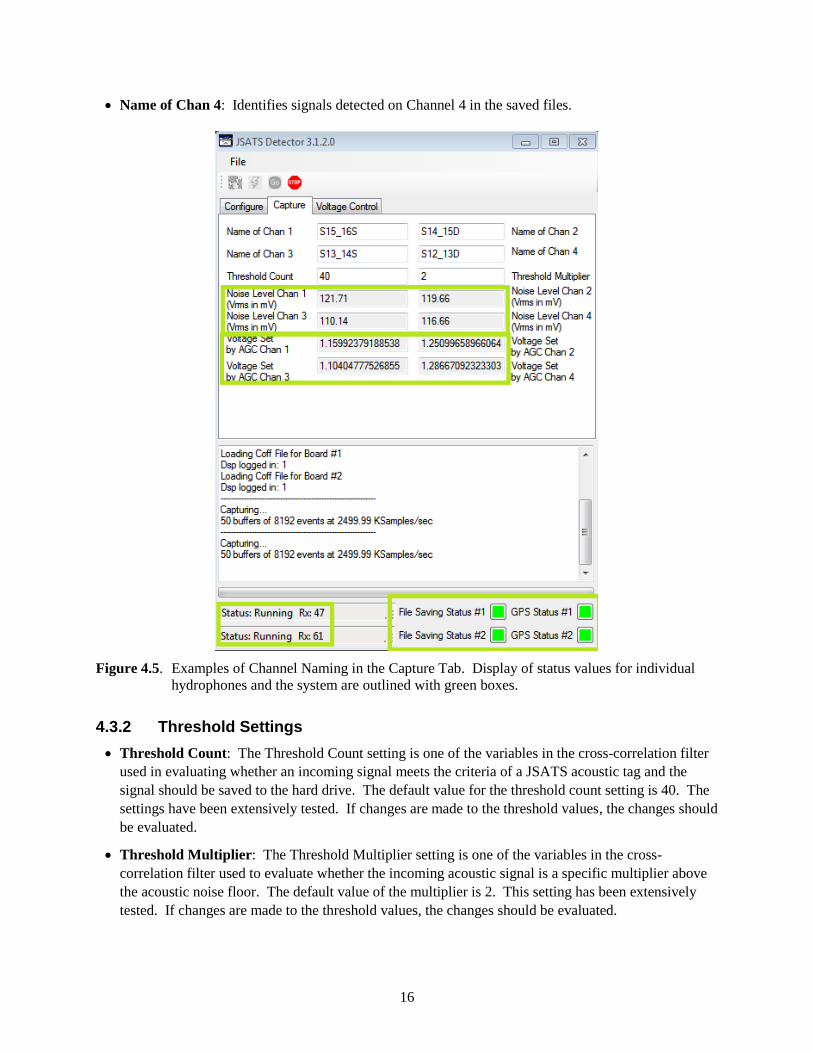
4.3.1 Channel Naming
Depending upon the number of boards installed in the PC and in operation, up to four channels
(hydrophones) can be processed by a single computer. Each channel can be assigned a unique name in
the Name of Chan # text box. The name assigned to each of the channels is included in the output file of
the JSATS decoder for unique identification of the hydrophone on which the signal was detected.
Examples are provided in Figure 4.5, where for Channel 1, the first ‘S’=spillway, 15_16=on pier between
spill bays 15 and 16, and second S=hydrophone is shallow.
Name of Chan 1: Identifies signals detected on Channel 1 in the saved files.
Name of Chan 2: Identifies signals detected on Channel 2 in the saved files.
Name of Chan 3: Identifies signals detected on Channel 3 in the saved files.
Page 24
16
Name of Chan 4: Identifies signals detected on Channel 4 in the saved files.
Figure 4.5. Examples of Channel Naming in the Capture Tab. Display of status values for individual
hydrophones and the system are outlined with green boxes.
4.3.2 Threshold Settings
Threshold Count: The Threshold Count setting is one of the variables in the cross-correlation filter
used in evaluating whether an incoming signal meets the criteria of a JSATS acoustic tag and the
signal should be saved to the hard drive. The default value for the threshold count setting is 40. The
settings have been extensively tested. If changes are made to the threshold values, the changes should
be evaluated.
Threshold Multiplier: The Threshold Multiplier setting is one of the variables in the cross-
correlation filter used to evaluate whether the incoming acoustic signal is a specific multiplier above
the acoustic noise floor. The default value of the multiplier is 2. This setting has been extensively
tested. If changes are made to the threshold values, the changes should be evaluated.
Page 25
17
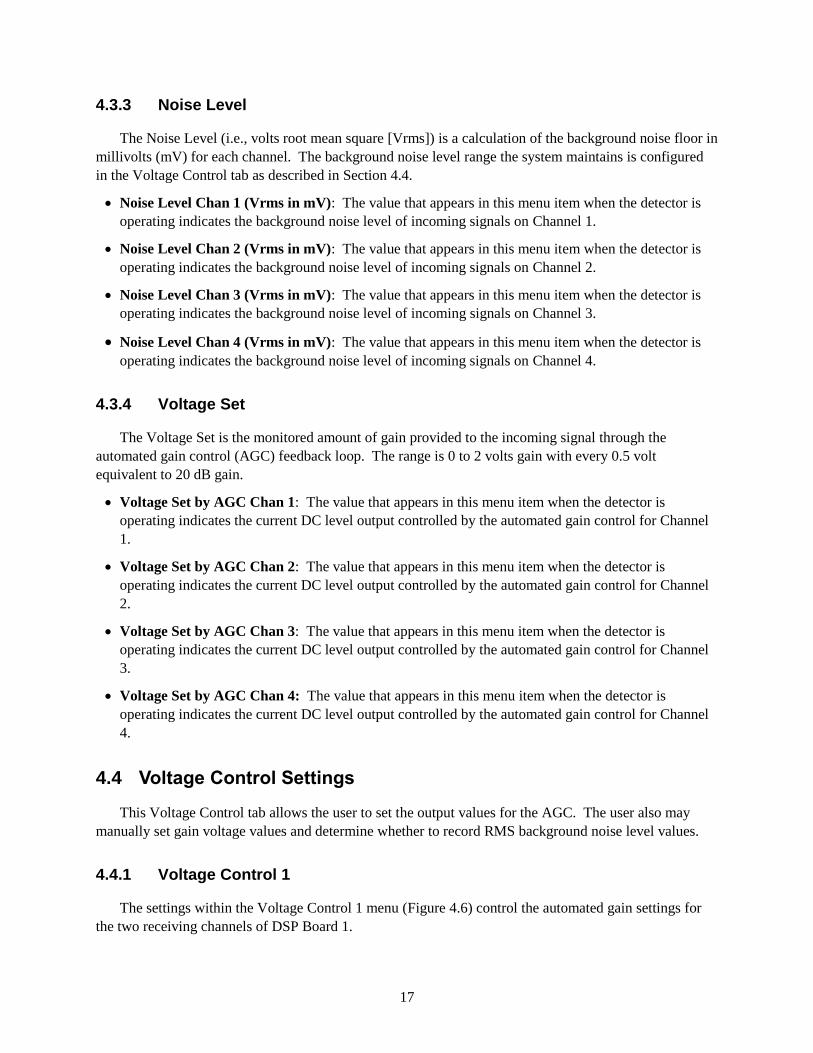
4.3.3 Noise Level
The Noise Level (i.e., volts root mean square [Vrms]) is a calculation of the background noise floor in
millivolts (mV) for each channel. The background noise level range the system maintains is configured
in the Voltage Control tab as described in Section 4.4.
Noise Level Chan 1 (Vrms in mV): The value that appears in this menu item when the detector is
operating indicates the background noise level of incoming signals on Channel 1.
Noise Level Chan 2 (Vrms in mV): The value that appears in this menu item when the detector is
operating indicates the background noise level of incoming signals on Channel 2.
Noise Level Chan 3 (Vrms in mV): The value that appears in this menu item when the detector is
operating indicates the background noise level of incoming signals on Channel 3.
Noise Level Chan 4 (Vrms in mV): The value that appears in this menu item when the detector is
operating indicates the background noise level of incoming signals on Channel 4.
4.3.4 Voltage Set
The Voltage Set is the monitored amount of gain provided to the incoming signal through the
automated gain control (AGC) feedback loop. The range is 0 to 2 volts gain with every 0.5 volt
equivalent to 20 dB gain.
Voltage Set by AGC Chan 1: The value that appears in this menu item when the detector is
operating indicates the current DC level output controlled by the automated gain control for Channel
1.
Voltage Set by AGC Chan 2: The value that appears in this menu item when the detector is
operating indicates the current DC level output controlled by the automated gain control for Channel
2.
Voltage Set by AGC Chan 3: The value that appears in this menu item when the detector is
operating indicates the current DC level output controlled by the automated gain control for Channel
3.
Voltage Set by AGC Chan 4: The value that appears in this menu item when the detector is
operating indicates the current DC level output controlled by the automated gain control for Channel
4.
4.4 Voltage Control Settings
This Voltage Control tab allows the user to set the output values for the AGC. The user also may
manually set gain voltage values and determine whether to record RMS background noise level values.
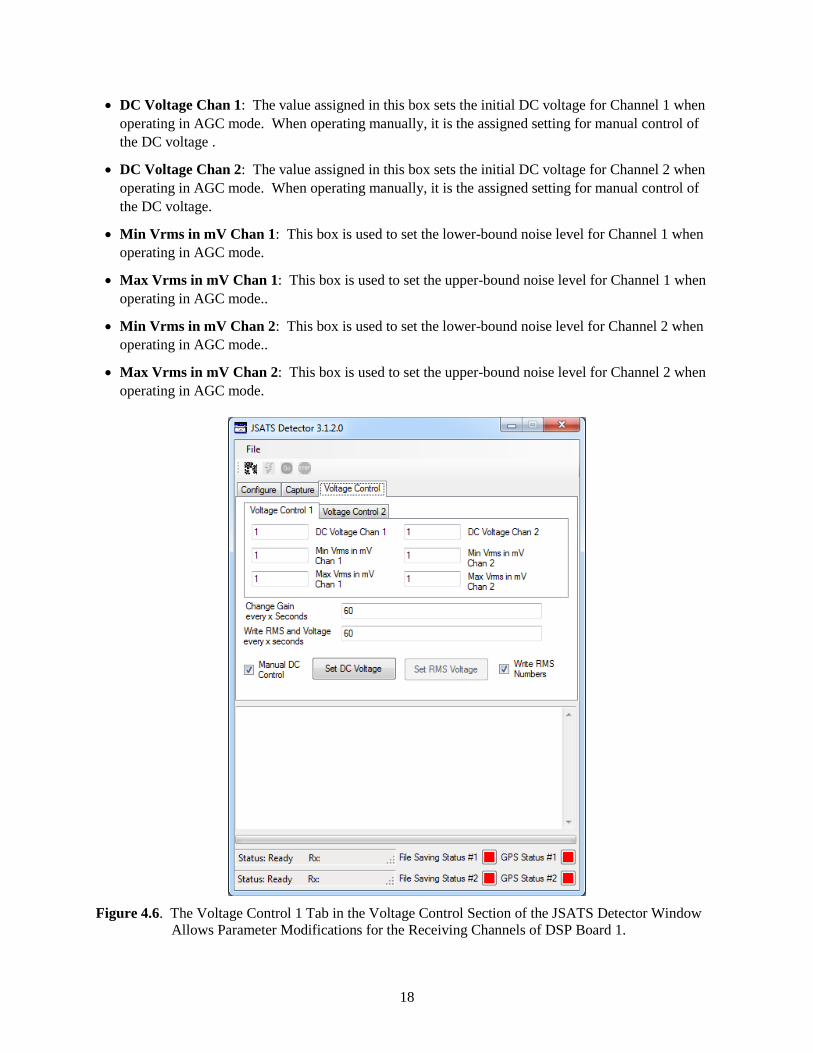
4.4.1 Voltage Control 1
The settings within the Voltage Control 1 menu (Figure 4.6) control the automated gain settings for
the two receiving channels of DSP Board 1.
Page 26
18
DC Voltage Chan 1: The value assigned in this box sets the initial DC voltage for Channel 1 when
operating in AGC mode. When operating manually, it is the assigned setting for manual control of
the DC voltage .
DC Voltage Chan 2: The value assigned in this box sets the initial DC voltage for Channel 2 when
operating in AGC mode. When operating manually, it is the assigned setting for manual control of
the DC voltage.
Min Vrms in mV Chan 1: This box is used to set the lower-bound noise level for Channel 1 when
operating in AGC mode.
Max Vrms in mV Chan 1: This box is used to set the upper-bound noise level for Channel 1 when
operating in AGC mode..
Min Vrms in mV Chan 2: This box is used to set the lower-bound noise level for Channel 2 when
operating in AGC mode..
Max Vrms in mV Chan 2: This box is used to set the upper-bound noise level for Channel 2 when
operating in AGC mode.
Figure 4.6. The Voltage Control 1 Tab in the Voltage Control Section of the JSATS Detector Window
Allows Parameter Modifications for the Receiving Channels of DSP Board 1.
Page 27
19
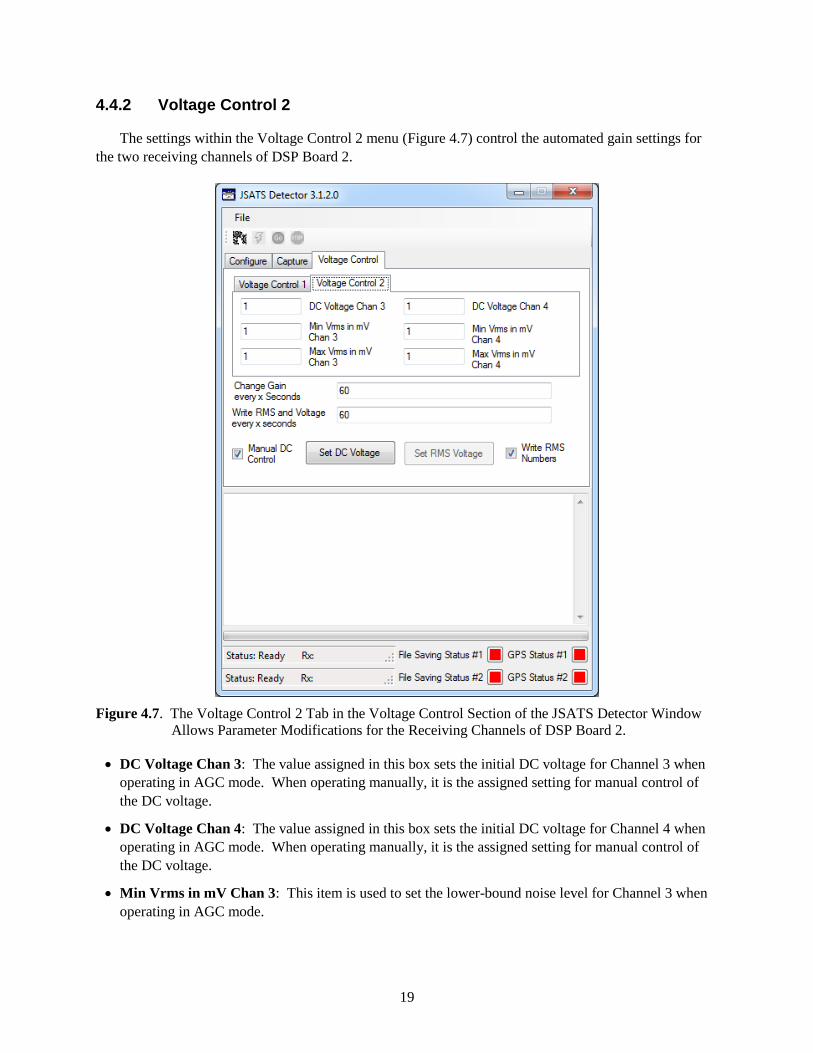
4.4.2 Voltage Control 2
The settings within the Voltage Control 2 menu (Figure 4.7) control the automated gain settings for
the two receiving channels of DSP Board 2.
Figure 4.7. The Voltage Control 2 Tab in the Voltage Control Section of the JSATS Detector Window
Allows Parameter Modifications for the Receiving Channels of DSP Board 2.
DC Voltage Chan 3: The value assigned in this box sets the initial DC voltage for Channel 3 when
operating in AGC mode. When operating manually, it is the assigned setting for manual control of
the DC voltage.
DC Voltage Chan 4: The value assigned in this box sets the initial DC voltage for Channel 4 when
operating in AGC mode. When operating manually, it is the assigned setting for manual control of
the DC voltage.
Min Vrms in mV Chan 3: This item is used to set the lower-bound noise level for Channel 3 when
operating in AGC mode.
Page 28
20
Max Vrms in mV Chan 3: This item is used to set the upper-bound noise level for Channel 3 when
operating in AGC mode.
Min Vrms in mV Chan 4: This item is used to set the lower-bound noise level for Channel 4 when
operating in AGC mode.
Max Vrms in mV Chan 4: This item is used to set the upper-bound noise level for Channel 4 when
operating in AGC mode.
4.4.3 Automated Gain Control
Automated gain control selections are found in both the Voltage Control 1 and Voltage Control 2
tabs.
Manual DC Control Check box: By checking the “Manual DC Control” box the user selects
manual DC control. If unchecked, the automated DC control is activated.
Change Gain every x seconds: The value entered into this box determines how often the AGC will
change the DC control level.
Set DC Voltage button: The “Set DC Voltage” button allows the user to set the DC level when the
detector is being operated in manual mode.
Set RMS Voltage button: The “Set RMS Voltage” button allows the user to set and update the
upper and lower bound of the RMS voltage for the AGC.
4.4.4 RMS and Voltage Recording
RMS and Voltage Recording selections are located in both the Voltage Control 1 and Voltage Control
2 tabs.
Write RMS and Voltage every x seconds: The value entered here determines how often the RMS
and DC voltages are recorded to a .csv file, if the “Write RMS Numbers” box is checked.
Write RMS Numbers Check box: If the Write RMS Numbers box is checked, RMS and DC
voltage values will be recorded and saved. If left unchecked, the values will not be saved.
4.5 Auto Restart Controls
The information provided in this section is available only in the versions of the JSATS detector that
have the automatic restart feature. This feature was added to allow for automatic restart of acquisition
computers at locations where there are sporadic power outages and where the location means the systems
cannot be monitored frequently.
4.5.1 File Menu
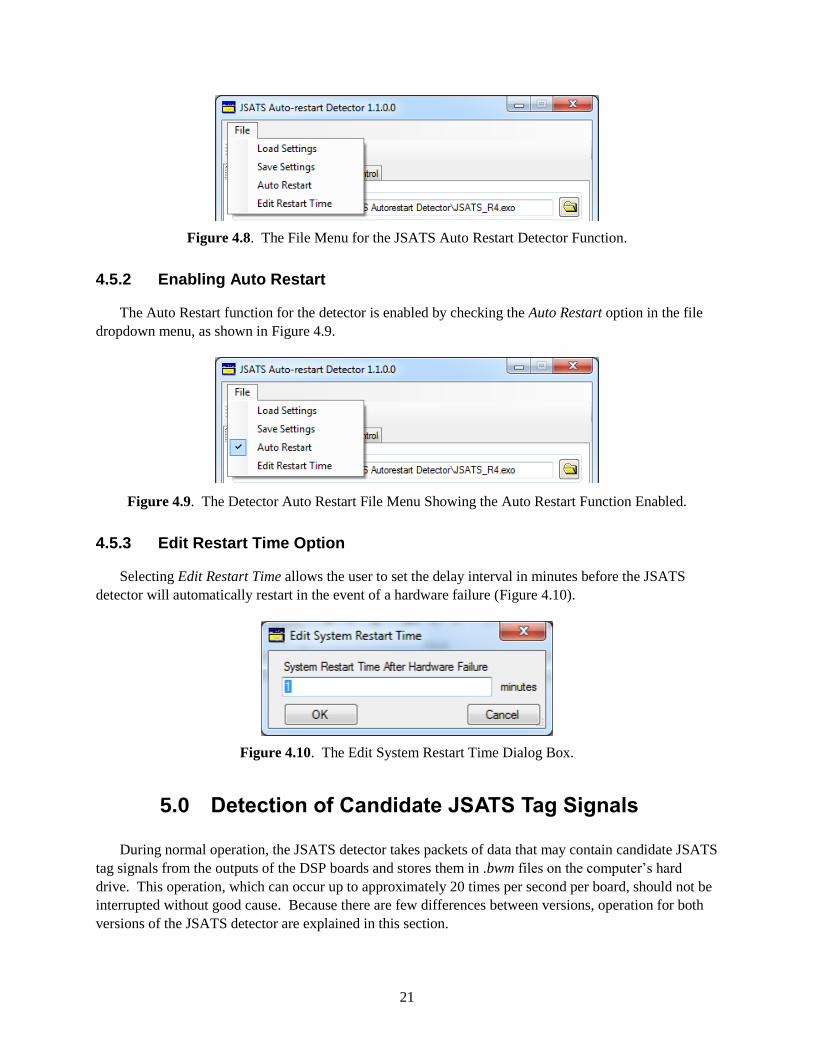
The JSATS Auto Restart file dropdown menu (Figure 4.8) allows settings to be loaded and saved as
well as enables automatic restart of the detector and the capacity to edit the restart time.
Page 29
21
Figure 4.8. The File Menu for the JSATS Auto Restart Detector Function.
4.5.2 Enabling Auto Restart
The Auto Restart function for the detector is enabled by checking the Auto Restart option in the file
dropdown menu, as shown in Figure 4.9.
Figure 4.9. The Detector Auto Restart File Menu Showing the Auto Restart Function Enabled.
4.5.3 Edit Restart Time Option
Selecting Edit Restart Time allows the user to set the delay interval in minutes before the JSATS
detector will automatically restart in the event of a hardware failure (Figure 4.10).
Figure 4.10. The Edit System Restart Time Dialog Box.
5.0 Detection of Candidate JSATS Tag Signals
During normal operation, the JSATS detector takes packets of data that may contain candidate JSATS
tag signals from the outputs of the DSP boards and stores them in .bwm files on the computer’s hard
drive. This operation, which can occur up to approximately 20 times per second per board, should not be
interrupted without good cause. Because there are few differences between versions, operation for both
versions of the JSATS detector are explained in this section.
Page 30
22
5.1 Starting JSATS Tag Detection
To initiate detection, load the coefficient file by clicking the button on the far left hand side of the
toolbar located near the top of the JSATS detector window (Figure 5.1).
Figure 5.1. Select the Coefficient File by Choosing the Gear Icon Button Found in the Detector Toolbar
Located near the Top of the JSATS Detector Window.
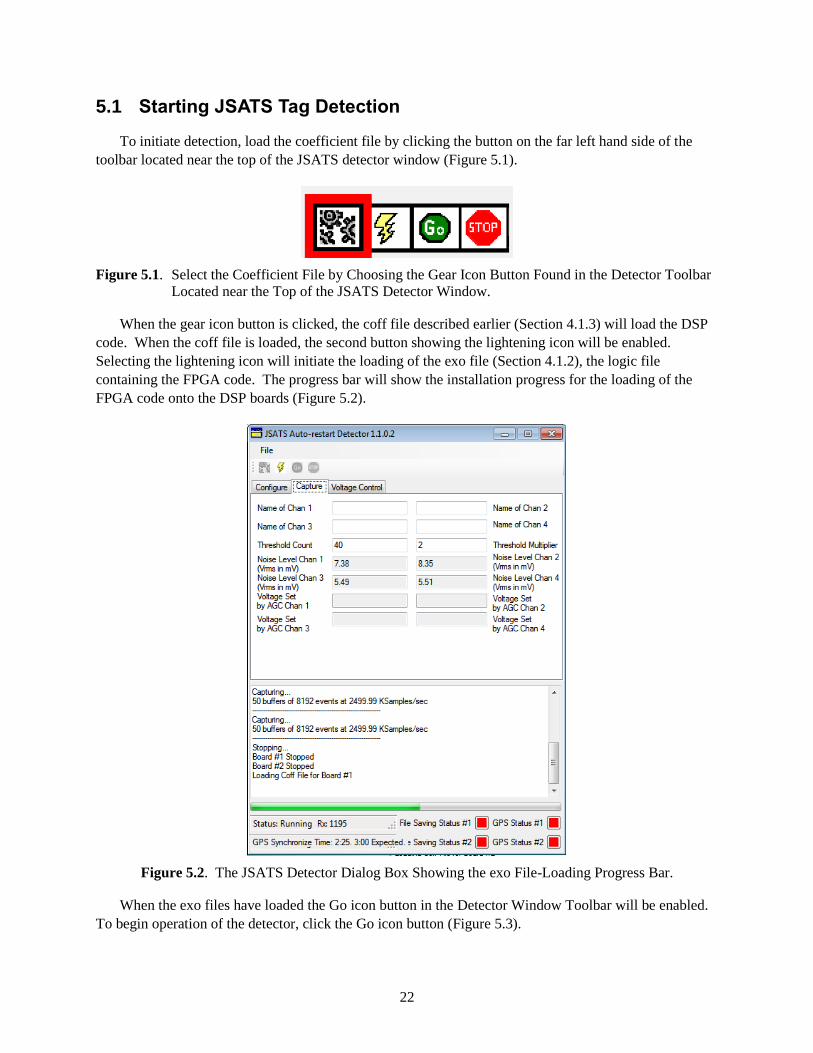
When the gear icon button is clicked, the coff file described earlier (Section 4.1.3) will load the DSP
code. When the coff file is loaded, the second button showing the lightening icon will be enabled.
Selecting the lightening icon will initiate the loading of the exo file (Section 4.1.2), the logic file
containing the FPGA code. The progress bar will show the installation progress for the loading of the
FPGA code onto the DSP boards (Figure 5.2).
Figure 5.2. The JSATS Detector Dialog Box Showing the exo File-Loading Progress Bar.
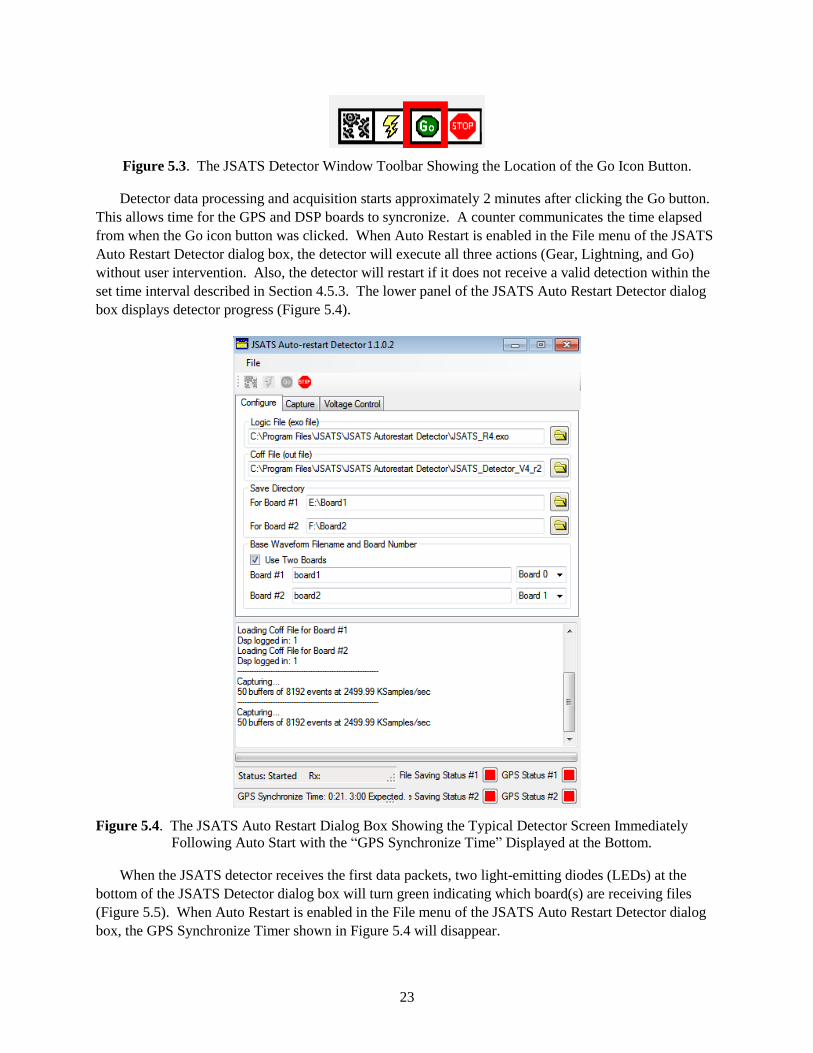
When the exo files have loaded the Go icon button in the Detector Window Toolbar will be enabled.
To begin operation of the detector, click the Go icon button (Figure 5.3).
Page 31
23
Figure 5.3. The JSATS Detector Window Toolbar Showing the Location of the Go Icon Button.
Detector data processing and acquisition starts approximately 2 minutes after clicking the Go button.
This allows time for the GPS and DSP boards to syncronize. A counter communicates the time elapsed
from when the Go icon button was clicked. When Auto Restart is enabled in the File menu of the JSATS
Auto Restart Detector dialog box, the detector will execute all three actions (Gear, Lightning, and Go)
without user intervention. Also, the detector will restart if it does not receive a valid detection within the
set time interval described in Section 4.5.3. The lower panel of the JSATS Auto Restart Detector dialog
box displays detector progress (Figure 5.4).
Figure 5.4. The JSATS Auto Restart Dialog Box Showing the Typical Detector Screen Immediately
Following Auto Start with the “GPS Synchronize Time” Displayed at the Bottom.
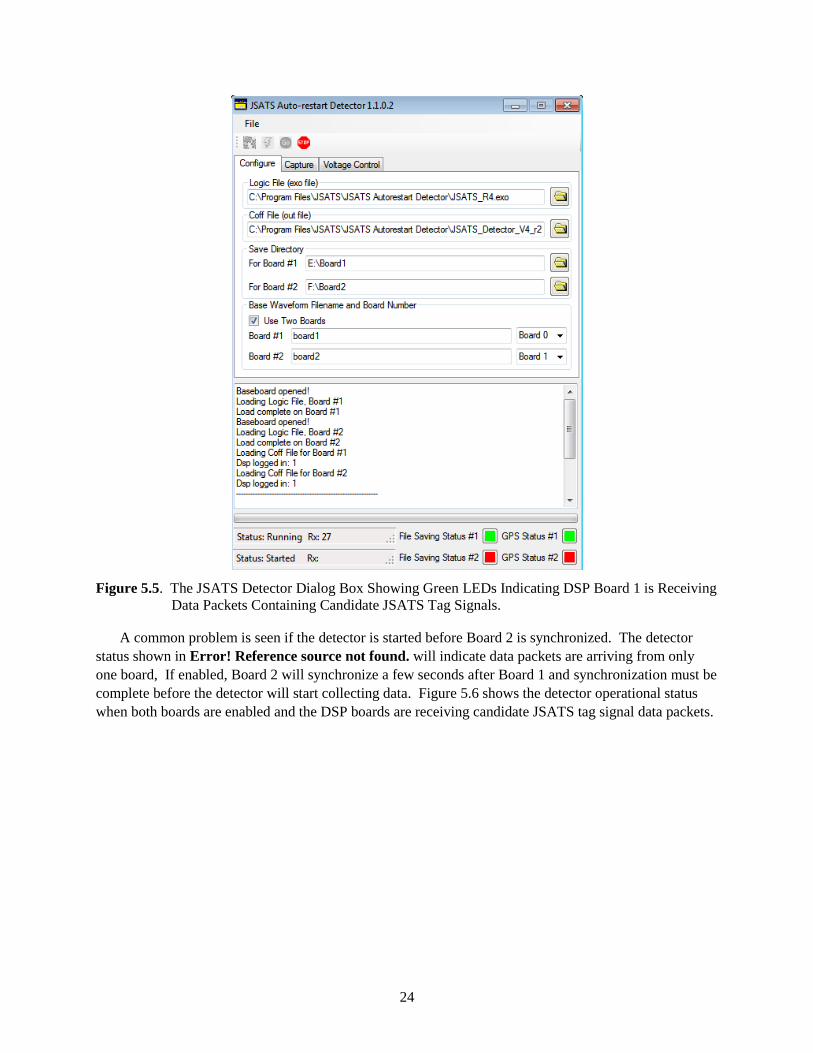
When the JSATS detector receives the first data packets, two light-emitting diodes (LEDs) at the
bottom of the JSATS Detector dialog box will turn green indicating which board(s) are receiving files
(Figure 5.5). When Auto Restart is enabled in the File menu of the JSATS Auto Restart Detector dialog
box, the GPS Synchronize Timer shown in Figure 5.4 will disappear.
Page 32
24
Figure 5.5. The JSATS Detector Dialog Box Showing Green LEDs Indicating DSP Board 1 is Receiving
Data Packets Containing Candidate JSATS Tag Signals.
A common problem is seen if the detector is started before Board 2 is synchronized. The detector
status shown in Error! Reference source not found. will indicate data packets are arriving from only
one board, If enabled, Board 2 will synchronize a few seconds after Board 1 and synchronization must be
complete before the detector will start collecting data. Figure 5.6 shows the detector operational status
when both boards are enabled and the DSP boards are receiving candidate JSATS tag signal data packets.
Page 33
25
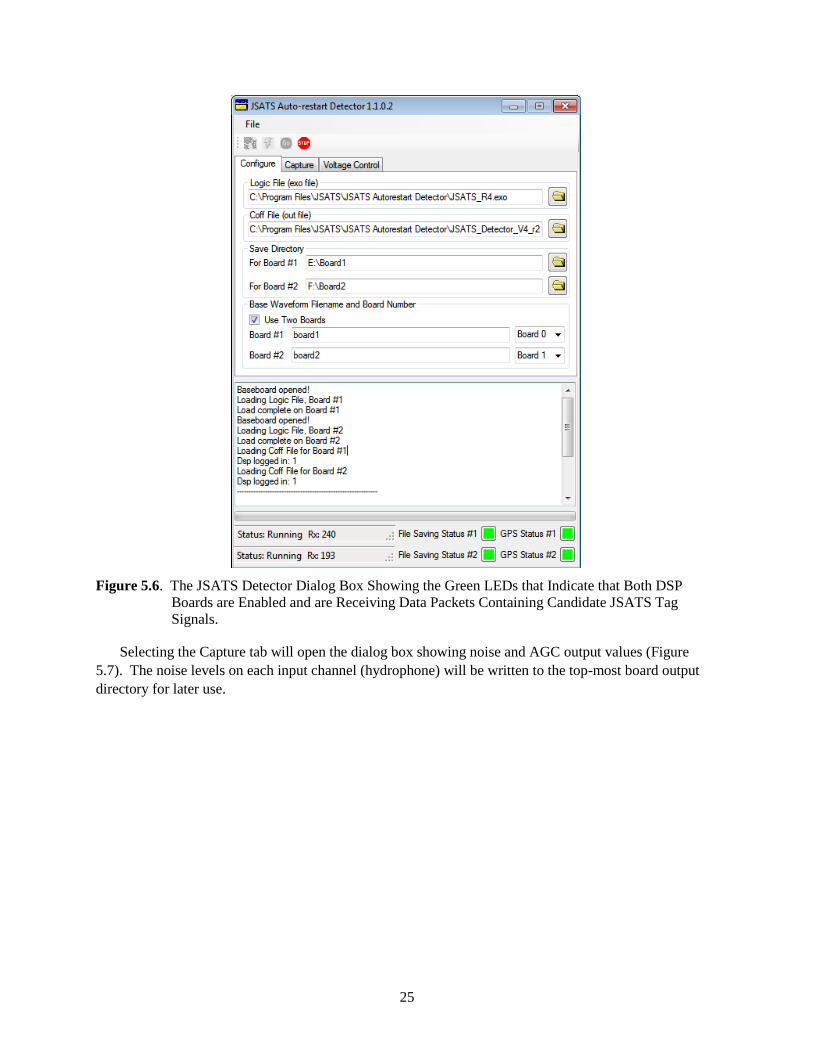
Figure 5.6. The JSATS Detector Dialog Box Showing the Green LEDs that Indicate that Both DSP
Boards are Enabled and are Receiving Data Packets Containing Candidate JSATS Tag
Signals.
Selecting the Capture tab will open the dialog box showing noise and AGC output values (Figure
5.7). The noise levels on each input channel (hydrophone) will be written to the top-most board output
directory for later use.
Page 34
26
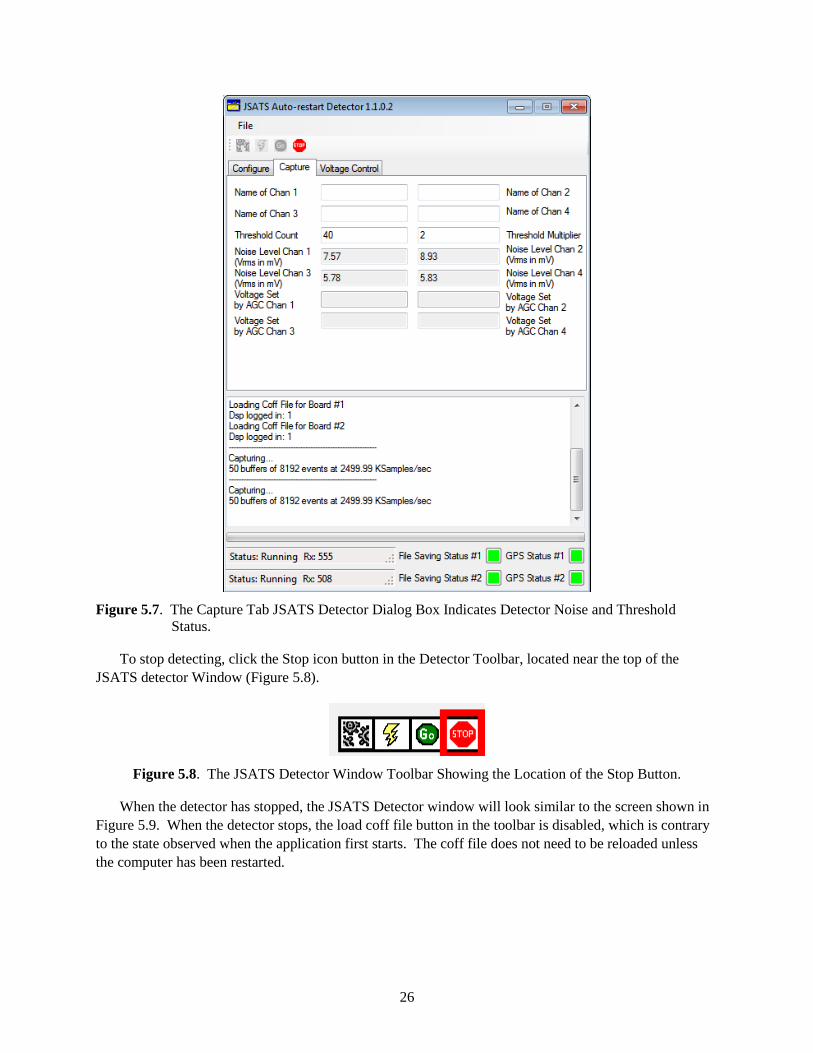
Figure 5.7. The Capture Tab JSATS Detector Dialog Box Indicates Detector Noise and Threshold
Status.
To stop detecting, click the Stop icon button in the Detector Toolbar, located near the top of the
JSATS detector Window (Figure 5.8).
Figure 5.8. The JSATS Detector Window Toolbar Showing the Location of the Stop Button.
When the detector has stopped, the JSATS Detector window will look similar to the screen shown in
Figure 5.9. When the detector stops, the load coff file button in the toolbar is disabled, which is contrary
to the state observed when the application first starts. The coff file does not need to be reloaded unless
the computer has been restarted.
Page 35
27
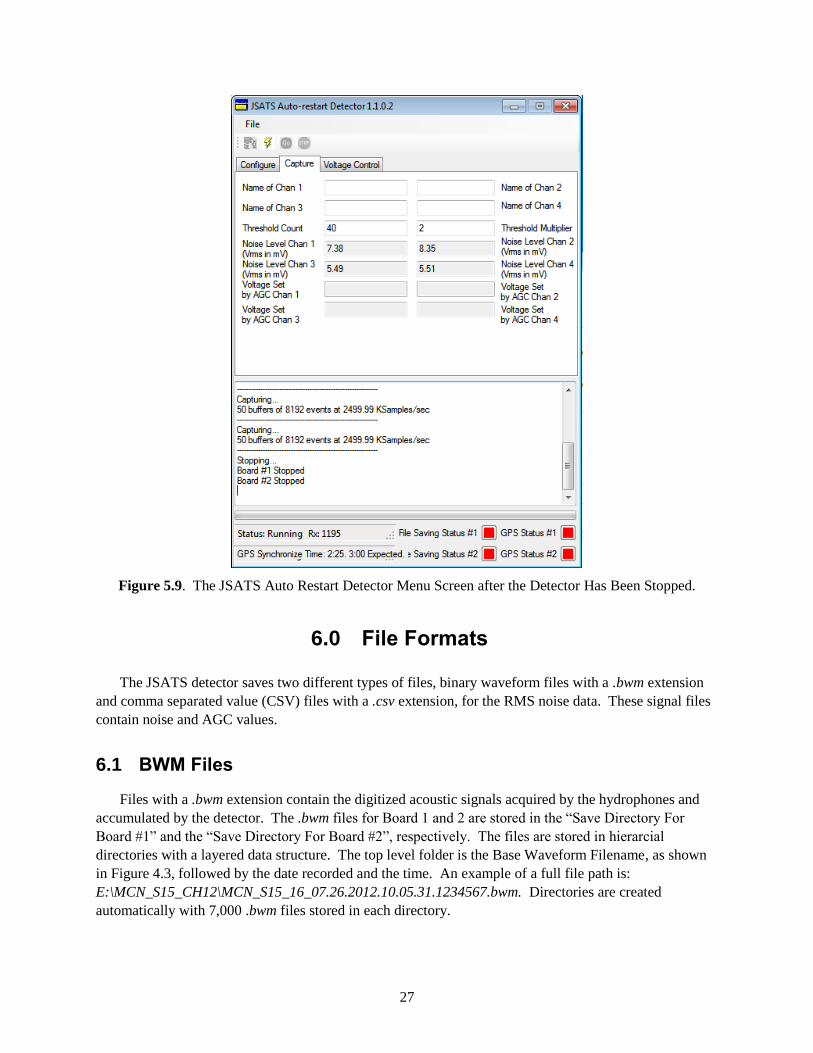
Figure 5.9. The JSATS Auto Restart Detector Menu Screen after the Detector Has Been Stopped.
6.0 File Formats
The JSATS detector saves two different types of files, binary waveform files with a .bwm extension
and comma separated value (CSV) files with a .csv extension, for the RMS noise data. These signal files
contain noise and AGC values.
6.1 BWM Files
Files with a .bwm extension contain the digitized acoustic signals acquired by the hydrophones and
accumulated by the detector. The .bwm files for Board 1 and 2 are stored in the “Save Directory For
Board #1” and the “Save Directory For Board #2”, respectively. The files are stored in hierarcial
directories with a layered data structure. The top level folder is the Base Waveform Filename, as shown
in Figure 4.3, followed by the date recorded and the time. An example of a full file path is:
E:\MCN_S15_CH12\MCN_S15_16_07.26.2012.10.05.31.1234567.bwm. Directories are created
automatically with 7,000 .bwm files stored in each directory.
Page 36
28
6.2 RMS CSV Files
Files with a .csv extension contain noise data in Vrms, and the DC inputs from the receiving array
hydrophones. The noise .csv files (RMS data files) are stored in their respective Board 1 or Board 2 save
directories. Each file is prefixed with RMS followed by an underscore, the date the data were acquired,
followed by a number indicating the chronological order of RMS values recorded that day. An example
file name is RMS_03.02.2012_00.csv. This file contains RMS noise data acquired on March 3, 2012 and
the first in the sequence of files for that day.
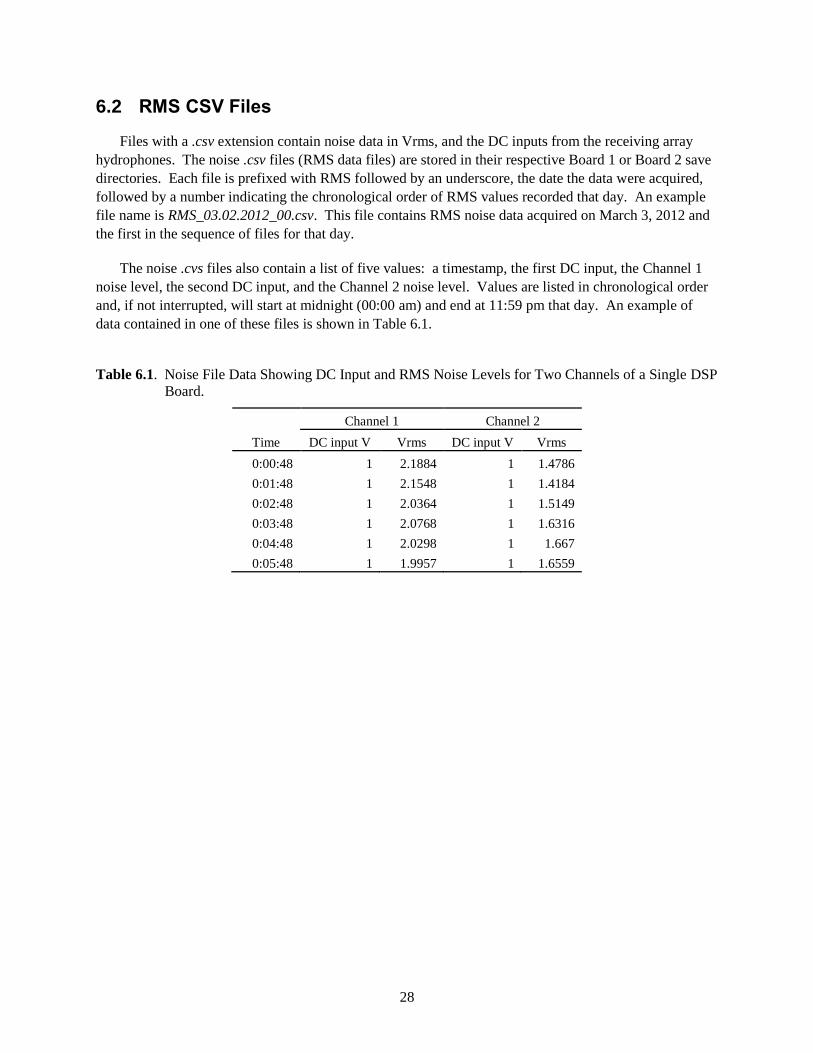
The noise .cvs files also contain a list of five values: a timestamp, the first DC input, the Channel 1
noise level, the second DC input, and the Channel 2 noise level. Values are listed in chronological order
and, if not interrupted, will start at midnight (00:00 am) and end at 11:59 pm that day. An example of
data contained in one of these files is shown in Table 6.1.
Table 6.1. Noise File Data Showing DC Input and RMS Noise Levels for Two Channels of a Single DSP
Board.
Time
Channel 1 Channel 2
DC input V Vrms DC input V Vrms
0:00:48 1 2.1884 1 1.4786
0:01:48 1 2.1548 1 1.4184
0:02:48 1 2.0364 1 1.5149
0:03:48 1 2.0768 1 1.6316
0:04:48 1 2.0298 1 1.667
0:05:48 1 1.9957 1 1.6559
Page 37
29
7.0 References
Deng Z, MA Weiland, T Fu, TA Seim, BL Lamarche, EY Choi, TJ Carlson, and MB Eppard. 2011. "A
Cabled Acoustic Telemetry System for Detecting and Tracking Juvenile Salmon: Part 2. Three-
Dimensional Tracking and Passage Outcomes." Sensors 11(6):5661-5676.
McMichael GA, MB Eppard, TJ Carlson, JA Carter, BD Ebberts, RS Brown, MA Weiland, GR Ploskey,
RA Harnish, and Z Deng. 2010. "The Juvenile Salmon Acoustic Telemetry System; A New
Tool." Fisheries 35(1):9-22.
Weiland MA, Z Deng, TA Seim, BL Lamarche, EY Choi, T Fu, TJ Carlson, AI Thronas, and MB Eppard.
2011. "A Cabled Acoustic Telemetry System for Detecting and Tracking Juvenile Salmon: Part 1.
Engineering Design and Instrumentation." Sensors 11(6):5645-5660.