Page 1
J)te/ HTGR-86-017 Revision 1 908699/1
This document is PUBLICLY RELEASABLE
Date; \xf?-Sf/'^
APPLICATION OF BRIDGING METHODS
FOR STANDARD HTGR LICENSING BASES
or of Other Foreign InterestsT panies and For(E U.S. Compa
APPLIED TECHNOLO Ijipn by any H
Devel! 36 Approved by^
locument les Representing
Foreign Com-Jsions of
^ o n , U.S. Department of Er
NOTICE
This report contains information of ^ preliminary nature and was prepared primarily for internal use at the originating installation. It IS subject to revision or correction and therefore does not represent a final report. It is passed to the recipient in confidence and should not be abstracted or further disclosed without the approval of the originating installation or USDOE Office of Scientific and Technical Information, Oak Ridge, TN 37830.
Issued By: GA Technologies Inc.
RO. Box 85608 San Diego, California 92138
AAASTER DOE Contract No. DE-AC03-84SF11963
GA Project 6300
FEBRUARY 1986
Page 2
DISCLAIMER
This report was prepared as an account of work sponsored by an agency of the United States Government. Neither the United States Government nor any agency Thereof, nor any of their employees, makes any warranty, express or implied, or assumes any legal liability or responsibility for the accuracy, completeness, or usefulness of any information, apparatus, product, or process disclosed, or represents that its use would not infringe privately owned rights. Reference herein to any specific commercial product, process, or service by trade name, trademark, manufacturer, or otherwise does not necessarily constitute or imply its endorsement, recommendation, or favoring by the United States Government or any agency thereof. The views and opinions of authors expressed herein do not necessarily state or reflect those of the United States Government or any agency thereof.
Page 3
DISCLAIMER Portions of this document may be illegible in electronic image products. Images are produced from the best available original document.
Page 4
GA 1485 (REV 10/82) GA Technologies Inc.
ISSUE SUMMARY TITLE
Application of Bridging Methods for Standard HTGR Licensing Bases
B R81D D D V & S D DESIGN
APPROVAL LEVEL.
DISCIPLINE 0
SYSTEM
01-00
DOC. TYPE
RGE
QUALITY ASSURANCE LEVEL
N/A
SSUE DATE
DEC 1 8 19R
^^0^^^"^ I DOCUMENT NO. 6300 908699
SAFETY CLASSIFICATION
N/A
PREPARED BY
WCJ.Nough t
L.L.Parme
PEB 2 7 1986
SEISMIC CATEGORY
N/A
ISSUE NO./LTR.
ELECTRICAL CLASSIFICATION
N/A
APPROVAL
ENGINEERING
nterface Assurance
tDn Wfj.Hougftt
I n r e r f a c e ce ^ . ssurance
R.N.Ouade
QA
)S).irv„U^ IP .Connors
G .P .Connors
CONTINUE ON GA FORM 1485-1
FUNDING PROJECT
APPLICABLE PROJECT.
G.C.Brambl
/(?fc.Bi B r a m b l 2 t t
ISSUE DESCRIPTION/
CWBSNO.
i t t
Initial Issue WBS 6351060101 HTGR-86-017 Draft
Minor changes WBS 6351060101 Class II Change
HTGR-86-017/1
REV
NEXT INDENTURED DOCUMENTS
908397
HTGR-86-004
SH
REV
SH 29 30 31 32 33 34 35 36 37 38 39 40 41 42 43 44 45 46 47 48 49 50 51 52 53 54 55 5^9 REV
SH 10 11 12 13 14 15 16 17 18 19 20 21 22 23 24 25 26 27 28
MT-145-A SR-6236 PAGE 1 OF 46
Page 5
908699/1
TABLE OF CONTENTS
Page
1 . SUMMARY 4
2. INTRODUCTION 5
3. BRIDGING METHODS 7
4. SELECTION OF LICENSING BASIS EVENTS 13
5. SELECTION OF SAFETY-RELATED SSCs 34
6. REQUESTED NRC RESPONSE 42
7. REFERENCES 44
FIGURES
2-1 Bridging Method: A Bridge Between the Integrated Approach
and the Licensing Basis 6
3-1 Licensing Basis Regions for HTGR Bridging Methods 10
4-1 4 X 350 MW(t) Preliminary Safety Risk Assessment Compared
to Top-Level Regulatory Criteria 14
4-2 Identify PC-10 as as Anticipated Operational Occurrence 15
4-3 Identify CC -N1 as a Design Basis Event 23
4-4 Identify CC -9 as an Emergency Planning Basis Event 27
Page 2
Page 6
908699/1
TABLES
Page
1 Quantitative Criteria for Bridging 11
1 Anticipated Operational Occurrence Summary Table 18
2 Comparison of Releases to Appendix I Limits 20
3 Design Basis Event Summary Table 25
4 Emergency Planning Basis Event Summary Table 30
5 Comparison of Preliminary Risk Assessment to Latent Cancer
Risk Goal 33
1 Preliminary Identification of Safety-Related Functions 36
2 Representative Classification of an SSC as Safety-Related for the 350 MW(t) HTGR 37
3 Further Considerations in the Classification of an SSC as Safety-Related 38
4 Functions and Safety-Related SSCs Summary Table 41
Page 7
908699/1
1. SUMMARY
A review of the bridging methods is accomplished by providing an
application of the process to the standard HTGR. A representative PRA, of
limited range, is used in the process, and representative deterministic
licensing bases are obtained.
The PRA is presented as a risk plot, and the characteristics of the
events and the equipment in the PRA are used in the bridging application.
Representative licensing basis events are identified consisting of
anticipated operational occurrences, design basis events, and emergency
planning basis events.
Representative safety-related functions and safety-related structures,
systems and components are identified.
The licensing basis events and safety-related functions and equipment are
representative of the deterministic licensing bases that will be included in
the PSID and SARs.
A response is requested from NRC on the acceptability of the application
of the method, considering the range of the representative PRA presented.
Page 4
Page 8
908699/1
2. INTRODUCTION
The design of the HTGR is being conducted in a top down, goal oriented
manner using the DOE sponsored Integrated Approach. Methods have previously
been presented (Ref. 1) that enable bridging between this design process and
the NRC's licensing framework. In turn, this structured method for selecting
licensing bases supports one of the objectives of the Integrated Approach
process, promoting stability in licensing. In this document these bridging
methods are applied to demonstrate the derivation of licensing basis events
and safety classification of structures, systems and components.
At each design phase (i.e., preconceptual, conceptual, preliminary, and
final) the bridging methods will be used to derive licensing bases from
Top-level Regulatory Criteria (Ref. 2). This is illustrated in Fig. 2-1. On
the left hand side of the figure are seen the Top-Level Regulatory Criteria
feeding the Integrated Approach process. This process, also, having user
requirements as input, yields the engineering product of the plant design,
etc. On the right is a list of licensing bases. The subject of this document
is the centrally located box in the figure, the "bridge," connecting the
Integrated Approach and the licensing basis.
This application is based on the 350 MW(t) HTGR. Since this is the first
of several applications on a design concept that is not fully developed, the
licensing selections developed in this report should be considered representa
tive and can be expected to change in response to design evolution and further
analyses. However, the report serves as a basis for discussion of the
application of the bridging methods.
Page 5
Page 9
w #
IGA Technologies! FIGURE 2.1
BRIDGING METHOD: A BRIDGE BETWEEN THE INTEGRATED APPROACH AND THE LICENSING BASIS
USER
REQUIREMENTS
' '
TOP-LEVEL
REGULATORY
CRITERIA
' •
NTEGRATED APPROACH
'
ENGINEERING PRODUCT
PLANT DESIGN. ETC.
BRIDGE
LICENSING BASIS
PHINCPAL DESIGN CRITERIA
LICENSING BASIS EVENTS
EQUIPMENT CLASS
OTHER BASES o
OO
vD
Page 10
908699/1
3. BRIDGING METHOD
The method for bridging between the Integrated Approach design process
and the licensing basis, with which the NRC is familiar, has been documented
in Ref. 1. The steps in the method are summarized in the first part of this
section. In the second half, quantitative guidelines used in implementing the
first of these steps are discussed. Further discussion and examples of the
implementation of each of the succeeding steps is given in Sections 4 and 5.
3.1 Steps in the Bridging Method
Licensing Basis Events (LBEs) are one of the vehicles by which regulators
evaluate the licensability of a plant. The LBEs need to be chosen in the
process of defining the plant concept.
The approach herein is .o determine the LBEs utilizing risk assessment.
This provides a basis for judging, in a quantitative manner, the frequency of
the entire event sequence. The event frequency is used to determine the
appropriate dose or risk criteria.
This process can be illustrated with a figure, such as figure 3-1i which
is basically a "risk plot" where accident families are plotted. The ordinate
is the frequency with which an accident family is predicted to occur. The
abscissa is the dose for the family evaluated at the Exclusion Area Boundary
(EAB) of the plant.
The steps for choosing Licensing Basis Events are as follows.
Step 1. Define three regions on a frequency-consequence risk plot
bounded by three agreed upon mean frequencies and related to the
dose criteria of Appendix I, 10CFR100 or the PAG.
Step 2. Compare the results of a risk assessment of a plant designed to
Goals 1, 2, and 3 to the frequency-consequence risk plot.
Pa(?e 7
Page 11
908699/1
Step 3. Identify as Anticipated Operational Occurrences (AOOs) those
families of events that would violate the dose criteria were it
not for design selections that control radioactivity release.
Step 4. Evaluate the consequences of the selected AOOs realistically
against the Appendix I annualized dose criteria in for the
Safety Analysis Reports Chapter 11 analyses.
Step 5. Identify as Design Basis Events (DBFs) those families of events
within the design basis region that would violate the dose
criteria were it not for design selections that control
radioactivity release.
Step 6. Identify as DBFs those events with agreed upper margin
frequencies that lie within the design basis region and
otherwise satisfy Step 5.
Step 7. Evaluate the consequences of the selected DBEs conservatively
against the 10CFR100 dose criteria for the Safety Analysis
Reports Chapter 15 analyses.
Step 8. Identify as Emergency Planning Basis Events (EPBEs) the
dose-dominant events whose upper margin frequencies lie within
the emergency planning basis region.
Step 9. Evaluate the consequences of the selected EPBEs realistically
for emergency planning assessments.
Step 10. Compare the risk assessment of the Goal 1-2-3 Design to the
' Goal 0- Top-Level Regulatory Criteria (Interim Risk Goals).
In addition to LBEs, another licensing basis with which regulators
evaluate plant licensability and assure compliance with the Top-Level
Regulatory Criteria is safety classification. Certain structures, systems and
Page 8
Page 12
908699/1
components (SSCs) capable of performing those radioactivity control functions
related to public safety are classified as being safety-related. These SSCs
which are so classified are subjected to various quality standards regulated
by the NRC.
The steps for choosing which SSCs are to be classified as safety-related
are as follows.
Step 1. For each DEE, classify as safety-related those SSC design
selections needed to meet the design basis region dose criteria.
Step 2. For each EPBE with consequences greater than that specified by
10CFR100, classify as safety-related those SSC design selections
chosen to assure that the event frequency is below the design
basis region.
Step 3. For each SSC classified as safety-related, determine the design
conditions for its operation by examining all of its associated
DBEs and EPBEs.
3-2 Licensing Basis Event Selection Criteria
In Step 1 of the method for choosing LBEs it is necessary to define three
regions on a frequency-consequence risk plot bounded by three agreed upon mean
frequencies. In Fig. 3-1 these three regions are shown along with their
bounding frequencies 10"^, 10"^, and 10"^. The development of numerical
definitions for these boundaries is given in Ref. 3. The values for "W", "X,"
and "Y" arrived at in Ref. 3 and listed in Table 3-1 will be used in this
document.
Families of events which plot near the lower boundary of some region may
have significant uncertainties in the estimate of their frequencies, as
acknowledged in Steps 6 and 8 of the LBE selection process. The consideration
of these is necessary to allow a well balanced choice of events that will be
Page 9
Page 13
f
IGA TachnologlasI
~N
FIGURE 3,1 LICENSING BASIS REGIONS
FOR HTGR BRIDGING METHODS
<r w >-
z: CC
CL
>-LJ Z w !=) O UJ P i P-.
10" •w
10"
10 r Y
APPENDIX I
AOO REGION CONTAINING
ANTICIPATED OPERATIONAC OCCURRENCES
UNACCEPTABLE
AGREED FREQUENCY
DESIGN BASIS REGION CONTAINING
DESIGN BASIS EVENTS
DOSE LIMITS
EMERGENCY PLANNING BASIS REGION CONTAINING
EMERGENCY PLANNING BASIS EVENTS
AGREED FREQUENCY
lOCFRlOO
O 00
THYROID/UHOLE BODY REM RT ERB
Page 14
908699/1
TABLE 3-1 QUANTITATIVE CRITERIA FOR BRIDGING
PROPOSED REGION BOUNDARIES
Criterion Mean Frequency Symbol Region Bounded by Guideline (per Plant Year)
lO"' AOO region lower boundary 0.025
10"^ Design basis region lower boundary 1 x lO""*
10"^ Emergency planning basis region 5 x 10"' lower boundary
Page 11
Page 15
908699/1
! •
under the rules of the appropriate region. The mean value of frequency, which
involves an integral over the complete uncertainty spectrum, is the proposed
function for accounting for frequency uncertainties. An agreed upon factor
would then be placed on the mean frequency to provide margin and to dispel
concern over event families falling just barely below the frequency boundaries
of a region and therefore not being included in the region. A factor of 2 is
used in this report.
Page 12
Page 16
908699/1
4. SELECTION OF LICENSING BASIS EVENTS
Having defined the Top-level Regulatory Criteria and the regions over
which these criteria will be applied, a demonstration of the selection of
events can be started.
Step 2 of the Bridging Method is to compare the results of a risk
assessment of a plant design meeting the requirements of Goals 1, 2, and 3 to
the regulatory dose limits previously described. In Fig. 4-1 the results of a
representative risk assessment of the 350 MW(t) HTGR are compared to the
regulatory criteria as shown on a frequency-consequence risk plot. These
results are largely based upon analyses performed for the 250 MW(t) HTGR
(Ref. 4) and scaled, as required, to provide representative results for the
350 MW(t) plant.
Many of the event families of interest result in no or essentially no
dose to the public. These events are shown lying on the left of the figure.
Other events, to the right of these, represent those event families that lead
to significant predicted public exposure and still fall within the range of
frequencies considered in the licensing bases. Because the plant was designed
from the top down to meet all the top-level requirements of the Integrated
Approach, both user and regulatory, all these events can be seen to fall
within the allowable regulatory dose limits.
4.1 Anticipated Operational Occurrence Selection
Step 3 of the Bridging Method is to identify as AOOs those families of
events whose mean frequencies fall within the AOO region and would violate the
dose criteria were it not for design selections that control radioactivity
release. In Tig. 4-2 those event families with a frequency greater than 0.025
(once in 40 years) and therefore falling within the AOO region are shown.
Page 13
Page 17
s 9
l€A Ttchholoswcl
(X <E W >-
P-,
PC
> U
w a ui
2: a: w
FIGURE 4.1 4X350 MW(t) PLANT PRELIMINARY
SAFETY RISK ASSESSMENT COMPARED TO ACCIDENT SELECTION CRITERIA
10' 3-
10 0 _
10-"-
10-^-
10 3 .
10'"^
10 5_
10
10'
- 6 _
APPENDIX I
AOO -•CCin-fl REGION
^6-HjLMI
.PC-9
PC-6
qpS-NlCCL-W
DESIGN BASIS REGION
,M:-« ^ -
- 2 5x10⁻²
^-1 SG-t
ap-?^C-5
iCp-^
EMERGENCY PLANNING BASIS REGION
^ - 7
J^K CCp-B- SG-3 I c ; - !
0 LOW ' 10'^ I I I U I I IH • I I l l l l l l l I I I I Mill 1 I I IIMII 1 I I Mill
lOCFRlOO
10-"
5X10 r^
10" 10 10' 10 10'
MERN UHOLE BODY GRMMR DOSE RT ERB (REM)
Page 18
IGA Technologies!
FIGURE 4 2 IDENTIFY PC-IO AS
ANTICIPATED OPERATIONAL OCCURRENCE
10' -3
PC <L
a: - J p-
PC w
>-u z w a w p-
5:
10
10
10
10
0 ,
- l _ AOO
tCffH REGION +SG-N J> I
-2_
- 3 .
10 l - * .
- 5 , 10
10"° T
10"
APPENDIX I
EFFECT OF DESIGN SELECTION WITH
FUNCTION TO CONTROL RELEASE
.4
DESIGN BASIS REOION
EMERGENCY PLANNING BASIS REGION
- -2.5x10⁻²
lOCFRlOO
5x10 -7
T i—'l/ I ' I I II iiiii * I I II Mill—I I min i—I I II Mill—I I m i 0 low ' 1 0 " ^ I0"2 10"' 10° 10 ' 10
o OO o> VO
MERN WHOLE BODY GRMMR DOSE RT ERB (REM)
t
Page 19
908699/1
As an example of the selection process, consider the accident family
PC-10. With it's predicted mean frequency of once per plant year, PC-10 is
included on Fig. 4-2. PC-10 is a very small leak in the primary coolant
pressure boundary predicted to occur about once every year of plant operation.
A description of the event is as follows.
1. The coated fuel particles retain most of the generated fission
products and thereby keep the level of primary coolant activity low.
2. The helium purification system operates and further reduces the
primary coolant activity.
3. Reactor is at equilibrium 100$ power.
4. A very small leak occurs in the primary coolant pressure boundary
allowing coolant to escape (between 3 x 10"' to 0.05 sq in.)
5. The leak is detected and the reactor is shut down.
6. Core cooling is maintained using the Heat Transport System (HTS).
7. Some of the primary coolant is pumped to storage.
8. The remainder of the coolant leaks to the reactor building and
ultimately, after some hold up, to the environment.
While PC-10 clearly lies within the allowable dose limits, the line
extending from the right of the event indicates what the dose from such a leak
could be were it not for the performance of certain design selections which
control the release of radioactivity. For instance, if the design selection
for fuel particle coatings allowed much higher fission product releases during
normal operation, the primary coolant activity levels could be higher than
currently anticipated. Then if a leak were to occur the activity released and
the resultant offsite doses could be higher than now predicted and could
Page 16
Page 20
908699/1
exceed the dose limits as pictured. Therefore, PC-10 is included as an AOO
and, for convenience, is numbered AOO-3 in Table 4-1. The other AOOs,
identified in this manner, are also listed in this table.
Actually, since the analyses deal only with potential releases of
radioactivity from the primary coolant and the reactor core, all the candidate
events shown in Fig. 4-2 are, in fact, AOOs.
Five AOOs are listed in Table 4-1. Along with a number assigned to each
of the AOOs, the table contains two other pieces of information about each of
the AOOs. In the second column the accident family, also called a consequence
category, is listed. This designation comes from the PRA and is chosen to
identify a group of events with a certain type of radionuclide release path.
Knowing what the accident family category is, we can go back to the PRA. event
trees and determine which sequences lead to the AOO. So, listing the accident
family assists in cross refei encing between the AOOs and the PRA on which
they're based. In the third column a brief descriptive name is provided.
Further description of these AOOs is provided below.
AOO-1 is a loss of main loop cooling. It is intended to encompass most
failures, originating within the plant, that preclude the Heat Transport
System from continuing to perform the function of removing reactor heat. The
event is terminated by reactor shutdown and startup of the Shutdown Cooling
System. Failures typifying the event include circulator trips and losses of
feedwater.
AOO-2 encompasses failures similar to those in AOO-1 except that in AOO-2
the Shutdown Cooling System fails to run. The event sequence is terminated
with core cooling in the still pressurized module provided by convective loops
developed within the reactor core, conduction, and radiation heat transport
(pressurized conduction cooldown). Typical of the failures included in AOO-2
are failures originating within the plant that render both the HTS and SCS
unable to perform their heat removal functions such as a failure of the
service water system.
Page 17
Page 21
908699/1
TABLE 4-1 ANTICIPATED OPERATIONAL OCCURRENCE (AOO)
SUMMARY TABLE
AOO Accident Number Family Anticipated Operational Occurrence
AOO-1
AOO-2
AOO-3
AOO-4
AOO-6
LM-N1
CC -N1 m
PC-10
LP-N1
SG-N1
Loss of main loop cooling
Loss of main and shutdown cooling loops
Very small primary coolant leak
Loss of offsite power & turbine trip
Steam generator tube rupture
Page 18
Page 22
908699/1
AOO-3 is the small primary coolant leak (PC-10) discussed in some detail
above.
AOO-4 is a loss of offsite power and turbine trip. The event is similar
to AOO-1, in so far as that it leads to a loss of the HTS and the event is
terminated by reactor shutdown and startup of the SCS. The event differs from
AOO-1 in the failure sequence involved. For AOO-4 the failure initiating the
event sequence, a loss of offsite power, occurs outside the plant and creates
a significantly different set of conditions for analysis and design of the
plant. For instance, in AOO-4 startup of the SCS is predicated upon
successful start of a backup power supply.
AOO-6 is a steam generator tube rupture. The event is similar to AOO-1
in that it leads to loss of the HTS but because the failure leads to different
design bases for certain design selections, it is treated as a separate event.
In AOO-6 the tube rupture is followed by reactor and main loop shutdown. The
leaking steam generator is isolated from the feedwater and steam headers and
its inventory is dumped. Core cooling in this event is provided by the SCS.
Step 4 in the method is to evaluate the consequences of each of the
selected AOOs realistically against the Appendix I annualized dose criteria
for Chapter 11 of the Safety Analysis Reports. Because the doses from the PRA
plotted in Fig. 4-2 are calculated realistically, they can be considered as
indicative of what might be seen in Chapter 11. Showing that these doses are
acceptable relative to the limits of Appendix I requires that the doses from
each AOO be expressed on an annualized or risk bases of mRem/year, as are the
limits of Appendix I. Then the risk from all of the events plus that from
planned releases can be summed and compared to the Appendix I limits. Such a
comparison is' made in Table 4-2.
In the table both the frequency and resultant dose from each of the AOOs
is listed. The product of these is the annualized dose and is listed in the
right most column. Since AOO-3, the small primary coolant leak discussed
Page 19
Page 23
908699/1
TABLE 4-2 COMPARISON OF RELEASES TO APPENDIX I LIMITS
! •
AOO
AOO-1
AOO-2
AOO-3
AOO-4
AOO-6
Frequency (Per Year)
Normal Operation
2.5
0.1
1.2
0.04
0.04
Dose (mRem)
Whole Body
0.05
0
0
0.84
0
0
Total Annual
Appendix I
Dose
Limit
Annualized Dose
(mRem Per Year)
0.05
0
0
1.01
0
0
1.06
5.0
Page 20
Page 24
908699/1
above, is the only AOO which has a calculated dose it is the only AOO to
contribute to the total. The planned releases from normal operation have not
as of yet been evaluated but for the purposes of this example it is assumed to
be lit of the releases allowed.
4.2 Design Basis Event Selection
In Step 5 of the method a similar approach is utilized to to select
Design Basis Events (DBEs). The method identifies as DBEs those families of
events whose mean frequencies fall within the design basis region and would
violate the dose criteria were it not for design selections that control
radioactivity release.
Those events identified in the PRA and falling within the design basis
region, that is those with mean frequencies between 0.025 and 1 x lO"", are
shown in Fig. 4.3. Each of these event families is considered as a potential
DBE. For example, consider the event family designated on the figure as
CC -N1. LI
CC -N1 is a station blackout in which all ac electrical power is lost. LI
This event is predicted to occur at a mean value of 8 x lO"" per plant year.
The specific events involved are as follows.
1. Reactor is at equilibrium 100$ power.
2. Offsite electrical power is lost.
3. Turbine-generator fails to remain on-line. Normal, in-house power
is lost. HTS is unavailable.
4. Reactor is shutdown.
5. Standby power source fails to start. No power is available to
operate the Shutdown Cooling System.
Page 21
Page 25
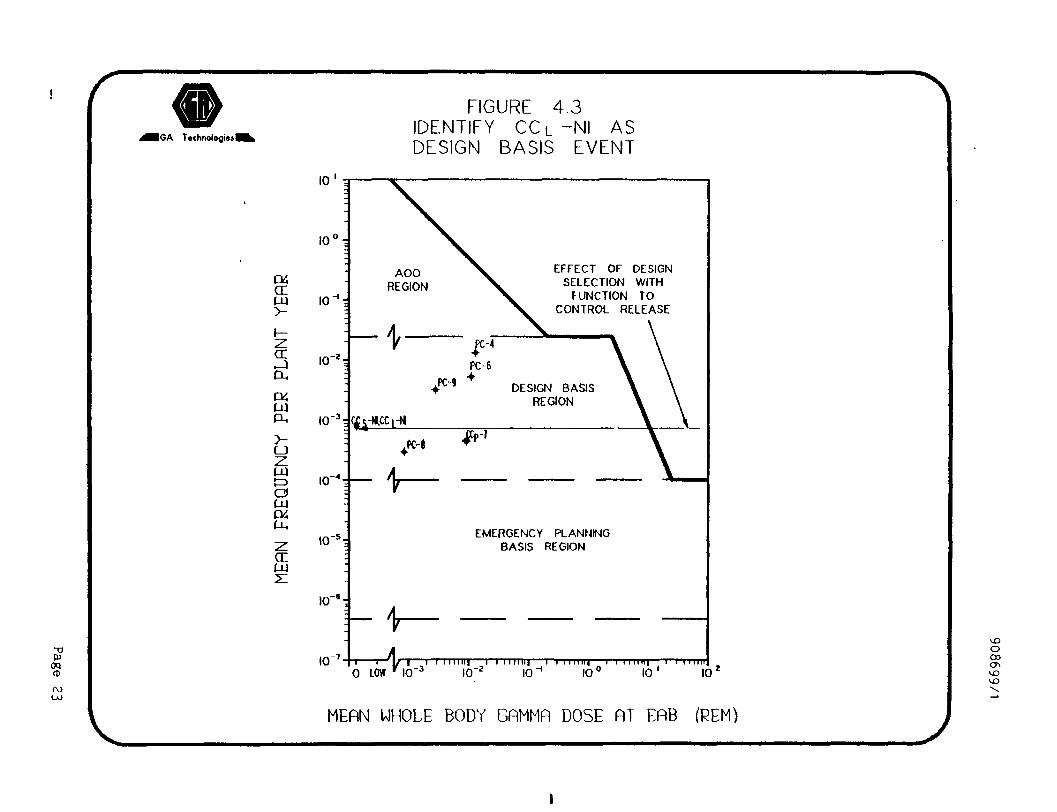
6. Primary coolant remains at pressure.
908699/1
7. Decay heat removal from the core is accomplished via localized
convection, conduction and radiation. Fuel temperatures remain
below normal operating limits.
8. Vessel temperatures are kept within design limits by the passive
reactor cavity cooling system (natural circulation of water).
9. Primary coolant and fuel inventories are retained. Therefore, there
is no radioactivity release.
As seen in Fig. 4-3 the frequency of this event family, being in excess of
10-", puts CC -N1 in the design basis region. Additionally, while the event L
leads while the event leads .o no public exposure, and therefore falls well
within the dose limit for this region, this limit could be exceeded were it
not for certain features selected in the design of the plant. The horizontal
arrow extending from the right of CC.-N1, in the figure, is intended to show
an estimate of what the dose from this sequence of failures might be if the
plant was not designed to reject decay heat via natural convection within the
core, conduction and radiation and not designed with high temperature fuel.
Without the "conduction cooldown" feature this sequence of events, described
by CC -N1, would result in a total loss of core cooling and loss of fuel LI
integrity and the dose limits could be exceeded as shown. Because of this, CC -N1 is included as a DBE and labeled DBE-8. L
other events, not shown on Fig. 4-3 but visible on 4-1, might fall very
close to but not actually within the frequencies bounding the design basis
region. Step' 6 of the method identifies as DBEs any additional event families
whose agreed upper margin frequencies fall within the design basis region and
who otherwise satisfy Step 5 as described above. A review of Fig. 4-1 shows
no additional DBEs from Step 6, assuming that a factor of two covers the
agreed upon margin.
Page 22
Page 26
# IGA Technologiesl
FIGURE 4.3 IDENTIFY C C L - N I AS DESIGN BASIS EVENT
10'
OC CE Ui >-
a: _ i p .
DC p j PH
>-LJ Z P)
o P4 P i
z CE P I
1 0 ° -
10 ""t
10"^
10"^
- 5 . 10
I0~ ' i
10"
EFFECT OF DESIGN SELECTION WITH
FUNCTION TO CONTROL RELEASE
DESIGN BASIS REGION
IO"^-^^-HCCt-t<
. M ^-
, - \ -
EMERGENCY PLANNING BASIS REGION
:-f I I ' l / ~ |—I I I Mini—I I 11 Mill I I n iiiii I I I iiini i i i iiiii 0 LOW ' 10" 10" 10" lO^ 10 10'
MERN UHOLE BODY GRMMR DOSE RT ERB (REM)
I
Page 27
908699/1
A listing of all the event families, identified as DBEs in Steps 5 and 6,
is provided in Table 4-3. For each DBE within the table a convenient DBE
identifying number is first given. As was done for the table of AOOs, this is
then followed by the accident family category and a brief descriptive name.
Additional descriptions of the DBEs are given in the following paragraphs.
Many of the DBEs listed in the table are aimed at primary coolant leaks
which were found in the safety assessment of the plant to dominate risk to the
public. DBEs 3 and 1 characterize leaks of increasingly large size in which
the plant responds as planned. The reactor is shut down following detection
of the leak. A portion of the primary coolant leaks into the reactor building
while the remainder is pumped to storage. Core cooling is provided by the
Heat Transport System operating in a shutdown mode. The moderate, though less
likely, leaks, because of their more rapid depressurization, differ from the
smaller leaks in four ways. The higher flow rates can give rise to greater
liftoff of plated out material in the primary coolant loop. The shorter
transient time limits or completely precludes the extent to which the coolant
can be pumped to storage, thus increasing that released. The greater
differential pressures associated with the large leaks increase the loads on
various structures within the primary circuit. Finally, the reactor building
response to different sized leaks can vary.
While the events described above all had the plant responding as it was
designed to do, the method places no limit on the number of failures, subse
quent to the leak, that must be included in the DBEs except that the predicted
likelihood of the event sequence must fall within the range of frequencies
included by the design basis region. DBEs 5 through 7 describe very small
leaks in which the plant does not respond as planned. DBE-5 encompasses any
failures that" prevent pumping the primary coolant to storage. DBE-6 encom
passes single common mode and multiple failures that preclude both the HTS and
the SCS from providing core cooling. In this case the event is terminated
with core cooling being provided by conduction and radiation and cavity
Page 24
Page 28
908699/1
TABLE it-3 DESIGN BASIS EVENTS (DBE)
SUMMARY TABLE
Accident DBE Number Family Design Basis Event (DBE) Name
Moderately sized primary coolant leak
Small primary coolant leak
Very small primary coolant leak without pumpdown
Very small primary coolant leak without shutdown cooling
DBE-7 PC-8 Very small leak without confinement Filters
DBE-8 CC -N1 Loss of offsite power, turbine trip and_ Failure of the SCS to Start
DBE-9 CC -N1 Large steam generator leak with failure of ^ the SCS to start
DBE-1
DBE-3
DBE-5
DBE-6
PC-4
PC-6
PC-9
CC - 7 P
Page 25
Page 29
908699/1
cooling. DBE-7 encompasses failures that prevent use of the reactor building
filters.
DBE-8 is a loss of offsite power followed by inadvertent turbine trip and
failure to successfully start the SCS. DBE-8 is generally similar to AOO-2.
Both encompass a loss of forced core cooling with the event sequence
terminated by a pressurized conduction cooldown and no offsite release. In
the case of DBE-8, however, the course of the event sequence is strongly
influenced by the loss of offsite power and the failure of the SCS to start
which is typically attributable to a failure of the standby power source to
start.
DBE 9 encompasses large steam generator leaks, such as those described by
AOO-6 but with the addition that the shutdown cooling system fails to provide
forced convection cooling.
In Step 7 the consequences of each selected DBE is conservatively
evaluated and compared to the 10CFR100 dose criteria for Chapter 15 of the
Safety Analysis Reports. The doses shown on the figures for each of the DBE
selected are realistic. Conservative calculations have not yet been
completed, but representative uncertainty bars showing conservative values on
the right end are shown on Fig. 4-3.
'1.3 Emergency Planning Basis Event Selection
Step 8 of the LBE selection process identifies as Emergency Planning
Basis Events (EPBEs) the dose dominant events whose upper margin frequencies
fall within the frequency range encompassed by the emergency planning basis
region.
As an example of the application of this step consider Fig. M-**. Shown
in the figure are all those accident families evaluated in the FRA and whose
expected frequencies fall within the emergency planning basis region. As can
be seen the highest dose family in the region is the small primary coolant
leak category designated CC -9. Details of this event are as described below.
Page 26
Page 30
# IGA Tachnoiogicsl
FIGURE 4 4 IDENTIFY CCp - 9 AS
EMERGENCY PLANNING BASIS EVENT
04 CE J-U >-
CC • J PU
(X UJ
a. >-u z w a w 04
a: UJ
10
10 0 .
10-'t
- V 10-^-
lO"''-:
IO- 'T
lO-^r
lO"*':
10 -7 .
AOO REGION
1-f
DESIGN BASIS REGION
fp-»
SG-:
CCp-2^C-5
^ - 7
EMERGENCY PLANNNG BASIS REGION
^-2
0 low ' 10 II inn—I I II iiii|—I I IIIIIII 1.1 IIIIIII I M i l l
10" 10 10' 10 10'
MERN UHOLE BODY GRMMR DOSE RT ERB (REM)
I
Page 31
908699/1
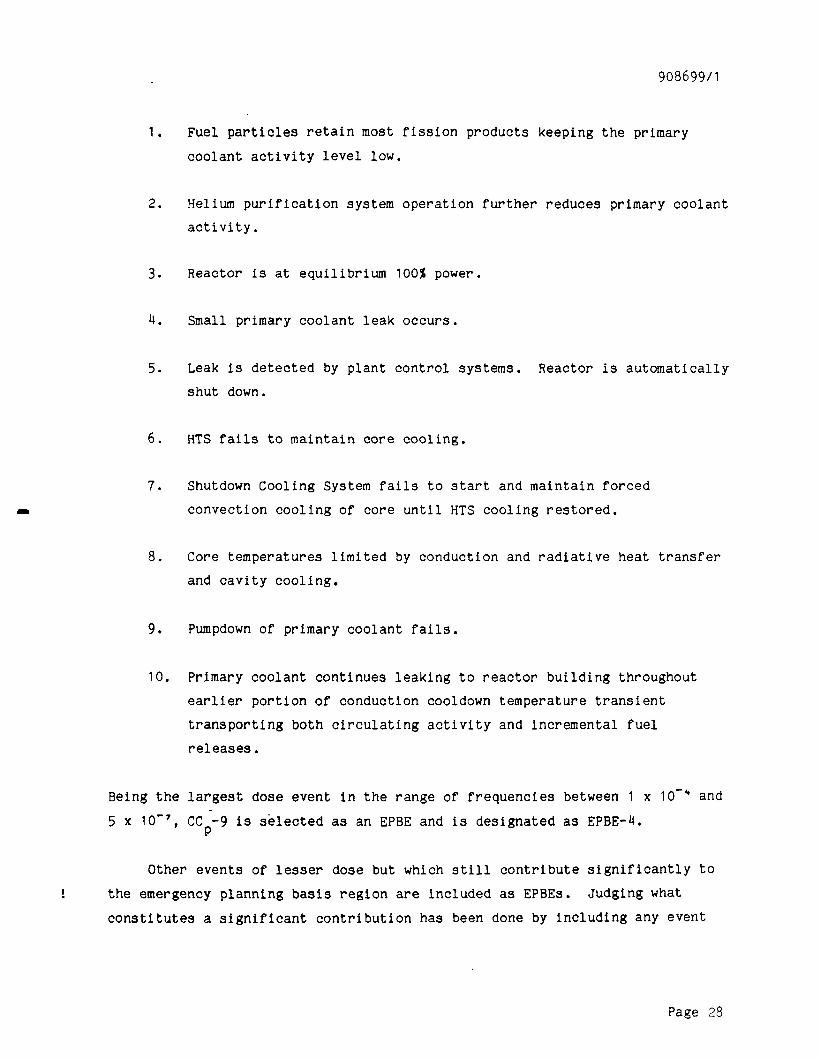
1. Fuel particles retain most fission products keeping the primary
coolant activity level low.
2. Helium purification system operation further reduces primary coolant
activity.
3. Reactor is at equilibrium 100>f power.
1. Small primary coolant leak occurs.
5. Leak is detected by plant control systems. Reactor is automatically
shut down.
6. HTS fails to maintain core cooling.
7. Shutdown Cooling System fails to start and maintain forced
convection cooling of core until HTS cooling restored.
8. Core temperatures limited by conduction and radiative heat transfer
and cavity cooling.
9. Pumpdown of primary coolant fails.
10. Primary coolant continues leaking to reactor building throughout
earlier portion of conduction cooldown temperature transient
transporting both circulating activity and incremental fuel
releases.
Being the largest dose event in the range of frequencies between 1 x 10"" and
5 X 10"', CC -9 is selected as an EPBE and is designated as EPBE-U. P
Other events of lesser dose but which still contribute significantly to
! the emergency planning basis region are included as EPBEs. Judging what
constitutes a significant contribution has been done by including any event
Page 28
Page 32
908699/1
that has a dose of greater than about 1? of the event with the largest dose,
in this case EPBE-U. Table H-U lists all the events identified as EPBEs.
Eight events are listed in the table. EPBE-4 is the dominant risk
contributor in the region and has already been addressed in some length.
Other EPBEs with in the table are summarized below.
EPBEs 1 and 2 are moderately sized primary coolant leaks of less than
1 sq in. in which reactor building ventilation fails to operate as designed.
These events include the failure to divert ventilation discharge through
exhaust filters. This failure reduces the building's ability to holdup
released radioactivity and results in higher doses than would otherwise occur
for leaks of this size. In the case of EPBE-2 the release is increased by a
subsequent failure to pumpdown the primary coolant system to storage.
EPBEs 3. and H are small primary coolant leaks followed by failures in
forced circulation. EPBE-4 has already been discussed in some detail. EPBE-3
is identical but the leak is smaller and the corresponding dose is lower.
EPBE-9 is a very large primary coolent leak followed by failure in forced
circulation.
EPBE-5 is a large steam generator leak in which the steam generator dump
valves do not successfully dump the water inventory from the affected module.
This failure allows more water/steam ingress to the primary coolant system
than otherwise would occur which leads to lifting of the primary coolant
relief valve. In EPBE-5 the relief valve does not reseat after successfully
opening. This in turn leads to venting the primary coolant and some liftoff
to the reactor building.
EPBE-6 i-s a large steam generator leak in which feedwater is not
successfully isolated from the affected module. This failure allows more
water/steam ingress to the primary coolant system than otherwise would occur
which leads to lifting of the primary coolant relief valve. In EPBE-6 the
relief valve does not reseat after successfully opening. This in turn leads
to venting the primary coolant and some liftoff to the reactor building.
Page 29
Page 33
908699/1
TABLE 4-4 EMERGENCY PLANNING BASIS EVENT (EPBE)
SUMMARY TABLE
EPBE Number Accident Family Emergency Planning Basis Event (EPBE)
EPBE-1 PC-5 Moderate primary coolant leak with reactor bldg. fans operating without filters
EPBE-2 PC-7 Moderate primary coolant leak with failure to Pumpdown and Reactor Bldg. Fans operating without filters
EPBE-3
EPBE-4
CC -2 P
CCp-9
Very small primary coolant leak without forced core cooling
Small primary coolant leak without forced core cooling
EPBE-5
EPBE-6
SG-2
SG-3
Large steam generator leak with failure to dump and stuck open primary relief valve
Large steam generator leak with failure to isolate feedwater and stuck open primary relief valve
EPBE-7 SG-4 Large steam generator leak with failed open dump valves
EPBE-8
EPBE-9
CC -9 s
CC -6 P
Large steam generator leak with failed open dump valves and without forced core cooling
Very large primary coolant leak without forced core cooling.
Page 30
Page 34
908699/1
EPBE-7 is a large steam generator leak in which the mutiple dump valves
fail to reshut after discharging the steam generator water inventory. This
failure allows the primary coolant to escape through the ruptured steam
generator tube, through the steam generator tubing and out to the atmosphere,
via the open dump valves, and in so doing to bypass the reactor building.
EPBE-8 is similar to EPBE-7 but includes a loss of forced circulation.
Like EPBE-7 a leak occurs in which the mutiple dump valves fail to reshut
after discharging the steam generator water inventory. However, in EPBE-8 the
SCS fails to successfully provide core cooling until the HTS is restored to
service. Core cooling is via conduction and radiation. These failures allow
the primary coolant and any incremental fuel releases, due to the conduction
cooldown temperature transient, to escape to the atmosphere and bypass the
reactor building.
As stated in Step 9 of the Bridging Method the consequences of the
selected EPBEs are evaluated realistically for emergency planning, and
environmental assessments. These realistic dose evaluations, performed as a
part of the preliminary PRA, are shown in Fig. 4-4 for the selected EPBEs.
4.4 Overall Regulatory Compliance
The preceding steps of the LBE selection method have shown how the choice
of these events is used to demonstrate compliance with various portions of the
Top-Level Regulatory Criteria. AOOs are used as a part of showing compliance
with the annualized dose criteria of 10CFR50 Appendix I. DBFs are used to
show compliance with the dose limits specified in 10CFR100. In Step 10 AOOs,
DBFs and EPBEs are used together to show compliance with the Top-Level
Regulatory Criteria consisting of the interim safety goals. The step requires
that the results of a risk assessment of the plant be compared to that portion
of the Interim Risk Goals contained in the Top-level Regulatory Criteria. In
so doing plant conformance with these goal 0 regulatory criteria is confirmed.
Page 31
Page 35
908699/1
Table 4-5 demonstrates how such a comparison is made using those LBEs
selected in the previous sections. For each LBE the table notes both the
event frequency and consequence, both of which can be read off the frequency-
consequence plots previously seen. The product of these factors gives a risk.
These risks have been calculated for each event and the result given in the
right-hand column of the table. Summing up these risks would give a resultant
risk due to all unplanned releases. However, the risk limits specified in the
interim safety goals is for all releases, whether planned or unplanned.
Therefore, one additional entry, listed as "normal operation" in the event
column, can be seen in the top line of the table. Summing all the risks
listed in the right hand column of the table yields a total risk which is
compared to the risk goal.
Because of the preconceptual stage of the design of the 350 MW(t).HTGR
actual calculations have not been performed on the predicted annual planned
releases from the plant. Ho..ever, to illustrate this demonstration of
compliance with the interim safety goals, a value of 1? of that allowed by
Appendix I is assumed. It can be seen then, by reviewing Table 4-5, that
significant margin to the latent cancer risk goal (2 x 10~* latent cancer
deaths per plant year per person) is predicted. Furthermore, it should be
noted that the total risk is dominated by the smaller, more frequent releases
characterized by the AOOs and higher frequency DBEs.
Page 32
Page 36
908699/1
TABLE 4-5 COMPARISON OF PRELIMINARY RISK ASSESSMENT TO LATENT CANCER
RISK GOAL
Region
AOO
Design Basis
Design Basis
Design Basis
Design Basis
Design Basis
Emergency Planning
Emergency Planning
Emergency Planning
Emergency Planning
Emergency Planning
Emergency Planning
Emergency Planning
Basis
Basis
Basis
Basis
Basis
Basis
Basis
Event
Normal Operation
PC-10
PC-4
PC-6
PC-9
CCp-7
PC-8
PC-5
PC-7
CC -2 P
CC -9 P
SG-3
SG-4
CC3-9
Frequency
Events Per year (Mean)
1
5
3
4
3
2
8
2
2
4
1
4
1.0
0.95
X 10"^
X 10"'
X 10"'
X 10""
X 10""
X 10"*
X 10"'
X 10"*
X 10"'
X 10"'
X 10"*
X 10"'
Consequence
Cancers Per Event Per Person
5
9
1
1
3
9
8
1
3
9
3
9
3
X 10-»
X 10"«
X 10"*
X 10"*
X 10"'
X 10"'
X 10"*
X 10"*
X 10"'
X 10"'
X 10"*
X 10"*
X 10"*
9 X 10"«
Total risk
Risk goal
Risk
Cancers Per Year Per Person
5
8
1
6
9
4
2
2
2
2
4
4
3
4
3
2
X
X
X
X
X
X
X
X
X
X
X
X
X
X
X
X
10"'
10"«
10"*
10"^
10"'°
lO-'o
10-1'
10"'^
10"''
10"'^
lO"'"
10"'^
10""
10"'*
10"*
10-*
Page 33
Page 37
908699/1
5. SELECTION OF SAFETY-RELATED STRUCTURES, SYSTEMS AND COMPONENTS
A three-step method for classifying certain structures systems and
components (SSCs) as safety-related is described in Ref. 1. The method is
linked to the selection of DBEs and leads to classifying as safety-related a
set of plant features which perform the functions needed for compliance with
the dose limits of 10CFR100. This method, along with the selection of DBEs
given above, has been used to develop a representative classification of
safety-related SSCs for the 4 x 350 MW(t) HTGR. The following section, in
addition to listing the SSCs so classified, describes the method used and
provides an example of its application.
Step 1 specifies that for each DBE, classify as safety-related those SSC
design selections chosen for compliance with the dose criteria of the design
basis region. More exactly, for each DBE selected various functions can be
identified which must be performed if the consequence of the event is to
remain within that allowed by the dose criteria. These functions, for a
typical DBE, might be such things as removing core heat or controlling core
reactivity. Step 1 requires that a set of SSCs which are capable of
performing these functions be classified as safety-related. Note that this
does not require that the SSC(s) performing these functions as described by
the DBE be classified as safety-related. The method only requires that an SSC
capable of adequately performing the required function(s) be so classified.
This distinction will be further clarified in the example.
Step 2 specifies that for each EPBE, with consequences greater than
10CFR100, classify as safety-related those SSC design selections chosen to
assure that the event frequency is below the design basis region. For this
step too various functions can be identified which must be performed to assure
that the frequency of an EPBE, with a consequence greater than that allowed by
10CFR100, falls below the design basis region. Step 2 requires that a set of
SSCs capable of performing these functions be classified as safety-related.
Again, these SSCs need not be those in the EPBE description.
Page 34
Page 38
908699/1
Finally, Step 3 of the method specifies that for each SSC classified as
safety-related, determine the design conditions for its operation by examining
all it's associated DBEs and EPBEs.
Illustrating how this process has been used to classify various SSCs as
safety-related, observe Table 5-1. In this table a matrix has been
constructed showing, for each DBE, which functions must be performed if the
dose limits of 10CFR100 are to be met. Because there are no EPBEs yet
identified which exceed the 10CFR100 limits, there is no EPBE table.
From Steps 1 and 2 each of the functions listed in Table 5-1 an SSC, or
set of SSCs, capable of performing the function will be classified as
safety-related. Viewing the table it is immediately apparent that many of the
DBEs rely on satisfactory performance of the same functions in order to result
in allowable doses. Thus in selecting an SSC to classify as safety-related
for some function, it is advisable to consider simultaneously all the events
during which the function is required.
For example, consider function number "B" in the table. Remove Core Heat.
This function is relied upon by all the DBEs listed. Furthermore, one can
quickly think of several SSCs which are capable of providing the function and
might be candidates for being classified as safety-related. In Table 5-2 a
second matrix has been constructed showing, for each DBE, which SSCs in the
plant design are available to perform the function of removing decay heat. In
addition to this, the table, in the second from the right hand column, gives
an estimate of the relative cost impact of classifying each of these SSCs
safety-related. So in choosing which SSC to classify one first determines
which SSCs can satisfy the needs of all the DBEs. Then, from among these
possibilities, one chooses the SSC with the lowest cost impact. In this case
the choice is somewhat more involved because while option 5 (Reactor Cavity
and Surroundings) may at first appear more attractive, this choice would not
be optimal when other safety-related functions are considered. Referring to
Table 5-3 it is noted that the cavity and surroundings are not by themselves
able to satisfy the function of preventing chemical attack and so option 4 of
Page 35
Page 39
TABLE 5-1 PRELIMINARY SELECTION OF SAFETY RELATED FUNCTIONS
Safety-Related Function DBE-1 DBE-3 DBE-5 DBE-6 DBE-7 DBE-8 DBE-9 To Meet 10CFR100 PC-4 PC-6 PC-9 CC -7 pc-8 CC,-N1 CC«-N1
P LI O
A. Retain Radionuclides within Yes Yes Yes Yes Yes Yes Yes Coated Fuel Particles
B. Remove Core Heat to Assist in Yes Yes Yes Yes Yes Yes Yes Radionuclide Retention
C. Prevent Chemical Attack _ _ _ _ _ yes Yes
Page 40
TABLE 5-2 REPRESENTATIVE CLASSIFICATION OF AN SSC AS SAFETY-RELATED
FOR THE 350 MW(t) HTGR
SAFETY-RELATED FUNCTION; Remove Core Heat to Assist in Radionuclide Retention (Function "B" in Table 5-1)
SSC Available to Perform Function
DBE-1 DBE-3 DBE-5 DBE-6 DBE-7 DBE-8 DBE-9 Related Class. PC-4 PC-6 PC-9 CCp-7 PC-8 CC^-Nl CCg-Nl Cost
1. Heat Transport Sys Yes Yes Yes High
2. Shutdown Cooling System Yes Yes Yes Yes Medium
3. Conduction C/D to Active RCCS Yes Yes Yes Yes Yes Yes Medium
4. Conduction C/D to Passive RCCS Yes Yes Yes Yes Yes Yes Yes Medium
5. Conduction C/D to Reactor Cavity and Surroundings Yes Yes Yes Yes Yes Yes Yes Medium X
Page 41
TABLE 5-3 FURTHER CONSIDERATIONS IN THE CLASSIFICATION OF AN SSC AS SAFETY-RELATED
SAFETY-RELATED FUNCTION: Prevent Chemical Attack (Function "C" in Table 5-1)
SSC Available to Perform Function
DBE-8 DBE-9 Related Class, CC -NI CCg-N1 Cost
1. HPS Pumpdown Yes Medium
2. Conduction C/D to Passive RCCS Yes Yes Low
3. Conduction C/D to Reactor Cavity and Surroundings
Page 42
908699/1
Table 5-2, Conduction Cooldown to the RCCS in the passive mode, is classified
as safety related. If no one SSC had been able to satisfactorily perform the
function for all the events of concern then the more difficult, though
conceptually similar, task of finding the most cost effective set of SSCs
would be undertaken. A redesign introducing new SSCs could also be
considered.
Other SSCs which have been classified as safety-related using this method
can be found in Table 5-4. In the table are first listed, in the left-hand
column, those functions which must be performed in order to limit any releases
to within that allowed by 10CFR100. On the right are listed those SSCs which
are both capable of performing the function and have been chosen to be
classified as safety-related.
The first function listed in the table is the retention of fission
products within the fuel. Accomplishment of this function assures low
activity levels within the primary coolant such that should the primary
coolant escape the resulting doses fall within acceptable limits.
Furthermore, the retention function is also key to the HTGRs performance
during transients and is related to function B. That is, the conditions under
which this retention must be accomplished is determined in part by the degree
to which function B, heat removal, is accomplished. The degree of retention
required is that needed to limit any releases to levels consistent with the
dose criteria of 10CFR100. While several design options are available to do
this, the SSC capable of accomplishing this and chosen to be classified is the
coated, ceramic HTGR fuel.
The second of the functions ("B"), Remove Core Heat, has been discussed
in some depth previously and is not further discussed here.
The last function dealt with in the table. Function C, is preventing
chemical attack. Accomplishment of this function involves limiting the
ingress of any graphite oxidants to levels that would not lead to releases in
excess of those compatible with meeting the Top-Level Regulatory Criteria.
Page 39
Page 43
908699/1
Several SSCs have been selected as being safety related and together can
perform this function. These include the reactor pressure vessel, the primary
coolant relief valves and the reactor cavity cooling system.
Page 40
Page 44
908699/1
TABLE 5-4 FUNCTIONS REQUIRED TO MEET 10CFR100 AND SSCs CLASSIFIED
AS SAFETY-RELATED
Safety-Related Function Safety-Related SSC
Retain radionuclides within fuel
Leaktight fuel, high temperature and moisture resistant fuel
Reactor Core (18) especially particle coatings
Remove core heat to assist radionuclide retention
SSCs for conduction cooldown in (conduction and radiation heat transport from core)
Reactor Core (18) Reactor Internals (17) Reactor Vessel (11-6) Reactor Enclosure Space
Prevent chemical attack SSCs preventing large air ingress Reactor Cavity Cooling (56) in
passive mode only Primary Coolant Pressure Relief
Valves (11-5)
Control reactivity (To be determined)
Page 41
Page 45
908699/1
6. REQUESTED NRC RESPONSE
This document has been prepared for presentation to the Advanced Reactor
Group of the Nuclear Regulatory Commission (NRC) in support of the HTGR
Licensing Plan (Ref. 6). It is submitted for their information and review.
The NRC is requested to address and respond to the following questions on the
review of the bridging method based on the representative application given in
Sections 4 and 5:
1. Does the NRC agree that the choice of licensing basis events follows
the bridging method, within the range of the representative PRA
results presented in the review?
2. Are the licensing basis events chosen a complete selection, within
the range of the representative PRA results presented?
3. Are the anticipated operational occurrences and the design basis
events chosen the appropriate and complete set of events to be
included in the PSID and SARs, within the range of the
representative PRA results?
4. Are the emergency planning basis events chosen the appropriate set
of events to be emphasized in the PRA report, within the range of
the representative results?
5. Does the NRC agree that the choice of safety-related functions
follows the bridging method, within the range of the representative
PRA results presented?
6. Are the sstfety-related functions chosen a complete selection, within
the range of the representative results?
Page 42
Page 46
908699/1
Does the NRC agree that the choice of safety-related structures,
systems and components are sufficient to perform the chosen
safety-related functions?
Are the chosen safety-related structures, systems and components an
appropriate and complete set to be included in the PSID and SARs as
safety-related equipment, within the range of the representative
results?
Page 43
Page 47
908699/1
REFERENCES
Houghton, W. J., "Bridging Methods for Standard HTGR Licensing Bases,"
HTGR-85-039 Rev. 1, GA Document PC-000194, October 1985.
"Top-level Regulatory Criteria for the Standard HTGR," HTGR-85-002, GA
Document PC-000169, January 1985.
Houghton, W. J., Licensing Basis Event Selection Criteria," HTGR-86-001,
GA Document 908418, to be published.
Everline, C. J., and S. B. Inamati, "Safety Risk Assessment of 250 MW(t)
Side-by-Side Modular HTGR Plant," HTGR-85-097, GA Document 908246,
August 1985.
Houghton, W. J., "Bridging Manual," GA Doc 908395, September 1985.
"Licensing Plan for the Standard HTGR," HTGR-85-002, GA Document
PC-000169, Rev. 1, June 1985.
Page 44