Functional characterization of human Cd33+ AndCd11b+ myeloid-derived suppressor cell subsetsinduced from peripheral blood mononuclear cellsco-cultured with a diverse set of human tumorcell linesMelissa G Lechner, Carolina Megiel, Sarah M Russell, Brigid Bingham, Nicholas Arger, Tammy Woo andAlan L Epstein*
Abstract
Background: Tumor immune tolerance can derive from the recruitment of suppressor cell populations, includingmyeloid-derived suppressor cells (MDSC). In cancer patients, MDSC accumulation correlates with increased tumorburden, but the mechanisms of MDSC induction remain poorly understood.
Methods: This study examined the ability of human tumor cell lines to induce MDSC from healthy donor PBMCusing in vitro co-culture methods. These human MDSC were then characterized for morphology, phenotype, geneexpression, and function.
Results: Of over 100 tumor cell lines examined, 45 generated canonical CD33+HLA-DRlowLineage- MDSC, with highfrequency of induction by cervical, ovarian, colorectal, renal cell, and head and neck carcinoma cell lines. CD33+
MDSC could be induced by cancer cell lines from all tumor types with the notable exception of those derivedfrom breast cancer (0/9, regardless of hormone and HER2 status). Upon further examination, these and others withinfrequent CD33+ MDSC generation were found to induce a second subset characterized as CD11b+CD33lowHLA-DRlowLineage-. Gene and protein expression, antibody neutralization, and cytokine-induction studiesdetermined that the induction of CD33+ MDSC depended upon over-expression of IL-1b, IL-6, TNFa, VEGF, andGM-CSF, while CD11b+ MDSC induction correlated with over-expression of FLT3L and TGFb. Morphologically, bothCD33+ and CD11b+ MDSC subsets appeared as immature myeloid cells and had significantly up-regulatedexpression of iNOS, NADPH oxidase, and arginase-1 genes. Furthermore, increased expression of transcriptionfactors HIF1a, STAT3, and C/EBPb distinguished MDSC from normal counterparts.
Conclusions: These studies demonstrate the universal nature of MDSC induction by human solid tumors andcharacterize two distinct MDSC subsets: CD33+HLA-DRlowHIF1a+/STAT3+ and CD11b+HLA-DRlowC/EBPb+, whichshould enable the development of novel diagnostic and therapeutic reagents for cancer immunotherapy.
Keywords: myeloid-derived suppressor cells, tumor immune tolerance, human tumor cell lines, immunomodula-tion, cytokines, hypoxia-inducible factor 1 alpha, CAAAT-enhancer binding protein, signal transducer and activatorof transcription, inflammation
* Correspondence: [email protected] of Pathology, USC Keck School of Medicine, Los Angeles,California, USA
Lechner et al. Journal of Translational Medicine 2011, 9:90http://www.translational-medicine.com/content/9/1/90
BackgroundMyeloid-derived suppressor cells (MDSC) have recentlybeen recognized as a subset of innate immune cells thatcan alter adaptive immunity and produce immunosup-pression [1]. In mice, MDSC are identified by CD11b+,IL-4Ra+, and GR-1low/int expression, with recognizedgranulocytic and monocytic subsets [2-6]. Human MDSCare less understood and comprise a heterogeneous popu-lation of immature myeloid (CD33+) cells consisting ofdendritic cell, macrophage, and granulocyte progenitorsthat lack lineage maturation markers [2,5]. MDSC inhibitT cell effector functions through a range of mechanisms,including: arginase 1 (ARG-1)-mediated depletion ofL-arginine [7], inducible nitric oxide synthase (iNOS) andNADPH oxidase (NOX2) production of reactive nitrogenand oxygen species [8,9], vascular endothelial growth fac-tor (VEGF) over-expression [10], cysteine depletion [11],and the expansion of T-regulatory (Treg) cell populations[12,13]. While rare or absent in healthy individuals,MDSC accumulate in the settings of trauma, severe infec-tion or sepsis, and cancer [6], possibly as a result of thehypoxia and inflammatory mediators in the tumor micro-environment [14-19]. In cancer patients and experimen-tal tumor models, MDSC are major contributors totumor immune tolerance and the failure of anti-tumorimmunity [1]. Given the multitude of immune modula-tory factors produced by tumors, it is indeed quite likelythat different subsets of MDSC may be generated in thetumor microenvironment dependent upon the uniqueprofile of factors secreted by the tumor [16,17,20]. Precli-nical models of human tumor-induced MDSC will signif-icantly advance knowledge of their induction andfunction as suppressor cells.In a prior study, we demonstrated that certain
cytokines can induce CD33+ MDSC from normal donorperipheral mononuclear cells [16]. As an extension ofthese studies, we now report the development of a novelin vitro method to induce human MDSC from healthydonor peripheral blood mononuclear cells (PBMC) byco-culture with human solid tumor cell lines. Suppres-sor cells generated by this method demonstrate featuresconsistent with MDSC isolated from cancer patients,including the inhibition of autologous T cell responsesto stimuli [5]. Using this model system, we have deter-mined the frequency of MDSC induction in human can-cers of varied histiologic types, and have elucidated keytumor-derived factors that drive MDSC induction. Ourmethods generated highly purified human MDSC inquantities sufficient to enable robust morphology, phe-notype, gene expression, and functional analyses. Fromthese investigations two major subsets of MDSC havebeen identified that will help elucidate the role of thesecells in the ontogeny, spread, and treatment of cancer.
MethodsCell Lines and Cell CultureTumor cell lines were obtained from the AmericanType Culture Collection (ATCC) or were gifted to theEpstein laboratory. Tumor cell line authenticity wasperformed by cytogenetics and surface marker analysisperformed at ATCC or in our laboratory. All cell lineswere maintained at 37°C in complete medium [(RPMI-1640 with 10% fetal calf serum (characterized FCS,Hyclone, Inc., Logan, UT), 2 mM L-Glutamine, 100U/mL Penicillin, and 100 μg/mL Streptomycin with 10ng/mL hGM-CSF to support viability in co-cultures)],grown in tissue culture flasks in humidified, 5% CO2
incubators, and passaged 2-3 times per week by lighttrypsinization.
Tumor-Associated MDSC Generation Protocoli. InductionHuman PBMC were isolated from healthy volunteerdonors by venipuncture (60 mL total volume), followedby differential density gradient centrifugation (FicollHypaque, Sigma, St. Louis, MO). PBMC were culturedin complete medium (5-10 × 105 cells/mL) in T-25culture flasks with human tumor cell lines for oneweek. Tumor cells were seeded to achieve confluenceby day 7 (approximately 1:100 ratio with PBMC), andsamples in which tumor cells overgrew were excludedfrom analysis and were repeated with adjusted ratios.Alternatively, irradiated tumor cells (3500 rad) wereinitially seeded at a 1:10 ratio in co-cultures to exam-ine whether induction was dependent upon activelydividing tumor cells. PBMC cultured in medium alonewere run in parallel as an induction negative controlfor each donor to control for any effects of FCS. Forthese studies 39 male and 22 female healthy, volunteerdonors ages 23 to 62 were used under USC Institu-tional Review Board-approved protocol HS-06-00579.Data were derived from at least two individuals and nointer-donor differences in MDSC induction or functionwere observed.For antibody neutralization experiments, PBMC-tumor
cell line co-cultures were repeated in the presence orabsence of neutralizing monoclonal antibodies for a sub-set of HNSCC cell lines and included anti-VEGF (Avas-tin, Genetech, San Francisco, CA), anti-TNFa (Humira,Abbott, Abbott Park, IL), anti-IL-1b (clone AB-206-NA,Abcam, Cambridge, MA), anti-IL-6 (clone AB-201-NA,Abcam), anti-GM-CSF (clone BVD2), anti-TGFb (clone1D11), anti-FLT3L (polyclonal, Abcam), or isotypecontrol. For cytokine induction, PBMC were cultured at5-10 × 105 cells/mL in complete medium supplementedwith 10 ng/mL GM-CSF, FLT3L (25 ng/mL, Abcam),and/or TGFb (2 ng/mL, R&D).
Lechner et al. Journal of Translational Medicine 2011, 9:90http://www.translational-medicine.com/content/9/1/90
Page 2 of 20
ii. MDSC IsolationAfter one week, all cells were collected from tumor-PBMC co-cultures. Adherent cells were removed usingthe non-protease cell detachment solution Detachin(GenLantis, San Diego, CA). Myeloid cells were thenisolated from the co-cultures using anti-CD33 or anti-CD11b magnetic microbeads and LS column separation(Miltenyi Biotec, Germany) as per manufacturer’sinstructions. Purity of isolated cell populations wasfound to be greater than 90% by flow cytometry andmorphological examination and viability of isolated cellswas confirmed using trypan blue dye exclusion.iii. Suppression AssayThe suppressive function of tumor-educated myeloidcells was measured by their ability to inhibit the prolif-eration of autologous T cells in the following Suppres-sion Assay: T cells isolated from 30 mL of PBMC fromreturning healthy donors by anti-CD8 microbeads andmagnetic column separation (Miltenyi Biotec) wereCFSE-labeled (3 μM, Sigma) and seeded in 96-wellplates with myeloid cells isolated previously (ii. MDSCisolation, above) at 2 × 10⁵, cells/well 4:1 ratio. T cellproliferation was induce by anti-CD3/CD28 stimulationbeads (Invitrogen, Carlsbad, CA). Suppression Assaywells were analyzed by flow cytometry for T cell prolif-eration after three days and supernatants were analyzedfor IFNg levels by ELISA (R&D Systems). Controlsincluded a positive T cell proliferation control (T cellsalone) and induction negative (medium only) and posi-tive (GM-CSF + IL-6 cytokine-induced MDSC) controls[16]. Where indicated specific inhibitors of MDSC wereadded to suppression assays including all-trans retinoicacid (ATRA, 100 nM, Sigma, St. Louis, MO), sunitinib(0.1 μg/mL, ChemieTek, Indiannapolis, IN), celecoxib(15 μM, Pfizer, New York, NY), nor-NOHA (500 μM,CalBiochem, San Diego, Ca), L-NMMA (500 μM, Cal-biochem), apocynin (0.1 mM, Sigma), 1D11 antibody(10 μg/mL), SB431542 (5 μM, Tocris, Ellisville, MO), orAvastin (10 μg/mL, Genentech, San Francisco, CA).Samples were run in duplicate and data were collectedas percent proliferation for 15,000 cells. Samples wererun on a FACSCalibur flow cytometer (BD Biosciences,San Jose, CA) and data acquisition and analysis wereperformed using CellQuestPro software (BD) at the USCFlow Cytometry core facility.
Characterization of myeloid suppressor cellsi. Morphology of MDSCWright-Giemsa staining (Protocol Hema 3, Fisher,Kalamazoo, MI) of CD33+ or CD11b+ cell cytospin pre-parations was performed to assess the morphology oftumor-educated myeloid cells. Freshly isolated PBMCand CD33+ cultured in medium only or induced bycytokines GM-CSF + IL-6 were prepared in parallel for
comparison. Observation, evaluation, and image acquisi-tion were performed using a Leica DM2500 microscope(Leica Microsystems, http://www.leica-microsystems.com) connected to an automated, digital SPOT RTkecamera and SPOT Advanced Software (SPOT Diagnos-tic Instrument Inc., http://www.diaginc.com). Imageswere resized for publication using Adobe Photoshopsoftware (Adobe, http://www.adobe.com).ii. Flow cytometry analyses of cell phenotypesThe phenotype of in vitro-generated MDSC wasexamined for expression of myeloid, antigen-present-ing, and suppressor cell markers. For staining, cellswere collected from flasks using Detachin to minimizecell surface protein digestion, and washed twice withFACS buffer (2% FCS in PBS) before resuspending 106
cells in 100 μl FACS buffer. Cells were stained for 1hron ice with cocktails of fluorescently-conjugatedmonoclonal antibodies or isotype-matched controls,washed twice with FACS buffer, and resuspended inFACS buffer for analysis. For intracellular staining,cells were fixed and permeabilized using Fixation/Per-meabilization Kit (eBioscience, San Diego, CA) aftersurface staining. Antibodies used were purchasedeither from BD Biosciences: CD11c (B-ly6), CD33(HIM3-4), HLA-DR (L243), CD11b (ICRF44), CD66b(G10F5), CD14 (M5E2), CD68 (Y1/82A), 41BBL(C65-485), OX40L (Ik-1); or eBioscience: CD30 (Ber-H2), CD103 (B-Ly7), GITRL (eBioAITR-L), CD56(MEM-188). Samples were run on a BD FACSCaliburflow cytometer and data acquisition and analysis wereperformed as above. Data are from three uniquedonors and expressed as a fraction of labeled cellswithin a live-cell gate set for 15,000 events. CD33+ orCD11b+ cells from PBMC cultured in medium alonewere run in parallel for comparison.iii. Real-time RT-PCR for gene expression of myeloidsuppressor cells and tumor cell linesFor gene expression studies, tumor-educated CD33+ orCD11b+ cells were isolated from tumor-PBMC co-cultures by fluorescence activated cell sorting afterInduction (i. Induction, above) and RNA was isolatedfrom MDSC and DNase-treated using Qiagen’s RNeasymicro kit. Tumor cells were collected from culture flasksand RNA isolated and DNase-treated using Qiagen’sRNeasy mini kit. For real-time RT-PCR, 100ng ofDNase-treated RNA was amplified with gene specificprimers using one-step Power SYBR green RNA-to-Ctkit (Applied Biosystems) and run in an MX3000P Strate-gene thermocycler (La Jolla, CA). Data were acquiredand analyzed using MxPro software (Stratagene). Geneexpression was normalized to housekeeping geneGAPDH and fold change determined relative to expres-sion levels in medium only-cultured cells. Primersequences were obtained from the NIH qRT-PCR
Lechner et al. Journal of Translational Medicine 2011, 9:90http://www.translational-medicine.com/content/9/1/90
database http://primerdepot.nci.nih.gov and weresynthesized by the USC Microchemical Core Facility[21].iv. Measurement of tumor-derived factors by ELISASupernatants were collected from confluent cell linecultures, passed through a 0.2 μm syringe filter unit toremove cell debris, and stored in aliquots at -20°C.Levels of IL-1b, IL-6, TNFa, VEGF, and GM-CSF insupernatant samples were measured using ELISADuoSet kits (R&D) per manufacturer’s instructions.Plate absorbance was read on an ELX-800 plate reader(Bio-Tek, Winooski, VT) and analyzed using KC Juniorsoftware (Bio-Tek).v. Functional studiesTumor cell line-induced CD33+ or CD11b+ MDSC andmedium only controls were isolated by magnetic beadseparation (Miltenyi Biotec) and used for functionalstudies. Arginase activity was measured in cell lysatesusing Bioassay Systems’ QuantiChrom Arginase AssayKit (Hayward, CA) per the manufacturer instructions.For measurement of ROS production, freshly isolatedmyeloid cells were incubated for 45 minutes in RPMIwith 3 μM DCFDA (Sigma) then analyzed by flow-cytometry. Nitrites were measured in supernatants of cellscultured 5 × 10⁵ cells/mL overnight in complete mediumusing Promega’s Griess Reagent System (Madison, WI)per the manufacturer instructions.vi. ImmunohistochemistryImmunohistochemistry studies were performed by theUSC Department of Pathology Histology Core Facility(Los Angeles, CA) on cytospin preparations of suppres-sive and non-suppressive myeloid cells using antibodiesagainst p-STAT3 (clone 6D779, dilution 1:400), C/EBPb(clone H-7, dilution 1:100) (Santa Cruz Biotech), andHIF1a (clone 241812, dilution 1:50) (R&D Systems).Images were acquired and resized for publication asdescribed above.
Statistical analysisChanges in mean T cell proliferation and mean IFNgproduction in the presence or absence of tumor-edu-cated or cytokine-treated MDSC were tested for statisti-cal significance by one-way ANOVAs followed byDunnett test for pairwise comparisons of experimentalsamples to T cells alone. Changes in mean T cell prolif-eration in suppression assays in the presence or absenceof single inhibitors of suppressive mechanisms wereevaluated by ANOVA followed by Tukey’s test for pair-wise comparisons between all groups. Mean geneexpression of 15 tumor-derived factors between HNSCCcell lines with and without CD33+ MDSC inductioncapacity was compared by ANOVA followed by Tukey’stest for pairwise comparisons. For those factors with sta-tistically significant different mean expression between
suppressor cell inducing and non-inducing cell linegroups, a linear regression analysis was performed toevaluate for a linear correlation between strength ofsuppressor cell induction and gene expression levels.Changes in mean T cell proliferation stimulated in thepresence of suppressive CD33+ or CD11b+ cells inducedby HNSCC or breast and lung carcinoma cell lines,respectively, for neutralization experiments were evalu-ated by ANOVA followed by Tukey’s test for pairwisecomparisons between all groups. Differences in meanexpression of phenotypic markers between pooledgroups of suppressive and non-suppressive CD33+ orCD11b+ cells were tested for significance by ANOVAfollowed by Bonferroni’s multiple comparisons test forselected pairs (CD11b+ MDSC vs. CD11b+ medium con-trol; CD33+ MDSC vs. CD33+ medium control). Differ-ences in mean transcription factor or suppressive geneexpression between CD11b+ and CD33+ MDSC weretested for significance by Student’s t test. Differences inarginase activity, ROS production, and nitrite productionamong MDSC subsets and controls were evaluated byANOVA followed by Bonferroni’s multiple comparisonstest for selected pairs (CD11b+ MDSC vs. CD33+
MDSC; CD11b+ MDSC vs. CD11b+ medium control;CD33+ MDSC vs. CD33+ medium control). Statisticaltests were performed using GraphPad Prism software(La Jolla, CA) with a significance level of 0.05. Graphsand figures were produced using GraphPad Prism,Microsoft Excel, and Adobe Illustrator and Photoshopsoftware (San Jose, CA).
ResultsInduction of tumor-associated humanmyeloid suppressor cellsA protocol for the generation of tumor cell line-edu-cated human MDSC from normal donor PBMC wasdeveloped, as outlined schematically in Figure 1. Briefly,PBMC-tumor cell line co-cultures were established intissue culture flasks for one week. Tumor-educatedmyeloid (CD33+) cells were then isolated, checked forviability, and tested for suppressive function by co-culture with fresh, autologous T cells in the presence ofT cell stimuli. Use of irradiated tumor cells in co-cultures yielded comparable suppressor cell induction,suggesting that tumor cells need not be actively dividingto mediate the observed induction of suppressive func-tion (Table 1). Unfractionated PBMC preparations wereused in evaluating the ability of human solid tumor celllines to generate myeloid suppressor cells to bestapproximate an in vivo setting, but CD33+ suppressorcells were also generated successfully from T cell-depleted PBMC by co-culture with 4-998 osteogenicsarcoma or SCCL-MT1 head and neck squamous cellcarcinoma (HNSCC) cells (Table 1).
Lechner et al. Journal of Translational Medicine 2011, 9:90http://www.translational-medicine.com/content/9/1/90
Strong CD33+ MDSC induction capability bya subset of human tumor cell linesMDSC have been reported in patients with a wide rangeof different types of cancer [21-31] and their accumula-tion appears to correlate with increased tumor burdenand stage [10,30]. However, it remains unclear whetherall cancers induce this tolerizing population, as strongevidence exists to suggest diversity in immune escapemechanisms amongst cancer types and individual tumors[32]. To address this question, one-hundred-one humansolid tumor cell lines were tested for their ability toinduce MDSC in the tumor co-culture assay using PBMCfrom 61 unique healthy, volunteer donors (39 male, 22female) ranging in age from 23-62 (Table 1). CD33+
MDSC could be generated by at least one cell line ofevery human tumor type examined (cervical/endometrial,ovarian, pancreatic, lung, head and neck, renal cell, liver,colorectal, prostate, thyroid, gastric, bladder, sarcoma,and glioblastoma), with the exception of breast carci-noma (Table 1). Head and neck, cervical/ovarian, color-ectal, and renal cell carcinoma cell lines frequently
induced CD33+ MDSC and are good models for furtherstudies of this suppressive population. A range ofsuppressor cell ability appeared to exist within histologictypes for the majority of tumor cell lines examined,suggesting that subclones within a whole tumor maydrive MDSC induction. Notably, myeloid cells fromPBMC cultured in medium alone or co-cultured withfibroblast cell lines were not suppressive (Table 1).
Tumor cell line-induced CD33+ MDSC resemble MDSCfrom cancer patients in suppressive functionand gene expressionA sample of HNSCC cell line-induced CD33+ MDSC(from co-cultures with SCCL-MT1, SCC-4, CAL-27,FaDu, RPMI 2650, or SW 2224) were used to character-ize further the suppressive function and related geneexpression of these in vitro-generated suppressor cells.As shown in Figure 2A, tumor cell line-educated MDSCsuppressed both autologous T cell proliferation andinterferon g with a range of suppressive function seenamongst MDSC samples induced by different HNSCC
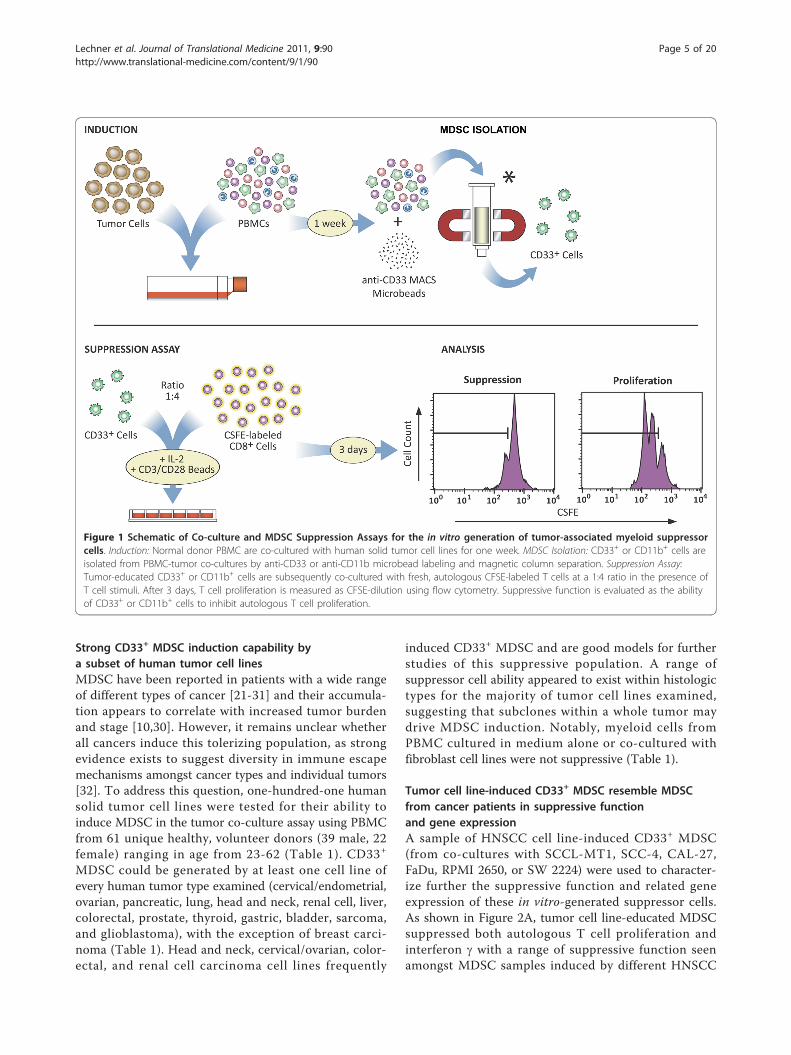
Figure 1 Schematic of Co-culture and MDSC Suppression Assays for the in vitro generation of tumor-associated myeloid suppressorcells. Induction: Normal donor PBMC are co-cultured with human solid tumor cell lines for one week. MDSC Isolation: CD33+ or CD11b+ cells areisolated from PBMC-tumor co-cultures by anti-CD33 or anti-CD11b microbead labeling and magnetic column separation. Suppression Assay:Tumor-educated CD33+ or CD11b+ cells are subsequently co-cultured with fresh, autologous CFSE-labeled T cells at a 1:4 ratio in the presence ofT cell stimuli. After 3 days, T cell proliferation is measured as CFSE-dilution using flow cytometry. Suppressive function is evaluated as the abilityof CD33+ or CD11b+ cells to inhibit autologous T cell proliferation.
Lechner et al. Journal of Translational Medicine 2011, 9:90http://www.translational-medicine.com/content/9/1/90
Page 5 of 20
Table 1 Canonical CD33+ human MDSC induction by human cancer cell lines
Inducing Tumor Cell Line Mean Percent Suppression SEM Inducing Tumor Cell Line Mean Percent Suppression SEM
Controls Cervical/Endometrial (4/5)
T cells alone 0.00 ** HeLa 68.35 5.36
Medium only -2.35 0.86 ** ME-180 75.24 3.83
Lung Fibroblasts -1.03 0.96 ** SIHA 54.49 8.66
Ditt Fibroblasts -0.13 2.91 ** RL95-2 52.11 3.84
** GM-CSF + IL-6 56.30 5.01 SW 756 -83.60 2.18
HNSCC (6/8) Ovarian (6/9)
** SCCL-MT1 91.83 0.82 ** A2780 64.46 5.33
Irradiated 89.18 0.20 ** ES-2 63.62 5.17
T cell Depl. 81.49 4.98 ** TOV-21G 52.86 11.37
** USC-HN21 87.97 ND ** SK-OV-3 51.44 9.81
** SCC-4 65.72 2.08 * NIHOVCAR-3 47.89 1.08
** CAL-27 66.26 6.21 * SW 626 46.54 4.07
** SW 451 59.49 9.59 HOC-7 41.77 19.15
* FaDu 30.98 4.45 HEY 22.20 3.87
RPMI 2650 17.46 5.01 Caov-3 -146.53 2.69
SW 2224 -13.48 11.21 Breast (0/9)
Thyroid (1/2) MCF-7 16.95 0.39
** SW 579 68.97 3.41 734B 16.72 2.32
SW 1949 43.90 13.68 T47D 8.47 1.23
Brain (2/9) BT-474 0.83 11.53
** NU-04 69.41 4.02 SKBR3 -0.09 13.53
** U118MG 51.96 1.48 MDA-MB-468 -3.46 0.25
SW 598 14.29 4.14 GI-101 -6.41 0.92
A172 2.26 4.97 SV-BR-1 -8.00 1.75
IMR-5 -1.23 3.09 MDA231 -16.21 2.60
IMR-32 -3.16 7.48 Bladder (1/3)
TE 671 -12.23 4.29 ** T24 53.89 3.97
Y79 -72.63 5.58 SW 780 8.10 10.01
BM-166 -83.22 0.05 SW 733 -54.63 0.45
Melanoma (1/3) Prostate (2/3)
** A375 56.16 0.64 ** DU 145 54.73 2.07
CaCl74-36 17.26 6.83 * LNCaP 29.09 2.78
Colo 38 15.83 1.49 PC3 15.12 9.09
Sarcomas (4/9) Renal (3/6)
** 4-998 58.31 0.82 ** 786-O 75.91 6.06
Irradiated 52.10 0.44 ** CAKI-1 64.94 3.70
T cell Depl. 65.23 8.17 ** CAKI-2 63.62 5.17
* Rh30 44.63 2.51 SW 156 36.51 10.69
* HOS 42.58 4.86 ACHN 9.85 0.20
* SW 1353 42.22 4.42 SK-NEP-1 0.00 1.82
HT 1080 19.37 5.92 Gastric (1/2)
SA-4 12.53 1.05 ** SW 1961 64.55 3.04
HS 919 3.01 5.31 KATO-III 7.65 2.16
SW 80 -5.00 3.93 Colorectal (5/6)
HS 913T -56.35 1.45 ** SW 732 69.19 1.29
Lung (4/11) ** DLD-1 65.59 3.19
Non-small cell (2/7) ** SW 608 53.11 5.15
* A427 27.71 6.87 ** SW 707 52.38 0.64
* SW 1573 21.47 1.64 * HT-29 38.37 4.91
NCI-H292 8.23 2.89 LS147T 13.62 3.87
Lechner et al. Journal of Translational Medicine 2011, 9:90http://www.translational-medicine.com/content/9/1/90
Page 6 of 20
cell lines. The suppressive capability of HNSCC-inducedMDSC was compared with that of a positive T cell pro-liferation control (T cells alone), an induction negativecontrol (CD33+ cells from medium only cultures), andan induction positive control (CD33+ cells isolated fromPBMC cultured with GM-CSF and IL-6). Of note, whilethe most potent MDSC (SCCL-MT1 and SCC-4-induced) blocked both T cell proliferation and IFNg pro-duction, weaker HNSCC-induced CD33+ suppressorcells preferentially inhibited T cell proliferation (CAL-27or SW 451-induced) or IFNg production (FaDu-induced). These findings suggest that MDSC mayimpede T cell responses through multiple avenues,including inhibition of activation and expansion.Using these and additional tumor cell line-induced
MDSC samples (4-998 osteogenic sarcoma, DU 145prostate carcinoma, CAKI-1 renal cell carcinoma, SK-OV-3 ovarian carcinoma, and SW 608 and SW 732 col-orectal adenocarcinoma cell lines), we analyzed expres-sion of putative MDSC suppression genes incomparison to normal myeloid cells. These MDSC con-sistently showed statistically significant up-regulation ofARG-1, iNOS, NOX2, VEGF, and/or TGFb comparedwith control CD33+ cells from medium-only cultures(Figure 2B). Subtle variations were observed in the geneexpression patterns of these tumor-induced MDSC,which is consistent with the hypothesis that differentMDSC subsets are generated by different tumors depen-dent upon the specific profile of immune factors
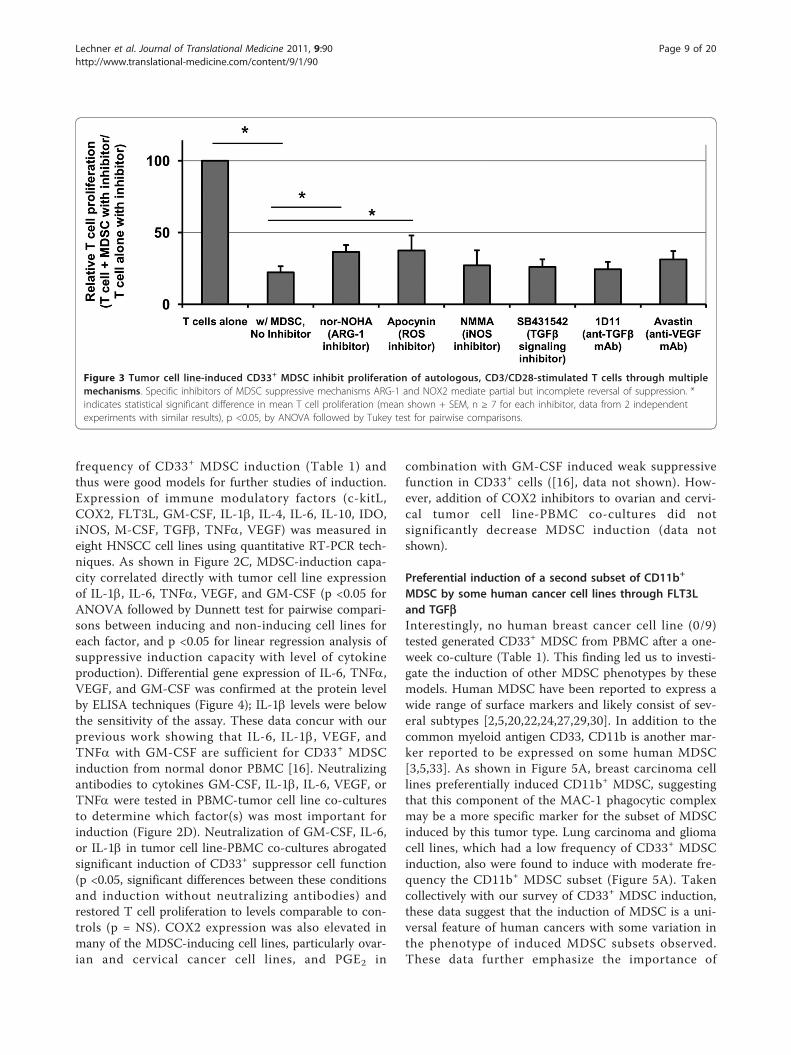
produced by each. To determine the dominant mechan-ism of T cell suppression by this canonical CD33+
MDSC subset, suppression assays were repeated in thepresence or absence of specific inhibitors of ARG-1(nor-NOHA), iNOS (L-NMMA), NOX2 (apocynin),VEGF (neutralizing antibody Avastin), or TGFb1(SB431542 or neutralizing antibody 1D11). In these stu-dies no one inhibitor was found to completely reversesuppression (Figure 3), consistent with the pleotropicactions of MDSC, but inhibitors of ARG-1 and NOX2did produce statistically significant decreases in suppres-sion by CD33+ MDSC. These results were confirmed bysiRNA knockdown of individual suppression genes:ARG-1, iNOS, NCF1 (NOX2 component), TGFb1, orVEGFA (data not shown).
CD33+ MDSC are induced by tumor-derived IL-1b, IL-6,TNFa, VEGF, and GM-CSFPreviously, we compared gene expression of immunemodulatory cytokines for groups of MDSC-inducing andnon-inducing human cancer cell lines [16]. These stu-dies suggested multiple mechanisms of MDSC inductionamongst tumor cell lines, including inflammatory cyto-kines. To reduce background differences in gene expres-sion related to tissue-specific expression patterns, agroup of human HNSCC cell lines consisting of bothMDSC-inducing and non-inducing models was furtherstudied for expression of these putative MDSC inducingfactors. HNSCC tumor cell lines showed a high
Table 1 Canonical CD33+ human MDSC induction by human cancer cell lines (Continued)
NCI-H1650 6.67 4.18 Pancreatic (3/10)
SK-MES-1 4.31 6.03 ** SW 1990 78.15 1.21
NCI-H125 1.54 3.69 * Panc 2.03 22.28 4.37
NCI-H1975 0.28 2.89 * Panc 4.14 21.82 2.60
Small Cell 2/3) Panc 9.6.94 27.28 8.47
** NCI-H464 63.96 6.00 Panc-1 7.82 3.69
* NCI-H60 47.79 7.71 Panc 3.27 6.98 5.44
NCI-HUT 69C -24.28 16.75 ASPC-1 3.09 2.36
Mesothelioma (0/1) CAPAN-1 -1.34 2.27
SW 1503 1.93 2.02 Panc 2.5 -1.79 6.08
Liver (2/5) MIA PaCa-2 -4.38 1.94
* HA 22T 44.01 4.22 Epidermoid (0/1)
* HEP 3B 23.52 7.44 A431 -31.12 8.55
PLC 22.05 5.22
MAH 11.87 4.72
HEP-G2 -2.10 9.40
Forty-five of 101 human solid tumor cell lines induce functionally suppressive CD33+ myeloid suppressor cells from volunteer normal human PBMC after one-week co-culture in vitro. Tumor cell lines inducing CD33+ MDSC with statistically significant suppressive function are indicated by */bold, and those with strongMDSC inducing capacity (mean T cell suppression by CD33+ cells ≥ 50%) are indicated by **. CD33+ cells from PBMC cultured in complete medium alone (non-suppressive control), co-cultured with fibroblast cell lines (induction negative control), and cytokine-induced MDSC (GM-CSF + IL-6, suppressive control) were runin parallel for comparison. Irradiated tumor cell lines and T cell depleted PBMC (italicized) were tested for the ability to induce CD33+ MDSC in someexperiments.
Lechner et al. Journal of Translational Medicine 2011, 9:90http://www.translational-medicine.com/content/9/1/90
Page 7 of 20
Figure 2 Induction and functional characterization of canonical CD33+ MDSC by human tumor cell lines. A, HNSCC-induced MDSC inhibitautologous T cell proliferation and IFNg production. A subset of HNSCC cell lines induces a CD33+ population with suppressive functioncharacteristic of MDSC, including inhibition of autologous T cell proliferation (left) and IFNg secretion (right). Tumor cell lines are grouped bystrength of MDSC induction: strong (black), weak (gray), and non-inducing (white). For both graphs, mean shown (n ≥ 2 donors) +SEM. *indicates statistical significance by ANOVA followed by Dunnett post-test for comparison to T cells alone, p <0.05. B, Human MDSC mediatesuppression through up-regulation of ARG-1, NOX2, iNOS, VEGF, and TGFb. A, Expression of putative suppressive genes ARG-1, iNOS, NOX2-component NCF1, VEGF, and TGFb in a subset of tumor cell line-induced CD33+ MDSC. Mean fold change (n ≥ 2 donors per tumor cell line)+SEM, relative to CD33+ cells cultured in medium alone, are shown. * indicates statistical significance, p <0.05, by ANOVA followed by Dunnetttest for pairwise comparisons to medium only CD33+ controls. C, Heatmap showing expression of immune modulatory cytokines by HNSCC celllines in relation to their ability to induce CD33+ MDSC. MDSC-inducing cell lines produce increased IL-1b, IL-6, TNFa, VEGF, and GM-CSF.Expression of ten putative MDSC-inducing factors was measured in MDSC-inducing (bold) and non-inducing HNSCC cell lines by qRT-PCR.Increased CD33+ MDSC-induction capacity was associated with greater expression of IL-1b, IL-6, TNFa, and VEGF (p <0.05). Mean fold change (n= 2) relative to human reference RNA (gray shading = increased, white = decreased expression), p value shown is for linear regression analysisfor factors having significantly higher gene expression in MDSC-inducing compared with non-inducing human HNSCC cell lines by one-wayANOVA followed by Tukey’s post-test. D, Removal of GM-CSF, IL-6, or IL-1b from co-culture impairs CD33+ MDSC induction by tumor cell lines. Tcell proliferation when co-cultured with CD33+ MDSC from tumor cell line (SCCL-MT1 or USC-HN2) co-cultures with neutralizing antibodies toGM-CSF, IL-6, IL-1b, TNFa, or VEGF. Mean shown (n = 5, four independent experiments), +SEM. * indicates statistical significance, p <0.05.
Lechner et al. Journal of Translational Medicine 2011, 9:90http://www.translational-medicine.com/content/9/1/90
Page 8 of 20
frequency of CD33+ MDSC induction (Table 1) andthus were good models for further studies of induction.Expression of immune modulatory factors (c-kitL,COX2, FLT3L, GM-CSF, IL-1b, IL-4, IL-6, IL-10, IDO,iNOS, M-CSF, TGFb, TNFa, VEGF) was measured ineight HNSCC cell lines using quantitative RT-PCR tech-niques. As shown in Figure 2C, MDSC-induction capa-city correlated directly with tumor cell line expressionof IL-1b, IL-6, TNFa, VEGF, and GM-CSF (p <0.05 forANOVA followed by Dunnett test for pairwise compari-sons between inducing and non-inducing cell lines foreach factor, and p <0.05 for linear regression analysis ofsuppressive induction capacity with level of cytokineproduction). Differential gene expression of IL-6, TNFa,VEGF, and GM-CSF was confirmed at the protein levelby ELISA techniques (Figure 4); IL-1b levels were belowthe sensitivity of the assay. These data concur with ourprevious work showing that IL-6, IL-1b, VEGF, andTNFa with GM-CSF are sufficient for CD33+ MDSCinduction from normal donor PBMC [16]. Neutralizingantibodies to cytokines GM-CSF, IL-1b, IL-6, VEGF, orTNFa were tested in PBMC-tumor cell line co-culturesto determine which factor(s) was most important forinduction (Figure 2D). Neutralization of GM-CSF, IL-6,or IL-1b in tumor cell line-PBMC co-cultures abrogatedsignificant induction of CD33+ suppressor cell function(p <0.05, significant differences between these conditionsand induction without neutralizing antibodies) andrestored T cell proliferation to levels comparable to con-trols (p = NS). COX2 expression was also elevated inmany of the MDSC-inducing cell lines, particularly ovar-ian and cervical cancer cell lines, and PGE2 in
combination with GM-CSF induced weak suppressivefunction in CD33+ cells ([16], data not shown). How-ever, addition of COX2 inhibitors to ovarian and cervi-cal tumor cell line-PBMC co-cultures did notsignificantly decrease MDSC induction (data notshown).
Preferential induction of a second subset of CD11b+
MDSC by some human cancer cell lines through FLT3Land TGFbInterestingly, no human breast cancer cell line (0/9)tested generated CD33+ MDSC from PBMC after a one-week co-culture (Table 1). This finding led us to investi-gate the induction of other MDSC phenotypes by thesemodels. Human MDSC have been reported to express awide range of surface markers and likely consist of sev-eral subtypes [2,5,20,22,24,27,29,30]. In addition to thecommon myeloid antigen CD33, CD11b is another mar-ker reported to be expressed on some human MDSC[3,5,33]. As shown in Figure 5A, breast carcinoma celllines preferentially induced CD11b+ MDSC, suggestingthat this component of the MAC-1 phagocytic complexmay be a more specific marker for the subset of MDSCinduced by this tumor type. Lung carcinoma and gliomacell lines, which had a low frequency of CD33+ MDSCinduction, also were found to induce with moderate fre-quency the CD11b+ MDSC subset (Figure 5A). Takencollectively with our survey of CD33+ MDSC induction,these data suggest that the induction of MDSC is a uni-versal feature of human cancers with some variation inthe phenotype of induced MDSC subsets observed.These data further emphasize the importance of
Figure 3 Tumor cell line-induced CD33+ MDSC inhibit proliferation of autologous, CD3/CD28-stimulated T cells through multiplemechanisms. Specific inhibitors of MDSC suppressive mechanisms ARG-1 and NOX2 mediate partial but incomplete reversal of suppression. *indicates statistical significant difference in mean T cell proliferation (mean shown + SEM, n ≥ 7 for each inhibitor, data from 2 independentexperiments with similar results), p <0.05, by ANOVA followed by Tukey test for pairwise comparisons.
Lechner et al. Journal of Translational Medicine 2011, 9:90http://www.translational-medicine.com/content/9/1/90
Page 9 of 20
functionally defining this heterogeneous population ofsuppressor cells until specific activation-associated mar-kers are identified.Revisiting previously published gene expression data
for this group of breast cancer cell lines, which lackCD33+ MDSC induction, we identified FLT3L andTGFb as differentially expressed candidates for CD11b+
MDSC subset induction from our panel of putativeMDSC-inducing factors [16]. PBMC were then culturedin the presence of FLT3L, TGFb, FLT3L + TGFb, ormedium alone for one week to evaluate whether thesecytokines were sufficient for CD11b+ MDSC induction.Myeloid cells isolated from cytokine-treated culturesshowed significant suppression of autologous T cell pro-liferation (p <0.05, comparison to T cells culturedalone), consistent with MDSC, with the most potentcells generated from combined FLT3L and TGFb
treatment (Figure 5B). These data suggest that FLT3Land TGFb are present and sufficient for CD11b+ MDSCinduction, but technical difficulties in abolishing FLT3L,which is a broad hematopoietic progenitor growth fac-tor, and TGFb, which is ubiquitous in serum and regu-lated by association of a latency protein, precluded clearneutralization data.
Characterization of human CD33+ and CD11b+ suppressorcells induced by tumor cell linesTo characterize better these two MDSC subsets (CD11b+ or CD33+), comparative morphology, phenotype, geneexpression, and functional studies were performed. Themorphology of suppressive tumor-co-cultured CD33+
and CD11b+ populations was compared to that offreshly isolated PBMC and myeloid cells cultured inmedium only by Wright-Giemsa staining (Figure 6A and
Figure 4 MDSC-inducing cell lines produce increased GM-CSF, IL-6, TNFa, and VEGF. Protein secretion of these cytokines by HNSCC celllines was measured in supernatants using ELISA techniques to confirm gene expression findings. Mean protein levels shown (two independentexperiments each run in triplicate), +SEM. Of note, cell line USC-HN2 was recently established and characterized in our laboratory from a thetumor of a patient with recurrent oral cavity squamous cell carcinoma1 and found to be a strong producer of immune modulatory factorsassociated with MDSC induction.
Lechner et al. Journal of Translational Medicine 2011, 9:90http://www.translational-medicine.com/content/9/1/90
Page 10 of 20
data not shown). Healthy donor PBMC showed occa-sional mononuclear cells with pale and scant cytoplasm,scattered amongst predominant lymphocytes (data notshown). CD33+ and CD11b+ cells from PBMC culturedin medium alone (with hGM-CSF for growth support)
for one week were predominantly large, mononuclearcells having abundant basophilic cytoplasm with occa-sional granulocytes (CD33+ only) and other myeloidlineage cells (e.g. eosinophils) (far left and middle rightpanels). In contrast to the mature lineages seen in
Figure 5 Induction of a second CD11b+ MDSC subset by breast, lung, and brain cancer cell lines. A, CD11b+ cells from breast cancer,lung cancer, or glioma cell line-PBMC co-cultures were evaluated for suppressive function against CD3/CD28 stimulated autologous T cells.Mean (n = 2) T cell proliferation + SEM or T cell proliferation (n = 1) is shown from Suppression Assays of CD33+ or CD11b+ cells withautologous T cells, respectively. * indicates statistically significant suppression of T cells by CD11b+ cells from co-culture (p <0.05, ANOVAfollowed by Dunnett’s test for comparison to T cells alone); significance for suppression by CD33+ cells is found in Table 1. Note that sometumor cell lines induce both subsets, while others induce only one subset or neither. CD33+ and CD11b+ cells from medium only cultures werenot suppressive. B, CD11b+ MDSC subset can be induced from normal donor PBMC by cytokines FLT3L and TGFb. Mean shown (n = 3) + SEM. *indicates statistically significant in mean T cell proliferation compared with T cells alone (p <0.05).
Lechner et al. Journal of Translational Medicine 2011, 9:90http://www.translational-medicine.com/content/9/1/90
Page 11 of 20
Figure 6 Morphology, phenotype, and function of CD11b+ and CD33+ MDSC subsets. A, Morphology of human CD33+ and CD11b+ MDSCsubsets isolated after tumor cell line co-culture and normal myeloid counterparts from medium only cultures (Wright-Giemsa staining, x400,original magnification). CD33+ MDSC appear slightly more differentiated than CD11b+ MDSC after induction. Images are representative of datafrom more than five donors and three independent experiments using SCCL-MT1 or USC-HN2 for CD33+ MDSC induction and MCF7 or NCI-H60for CD11b+ MDSC induction. B, Human CD33+ and CD11b+ MDSC are distinct subsets with a common HLA-DRlow Lineage- phenotype.Phenotype of HNSCC cell line-induced CD33+ and breast cancer cell line-induced CD11b+ MDSC compared with medium only, non-suppressiveCD33+ and CD11b+ cells as measured by flow cytometry. Mean percent positive cells (n ≥ 2) + SD shown, data from three unique donors.Differences in percent positive cells analyzed by ANOVA then Bonferroni’s multiple comparison test for selected pairs (* indicates statisticallysignificant difference in mean percent positive between MDSC and medium control for each subset, p <0.05). C, Comparison of ARG-1, iNOS,and NOX2-component NCF1 gene expression in CD33+ and CD11b+ human MDSC revealed similar levels of expression between these subsets.Mean fold change shown relative to medium only controls (n = 3 unique donors for MDSC from co-cultures with each of three inducing tumormodels) + SEM. No statistically significant difference between means as determined by Student’s t test for each gene. D, Elevated arginaseactivity (left) and reactive oxygen species (ROS) production (right) by tumor cell line-induced CD33+ and CD11b+ MDSC. Arginase activity ofCD11b+ and CD33+ MDSC subsets as measured by arginine degradation to urea and compared with normal myeloid cells. Mean shown + SEM;data from four unique donors and two inducing cancer cell lines for each subset. * indicates statistical significance (p <0.05); NS = notsignificant. ROS production by CD11b+ and CD33+ MDSC subsets as measured by DCFDA and compared with normal myeloid cells. Meanfluorescence intensity shown + SEM for 20,000 events collected; data from three unique donors and two inducing cancer cell lines for eachsubset. No significant difference by ANOVA.
Lechner et al. Journal of Translational Medicine 2011, 9:90http://www.translational-medicine.com/content/9/1/90
Page 12 of 20
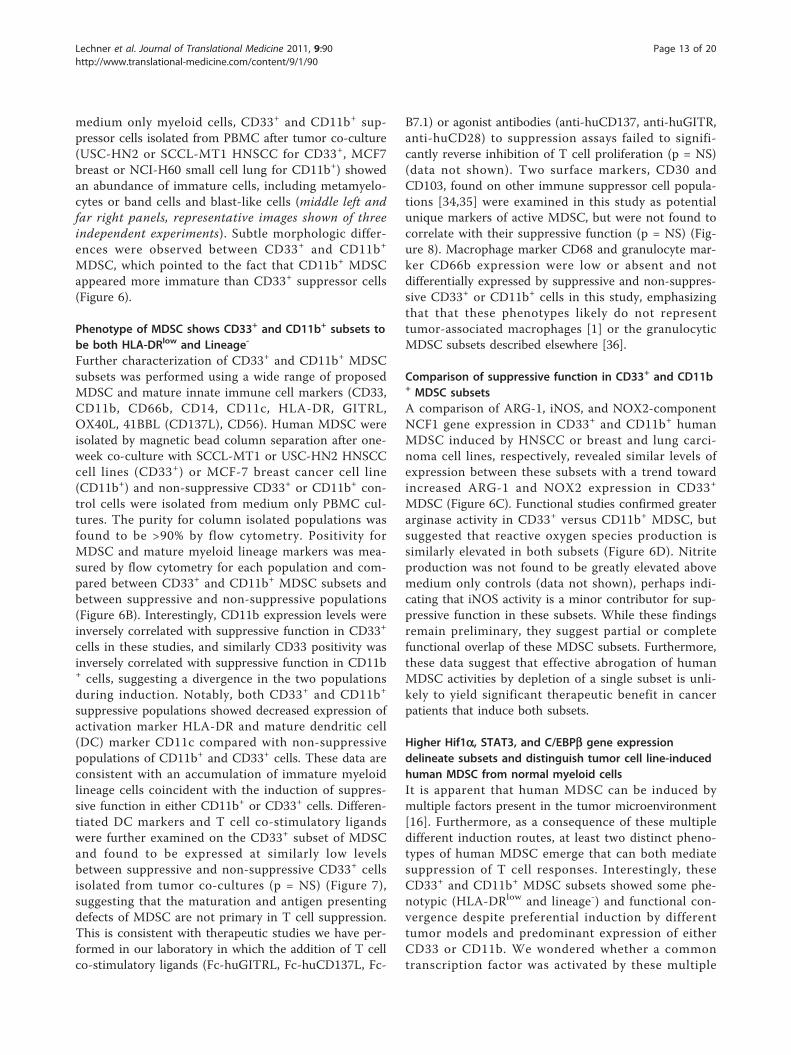
medium only myeloid cells, CD33+ and CD11b+ sup-pressor cells isolated from PBMC after tumor co-culture(USC-HN2 or SCCL-MT1 HNSCC for CD33+, MCF7breast or NCI-H60 small cell lung for CD11b+) showedan abundance of immature cells, including metamyelo-cytes or band cells and blast-like cells (middle left andfar right panels, representative images shown of threeindependent experiments). Subtle morphologic differ-ences were observed between CD33+ and CD11b+
MDSC, which pointed to the fact that CD11b+ MDSCappeared more immature than CD33+ suppressor cells(Figure 6).
Phenotype of MDSC shows CD33+ and CD11b+ subsets tobe both HLA-DRlow and Lineage-
Further characterization of CD33+ and CD11b+ MDSCsubsets was performed using a wide range of proposedMDSC and mature innate immune cell markers (CD33,CD11b, CD66b, CD14, CD11c, HLA-DR, GITRL,OX40L, 41BBL (CD137L), CD56). Human MDSC wereisolated by magnetic bead column separation after one-week co-culture with SCCL-MT1 or USC-HN2 HNSCCcell lines (CD33+) or MCF-7 breast cancer cell line(CD11b+) and non-suppressive CD33+ or CD11b+ con-trol cells were isolated from medium only PBMC cul-tures. The purity for column isolated populations wasfound to be >90% by flow cytometry. Positivity forMDSC and mature myeloid lineage markers was mea-sured by flow cytometry for each population and com-pared between CD33+ and CD11b+ MDSC subsets andbetween suppressive and non-suppressive populations(Figure 6B). Interestingly, CD11b expression levels wereinversely correlated with suppressive function in CD33+
cells in these studies, and similarly CD33 positivity wasinversely correlated with suppressive function in CD11b+ cells, suggesting a divergence in the two populationsduring induction. Notably, both CD33+ and CD11b+
suppressive populations showed decreased expression ofactivation marker HLA-DR and mature dendritic cell(DC) marker CD11c compared with non-suppressivepopulations of CD11b+ and CD33+ cells. These data areconsistent with an accumulation of immature myeloidlineage cells coincident with the induction of suppres-sive function in either CD11b+ or CD33+ cells. Differen-tiated DC markers and T cell co-stimulatory ligandswere further examined on the CD33+ subset of MDSCand found to be expressed at similarly low levelsbetween suppressive and non-suppressive CD33+ cellsisolated from tumor co-cultures (p = NS) (Figure 7),suggesting that the maturation and antigen presentingdefects of MDSC are not primary in T cell suppression.This is consistent with therapeutic studies we have per-formed in our laboratory in which the addition of T cellco-stimulatory ligands (Fc-huGITRL, Fc-huCD137L, Fc-
B7.1) or agonist antibodies (anti-huCD137, anti-huGITR,anti-huCD28) to suppression assays failed to signifi-cantly reverse inhibition of T cell proliferation (p = NS)(data not shown). Two surface markers, CD30 andCD103, found on other immune suppressor cell popula-tions [34,35] were examined in this study as potentialunique markers of active MDSC, but were not found tocorrelate with their suppressive function (p = NS) (Fig-ure 8). Macrophage marker CD68 and granulocyte mar-ker CD66b expression were low or absent and notdifferentially expressed by suppressive and non-suppres-sive CD33+ or CD11b+ cells in this study, emphasizingthat that these phenotypes likely do not representtumor-associated macrophages [1] or the granulocyticMDSC subsets described elsewhere [36].
Comparison of suppressive function in CD33+ and CD11b+ MDSC subsetsA comparison of ARG-1, iNOS, and NOX2-componentNCF1 gene expression in CD33+ and CD11b+ humanMDSC induced by HNSCC or breast and lung carci-noma cell lines, respectively, revealed similar levels ofexpression between these subsets with a trend towardincreased ARG-1 and NOX2 expression in CD33+
MDSC (Figure 6C). Functional studies confirmed greaterarginase activity in CD33+ versus CD11b+ MDSC, butsuggested that reactive oxygen species production issimilarly elevated in both subsets (Figure 6D). Nitriteproduction was not found to be greatly elevated abovemedium only controls (data not shown), perhaps indi-cating that iNOS activity is a minor contributor for sup-pressive function in these subsets. While these findingsremain preliminary, they suggest partial or completefunctional overlap of these MDSC subsets. Furthermore,these data suggest that effective abrogation of humanMDSC activities by depletion of a single subset is unli-kely to yield significant therapeutic benefit in cancerpatients that induce both subsets.
Higher Hif1a, STAT3, and C/EBPb gene expressiondelineate subsets and distinguish tumor cell line-inducedhuman MDSC from normal myeloid cellsIt is apparent that human MDSC can be induced bymultiple factors present in the tumor microenvironment[16]. Furthermore, as a consequence of these multipledifferent induction routes, at least two distinct pheno-types of human MDSC emerge that can both mediatesuppression of T cell responses. Interestingly, theseCD33+ and CD11b+ MDSC subsets showed some phe-notypic (HLA-DRlow and lineage-) and functional con-vergence despite preferential induction by differenttumor models and predominant expression of eitherCD33 or CD11b. We wondered whether a commontranscription factor was activated by these multiple
Lechner et al. Journal of Translational Medicine 2011, 9:90http://www.translational-medicine.com/content/9/1/90
Page 13 of 20
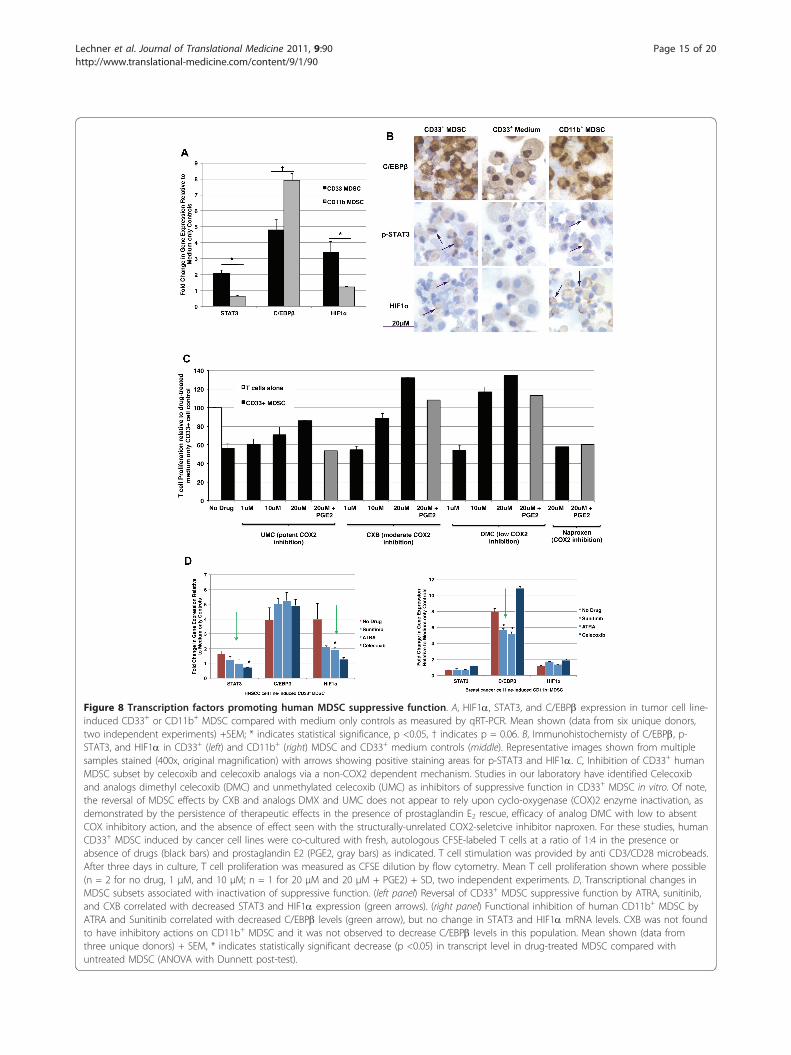
pathways and might be act as a “master switch” to controlboth of these human MDSC. Several transcription factorshave been proposed for control of MDSC, primarilyin mice, including CCAAT-enhancer-binding proteins(C/EBP) b [37], hypoxia inducible factor (HIF) 1a [14],and signal transducer and activator of transcription(STAT) 3 [26,38], STAT5 [38], and STAT6 [2]. Previouslyidentified as transcriptional regulators in some murinetumor-derived MDSC subsets, we now show that thesetranscription factors are elevated in human MDSC and,importantly, are differentially expressed in CD33+ versusCD11b+ MDSC subsets. We examined the expression ofHIF1a, STAT3, and C/EBPb in tumor cell line (SCCL-MT1 or USC-HN2)-induced CD33+ or (MCF7 breast orNCI-H60 small cell lung carcinoma) CD11b+ human sup-pressor cells compared with medium only controls byqRT-PCR techniques (data from six unique donors, twoindependent experiments) (Figure 8A) and immunohisto-chemistry (Figure 8B). Both CD33+ and CD11b+ function-ally active human MDSC showed significant up-regulationof transcription factors STAT3, C/EBPb, and HIF1a com-pared with non-suppressive myeloid cells from mediumonly cultures. However, CD33+ and CD11b+ MDSC sub-sets showed differences in transcriptional changes forthese factors that were suggestive of different induction oractivation pathways. As shown previously, CD33+ orCD11b+ MDSC may be induced under a variety of differ-ent tumor conditions and following incubation with sev-eral distinct cytokine mixtures [16]. CD33+ MDSC showedstronger up-regulation of STAT3 and HIF1a while CD11b+ MDSC showed comparably greater up-regulation of C/EBPb (Figure 8A). Differences in pSTAT3 and C/EBPb
were confirmed by immunohistochemistry studies (Figure8B) and Western blotting techniques (data not shown)and preliminary data are shown for HIF1a protein accu-mulation to support gene expression findings. Treatmentof either CD33+ or CD11b+ tumor-cell line-inducedMDSC with lipopolysaccharide, a known activator ofMDSC function [39], caused further up-regulation ofSTAT3, C/EBPb, and HIF1a concurrent with increasedexpression of ARG-1, iNOS, and NOX2-component NCF1(data not shown). These results further support a role forthese transcription factors in promoting human MDSCsuppressive function. While suppressive abilities in bothCD11b+ and CD33+ subsets correlated with increasedexpression of STAT3, C/EBPb, and HIF1a, the dominanttranscriptional pathway may be different. Indeed, thera-peutic reversal of CD11b+ or CD33+ MDSC-mediated sup-pression corresponded with different transcriptionalchanges.
Inhibitors of MDSC function show differentialactivity on MDSC subsetsAs reviewed by Lechner and Epstein [40], tyrosinekinase inhibitor Sunitinib and all-trans retinoic acid(ATRA) have previously been shown to inhibit MDSC[26,33]. Studies in our laboratory have also identifiedcelecoxib (CXB) and analogs dimethyl celecoxib (DMC)[41] and unmethylated celecoxib (UMC) [41] as inhibi-tors of suppressive function in CD33+, but not CD11b+,MDSC in vitro (Figure 8C). Of note, the reversal ofMDSC effects by CXB and analogs DMX and UMCdoes not appear to rely upon cyclo-oxygenase (COX)2enzyme inactivation, as demonstrated by the persistence
Figure 7 Expanded phenotype of canonical CD33+ human MDSC subset induced by tumor cell lines. Phenotype Expression of antigenpresenting cell (left) and suppressor cell (right) markers on strongly suppressive (induced by HNSCC cell lines SCCL-MT1, SCC-4, CAL-27) versusnon-suppressive (induced by SW 2224, RPMI 2650, or medium only) CD33+ myeloid cells as measured by flow cytometry. Median fluorescenceabove isotype control (data from 3 unique donors; mean shown for all three induction conditions (n = 9) +SEM). * indicates statisticalsignificance, p <0.05, † indicates p = 0.59 for comparisons between suppressive cell and non-suppressive cells mean.
Lechner et al. Journal of Translational Medicine 2011, 9:90http://www.translational-medicine.com/content/9/1/90
Page 14 of 20
Figure 8 Transcription factors promoting human MDSC suppressive function. A, HIF1a, STAT3, and C/EBPb expression in tumor cell line-induced CD33+ or CD11b+ MDSC compared with medium only controls as measured by qRT-PCR. Mean shown (data from six unique donors,two independent experiments) +SEM; * indicates statistical significance, p <0.05, † indicates p = 0.06. B, Immunohistochemisty of C/EBPb, p-STAT3, and HIF1a in CD33+ (left) and CD11b+ (right) MDSC and CD33+ medium controls (middle). Representative images shown from multiplesamples stained (400x, original magnification) with arrows showing positive staining areas for p-STAT3 and HIF1a. C, Inhibition of CD33+ humanMDSC subset by celecoxib and celecoxib analogs via a non-COX2 dependent mechanism. Studies in our laboratory have identified Celecoxiband analogs dimethyl celecoxib (DMC) and unmethylated celecoxib (UMC) as inhibitors of suppressive function in CD33+ MDSC in vitro. Of note,the reversal of MDSC effects by CXB and analogs DMX and UMC does not appear to rely upon cyclo-oxygenase (COX)2 enzyme inactivation, asdemonstrated by the persistence of therapeutic effects in the presence of prostaglandin E2 rescue, efficacy of analog DMC with low to absentCOX inhibitory action, and the absence of effect seen with the structurally-unrelated COX2-seletcive inhibitor naproxen. For these studies, humanCD33+ MDSC induced by cancer cell lines were co-cultured with fresh, autologous CFSE-labeled T cells at a ratio of 1:4 in the presence orabsence of drugs (black bars) and prostaglandin E2 (PGE2, gray bars) as indicated. T cell stimulation was provided by anti CD3/CD28 microbeads.After three days in culture, T cell proliferation was measured as CFSE dilution by flow cytometry. Mean T cell proliferation shown where possible(n = 2 for no drug, 1 μM, and 10 μM; n = 1 for 20 μM and 20 μM + PGE2) + SD, two independent experiments. D, Transcriptional changes inMDSC subsets associated with inactivation of suppressive function. (left panel) Reversal of CD33+ MDSC suppressive function by ATRA, sunitinib,and CXB correlated with decreased STAT3 and HIF1a expression (green arrows). (right panel) Functional inhibition of human CD11b+ MDSC byATRA and Sunitinib correlated with decreased C/EBPb levels (green arrow), but no change in STAT3 and HIF1a mRNA levels. CXB was not foundto have inhibitory actions on CD11b+ MDSC and it was not observed to decrease C/EBPb levels in this population. Mean shown (data fromthree unique donors) + SEM, * indicates statistically significant decrease (p <0.05) in transcript level in drug-treated MDSC compared withuntreated MDSC (ANOVA with Dunnett post-test).
Lechner et al. Journal of Translational Medicine 2011, 9:90http://www.translational-medicine.com/content/9/1/90
Page 15 of 20
of therapeutic effects in the presence of prostaglandin E2rescue, efficacy of analog DMC with low to absent COXinhibitory action, and the absence of effect seen withthe structurally-unrelated COX2-selective inhibitornaproxen (Figure 8C). Gene expression patterns inATRA, Sunitinb, or CXB-treated CD33+ or CD11b+
human MDSC were used to understand better factorspromoting suppressive function in these cells. As shownin Figure 8D, functional inhibition of human CD33+
MDSC by ATRA, Sunitinib, and Celecoxib correlatedwith decreased STAT3 and HIF1a transcription. Incomparison, functional inhibition of human CD11b+
MDSC by ATRA and Sunitinib correlated withdecreased C/EBPb levels, but no change in STAT3 andHIF1a mRNA levels. Celecoxib was not found to haveinhibitory actions on CD11b+ MDSC and it was notobserved to decrease C/EBPb levels in this population.While preliminary, these data suggest that HIF1a,STAT3, and C/EBPb may be key transcription factorsrelated to suppressive function in tumor cell line-induced human MDSC, as was recently demonstratedfor murine MDSC, and warrant further studies at theprotein level as master regulators of suppressive activitywith differential effects of human MDSC subsets.
DiscussionHuman MDSC comprise a diverse and complex groupof suppressive cells that have been poorly characterizedto date. Their accumulation and suppression of T cellresponses in cancer patients, however, are quite clearand remain a barrier to successful cancer immunother-apy. In this study, using a new model for in vitro gen-eration of tumor-associated human MDSC, we describeMDSC induction as a universal feature of human can-cers and identify two distinct subsets of MDSC.Studies to characterize human MDSC have been lim-
ited by the primary accumulation of these suppressorcells in individuals with significant illness (i.e. cancer,sepsis, trauma) and relative absence in healthy indivi-duals [6]. In our laboratory, induction of human MDSCfrom healthy donor PBMC by a one-week co-culturewith select human cancer cell lines has allowed the gen-eration of highly pure populations of MDSC in signifi-cant quantities for characterization studies andfunctional evaluation with autologous donor T cells.Using this induction method, we evaluated over 100human solid tumor cell lines for the ability to inducecanonical CD33+ human MDSC from healthy donorPBMC and found that these suppressor cells could begenerated by tumor cell lines of all histiologic types,with the notable exception of breast carcinomas regard-less of their HER2 and hormone receptor positivity.This finding prompted us to look for the induction of adifferent MDSC subset, and indeed we found that many
tumor models with absent or poor CD33+ MDSC induc-tion preferentially generated CD11b+ MDSC. Taken col-lectively, these data indicate that induction of MDSC isa common feature of human cancers and as such theirpresence may have a role in cancer detection andmonitoring.Using this model system, we then probed the path-
ways of induction and functional characteristics of thesetwo cancer-associated MDSC subsets. Combining ourpreviously published cytokine and gene expression data[16] with new gene expression, cytokine-induction, andantibody neutralization studies presented here, we iden-tified IL-6, IL-1b and GM-CSF as the major inducingfactors of CD33+ MDSC and FLT3L and TGFb as majorcontributors to CD11b+ MDSC induction. Althoughgenerated by different tumor co-culture conditions,these two subsets appear to show at least partial overlapin morphology, phenotype, and function. Comparedwith their normal, non-suppressive myeloid counter-parts, CD33+ and CD11b+ MDSC both showed imma-ture myeloid morphology, low HLA-DR expression, andlacked lineage mature surface markers. MDSC havemultiple mechanisms by which they can suppress T celleffector responses, and both CD33+ and CD11b+ subsetsof MDSC showed up-regulation of canonical suppressivemechanisms (ARG-1, iNOS, NOX2). Previously, wedemonstrated that subtle variations emerged in the pat-terns of suppressive genes that were up-regulated inhuman myeloid suppressor cells by different cytokinemixtures associated with active suppressive function[16]. Similarly, human MDSC induced by a range ofhuman solid tumor cell lines exhibited small differencesin the up-regulation of suppressive genes that likelyresult from subsets within the broadly defined myeloidsuppressor cell population. Of note, some tumor modelswere found to induce both CD33+ and CD11b+ MDSCsubsets, while others induced only one or neither popu-lation. Stratification into CD11b+ and CD33+ subsetsshowed greater arginase activity in the CD33+ subsetand partial overlap of function. These results likelyreflect the complexity of myeloid suppressor cells, andwill require finer dissection in future studies.The multiple pathways for induction and functional
overlap of these MDSC subsets likely reflect a highlyevolved, physiologic mechanism for tempering exuberantimmune responses and preventing autoimmunity that ispathologically co-opted by some tumor cells to escapeimmune destruction. Indeed, inflammatory pathwaysappear to be major drivers of the suppressive functionsin human MDSC induced by tumor cell lines andshould be investigated as means of MDSC generation insepsis and trauma patients where elevations of IL-6,IL-1b, and TNF-a are common and possibly are drivenby the hypoxic environment of these conditions [15,42].
Lechner et al. Journal of Translational Medicine 2011, 9:90http://www.translational-medicine.com/content/9/1/90
Page 16 of 20
Given their pleotropic mechanisms of induction andsuppressive actions, human MDSC will be difficult toinhibit for cancer therapy. A better therapeuticapproach, then, is likely to evolve from inhibition of thetranscription factors promoting the suppressive pheno-type. Here we showed that HIF1a and STAT3 are criti-cal transcription factors in CD33+ human MDSC andC/EBPb in CD11b+ MDSC, respectively, and that effec-tive inhibition of these subsets is accompanied by selec-tive down-regulation of these transcription factors.These data suggest that therapies seeking to inhibithuman MDSC at the level of conversion from normalmyeloid cells will need to target multiple paths of
induction occurring through STAT3, HIF1a, and/or C/EBPb. These studies also highlight a potential means ofhigh-throughput screening for MDSC-targeted therapiesusing the down-regulation of STAT3/HIF1a or C/EBPbas correlates of inhibited suppressor function. Lastlythese studies suggest that CD33+HLA-DRlowHIF1a+ andCD11b+HLA-DRlowC/EBPb+ are highly specific pheno-types that may be used to isolate and study MDSC incancer patients. From this investigation, we are able topropose a model for the induction and function of twokey MDSC subsets generated in the cancer setting(Figure 9A and 9B). This model encompasses a role forinflammatory mediators, tumor-derived cytokines, and
Figure 9 Schematic for the induction of human CD33+ and CD11b+ MDSC in cancer. A, Hypoxia and tumor-derived cytokines IL-1b, IL-6,TNFa, VEGF, FLT3L, and TGFb in the tumor microenvironment promote signaling through STAT3, NF�B/C/EBPb, SMAD2/4, and HIF1a pathwaysin myeloid cells. In addition to oxygen-dependent HIF1a regulation, inflammatory cytokines up-regulate HIF1a transcription (via PI3K or MAPK)and NO stabilizes HIF1a protein (via S-nitrosylation). Other factors influencing MDSC function include PBMC and tumor-derived GM-CSF, whichsupports expansion of myeloid progenitors and survival of MDSC, and IFNg, which contributes to MDSC activation. Transactivation (*) betweenJAK/STAT, HIF1a, and NF�B signaling pathways amplifies the induction effects of tumor-derived cytokines and hypoxia in MDSC. B, Activatedtranscription factors translocate to the nucleus where they up-regulate expression of suppressive genes (iNOS, NOX2, ARG-1, VEGF) and autocrineproduction of putative MDSC inducers (e.g. IL-6, IL-1b, TNFa, and VEGF). The transcription factors driving suppressive function (and by extensionpotential therapeutic targets) in human MDSC appear to vary by subset, with a dominant role for STAT3 and HIF1a in CD33+ MDSC (purple) anda dominant role for NF�B-C/EBPb in CD11b+ MDSC (pink).
Lechner et al. Journal of Translational Medicine 2011, 9:90http://www.translational-medicine.com/content/9/1/90
Page 17 of 20
Figure 10 Novel, minimally-invasive clinical assay for cancer detection and monitoring using MDSC biomarkers. A, Schematic showing anovel, minimally-invasive clinical assay for cancer detection and monitoring. Patient peripheral blood cells are analyzed by routine flowcytometry for the presence of myeloid-derived suppressor cells (MDSC) as a marker for tumor presence. Active MDSC are distinguished fromnormal blood cells by a unique 3-marker phenotype that correlates directly with suppressive function. Accumulation of active MDSC correlatesdirectly with disease stage and tumor burden, allowing physicians to track disease stage, tumor response to therapy, and tumor recurrence orprogression by a simple blood test. B, Preliminary data demonstrating the CD33+ MDSC subset in the peripheral blood of head and neck cancerpatients using a recently identified phenotype: CD33+HLA-DRlowHIF1a+. Ten milliliters of peripheral blood was collected from normal, healthyvolunteers or HNSCC cancer patients under Institutional Review Board-approved studies HS-06-00579 and HS-09-00048. Cells were stained forCD33+ and HLA-DR+ using fluorescence-labeled monoclonal antibodies, then cells were fixed and permeabilized for intracellular staining ofHIF1a by a third antibody. Stained sample PBMC and isotype controls were analyzed on a FACSCalibur flow cytometry using CellQuestProsoftware and collecting 50,000 live leukocyte events. CD33+HLA-DRlowHIF1a+ cells were found to be 15.78-16.23% of myeloid cells in cancerpatients compared with 0.12-1.99% in healthy controls.
Lechner et al. Journal of Translational Medicine 2011, 9:90http://www.translational-medicine.com/content/9/1/90
Page 18 of 20
hypoxia in activating STAT3, SMAD2/4, NF�B, andHIF1 signaling in myeloid cells [15,26,38,43-46]. Signal-ing through and transactivation among these pathwaysyields up-regulation of key suppressive gene productsrelated to MDSC function, as well as activation of auto-crine or paracrine induction pathways to maintain andexpand this population [15,44,45,47-50]. We highlightdifferential expression of STAT3/HIF1 a and C/EBPb inthe CD33+ and CD11b+ subsets, respectively, that mayaid other investigators in therapeutic targeting, subsetexpansion, or MDSC monitoring in cancer patients.
ConclusionsThis study is significant for its broad analysis of humanMDSC generation by a range of different cancer typesrepresented by human tumor cell lines. MDSC generatedby co-culture methods were then characterized for mor-phology, phenotype, gene expression and function. Thesedata and methods provide an important pre-clinical toolfor other investigators to examine other aspects ofhuman MDSC biology and the development of MDSC-directed therapies. Furthermore, from these analyses twosimplified phenotypes were identified that distinguishfunctionally suppressive human MDSC from normalmyeloid cells. One potential use of these MDSC biomar-kers is the detection of human MDSC in cancer patientsas a means to track disease progression and response totherapy. Diaz-Montero and colleagues [30] initially sug-gested that human MDSC levels correlate with diseasestage and preliminary data from an on-going clinicalstudy in our laboratory suggests that MDSC detection inperipheral blood using definitive biomarkers for CD33+
and CD11b+ subsets can distinguish cancer patients fromhealthy individuals (Figure 10). In conclusion, we showMDSC induction to be a universal feature of human solidtumors and present a novel model system for pre-clinicalstudies of this important regulatory cell population.
Note1Russell SM, Lechner MG, Gong L, Megiel C, LiebertzDJ, Masood R, Correa AJ, Han J, Puri JK, Sinha UK,Epstein AL. USC-HN2, a new model cell line for recur-rent oral cavity squamous cell carcinoma, with immu-nosuppressive characteristics. Oral Oncology, in press.
regulatory T cells; (STAT3): Signal transducer and activator of transcription 3;(TGFβ): transforming growth factor beta; (TNFα): tumor necrosis factor alpha;(VEGF): vascular endothelial growth factor-a.
Acknowledgements and FundingThe authors thank Dr. Dixon Gray for flow cytometry support, Lillian Youngfor performing immunohistochemistry studies, Dr. Daniel Liebertz forcreation of the schematic in Figure 1, and Dr. Axel Schonthal for providingcelecoxib analogs. Furthermore, the authors thank Dr. Adi Gadzar (UTSouthwestern Medical Center, Dallas, TX), the Scott and White Clinic(Temple, TX) and Dr. Liz Jaffe (Johns Hopkins Medical Center, Baltimore, MD)for their generous contributions of cell lines used in these studies. This workwas supported by National Institutes of Health Training Grant Award3T32GM067587-07S1, USC Institute for Innovation Ideas EmpoweredProgram, Philanthropic Educational Organization Scholars Award, and CancerTherapeutics Laboratories, Inc. (Los Angeles, CA).
Authors’ contributionsMGL designed the study and wrote the paper. MGL and CM developed themethods, screened the tumor cell lines, and performed phenotype andgene expression studies. SMR, BB, TW, and NA assisted with these studies.ALE contributed to method development, supervised the studies, providedtumor cell line bank and maintained cell lines, and assisted with datainterpretation. All authors reviewed the paper.
Competing interestsA.L.E. is a co-founder and was previously part-owner of Cancer TherapeuticsLaboratories, Inc. (Los Angeles, CA). All other authors declare that they haveno conflicts of interest.
Received: 31 May 2011 Accepted: 9 June 2011 Published: 9 June 2011
References1. Stewart TJ, Smyth MJ: Improving cancer immunotherapy by targeting tumor-
induced immune suppression. Cancer Metastasis Reviews 2011, 30:125-140.2. Peranzoni E, Zilio S, Marigo I, Dolcetti L, Zanovello P, Mandruzzato S,
3. Youn JI, Nagaraj S, Collazo M, Gabrilovich DI: Subsets of myeloid-derivedsuppressor cells in tumor-bearing mice. Journal of Immunology 2008,181:5791-5802.
4. Movahedi K, Guilliams M, Van den Bossche J, Van den Bergh R, Gysemans C,Beschin A, De Baetselier P, Van Ginderachter JA: Identification of discretetumor-induced myeloid-derived suppressor cell subpopulations withdistinct T cell-suppressive activity. Blood 2008, 111:4233-4244.
6. Gabrilovich DI, Nagaraj S: Myeloid-derived suppressor cells as regulatorsof the immune system. Nat Rev Immunol 2009, 9:162-174.
7. Bak SP, Alonso A, Turk MJ, Berwin B: Murine ovarian cancer vascularleukocytes require arginase-1 activity for T cell suppression. Mol Immunol2008, 46:258-268.
8. Nagaraj S, Gabrilovich DI: Tumor escape mechanism governed bymyeloid-derived suppressor cells. Cancer Res 2008, 68:2561-2563.
10. Donkor MK, Lahue E, Hoke TA, Shafer LR, Coskun U, Solheim JC, Gulen D,Bishay J, Talmadge JE: Mammary tumor heterogeneity in the expansionof myeloid-derived suppressor cells. Int Immunopharmacol 2009,9:937-948.
11. Srivastava MK, Sinha P, Clements VK, Rodriguez P, Ostrand-Rosenberg S:Myeloid-derived suppressor cells inhibit T-cell activation by depletingcystine and cysteine. Cancer Res 2010, 70:68-77.
12. Serafini P, Mgebroff S, Noonan K, Borrello I: Myeloid-derived suppressorcells promote cross-tolerance in B cell lymphoma by expandingregulatory T cells. Cancer Res 2008, 68:5439-5449.
13. Dumitriu IE, Dunbar DR, Howie SE, Sethi T, Gregory CD: Human dendriticcells produce TGF-beta 1 under the influence of lung carcinoma cells
Lechner et al. Journal of Translational Medicine 2011, 9:90http://www.translational-medicine.com/content/9/1/90
and prime the differentiation of CD4+CD25+Foxp3+ regulatory T cells. JImmunol 2009, 182:2795-2807.
14. Corzo CA, Condamine T, Lu L, Cotter MJ, Youn JI, Cheng P, Cho HI, Celis E,Quiceno DG, Padhya T, McCaffrey TV, McCaffrey JC, Gabrilovich DI: HIF-1αregulates function and differentiation of myeloid-derived suppressorcells in the tumor microenvironment. J Exp Med 2010, 207:2439-2453.
15. Eltzschig HK, Carmeliet P: Hypoxia and inflammation. New England Journalof Medicine 2011, 364:656-665.
16. Lechner MG, Liebertz DJ, Epstein AL: Characterization of cytokine-inducedmyeloid-derived suppressor cells from normal human peripheral bloodmononuclear cells. J Immunol 2010, 185:2273-2284.
17. Kusmartsev S, Gabrilovich DI: Effect of tumor-derived cytokines andgrowth factors on differentiation and immune suppressive features ofmyeloid cells in cancer. Cancer Metastasis Rev 2006, 25:323-331.
18. Serafini P, Borrello I, Bronte V: Myeloid suppressor cells in cancer:recruitment, phenotype, properties, and mechanisms of immunesuppression. Semin Cancer Biol 2006, 16:53-65.
19. Zhou Z, French DL, Ma G, Eisenstein S, Chen Y, Divino CM, Keller G,Chen SH, Pan PY: Development and function of myeloid-derivedsuppressor cells generated from mouse embryonic and hematopoieticstem cells. Stem Cells 2010, 28:620-632.
20. Poschke I, Mougiakakos D, Hansson J, Masucci GV, Kiessling R: Immatureimmunosuppressive CD14+HLA-DR-/low cells in melanoma patients areStat3hi and overexpress CD80, CD83, and DC-sign. Cancer Res 2010,70:4335-4345.
21. Cui W, Taub DD, Gardner K: qPrimerDepot: a primer database for quantitativereal time PCR. Nucleic Acids Res 2007, 35(Database issue):D805-809.
22. Mandruzzato S, Solito S, Falisi E, Francescato S, Chiarion-Sileni V, Mocellin S,Zanon A, Rossi CR, Nitti D, Bronte V, Zanovello P: IL4Ralpha+ myeloid-derived suppressor cell expansion in cancer patients. J Immunol 2009,182:6562-6568.
23. Filipazzi P, Valenti R, Huber V, Pilla L, Canese P, Iero M, Castelli C, Mariani L,Parmiani G, Rivoltini L: Identification of a new subset of myeloidsuppressor cells in peripheral blood of melanoma patients withmodulation by a granulocyte-macrophage colony-stimulation factor-based antitumor vaccine. J Clin Oncol 2007, 25:2546-2553.
24. Hoechst B, Voigtlaender T, Ormandy L, Gamrekelashvili J, Zhao F,Wedemeyer H, Lehner F, Manns MP, Greten TF, Korangy F: Myeloid derivedsuppressor cells inhibit natural killer cells in patients with hepatocellularcarcinoma via the NKp30 receptor. Hepatology 2009, 50:799-807.
25. Hoechst B, Ormandy LA, Ballmaier M, Lehner F, Krüger C, Manns MP,Greten TF, Korangy F: A new population of myeloid-derived suppressorcells in hepatocellular carcinoma patients induces CD4(+)CD25(+)Foxp3(+) T cells. Gastroenterology 2008, 135:234-243.
26. Liu CY, Wang YM, Wang CL, Feng PH, Ko HW, Liu YH, Wu YC, Chu Y,Chung FT, Kuo CH, Lee KY, Lin SM, Lin HC, Wang CH, Yu CT, Kuo HP:Population alterations of L: -arginase- and inducible nitric oxide synthase-expressed CD11b(+)/CD14 (-)/CD15 (+)/CD33 (+) myeloid-derivedsuppressor cells and CD8 (+) T lymphocytes in patients with advanced-stage non-small cell lung cancer. J Cancer Res Clin Oncol 2009, 136:35-45.
28. Zea AH, Rodriguez PC, Atkins MB, Hernandez C, Signoretti S, Zabaleta J,McDermott D, Quiceno D, Youmans A, O’Neill A, Mier J, Ochoa AC:Arginase-producing myeloid suppressor cells in renal cell carcinomapatients: a mechanism of tumor evasion. Cancer Res 2005, 65:3044-3048.
29. Morse MA, Hall JR, Plate JM: Countering tumor-inducedimmunosuppression during immunotherapy for pancreatic cancer. ExpertOpin Biol Ther 2009, 9:331-339.
30. Gordon IO, Freedman RS: Defective antitumor function of monocyte-derived macrophages from epithelial ovarian cancer patients. Clin CancerRes 2006, 12:1515-1524.
31. Diaz-Montero CM, Salem ML, Nishimura MI, Garrett-Mayer E, Cole DJ,Montero AJ: Increased circulating myeloid-derived suppressor cellscorrelate with clinical cancer stage, metastatic tumor burden, anddoxorubicin-cyclophosphamide chemotherapy. Cancer ImmunolImmunother 2009, 58:49-59.
32. Brimnes MK, Vangsted AJ, Knudsen LM, Gimsing P, Gang AO, Johnsen HE,Svane IM: Increased level of both CD4+FOXP3+ regulatory T cells and
CD14+HLA-DR-/low myeloid-derived suppressor cells and decreasedlevel of dendritic cells in patients with multiple myeloma. Scand JImmunol 2010, 72:540-547.
33. Sadun RE, Sachsman SM, Chen X, Christenson KW, Morris WZ, Hu P,Epstein AL: Immune signatures of murine and human cancers revealunique mechanisms of tumor escape and new targets for cancerimmunotherapy. Clin Cancer Res 2007, 13:4016-4025.
34. Nefedova Y, Fishman M, Sherman S, Wang X, Beg AA, Gabrilovich DI:Mechanism of all-trans retinoic acid effect on tumor-associated myeloid-derived suppressor cells. Cancer Research 2007, 67:11021-11028.
35. de Kleer I, Vercoulen Y, Klein M, Meerding J, Albani S, van der Zee R,Sawitzki B, Hamann A, Kuis W, Prakken B: CD30 discriminates heat shockprotein 60-induced FOXP3+ CD4+ T cells with a regulatory phenotype. JImmunol 2010, 185:2071-2079.
36. del Rio ML, Bernhardt G, Rodriguez-Barbosa JI, Förster R: Development andfunctional specialization of CD103+ dendritic cells. Immunol Rev 2010,234:268-281.
37. Rodriguez PC, Ernstoff MS, Hernandez C, Atkins M, Zabaleta J, Sierra R,Ochoa AC: Arginase I-producing myeloid-derived suppressor cells inrenal cell carcinoma are a subpopulation of activated granulocytes.Cancer Research 2009, 69:1553-1560.
38. Marigo I, Bosio E, Solito S, Mesa C, Fernandez A, Dolcetti L, Ugel S, Sonda N,Bicciato S, Falisi E, Calabrese F, Basso G, Zanovello P, Cozzi E, Mandruzzato S,Bronte V: Tumor-induced tolerance and immune suppression depend onthe C/EBPbeta transcription factor. Immunity 2010, 32:790-802.
39. Ko JS, Rayman P, Ireland J, Swaidani S, Li G, Bunting KD, Rini B, Finke JH,Cohen PA: Direct and differential suppression of myeloid-derivedsuppressor cell subsets by sunitinib is compartmentally constrained.Cancer Res 2010, , 70: 3526-3536.
41. Lechner MG, Epstein AL: A new mechanism for blocking myeloid-derivedsuppressor cells by CpG. Clin Cancer Res 2011, 17:1645-1648.
42. Lin HP: Celecoxib: Its non-COX-2 targets and its anti-cancer effects. PhDThesis Ohio State University, Pharmacy Department; 2005.
43. Adib-Conquy M, Cavaillon JM: Stress molecules in sepsis and systemicinflammatory response syndrome. FEBS Letter 2007, 581:3723-3733.
44. Li F, Sonveaux P, Rabbani ZN, Liu S, Yan B, Huang Q, Vujaskovic Z,Dewhirst MW, Li CY: Regulation of HIF-1α Stability through S-nitrosylation. Mol Cell 2007, 26:63-74.
45. Kaluz S, Van Meir EG: At the crossroads of cancer and inflammation: Rasrewires an HIF-driven IL-1 autocrine loop. J Mol Med 2011, 89:91-94.
46. Peyssonnaux C, Cejudo-Martin P, Doedens A, Zinkernagel AS, Johnson RS,Nizet V: Cutting edge: Essential role of hypoxia inducible factor-1alpha indevelopment of lipopolysaccharide-induced sepsis. J Immunol 2007,178:7516-7519.
47. Semenza GL: Targeting HIF-1 for cancer therapy. Nat Rev Cancer 2003,3:721-732.
48. Matsusaka T, Fujikawa K, Nishio Y, Mukaida N, Matsushima K, Kishimoto T,Akira S: Transcription factors NF-IL6 and NF-kappa B synergisticallyactivate transcription of the inflammatory cytokines, interleukin 6 andinterleukin 8. Proc Natl Acad Sci USA 1993, 90:10193-10197.
49. Rius J, Guma M, Schachtrup C, Akassoglou K, Zinkernagel AS, Nizet V,Johnson RS, Haddad GG, Karin M: NF-kappaB links innate immunity to thehypoxic response through transcriptional regulation of HIF-1alpha.Nature 2008, 453:807-811.
50. Walmsley SR, Chilvers ER, Whyte MK: Hypoxia, hypoxia inducible factorand myeloid cell function. Arthritis Research and Therapy 2009, 11:219-225.
51. Huang WL, Yeh HH, Lin CC, Lai WW, Chang JY, Chang WT, Su WC: Signaltransducer and activator of transcription 3 activation up-regulatesinterleukin-6 autocrine production: a biochemical and genetic study ofestablished cancer cell lines and clinical isolated human cancer cells.Mol Cancer 2010, 9:309.
doi:10.1186/1479-5876-9-90Cite this article as: Lechner et al.: Functional characterization of humanCd33+ And Cd11b+ myeloid-derived suppressor cell subsets inducedfrom peripheral blood mononuclear cells co-cultured with a diverse setof human tumor cell lines. Journal of Translational Medicine 2011 9:90.
Lechner et al. Journal of Translational Medicine 2011, 9:90http://www.translational-medicine.com/content/9/1/90