248
Judicial and Court Statistics 2009 Version 1.1 - revised October 2010

Judicialand Court Statistics 2009
Version 1.1 - revised October 2010

Version 1.1 - Revised October 2010 - revisions to pages 127 and 130.

Contents
Introductory Note 3
Background on the court system in England and Wales 5
Main findings 7
1. County courts (non-family) 13
2. Family matters 43
3. Magistrates’ courts 65
4. The Crown Court 91
5. High Court – Chancery Division 125
6. High Court – Queen’s Bench Division 135
7. Appellate Courts 149
8. The Mental Capacity Act 177
9. Offices of the Supreme Court 189
10. The Judiciary 195
11. Assessment of litigation costs, and publicly funded legal services 207
Annex A: Data quality and sources 219
Glossary 235
Explanatory notes 243
Contacts 244


Judicial and Court Statistics 2009 | Introductory Note
3
Introductory Note
This report presents statistics on judicial and court activity in England and Wales in 2009. It was formally entitled “Judicial Statistics” for the 2005 edition and earlier years, which was published by the Department for Constitutional Affairs and its predecessors.
Report structure
This report provides statistics on activity in the county, family, Crown and magistrates’ courts of England and Wales along with statistics on the work of the High Court, Court of Appeal, UK Supreme Court and some associated offices and agencies, such as the Court of Protection, the Office of the Public Guardian and the Judicial Committee of the Privy Council.
Chapters 1 to 7 each start with a commentary section which includes a brief description of the function, constitution and jurisdiction of the relevant court type, an explanation of some of the procedures involved, and description of the latest statistics and trends. The chapters conclude with statistical tables. Chapter 8 provides summary statistics on casework of the Court of Protection and the Office of the Public Guardian, while Chapter 9 contains casework data relating to the Offices of the Supreme Court. Chapters 10 and 11 deal with the judiciary and assessment of litigation costs and publicly funded legal services, respectively.
The statistics give a summary overview of the volume of cases dealt with by these courts and offices over time, broken down for the main types of case involved. The statistics are used to monitor court workloads, to assist in the development of policy, and their subsequent monitoring and evaluation.
Annex A provides summary information on data sources for the figures given in this report, along with a brief discussion on data quality and highlighting any significant revisions compared to previously published statistics. There is also a Glossary section which provides brief definitions for some of the main terms used in this report.
Information about statistical revisions, forthcoming changes and the symbols and conventions used in the bulletin are given in the Explanatory Notes section.

Judicial and Court Statistics 2009 | Introductory Note
4
Other court statistics published by the Ministry of Justice
Provisional statistics on many aspects of activity in the county, family, Crown and magistrates’ courts of England and Wales in 2009 have already been published by the Ministry of Justice in the statistical bulletin “Court Statistics Quarterly”. The statistics presented in “Judicial and Court Statistics” constitute final figures for 2009, and show more detailed tables than in the quarterly report. Most revisions compared to the figures already published in Court Statistics Quarterly reflect updates to administrative data sources since figures were first compiled. This report is published at the same time as the Q2 (April to June) 2010 edition of Court Statistics Quarterly.
These statistical bulletins are available from the Ministry of Justice website at:
www.justice.gov.uk/publications/judicialandcourtstatistics.htm
www.justice.gov.uk/publications/courtstatisticsquarterly.htm
The Ministry of Justice also publishes three quarterly statistical reports focusing on a particular aspect of court workload in detail, covering statistics on the timeliness of criminal cases in the magistrates’ courts (summary statistics also shown in Chapter 3 of this report), mortgage and landlord possession actions in the county courts, and company winding-up and bankruptcy petitions in the county courts. These bulletins are also available from the Ministry of Justice website at, respectively:
http://www.justice.gov.uk/publications/timeintervals.htm
http://www.justice.gov.uk/publications/mortgatelandlordpossession.htm
http://www.justice.gov.uk/publications/companywindingupandbankruptcy.htm
If you have any feedback, questions or requests for further information about this statistical bulletin, please direct them to the appropriate contact given at the end of this report.
Tribunals’ statistics
Although this report contains statistics on appeals against the decisions of various tribunals’, it does not contain statistics on the work of the Tribunals Service and the Tribunals judiciary. Quarterly statistics on the workload in the Tribunals Service can be found at:
http://www.tribunals.gov.uk/Tribunals/Publications/publications.htm
If you have a specific query regarding statistics for the Tribunals Service, please contact:

Judicial and Court Statistics 2009 | Background on the court system in England and Wales
5
Background on the court system in England and Wales
Virtually all criminal cases in England and Wales start in a magistrates’ court. The less serious offences are handled entirely in magistrates’ courts. More serious offences are passed on to the Crown Court, either for sentencing after the defendant has been found guilty in a magistrates’ court, or for a full trial with a judge and jury. The Crown Court also receives appeals against decisions of the magistrates’ courts.
Cases in the magistrates’ courts are heard by either two or three lay magistrates (local people who volunteer their services, who may not have formal legal qualifications but will have undertaken a training programme to develop the necessary skills) or by one District Judge (legally qualified, paid, full-time professionals, who are usually based in the larger cities and normally hear the more complex or sensitive cases). Crown Court cases may be heard by Circuit Judges, Recorders or a High Court Judge, depending on the seriousness of the offence.
The vast majority of civil cases in England and Wales which do not involve family matters or failure to pay council tax or child maintenance are handled in the county courts. These cases are typically related to debt, the repossession of property, personal injury and insolvency. Once a claim has been served, the usual options for the defendant are to do nothing, pay up, admit the claim and ask for more time to pay up, and/or dispute the claim. The vast majority of claims are either not defended, or settle or are withdrawn before a hearing or trial. Particularly important, complex or substantial cases are dealt with in the High Court.
All family matters in England and Wales are dealt with at Family Proceedings Courts (which are part of the magistrates’ courts), at county courts or in the Family Division of the High Court. Family courts deal with matters such as: parental disputes, local authority intervention to protect children, matrimonial cases such as divorce petitions, the financial provisions for children after divorce or relationship breakdown, domestic violence remedies and adoption.
As noted above, some civil and family cases are generally dealt with in the High Court rather than in a lower court. The High Court’s Chancery Division primarily deals with the resolution of disputes involving property (e.g. land, business, and intellectual property), taxation, mortgages, insolvency, and others. The High Court’s Queen’s Bench Division deals mainly with civil actions in contract and tort (civil wrongs), and also deals with more specialist matters such as

Judicial and Court Statistics 2009 | Background on the court system in England and Wales
6
applications for judicial reviews. As well as dealing with such cases outright, the High Court also hears appeals involving such matters where they were originally heard in the county and magistrates’ courts. Most proceedings in the High Court are heard by a single judge, but certain kinds of proceedings may be heard by two or more judges. On rare occasions cases may have a jury.
The Court of Appeal of England and Wales is the second most senior court in the country. The Court of Appeal’s Criminal Division hears appeals concerning criminal matters originally dealt with at the Crown Court, while the Civil Division hears appeals concerning cases heard at the county courts and High Court (and also from tribunals). Permission to appeal is required, either from the lower court or the Court of Appeal itself. The judges of the Court of Appeal are the Lord Chief Justice, the Master of the Rolls and 37 Lords Justices.
The United Kingdom Supreme Court was created in October 2009 and replaced the House of Lords as the highest court in the United Kingdom. Decisions made by the Court of Appeal may be further appealed to the Supreme Court (in some civil matters dealt with at the High Court an appeal may be made directly to the Supreme Court). The Supreme Court hears appeals on arguable points of law of the greatest public importance, bearing in mind that the cases will have already been the subject of judicial decision in a lower court. It hears appeals for the whole of the United Kingdom in civil cases, and for England, Wales and Northern Ireland in criminal cases. Additionally, it hears cases on devolution matters. There are 12 Justices of the Supreme Court in total; cases are typically heard by a panel of three to nine of the Justices.
The Judicial Committee of the Privy Council is the final Court of Appeal for 23 Commonwealth territories and four independent republics within the Commonwealth. It also hears appeals from the Channel Islands and the Isle of Man, and appeals within the UK relating to a small number of matters such as veterinary work and pastoral schemes.

Judicial and Court Statistics 2009 | Main findings
7
Main findings
The statistics presented in this report are primarily used to monitor the type and volume of cases that are received and processed through the court system of England and Wales.
County courts (non-family)
The civil cases dealt with by the county courts (excluding family cases) typically relate to debt, the repossession of property, personal injury and insolvency. Since 2006, the total number of claims issued has generally followed a downward trend, while the number of defences made, hearings and trials have remained relatively flat.
Key points for 2009
Some 1,879,000 civil (non-family) cases started in 2009, a fall of nine per •cent compared to 2008, continuing the general downward trend seen since 2006.
The fall in 2009, compared to 2008, was mainly due to decreases in specified •money claims (typically related to debt issues) and repossession claims, and was despite an increase in the number of unspecified money claims (typically related to personal injury) and insolvency petitions. The fall in repossession claims (230,000 in 2009, compared to 291,000 in the previous year) coincides with the introduction of the Mortgage Pre-Action Protocol, which gives clear guidance on what the courts expect lenders and borrowers to have done prior to a claim being issued. It encourages more pre-action contact between lender and borrower and as such enables more efficient use of the court’s time and resources.
There were 316,000 defences made in 2009; this is a six per cent increase on •the previous year, and continues the longer term general upward trend seen over the last decade.
Defended cases which are not settled or withdrawn generally result in a •hearing or trial. In total there were 67,000 trials and small claims hearings in 2009, continuing the slight upward trend seen in recent years. On average small claim hearings occurred 31 weeks after the claim was originally made, a 2-4 week increase on recent years. Trials took place an average 48 weeks after the claim was originally made, the same as in the previous year although remaining on a general downward trend.
There were 585,000 applications for enforcements in 2009 (of which 379,000 •were warrants, the remainder being other forms of enforcement orders, such as attachment of earnings orders which oblige the debtor’s employer to

Judicial and Court Statistics 2009 | Main findings
8
deduct a set sum from the debtor’s pay and forward it to the court), a 17 per cent decrease on 2008 which followed a steadily increasing trend over the previous few years. This fall compared to 2008 reflects the 10 per cent drop in claims issued for a specified amount of money and large increases in court fees for enforcement applications commencing on 13 July 2009.
In 2009 some 63,000 repossessions of property by county court bailiffs •occurred, a fall of 11 per cent on the previous year. This coincides with the fall in the number of mortgage and landlord possession claims in 2009.
Family matters
Family cases deal with issues such as parental disputes, child protection cases, divorce and separation, and cases of domestic violence. In 2009, there was an overall increase in the number of applications made in relation to matters affecting children. The number of orders made in relation to divorce / separation and domestic violence has fallen in recent years.
Key points for 2009
Some 25,810 public law applications (applications for various court orders •relating to the protection of children, which are brought by local authorities or the National Society for the Prevention of Cruelty to Children) and 137,480 private law applications (applications for court orders which are brought by private individuals) were made in 2009, which were increases of 31 per cent and 14 per cent respectively on the previous year. Public law applications had been on a shallow downward trend in the previous four years.
21,000 public law applications were dealt with in 2009, in that an order was •either made or refused or the application was withdrawn. Some of these will relate to applications initially received during the year, and some which were initially received in a previous year. Some 155,500 private law applications were dealt with during 2009.
There were 132,100 petitions for the dissolution of marriage were filed in •2009, an increase of three per cent compared to 2008 and a reversal of the recent downward trend seen since 2005. Some 116,600 decrees absolute were granted in 2009, a fall of five per cent on the previous year and continuing the downward trend seen in recent years.
Around 24,900 domestic violence orders were made in 2009. This was a two •per cent increase on the number in 2008, although the number of domestic violence orders had been on a downward trend years prior to 2009.

9
Judicial and Court Statistics 2009 | Main findings
9
Magistrates’ Courts
Nearly all criminal court cases start in a magistrates’ court; less serious offences will be dealt with by the court, while more serious offences are passed on to the Crown Court.
Key points for 2009
An estimated 1.79 million defendants were proceeded against in criminal •cases in the magistrates’ courts in 2009 (excluding breaches), a fall compared to the 1.92 million defendants in the previous year. (These figures are not directly comparable with those prior to 2008 as a different data source has been used.)
180,000 trials were recorded in the magistrates’ courts in 2009 (excluding •breaches), fewer than the 184,000 in 2008, although the number of trials has generally remained flat in the last few years. Of those trials, 43 per cent were recorded as ‘effective’ (commenced on the scheduled date and reach a conclusion), 38 per cent were recorded as ‘cracked’ (an acceptable plea was offered by the defendant or the prosecution offered no evidence), and 19 per cent were recorded as ‘ineffective’ (did not commence as scheduled and required re-listing). Rates of cracked and ineffective trials have remained unchanged over the last three or four years.
For defendants in criminal cases, the estimated average time between the •date an offence was committed and the date a case was dealt with by a magistrates’ court in 2009 was 141 days. This average duration is slightly lower in 2008 and 2009 than in the preceding few years. The timeliness statistics are sourced from the quarterly Time Intervals Survey, more detailed results of which are published by the Ministry of Justice in a separate statistical report which can be found on the department’s website at http://www.justice.gov.uk/publications/timeintervals.htm
Fines are the most commonly used sentence in magistrates’ courts. The total •amount of fines paid in England and Wales in 2009 was £251m, a figure similar to the previous couple of years.

Judicial and Court Statistics 2009 | Main findings
10
Crown Court
The Crown Court is formally a single court which sits in approximately 77 different locations across England and Wales. It deals with criminal cases that are too serious to be dealt with in full by the magistrates’ courts. Some such cases can only be heard at the Crown Court because of their seriousness (“sent for trial” cases); in other instances cases could be heard at either a magistrates’ court or the Crown Court, but either magistrates have decided that the circumstances of the case are sufficiently serious that it should be heard in the higher Crown Court, or the defendant has elected to be tried at the Crown Court (“committed for trial” cases).
The Crown Court also deals with cases “committed for sentence” – those transferred for sentencing after a defendant has been found guilty in a magistrates’ court, when a magistrate believes their sentencing powers are insufficient to apply an appropriate sanction – or the defendant appeals against the decision of a magistrates’ court.
Key points for 2009
There were 150,700 cases (of all the above types) received by the Crown •Court in 2009. This was three per cent more than in 2008 and continues an upward trend seen in recent years. In particular, the number of “committed for trial” cases received by the Crown Court has been increasing (a total of 62,800 in 2009, which was 14 per cent more than in 2008).
147,200 cases were dealt with by the Crown Court in 2009. This figure has •been increasing in recent years, reflecting the increase in the number of cases referred to the Crown Court. Since more cases were received in 2009 than were dealt with during the year, the backlog of cases outstanding as at the end of the year (47,700) increased compared to as at the end of 2008 (44,500), continuing an upward trend.
Approximately 39,300 cases were listed for trial in the Crown Court in 2009, •compared to 36,000 in the previous year. Of these, 46 per cent were recorded as ‘effective’, 13 per cent were ‘ineffective’ and 42 per cent were ‘cracked’. As with the magistrates’ courts, rates of cracked and ineffective trials at the Crown Court have generally remained consistent over the last two or three years.
Of those defendants who entered a plea (in cases committed or sent for •trial), 71 per cent pleaded guilty, with the other 29 per cent pleading not guilty. The proportion of guilty pleas entered has been increasing in recent years (for example, 63 per cent pleaded guilty in 2005).
The “average waiting time” refers to the average time between the date of •sending or committal to the Crown Court and the start of the substantive Crown Court hearing. In 2009, the average waiting time for defendants committed for trial was 13.5 weeks (the same as in the previous year), while the corresponding figure for defendants sent for trial was 18.6 weeks (again

Judicial and Court Statistics 2009 | Main findings
11
the same as in 2008). Generally, the average waiting time was lower for those defendants held in custody than for those defendants on bail, and lower for those defendants who pleaded guilty than those who pleaded not guilty.
High Court - Chancery and Queen’s Bench Divisions
In England and Wales civil justice is administered mainly by the High Court and county courts, with the High Court handling the more substantial and complex cases relating to such matters. The Chancery Division and Queen’s Bench Division are the parts of the High Court which deal with such cases, except for those which concern family matters which are dealt with by the Family Division and are including within the Family matters (see page 8).
Key points for 2009
In 2009, 49,500 proceedings were started in the High Court’s Chancery •Division, down from 51,900 in 2008. This is the first annual fall in proceedings started since 2005, and until 2008 there had been an upward trend.
Of these 49,500 proceedings, 16,300 were proceedings in the Companies •Court, a fall of 20 per cent compared to the previous year. In recent years, the number of Companies Court proceedings saw a fluctuating trend between about 15,000 and 23,000 per year.
The 2009 total also includes 26,100 applications filed in the Bankruptcy •Court in 2009, an increase of 18 per cent compared to the previous year (22,200), and continuing an upward trend seen in recent years.
In the High Court’s Queen’s Bench Division, there were some 18,600 •proceedings started in 2009, continuing a flat trend seen in the last few years.
5,700 of these claims were issued by the Royal Courts of Justice (RCJ) in •London, while the remaining 12,900 were issued by District Registries of the High Court. Some 3,500 (62 per cent) of the RCJ claims were for an unspecified amount of money, and 1,300 (22 per cent) were for amounts in excess of £50,000.
In the Admiralty Court, the total number of claims issued in 2009 more than •doubled to 230 from approximately 110 in 2008 (and a similar level in previous years). This included increases in most categories of case.
In the Technology and Construction Court, the number of cases received •increased from 366 in 2008 to 528 in 2009. Prior to 2009, the number of such actions had followed a fluctuating but generally flat trend.

Judicial and Court Statistics 2009 | Main findings
12
Appellate Courts
The Court of Appeal of England and Wales is the second most senior court in the country. The Court of Appeal’s Criminal Division hears appeals concerning criminal matters originally dealt with at the Crown Court, while the Civil Division hears appeals concerning cases heard at the county courts and High Court.
In October 2009 the Supreme Court replaced the Appellate Committee of the House of Lords as the highest court in the UK. Decisions made by the Court of Appeal may be further appealed to the Supreme Court (in some civil matters dealt with at the High Court an appeal may be made directly to the Supreme Court). The Supreme Court hears appeals on arguable points of law of the greatest public importance.
Key points for 2009
In 2009, 188 petitions for leave to appeal were presented to the House of •Lords or the Supreme Court, while 173 such petitions were disposed of. These are falls compared to the 207 petitions for leave to appeal presented and 207 disposed of in 2008, prior to the creation of the Supreme Court and when such matters were handled by the House of Lords throughout the entire period. As in previous years, the vast majority were brought from the Civil Division of the Court of Appeal in England and Wales. 69 of these disposals in 2009 were by the Supreme Court.
Some 64 appeals were disposed of during 2009 by the House of Lords or •Supreme Court, compared with 96 in the previous year. Seven of these were disposed of by the Supreme Court.
Approximately 7,200 applications for leave to appeal were received by the •Criminal Division of the Court of Appeal, a similar number to the previous year and continuing a flat trend. There were 1,200 appeals filed with the Civil Division of the Court of Appeal, the same number as in 2008.

County courts (non-family)
Chapter 1

Judicial and Court Statistics 2009 | Chapter 1
14
Chapter 1: County courts (civil non-family)
There are currently 216 county courts in England and Wales. These deal with the vast majority of civil cases (as opposed to criminal cases) which do not involve family matters or failure to pay council tax or child maintenance. All county courts have jurisdiction to deal with contract and tort cases (those relating to civil wrongs) and recovery of land actions. These cases are typically related to debt (generally issued for a specified amount of money), the repossession of property and personal injury (generally issued for an unspecified amount of money). In addition, some county courts deal with bankruptcy and insolvency matters, equity and contested probate actions (where the value of the trust, fund or estate does not exceed £30,000), matters under the Race Relations Act 1976, and actions which all parties agree to have heard in a county court (e.g. defamation cases). Generally, only the most complex, substantial or important cases are dealt with by the High Court.
All county courts are assigned at least one District Judge and some, at least one Circuit Judge. From 6 April 2009, Circuit Judges have generally only heard cases worth over £25,0001 or involving greater importance or complexity. District Judges hear many of the cases worth over £5,000 but generally not over £25,000. In addition to hearing other cases, District Judges generally case manage proceedings, deal with repossession matters, and make contested and uncontested assessments of damages.
Information on the data sources used for the county court statistics can be found in Annex A. Explanations for some of the main terms used in this section can be found in the Glossary. The tables of detailed data can be found immediately following this section of commentary.
Figures for 2005-2008 representing the number of repossessions of properties by bailiffs have been revised from previously published statistics and now include repossession actions recorded by county courts other than at which the warrants for possession were issued.
1 The lower (claim value) limit of the multi track, whose claims are generally heard by a Circuit Judge, was increased from £15,000.01 to £25,000.01 with effect from 6 April 2009.

Judicial and Court Statistics 2009 | Chapter 1
15
Key findings for 2009
There was a nine per cent fall in 2009, compared to 2008, in civil (non- •family) cases commencing in the county courts. Within the total of 1,879,000 cases started in 2009:
1,281,000 were “money” claims for a specified amount, a decrease of 10 •per cent from 2008. 38 per cent of these claims had a claim value of up to £500, down from 41 per cent in 2008.
179,000 were “money” claims for unspecified amounts, an increase of 12 •per cent compared with 2008.
94,000 were mortgage repossession claims, a decrease of 34 per cent •from 2008, with the fall coinciding with the introduction of the Mortgage Pre-Action Protocol, which gives clear guidance on what the courts expect lenders and borrowers to have done prior to a claim being issued. A further 137,000 were landlord repossession claims, a decrease of eight per cent compared with 2008.
76,000 were insolvency petitions, a rise of eight per cent compared with •2008.
In 2009, there were six per cent more defences of civil cases in the county •courts and 10 per cent more allocations to track than in 2008.
In 2009, there were 20,000 trials, a two per cent rise on 2008, and 47,000 •small claim hearings, a one per cent increase on 2008. Trials took place on average 48 weeks following issue, the same as in 2008, while small claim hearings took place 31 weeks following issue, up from 29 weeks in 2008.
There were 585,000 applications for enforcements in 2009, a 17 per cent •decrease on 2008, with a decline in every type of enforcement.
In 2009 some 63,000 properties were repossessed by county court bailiffs, a •decrease of 11 per cent from 2008. 32,000 properties related to mortgage repossession cases, nine per cent fewer than in 2008.

Judicial and Court Statistics 2009 | Chapter 1
16
Commencing a case
Historically, the normal method of taking someone to court regarding a civil matter is for the person doing so (the claimant) to complete a claim form and take it into a county court. However, the creation of electronic services has meant that claims for a specified amount of money (where the claim is for a set amount of money) or repossession of property can be completed via the internet. Money Claim Online (www.moneyclaim.gov.uk) was launched in February 2002 and issues claims in the name of Northampton County Court. Possession Claim Online (www.possessionclaim.gov.uk) was launched in October 2006 and issues claims in the name of the court relating to the postcode of the property. With both, the claimant can pay the court fee by credit or debit card. In addition, for Possession Claim Online, large issuers can pay by direct debit.
These services remove time consuming and repetitive administrative work from the court, reducing the cost of litigation and freeing up resources to do other work.
Claimants who issue a large number of claims for a specified amount of money each year (e.g. banks, credit card and store card issuers, utilities and solicitors specialising in debt recovery), can do so by filing them in a computer readable form to the Claim Production Centre (CPC). The CPC, set up in January 1990, guarantees issue and dispatch of claims within 24-48 hours. Most of the work of the CPC is done by the County Court Bulk Centre, a central processing unit attached to Northampton County Court which was set up in March 1992.
In total, there were 1,879,000 civil (non-family) proceedings started in 2009, a decrease of nine per cent compared to 2008. This comprised the following types of cases:
1,281,000 “money” claims with specified claim amounts, a decrease of 10 •per cent compared with 2008 continuing a downward trend after peaking in 2006. 53 per cent of these claims were issued through the County Court Bulk Centre and 12 per cent through Money Claim Online. Overall, 38 per cent had a value of up to £500 compared with 41 per cent in 2008 and 53 per cent in 2005. Just 14 per cent had a value over £5,000 compared to 15 per cent in 2008 and 11 per cent in 2005.
179, 000 “money” claims with unspecified claim amounts, an increase of 12 •per cent compared with 2008 and of 24 per cent compared with 2007. In 2009, 49 per cent of these had a value of over £1,000 and up to £5,000, 30 per cent a value over £5,000 and up to £15,000, and 14 per cent a value of over £15,000.
94,000 mortgage repossession claims, a decrease of 34 per cent compared •with 2008 following a 24 per cent increase between 2005 and 2008. The fall in these claims since the end of 2008 coincides with the introduction of the Mortgage Pre-Action Protocol, which gives clear guidance on what the courts expect lenders and borrowers to have done prior to a claim being issued. It

Judicial and Court Statistics 2009 | Chapter 1
17
encourages more pre-action contact between lender and borrower and as such enables more efficient use of the court’s time and resources.
98,000 social landlord repossession claims, a decrease of six per cent •compared with 2008 and of 22 per cent since 2005.
38,000 private landlord repossession claims (including accelerated procedure •claims), 13 per cent fewer than in 2008 after increasing in each year from 2005.
76,000 insolvency petitions, eight per cent more than in 2008 and 47 per •cent more than in 2005. This large increase has been driven by rises in bankruptcy petitions made by debtors, which have risen by 13 per cent compared with 2008 and 73 per cent compared with 2005.
113,000 non-”money” claims including those for return of goods but •excluding those for mortgage and landlord repossession, five per cent lower than in 2008.
Claims issued by type of case, 2001-2009
0
500
1,000
1,500
2,000
2,500
2001 2002 2003 2004 2005 2006 2007 2008 2009
Number of claims/petitions(in thousands)
Specified "money" claims Unspecified "money" claims Claims for recovery of land
Other claimsInsolvency
Claim issue statistics are shown in Tables 1.1 to 1.9

Judicial and Court Statistics 2009 | Chapter 1
18
Case Progression
Whether the claim is issued online or through the county courts, the usual procedure is for a copy of the claim form and a response pack to be sent to (served on) the defendant who has 14 days to respond to the claim. The defendant can do nothing, pay up (either the full amount of the claim or in part), admit the claim and ask for more time to pay up (in full or part), and/or dispute (defend) the claim (in full or part). In 2009, 316,000 defences were made, a six per cent increase compared with 2008 and a 15 per cent increase compared with 2005.
If the claim is defended, the usual procedure is for further information to be provided by the parties, following which the case is allocated by a judge to one of three case management tracks. In total, there were 180,000 allocations to track in 2009, a 10 per cent increase compared with 2008 and a 17 per cent increase compared with 2005. This was made up of, in ascending order of case complexity and degree of judicial involvement:
93,000 allocations to the small claim track, an increase of 11 per cent •compared to 2008 and of 25 per cent compared with 2005. This track is generally for cases with a claim value of up to £5000 which do not require substantial pre-hearing preparation. The hearings are designed to be accessible to litigants in person (i.e. without representation by a solicitor or counsel), and are dealt with in about an hour.
61,000 allocations to the fast track, 15 per cent more than in 2008 and 21 •per cent more than in 2005. These large increases reflect the rise in the fast track upper (claim value) limit from £15,000 to £25,000 for all proceedings issued on or after 6 April 2009. The fast track is generally for cases with a claim value of greater than £5,000 and not more than this upper limit, with issues not complex enough to merit more than a one day trial.
25,000 allocations to the multi track, a decrease of five per cent compared to •2008 and a decrease of nine per cent compared to 2005. This track is generally for cases with a claim value exceeding the fast track upper limit with issues complex enough to merit preliminary hearings. They generally last more than one day at trial.
Around 37 per cent of cases allocated to track reached a trial or small claim hearing in 2009, with most settling or being withdrawn. In total, there were 67,000 trials and small claim hearings, one per cent more than in 2008 and four per cent more than in 2005. This comprised:
20,000 fast and multi track trials, two per cent more than in 2008 and 21 •per cent more than in 2005. In 2009, more than two thirds (72 per cent) of these related to unspecified “money” cases. On average, trials occurred 48 weeks following issue, the same as in 2008 and down from 52 weeks in 2005. They lasted three hours and 49 minutes on average in 2009, similar to the three hours and 45 minutes in 2008 and three hours and 40 minutes in 2005.

Judicial and Court Statistics 2009 | Chapter 1
19
47,000 small claim hearings, one per cent more than in 2008 and two per cent •fewer than in 2005. The vast majority (96 per cent) of these related to specified “money” cases. On average, small claim hearings occurred 31 weeks following issue, up from 29 weeks in 2008 and 27 weeks in 2005. They lasted 77 minutes on average, the same as in 2008 and similar to the 76 minutes in 2005.
Hearings and trials by type, 2001-2009
0
10
20
30
40
50
60
70
2001 2002 2003 2004 2005 2006 2007 2008 2009
Number of hearings (in thousands)
Trials (fast and multi track) Small claims hearings
Case progression statistics are shown in Tables 1.10 to 1.14.
Judgments
There are many types of County Court Judgments. In specified “money” cases the majority follow either no response from the defendant within the allotted time period (a default judgment) or the claimant accepting the defendant’s offer to pay all or part of the amount owed (a judgment by acceptance or determination). These judgments are entered as an administrative function and generally don’t involve a judge. Overall, 937,000 judgments by default, acceptance and determination were made in 2009, 12 per cent fewer than in 2008 and eight per cent fewer than in 2005. Almost all such judgements relate to specified “money” claims and accounted for around 73 per cent of specified “money” claims issued in 2009.
In possession cases, the standard procedure is for the claim being issued to be given a hearing date before a District Judge. Overall 165,000 claims led to possession orders being made in 2009, 22 per cent fewer than in 2008 and eight per cent fewer than in 2005. Most of the fall between 2008 and 2009 is

Judicial and Court Statistics 2009 | Chapter 1
20
explained by a 35 per cent fall in mortgage related claims leading to orders, following a 62 per cent rise between 2005 and 2008. There was also an eight per cent fall in landlord related claims leading to orders, which have generally fallen between 2005 and 2009. Overall, 53 per cent of all claims leading to orders involved orders being made that were not suspended (possession given immediately or by a given date) in 2009, down from 54 per cent in 2008 but up from 47 per cent in 2005. Of mortgage related claims leading to orders, 54 per cent involved orders being made that were not suspended, up from 53 per cent in 2008 and 46 per cent in 2005.
Registry Trust Limited (a private non-profit making company limited by guarantee) administers the statutory public register of judgments, orders and fines. Overall, 915,000 county court judgments were registered in claims for a specified amount of money with Registry Trust in 2009. 77 per cent of these related to consumers, compared to 81 per cent in 2008 and 79 per cent in 2005. During the year, 108,000 entries were satisfied, the judgments having been paid in full after one month of the date of judgment. A further 82,000 entries were cancelled, the judgment having been made in error, set aside, reversed, or paid in full within one month of the date of judgment. All entries are automatically removed at the end of the sixth calendar year after the date of judgment. The Register is open for public inspection on payment of a statutory fee, and is used in particular by credit reference agencies to assist lenders in making responsible credit granting decisions, for the benefit of both consumers and businesses.
62,000 searches of the Registry were performed in 2009, mainly by individuals searching for themselves or others or by agents acting for law firms. This represented a 59 per cent increase compared to 2008 and a 129 per cent increase compared to 2005. Internet search requests increased by 101 per cent from 29,000 in 2008 to 59,000 in 2009, while other searches fell by 63 per cent from 10,000 in 2008 to 4,000 in 2009. Additional information regarding the Register of Judgments, Orders and Fines can be obtained at www.trustonline.org.uk.
Judgment statistics are shown in Tables 1.16 to 1.18
Enforcement
There are various methods of enforcing judgments in the county courts. The most common method is the warrant of execution against a debtor’s goods, where unless the amount due under the warrant is paid, saleable items owned by a defendant can be recovered by a bailiff acting on behalf of the court and sold. Other warrant types are for the repossession of property, the return of particular goods or items, and to enforce an order for which the penalty for failure to comply is imprisonment, the warrant of committal which authorises the bailiff to arrest and deliver the person to prison or to the court. During 2009 236,000 warrants of execution were issued, 20 per cent lower than in 2008 and 31 per cent lower than in 2005, with the number having declined in each year. Overall

Judicial and Court Statistics 2009 | Chapter 1
21
16 pence in the pound was recovered, with 75 pence in the pound being recovered from warrants of execution where the creditor had provided a correct address for the debtor.
Where repossession of property or the return of particular goods or items is sought, the claimant can apply for a warrant of possession or warrant of delivery. In 2009, there were 139,000 warrants of possession issued, 13 per cent lower than in 2008 and six per cent higher than 2005. In total, bailiffs made 63,000 repossessions of properties, 11 per cent lower than in 2008 after a 41 per cent increase between 2005 and 2008. 32,000 of the properties were on behalf of mortgage lenders, nine per cent fewer than in 2008 after a 179 per cent increase between 2005 and 2008. There were 2,300 warrants of delivery issued, eight per cent lower than in 2008 and three per cent lower than in 2005.
To enforce an order for which the penalty for failure to comply is imprisonment, it is possible to apply for a warrant of committal which authorises the bailiff to arrest and deliver the person to prison or to the court. There were 1,100 warrants of committal issued in 2009, 18 per cent lower than in 2008 and 40 per cent lower than in 2005.
A judgment amount can also be enforced through the claimant applying for:
An attachment of earnings order obliging the debtor’s employer to deduct a •set sum from the debtor’s pay and forward it to the court. 72,000 applications were made for attachment of earnings orders in 2009, two per cent less than in 2008 and 22 per cent less than in 2005 with the number having declined in each year. Around 85 per cent of applications resulted in orders being made compared to 82 per cent in 2008 and 77 per cent in 2005.
A charging order enabling the creditor to obtain security for the payment •against a property owned by the debtor. 127,000 applications were made for charging orders in 2009, 23 per cent lower than in 2008 after rising by 151 per cent between 2005 and 2008.
A third party debt order enabling the creditor to secure payment by freezing •and then seizing money owed or payable by a third party to a debtor. 7,000 applications were made for third party debt orders in 2009, six per cent lower than in 2008 after a rise of 15 per cent between 2005 and 2008.
In certain circumstances a debtor may apply to the county court to combine debts into an administration order (AO). The debtor must have a judgment debt and at least one other that he is unable to pay with the total indebtedness not exceeding £5,000. Once the debts have been examined and found to be correctly calculated a District Judge can make an order for the debtor to make regular payments to the court. The court will then distribute the money in the appropriate proportions to the creditors listed by the debtor. There were 2,000 AOs made in 2009, 28 per cent fewer than in 2008 and 45 per cent fewer than

Judicial and Court Statistics 2009 | Chapter 1
22
in 2007. Provisions in Part 5 of the Tribunals Courts and Enforcement Act (TCEA) 2007 include the reform of the administration order (AO) scheme, the introduction of an enforcement restriction order (ERO), and the introduction of regulated debt management schemes. Work on the AO and ERO was suspended in 2009 pending the outcome of the consultation on non-court based debt management schemes. A consultation paper entitled ‘Debt Management Schemes – delivering effective and balanced solutions for debtors and creditors’ was issued (jointly with the Insolvency Service and the Department for Business Innovation and Skills) in September 2009.The consultation closed on 18 December 2009 and the Government intends to publish its’ response around the time of publication of these statistics.
To assist in determining the most appropriate method of enforcing a judgment, the claimant can apply for an order to obtain information from the judgment debtors. This involves debtors being ordered to attend court to provide details of their means. There were 30,000 orders made to obtain information from debtors in 2009, two per cent fewer than in 2008 but one per cent higher than the average over the previous four years.
Enforcement statistics are shown in Tables 1.19 to 1.22.
Enforcement applications by type, 2001-2009
0
100
200
300
400
500
600
700
800
20092001 2002 2003 2004 2005 2006 2007 2008
Number of enforcement applications (in thousands)
Warrants Attachment of earnings Charging Orders Third Party Debt Orders

Judicial and Court Statistics 2009 | Chapter 1
23
Tabl
e 1.1
Cou
nty
cour
ts (n
on-f
amily
wor
k)Su
mm
ary
stat
istic
s on
clai
ms
issu
ed in
Eng
land
and
Wal
es, 2
005–
2009
Num
ber o
f cla
ims /
pet
ition
s
Year
Spec
ified
“m
oney
” cl
aim
s 1
Uns
peci
fied
“mon
ey”
clai
ms 2
Tota
l “m
oney
” cl
aim
s
Clai
ms f
or
reco
very
of
land
3Cl
aim
s for
re
turn
of g
oods
Oth
er n
on-
”mon
ey”
clai
ms
Tota
l non
-”m
oney
” cl
aim
s
Tota
l in
solv
ency
pe
titio
ns 4
Tota
l pr
ocee
ding
s st
arte
d
2005
1,42
9,61
314
7,120
1,57
6,73
328
0,42
29,
079
102,
835
392,
336
51,8
752,
020,
944
2006
1,57
2,04
414
5,19
51,
717,
239
289,
408
9,85
210
0,07
439
9,33
466
,966
2,18
3,53
9
2007
1,40
8,49
914
4,12
81,
552,
627
284,
782
8,43
099
,024
392,
236
66,9
512,
011,
814
2008
1,42
6,38
916
0,24
81,
586,
637
290,
958
8,65
210
7,605
407,
215
70,2
722,
064,
124
2009
1,28
1,10
517
8,96
91,
460,
074
230,
125
10,2
6910
2,72
634
3,12
076
,211
1,87
9,40
5
Sour
ce:
HM
CS C
aseM
an s
yste
m, C
laim
Pro
duct
ion
Cent
re, M
oney
Cla
im O
nlin
e, P
osse
ssio
n Cl
aim
Onl
ine
and
man
ual r
etur
nsN
otes
:1
Clai
ms
issu
ed fo
r a s
peci
fied
amou
nt o
f mon
ey, i
nclu
ding
thos
e m
ade
thro
ugh
the
Clai
m P
rodu
ctio
n Ce
ntre
, Cou
nty
Cour
t Bul
k Ce
ntre
and
Mon
ey C
laim
Onl
ine
2 Cl
aim
s is
sued
for a
n un
spec
ified
am
ount
of m
oney
3 In
clud
es c
laim
s m
ade
via
Poss
essi
on C
laim
Onl
ine
4 In
clud
es p
etiti
ons
hear
d in
the
Dis
tric
t Reg
istr
ies o
f the
Hig
h Co
urt

Judicial and Court Statistics 2009 | Chapter 1
24
Table 1.2County courts (non-family work)Summary statistics on claims issued by HMCS area, 1 2009
Number of claims / petitions
Area
Specified “money”
claims 2
Unspecified “money”
claims 3
Total “money”
claims
Claims for recovery of land 4
Claims for return of
goods
Other non-“money”
claims
Total non-“money”
claims
Total insolvency petitions 5
Total proceedings
started
Avon and Somerset 11,710 3,405 15,115 3,824 260 2,153 6,237 3,402 24,754Bedfordshire, Essex and Herts 27,457 5,288 32,745 12,728 678 4,313 17,719 4,787 55,251Birmingham, Coventry, Solihull and Warwickshire
15,760 6,928 22,688 10,503 439 4,376 15,318 4,909 42,915
Black Country, Staffordshire & West Mercia
29,332 5,290 34,622 12,560 626 4,019 17,205 4,873 56,700
Cambridgeshire, Norfolk and Suffolk 18,034 2,828 20,862 7,895 385 2,165 10,445 3,872 35,179Cheshire and Merseyside 21,466 43,266 64,732 11,218 574 10,673 22,465 3,726 90,923Cleveland, Durham and Northumbria 18,078 7,138 25,216 12,508 573 5,259 18,340 4,643 48,199Cumbria and Lancashire 9,640 4,872 14,512 6,342 302 2,750 9,394 2,476 26,382Derbyshire and Nottinghamshire 14,839 6,183 21,022 8,443 306 2,673 11,422 2,773 35,217Devon and Cornwall 9,175 3,237 12,412 4,479 239 2,430 7,148 3,326 22,886Dorset, Gloucestershire and Wiltshire 15,726 2,393 18,119 5,646 288 2,487 8,421 2,776 29,316Greater Manchester 31,131 25,065 56,196 15,588 647 9,811 26,046 4,515 86,757Hampshire and Isle of Wight 16,028 4,993 21,021 6,107 302 3,094 9,503 1,901 32,425Humber and South Yorkshire 24,409 6,895 31,304 9,425 335 6,676 16,436 3,612 51,352Kent 16,743 2,154 18,897 7,590 417 1,668 9,675 2,496 31,068Lincolnshire, Leicestershire & Rutland and Northamptonshire
15,360 2,852 18,212 7,732 352 2,313 10,397 3,349 31,958
London 60,363 20,970 81,333 50,766 1,558 18,323 70,647 3,060 155,040Mid and West Wales 6,979 1,353 8,332 3,457 215 893 4,565 1,080 13,977North and West Yorkshire 33,624 11,196 44,820 9,734 534 5,994 16,262 5,315 66,397North Wales 3,584 2,163 5,747 2,142 126 1,541 3,809 1,002 10,558South East Wales 11,295 3,991 15,286 6,872 332 3,501 10,705 2,017 28,008Surrey and Sussex 19,190 3,454 22,644 7,351 381 3,167 10,899 3,017 36,560Thames Valley 23,125 3,055 26,180 7,215 400 2,447 10,062 3,284 39,526
County Court Bulk Centre 6 673,657 0 673,657 0 0 0 0 0 673,657
Money Claim Online 6 154,400 0 154,400 0 0 0 0 0 154,400
Total 1,281,105 178,969 1,460,074 230,125 10,269 102,726 343,120 76,211 1,879,405
Source:HMCS CaseMan system, Claim Production Centre, Money Claim Online, Possession Claim Online and manual returnsNotes:1 From April 2007, HMCS underwent a restructuring from 42 to 25 geographic areas. This table uses the new structure that was in place during the period it covers2 Claims issued for a specified amount of money, including those made through the Claim Production Centre, County Court Bulk Centre and Money Claim Online3 Claims issued for an unspecified amount of money4 Includes claims made via Possession Claim Online5 Includes petitions issued in the District Registries of the High Court6 These claims are issued in the name of Northampton County Court

Judicial and Court Statistics 2009 | Chapter 1
25
Tabl
e 1.
3C
ount
y co
urts
(non
-fam
ily w
ork)
Sum
mar
y st
atis
tics1 o
n re
cove
ry o
f lan
d ac
tions
in E
ngla
nd a
nd W
ales
, 200
5–20
09N
umbe
r of c
laim
s /
clai
ms
lead
ing
to a
n or
der m
ade2
Year
Mor
tgag
e re
poss
essi
ons
Soci
al la
ndlo
rd re
poss
essi
ons 3
Priv
ate
land
lord
repo
sses
sion
s 4A
ccel
erat
ed re
poss
essi
ons 5
Tota
l
Clai
ms
issu
ed
Susp
ende
d or
ders
m
ade
Ord
ers
mad
eCl
aim
s is
sued
Susp
ende
d or
ders
m
ade
Ord
ers
mad
eCl
aim
s is
sued
Susp
ende
d or
ders
m
ade
Ord
ers
mad
eCl
aim
s is
sued
Susp
ende
d or
ders
m
ade
Ord
ers
mad
eC
laim
s is
sued
Susp
ende
d or
ders
Ord
ers
mad
e
2005
114,
733
37,0
4331
,879
126,
333
54,8
7227
,985
18,2
872,
131
9,39
421
,069
1115
,518
280,
422
94,0
5784
,776
2006
131,
248
43,19
944
,819
116,
152
46,9
3628
,212
19,0
021,
759
9,60
923
,006
716
,912
289,
408
91,9
0199
,552
2007
137,7
2541
,474
49,18
010
3,21
440
,563
27,12
019
,347
1,35
411
,026
24,4
968
18,5
4628
4,78
283
,399
105,
872
2008
142,
741
52,0
9459
,669
104,
165
43,9
7226
,184
21,0
041,1
1811
,906
23,0
4810
17,6
2329
0,95
897
,194
115,
382
2009
93,5
3332
,946
39,2
8998
,108
43,2
1023
,730
21,4
5998
312
,424
17,0
2510
12,5
3723
0,12
577
,149
87,9
80
Sour
ce:
HM
CS C
aseM
an s
yste
m a
nd P
osse
ssio
n Cl
aim
Onl
ine
Not
es:
1 Th
e fig
ures
in th
is ta
ble
mat
ch th
ose
prov
ided
in th
e 20
10Q
2 m
ortg
age
and
land
lord
pos
sess
ion
stat
istic
s bu
lletin
. See
htt
p://
ww
w.ju
stic
e.go
v.uk
/pub
licat
ions
/mor
tgat
elan
dlor
dpos
sess
ion.
htm
2 Th
e nu
mbe
r of c
laim
s tha
t lea
d to
an
orde
r inc
lude
s al
l cla
ims
in w
hich
the
first
ord
er, w
heth
er o
utrig
ht o
r sus
pend
ed, i
s m
ade
durin
g th
e pe
riod
3 Ac
tions
by
loca
l aut
horit
ies
and
hous
ing
asso
ciat
ions
4 Ac
tions
by
all l
andl
ords
exc
ept l
ocal
aut
horit
ies
and
hous
ing
asso
ciat
ions
5 La
ndlo
rd a
ctio
ns v
ia th
e ac
cele
rate
d pr
oced
ure
enab
ling
orde
rs to
be
mad
e so
lely
on
the
basi
s of w
ritte
n ev
iden
ce fo
r ass
ured
sho
rtho
ld te
nanc
ies,
whe
n th
e fix
ed p
erio
d of
the
tena
ncy
has
co
me
to a
n en
d

Judicial and Court Statistics 2009 | Chapter 1
26
Tabl
e 1.
4C
ount
y co
urts
(non
-fam
ily w
ork)
Sum
mar
y st
atis
tics1,
2 on
reco
very
of l
and
actio
ns b
y H
MCS
3 are
a an
d re
gion
, 200
9
Num
ber o
f cla
ims /
cla
ims l
eadi
ng to
an
orde
r mad
e4
Area
/ re
gion
Mor
tgag
e re
poss
essi
ons
Soci
al la
ndlo
rd re
poss
essi
ons 5
Priv
ate
land
lord
repo
sses
sion
s 6Ac
cele
rate
d re
poss
essi
ons 7
Tota
l
Clai
ms l
eadi
ng to
Clai
ms l
eadi
ng to
Clai
ms l
eadi
ng to
Clai
ms l
eadi
ng to
Clai
ms l
eadi
ng to
Clai
ms
issue
dSu
spen
ded
orde
rsO
rder
s m
ade
Clai
ms
issue
dSu
spen
ded
orde
rsO
rder
s m
ade
Clai
ms
Issue
dSu
spen
ded
orde
rsO
rder
s m
ade
Clai
ms
issue
dSu
spen
ded
orde
rsO
rder
s m
ade
Clai
ms
issue
dSu
spen
ded
orde
rsO
rder
s m
ade
Lond
on C
ivil
and
Fam
ily12
,932
4,98
54,
812
24,0
636,
855
6248
6,50
120
53,
551
7,27
00
5,48
950
,766
12,0
4520
,100
Lond
on
12,9
324,
985
4,81
224
,063
6,85
56,
248
6,50
120
53,
551
7,27
00
5,48
950
,766
12,0
4520
,100
Birm
ingh
am, C
oven
try,
So
lihul
l and
War
wic
kshi
re
4,37
21,
524
1,82
94,
769
2,05
412
9981
238
453
550
135
810
,503
3,61
73,
939
Blac
k Cou
ntry
, Sta
fford
shire
an
d W
est M
erci
a 5,
586
2,01
72,
250
5,51
32,
921
1275
796
3647
766
50
464
12,5
604,
974
4,46
6
Der
bysh
ire a
nd
Not
tingh
amsh
ire
3,40
61,
094
1,52
04,
244
2,01
210
7248
829
275
305
024
38,
443
3,13
53,
110
Linc
olns
hire
, Lei
cest
ersh
ire
& R
utla
nd a
nd
Nor
tham
pton
shire
3,85
11,
265
1,67
82,
876
1,49
667
059
222
376
413
130
87,
732
2,78
43,
032
Mid
land
s17
,215
5,90
07,
277
17,4
028,
483
4,31
62,
688
125
1,58
11,
933
21,
373
39,2
3814
,510
14,5
47
Clev
elan
d, D
urha
m a
nd
Nor
thum
bria
5,
762
1,96
62,
791
5,56
52,
847
1216
734
5144
844
71
321
12,5
084,
865
4,77
6
Hum
ber a
nd S
outh
Yo
rksh
ire
4,56
81,
411
2,13
53,
777
1,87
111
0863
436
396
446
034
19,
425
3,31
83,
980
Nor
th a
nd W
est Y
orks
hire
5,
483
1,89
42,
447
2,96
31,
586
919
835
3652
445
30
314
9,73
43,
516
4,20
4
Nor
th E
ast
15,8
135,
271
7,37
312
,305
6,30
43,
243
2,20
312
31,
368
1,34
61
976
31,6
6711
,699
12,9
60
Ches
hire
and
Mer
seys
ide
5,19
61,
822
2,17
64,
793
2,65
782
278
531
444
444
130
711
,218
4,51
13,
749
Cum
bria
and
Lan
cash
ire3,
300
1,16
81,
393
2,16
198
260
246
816
269
413
127
16,
342
2,16
72,
535
Gre
ater
Man
ches
ter
6,61
52,
337
2,93
77,
163
3,24
914
481,
139
8762
667
10
457
15,5
885,
673
5,46
8

Judicial and Court Statistics 2009 | Chapter 1
27
Nor
th W
est
15,1
115,
327
6,50
614
,117
6,88
82,
872
2,39
213
41,
339
1,52
82
1,03
533
,148
12,3
5111
,752
Bedf
ords
hire
, Ess
ex a
nd
Her
ts
5,20
71,
907
2,16
95,
371
2,42
212
421,
330
3982
382
02
568
12,7
284,
370
4,80
2
Cam
brid
gesh
ire, N
orfo
lk
and
Suffo
lk
3,19
71,
084
1,38
83,
631
2,00
573
655
728
385
510
037
77,
895
3,11
72,
886
Kent
3,
283
1,23
31,
431
2,49
91,
130
685
1,26
011
966
754
80
388
7,59
02,
482
3,17
1
Surre
y an
d Su
ssex
3,
038
1,10
31,
188
2,58
01,
170
581
1,00
447
557
729
154
17,
351
2,32
12,
867
Tham
es V
alle
y 2,
730
993
1,00
13,
289
1,52
678
774
834
466
448
234
37,
215
2,55
52,
597
Sout
h Ea
st17
,455
6,32
07,
177
17,3
708,
253
4,03
14,
899
267
2,89
83,
055
52,
217
42,7
7914
,845
16,3
23
Avon
and
Som
erse
t 1,
903
659
752
1,27
768
729
837
913
225
265
019
13,
824
1,35
91,
466
Dev
on a
nd C
ornw
all
1,96
961
981
71,
639
861
336
456
2326
441
50
332
4,47
91,
503
1,74
9
Dor
set,
Glo
uces
ters
hire
and
W
iltsh
ire
2,46
278
01,
065
2,21
71,
115
460
558
2237
540
90
320
5,64
61,
917
2,22
0
Ham
pshi
re a
nd Is
le o
f Wig
ht
2,39
082
594
82,
604
1,20
553
472
642
419
387
030
86,
107
2,07
22,
209
Sout
h W
est
8,72
42,
883
3,58
27,
737
3,86
81,
628
2,11
910
01,
283
1,47
60
1,15
120
,056
6,85
17,
644
Mid
and
Wes
t Wal
es
1,63
851
463
11,
586
681
426
130
978
103
079
3,45
71,
204
1,21
4
Nor
th W
ales
1,
218
483
564
706
352
215
111
854
107
082
2,14
284
391
5
Sout
h Ea
st W
ales
3,
427
1,26
31,
367
2,82
21,
526
751
416
1227
220
70
135
6,87
22,
801
2,52
5
Wal
es6,
283
2,26
02,
562
5,11
42,
559
1,39
265
729
404
417
029
612
,471
4,84
84,
654
Tota
l93
,533
32,9
4639
,289
98,1
0843
,210
23,7
3021
,459
983
12,4
2417
,025
1012
,537
230,
125
77,1
4987
,980
Sour
ce:
HM
CS C
aseM
an s
yste
m a
nd P
osse
ssio
n Cl
aim
Onl
ine
Not
es:
1 Th
e fig
ures
in th
is ta
ble
mat
ch th
ose
prov
ided
in th
e 20
10Q
2 m
ortg
age
and
land
lord
pos
sess
ion
stat
istic
s bu
lletin
. See
htt
p://
ww
w.ju
stic
e.go
v.uk
/pub
licat
ions
/mor
tgat
elan
dlor
dpos
sess
ion.
htm
2
Clai
ms
mad
e vi
a Po
sses
sion
Cla
im O
nlin
e ar
e is
sued
in th
e na
me
of th
e lo
cal c
ourt
rela
ting
to th
e po
stco
de o
f the
pro
pert
y3
From
Apr
il 20
07, H
MCS
und
erw
ent a
rest
ruct
urin
g fr
om 4
2 to
25
geog
raph
ic a
reas
whi
le th
e nu
mbe
r of r
egio
ns re
mai
ned
at s
even
. Thi
s tab
le u
ses t
he n
ew s
truc
ture
4
The
num
ber o
f cla
ims t
hat l
ead
to a
n or
der i
nclu
des
all c
laim
s in
whi
ch th
e fir
st o
rder
, whe
ther
out
right
or s
uspe
nded
, is
mad
e du
ring
the
perio
d 5
Actio
ns b
y lo
cal a
utho
ritie
s an
d ho
usin
g as
soci
atio
ns
6 Ac
tions
by
all l
andl
ords
exc
ept l
ocal
aut
horit
ies
and
hous
ing
asso
ciat
ions
7 La
ndlo
rd a
ctio
ns v
ia th
e ac
cele
rate
d pr
oced
ure
enab
ling
orde
rs to
be
mad
e so
lely
on
the
basi
s of w
ritte
n ev
iden
ce fo
r ass
ured
sho
rtho
ld te
nanc
ies,
whe
n th
e fix
ed p
erio
d of
the
tena
ncy
has
com
e to
an
end
Tabl
e 1.
4 co
ntin
ued

Judicial and Court Statistics 2009 | Chapter 1
28
Table 1.5County courts (non-family work)Summary statistics on other non-“money” claims issued in England & Wales, 2005–2009
Number of claims
Year
Housing (not Landlord or
Mortgage possession) 1 Injunctions 2 Enforcement 3
Pre-issue applications 4 Other 5 Total
2005 6,889 7,559 29,962 14,941 43,484 102,8352006 6,544 8,419 29,199 14,059 41,853 100,0742007 6,270 9,699 24,302 15,553 43,200 99,0242008 6,164 10,198 26,028 14,616 50,599 107,6052009 6,144 10,031 22,186 15,241 49,124 102,726
Source:HMCS CaseMan systemNotes:1 Includes landlord and tenancy applications generally for a new tenancy agreement, claims to evict trespassers and claims for interim
possession orders2 To make somebody do something or to stop them doing it3 Enforcement of Tribunal awards and orders made in magistrates’ courts4 To obtain an order for disclosure of information prior to issue of a claim5 Includes orders for costs only
Judicial and Court Statistics 2009 | Chapter 1
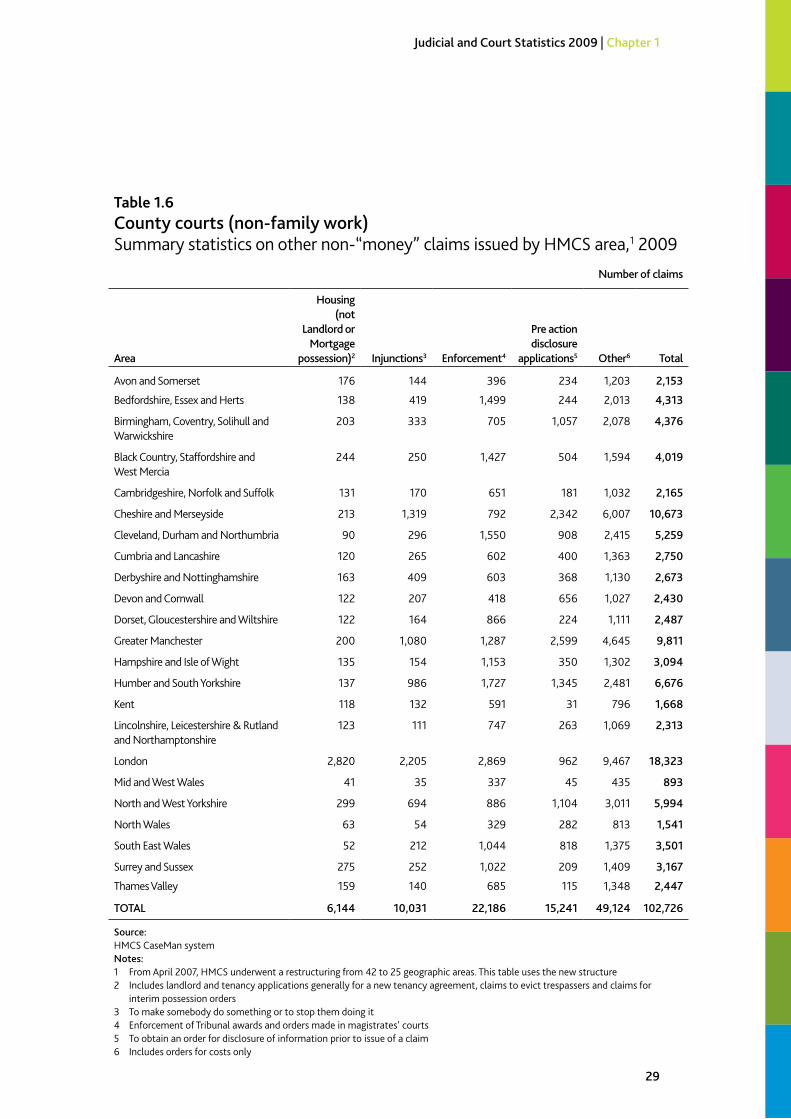
29
Table 1.6County courts (non-family work)Summary statistics on other non-“money” claims issued by HMCS area, 1 2009
Number of claims
Area
Housing (not
Landlord or Mortgage
possession) 2 Injunctions 3 Enforcement 4
Pre action disclosure
applications 5 Other 6 Total
Avon and Somerset 176 144 396 234 1,203 2,153
Bedfordshire, Essex and Herts 138 419 1,499 244 2,013 4,313
Birmingham, Coventry, Solihull and Warwickshire
203 333 705 1,057 2,078 4,376
Black Country, Staffordshire and West Mercia
244 250 1,427 504 1,594 4,019
Cambridgeshire, Norfolk and Suffolk 131 170 651 181 1,032 2,165
Cheshire and Merseyside 213 1,319 792 2,342 6,007 10,673
Cleveland, Durham and Northumbria 90 296 1,550 908 2,415 5,259
Cumbria and Lancashire 120 265 602 400 1,363 2,750
Derbyshire and Nottinghamshire 163 409 603 368 1,130 2,673
Devon and Cornwall 122 207 418 656 1,027 2,430
Dorset, Gloucestershire and Wiltshire 122 164 866 224 1,111 2,487
Greater Manchester 200 1,080 1,287 2,599 4,645 9,811
Hampshire and Isle of Wight 135 154 1,153 350 1,302 3,094
Humber and South Yorkshire 137 986 1,727 1,345 2,481 6,676
Kent 118 132 591 31 796 1,668
Lincolnshire, Leicestershire & Rutland and Northamptonshire
123 111 747 263 1,069 2,313
London 2,820 2,205 2,869 962 9,467 18,323
Mid and West Wales 41 35 337 45 435 893
North and West Yorkshire 299 694 886 1,104 3,011 5,994
North Wales 63 54 329 282 813 1,541
South East Wales 52 212 1,044 818 1,375 3,501
Surrey and Sussex 275 252 1,022 209 1,409 3,167
Thames Valley 159 140 685 115 1,348 2,447
TOTAL 6,144 10,031 22,186 15,241 49,124 102,726
Source:HMCS CaseMan systemNotes:1 From April 2007, HMCS underwent a restructuring from 42 to 25 geographic areas. This table uses the new structure2 Includes landlord and tenancy applications generally for a new tenancy agreement, claims to evict trespassers and claims for
interim possession orders3 To make somebody do something or to stop them doing it4 Enforcement of Tribunal awards and orders made in magistrates’ courts5 To obtain an order for disclosure of information prior to issue of a claim6 Includes orders for costs only

Judicial and Court Statistics 2009 | Chapter 1
30
Table 1.7County courts (non-family work)Summary statistics1 on insolvency petitions2 issued in England and Wales, 2005–2009
Number of petitions
YearCompany
windings-up 3
Individual bankruptcy 4
TotalCreditor’s petition Debtor’s petition
2005 7,350 10,438 34,087 51,8752006 6,956 11,045 48,965 66,9662007 6,296 11,327 49,322 66,9452008 6,075 12,068 52,129 70,2722009 5,690 11,400 59,121 76,211
Source:HMCS manual returnsNote:1 The figures in this table match those provided in the 2010Q2 company winding up and bankruptcy petition statistics
bulletin. See http://www.justice.gov.uk/publications/companywindingupandbankruptcy.htm2 Includes petitions issued in the District Registries of the High Court 3 ‘Winding up’ is the process by which a company’s existence is terminated, whether due to insolvency or for another reason4 Where an individual has debts that he/she is unable to pay
Table 1.8County courts (non-family work)“Money” claims issued for a specified amount in England and Wales, with percentage breakdown by claim value, 2005–2009
Percentage
Year
Total number
of claims issued
Value of claim
Lower bound (>) £0 £500 £1,000 £5,000 £15,000 £50,000 Other 1
Upper bound (<=) £500 £1,000 £5,000 £15,000 £50,000 n/a
2005 1,429,613 53.3% 14.3% 21.6% 7.7% 2.5% 0.4% 0.4%2006 1,572,044 48.6% 15.4% 23.6% 8.6% 2.9% 0.4% 0.3%2007 1,408,499 40.8% 15.4% 28.2% 10.9% 3.9% 0.5% 0.3%2008 1,426,389 41.1% 14.9% 28.2% 11.3% 3.7% 0.5% 0.3%2009 1,281,105 38.1% 17.1% 30.0% 10.4% 3.4% 0.6% 0.3%
Source:HMCS CaseMan system, Claim Production Centre, Money Claim OnlineNote:1 Includes claims with no recorded claim values

Judicial and Court Statistics 2009 | Chapter 1
31
Table 1.9County courts (non-family work)“Money” claims issued for an unspecified amount in England and Wales, with percentage breakdown by claim value, 2005–2009 1
Percentage
Year
Total number
of claims issued
Value of claim
Lower bound
(>) £0 £500 £1,000 £5,000 £15,000 £50,000 Other2
Upper bound
(<=) £500 £1,000 £5,000 £15,000 £50,000 n/a
2005 147,120 1.4% 1.2% 46.5% 30.9% 11.2% 4.3% 4.6%
2006 145,195 1.2% 1.0% 47.8% 30.3% 10.8% 4.5% 4.5%
2007 144,128 1.3% 1.1% 47.9% 30.2% 10.9% 4.3% 4.3%
2008 160,248 1.0% 0.8% 48.5% 31.0% 10.4% 4.0% 4.4%
2009 178,969 1.1% 0.8% 49.1% 30.2% 10.7% 3.7% 4.4%
Source:HMCS CaseMan systemNotes:1 The claim value breakdown is derived from the claim issue fee paid2 Includes claims with either no recorded issue fee paid or with a recorded issue fee paid that doesn’t correspond to
one of the claim value ranges shown

Judicial and Court Statistics 2009 | Chapter 1
32
Table 1.10County courts (non-family work)Summary statistics on claims defended and allocated to track in England and Wales, 2005–2009 1
Number of defences / allocations
YearNumber of
defences 2
Number of allocations to track 3
Small claims Fast track Multi track4 Total
2005 275,138 74,527 50,704 28,097 153,3282006 292,115 76,821 50,723 27,605 155,1492007 338,616 96,417 50,970 26,364 173,7512008 298,796 83,928 53,255 26,722r 163,905r2009 315,934 93,073 61,415 25,495 179,983
Source:HMCS CaseMan systemNotes:1 Where a claim is defended, further information is gathered before it is allocated to one of the three
case management “tracks” shown depending on the value, complexity and importance of the case and the consequential level of judicial involvement required. There may be more than one defence or allocation to track in a case
2 The number of defences excludes those recorded on the grounds of the defendant having already paid the amount claimed. Despite some cases involving more than one defendant, it is much lower than the number of claims issued (see Table 1.1) because the vast majority of claims are not disputed
3 The number of allocations to track is lower than the number of defences primarily because defended cases are often settled / withdrawn before they are allocated to track
4 A new and higher claim value limit was introduced for fast track cases on 6th April 2009. Since 1999, claims have generally been allocated to the fast track which have a value exceeding the limit of the small claims track (£5,000 for most claim types) but not more than £15,000 (those with a value over £15,000 generally being allocated to the multi track). For all proceedings issued on or after 6th April 2009, the limit has been raised from £15,000 to £25,000
Judicial and Court Statistics 2009 | Chapter 1
33
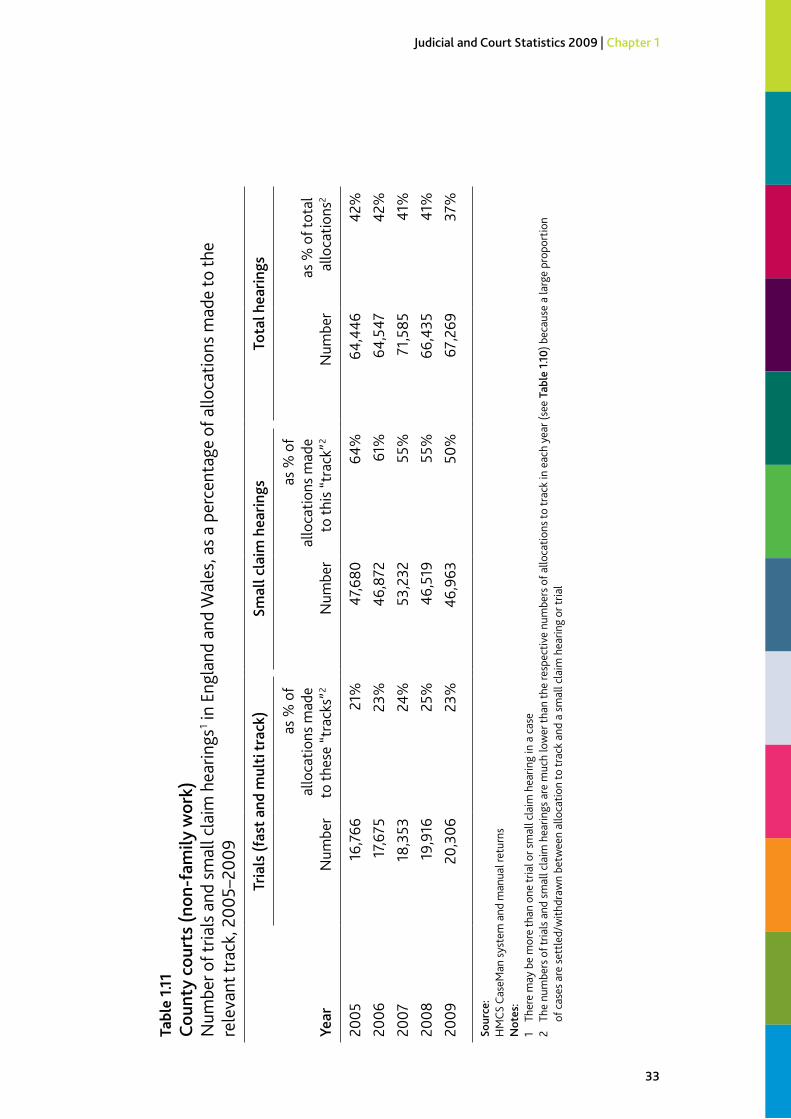
Tabl
e 1.1
1C
ount
y co
urts
(non
-fam
ily w
ork)
Num
ber o
f tria
ls a
nd s
mal
l cla
im h
earin
gs 1 in
Eng
land
and
Wal
es, a
s a
perc
enta
ge o
f allo
catio
ns m
ade
to th
e re
leva
nt tr
ack,
200
5–20
09
Year
Tria
ls (f
ast a
nd m
ulti
trac
k)Sm
all c
laim
hea
rings
Tota
l hea
rings
Num
ber
as %
of
allo
catio
ns m
ade
to th
ese
“tra
cks”
2N
umbe
r
as %
of
allo
catio
ns m
ade
to th
is “
trac
k” 2
Num
ber
as %
of t
otal
al
loca
tions
2
2005
16,7
6621
%47
,680
64%
64,4
4642
%20
0617
,675
23%
46,8
7261
%64
,547
42%
2007
18,3
5324
%53
,232
55%
71,5
8541
%20
0819
,916
25%
46,5
1955
%66
,435
41%
2009
20,3
0623
%46
,963
50%
67,2
6937
%
Sour
ce:
HM
CS C
aseM
an s
yste
m a
nd m
anua
l ret
urns
Not
es:
1 Th
ere
may
be
mor
e th
an o
ne tr
ial o
r sm
all c
laim
hea
ring
in a
cas
e2
The
num
bers
of t
rials
and
sm
all c
laim
hea
rings
are
muc
h lo
wer
than
the
resp
ectiv
e nu
mbe
rs o
f allo
catio
ns to
trac
k in
eac
h ye
ar (s
ee T
able
1.10
) bec
ause
a la
rge
prop
ortio
n
of c
ases
are
set
tled/
with
draw
n be
twee
n al
loca
tion
to tr
ack
and
a sm
all c
laim
hea
ring
or tr
ial

Judicial and Court Statistics 2009 | Chapter 1
34
Table 1.12County courts (non-family work)Small claim hearings in England and Wales, by claim type, 2005–2009
Number of hearings
Year
Type of case
Specified “money” 1
Unspecified “money” 2 Other Total
2005 44,594 2,718 368 47,6802006 44,202 2,328 342 46,8722007 50,725 2,179 328 53,2322008 44,359 1,900 260 46,5192009 45,006 1,659 298 46,963
Source:HMCS CaseMan systemNotes:1 Cases which were issued for a specified amount of money2 Cases which were issued for an unspecified amount of money
Table 1.13County courts (non-family work)Fast and Multi-Track trials in England and Wales, by claim type, 2005–2009
Number of hearings
Year
Type of case
Specified “money” 1
Unspecified “money” 2 Other Total
2005 2,922 11,337 2,507 16,7662006 3,164 12,203 2,308 17,6752007 3,353 12,750 2,250 18,3532008 3,696 14,018 2,202 19,9162009 3,657 14,662 1,987 20,306
Source:HMCS CaseMan systemNotes:1 Cases which were issued for a specified amount of money2 Cases which were issued for an unspecified amount of money

Judicial and Court Statistics 2009 | Chapter 1
35
Tabl
e 1.1
4C
ount
y co
urts
(non
-fam
ily w
ork)
Aver
age
time
take
n to
reac
h tr
ials
/ sm
all c
laim
hea
rings
, and
est
imat
es o
f the
ir du
ratio
n, E
ngla
nd a
nd W
ales
, 20
05–2
009 1,
2
Smal
l Cla
im c
ases
Fast
and
Mul
ti T
rack
cas
es
Year
Tim
e be
twee
n is
sue
and
star
t of
sm
all c
laim
(w
eeks
) 3
Dur
atio
n of
sm
all c
laim
he
arin
gsSa
mpl
e si
ze
Tim
e be
twee
n is
sue
and
allo
catio
n to
tr
ack
(wee
ks) 3
Tim
e be
twee
n al
loca
tion
to
trac
k an
d tr
ial
(wee
ks) 3
Tim
e be
twee
n is
sue
and
tria
l (w
eeks
) 3,4
Dur
atio
n of
tria
lsSa
mpl
e si
ze
2005
2776
Min
s 9
60
2232
523
Hou
rs 4
0 M
ins
880
20
0627
84 M
ins
840
21
3250
4 H
ours
37
Min
s 9
80
2007
2783
Min
s 5
92
2132
493
Hou
rs 4
2 M
ins
492
20
0829
77 M
ins
1,27
3r
2132
483
Hou
rs 4
5 M
ins
758
r20
0931
77 M
ins
891
21
3248
3 H
ours
49
Min
s 8
22
Sour
ce:
HM
CS C
aseM
an s
yste
m a
nd c
ase
“sam
pler
s” fo
r sm
all c
laim
s he
arin
gs a
nd tr
ials
Not
es:
1 Al
l figu
res f
or h
earin
g du
ratio
ns a
re d
eriv
ed fr
om c
ase
sam
pler
s2
Figu
res f
or ti
me
inte
rval
s be
twee
n m
ajor
cas
e m
ilest
ones
(iss
ue, a
lloca
tion
and
hear
ing)
are
take
n fr
om fu
ll po
pula
tion
data
3 Fi
gure
s re
late
to c
ases
who
se tr
ials
or s
mal
l cla
im h
earin
gs to
ok p
lace
dur
ing
the
rele
vant
qua
rter
or y
ear.
For m
any
case
s the
orig
inal
dat
e of
issu
e an
d al
loca
tion
date
will
hav
e be
en in
an
earli
er p
erio
d4
Thes
e fig
ures
are
diff
eren
t to
the
sum
s of t
he a
vera
ge ti
mes
bet
wee
n is
sue
and
allo
catio
n to
trac
k an
d be
twee
n al
loca
tion
to tr
ack
and
tria
l as
not a
ll al
loca
tion
to tr
ack
deta
ils
are
know
n

Judicial and Court Statistics 2009 | Chapter 1
36
Table 1.15County courts (non-family work)Number of judgments by default, 1 acceptance and determination 2, 3 in England and Wales by case type, 2005–2009
Number of judgments
Year
Type of case
Specified “money” 4
Unspecified “money” 5 Other Total
2005 1,019,437 960 565 1,020,9622006 1,102,687 870 629 1,104,1862007 997,342 898 589 998,8292008 1,065,422 1,000 527 1,066,9492009 935,830 890 538 937,258
Source:HMCS CaseMan system, Claim Production Centre and Money Claim OnlineNotes:1 Following no response from the defendant within the allotted time period2 Judgments by acceptance and determination which follow the claimant accepting the defendant’s
offer to pay all or part of the amount owed3 Includes judgments by default, acceptance and determination made in the County Court Bulk Centre
and via Money Claim Online4 Cases which were issued for a specified amount of money5 Cases which were issued for an unspecified amount of money

Judicial and Court Statistics 2009 | Chapter 1
37
Table 1.16County courts (non-family work)Number of judgments by default, 1 acceptance and determination2 by HMCS3 area, 2009
Number of judgments
Type of case
AreaSpecified
“money” 4Unspecified
“money” 5 Other Total
Avon and Somerset 7,530 24 12 7,566Bedfordshire, Essex & Herts 18,957 50 59 19,066
Birmingham, Coventry, Solihull and Warwickshire 10,863 41 20 10,924
Black Country, Staffordshire and West Mercia 17,720 43 22 17,785
Cambridgeshire, Norfolk and Suffolk 11,558 21 7 11,586
Cheshire and Merseyside 12,340 110 13 12,463
Cleveland, Durham and Northumbria 14,594 50 13 14,657
Cumbria and Lancashire 6,564 31 10 6,605
Derbyshire and Nottinghamshire 10,260 18 5 10,283
Devon and Cornwall 6,075 23 14 6,112
Dorset, Gloucestershire and Wiltshire 11,133 17 6 11,156
Greater Manchester 18,897 78 31 19,006
Hampshire and Isle of Wight 9,871 37 20 9,928
Humber and South Yorkshire 12,125 25 12 12,162
Kent 11,585 31 70 11,686
Lincolnshire, Leicestershire & Rutland and Northamptonshire 10,639 15 8 10,662
London 38,050 129 144 38,323
Mid and West Wales 4,592 14 4 4,610
North and West Yorkshire 21,181 31 18 21,230
North Wales 2,655 13 11 2,679
South East Wales 8,484 25 13 8,522
Surrey and Sussex 12,568 21 8 12,597
Thames Valley 15,349 43 18 15,410
County Court Bulk Centre and Money Claim Online 6 642,240 0 0 642,240
Total 935,830 890 538 937,258
Source:HMCS CaseMan system, Claim Production Centre and Money Claim OnlineNotes:1 Following no response from the defendant within the allotted time period2 Judgments by acceptance and determination which follow the claimant accepting the defendant’s offer to pay all or part of the amount owed3 From April 2007, HMCS underwent a restructuring from 42 to 25 geographic areas. This table uses the new structure4 Cases which were issued for a specified amount of money5 Cases which were issued for an unspecified amount of money6 These judgments by default, acceptance and determination are made in the name of Northampton County Court

Judicial and Court Statistics 2009 | Chapter 1
38
Table 1.17Registry of County Court Judgments in England and WalesNumber of judgments registered in claims for a specified amount of money, satisfied and cancelled, by type, 2005–2009 1
Number of judgments
Consumer judgments (i.e. individuals) Commercial judgments (i.e. businesses) Total
Year Registered Satisfied 2 Cancelled 3 Registered Satisfied 2 Cancelled 3 Registered Satisfied 2 Cancelled 3
2005 635,222 93,443 54,277 167,664 15,476 32,011 802,886 108,919 86,288
2006 843,853 108,079 55,626 178,313 20,586 33,994 1,022,166 128,665 89,620
2007 796,528 106,151 49,905 185,395 22,195 35,523 981,923 128,346 85,428
2008 827,880 95,676 41,618 192,056 20,708 35,341 1,019,936 116,384 76,959
2009 707,942 87,424 44,367 207,101 20,166 37,902 915,043 107,590 82,269
Source:Registry Trust LtdNotes:1 Excludes judgments made for the non-payment of road tax between 2005 and 2007 (these amounting to £216,000 in 2005, £83,000 in
2006 and £6,000 in 2007)2 The judgment debt has been paid in full3 A judgment registration can be cancelled when it is made in error, set aside, reversed, paid before the court date in full within one month
Table 1.18Registry of County Court Judgments in England and WalesNumber of register searches made, 1 by search method, 2005–2009
Number of searches
Year Postal Personal Internet Total
2005 17,368 3,570 6,252 27,1902006 16,228 4,376 16,205 36,8092007 11,097 3,784 22,220 37,1012008 7,726 2,521 29,080 39,3272009 3,718 92 58,525 62,335
Source:Registry Trust LtdNote:1 These searches were mainly carried out by individuals searching for themselves or others or by agents
acting for law firms

Judicial and Court Statistics 2009 | Chapter 1
39
Table 1.19County court (enforcement work)Number of warrants issued 1 in England and Wales, by type, 2005–2009
Number of warrants
Year Execution 2 Delivery 3 Possession 4 Committal 5
2005 341,097 2,382 131,510 1,8442006 340,078 2,121 144,990 1,7572007 310,178 2,359 146,120 1,6472008 294,823 2,500 159,337 1,3532009 236,293 2,307 139,131 1,103
Source:HMCS CaseMan system, Claim Production Centre, Money Claim Online and Possession Claim OnlineNotes:1 Includes warrants issued in the County Court Bulk Centre, Money Claim Online and Possession Claim
Online2 Allows saleable items owned by the debtor to be sold unless the amount due under the warrant is paid3 For the return of goods or items4 For the repossession of property5 For enforcing an order where the penalty for failing to comply is imprisonment. It authorises the
bailiff to arrest and deliver the person to prison or to the court
Table 1.20County court (enforcement work)Amounts issued and recovered from warrants of execution 1 in England and Wales, 2005–2009
Year
Amount issued in correctly directed 2
warrants (£)
Amount received in correctly directed 2
warrants (£)
Amount issued in all
warrants (£)
Amount received in all
warrants (£)
Pence-per-pound recovered on correctly
directed 2 warrants
Pence-per-pound recovered on all
warrants
2005 47,730,253 44,301,929 200,347,628 47,417,447 92.8 23.7
2006 47,151,671 42,905,286 211,262,049 46,173,497 91.0 21.9
2007 44,191,558 39,570,109 204,649,725 42,592,414 89.5 20.8
2008 40,838,478 34,035,170 210,876,807 36,927,906 83.3 17.5
2009 39,453,880 29,746,118 211,417,150 32,833,337 75.4 15.5
Source:HMCS CaseMan systemNotes:1 Allows saleable items owned by the debtor to be sold unless the amount due under the warrant is paid2 Warrants for which the creditor has specified the correct address

Judicial and Court Statistics 2009 | Chapter 1
40
Table 1.21County court (enforcement work)Number of repossessions1 of property by bailiffs2 in England and Wales, by type of case, 2005–20093
Number of repossessions
Type of case
YearMortgage
repossession4
Social landlord
repossession
Private landlord
repossessionAccelerated
repossession Other Total
2005(r) 12,850 24,416 4,004 6,002 2,337 49,609
2006(r) 21,017 23,179 4,120 6,775 2,297 57,388
2007(r) 23,894 20,667 4,356 7,557 2,104 58,578
2008(r) 35,823 20,249 4,445 7,575 2,074 70,166
2009(r) 32,468 18,309 4,623 5,079 2,077 62,556
Source:HMCS CaseMan system and Possession Claim OnlineNotes:1 The vast majority of warrant of repossession outcomes are repossession, the warrant being suspended by an order
made by the court and the warrant being withdrawn 2 Includes warrants issued in the County Court Bulk Centre and via Possession Claim Online3 The revisions for 2005-2009 reflect new procedures put in place to include observations which were recorded by the
court which executed the warrant as well as by the court which issued the warrant (who are supposed to record these details)
4 These figures differ from those provided by Council of Mortgage Lenders (www.cml.org.uk) for a number of reasons including the latter including “voluntary” repossessions (where the property has been repossessed without the need for a bailiff), being shown on a UK basis but excluding repossessions by lenders who are not CML members

Judicial and Court Statistics 2009 | Chapter 1
41
Tabl
e 1.
22C
ount
y co
urt (
enfo
rcem
ent w
ork)
Enfo
rcem
ent-
rela
ted
orde
rs a
pplie
d fo
r and
mad
e in
Eng
land
and
Wal
es, 2
005–
2009
Num
ber o
f app
licat
ions
/ or
ders
Year
Atta
chm
ent o
f ear
ning
s or
ders
1, 2
Third
par
ty d
ebt o
rder
s 3C
harg
ing
orde
rs 4
Adm
inis
trat
ion
orde
rs 5
Ord
ers t
o ob
tain
in
form
atio
n fr
om
judg
men
t deb
tors
7Ap
plica
tions
Ord
ers
mad
e 2Ap
plica
tions
Ord
ers m
ade
Appl
icatio
nsO
rder
s mad
eAp
plica
tions
Ord
ers
mad
e 6
2005
92,5
5971
,089
6,59
71,
826
65,7
8049
,218
3,17
73,
700
31,5
12
2006
85,3
2866
,477
6,55
41,
828
92,9
3367
,090
3,18
14,
480
28,4
62
2007
82,0
1962
,125
6,47
41,
813
131,
637
97,0
262,
407
3,68
327
,148
2008
73,8
4560
,588
7,564
2,04
116
4,81
213
5,70
22,
065
2,79
530
,261
2009
72,3
1661
,336
7,13
72,
176
127,
179
111,
311
1,94
82,
019
29,6
72
Sour
ce:
HM
CS C
aseM
an s
yste
m a
nd m
anua
l ret
urns
Not
es:
1 At
tach
men
t of e
arni
ngs’
ord
ers o
blig
e th
e de
btor
’s em
ploy
er to
ded
uct a
set
sum
from
the
debt
or’s
pay
and
forw
ard
it to
the
cour
t2
Incl
udes
the
mak
ing
of v
arie
d or
ders
and
sus
pend
ed o
rder
s en
ablin
g th
e de
btor
to m
ake
paym
ents
into
cou
rt d
irect
ly b
ut u
pon
failu
re to
do
so w
ill re
sult
in th
e de
btor
’s em
ploy
er b
eing
con
tact
ed
3 Th
ird p
arty
deb
t ord
ers
secu
re p
aym
ent b
y fr
eezi
ng a
nd th
en s
eizi
ng m
oney
ow
ed o
r pay
able
by
a th
ird p
arty
to a
deb
tor
4 Ch
argi
ng o
rder
s obt
ain
secu
rity
for t
he p
aym
ent a
gain
st a
pro
pert
y ow
ned
by th
e de
btor
5 Ad
min
istr
atio
n or
ders
ena
ble
a de
btor
to c
ombi
ne a
judg
men
t deb
t and
at l
east
one
oth
er d
ebt (
with
tota
l ind
ebte
dnes
s no
t exc
eedi
ng £
5,00
0) in
to a
sin
gle
orde
r for
the
mak
ing
of re
gula
r pay
men
ts to
the
cour
t to
be d
istr
ibut
ed to
the
cred
itors
in th
e ap
prop
riate
pro
port
ions
list
ed b
y th
e de
btor
6 M
ultip
le o
rder
s m
ay b
e m
ade
follo
win
g an
app
licat
ion
e.g.
whe
re a
n or
igin
al o
rder
is re
voke
d an
d th
en re
-inst
ated
7
Form
erly
kno
wn
as th
e th
e or
al e
xam
inat
ion
proc
edur
e w
hich
was
cha
nged
on
26 M
arch
200
2, th
e pr
oces
s be
ing
stre
amlin
ed a
nd s
tand
ardi
sed
to e
nabl
e in
form
atio
n to
be
obta
ined
fast
er

Judicial and Court Statistics 2009 | Chapter 1
42

Family matters
Chapter 2

Judicial and Court Statistics 2009 | Chapter 2
44
Chapter 2: Family matters
This chapter refers to family proceedings across all tiers of court
Family law is the area of law that deals with:
local authority intervention to protect children (public law) •
parental disputes concerning the upbringing of children (private law) •
decrees relating to marriage •
financial provisions for children after divorce or relationship breakdown •
domestic violence remedies •
adoption. •
All family matters are dealt with at Family Proceedings Courts (which are part of the magistrates’ courts), at county courts or in the Family Division of the High Court. Magistrates undergo specialist training before they sit in Family Proceedings Courts where procedures are very different from the criminal courts. Most matters affecting children are dealt with under the Children Act 1989 in all three levels of courts.
Information on the data sources used for the family court statistics can be found in Annex A. Explanations for some of the main terms used in this section can be found in the Glossary. The tables of detailed data can be found immediately following this section of commentary.
Key findings for 2009
There were 25,810 children involved in public law applications in 2009, an •increase of 31 per cent compared with 2008. This increase follows a declining trend in previous years, and largely reflects an increase in children-related applications received by the family courts which began towards the end of 2008. At around this time there was also significant media coverage of local authority child protection practice.
The total number of children involved in private law applications increased by •14 per cent compared with 2008. It is a considerably larger annual increase than seen in recent years, and continues the upward trend from 2005.
There were 132,140 petitions filed for dissolution of marriage in 2009; an •increase of three per cent compared with the previous year, and a reversal of the recent downward trend seen since 2005.

Judicial and Court Statistics 2009 | Chapter 2
45
Applications in county courts for domestic violence remedies increased by •five per cent in 2009 compared with 2008. Within this, applications for non-molestation orders increased by 10 per cent, while applications for occupation orders decreased by eight per cent.
Matters affecting children: Public Law applications
A new compilation methodology has been introduced for the public and private law applications data for 2005 onwards, and previously-published statistics for 2005 to 2009 have been revised as a result - see Annex A for more details.
Public law cases are those brought by local authorities or an authorised person (currently only the National Society for the Prevention of Cruelty to Children) and include matters such as care, supervision and emergency protection orders.
Care orders
A care order brings the child into the care of the applicant local authority and cannot be made in favour of any other party. The care order gives the local authority parental responsibility for the child and gives the local authority the power to determine the extent to which the child’s parents and others with parental responsibility (who do not lose their parental responsibility on the making of the order) may meet their responsibility. The making of a care order, with respect to a child who is the subject of any section 8 order (see page 47), discharges that order.
Supervision orders
A supervision order places the child under the supervision of the local authority or probation officer. While a supervision order is in force, it is the duty of the supervisor to advise, assist and befriend the child and take the necessary action to give effect to the order, including whether or not to apply for its variation or discharge.
Emergency Protection Orders
An emergency protection order is used to secure the immediate safety of a child by removing the child to a place of safety, or by preventing the child’s removal from a place of safety. Anyone, including a local authority, can apply for an emergency protection order if, for example, they believe that access to the child is being unreasonably refused.
Under the relevant allocation of proceedings rules for family law, public law cases must start in the Family Proceedings Courts but may be transferred to the county courts in the following circumstances:
to minimise delay •
to consolidate with other family proceedings •
where the matter is exceptionally grave, complex or important •

Judicial and Court Statistics 2009 | Chapter 2
46
In 2009, there were 25,810 children were involved in public law applications, an increase of 31 per cent compared with 2008 (19,760), and a significant reversal of the recent downward trend (Table 2.1). This increasing trend in children-related applications received by the family courts began towards the end of 2008.
Within this, between 2008 and 2009, there were increases in the number of applications for care orders (45 per cent), emergency protection orders (26 per cent), and supervision orders (28 per cent) – see Table 2.3.
Children involved in Public Law applications, by tier of court, 2005-2009
Public law application statistics are shown in Tables 2.1 to 2.3.
0
5,000
10,000
15,000
20,000
25,000
30,000
20092005 2006 2007 2008
Number of children involved
Family Proceedings Courts County Courts High Courts

Judicial and Court Statistics 2009 | Chapter 2
47
Matters affecting children: Private Law applications
Private law cases are those brought by private individuals, generally in connection with divorce or the parents’ separation. Order types include parental responsibility, “Section 8” orders (referring to the relevant section of the Children Act 1989), financial applications and special guardianship orders.
Parental responsibility
Section 3(1) of the Children Act 1989 defines parental responsibility as “all the rights, duties, powers, responsibilities and authority which by law a parent of a child has in relation to the child and his property”. Parental responsibility allows parents to make important decisions about their children’s lives.
Section 8 orders include
residence – settles where the child should live and can be made in favour of •anyone except a local authority. A residence order also gives the person named in the order parental responsibility for the child.
contact – this order requires the person with whom the child lives to allow •the child to have contact with the person named on the order. It can be granted to anyone except a local authority.
prohibited steps – this order can be used to direct someone not to take •specific action in relation to the child without the consent of the court. It could be used, for example, to stop a parent from moving the child to another country.
specific issue – this order determines specific aspects as to the child’s •upbringing, for example, which religion s/he should be brought up in.
Special Guardianship
The Adoption and Children Act 2002 introduced special guardianship orders, which give the special guardian legal parental responsibility for the child without taking away parental responsibility from the birth parents. This means that the child is no longer the responsibility of the local authority. The special guardian takes responsibility for all the day to day decisions and only needs to consult with the birth parents in exceptional circumstances.
In 2009, there were 137,480 children involved in private law applications, an increase of 14 per cent compared with 2008 when there were 120,500. It is a considerably larger annual increase than seen in recent years, and continues the upward trend seen from 2005 (Table 2.1).
Within the overall figures for 2009, applications for contact orders increased by 23 per cent, applications for prohibited steps orders increased by 15 per cent, and applications for residence increased by 11 per cent, compared to 2008 (Table 2.3).

Judicial and Court Statistics 2009 | Chapter 2
48
Private law application statistics are shown in Tables 2.1 to 2.3.
Disposal of Public and Private Law applications
There are four ways in which an order can be disposed of:
withdrawn applications – applications can only be withdrawn by order of the •court
order refused – in public law proceedings an order is refused if the grounds •are not proved and the court has dismissed the application. In private law proceedings the court may refuse to make an order or make an order of no order
order of no order – this is made if the court has applied the principle of non- •intervention under section 1(5) of the Act. This provides that the court shall not make an order unless it considers that doing so would be better for the child than not making an order at all
order made. •
In 2009, there were 20,950 children involved in disposals of public law cases, a decrease of 15 per cent from 2008. Nearly a third of all the public law disposals were for care orders (6,240).
Children involved in Private Law applications, by tier of court, 2005-2009
140,000
0
20,000
40,000
60,000
80,000
100,000
120,000
20092005 2006 2007 2008
Number of children involved
Family Proceedings Courts County Courts High Courts

Judicial and Court Statistics 2009 | Chapter 2
49
In contrast to public law cases, there was a 16 per cent increase in the number of children involved in disposals of private law cases – from 133,960 to 155,470 between 2008 and 2009. The majority of these disposals were for contact orders (95,240).
Public and Private law disposal statistics are shown in Table 2.4.
Matrimonial matters
There are two ways to dissolve a marriage. The vast majority is with a decree absolute of divorce, which ends a valid marriage. The other is a decree of nullity, which declares that the marriage itself is void, i.e. no valid marriage ever existed, or voidable, i.e. the marriage was valid unless annulled. No petition may be made for divorce within the first year of marriage.
Divorce
To obtain a decree of divorce the marriage must be proved to have broken down irretrievably. This must be done on proof of one or more of the following facts:
(a) adultery
(b) behaviour with which the petitioner cannot reasonably be expected to live
(c) desertion of at least two years
(d) two years separation where the respondent consents
(e) five years separation without consent.
Nullity
A void marriage is one that is legally invalid because, for example:
(a) either party was under the age of sixteen at the time of the marriage
(b) either party was already married
(c) the parties are prohibited from marrying, for example father and daughter.
Examples of voidable marriages are those:
(a) not consummated due to incapacity or wilful refusal (most nullities are on these grounds)
(b) where one party was suffering from a venereal disease in a communicable form, or was pregnant by someone else at the time of marriage.

Judicial and Court Statistics 2009 | Chapter 2
50
There were 132,140 petitions filed for dissolution of marriage in 2009; an increase of three per cent compared to 2008 and a reversal of the recent downward trend seen since 2005 (Table 2.5).
However, the number of decrees absolute granted for dissolution of marriage decreased by five per cent, from 122,660 in 2008 to 116,580 in 2009.
Statistics on the number of divorces occurring each year in England and Wales are also published by the Office for National Statistics. Please see Annex A for more explanation of the differences between the ONS figures and the statistics presented here.
Judicial Separation
An alternative to divorce is a decree of judicial separation. This does not dissolve the marriage but absolves the parties from the obligation to live together. This procedure might, for instance, be used if religious beliefs forbid or discourage divorce.
In 2009 there were 360 petitions filed for judicial separation, a decrease of 14 per cent compared with the previous year, and continuing the steady downward trend.
Table 2.5 shows summary statistics on matrimonial proceedings from 2005 to 2009.
Dissolution of Marriage: Decrees Absolute Granted, 2005-2009
0
20,000
40,000
60,000
80,000
100,000
120,000
140,000
160,000
180,000
200,000
20092005 2006 2007 2008
Number of cases

Judicial and Court Statistics 2009 | Chapter 2
51
Ancillary relief
During or after a divorce, the annulment of a marriage (nullity) or judicial separation, there may still be a need for the court to settle disputes over money or property. The court can make a financial order. This is known as ancillary relief and may deal with the sale or transfer of property, maintenance payments (for example weekly or monthly maintenance), a lump sum payment and/or a pension sharing or attachment order.
Ancillary relief figures presented in this volume are not directly comparable to those previously published due to a change in the methodology to allow duplicate records to be removed. Please see Annex A for further details.
In 2009 a total of 79,880 applications for ancillary relief were disposed of, down 12 per cent from the 90,560 recorded for 2008, and continuing the downward trend from 2006. Of the disposals made in 2009, the majority (73 per cent) were not contested (Table 2.6), while a further 21 per cent of orders were made by consent after initially being contested. Most disposals made in 2009 were for property adjustment orders (25,590) or lump sum orders (24,370).
Just over half of those cases which were contested or initially contested were in respect of one or more children (Table 2.7).
The numbers of disposals for ancillary relief applications are shown in Tables 2.6 and 2.7.
Other orders for financial provision are not dependent upon divorce proceedings and may be made for children.
The Child maintenance and Other Payments Act 2008 led to the creation of the Child Maintenance Enforcement Commission (CMEC) which replaced the Child Support Agency (CSA), although the CSA retained its existing caseload. The Act also removed the requirement for all parents in receipt of benefit to go through the CMEC even if they could reach agreement. Parents who were not on benefit were previously allowed to come to courts for consent orders. This change is likely to increase the number of parties that come to court for maintenance consent orders.
Domestic violence
Part IV of the Family Law Act 1996 provides single and unified domestic violence remedies in county courts and magistrates’ courts, with the vast majority carried out in the former. A range of people can apply to the court: spouses, cohabitants, ex-cohabitants, those who live or have lived in the same household (other than by reason of one of them being the other’s employee, tenant, lodger or boarder), certain relatives (e.g. parents, grandparents, in-laws, brothers, sisters), and those who have agreed to marry one another.

Judicial and Court Statistics 2009 | Chapter 2
52
Two types of order can be granted:
a non-molestation order, which can either prohibit particular behaviour or •general molestation;
an occupation order, which can define or regulate rights of occupation of the •home.
Where the court makes an occupation order and it appears to the court that the respondent has used or threatened violence against the applicant or child, then the court must attach a power of arrest unless it is satisfied that the applicant or child will be adequately protected without such a power. In July 2007, section 1 of the Domestic Violence, Crime and Victims Act 2004 came into force, making the breach of a non-molestation order a criminal offence. A power of arrest is therefore no longer required on a non-molestation order but instead includes a penal notice.
The court may also add an exclusion requirement to an emergency protection order or interim care order made under the Children Act 1989. This means a suspected abuser may be removed from the home, rather than the child.
Please note that the statistics presented in this report relate to applications for, and grants of, the above domestic violence order types by the family courts. They do not relate to prosecutions or convictions for criminal offences regarding matters of domestic violence, nor do they cover prosecutions or convictions for breaching a non-molestation order.
The Forced Marriage (Civil Protection) Act 2007 came into force on 25 November 2008. The Act amended Part IV of the Family Law Act to enable 15 designated county courts to make Forced Marriage Protection Orders to prevent forced marriages from occurring and to offer protection to victims who might have already been forced into a marriage. Statistics for these orders are not yet included.
Applications made in the county courts for domestic violence remedies increased by five per cent in 2009 compared with 2008; from 24,880 to 26,030 applications (Table 2.8).
Within this overall increase, applications for non-molestation orders increased by 10 per cent (from 17,140 to 18,900), while applications for occupation orders decreased by eight per cent (from 7,740 to 7,120).
A total of 24,870 domestic violence orders were made in county courts in 2009, an increase of two per cent from the 24,420 made in 2008 (Table 2.9). As the breach of a non-molestation order was made a criminal and arrestable offence from July 2007, with the power of arrest inherent within it, it became no longer necessary for courts to attach a separate power of arrest to these orders.
Statistics on domestic violence orders are shown in Tables 2.8 and 2.9.

Judicial and Court Statistics 2009 | Chapter 2
53
Probate
The Probate Service forms part of the Family Division of the High Court. It deals with ‘non-contentious’ probate business (i.e. where there is no dispute about the validity of a will or entitlement to take a grant), and issues grants of representation – either probate (when the deceased person left a valid will) or letters of administration (usually when there is no valid will). These grants appoint people – known as personal representatives – to administer the deceased person’s estate.
The Probate Service is currently made up of the Principal Registry in London, 11 District Probate Registries and 18 Probate Sub-Registries throughout England and Wales. There are also a number of Probate offices which are opened between once a week and once every two months to provide a local service for personal applicants.
In 2009, 254,160 grants of representation were issued; down from the 267,480 grants issued in 2008, and 18 per cent down from the peak of 311,130 seen in 2006.
In 2009, 89,650 of the grants were personal applications and 164,520 were made by solicitors. In 83 per cent of all cases for 2009 (211,470) the deceased left a will.
Summary caseload statistics for the Probate service are shown in Tables 2.10 and 2.11.

Judicial and Court Statistics 2009 | Chapter 2
54
Table 2.1Family mattersMatters affecting children: Number of children involved in Public and Private Law applications, made in each tier of court, 2005 to 2009 1, 2
Number of children
Year
Public law Private law 4
FPC 3, 6 CC HC Total FPC 3, 6 CC HC Total
2005 15,830 6,390r 450r 22,660r 15,820 93,300r 1,210r 110,330r2006 13,660 6,500r 360r 20,510r 16,410 93,920r 1,180r 111,510r2007 13,640 5,630r 380r 19,650r 19,190 94,650r 1,000r 114,840r2008 14,200r 5,180r 380r 19,760r 18,040r 101,440r 1,020r 120,500r2009 19,760r 5,770r 290r 25,810r 27,670r 108,670r 1,150r 137,480r
Source:HMCS FamilyMan system and summary returnsNotes:Abbreviations: FPC = Family Proceedings Court, CC = county court, HC = High Court1 Figures relate to the number of children subject to each application 2 A new compilation methodology has been introduced for the public and private law applications data for 2008 onwards
and previously - published statistics for 2008 and 2009 have been revised as a result. Please see Annex A for more details3 There are known data quality problems with the figures for the Family Proceedings Courts. A new data collection method,
introduced in April 2007, has made some improvements to the completeness of data4 Private Law applications exclude adoptions5 Figures have been rounded to the nearest ten. Figures under 5 are marked with an asterisk. Totals may not add up due to
rounding6 Special Guardianship Orders figures in the Family Proceedings Courts are only available for those courts which share
premises and administrative systems with county courts. The total has therefore been estimated based on the proportion of the total public law and private law applications made in each tier of court

Judicial and Court Statistics 2009 | Chapter 2
55
Table 2.2Family mattersMatters affecting children: Number of children involved in Public and Private Law applications, made in each tier of court by HMCS region, 2009 1, 2
Number of children
Region
Public law Private law 4
FPC 3, 6 CC 6 HC Total FPC 3, 6 CC HC Total
London 2,950 610 50 3,610 1,880 16,570 550 19,000Midlands 3,470 780 60 4,310 7,700 15,650 100 23,450North East 3,570 870 30 4,470 3,540 18,800 100 22,440North West 2,700 1,210 50 3,960 4,560 15,750 80 20,390South East 3,520 1,180 20 4,720 3,200 23,260 170 26,630South West 2,120 780 60 2,960 3,360 13,920 140 17,420Wales 1,420 340 20 1,780 3,420 4,720 10 8,150
England & Wales
19,760 5,770 290 25,810 27,670 108,670 1,150 137,480
Source:HMCS FamilyMan system and summary returnsNotes:Abbreviations: FPC = Family Proceedings Court, CC = county court, HC = High Court1 Figures relate to the number of children subject to each application2 A new compilation methodology has been introduced for the public and private law applications data for 2008 onwards and previously -
published statistics for 2008 and 2009 have been revised as a result. Please see Annex A for more details3 There are known data quality problems with the figures for the Family Proceedings Courts. A new data collection method, introduced in
April 2007, has made some improvements to the completeness of data4 Private Law applications exclude adoptions5 Figures have been rounded to the nearest ten. Figures under 5 are marked with an asterisk. Totals may not add up due to rounding6 Special Guardianship Orders figures in the Family Proceedings Courts are only available for those courts which share premises and
administrative systems with county courts. The total has therefore been estimated based on the proportion of the total public law and private law applications made in each tier of court

Judicial and Court Statistics 2009 | Chapter 2
56
Table 2.3Family mattersMatters affecting children: Number of children involved in applications made, by whether Private or Public law, type and tier of court, 2009 1,2
Number of children
Application type
Public Law Private Law
FPC 3, 6 CC HC Total 2%
Change 4 FPC 3, 6 CC HC Total 2%
Change 4
Secure accommodation 350 60 * 410 6% - - - - -
Care 14,770 2,220 100 17,090 45% - - - - -
Discharge of care 280 890 0 1,160 -9% - - - - -
Substitute Supervision Order for a Care Order 20 0 0 20 - - - - - -
Supervision order 680 270 10 950 28% - - - - -
Supervision order – discharge 10 * 0 10 - - - - - -
Contact with a child in care 270 450 30 750 30% - - - - -
Authority to refuse Contact with a child in care 140 320 50 510 5% - - - - -
Education Supervision 240 0 0 240 14% - - - - -
Child assessment orders 40 30 0 60 28% - - - - -
Emergency protection order 2,140 50 10 2,190 26% - - - - -
Extension of emergency protection order 100 * 0 100 24% - - - - -
Discharge of emergency protection order 0 * 0 * - - - - - -
Recovery orders 120 70 10 200 -9% - - - - -
Parental responsibility 50 150 10 200 9% 3,190 6,580 30 9,790 0%
Section 8
Residence 200 470 20 700 -2% 7,580 36,840 340 44,770 11%
Contact 250 640 40 930 -5% 14,020 38,700 300 53,020 23%
Prohibited steps 20 40 * 60 18% 1,260 16,690 240 18,190 15%
Specific issue 40 100 10 150 -33% 1,040 8,040 210 9,300 0%
Financial applications - - - - - 300 750 20 1,070 -5%
Special Guardianship Orders 6 60 20 0 80 61% 270 1,060 10 1,340 23%
Total 19,760 5,770 290 25,810 31% 27,670 108,670 1,150 137,480 14%
Source:HMCS FamilyMan system and summary returnsNotes:Abbreviations: FPC = Family Proceedings Court, CC = county court, HC = High Court1 Figures relate to the number of children subject to each application2 A new compilation methodology has been introduced for the public and private law applications data for 2008 onwards and previously - published statistics
for 2008 and 2009 have been revised as a result. Please see Annex A for more details3 There are known data quality problems with the figures for the Family Proceedings Courts. A new data collection method, introduced in April 2007, has made
some improvements to the completeness of data4 Compared with revised 2008 figures, and based on unrounded data. Percentage changes are not provided where there are less than 20 observations in either
period5 Figures have been rounded to the nearest ten. Figures under 5 are marked with an asterisk. Totals may not add up due to rounding6 Special Guardianship Orders figures in the Family Proceedings Courts are only available for those courts which share premises and administrative systems with
county courts. The total has therefore been estimated based on the proportion of the total public law and private law applications made in each tier of court

Judicial and Court Statistics 2009 | Chapter 2
57
Tabl
e 2.
4Fa
mily
mat
ters
Mat
ters
affe
ctin
g ch
ildre
n: N
umve
r of c
hild
ren
in d
ispos
als i
n al
l tie
rs o
f cou
rt, b
y ty
pe o
f disp
osal
and
whe
ther
Priv
ate
or P
ublic
law
, 200
9 1,2
Num
ber o
f chi
ldre
n
Ord
er ty
pe
Publ
ic L
awPr
ivat
e La
w
Type
of d
ispos
al
Tota
l di
spos
als 3,
4,5
Type
of d
ispos
al
Tota
l di
spos
als 3,
4,5
Appl
icat
ions
w
ithdr
awn
Ord
ers
refu
sed
Ord
ers o
f no
ord
ers
Ord
ers
mad
eAp
plic
atio
ns
with
draw
nO
rder
s re
fuse
dO
rder
s of
no o
rder
sO
rder
s m
ade
Secu
re a
ccom
mod
atio
n30
10*
660
700
- -
- -
-
Care
270
2023
05,
720
6,24
0 -
- -
- -
Disc
harg
e of
car
e10
010
1061
073
0 -
- -
- -
Subs
titut
e Su
perv
ision
Ord
er fo
r a C
are
Ord
er0
00
8080
- -
- -
-
Supe
rvisi
on o
rder
10*
102,
780
2,80
0 -
- -
- -
Supe
rvisi
on o
rder
– d
ischa
rge
00
00
0 -
- -
- -
Cont
act w
ith a
chi
ld in
car
e80
1020
310
410
- -
- -
-
Auth
ority
to re
fuse
Con
tact
with
a ch
ild in
care
2010
*50
052
0 -
- -
- -
Educ
atio
n Su
perv
ision
100
022
023
0 -
- -
- -
Child
ass
essm
ent o
rder
s*
00
2030
- -
- -
-
Emer
genc
y pr
otec
tion
orde
r28
050
201,
380
1,73
0 -
- -
- -
Exte
nsio
n of
em
erge
ncy
prot
ectio
n or
der
*0
*13
013
0 -
- -
- -
Disc
harg
e of
em
erge
ncy
prot
ectio
n or
der
00
00
0 -
- -
- -

Judicial and Court Statistics 2009 | Chapter 2
58
Reco
very
ord
ers
10*
028
029
0 -
- -
- -
Pare
ntal
resp
onsib
ility
00
067
067
045
070
807,
650
8,25
0
Sect
ion
8
Resid
ence
3010
*2,
290
2,32
01,
220
140
400
28,1
6029
,920
Cont
act
8020
302,
420
2,54
02,
250
310
790
91,8
9095
,240
Proh
ibite
d st
eps
*0
043
044
041
060
150
14,6
5015
,260
Spec
ific
issue
10*
019
020
026
020
805,
020
5,39
0
Fina
ncia
l app
licat
ions
00
00
070
1010
620
700
Spec
ial G
uard
ians
hip
Ord
ers 4
00
089
089
010
0*
700
720
Tota
l92
013
032
019
,570
20,9
504,
680
610
1,50
014
8,68
015
5,47
0
Sour
ce:
HM
CS F
amily
Man
sys
tem
and
sum
mar
y re
turn
sN
otes
:1
Figu
res
rela
te to
the
num
ber o
f chi
ldre
n su
bjec
t to
each
app
licat
ion
2 Th
e nu
mbe
r of d
ispo
sals
sho
wn
in th
e ta
ble
abov
e ar
e no
t equ
al to
the
corr
espo
ndin
g nu
mbe
r of a
pplic
atio
ns m
ade
durin
g th
e ye
ar, b
ecau
se:
– di
spos
als
in 2
009
may
rela
te to
app
licat
ions
mad
e in
ear
lier y
ears
, and
– an
app
licat
ion
of o
ne ty
pe m
ay le
ad to
an
orde
r of a
diff
eren
t typ
e be
ing
mad
e3
Ther
e ar
e kn
own
data
qua
lity
prob
lem
s with
the
figur
es fo
r the
Fam
ily P
roce
edin
gs C
ourt
s. A
new
dat
a co
llect
ion
met
hod,
intr
oduc
ed in
Apr
il 20
07, h
as m
ade
som
e im
prov
emen
ts to
the
com
plet
enes
s of d
ata
4 Sp
ecia
l Gua
rdia
nshi
p O
rder
s figu
res
in th
e Fa
mily
Pro
ceed
ings
Cou
rts
are
only
ava
ilabl
e fo
r tho
se c
ourt
s whi
ch s
hare
pre
mis
es a
nd a
dmin
istr
ativ
e sy
stem
s with
cou
nty
cour
ts. T
he to
tal h
as th
eref
ore
been
est
imat
ed b
ased
on
the
prop
ortio
n of
the
tota
l pub
lic la
w a
nd p
rivat
e la
w a
pplic
atio
ns m
ade
in e
ach
tier o
f cou
rt5
Figu
res
have
bee
n ro
unde
d to
the
near
est t
en. F
igur
es u
nder
5 a
re m
arke
d w
ith a
n as
teris
k. T
otal
s m
ay n
ot a
dd u
p du
e to
roun
ding
Tabl
e 2.
4 co
ntin
ued

Judicial and Court Statistics 2009 | Chapter 2
59
Table 2.5Family mattersSummary statistics on matrimonial proceedings, 2005 to 2009 1
Number of cases
2005 2006 2007 2 2008 2 2009 2 % Change 3
Dissolution of marriagePetition filed 150,424 147,236 136,187 128,837 132,144 3%Decrees nisi 141,144 135,233 132,987 120,868 119,244 -1%Decrees absolute 142,116 132,782 128,953 122,661 116,576 -5%
Nullity of marriagePetition filed 425 388 336 331 290 -12%Decrees nisi 257 239 189 214 197 -8%Decrees absolute 251 244 193 200 199 -1%
Judicial separationPetition filed 691 605 499 421 360 -14%Decrees granted 359 324 304 214 198 -7%
Source:HMCS FamilyMan systemNotes:1 More detailed statistics on divorces in England and Wales are available from the Office for National Statistics annual publication
“Marriage, Divorce and Adoption Statistics”. This publication is based on statistics compiled by the General Register Office 2 Figures from 2007 include dissolutions of civil partnerships 3 Compared with published 2008 figures

Judicial and Court Statistics 2009 | Chapter 2
60
Table 2.6Family mattersDisposal of applications for ancillary relief made in the county courts, by type and whether contested or uncontested, 20091
Number of disposals
Disposal Uncontested 2
Initially contested, subsequently
consented Contested Total
Periodical payments 8,806 2,467 808 12,081
Lump sum orders 18,361 4,899 1,110 24,370
Property adjustment orders 18,499 5,705 1,390 25,594
Pension sharing or attachment orders 7,059 1,746 413 9,218
Secure Provision Order 4,049 764 229 5,042
Maintenance pending suit 1,537 344 398 2,279
Application dismissed - 914 385 1,299
Total Disposals3 58,311 16,839 4,733 79,883
Source:HMCS FamilyMan systemNotes:1 Figures are not directly comparable to those previously published due to duplicate records being removed. Please see Annex A for further
details 2 Uncontested applications do not have a court hearing3 Figures relate to the number of disposals for each type of ancillary relief order. One case may include more than one type of ancillary relief

Judicial and Court Statistics 2009 | Chapter 2
61
Table 2.7Family mattersDisposal of applications for ancillary relief made in county courts, by whether or not application made in respect of a child, 2009 1,2
Number of disposals
DisposalIn respect of
child(ren)Not in respect of
child(ren) Total
Periodical payments 2,334 941 3,275Lump sum orders 2,813 3,196 6,009Property adjustment orders 3,580 3,515 7,095Pension sharing or attachment orders 966 1,193 2,159Secure Provision Order 360 633 993Maintenance pending suit 345 397 742Application dismissed 613 686 1,299
Total Disposals 3 11,011 10,561 21,572
Source:HMCS FamilyMan systemNotes:1 Figures are not directly comparable to those previously published due to duplicate records being removed.
Please see Annex A for further details 2 Figures include contested and initially contested cases only3 Figures relate to the number of disposals for each type of ancillary relief order. One case may include more
than one type of ancillary relief

Judicial and Court Statistics 2009 | Chapter 2
62
Table 2.8Family mattersDomestic violence: Applications made in the county courts, 2005 to 2009 1, 2
Number of applications
Year
Non-molestation Applications Occupation Applications Total Applications
Ex parte On notice Total Ex parte On notice Total Ex parte On notice Total
2005 13,035 4,297 17,332 6,880 3,162 10,042 19,915 7,459 27,3742006 13,041 3,844 16,885 6,555 2,829 9,384 19,596 6,673 26,2692007 12,402 3,469 15,871 5,842 2,509 8,351 18,244 5,978 24,2222008 13,888 3,253 17,141 5,392 2,346 7,738 19,280 5,599 24,8792009 15,538 3,365 18,903 4,921 2,203 7,124 20,459 5,568 26,027
Source:HMCS FamilyMan systemNotes:1 Applications for arrest warrants not included2 Does not include applications made in Family Proceedings Courts
Table 2.9Family CourtsDomestic violence: Orders made in the county courts, 2005 to 2009 1
Number of orders
Year
Non-molestation Orders2 Occupation Orders Total Orders
With power of arrest attached
Without power
of arrest attached Total
With power of arrest attached
Without power
of arrest attached Total
With power of arrest attached
Without power
of arrest attached Total
2005 21,649 1,202 22,851 8,078 807 8,885 29,727 2,009 31,736
2006 20,860 1,160 22,020 7,283 696 7,979 28,143 1,856 29,999
2007 2 13,352r 6,468r 19,820r 5,647 1,298 6,945 18,999r 7,766r 26,765r
2008 19,367 3,375 1,724 5,099 24,466
2009 20,662 2,616 1,587 4,203 24,865
Source:HMCS FamilyMan systemNotes:1 Does not include orders made in Family Proceedings Courts 2 The Domestic Violence, Crime and Victims Act 2004 made breach of a non-molestation order a criminal and arrestable offence as of July
2007, making it no longer necessary for courts to attach a power of arrest to non-molestation orders

Judicial and Court Statistics 2009 | Chapter 2
63
Table 2.10The Probate ServiceGrants of representation in non-contentious probate proceedings issued, re-sealed and revoked, by type of application and type of registry, 2009
Number of cases
On personal Application
On Application
by Solicitors Total
Grants issued 1
ProbatesPrincipal Registry 10,022 3,132 13,154District Probate Registries 56,829 126,262 183,091
Letters of Administration with will annexedPrincipal Registry 780 280 1,060District Probate Registries 3,874 10,289 14,163
Letters of AdministrationPrincipal Registry 2,956 1,328 4,284District Probate Registries 15,188 23,224 38,412
Total grants issued 89,649 164,515 254,164
Grants Revoked - - 524
Grants re-sealed 40 129 169
Standing Searches 2 - - 12,712
Source:The Probate ServiceNotes:1 Grants are awarded in the following circumstances
Probate – when the deceased person left a valid will and an executor is actingLetters of administration with will annexed – when a person has left a valid will but no executor is actingLetters of administration – usually when there is no valid will
2 The figures on standing searches are not comparable to figures up to 2006 due to improved recording from 2007

Judicial and Court Statistics 2009 | Chapter 2
64
Table 2.11The Probate ServiceSummary statistics on grants of representation issued, and contentious probate cases, England and Wales, 2005 to 2009
Number of cases
2005 2006 2007 2008 2009
Grants of representation 1
Numbers
Probate 198,363 196,748 195,084 200,082 196,245
Letter of administration with will annexed 13,683 14,172 14,398 14,888 15,223
Letter of Administration 87,169 100,207 76,693 52,510 42,696
Percentages (of all grants)
Probate 66.3% 63.2% 68.2% 74.8% 77.2%
Letter of administration with will annexed 4.6% 4.6% 5.0% 5.6% 6.0%
Letter of Administration 29.1% 32.2% 26.8% 19.6% 16.8%
Total grants of representation 299,215 311,127 286,175 267,480 254,164
Contested probate cases 2 115 73 185 106 152
Source:The Probate ServiceNotes:1 Grants are awarded in the following circumstances:
Probate – when the deceased person left a valid will and an executor is actingLetters of administration with will annexed – when a person has left a valid will but no executor is actingLetters of administration – usually when there is no valid will
2 Where a probate case is contested, the Chancery Division of the High Court deals with the matter

Magistrates’ courts
Chapter 3

Judicial and Court Statistics 2009 | Chapter 3
66
Chapter 3: Magistrates’ Courts
This chapter refers to criminal proceedings in the magistrates’ courts. Information on family proceedings can be found in Chapter 2.
Virtually all criminal court cases start in the magistrates’ courts. The less serious offences are handled entirely in magistrates’ courts, with over 90 per cent of all cases being dealt with in this way. The more serious offences are passed on to the Crown Court, either for sentencing after the defendant has been found guilty in the magistrates’ court, or for full trial with a judge and jury. More information on cases passed on to the Crown Court can be found in Chapter 4.
Magistrates deal with three kinds of cases:
Summary offences. These are less serious cases, such as motoring offences •and minor assaults, where the defendant is not usually entitled to trial by jury. They are generally disposed of in the magistrates’ courts.
Either-way offences. As the name implies, these can be dealt with either by •the magistrates or before a judge and jury at the Crown Court. Such offences include theft and handling stolen goods. A defendant can insist on their right to trial in the Crown Court. Similarly, magistrates can decide that a case is sufficiently serious that it should be dealt with in the Crown Court - which can impose tougher sentences if the defendant is found guilty.
Indictable-only offences, such as murder, manslaughter, rape and robbery. •These must be heard at a Crown Court.
If the case is an indictable-only offence, the involvement of the magistrates’ court is generally brief. A decision will be made on whether to grant bail, and other legal issues such as reporting restrictions will be considered. The case will then be passed to the Crown Court.
If the case is to be dealt with in the magistrates’ court, the defendant(s) are asked to enter a plea. If they plead guilty or are later found to be guilty, the magistrates can impose a sentence, generally of up to six months’ imprisonment, or a fine, generally of up to £5,000. If found not guilty (‘acquitted’), defendants are judged innocent in the eyes of the law and will be free to go – provided there are no other cases against them outstanding.
Cases are either heard by two or three lay magistrates or by one district judge. The lay magistrates, or ‘Justices of the Peace’, as they are also known, are local people who volunteer their services. They do not require formal legal qualifications, but will have undertaken a training programme, including court and prison visits, to develop the necessary skills. They are given legal and
Judicial and Court Statistics 2009 | Chapter 3
67
procedural advice by qualified clerks. On the other hand, district judges are legally qualified, paid, full-time professionals and are usually based in the larger cities. They normally hear the more complex or sensitive cases.
As of April 2009, there are approximately 30,000 magistrates, 130 district judges and 170 deputy district judges operating in the roughly 330 magistrates’ courts throughout England & Wales.
Information on the data sources used for the magistrates’ courts statistics can be found in Annex A. Explanations for some of the main terms used in this section can be found in the Glossary. The tables of detailed data can be found immediately following this section of commentary.
Key findings for 2009
An estimated 1.79 million defendants were proceeded against in criminal •cases in the magistrates’ courts in 2009 (excluding breaches), a fall compared to the 1.92 million defendants in 2008. (NB these figures are not directly comparable with those prior to 2008 as a different data source has been used).
180,000 trials were recorded in the magistrates’ courts in 2009 (down from •184,000 in 2008). Of those trials, 38 per cent were recorded as cracked (unchanged from 2008), with 19 per cent recorded as ineffective (up from 18 per cent in 2008).
The estimated average time taken from offence to completion in 2009 was •141 days for defendants in completed criminal cases in magistrates’ courts (down from 143 days in 2008).
The estimated average time taken from charge to completion in 2009 for •adult charged cases, excluding cases sent or committed to the Crown Court, was 6.9 weeks (down from 7.0 weeks in 2008).
The estimated average number of hearings per case was 2.27 hearings (down •from 2.38 hearings in 2008).
Enforcement of financial penalties: the amount paid in England and Wales in •2009 was £251 million, unchanged from 2008.
Defendants Proceeded Against
Data since 2008 are derived from the HMCS Performance Database ‘OPT’ whereas earlier years’ data came from the OCJR Court Proceedings Database. These data sets are not identical, and cannot be directly compared. Therefore no comparison to earlier years is made in this section on caseload, and no data for years prior to 2008 are included in Table 3.1a or 3.1b.
An estimated 1.79 million defendants were proceeded against for criminal offences (excluding breaches) in magistrates’ courts during 2009, a decrease of seven per cent since 2008. However, not all criminal offences reach the

Judicial and Court Statistics 2009 | Chapter 3
68
magistrates’ courts, as there has been an increasing use of out-of-court disposals, such as cautions and penalty notices for disorder in recent years.
There were 420,000 defendants in adult indictable / triable-either-way cases; this represents just under a quarter (23 per cent) of defendants in criminal cases. The number in adult summary non-motoring cases was 571,000, comprising 32 per cent of defendants. Adult summary motoring cases constituted the largest group with 644,000 defendants (36 per cent). There were 156,000 youth defendants, representing nine per cent of all defendants in criminal cases.
Since 2008, the number of adult indictable or triable-either-way cases and adult summary non-motoring cases has fallen by seven per cent. Adult summary motoring cases have fallen by eight per cent while youth cases has remained unchanged.
These statistics consider cases completed in magistrates’ courts, and are case-based, so where a case has more than one offence, only the most serious offence is counted.
Statistics on defendants proceeded against in magistrates’ courts are shown in Tables 3.1a, 3.1b and 3.2.
Defendants proceeding against in magistrates’ courts, by offence type, 2009
Adult Summary Motoring
36%
Adult Summary Non-Motoring
32%
Adult Indictable/
Triable either way23%
Youth cases9%

Judicial and Court Statistics 2009 | Chapter 3
69
Trials
A trial in the magistrates’ court is a hearing at which the prosecution produces evidence to prove the case against the defendant. If a defendant pleads not guilty, or does not give a plea for a summary offence, then there is a trial. Similarly, for either-way offences, a trial may occur in the magistrates’ courts.
Magistrates’ courts record the number and outcome of trials. Trial outcomes are listed as ‘Effective’, ‘Ineffective’ or ‘Cracked’, according to the following definitions:
Effective Trial – A trial that commences on the day it is scheduled, and has an outcome in that a verdict is reached or the case is concluded.
Cracked Trial – On the trial date no further trial time is required and the case is closed. This maybe be because the defendant offers acceptable pleas or the prosecution offers no evidence
Ineffective Trial – On the trial date, the trial does not go ahead due to action or inaction by one or more of the prosecution, the defence or the court and a further listing for trial is required.
If a trial was recorded as either ineffective or cracked, the main reason why the trial did not take place is also recorded. Efficient case progression and good inter-agency communication will lead to higher numbers of effective trials and lower numbers of ineffective and cracked trials. Ineffective and cracked trials waste court time, create additional costs to the justice system and cause inconvenience and delay to witnesses and other court users; therefore this is an important measure for court management.
In 2009, 180,000 trials were recorded in the magistrates’ courts, compared to 184,000 in 2008 (a two per cent decrease). Of the total trials, 43 per cent were recorded as effective, 38 per cent were recorded as cracked, with 19 per cent recorded as ineffective.

Judicial and Court Statistics 2009 | Chapter 3
70
The proportion of cracked trials has remained fairly constant over the last five years. In 2009, 56 per cent of cracked trials (21 per cent of all trials) were cracked due to a late guilty plea being accepted, and 34 per cent of cracked trials (13 per cent of all trials) were cracked due to the prosecution ending the case.
Number of trials in magistrates’ courts by outcome, 2005-2009
Cracked trials: reasons for cracked trials in 2009
0
50,000
100,000
150,000
200,000
20092005 2006 2007 2008
Number of trials
Total cracked trials Total ineffective trials Total effective
Guilty plea to alternative new
charge7%
Prosecutionended case
34%
Late guilty plea accepted
56%
Defendant boundover2%

Judicial and Court Statistics 2009 | Chapter 3
71
The proportion of ineffective trials increased by one percentage point in 2009. The main reasons for ineffective trials in 2009 included absence of defendant (21 per cent of all ineffective trials, four per cent of all trials) and absence of prosecution witness (19 per cent of all ineffective trials, three per cent of all trials).
Statistics on trials in magistrates’ courts are shown in Tables 3.3, 3.4a, 3.4b, 3.5a and 3.5b.
Timeliness
One way in which the efficiency of the magistrates’ courts can be measured is through the timeliness of cases proceeded against in the magistrates’ courts. Information on the average time taken between stages of proceedings for defendants in completed criminal cases in magistrates’ courts is available from the Time Intervals Survey.
Information on completed adult indictable/ triable-either-way cases and charged summary cases is collected over one week in the final month of each calendar quarter. Information on completed adult summonsed summary offences is additionally collected in March and September surveys. Information on youth defendants in both indictable / triable-either-way and summary completed cases is collected in four weeks of each quarter.
Further information on the Time Intervals Survey can be found at: http://www.justice.gov.uk/publications/timeintervals.htm
Ineffective trials: reasons for ineffective trials in 2009
Defence not ready16%
Prosecution witnessabsent19%
Defence witnessabsent
4%
Other28%
Prosecution not ready11%
Defendant absent21%

Judicial and Court Statistics 2009 | Chapter 3
72
In 2009, the estimated average time taken from offence to completion in the magistrates’ courts was 141 days for all criminal cases. This compares 149 days in 2005, a six per cent reduction in the time taken to complete a case.
The estimated average time from offence to completion decreased by two days in 2009, from 143 days in 2008.
The estimated average time from offence to charge or laying of information was 85 days in 2009, a one-day increase from 2008. The estimated average time from charge/ laying of information to first listing was 31 days in 2009, a two-day decrease from 33 days in 2008. The estimated average time from first listing to completion in the magistrates’ courts in 2009 was 24 days, a two-day decrease from 26 days in 2008.
Average number of days for all criminal cases proceeded against in magistrates’ courts, by stage of proceedings, 2005-2009
0
20
40
60
80
100
120
140
160
20092005 2006 2007 2008
Average number of days
First listing to completionCharge or laying of information to first listingOffence to charge or laying of information

Judicial and Court Statistics 2009 | Chapter 3
73
The estimated average time between offence and completion for indictable/triable-either-way cases was 111 days in 2009, a one-day decrease from 112 days in 2008. For summary motoring cases the estimated average time taken between offence and completion was 162 days, a one-day decrease from 163 days in 2008. In 2009, there was an estimated average of 138 days between offence and completion for summary non-motoring cases, unchanged from 2008.
The estimated average time from an offence being committed and the charge/laying of information showed the greatest variation between offence groups. This is likely due to the nature of certain offences, and how they are reported and detected. In 2009, Fraud and Forgery cases were estimated to have the longest average time from offence to charge/laying of information of 325 days.
Sexual Offence cases took the second longest time on average between offence and charge/ laying of information at 274 days. Drunken Driving offences took, on average, the shortest time from offence to charge/laying of information at 15 days.
Compared to summary cases, indictable/triable-either-way cases took less time from charge or laying of information to first listing (an estimated 13 days, as opposed to 35 and 42 days for summary non-motoring and motoring cases respectively).
Average time by stage of proceedings – defendants in all criminal cases, 2009
0
20
40
60
80
100
120
140
160
180
Indictable/triable eitherway cases
Summary motoringcases
Summary non-motoring cases
All criminal cases
Average number of days
First listing to completionCharge or laying of information to first listingOffence to charge or laying of information

Judicial and Court Statistics 2009 | Chapter 3
74
However, indictable/triable-either-way cases took more time from first listing to completion (36 days as opposed to 17 and 22 days for summary non-motoring and motoring cases respectively).
The timeliness of adult charged cases, excluding cases sent or committed to the Crown Court, was targeted in the CJSSS initiative (Criminal Justice: Simple, Speedy, Summary), which was rolled out nationwide over 2007 and early 2008.
In 2009 the estimated average time from charge to completion for adult charged cases, excluding cases sent or committed to the Crown Court, was 6.9 weeks, a decrease from 7.0 weeks in 2008.
In 2009 the estimated average number of hearings per case was 2.27 hearings, a decrease from 2.38 hearings in 2008.
Since 2005, the average time from charge to completion for adult cases has fallen by 23 per cent and the average number of hearings by 22 per cent.
Statistics on the timeliness of cases in magistrates’ courts are shown in Tables 3.6, 3.7, 3.8 and 3.9.
Average time taken by offence group and stage of proceedings for defendants in all criminal cases, 2009
0 50 100 150 200 250 300
Fraud and forgery
Sexual Offences
Driving without due care
Other indictable offences
Indictable motoring offences
Failing to stop
Other summary motoring offences
All summary non-motoring cases
Violence against the person
Burglary
Drug Offences
Theft and handling stolen goods
Criminal Damage
Robbery
Drunken driving
Average number of days
Offence to charge or laying of informationCharge or laying of information to first listingFirst listing to completion
400350

Judicial and Court Statistics 2009 | Chapter 3
75
Persistent Young Offenders (Timeliness)
Previous editions of this report included statistics on the average number of days from arrest to sentence for Persistent Young Offenders (PYOs; those aged 10-17 who have been sentenced by any criminal court in the UK on three or more separate occasions for one or more recordable offences, and within three years of the last sentencing occasions is subsequently sentenced for a further recordable offence). These statistics monitored the PYO pledge, to halve the arrest to sentence time for this offender group, which was discontinued with effect from the end of 2008. As a result these statistics were discontinued with effect from that time and are therefore no longer included in this report.
Average time from charge to completion for adult charged cases, 2005-2009
Average number of hearings per defendant for adult charged cases, 2005-2009
0.0
2.0
4.0
6.0
8.0
10.0
Average number of weeks
2005 2006 2007 2008 2009
0.00
0.50
1.00
1.50
2.00
2.50
3.00
2005 2006 2007 2008 2009
Average number of hearings

Judicial and Court Statistics 2009 | Chapter 3
76
Enforcement
Fines are the most commonly used sentence in magistrates’ courts. The Courts Act 2003 provided a number of new enforcement sanctions (e.g. clamping, registration) which have since been subject to national rollout by HMCS, and which have contributed to the increase in the total value of fines paid in recent years.
The amount paid in England and Wales in 2009 was £251 million, a 0.2 per cent increase from the previous year. However since 2007, the amount paid has decreased by two per cent.
Statistics on enforcement of financial penalties in the magistrates’ courts are shown in Table 3.10.
Enforcement of financial penalties in the magistrates’ courts in England and Wales, 2005-2009
Amount Paid(£millions)
50
100
150
200
250
300
2005 2006 2007 2008 20090

Judicial and Court Statistics 2009 | Chapter 3
77
Table 3.1aMagistrates’ courtsNumber of defendants proceeded against in magistrates’courts, by offence type, England and Wales, 20091,2
Number of defendants
(in thousands)3
Total criminal offences (including breaches) 1,912.6Total criminal offences (excluding breaches) 1,791.3Adult Summary Motoring Proceedings 644.0Adult Summary non-Motoring Proceedings 571.3Adult Indictable/ Triable Either Way 420.4Youth Proceedings 155.6
Adult Breach Proceedings 121.3
Total other cases 974.1
Representation Orders 583.9Means Enquiries 266.3Civil & family cases 122.1Special Jurisdiction 1.9
Total number of defendants 2,886.8
Source:Completed Proceedings, HM Courts Service Performance Database (‘OPT’)Notes:1 The figures presented here are derived from a different data source (OPT) to previous bulletins and are
not therefore directly comparable with data from previous years2 In cases where a defendant appears at court in a case with more than one offence, only the offence
which has the heaviest penalty imposed is counted. Where the same penalty is imposed for two or more offences, the offence counted is the one that attracts the statutory maximum penalty. In instances where the same individual appears in multiple cases, these are recorded here as multiple defendants
3 Number of defendants are presented in thousands (000s) in the table. For example, 1,791 thousand defendants is equivalent to 1.79 million defendants

Judicial and Court Statistics 2009 | Chapter 3
78
Tabl
e 3.
1bM
agis
trat
es’ c
ourt
sN
umbe
r of d
efen
dant
s pr
ocee
ded
agai
nst i
n m
agis
trat
es’c
ourt
s, by
off
ence
type
, Eng
land
and
Wal
es, 2
008-
2009
1,2
Num
ber o
f def
enda
nts
(in th
ousa
nds)
3
Year
Tota
l cr
imin
al
offe
nces
Crim
inal
cas
esO
ther
cas
esTo
tal
Adul
t Su
mm
ary
Mot
orin
g Pr
ocee
ding
s
Adul
t Su
mm
ary
non-
Mot
orin
g Pr
ocee
ding
s
Adul
t In
dict
able
/ Tr
iabl
e Ei
ther
Way
Adul
t Bre
ach
Proc
eedi
ngs
Yout
h Pr
ocee
ding
sTo
tal o
ther
ca
ses
Repr
esen
tatio
n O
rder
sM
eans
En
quiri
esCi
vil &
fa
mily
cas
esSp
ecia
l Ju
risdi
ctio
n
Tota
l nu
mbe
r of
defe
ndan
ts
2008
2,0
31
696
6
13
450
1
16
155
9
77
589
2
56
130
2
3
,008
2009
1,91
3 6
44
571
4
20
121
156
9
74
584
2
66
122
2
2,
887
Sour
ce:
Com
plet
ed P
roce
edin
gs, H
M C
ourt
Ser
vice
Per
form
ance
Dat
abas
e (‘O
PT’)
Not
es:
1 Th
e fig
ures
pre
sent
ed h
ere
are
deriv
ed fr
om a
diff
eren
t dat
a so
urce
(OPT
) to
prev
ious
bul
letin
s an
d ar
e no
t the
refo
re d
irect
ly c
ompa
rabl
e w
ith d
ata
from
pre
viou
s yea
rs
2 In
cas
es w
here
a d
efen
dant
app
ears
at c
ourt
in a
cas
e w
ith m
ore
than
one
off
ence
, onl
y th
e of
fenc
e w
hich
has
the
heav
iest
pen
alty
impo
sed
is c
ount
ed. W
here
the
sam
e pe
nalty
is
impo
sed
for t
wo
or m
ore
offe
nces
, the
off
ence
cou
nted
is th
e on
e th
at a
ttra
cts t
he s
tatu
tory
max
imum
pen
alty
. In
inst
ance
s whe
re th
e sa
me
indi
vidu
al a
ppea
rs in
mul
tiple
cas
es,
thes
e ar
e re
cord
ed h
ere
as m
ultip
le d
efen
dant
s 3
Num
ber o
f def
enda
nts
are
pres
ente
d in
thou
sand
s (0
00s)
in th
e ta
ble.
For
exa
mpl
e, 2
,887
thou
sand
def
enda
nts
is e
quiv
alen
t to
2.89
mill
ion
defe
ndan
ts

Judicial and Court Statistics 2009 | Chapter 3
79
Table 3.2Magistrates’ courtsNumber of defendants proceeded against for criminal offences (excluding breaches), by offence type and HMCS area, England and Wales, 20091,2,4
Number of defendants (thousands)3
HMCS Area
Adult Youth Total
Indictable /triable either way offences
Summary non-motoring
offences
Summary motoring offences
All offence
types
Total defendants proceeded
against
Avon and Somerset 10.7 11.4 17.3 3.5 42.9Bedfordshire, Essex and Hertfordshire 20.5 31.1 42.6 8.0 102.2Birmingham, Coventry, Solihull and Warwickshire 18.8 21.9 30.7 4.7 76.2Black Country, Staffordshire and West Mercia 22.9 28.7 37.2 7.1 95.9Cambridgeshire, Norfolk and Suffolk 14.0 16.2 29.0 5.8 65.0Cheshire and Merseyside 22.4 32.0 27.6 6.3 88.3Cleveland, Durham and Northumbria 27.2 40.9 25.8 10.2 104.1Cumbria and Lancashire 18.4 21.0 30.7 7.6 77.6Devon and Cornwall 8.2 10.5 13.6 2.9 35.1Dorset, Gloucestershire and Wiltshire 11.3 10.9 25.7 4.0 51.9Greater Manchester 24.5 35.6 30.8 9.6 100.5Hampshire and Isle of Wight 14.2 16.8 18.4 5.7 55.1Humber and South Yorkshire 17.9 22.8 26.6 7.6 74.9Kent 10.0 12.9 17.3 4.4 44.5Lincolnshire, Leicestershire, Rutland and Northamptonshire
13.7 15.7 29.1 6.1 64.6
London (Central and South) 25.1 41.3 25.7 6.6 98.7London (North and West) 46.6 90.5 64.0 20.7 221.8Mid and West Wales 7.0 7.4 9.7 2.1 26.2North and West Yorkshire 25.9 25.8 43.7 10.2 105.7North Wales 5.3 6.6 10.1 2.1 24.2Nottingham and Derbyshire 15.7 18.3 18.7 5.2 57.9South East Wales 13.4 19.8 19.9 4.9 58.0Surrey and Sussex 13.9 20.1 24.9 5.7 64.6Thames Valley 12.8 13.1 25.0 4.5 55.5
England and Wales 420.4 571.3 644.0 155.6 1,791.3
Source:Completed Proceedings, HM Courts Service Performance Database (‘OPT’)Notes:1 The figures presented here are derived from a different data source to previous bulletins and are not therefore directly comparable with data from
previous years 2 In cases where a defendant appears at court in a case with more than one offence, only the offence which has the heaviest penalty imposed is
counted. Where the same penalty is imposed for two or more offences, the offence counted is the one that attracts the statutory maximum penalty. In instances where the same individual appears in multiple cases, these are recorded here as multiple defendants
3 Number of defendants are presented in thousands (000s) in the table. For example, 1,791.3 thousand defendants is equivalent to 1.79 million defendants
4 The figures presented here are based on the 25 HMCS areas, as per the 2007 restructuring of administrative arrangements. The area not shown is London (Civil and Family), which covers non-criminal caseload

Judicial and Court Statistics 2009 | Chapter 3
80
Table 3.3Magistrates’ courtsEffectiveness of recorded trials, by HMCS area, England and Wales, 20091
HMCS Area
Total number of
trials
Effective trials Ineffective trials Cracked trials
Number
Percentage of total
trials Number
Percentage of total
trials Number
Percentage of total
trials
Avon and Somerset 2,682 1,506 56% 343 13% 833 31%Bedfordshire, Essex and Hertfordshire 11,319 5,143 45% 2,490 22% 3,686 33%Birmingham, Coventry, Solihull and Warwickshire
8,442 3,128 37% 1,893 22% 3,421 41%
Black Country, Staffordshire and West Mercia
10,937 4,452 41% 1,979 18% 4,506 41%
Cambridgeshire, Norfolk and Suffolk 4,398 2,301 52% 664 15% 1,433 33%Cheshire and Merseyside 8,655 3,507 41% 1,140 13% 4,008 46%Cleveland, Durham and Northumbria 11,318 4,092 36% 2,461 22% 4,765 42%Cumbria and Lancashire 9,539 3,909 41% 1,510 16% 4,120 43%Derbyshire and Nottinghamshire 2,362 1,164 49% 423 18% 775 33%Devon and Cornwall 5,239 2,288 44% 1,263 24% 1,688 32%Dorset, Gloucestershire and Wiltshire 9,603 4,435 46% 1,416 15% 3,752 39%Greater Manchester 6,539 2,898 44% 1,322 20% 2,319 35%Hampshire and IoW 6,652 2,836 43% 1,012 15% 2,804 42%Humber and South Yorkshire 4,781 2,049 43% 999 21% 1,733 36%Kent 6,119 2,570 42% 1,148 19% 2,401 39%Lincolnshire, Leicestershire, Rutland and Northamptonshire
10,413 4,684 45% 2,308 22% 3,421 33%
London (Central and South) 23,114 11,094 48% 3,904 17% 8,116 35%London (North and West) 1,630 892 55% 211 13% 527 32%Mid and West Wales 8,938 3,189 36% 1,728 19% 4,021 45%North and West Yorkshire 2,277 1,119 49% 322 14% 836 37%North Wales 7,481 3,111 42% 1,673 22% 2,697 36%South East Wales 5,311 2,015 38% 887 17% 2,409 45%Surrey and Sussex 6,430 2,979 46% 1,447 23% 2,004 31%Thames Valley 5,679 2,808 49% 1,066 19% 1,805 32%
England and Wales 179,858 78,169 43% 33,609 19% 68,080 38%
Sources:Cracked and ineffective trial monitoring form, Business Information Division, HM Courts ServiceHM Courts Service Performance Database (‘OPT’)Note:1 The figures presented here are based on the 25 HMCS areas, as per the 2007 restructuring of administrative arrangements. The area not
shown is London (Civil and Family), which covers non-criminal caseload. Figures at LCJB level are available on request via the contact details given in Annex A

Judicial and Court Statistics 2009 | Chapter 3
81
Tabl
e 3.
4aM
agis
trat
es’ c
ourt
sN
umbe
r of t
rials
whi
ch w
ere
“cra
cked
” out
of t
otal
tria
ls, b
y re
ason
gro
upin
g, E
ngla
nd a
nd
Wal
es, 2
005-
2009
1,2
2005
2006
2007
2008
2009
2005
2006
2007
2008
2009
Tota
l tria
ls18
2,50
018
0,95
018
9,83
018
3,51
117
9,85
810
0%10
0%10
0%10
0%10
0%
Tota
l cra
cked
tria
ls67
,193
66,8
5872
,565
70,3
6668
,080
37%
37%
38%
38%
38%
Mai
n re
ason
s for
cra
cked
tr
ials
Late
gui
lty p
lea
acce
pted
34
,114
35,3
6839
,490
39,8
2038
,272
19%
20%
21%
22%
21%
Gui
lty p
lea
to a
ltern
ativ
e ne
w c
harg
e5,
010
4,73
75,
134
5,10
85,
086
3%3%
3%3%
3%
Def
enda
nt b
ound
ove
r3,
435
2,80
22,
220
1,62
11,
482
2%2%
1%1%
1%
Pros
ecut
ion
end
case
23,5
4523
,889
25,6
6923
,770
23,1
9813
%13
%14
%13
%13
%
Oth
er1,
089
6252
4742
1%0%
0%0%
0%
Sour
ces:
Crac
ked
and
inef
fect
ive
tria
l mon
itorin
g fo
rm, B
usin
ess I
nfor
mat
ion
Div
ision
, HM
Cou
rt S
ervi
ceH
M C
ourt
Ser
vice
Per
form
ance
Dat
abas
e (‘O
PT’)
Not
es:
1 Th
e m
ain
reas
on fo
r eac
h cr
acke
d tr
ial i
s re
cord
ed, a
nd g
roup
ed in
to th
e su
mm
ary
reas
ons
as s
how
n; th
e lis
t of r
easo
ns a
vaila
ble
to re
cord
ers
was
mod
ified
in 2
006.
Se
e An
nex
A fo
r det
ails
and
gro
upin
gs2
If fu
rthe
r det
ails
of r
easo
ns/g
roup
ings
are
requ
ired,
ple
ase
dire
ct a
ny q
uerie
s via
the
cont
act d
etai
ls g
iven
in

Judicial and Court Statistics 2009 | Chapter 3
82
Tabl
e 3.
4bM
agis
trat
es’ c
ourt
sN
umbe
r and
pro
port
ion
of tr
ials
whi
ch w
ere
“cra
cked
”, by
reas
on g
roup
ing,
Eng
land
and
Wal
es 2
005–
2009
1,2
Year
Tota
l cr
acke
d tr
ials
Num
ber o
f tria
lsPe
rcen
tage
of t
otal
cra
cked
tria
ls
Mai
n re
ason
s for
cra
cked
tria
lsM
ain
reas
ons f
or c
rack
ed tr
ials
Late
gu
ilty
plea
ac
cept
ed
Gui
lty
plea
to
alte
rnat
ive
new
cha
rge
Def
enda
nt
boun
d ov
erPr
osec
utio
n en
ded
case
Oth
er
Late
gu
ilty
plea
ac
cept
ed
Gui
lty
plea
to
alte
rnat
ive
new
cha
rge
Def
enda
nt
boun
d ov
erPr
osec
utio
n en
ded
case
Oth
er
2005
67,1
9334
,114
5,01
03,
435
23,5
451,
089
51%
7%5%
35%
2%
2006
66,8
5835
,368
4,73
72,
802
23,8
8962
53%
7%4%
36%
0%
2007
72,5
6539
,490
5,13
42,
220
25,6
6952
54%
7%3%
35%
0%
2008
70,3
6639
,820
5,10
81,
621
23,7
7047
57%
7%2%
34%
0%
2009
68,0
8038
,272
5,08
61,
482
23,1
9842
56%
7%2%
34%
0%
Sour
ces:
Crac
ked
and
inef
fect
ive
tria
l mon
itorin
g fo
rm, B
usin
ess I
nfor
mat
ion
Div
ision
, HM
Cou
rts S
ervi
ceH
M C
ourt
s Ser
vice
Per
form
ance
Dat
abas
e (‘O
PT’)
Not
es:
1 Th
e m
ain
reas
on fo
r eac
h cr
acke
d tr
ial i
s re
cord
ed, a
nd g
roup
ed in
to th
e su
mm
ary
reas
ons
as s
how
n; th
e lis
t of r
easo
ns a
vaila
ble
to re
cord
ers w
as m
odifi
ed in
200
6. S
ee A
nnex
A
for d
etai
ls a
nd g
roup
ings
2
If fu
rthe
r det
ails
of r
easo
ns/g
roup
ings
are
requ
ired,
ple
ase
dire
ct a
ny q
uerie
s via
the
cont
act d
etai
ls g
iven
in A
nnex
A

Judicial and Court Statistics 2009 | Chapter 3
83
Tabl
e 3.
5aM
agis
trat
es’ c
ourt
sN
umbe
r of t
rials
whi
ch w
ere
“ine
ffec
tive”
, by
reas
on g
roup
ing,
Eng
land
and
Wal
es, 2
005-
2009
1,3
2005
2006
2007
2008
2009
2005
2006
2007
2008
2009
Tota
l tria
ls18
2,50
018
0,95
018
9,83
018
3,51
117
9,85
810
0%10
0%10
0%10
0%10
0%
Tota
l ine
ffec
tilve
tria
ls39
,634
35,0
4435
,150
33,4
2333
,609
22%
19%
19%
18%
19%
Mai
n re
ason
s for
inef
fect
ive
tria
l
Pros
ecut
ion
not r
eady
23,
984
3,90
73,
684
3,61
13,
595
2%2%
2%2%
2%
Pros
ecut
ion
witn
ess
abse
nt10
,222
8,55
07,
774
6,71
26,
243
6%5%
4%4%
3%
Def
enda
nt a
bsen
t8,
802
7,22
37,
407
7,11
76,
903
5%4%
4%4%
4%
Def
ence
not
read
y25,
289
4,12
94,
855
5,13
75,
372
3%2%
3%3%
3%
Def
ence
witn
ess
abse
nt1,
879
1,69
61,
500
1,37
11,
394
1%1%
1%1%
1%
Oth
er1,
089
6252
4742
1%0%
0%0%
0%
Sour
ces:
Crac
ked
and
inef
fect
ive
tria
l mon
itorin
g fo
rm, B
usin
ess I
nfor
mat
ion
Div
ision
, HM
Cou
rt S
ervi
ce
HM
Cou
rt S
ervi
ce P
erfo
rman
ce D
atab
ase
(‘OPT
’)N
otes
:1
The
mai
n re
ason
for e
ach
inef
fect
ive
tria
l is
reco
rded
, and
gro
uped
into
the
sum
mar
y re
ason
s as
sho
wn;
the
list o
f rea
sons
ava
ilabl
e to
reco
rder
s was
mod
ified
in 2
006.
Se
e An
nex
A fo
r det
ails
and
gro
upin
gs2
Gro
upin
gs fo
r ‘pr
osec
utio
n no
t rea
dy’,
‘def
ence
not
read
y’ a
nd ‘o
ther
’ for
200
6 da
ta h
ave
been
cor
rect
ed fr
om th
ose
in ‘J
udic
ial a
nd C
ourt
Sta
tistic
s 20
06’
3 If
furt
her d
etai
ls o
f rea
sons
/gro
upin
gs a
re re
quire
d, p
leas
e di
rect
any
que
ries v
ia th
e co
ntac
t det
ails
giv
en in
Ann
ex A

Judicial and Court Statistics 2009 | Chapter 3
84
Tabl
e 3.
5bM
agis
trat
es’ c
ourt
sN
umbe
r of t
rials
whi
ch w
ere
“inef
fect
ive”
, by
reas
on g
roup
ing,
Eng
land
and
Wal
es, 2
005–
2009
1,3
Year
Tota
l in
effe
ctiv
e tr
ials
Num
ber o
f tria
lsPe
rcen
tage
of t
otal
inef
fect
ive
tria
ls
Mai
n re
ason
s for
inef
fect
ive
tria
lsM
ain
reas
ons f
or in
effe
ctiv
e tr
ials
Pros
ecut
ion
not r
eady
2
Pros
ecut
ion
witn
ess
abse
ntD
efen
dant
ab
sent
Def
ence
no
t rea
dy2
Def
ence
w
itnes
s ab
sent
Oth
erPr
osec
utio
n no
t rea
dy2
Pros
ecut
ion
witn
ess
abse
ntD
efen
dant
ab
sent
Def
ence
no
t rea
dy2
Def
ence
w
itnes
s ab
sent
Oth
er
2005
39,6
343,
984
10,2
228,
802
5,28
91,
879
9,45
810
%26
%22
%13
%5%
24%
2006
35,0
443,
907
8,55
07,
223
4,12
91,
696
9,53
911
%24
%21
%12
%5%
27%
2007
35,1
503,
684
7,77
47,
407
4,85
51,
500
9,93
010
%22
%21
%14
%4%
28%
2008
33,4
233,
611
6,71
27,
117
5,13
71,
371
9,47
511
%20
%21
%15
%4%
28%
2009
33,6
093,
595
6,24
36,
903
5,37
21,
394
10,1
0211
%19
%21
%16
%4%
30%
Sour
ces:
Crac
ked
and
inef
fect
ive
tria
l mon
itorin
g fo
rm, B
usin
ess I
nfor
mat
ion
Div
ision
, HM
Cou
rt S
ervi
ceH
M C
ourt
Ser
vice
Per
form
ance
Dat
abas
e (‘O
PT’)
Not
es:
1 Th
e m
ain
reas
on fo
r eac
h in
effe
ctiv
e tr
ial i
s re
cord
ed, a
nd g
roup
ed in
to th
e su
mm
ary
reas
ons
as s
how
n; th
e lis
t of r
easo
ns a
vaila
ble
to re
cord
ers w
as m
odifi
ed in
200
6.
See
Anne
x A
for d
etai
ls a
nd g
roup
ings
2 G
roup
ings
for ‘
pros
ecut
ion
not r
eady
’, ‘d
efen
ce n
ot re
ady’
and
‘oth
er’ f
or 2
006
data
hav
e be
en c
orre
cted
from
thos
e in
‘Jud
icia
l and
Cou
rt S
tatis
tics
2006
’3
If fu
rthe
r det
ails
of r
easo
ns/g
roup
ings
are
requ
ired,
ple
ase
dire
ct a
ny q
uerie
s via
the
cont
act d
etai
ls g
iven
in A
nnex
A

Judicial and Court Statistics 2009 | Chapter 3
85
Table 3.6Magistrates’ courtsAverage time taken by stage of proceedings and percentage of proceedings dealt with on first listing for defendants in criminal cases in magistrates’ courts, by offence type, England and Wales, 2005–20091,3,4
Year
Average number of days from:Percentage
completed at first listing
(i.e. no adjournments)
Sample size (number of
defendants)
Offence to charge or laying of
information
Margin of error
(+/- days)2
Charge or laying of information
to first listing
Marginof error
(+/- days)2
First listing to completion
Margin of error
(+/- days)2
Offence to completion
Margin of error
(+/- days)2
Indictable/triable either way cases
2005 59 2 10 0 54 1 122 2 31% 28,127
2006 61 2 10 0 52 1 123 2 30% 27,730
2007 61 2 10 0 47 1 118 2 32% 28,756
2008 62 2 12 0 37 1 112 2 39% 29,608
2009 62 2 13 0 36 1 111 2 41% 31,624
Summary motoring cases
2005 99 1 39 0 24 1 162 1 63% 29,530
2006 94 1 41 0 25 1 160 1 63% 26,707
2007 96 1 41 0 25 1 162 1 65% 26,396
2008 99 1 43 0 21 1 163 1 65% 22,782
2009 99 1 42 0 22 1 162 2 66% 21,663
Summary non-motoring cases
2005 90 1 34 0 24 1 148 2 70% 18,825
2006 85 1 37 0 24 1 146 2 71% 18,976
2007 83 1 37 1 24 1 144 2 70% 18,231
2008 83 2 36 1 20 1 138 2 73% 16,838
2009 87 2 35 0 17 1 138 2 74% 17,836
All criminal cases
2005 87 1 31 0 31 1 149 1 58% 63,153
2006 85 1 32 0 31 1 148 1 58% 60,200
2007 84 1 32 0 31 1 147 1 58% 59,353
2008 84 1 33 0 26 1 143 1 60% 54,637
2009 85 1 31 0 24 1 141 1 61% 55,611
Source:Time Intervals Survey, Ministry of JusticeNotes:1 Results are based on proceedings in one sample week in March, June, September and December for indictable / triable-either-way offences, and the
March and September surveys only for summary offences and all criminal cases. Hence, the sum of the number of defendants by offence type does not equal the total number of defendants
2 The margin of error is a measure of the precision of a result based on a survey. The true value is likely to fall within the range of the sample result plus or minus the margin of error
3 Both adult and youth defendant data from the quarterly TIS one-week survey periods are included4 More detailed results and notes from the Time Intervals Survey are published in a National Statistics Bulletin, available at:
http://www.justice.gov.uk/publications/timeintervals.htm

Judicial and Court Statistics 2009 | Chapter 3
86
Tabl
e 3.
7M
agis
trat
es’ c
ourt
sAv
erag
e tim
e ta
ken
by st
age
of p
roce
edin
gs a
nd p
erce
ntag
e of
pro
ceed
ings
com
plet
ed a
t firs
t list
ing
for d
efen
dant
s in
crim
inal
cas
es in
mag
istra
tes’
cour
ts, b
y of
fenc
e gr
oup,
Eng
land
and
Wal
es, 2
0091,
3,4
Off
ence
gro
up
Aver
age
num
ber o
f day
s fro
m:
Perc
enta
ge
com
plet
ed a
t fir
st li
stin
g(i.
e. n
o ad
jour
nmen
ts)
Sam
ple
size
(num
ber o
f de
fend
ants
)
Offe
nce
to
char
ge o
r la
ying
of
info
rmat
ion
Mar
gin
of e
rror
(+/-
day
s)2
Char
ge o
r la
ying
of
info
rmat
ion
to fi
rst l
istin
g
Mar
gin
of e
rror
(+/-
day
s)2
Firs
t lis
ting
to
com
plet
ion
Mar
gin
of e
rror
(+/-
day
s)2
Offe
nce
to
com
plet
ion
Mar
gin
of e
rror
(+/-
day
s)2
All i
ndic
tabl
e / t
riabl
e ei
ther
way
cas
es
Burg
lary
516
91
374
967
33%
1,85
1
Crim
inal
Dam
age
353
131
365
846
46%
2,54
7
Dru
g O
ffenc
es49
314
121
284
456
%4,
164
Frau
d an
d fo
rger
y32
531
192
426
386
3340
%1,
019
Indi
ctab
le m
otor
ing
offe
nces
685
252
354
127
744
%78
3
Robb
ery
537
81
243
848
61%
730
Sexu
al O
ffenc
es27
442
131
356
323
4241
%72
8
Thef
t and
han
dlin
g st
olen
goo
ds40
212
029
181
344
%9,
957
Viol
ence
aga
inst
the
pers
on43
213
055
211
13
23%
6,98
2
Oth
er in
dict
able
offe
nces
939
161
332
142
946
%2,
863
All s
umm
ary
mot
orin
g ca
ses
Dru
nken
driv
ing
152
151
255
555
66%
2,22
0
Driv
ing
with
out d
ue c
are
105
548
446
719
911
44%
490
Faili
ng to
stop
9413
359
5038
179
4039
%85
Oth
er su
mm
ary
mot
orin
g of
fenc
es10
81
451
201
173
266
%18
,868
All s
umm
ary
non-
mot
orin
g ca
ses
872
350
171
138
274
%17
,836
All c
rimin
al c
ases
851
310
241
141
161
%55
,611
Sour
ce:
Tim
e In
terv
als S
urve
y, M
inis
try
of Ju
stic
eN
otes
:1
Resu
lts a
re b
ased
on
proc
eedi
ngs
in o
ne s
ampl
e w
eek
in M
arch
, Jun
e, S
epte
mbe
r and
Dec
embe
r for
indi
ctab
le/t
riabl
e-ei
ther
-way
off
ence
s, an
d th
e M
arch
and
Sep
tem
ber
surv
eys o
nly
for s
umm
ary
offe
nces
and
all
crim
inal
cas
es. H
ence
, the
sum
of t
he n
umbe
r of d
efen
dant
s by
off
ence
type
doe
s no
t equ
al th
e to
tal n
umbe
r of d
efen
dant
s2
The
mar
gin
of e
rror
is a
mea
sure
of t
he p
reci
sion
of a
resu
lt ba
sed
on a
surv
ey. T
he tr
ue v
alue
is li
kely
to fa
ll w
ithin
the
rang
e of
the
sam
ple
resu
lt pl
us o
r min
us th
e m
argi
n of
err
or3
Both
adu
lt an
d yo
uth
defe
ndan
t dat
a fr
om th
e qu
arte
rly T
IS o
ne-w
eek
surv
ey p
erio
ds a
re in
clud
ed4
Mor
e de
taile
d re
sults
and
not
es fr
om th
e Ti
me
Inte
rval
s Sur
vey
are
publ
ished
in a
Nat
iona
l Sta
tistic
s Bul
letin
, ava
ilabl
e at
: htt
p://
ww
w.ju
stic
e.go
v.uk
/pub
licat
ions
/tim
eint
erva
ls.h
tm

Judicial and Court Statistics 2009 | Chapter 3
87
Tabl
e 3.
8M
agis
trat
es’ c
ourt
sAv
erag
e tim
e ta
ken
from
off
ence
to c
ompl
etio
n fo
r def
enda
nts
in a
ll cr
imin
al c
ases
in m
agis
trat
es’ c
ourt
s, by
off
ence
type
and
H
MCS
are
a, E
ngla
nd a
nd W
ales
, 200
91,3,
4,5
Area
Aver
age
num
ber o
f day
s fro
m o
ffen
ce to
com
plet
ion:
Num
ber o
f def
enda
nts
Indi
ctab
le/
tria
ble
eith
er w
ay
case
s
Mar
gin
of er
ror
(+/-
days
)2
Sum
mar
y m
otor
ing
case
s
Mar
gin
of er
ror
(+/-
days
)2
Sum
mar
y no
n-m
otor
ing
case
s
Mar
gin
of er
ror
(+/-
days
)2
All
case
s
Mar
gin
of er
ror
(+/-
days
)2
Indi
ctab
le/
tria
ble
eith
er w
ay
case
s
Sum
mar
y m
otor
ing
case
s
Sum
mar
y no
n-m
otor
ing
case
sAl
l ca
ses
Avon
and
Som
erse
t10
67
142
612
310
125
51,
428
779
400
1,78
3
Bedf
ords
hire
, Ess
ex a
nd H
ertfo
rdsh
ire10
57
174
714
77
150
51,
640
1,41
31,
276
3,46
3
Birm
ingh
am, C
oven
try,
Solih
ull a
nd W
arw
icksh
ire10
512
189
610
46
138
61,
371
970
723
2,42
0
Blac
k Cou
ntry
, Sta
fford
shire
and
Wes
t Mer
cia11
811
146
513
014
136
61,
798
1,25
480
52,
961
Cam
brid
gesh
ire, N
orfo
lk a
nd S
uffo
lk96
914
45
105
1112
36
1,28
498
430
41,
910
Ches
hire
and
Mer
seys
ide
106
1115
715
129
513
17
1,51
570
11,
133
2,59
2
Clev
elan
d, D
urha
m a
nd N
orth
umbr
ia10
210
161
2411
56
125
91,
977
946
1,47
23,
395
Cum
bria
and
Lanc
ashi
re11
010
150
512
86
133
51,
434
1,24
11,
047
3,02
2
Dev
on a
nd C
ornw
all
125
2415
318
8823
137
1423
424
381
504
Dor
set,
Glo
uces
ters
hire
and
Wilt
shire
118
1219
37
159
1016
77
1,13
089
561
82,
049
Gre
ater
Man
ches
ter
112
1013
26
136
1012
65
1,89
41,
030
1,09
23,
128
Ham
pshi
re a
nd Is
le o
f Wig
ht11
919
182
1014
212
153
929
933
027
685
2
Hum
ber a
nd S
outh
Yor
kshi
re98
1016
06
132
713
65
1,29
895
176
82,
379
Kent
134
1717
67
143
1016
38
724
767
308
1,48
1

Judicial and Court Statistics 2009 | Chapter 3
88
Linco
lnsh
ire, L
eice
ster
shire
, Rut
land
and
N
orth
ampt
onsh
ire11
711
148
914
013
137
71,
139
1,11
532
51,
983
Lond
on (C
entr
al a
nd S
outh
)13
712
148
614
88
147
72,
190
932
1,09
03,
082
Lond
on (N
orth
and
Wes
t)95
518
96
169
415
43
3,43
31,
427
2,77
85,
971
Mid
and
Wes
t Wal
es10
616
144
1491
2111
813
546
219
117
594
Nor
th W
ales
106
1516
413
9936
137
1036
719
861
453
Nor
th a
nd W
est Y
orks
hire
127
915
53
116
1114
14
1,93
81,
835
628
3,44
6
Not
tingh
am a
nd D
erby
shire
125
1117
76
144
615
05
1,01
575
378
32,
100
Sout
h Ea
st W
ales
9410
170
613
29
140
679
664
658
41,
635
Surre
y an
d Su
ssex
117
1015
17
127
713
65
1,12
591
265
62,
143
Tham
es V
alle
y11
811
179
615
59
155
51,
049
1,12
251
12,
265
Engl
and
and
Wal
es11
12
162
213
82
141
131
,624
21,6
6317
,836
55,6
11
Sour
ce:
Tim
e In
terv
als S
urve
y, M
inis
try
of Ju
stic
eN
otes
:1
Resu
lts a
re b
ased
on
proc
eedi
ngs
in o
ne s
ampl
e w
eek
in M
arch
, Jun
e, S
epte
mbe
r and
Dec
embe
r for
indi
ctab
le/t
riabl
e-ei
ther
-way
off
ence
s an
d M
arch
and
Sep
tem
ber s
urve
ys o
nly
for s
umm
ary
offe
nces
and
all
crim
inal
cas
es. H
ence
, the
sum
of t
he n
umbe
r of d
efen
dant
s by
off
ence
type
doe
s no
t equ
al th
e to
tal n
umbe
r of d
efen
dant
s2
The
mar
gin
of e
rror
is a
mea
sure
of t
he p
reci
sion
of a
resu
lt ba
sed
on a
surv
ey. T
he tr
ue v
alue
is li
kely
to fa
ll w
ithin
the
rang
e of
the
sam
ple
resu
lt pl
us o
r min
us th
e m
argi
n of
err
or3
The
figur
es p
rese
nted
her
e ar
e ba
sed
on th
e 25
HM
CS a
reas
, as
per t
he 2
007
rest
ruct
urin
g of
adm
inis
trat
ive
arra
ngem
ents
. The
are
a no
t sho
wn
is L
ondo
n (C
ivil
and
Fam
ily),
whi
ch c
over
s no
n-cr
imin
al c
asel
oad
4 Bo
th a
dult
and
yout
h de
fend
ant d
ata
from
the
quar
terly
TIS
one
-wee
k su
rvey
per
iods
are
incl
uded
5 M
ore
deta
iled
resu
lts a
nd n
otes
from
the
Tim
e In
terv
als S
urve
y ar
e pu
blish
ed in
a N
atio
nal S
tatis
tics B
ulle
tin, a
vaila
ble
at: h
ttp:
//w
ww
.just
ice.
gov.
uk/p
ublic
atio
ns/t
imei
nter
vals
.htm
Tabl
e 3.
8 co
ntin
ued

Judicial and Court Statistics 2009 | Chapter 3
89
Table 3.9Magistrates’ courtsAdult charged cases (excluding cases sent or committed to the Crown Court): average time taken from charge to completion and average number of hearings per case, England and Wales, 2005–20091,3,4
Year
Average number of weeks from charge to
completionAverage number of hearings per case Sample size
Number of weeks
Margin of error
(+/- weeks)2
Number of weeks
Margin of error
(+/- weeks)2
Number of defendants
2005 9.0 0.2 2.90 0.03 32,7042006 8.9 0.2 2.92 0.03 32,9522007 8.3 0.1 2.88 0.03 34,5492008 7.0 0.1 2.38 0.02 34,2492009 6.9 0.1 2.27 0.02 35,323
Source:Time Intervals Survey, Ministry of JusticeNotes:1 Results are based on proceedings in one sample week in March, June, September and December2 The margin of error is a measure of the precision of a result based on a survey. The true value is likely
to fall within the range of the sample result plus or minus the margin of error3 The figures cover adult charged cases, excluding cases sent or committed to the Crown Court4 More detailed results and notes from the Time Intervals Survey are published in a National Statistics
Bulletin, available at: http://www.justice.gov.uk/publications/timeintervals.htm

Judicial and Court Statistics 2009 | Chapter 3
90
Table 3.10Magistrates’ courtsEnforcement of financial penalties in magistrates’ courts, England and Wales, 2005–20091,3
YearAmount Paid (£ millions)2
2005 2282006 2422007 2552008 2512009 251
Source:Debt Analysis Return (DAR), Business Information Division, HM Courts Service HM Court Service Performance Database (‘OPT’)Notes:1 Magistrates’ courts submit information on the enforcement of financial penalties using the Debt
Analysis Return. National figures are collated by the Business Information Division in HMCS2 The amount paid represents the amount of financial penalties collected by the courts in the given year3 Information prior to 2004 has not been provided. The collection of enforcement information (DAR)
was revised in April 2003 so that it no longer contained confiscation or civil amounts, and is therefore not available prior to that date in a similar format

The Crown Court
Chapter 4

Judicial and Court Statistics 2009 | Chapter 4
92
Chapter 4: The Crown Court
The Crown Court sits in a number of different locations across England and Wales. It deals with serious criminal cases which include:
Cases sent for trial by magistrates’ courts in respect of ‘indictable only’ •offences (i.e. those which can only be heard by the Crown Court).
‘Either way’ offences committed for trial (i.e. those which can be heard in •either a magistrates’ court or the Crown Court).
Defendants committed from magistrates’ courts for sentence. •
Appeals against decisions of magistrates’ courts. •
The Crown Court is the only court which has the jurisdiction to hear criminal trials on indictment. It also exercises the appellate and other jurisdictions which had been exercised, prior to its establishment in 1972, by Quarter Sessions. It is a unitary court, but is currently based at 77 centres across England and Wales. There are three different types of centre based on the type of work they deal with. They are as follows:
First-tier centres are those visited by High Court Judges for Crown Court and •High Court Civil work. (Crown Court work includes all classes of offence in criminal proceedings.)
Second-tier centres are those visited by High Court Judges for Crown Court •work only. (Crown Court work includes all classes of offence in criminal proceedings.)
Third-tier centres are not normally visited by High Court Judges and handle •Crown Court work only. (Crown Court work includes class 2 and 3 offences in criminal proceedings.)
Circuit Judges and Recorders deal with Crown Court work in all three types of centre.
Information on the data sources used for the Crown Court statistics can be found in Annex A. Explanations for some of the main terms used in this section can be found in the Glossary. The tables of detailed data can be found immediately following this section of commentary.

Judicial and Court Statistics 2009 | Chapter 4
93
Key findings for 2009
In 2009, there were 97,700 cases committed/sent for trial to the Crown •Court, and increase of nine per cent compared to 2008. Disposals of cases committed/sent for trial increased by seven per cent to 94,300 in 2009.
A further 38,700 cases were committed to the Crown Court for sentence in •2009, a decrease of seven per cent from the previous year. Appeals against magistrates’ decisions (14,300) increased by two per cent.
Guilty pleas as a proportion of all cases where a plea was entered rose to 71 •per cent in 2009, from 70 per cent in 2008.
In 2009, the rates of cracked and ineffective trials both rose by around one •percentage point compared to 2008, to 42 per cent and 13 per cent respectively.
In 2009, the average waiting time for defendants committed for trial on bail •was 15.1 weeks and 8.8 weeks for those held in custody.
On average, the waiting time for defendants sent for trial for those on bail •was 22.3 weeks, and 15.2 weeks for those held in custody in 2009.
The average hearing time for defendants who pleaded not guilty decreased from •20.3 hours in 2008 to 19.8 hours in 2009 in sent for trial cases, and fell from 8.1 hours to 7.6 hours in committed for trial cases between 2008 and 2009.
Seriousness of offences
For the purpose of trial in the Crown Court, offences are divided into three classes of seriousness according to directions given by the Lord Chief Justice, with the concurrence of the Lord Chancellor. From the 6 June 2005, the method of classifying offences was amended such that all class 4 offences were reclassified to class 3 offences.
Class 1 – Generally heard by a High Court Judge, these are the most serious offences which include treason and murder.
Class 2 – Offences which include rape that are usually heard by a Circuit Judge under the authority of the Presiding Judge.
Class 3 – Includes all other offences, such as kidnapping, burglary, grievous bodily harm and robbery, which are normally tried by a Circuit Judge or Recorder.

Judicial and Court Statistics 2009 | Chapter 4
94
Sent for Trial – ‘Indictable Only’ Offences
Since the 15 January 2001 all ‘indictable only’ cases have been ‘sent for trial’ to the Crown Court after they have had their first appearance in a magistrates’ court. This procedure under Section 51 of the Crime and Disorder Act 1998 replaced committal proceedings and reduces the number of hearings these cases have at magistrates’ court. While the time that ‘indictable only’ cases spend in the Crown Court will increase, the overall time spent in the Criminal Justice System from arrest to sentence will decrease.
Committals for Trial – ‘Either Way’ Offences
‘Either way’ offences may be committed by magistrates’ courts to the Crown Court for trial. The magistrates are required to ask defendants to indicate their plea to the charge. Where a guilty plea is indicated, the summary trial procedure is deemed to have been complied with and the defendant is deemed to have pleaded guilty under it. The defendant can then be sentenced or committed to the Crown Court for sentence.
Where a defendant indicates a not guilty plea or gives no indication of their plea, the court, having considered various factors, including representations by the prosecution and the defence, indicates whether it considers the offence more suitable for a summary trial or an indictment. A court may only proceed to summary trial with the consent of the defendant who may elect to be tried by a jury in the Crown Court.
Committals for Sentence
Provisions in the Magistrates’ Courts Act 1980 allow magistrates to commit defendants who have been summarily convicted of an ‘either way’ offence to the Crown Court for sentence. The magistrates must be of the opinion that the offence or the offence combined with one or more associated offences is so serious that a greater punishment should be imposed than they have the power to enforce or, in the case of a violent or sexual offence, that a sentence of imprisonment for a longer term than they have power to impose is necessary to protect the public from serious harm. Committals may also arise from breaches of the terms of, for example, Community Orders or suspended sentences of imprisonment where the Crown Court Judge did not reserve any breach to the Crown Court.
Appeals
In its appellate jurisdiction the Crown Court deals mainly with appeals against conviction and/or sentence in respect of criminal offences, including consequential orders, e.g. disqualification from driving, and against the making of

Judicial and Court Statistics 2009 | Chapter 4
95
certain stand alone orders, e.g. Anti-Social Behaviour Orders. The Crown Court may dismiss or allow the appeal and vary all or any part of the sentence. Appeals are usually heard by a Circuit Judge sitting with no more than four lay magistrates (normally two).
Plea and Case Management
The Criminal Procedure Rules 2005 introduced new principles of case management for cases sent or committed for trial. On receipt to the Crown Court, such cases have a Plea and Case Management Hearing (PCMH) at which directions may be given for the future conduct of the case including, if appropriate, the fixing of the date for trial or the warned period for its listing. The first hearing in a sent for trial case may be a preliminary hearing which is then followed by a PCMH.
Bench Warrants
A bench warrant is issued for a person deemed to be in contempt of court – usually as a result of that person’s failure to appear at their court appearance. For reporting purposes once a bench warrant is issued the case is considered disposed of. A bench warrant can also be issued in a magistrates’ court for breaches of police bail.
A person is not held under the warrant, but has to be produced before the court within 24 hours of arrest. At this point they may be remanded in custody or re-bailed by the court once the bench warrant is executed and the defendant is brought before the court for the original offence. Often, if a person is arrested on a bench warrant, they are held without bail until they appear in court for whatever incident they originally failed to appear for.
Findings for 2009
The information contained within this chapter was produced using a Management Information System (MIS) data warehouse which provides the Ministry of Justice with access to more complete data than previously possible. MIS receives monthly updates from the Courts Record System (CREST), a computer-based data collection facility used by staff at each court to record case details. CREST is a live-system which allows court staff to enter late information and update previously submitted information. As such, published figures are subject to subsequent revisions in later volumes of this publication.

Judicial and Court Statistics 2009 | Chapter 4
96
Receipts, Disposals and Outstanding Workload
A number of changes to court procedures over the last ten years have contributed to a shift in workload between magistrates’ court and the Crown Court.
The plea before venue procedure, which was introduced in 1997 for triable •‘either way’ offences, substantially reduced the number of trials received in the Crown Court. It also doubled the number of cases committed for sentence to the Crown Court. These do, however, require much less resource.
The number of trials received in the Crown Court increased upon the •introduction of sent for trial cases in 2001. These are ‘indictable only’ cases which are sent under section 51 of the Crime and Disorder Act 1998 to the Crown Court because the offence is so serious that only the Crown Court has jurisdiction to deal with it.
Crown Court Trial Workload, 2001 to 2009
In 2009, 97,700 cases were received for trial in the Crown Court, an increase of nine per cent on 2008. The increase in trials received is driven by an increase in committed for trial cases, whereas the number of sent for trial cases remained unchanged compared to the previous year.
0
10
20
30
40
50
60
70
Receipts Disposals Casesoutstanding
Receipts Disposals Casesoutstanding
(in thousands)
2001 2002 2003 2004 2005 2006 2007 2008 2009
Committal for Trial Sent for Trial

Judicial and Court Statistics 2009 | Chapter 4
97
Some 94,300 trial cases were disposed of in 2009, an increase of seven per cent compared to 2008. As a result of fewer trial cases being disposed of than received, the number of outstanding trial cases as at the end of the year was 39,900, an increase of 10 per cent compared to as at the end of 2008.
In 2009, cases committed for sentence to the Crown Court decreased by seven per cent from the previous year to 38,700, while disposals decreased by six per cent to 38,900. At the end of 2009 was 4,600 cases were outstanding, a decrease of 13 per cent compared to the end of 2008.
A total of 14,300 appeals were received in 2009, an increase of two per cent compared to 2008. By contrast, the number of appeals disposed of decreased marginally from just over 14,000 in 2008 to just under 14,000 in 2009. There were 3,200 appeal cases outstanding at the end of 2009, an increase of 12 per cent compared to at the end of the previous year.
Summary statistics on receipts, disposals and outstanding cases in the Crown Court for England and Wales are presented in Table 4.1. Regional and area level figures can be found in Table 4.2.
Judge Caseload
High Court Judges deal with the more complex and difficult cases. In 2009 they sat in two per cent of all trial cases dealt with in the Crown Court. They try the most serious criminal cases in the Crown Court and in 2009 they sat in 25 per cent of all Class 1 cases compared to only three per cent and two per cent of Class 2 and Class 3 cases respectively.
Most Crown Court cases are heard by Circuit Judges. In 2009 they sat in 90 per cent of all trial cases dealt with in the Crown Court. Less complex or serious cases can be heard by Recorders and in 2009 they sat in eight per cent of all trial cases dealt with in the Crown Court.
Summary statistics on judge caseloads in the Crown Court at regional and national levels are presented in Tables 4.3 and 4.4.
Defendants
In 2009 the Crown Court dealt with around 166,100 defendants in total. This represents an increase of three per cent on the 2008 total and is a result of an increase in the numbers of cases received.
The average number of defendants involved in Crown Court trial cases has fallen from 1.21 defendants per case in 2008 to 1.20 defendants per case in 2009. The average number of defendants involved in other types of cases has remained constant over the last few years. In 2009, there were, on average 1.01 defendants per case committed for sentence and one defendant per appeal.

Judicial and Court Statistics 2009 | Chapter 4
98
Summary statistics on defendants in the Crown Court for England and Wales are presented in Table 4.5.
Pleas and Convictions
Tables 4.6 to 4.9 illustrate how defendants involved in cases committed/sent for trial to the Crown Court were dealt with according to plea. Table 4.10 illustrates how appellants involved in appeals against decisions of magistrates’ courts were dealt with.
Guilty Plea
A guilty plea is recorded when a defendant:
Pleads guilty to all counts. •
Pleads guilty to some counts and not guilty to others and no jury is sworn in •respect of the not guilty counts.
Pleads not guilty to some or all counts but offers a guilty plea to alternatives •which are accepted (providing no jury is sworn in respect of other counts).
A case is treated as a guilty plea only if pleas of guilty are recorded in respect of all defendants.
The proportion of all defendants (including those who did not enter a plea) who entered a not guilty plea in committed/sent for trial cases which were dealt with in 2009 remained unchanged at 29 per cent. The guilty plea rate (the number of guilty pleas as a proportion of all defendants who pled) rose by one percentage point. Since 2005 the guilty plea rate has steadily increased from 63 per cent to 71 per cent in 2009.
Initiatives in the Crown Court and other agencies, such as offering an early plea discount and providing early charging advice from the Crown Prosecution Service at police stations, have helped to increase the guilty plea rate. Moreover, other initiatives have not only helped to reduce the number of extraneous hearings, but promote early guilty plea decisions.

Judicial and Court Statistics 2009 | Chapter 4
99
Defendants dealt with by plea, 2000 to 2009
Acquitted
62 per cent of defendants who pleaded not guilty in cases dealt with in 2009 were acquitted. These defendants represent 18 per cent of all those who entered a plea and were dealt with in 2009. Of those who were acquitted after a not guilty plea, 60 per cent were discharged by the judge, nine per cent were acquitted on the direction of the judge, 30 per cent were acquitted by the jury and one per cent were acquitted by other means.
Convicted
38 per cent of defendants who pleaded not guilty in cases dealt with in 2009 were convicted. Of these, 82 per cent were convicted by a jury who reached a unanimous verdict and the remainder by a jury who reached a majority verdict.
Appeals
43 per cent of the appellants dealt with in criminal cases in 2009 had their appeals allowed or their sentence varied, 30 per cent were dismissed and 27 per cent were abandoned or otherwise disposed.
0%
10%
20%
30%
40%
50%
60%
70%
80%
90%
100%
2000 2001 2002 2003 2004 2005 2006 2007 2008 2009
Guilty (to all counts) Not Guilty Bench Warrant Other

Judicial and Court Statistics 2009 | Chapter 4
100
Listing of Cases
The listing of cases is done, in most instances, months in advance. Good listing practice, inter-agency communication and efficient case progression inevitably lead to a higher number of effective trials. Where a case does not proceed on the day, the case will either ‘crack’ or be ineffective.
Cracked Trial - on the trial date the defendant offers acceptable pleas or the •prosecution offers no evidence. A cracked trial requires no further trial time, but, as a consequence, the time allocated has been wasted and witnesses have been unnecessarily inconvenienced thus reducing confidence in the system.
Ineffective Trial - on the trial date the trial does not go ahead due to action •or inaction by one or more of the prosecution, the defence or the Court and a further listing for trial is required.
Cracked Trials
A defendant entering a late guilty plea has consistently been the main reason for a cracked trial and in 2009 this represented 64 per cent of all cracked trials. Other reasons for cracked trials included the prosecution accepting a plea of guilty to an alternative charge (17 per cent) and the prosecution ending the case (17 per cent).
Since 2005, the cracked rate has been increasing steadily. In 2009, the cracked trial rate increased by one percentage point to 42 per cent.
Ineffective Trials
Over the last few years an absent defendant/one that is unfit or the absence of a prosecution witness have been the main reasons for an ineffective trial. In 2009 these represented 24 per cent and 21 per cent respectively of all ineffective trials. Other reasons for ineffective trials included the defence not being ready (18 per cent), the prosecution not being ready (17 per cent) and court administrative problems (19 per cent).
The ineffective trial rate increased by one percentage point to 13 per cent in 2009.

Judicial and Court Statistics 2009 | Chapter 4
101
Over the last ten years various new initiatives have been introduced with the aim to reduce the number of ineffective trials.
In 2003 the Ineffective Trial Monitoring Scheme was launched to formalise •procedures on identifying the reasons for ineffective trials and enable focused action to be taken on improving performance.
In 2004 the Effective Trial Management Programme (ETMP) was put in place •to reduce the number of ineffective trials by improving case preparation and progression from the point of charge through to trial or earlier disposal. The ETMP introduced the role of the case progression officer – an individual nominated to the court and each party with the responsibility for progressing the case. Certificates of Readiness were also introduced under ETMP, which are in use in some courts. This requires that each party, acting under the judge’s instruction, confirm in writing that they are ready to proceed with the trial as planned and that the trial will take no more than previously estimated.
The Criminal Procedure Rules 2005 set out the procedures to be followed in •case management by the courts, prosecution and defence teams.
All these initiatives have helped to bring about a fall in the ineffective trial rate - since 2000 it has fallen by 12 percentage points to the current rate of 13 per cent in 2009.
Summary statistics on cracked and ineffective trials in the Crown Court for England and Wales are presented in Tables 4.11 and 4.12. Regional and area level figures can be found in Table 4.13.
Effective, Ineffective and Cracked Trial Rates, 2000 to 2009
0%
10%
20%
30%
40%
50%
60%
2000 2001 2002 2003 2004 2005 2006 2007 2008 2009
Cracked rate Ineffective rate Effective rate

Judicial and Court Statistics 2009 | Chapter 4
102
Waiting Times
In this publication, the waiting time for a defendant or appellant is defined as the length of time between a committal or the lodging of an appeal and the start of the substantive Crown Court hearing. (For reporting purposes a bench warrant execution is considered as a new trial receipt. Therefore, any subsequent waiting time is taken from the date of execution.)
Waiting times for defendants committed or sent for trial tend to vary according to the plea they enter and whether the defendant is on bail or in custody.
Sent for Trial
In cases sent for trial defendants who pleaded guilty in 2009 waited, on average, 14 weeks. No change was seen compared to 2008.
The average waiting times for those who pleaded not guilty decreased to 28 weeks in 2009, from 29 weeks in 2008. In 2009, those who pleaded not guilty, i.e. those who had a trial by jury, waited on average, 14 more weeks than those who pleaded guilty. This is not unusual as, where a defendant has pleaded not guilty, extra time is required by both parties to prepare for the case before the trial commences.
Average waiting times in 2009 for defendants remanded in custody was 15 weeks and for defendants remanded on bail was 22 weeks. In 2009 those who were remanded in custody waited, on average, seven weeks less than those remanded on bail.
Sent for Trial Average Waiting Times, 2000 to 2009
0
5
10
15
20
25
30
2000 2001 2002 2003 2004 2005 2006 2007 2008 2009
Weeks
All defendants Pleaded not guilty Pleaded guilty
In custody On bail

Judicial and Court Statistics 2009 | Chapter 4
103
Committal for Trial
In cases committed for trial defendants who pleaded guilty in 2009, on average, waited 10 weeks and remains unchanged compared to 2008. The average waiting times for defendants who pleaded not guilty was around 22 weeks. In 2009 those who pleaded not guilty, on average, waited an extra 11 weeks compared to those who pleaded guilty.
Average waiting times in 2009 for defendants remanded on bail and remanded in custody remained unchanged at 15 weeks and nine weeks respectively.
The reasons which explain the differences between the various waiting times for cases sent for trial apply here as well.
Cases which are sent for trial involve serious offences that take longer to process and require more court time. Therefore, their average waiting times tend to be higher than average waiting times for cases committed for trial.
Committed for Trial Average Waiting Times, 2000 to 2009
0
5
10
15
20
25
2000 2001 2002 2003 2004 2005 2006 2007 2008 2009
Weeks
All defendants Pleaded not guilty Pleaded guilty (to all counts)
In custody On bail

Judicial and Court Statistics 2009 | Chapter 4
104
Sentences and Appeals
In 2009 the average waiting time for defendants in cases committed for sentence remains unchanged at six weeks. Since 2005 this has remained unchanged.
In 2009 the average waiting time for defendants appealing the decision of a magistrates’ court remains unchanged at nine weeks. Since 2005 this has seen an overall increase of one week.
Summary statistics on average waiting times in the Crown Court for England and Wales are presented in Tables 4.14 to 4.17.
Hearing Times
Sent for Trial
Where a defendant pleaded not guilty, the average hearing time for cases sent for trial decreased by 30 minutes in 2009, to 19 hours and 48 minutes. In contrast, where a defendant pleaded guilty, the average hearing time for cases sent for trial in 2009 has remained constant at one hour and 42 minutes.
Since 2005, the average hearing time in cases sent for trial has decreased by 14 per cent for defendants entering a guilty plea and increased by five per cent for defendants entering a not guilty plea.
Committal for Trial
The average hearing times where a defendant pleaded not guilty and guilty reduced by 30 minutes and six minutes respectively from 2008 to 2009. Actual average hearing times for 2009 where a defendant pleaded not guilty and guilty were 7 hours and 36 minutes and 1 hour and six minutes respectively.
Since 2005, the average hearing time for cases committed for trial has decreased by 14 per cent for defendants entering a guilty plea and decreased by 10 per cent for defendants entering a not guilty plea.

Judicial and Court Statistics 2009 | Chapter 4
105
Average Hearing Times, by case type and plea type, 2000 to 2009
0
5
10
15
20
25
2000 2001 2002 2003 2004 2005 2006 2007 2008 2009
Hours
Not Guilty Committal for Trial Guilty Committal for Trial
Not Guilty Sent for Trial Guilty Sent for Trial
Sentences and Appeals
The average hearing time in 2009 was 30 minutes for a case committed for sentence and one hour for an appeal.
Summary statistics on average hearing times in the Crown Court for England and Wales are presented in Table 4.18.
Juror Statistics
In 2009, 396,700 juror summons were issued, which is a reduction of five per cent on 2008. In the same year, 100,000 were excused. Of these, three per cent were excused as they had already served in the last two years and 97 per cent were excused for other reasons including childcare, work commitments, medical, language difficulty, student, moved from area, travel difficulties and financial hardship.
The number of people who failed to reply to their summons together with the number which were returned as undelivered remained changed in 2009, compared to 2008, at around 62,700.
The juror utilisation rate has increased over the last five years to reach its current value of 66.1 per cent in 2009. This represents an increase of six percentage point on 2008.
Summary statistics on jurors in the Crown Court for England and Wales are presented in Tables 4.19 and 4.20.

Judicial and Court Statistics 2009 | Chapter 4
106
Tabl
e 4.
1C
row
n C
ourt
Rece
ipts
, 1 Disp
osal
s 2 and
Out
stan
ding
3 cas
es in
Eng
land
and
Wal
es, b
y ca
se ty
pe, 2
005–
2009
Num
ber o
f cas
es
Year
Com
mitt
ed fo
r tria
lSe
nt fo
r tria
lCo
mm
itted
for s
ente
nce
Appe
als a
gain
st M
ags’
deci
sions
Rece
ipts
Disp
osal
sCa
ses
outs
tand
ing
Rece
ipts
Disp
osal
sCa
ses
outs
tand
ing
Rece
ipts
Disp
osal
sCa
ses
outs
tand
ing
Rece
ipts
Disp
osal
sCa
ses
outs
tand
ing
2005
47,9
8047
,239
18,0
5431
,234
29,7
5615
,192
32,4
5231
,475
5,22
312
,647
12,6
292,
446
2006
47,0
8847
,032
18,4
5630
,469
30,4
0715
,397
35,9
6435
,943
5,05
513
,470
13,1
332,
838
2007
50,1
4349
,823
18,8
7032
,738
33,0
6315
,117
40,3
1139
,385
5,49
713
,242
13,2
262,
854
2008
55,3
0253
,654
20,5
5334
,738
34,0
8115
,759
41,6
5641
,337
5,27
014
,019
14,0
082,
873
2009
62,8
3859
,840
23,6
5534
,869
34,4
7116
,243
38,6
6338
,868
4,59
214
,341
13,9
823,
223
Sour
ce:
HM
Cou
rts S
ervi
ce C
REST
sys
tem
Not
es:
1 Re
ceip
ts in
clud
e co
mm
ittal
s dire
ct fr
om a
mag
istr
ates
’ cou
rt, b
ench
war
rant
s ex
ecut
ed (t
rial a
nd s
ente
nce
only
) and
cas
es tr
ansf
erre
d in
, les
s ca
ses t
rans
ferr
ed o
ut2
Dis
posa
ls a
re to
tal c
ases
dea
lt w
ith3
Out
stan
ding
cas
es a
t end
of t
he p
erio
d
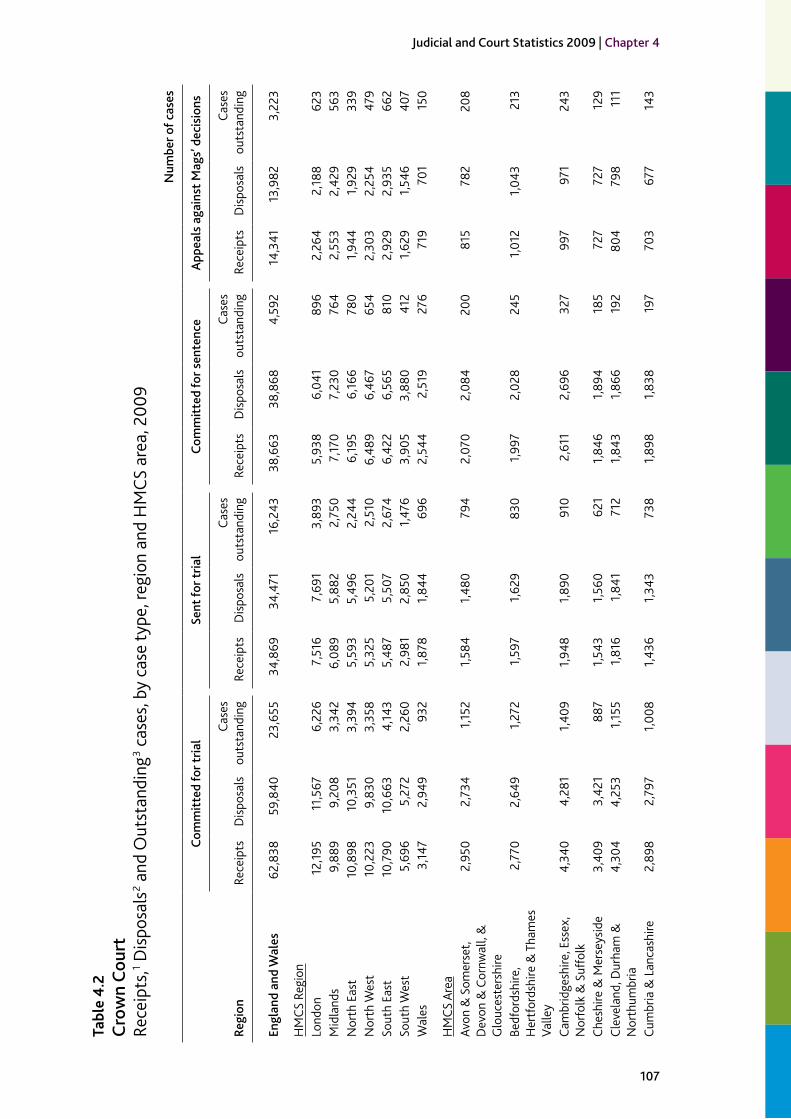
Judicial and Court Statistics 2009 | Chapter 4
107
Tabl
e 4.
2C
row
n C
ourt
Rece
ipts
, 1 Dis
posa
ls 2 a
nd O
utst
andi
ng 3 c
ases
, by
case
type
, reg
ion
and
HM
CS a
rea,
200
9N
umbe
r of c
ases
Regi
on
Com
mit
ted
for t
rial
Sent
for t
rial
Com
mit
ted
for s
ente
nce
App
eals
aga
inst
Mag
s’ d
ecis
ions
Rece
ipts
Dis
posa
lsCa
ses
outs
tand
ing
Rece
ipts
Dis
posa
lsCa
ses
outs
tand
ing
Rece
ipts
Dis
posa
lsCa
ses
outs
tand
ing
Rece
ipts
Dis
posa
lsCa
ses
outs
tand
ing
Engl
and
and
Wal
es62
,838
59,8
4023
,655
34,8
6934
,471
16,2
4338
,663
38,8
684,
592
14,3
4113
,982
3,22
3
HM
CS R
egio
nLo
ndon
12,1
9511
,567
6,22
67,
516
7,69
13,
893
5,93
86,
041
896
2,26
42,
188
623
Mid
land
s9,
889
9,20
83,
342
6,08
95,
882
2,75
07,
170
7,23
076
42,
553
2,42
956
3N
orth
Eas
t10
,898
10,3
513,
394
5,59
35,
496
2,24
46,
195
6,16
678
01,
944
1,92
933
9N
orth
Wes
t10
,223
9,83
03,
358
5,32
55,
201
2,51
06,
489
6,46
765
42,
303
2,25
447
9So
uth
East
10,7
9010
,663
4,14
35,
487
5,50
72,
674
6,42
26,
565
810
2,92
92,
935
662
Sout
h W
est
5,69
65,
272
2,26
02,
981
2,85
01,
476
3,90
53,
880
412
1,62
91,
546
407
Wal
es3,
147
2,94
993
21,
878
1,84
469
62,
544
2,51
927
671
970
115
0
HM
CS A
rea
Avon
& S
omer
set,
Dev
on &
Cor
nwal
l, &
G
louc
este
rshi
re
2,95
02,
734
1,15
21,
584
1,48
079
42,
070
2,08
420
081
578
220
8
Bedf
ords
hire
, H
ertf
ords
hire
& T
ham
es
Valle
y
2,77
02,
649
1,27
21,
597
1,62
983
01,
997
2,02
824
51,
012
1,04
321
3
Cam
brid
gesh
ire, E
ssex
, N
orfo
lk &
Suf
folk
4,34
04,
281
1,40
91,
948
1,89
091
02,
611
2,69
632
799
797
124
3
Ches
hire
& M
erse
ysid
e3,
409
3,42
188
71,
543
1,56
062
11,
846
1,89
418
572
772
712
9Cl
evel
and,
Dur
ham
&
Nor
thum
bria
4,30
44,
253
1,15
51,
816
1,84
171
21,
843
1,86
619
280
479
811
1
Cum
bria
& L
anca
shire
2,89
82,
797
1,00
81,
436
1,34
373
81,
898
1,83
819
770
367
714
3

Judicial and Court Statistics 2009 | Chapter 4
108
Dor
set,
Ham
pshi
re &
Isle
of
Wig
ht, &
Wilt
shire
2,74
62,
538
1,10
81,
397
1,37
068
21,
835
1,79
621
281
476
419
9
East
Mid
land
s4,
120
3,85
71,
335
2,44
22,
362
991
2,88
52,
939
284
946
923
213
Gre
ater
Man
ches
ter
3,91
63,
612
1,46
32,
346
2,29
81,
151
2,74
52,
735
272
873
850
207
Hum
ber &
Sou
th
York
shire
2,
834
2,71
388
51,
717
1,73
663
92,
415
2,40
622
651
452
579
Kent
, Sur
rey
& S
usse
x3,
680
3,73
31,
462
1,94
21,
988
934
1,81
41,
841
238
920
921
206
Lond
on (C
entr
al &
Sou
th)
5,71
25,
400
3,14
33,
879
4,04
92,
071
2,77
82,
885
444
1,10
21,
060
314
Lond
on (N
orth
& W
est)
6,48
36,
167
3,08
33,
637
3,64
21,
822
3,16
03,
156
452
1,16
21,
128
309
Mid
& W
est W
ales
671
637
189
373
391
107
580
534
8616
914
344
Nor
th &
Wes
t Yor
kshi
re3,
760
3,38
51,
354
2,06
01,
919
893
1,93
71,
894
362
626
606
149
Nor
th W
ales
670
596
172
310
325
8241
942
530
193
180
35So
uth
East
Wal
es1,
806
1,71
657
11,
195
1,12
850
71,
545
1,56
016
035
737
871
Staf
ford
shire
& W
est
Mer
cia
2,07
11,
876
760
1,03
599
549
21,
205
1,18
617
562
962
812
8
Wes
t Mid
land
s &
W
arw
icks
hire
3,69
83,
475
1,24
72,
612
2,52
51,
267
3,08
03,
105
305
978
878
222
Sour
ce:
HM
Cou
rts S
ervi
ce C
REST
sys
tem
Not
es:
1 Re
ceip
ts in
clud
e co
mm
ittal
s dire
ct fr
om m
agis
trat
es’ c
ourt
s, be
nch
war
rant
s ex
ecut
ed (t
rial a
nd s
ente
nce
only
) and
cas
es tr
ansf
erre
d in
, les
s ca
ses t
rans
ferr
ed o
ut2
Dis
posa
ls a
re to
tal c
ases
dea
lt w
ith3
Out
stan
ding
cas
es a
t end
of t
he p
erio
d
Tabl
e 4.
2 co
ntin
ued

Judicial and Court Statistics 2009 | Chapter 4
109
Tabl
e 4.
3C
row
n C
ourt
Num
ber o
f cas
es 1,
2 dea
lt w
ith, a
nd p
ropo
rtio
n he
ard
by H
igh
Cour
t jud
ges3 , b
y cl
ass
and
HM
CS re
gion
, 200
9Cl
ass 1
Clas
s 2Cl
ass 3
Regi
onN
umbe
r of
case
s
As %
of
all c
ases
he
ard
Num
ber
hear
d by
a
Hig
h Co
urt
judg
e
% h
eard
by
Hig
h Co
urt
judg
eN
umbe
r of
case
s
As %
of
all c
ases
he
ard
Num
ber
hear
d by
a
Hig
h Co
urt
judg
e
% h
eard
by
Hig
h Co
urt
judg
eN
umbe
r of
case
s
As %
of
all c
ases
he
ard
Num
ber
hear
d by
a
Hig
h Co
urt
judg
e
% h
eard
by
Hig
h Co
urt
judg
e
Engl
and
& W
ales
1,09
81.
2%27
024
.6%
3,32
13.
6%87
2.6%
88,5
0095
.2%
1,40
71.
6%
HM
CS R
egio
n
Lond
on33
01.
8%16
4.8%
502
2.7%
20.
4%17
,974
95.6
%19
81.
1%
Mid
land
s17
31.
2%59
34.1
%70
44.
7%19
2.7%
14,0
1594
.1%
190
1.4%
Nor
th E
ast
162
1.0%
4427
.2%
541
3.5%
132.
4%14
,926
95.5
%24
41.
6%
Nor
th W
est
166
1.1%
5935
.5%
508
3.4%
132.
6%14
,242
95.5
%24
11.
7%
Sout
h Ea
st15
21.
0%31
20.4
%49
13.
1%7
1.4%
15,3
2496
.0%
269
1.8%
Sout
h W
est
771.
0%43
55.8
%37
44.
7%23
6.1%
7,52
194
.3%
148
2.0%
Wal
es38
0.8%
1847
.4%
201
4.2%
105.
0%4,
498
95.0
%11
72.
6%
Sour
ce:
HM
Cou
rts S
ervi
ce C
REST
sys
tem
Not
es:
1 In
clud
es c
ases
whe
re a
ben
ch w
arra
nt w
as is
sued
, no
plea
reco
rded
, ind
ictm
ent t
o lie
on
file,
foun
d un
fit to
ple
ad, a
nd o
ther
resu
lts2
Excl
udes
cas
es d
ealt
with
whi
ch w
ere
not h
eard
by
a ju
dge
3 In
clud
es a
sm
all n
umbe
r of c
ases
hea
rd b
y ju
dges
in th
e re
leva
nt d
eput
y gr
ade

Judicial and Court Statistics 2009 | Chapter 4
110
Table 4.4Crown CourtNumber of cases 1,2 dealt with, by type of judge3 and HMCS region, 2009
Region
High Court judge Circuit judge Recorder
Number Percentage Number Percentage Number Percentage
England & Wales 1,764 2% 83,285 90% 7,870 8%
HMCS RegionLondon 216 1% 16,967 90% 1,623 9%Midlands 268 2% 13,080 88% 1,544 10%North East 301 2% 13,479 86% 1,849 12%North West 313 2% 13,946 93% 657 4%South East 307 2% 14,413 90% 1,247 8%South West 214 3% 7,150 90% 608 8%Wales 145 3% 4,250 90% 342 7%
Source:HM Courts Service CREST systemNotes:1 Includes cases where a bench warrant was issued, no plea recorded, indictment to lie on file, found unfit to plead, and other results2 Excludes cases dealt with which were not heard by a judge3 Includes a small number of cases heard by judges in the relevant deputy grade

Judicial and Court Statistics 2009 | Chapter 4
111
Tabl
e 4.
5C
row
n C
ourt
Num
ber o
f cas
es1 d
ispo
sed
of in
Eng
land
and
Wal
es, b
y ca
se ty
pe a
nd n
umbe
r of d
efen
dant
s in
volv
ed, 2
005–
2009
Year
Com
mitt
ed /
Sent
for t
rial
Com
mitt
ed fo
r sen
tenc
eAp
peal
s
Disp
osal
s
Num
ber o
f de
fend
ants
in
volv
ed
Case
s w
ith >
1
defe
ndan
t
Aver
age
num
ber o
f de
fend
ants
pe
r cas
eD
ispos
als
Num
ber o
f de
fend
ants
in
volv
ed
Case
s w
ith >
1
defe
ndan
t
Aver
age
num
ber o
f de
fend
ants
pe
r cas
eD
ispos
als
Num
ber o
f de
fend
ants
in
volv
ed
Case
s w
ith >
1
defe
ndan
t
Aver
age
num
ber o
f de
fend
ants
pe
r cas
e
2005
77,4
9594
,234
10,7
901.2
231
,475
31,7
3022
21.0
112
,629
12,6
290
1.00
2006
77,9
0294
,845
11,0
731.2
235
,943
36,2
9231
61.0
113
,133
13,13
30
1.00
2007
82,8
8710
0,88
511
,814
1.22
39,3
8539
,680
268
1.01
13,2
2613
,226
01.0
020
0887
,735
105,
820
11,9
701.
2141
,337
41,6
9231
01.
0114
,008
14,0
080
1.00
2009
94,3
1111
3,03
212
,522
1.20
38,8
6839
,132
224
1.01
13,9
8113
,981
01.0
0
Sour
ce:
HM
Cou
rts S
ervi
ce C
REST
sys
tem
Not
e:1
Incl
udes
cas
es w
here
a b
ench
war
rant
was
issu
ed, n
o pl
ea re
cord
ed, i
ndic
tmen
t to
lie o
n fil
e, fo
und
unfit
to p
lead
, and
oth
er re
sults

Judicial and Court Statistics 2009 | Chapter 4
112
Tabl
e 4.
6C
row
n C
ourt
Def
enda
nts d
ealt
with
in c
ases
1 com
mitt
ed o
r sen
t for
tria
l, by
ple
a, E
ngla
nd a
nd W
ales
, 200
5–20
09
Year
Tota
l num
ber
of d
efen
dant
s de
alt w
ith
Plea
ent
ered
No
plea
ent
ered
Gui
lty p
leas
as
% ca
ses
with
ple
a
Gui
lty (t
o al
l cou
nts)
Not
Gui
lty 2
Benc
h w
arra
ntO
ther
Num
ber
Perc
enta
geN
umbe
rPe
rcen
tage
Num
ber
Perc
enta
geN
umbe
rPe
rcen
tage
2005
80,7
7249
,261
61%
29,3
2336
%22
90.
3%1,9
592%
63%
2006
83,7
3052
,817
63%
28,7
0934
%23
90.
3%1,9
652%
65%
2007
90,7
2059
,997
66%
28,2
9931
%30
30.
3%2,1
212%
68%
2008
96,0
2765
,571
68%
27,9
2329
%44
40.
5%2,
089
2%70
%20
0910
4,41
871
,442
68%
29,8
3529
%51
40.
5%2,
627
3%71
%
Sour
ce:
HM
Cou
rts S
ervi
ce C
REST
sys
tem
Not
es:
1 In
clud
es c
ases
whe
re a
ben
ch w
arra
nt w
as is
sued
, no
plea
reco
rded
, ind
ictm
ent t
o lie
on
file,
foun
d un
fit to
ple
ad, a
nd o
ther
resu
lts2
Incl
udes
cas
es w
here
def
enda
nts
plea
d no
t gui
lty to
all
coun
ts a
nd a
lso
case
s whe
re d
efen
dant
s pl
ead
not g
uilty
to s
ome
coun
ts

Judicial and Court Statistics 2009 | Chapter 4
113
Table 4.7Crown CourtDefendants dealt with in cases1 committed or sent for trial showing result according to plea, England and Wales, 2005–2009
Year
Total number of defendants entering plea
Plea entered
Guilty to all countsTotal
Not Guilty 2
Total Acquitted 3 Convicted 3Percentage
Acquitted
2005 78,584 49,261 29,323 15,587 13,736 53%2006 81,526 52,817 28,709 17,031 11,678 59%2007 88,296 59,997 28,299 17,226 11,073 61%2008 93,494 65,571 27,923 16,786 11,137 60%2009 101,277 71,442 29,835 18,583 11,252 62%
Source:HM Courts Service CREST systemNotes:1 Excludes cases where a bench warrant was issued, no plea recorded, indictment to lie on file, found unfit to plead, and other results2 Includes cases where defendants plead not guilty to all counts and also cases where defendants plead not guilty to some counts3 Acquitted or convicted on those counts to which defendant pleaded not guilty
Table 4.8Crown CourtDefendants 1 acquitted after a not guilty plea, by manner of acquittal, England and Wales, 2005–2009
Year
Manner of acquittal
% of acquittals by jury verdict
Discharged by judge
Acquittal directed by
judge Jury verdictOther
acquittal 2 Total
2005 8,598 1,638 4,577 774 15,587 29%2006 9,919 1,698 5,165 249 17,031 30%2007 10,360 1,660 5,024 182 17,226 29%2008 10,245 1,497 4,844 200 16,786 29%2009 11,146 1,669 5,535 233 18,583 30%
Source:HM Courts Service CREST systemNotes:1 Includes cases where defendants plead not guilty to all counts and also cases where defendants plead not guilty to some counts2 Other acquittals include where no plea is recorded, autrefois acquit and autrefois convict

Judicial and Court Statistics 2009 | Chapter 4
114
Table 4.9Crown CourtDefendants convicted 1 after a not guilty plea in cases committed or sent for trial, by number of jurors dissenting to the verdict, England and Wales, 2005–2009
Year
Total convicted
after a not guilty plea
Unanimous verdict
1 dissenting juror
(11–1 majority)
2 dissenting jurors
(10–2 majority)
Percentage of convictions
by unanimous verdict
2005 13,736 11,730 766 1,240 85%2006 11,678 9,569 855 1,254 82%2007 11,073 9,049 832 1,192 82%2008 11,137 9,076 817 1,244 81%2009 11,252 9,196 783 1,273 82%
Source:HM Courts Service CREST systemNote:1 Convicted on at least one count to which the defendant pleaded not guilty
Table 4.10Crown CourtAppeals (against decisions of magistrates’ courts) dealt with, by appeal type and result, England and Wales, 2005–2009
Year
Total appellants dealt with
Appeals against verdict Appeals against sentence
Total other appeals 3Total Allowed Dismissed
Abandoned 1 or otherwise
disposed 2%
allowed Total Allowed Dismissed
Abandoned 1 or otherwise
disposed 2%
allowed
2005 12,318 5,127 2,017 1,565 1,545 39% 6,418 2,992 1,789 1,637 47% 773
2006 12,545 5,346 1,958 1,704 1,684 37% 6,533 3,071 1,826 1,636 47% 666
2007 12,446 5,531 2,029 1,749 1,753 37% 6,288 2,830 1,802 1,656 45% 627
2008 13,251 5,915 2,322 1,889 1,704 39% 6,568 2,955 1,802 1,811 45% 768
2009 13,982 6,447 2,678 2,048 1,721 42% 6,838 3,065 1,918 1,855 45% 697
Source:HM Courts Service CREST systemNotes:1 Includes both abandoned in court and abandoned before court appearance2 Includes those remitted back to magistrates’ court3 Includes those for non-Criminal matters including licensing or care proceedings in juvenile cases

Judicial and Court Statistics 2009 | Chapter 4
115
Tabl
e 4.
11C
row
n C
ourt
Prop
ortio
n of
list
ed tr
ials
whi
ch “
crac
ked”
, by
reas
on fo
r the
cra
ck, E
ngla
nd a
nd W
ales
, 20
05–2
009
Year
Tota
l ca
ses
liste
d fo
r tr
ial
Tota
l cr
acke
d tr
ials
Crac
ked
tria
l rat
e
Reas
ons f
or c
rack
1
Def
enda
nt e
nter
s lat
e gu
ilty
plea
Def
enda
nt p
lead
s gui
lty
to a
ltern
ativ
e ch
arge
, ac
cept
ed b
y pr
osec
utio
nD
efen
dant
bou
nd o
ver
Pros
ecut
ion
end
case
Oth
er re
ason
Num
ber
Perc
enta
geN
umbe
rPe
rcen
tage
Num
ber
Perc
enta
geN
umbe
rPe
rcen
tage
Num
ber
Perc
enta
geN
umbe
rPe
rcen
tage
2005
38,2
4414
,575
38.1
%9,
105
62.5
%2,
648
18.2
%33
32.
3%2,
430
16.7
%59
0.4%
2006
36,6
5914
,398
39.3
%9,
157
63.6
%2,
550
17.7
%34
42.
4%2,
289
15.9
%58
0.4%
2007
37,2
8515
,507
41.6
%9,
707
62.6
%2,
754
17.8
%32
22.
1%2,
653
17.1
%71
0.5%
2008
35,9
8514
,772
41.1
%9,
223
62.4
%2,
805
19.0
%27
21.
8%2,
436
16.5
%36
0.2%
2009
39,2
6216
,437
41.9
%10
,451
63.6
%2,
831
17.2
%29
91.
8%2,
826
17.2
%30
0.2%
Sour
ce:
HM
Cou
rts S
ervi
ce C
REST
sys
tem
Not
e:1
From
Sep
tem
ber 2
005
the
reas
ons f
or c
rack
ed tr
ials
wer
e al
igne
d w
ith m
agis
trat
es’ c
ourt
s. Th
e pr
evio
us s
ix re
ason
s wer
e re
plac
ed w
ith tw
elve
and
thes
e ha
ve b
een
cate
goris
ed a
s ab
ove

Judicial and Court Statistics 2009 | Chapter 4
116
Tabl
e 4.
12C
row
n C
ourt
Prop
ortio
n of
list
ed tr
ials
whi
ch w
ere
“ine
ffec
tive”
, by
reas
on, E
ngla
nd a
nd W
ales
, 200
5–20
09
Year
Tota
l ca
ses
liste
d fo
r tr
ial
Tota
l in
effe
ctiv
e tr
ials
Inef
fect
ive
tria
l rat
e
Reas
ons f
or in
effe
ctiv
e tr
ial1
Pros
ecut
ion
not r
eady
Pros
ecut
ion
witn
ess
abse
ntD
efen
ce n
ot re
ady
Def
ence
witn
ess a
bsen
tD
efen
dant
abs
ent /
un
fit to
stan
dCo
urt a
dmin
istra
tive
prob
lem
s
Num
ber
Perc
enta
geN
umbe
rPe
rcen
tage
Num
ber
Perc
enta
geN
umbe
rPe
rcen
tage
Num
ber
Perc
enta
geN
umbe
rPe
rcen
tage
Num
ber
Perc
enta
ge
2005
38,2
445,
216
13.6
%99
019
.0%
1,14
121
.9%
1,11
021
.3%
116
2.2%
1,26
924
.3%
590
11.3
%
2006
36,6
594,
571
12.5
%72
115
.8%
1,02
422
.4%
955
20.9
%11
72.
6%1,
147
25.1
%60
713
.3%
2007
37,2
854,
511
12.1
%81
918
.2%
915
20.3
%85
318
.9%
982.
2%1,
211
26.8
%61
513
.6%
2008
35,9
854,
169
11.6
%77
118
.5%
856
20.5
%78
218
.8%
902.
2%1,
029
24.7
%64
115
.4%
2009
39,2
624,
926
12.5
%85
117
.3%
1,04
021
.1%
867
17.6
%78
1.6%
1,16
823
.7%
922
18.7
%
Sour
ce:
HM
Cou
rts S
ervi
ce C
REST
sys
tem
Not
e:1
From
Sep
tem
ber 2
005
the
reas
ons f
or “
inef
fect
ive”
tria
ls w
ere
alig
ned
with
mag
istr
ates
’ cou
rts.
The
prev
ious
twen
ty fo
ur re
ason
s wer
e re
plac
ed w
ith tw
enty
eig
ht a
nd th
ese
have
bee
n ca
tego
rised
as
abov
e

Judicial and Court Statistics 2009 | Chapter 4
117
Table 4.13Crown CourtSummary statistics on effectiveness of cases listed for trial, by HMCS area and region, 2009
RegionTotal number cases for trial
Number of listings for trial
Ineffective trials Cracked trials Effective trials
Number Percentage Number Percentage Number Percentage
England and Wales 25,261 39,262 4,926 12.5% 16,437 41.9% 17,899 45.6%
HMCS RegionLondon 7,686 10571 1547 14.6% 3386 32.0% 5638 53.3%Midlands 3,343 5101 534 10.5% 2168 42.5% 2399 47.0%North East 3,001 6294 680 10.8% 3794 60.3% 1820 28.9%North West 3,094 5482 652 11.9% 2848 52.0% 1982 36.2%South East 4,741 7084 1013 14.3% 2514 35.5% 3557 50.2%South West 2,253 3040 349 11.5% 1060 34.9% 1631 53.7%Wales 1,143 1690 151 8.9% 667 39.5% 872 51.6%
HMCS AreaAvon & Somerset, Devon & Cornwall, & Gloucestershire
1,065 1429 156 10.9% 511 35.8% 762 53.3%
Bedfordshire, Hertfordshire & Thames Valley
1,365 2073 317 15.3% 707 34.1% 1049 50.6%
Cambridgeshire, Essex, Norfolk & Suffolk
1,615 2298 225 9.8% 898 39.1% 1175 51.1%
Cheshire & Merseyside 1,065 1782 179 10.0% 909 51.0% 694 38.9%Cleveland, Durham & Northumbria
1,150 2466 274 11.1% 1563 63.4% 629 25.5%
Cumbria & Lancashire 812 1527 237 15.5% 817 53.5% 473 31.0%Dorset, Hampshire & Isle of Wight, & Wiltshire
1,188 1611 193 12.0% 549 34.1% 869 53.9%
East Midlands 1,265 2036 263 12.9% 916 45.0% 857 42.1%Greater Manchester 1,217 2173 236 10.9% 1122 51.6% 815 37.5%Humber & South Yorkshire 715 1655 131 7.9% 1089 65.8% 435 26.3%Kent, Surrey & Sussex 1,761 2713 471 17.4% 909 33.5% 1333 49.1%London (Central & South) 3,695 5108 787 15.4% 1523 29.8% 2798 54.8%London (North & West) 3,991 5463 760 13.9% 1863 34.1% 2840 52.0%Mid & West Wales 268 402 43 10.7% 137 34.1% 222 55.2%North & West Yorkshire 1,136 2173 275 12.7% 1142 52.6% 756 34.8%North Wales 174 237 12 5.1% 74 31.2% 151 63.7%South East Wales 701 1051 96 9.1% 456 43.4% 499 47.5%Staffordshire & West Mercia 597 877 73 8.3% 337 38.4% 467 53.2%West Midlands & Warwickshire
1,481 2188 198 9.0% 915 41.8% 1075 49.1%
Source:HM Courts Service CREST system

Judicial and Court Statistics 2009 | Chapter 4
118
Tabl
e 4.
14C
row
n C
ourt
Aver
age
wai
ting
times
for d
efen
dant
s dea
lt w
ith 1 h
avin
g be
en c
omm
itted
for t
rial,
by p
lea
and
rem
and
type
, En
glan
d an
d W
ales
, 200
5–20
09
Year
All
defe
ndan
ts d
ealt
wit
h
By P
lea
By R
eman
d st
atus
3
Def
enda
nts
plea
ding
no
t gui
lty 2
Def
enda
nts
plea
ding
gui
lty
(to
all c
ount
s)D
efen
dant
s re
man
ded
in c
usto
dyD
efen
dant
s re
man
ded
on b
ail
Num
ber
deal
t w
ith
Wai
ting
time
(wee
ks)
% d
ealt
with
in
16 w
eeks
Num
ber
deal
t w
ith
Wai
ting
time
(wee
ks)
% d
ealt
with
in
16 w
eeks
Num
ber
deal
t w
ith
Wai
ting
time
(wee
ks)
% d
ealt
with
in
16 w
eeks
Num
ber
deal
t w
ith
Wai
ting
time
(wee
ks)
% d
ealt
with
in
16 w
eeks
Num
ber
deal
t w
ith
Wai
ting
time
(wee
ks)
% d
ealt
with
in
16 w
eeks
2005
48,2
5613
.371
%17
,481
18.4
54%
30,7
7510
.481
%12
,615
8.8
88%
35,6
4114
.965
%
2006
49,7
3214
.568
%17
,372
20.6
46%
32,3
6011
.379
%12
,578
9.8
85%
37,1
5416
.162
%
2007
53,6
6114
.569
%17
,331
21.3
47%
36,3
3011
.280
%13
,135
9.5
87%
40,5
2616
.163
%
2008
57,6
5313
.573
%17
,037
21.3
48%
40,6
1610
.284
%14
,839
8.9
89%
42,8
1415
.068
%
2009
64,4
1113
.574
%18
,606
21.5
49%
45,8
0510
.284
%15
,976
8.8
90%
48,4
3515
.168
%
Sour
ce:
HM
Cou
rts S
ervi
ce C
REST
sys
tem
Not
es:
1 Ex
clud
es c
ases
whe
re a
ben
ch w
arra
nt w
as is
sued
, no
plea
reco
rded
, ind
ictm
ent t
o lie
on
file,
foun
d un
fit to
ple
ad, a
nd o
ther
resu
lts2
Incl
udes
cas
es w
here
def
enda
nts
plea
d no
t gui
lty to
all
coun
ts a
nd a
lso
case
s whe
re d
efen
dant
s pl
ead
not g
uilty
to s
ome
coun
ts3
This
is re
pres
ente
d by
a d
efen
dant
’s re
man
d st
atus
at t
he s
tart
of t
he fi
rst m
ain
hear
ing

Judicial and Court Statistics 2009 | Chapter 4
119
Tabl
e 4.
15C
row
n C
ourt
Aver
age
wai
ting
times
for d
efen
dant
s dea
lt w
ith 1 h
avin
g be
en s
ent f
or tr
ial,
by p
lea
and
rem
and
type
, En
glan
d an
d W
ales
, 200
5–20
09
Year
All
defe
ndan
ts d
ealt
wit
h
By P
lea
By R
eman
d st
atus
3
Def
enda
nts
plea
ding
no
t gui
lty 2
Def
enda
nts
plea
ding
gui
lty
(to
all c
ount
s)D
efen
dant
s re
man
ded
in c
usto
dyD
efen
dant
s re
man
ded
on b
ail
Num
ber
deal
t w
ith
Wai
ting
time
(wee
ks)
% in
26
wee
ks
Num
ber
deal
t w
ith
Wai
ting
time
(wee
ks)
% in
26
wee
ks
Num
ber
deal
t w
ith
Wai
ting
time
(wee
ks)
% in
26
wee
ks
Num
ber
deal
t w
ith
Wai
ting
time
(wee
ks)
% in
26
wee
ks
Num
ber
deal
t w
ith
Wai
ting
time
(wee
ks)
% in
26
wee
ks
2005
30,5
8419
.576
%11
,936
26.3
61%
18,6
4815
.186
%14
,681
16.7
83%
15,9
0322
.070
%
2006
31,9
5920
.573
%11
,349
28.6
53%
20,6
1016
.084
%15
,657
17.3
82%
16,3
0223
.565
%
2007
34,6
3119
.276
%10
,980
28.6
54%
23,6
5114
.986
%17
,571
15.3
86%
17,0
6023
.266
%
2008
35,9
4818
.678
%10
,902
28.7
55%
25,0
4614
.288
%19
,003
15.1
87%
16,9
4522
.568
%
2009
36,8
6618
.678
%11
,229
28.3
56%
25,6
3714
.488
%19
,245
15.2
87%
17,6
2122
.368
%
Sour
ce:
HM
Cou
rts S
ervi
ce C
REST
sys
tem
Not
es:
1 Ex
clud
es c
ases
whe
re a
ben
ch w
arra
nt w
as is
sued
, no
plea
reco
rded
, ind
ictm
ent t
o lie
on
file,
foun
d un
fit to
ple
ad, a
nd o
ther
resu
lts2
Incl
udes
cas
es w
here
def
enda
nts
plea
d no
t gui
lty to
all
coun
ts a
nd a
lso
case
s whe
re d
efen
dant
s pl
ead
not g
uilty
to s
ome
coun
ts3
This
is re
pres
ente
d by
a d
efen
dant
’s re
man
d st
atus
at t
he s
tart
of t
he fi
rst m
ain
hear
ing

Judicial and Court Statistics 2009 | Chapter 4
120
Table 4.16Crown CourtAverage waiting times for defendants dealt with 1 having been committed for sentence, England and Wales, 2005–2009
Year
Total number of defendants
dealt withWaiting time
(weeks)% within 10
weeks
2005 24,647 6.1 89%2006 25,903 6.0 89%2007 24,209 5.8 91%2008 24,611 5.7 92%2009 23,082 5.7 92%
Source:HM Courts Service CREST systemNote:1 Excludes committals after breach, ‘bring backs’ and deferred sentences
Table 4.17Crown CourtAverage waiting times for appellants dealt with 1 having appealed the decision of a magistrates’ court, England and Wales, 2005–2009
Year
Total number of appellants
dealt withWaiting time
(weeks)% within 14
weeks
2005 10,863 7.5 89%2006 11,171 7.9 87%2007 10,933 8.6 86%2008 12,107 8.7 86%2009 11,865 8.9 86%
Source:HM Courts Service CREST systemNote:1 Excludes cases abandoned before appearance in court

Judicial and Court Statistics 2009 | Chapter 4
121
Tabl
e 4.
18C
row
n C
ourt
Aver
age
hear
ing
times
in ca
ses1 d
ealt
with
, by
case
type
and
ple
a, E
ngla
nd a
nd W
ales
, 200
5–20
09
Year
Com
mitt
ed fo
r tria
lSe
nt fo
r tria
lCo
mm
itted
for
sent
ence
Appe
als a
gain
st M
ags’
de
cisio
n
Not
gui
lty p
lea
Gui
lty p
lea
Not
gui
lty p
lea
Gui
lty p
lea
Num
ber
of ca
ses
deal
t with
Aver
age
hear
ing
time
(hou
rs)
Num
ber
of ca
ses
deal
t with
Aver
age
hear
ing
time
(hou
rs)
Num
ber
of ca
ses
deal
t with
Aver
age
hear
ing
time
(hou
rs)
Num
ber
of ca
ses
deal
t with
Aver
age
hear
ing
time
(hou
rs)
Num
ber
of ca
ses
deal
t with
Aver
age
hear
ing
time
(hou
rs)
Num
ber
of ca
ses
deal
t with
Aver
age
hear
ing
time
(hou
rs)
2005
14,2
808.
428
,803
1.3
8,22
018
.816
,713
1.9
29,4
640.
611
,153
1.0
2006
14,5
878.
428
,291
1.3
8,75
018
.417
,694
1.9
33,3
600.
611
,594
1.1
2007
14,4
898.
031
,142
1.2
8,82
317
.620
,263
1.6
36,0
850.
511
,439
1.1
2008
14,5
338.
135
,840
1.2
8,87
620
.322
,118
1.7
39,3
810.
512
,235
1.0
2009
16,0
507.
640
,904
1.1
9,21
119
.822
,710
1.7
38,0
670.
512
,468
1.0
Sour
ce:
HM
Cou
rts S
ervi
ce C
REST
sys
tem
Not
e:1
Excl
udes
cas
es w
here
a b
ench
war
rant
was
issu
ed, n
o pl
ea re
cord
ed, i
ndic
tmen
t to
lie o
n fil
e, fo
und
unfit
to p
lead
, and
oth
er re
sults

Judicial and Court Statistics 2009 | Chapter 4
122
Table 4.19Crown CourtJury Central Summoning Bureau figures1, 2005–2009
Number of cases
2005 2006 2007 2008 2009
Total number of summons issued 388,154 390,671 412,666 416,689 396,631
Total number of jurors supplied to the court 185,193 181,966 182,661 183,506 176,351
Deferred to serve at a later date 63,741 61,254 66,174 66,806 61,892
Number refused deferral 286 172 122 103 87
Excused by right having served in past 2 years 4,333 4,277 4,518 4,244 3,470
Excused for other reasons 2 93,141 95,559 103,064 104,290 96,563
All excused 97,474 99,836 107,582 108,534 100,033
Number refused excusal 3,585 2,053 1,641 1,515 1,342
Disqualified – residency, mental disorders, criminality 77,364 85,061 94,171 96,325 92,704
Disqualified – on selection3 49,765 53,031 58,900 59,017 56,967
Disqualified – failed Police National Computer (PNC) check3 193 185 207 225 220
Failed to reply to summons 38,322 39,223 40,635 45,192 49,086
Summons undelivered 15,911 18,394 18,325 17,603 13,646
Postponed by Jury Central Summoning Bureau 10,691 6,379 7,274 9,621 7,439
Source:Jury Central Summoning BureauNote:1 Numbers do not add up to the overall total within a given year as the data reflect rolling 12 month periods with ‘carry-
over’ rules applied to certain rows in the table. For example, the number of disqualifications reported for a given year may include disqualifications for summons that were issued in previous years
2 Including childcare, work commitments, medical, language difficulty, student, moved from area, travel difficulties, financial hardship
3 Figures for 2008 published in last year’s report were incorrect

Judicial and Court Statistics 2009 | Chapter 4
123
Table 4.20Crown CourtJuror sitting days and juror utilisation, England and Wales, 2005–2009
YearJuror sitting
days
Juror non-sitting
days
Juror non-attendance
days
Juror utilisation
rate1
2005 841,143 292,908 366,676 56.0%
2006 830,567 279,601 295,260 59.1%
2007 811,937 305,986 252,611 59.2%
2008 846,875 298,485 254,008 60.5%
2009 902,950 263,987 198,152 66.1%
Source:HM Courts Service Performance Database (OPT)Note:1 Juror utilisation rate is the number of sitting days divided by the sum of sitting, non-sitting and
non-attendance days

Judicial and Court Statistics 2009 | Chapter 4
124
Table 4.21Crown CourtSummary statistics on hearing times, waiting time, plea rates and juror utilisation, by HMCS area and region, 2009
Region
Average Hearing Time (hours)
Guilty plea Rate
Average Waiting Time (weeks)Juror
utiliationrate1
Not Guilty plea Trials
Guilty plea Trials
Committal for Sentence Appeal
Not Guilty plea Trials
Guilty plea Trials
Committal for Sentence Appeal
England and Wales 12.0 1.3 0.5 1.0 72% 24.1 11.7 5.7 8.9 66%
HMCS RegionLondon 13.9 1.7 0.7 1.3 58% 29.6 14.6 6.0 9.8 76%Midlands 12.6 1.1 0.5 0.8 76% 21.2 11.0 5.1 7.8 64%North East 8.2 1.0 0.4 0.8 80% 17.8 9.8 5.0 8.5 60%North West 9.7 1.4 0.5 0.9 78% 20.5 11.4 5.1 7.5 63%South East 13.3 1.4 0.6 1.1 69% 26.8 12.9 7.4 9.7 64%South West 11.7 1.3 0.5 1.1 70% 21.4 12.3 5.3 10.5 58%Wales 9.9 1.1 0.5 0.9 75% 17.8 8.6 5.0 7.9 62%
HMCS AreaAvon & Somerset, Devon & Cornwall, & Gloucestershire
10.3 1.3 0.5 1.0 73% 21.9 12.4 5.2 10.7 56%
Bedfordshire, Hertfordshire & Thames Valley
15.9 1.5 0.6 1.1 66% 30.8 14.0 6.2 10.3 64%
Cambridgeshire, Essex, Norfolk & Suffolk
11.1 1.4 0.7 1.0 72% 21.1 11.7 8.1 7.8 62%
Cheshire & Merseyside 9.3 1.2 0.4 0.8 77% 17.9 10.0 5.7 8.5 68%Cleveland, Durham & Northumbria
5.9 1.1 0.4 1.0 80% 16.2 9.7 5.1 6.2 54%
Cumbria & Lancashire 9.6 1.5 0.6 1.0 79% 19.9 11.9 5.0 9.2 56%Dorset, Hampshire & Isle of Wight, & Wiltshire
12.9 1.3 0.5 1.3 67% 21.0 12.3 5.4 10.4 60%
East Midlands 9.6 1.0 0.4 0.8 78% 20.6 11.1 5.2 6.1 60%Greater Manchester 10.1 1.3 0.5 0.9 79% 23.3 12.2 4.7 5.5 63%Humber & South Yorkshire
9.0 0.9 0.3 0.6 83% 19.2 9.7 4.0 8.1 54%
Kent, Surrey & Sussex 13.4 1.2 0.6 1.2 68% 28.9 13.6 7.7 11.2 65%London (Central & South)
16.5 1.7 0.7 1.3 59% 29.4 14.0 6.4 10.4 77%
London (North & West) 11.4 1.7 0.7 1.3 57% 29.9 15.2 5.6 9.1 74%Mid & West Wales 11.4 1.2 0.5 1.1 73% 16.7 8.2 5.9 8.0 66%North & West Yorkshire 10.0 1.1 0.5 0.8 77% 18.6 9.8 6.0 11.9 67%North Wales 8.4 0.9 0.5 0.9 81% 14.4 7.1 4.7 8.1 56%South East Wales 9.8 1.2 0.5 0.9 74% 19.0 9.4 4.6 7.7 62%Staffordshire & West Mercia
18.2 1.1 0.5 0.9 78% 22.4 10.5 6.4 9.9 60%
West Midlands & Warwickshire
13.0 1.2 0.5 0.7 73% 21.3 11.3 4.6 7.9 70%
Source:HM Courts Service CREST systemHM Courts Service Performance Database (OPT) (Juror utilisatiion rate)Note:1 Figures for 2008 published in last year’s report were incorrect

High Court – Chancery Division
Chapter 5

Judicial and Court Statistics 2009 | Chapter 5
126
Chapter 5: High Court – Chancery Division
In England and Wales civil justice is administered mainly by the High Court and county courts (Chapter 1), the former handling the more substantial and complex cases.
Although there is some overlap with the Queen’s Bench Division, certain matters are specifically assigned to the Chancery Division. The core business of the Chancery Division is the resolution of disputes involving property in all its forms, ranging from commercial, business, intellectual property and competition disputes, through taxation of all sorts to its traditional work relating to companies, partnerships, mortgages, insolvency, land and trusts.
The Chancery Division of the High Court comprises the Chancellor of the High Court (the Head of Division since October 2005) and 18 High Court judges. Most Chancery business is dealt with in the Royal Courts of Justice in London and in eight provincial High Court centres which have Chancery jurisdiction.
Information on the data sources used for the High Court statistics can be found in Annex A. Explanations for some of the main terms used in this section can be found in the Glossary. The tables of detailed data can be found immediately following this section of commentary.
Key findings for 2009
There were 49,500 proceedings started in 2009, a decrease of five per from •about 51,900 in 2008.
Applications filed at the Bankruptcy court increased by 18 per cent to 26,100 •from 22,200 in 2008.
In the Companies Court under applications filed the number of originating •and non-originating cases increased by 45 per cent and 58 per cent, respectively from 2008 to 2009.

Judicial and Court Statistics 2009 | Chapter 5
127
Chancery
Most actions begin with the issue of a claim or originating proceedings by the claimant against the defendant and some are disposed of without a trial. Before an action comes to trial there may be a number of interlocutory hearings which are heard by judges and masters (in London) and district judges (outside London). Both masters and district judges are appointed by the Lord Chancellor and are solicitors or barristers of at least seven years standing. Trials come before High Court judges or deputy High Court judges (i.e. approved practitioners, retired High Court judges or circuit judges).
There was a decrease of 62 per cent in Companies Court proceedings outside London between 2008 and 2009. See Table 5.1 for more information.
In 2009, there were approximately 4,900 claims and originating proceedings issued in London, 29 per cent more than in 2008. The increases were seen across many of the different nature of proceedings such as land, business and industry, intellectual property and professional negligence In addition, the number of cases recorded under ‘Other Proceedings’, ‘Other Disputes’, ‘Other applications concerning wills and trusts’ and ‘Other debts, damages and accounts’ were lower compared to previous years due to claims being recorded and categorised more accurately.
Information on the work by masters in London is given in Table 5.2, whilst Tables 5.3 and 5.4 give breakdowns on the proceedings issued, and the cases disposed of, in London during 2009.
Bankruptcy
Bankruptcy is a term applied to insolvency (inability to pay debts) of individuals. Proceedings are started with a petition for bankruptcy. Bankruptcy work is carried out in the High Court at the Royal Courts of Justice, with actions heard by registrars, and in those county courts with bankruptcy jurisdiction where matters are heard by district judges (see Chapter 4 for more information).
There were 10,800 bankruptcy petitions issued in the High Court in London during 2009, a decrease of 11 per cent on the 12,100 in the previous year, mainly due to the petitions by creditors decreasing. Other originating applications increased by 53 per cent, to 15,300 in 2009.
See Table 5.5 for more information.

Judicial and Court Statistics 2009 | Chapter 5
128
Companies Court
The Companies Court in London deals predominantly with the compulsory liquidation of companies and other matters under the Insolvency Act 1986 and Companies Acts. Unlike an individual, a company cannot be made bankrupt but may, because of insolvency or if there is some other reason it should cease to exist, be wound up instead. In addition to winding up proceedings, the Court exercises other powers in relation to registered companies. For example, a company can only reduce its capital with the approval of the Court.
The Court also deals with an increasing number of claims to prevent individuals from being a director, liquidator, administrator, receiver or manager of a company or to take part in the running of a company under the Company Directors Disqualification Act 1986. Most proceedings in the Companies Court are dealt with by registrars but certain applications are heard by judges. The Birmingham, Bristol, Cardiff, Leeds, Liverpool, Manchester, Newcastle-upon-Tyne and Preston District Registries have concurrent jurisdiction with the Companies Court in London.
Under applications filed in the Companies Court in London originating and non-originating petitions, applications and summonses increased by 45 per cent and 58 per cent, respectively, since 2008.
See Table 5.6 for more information.
Patents Court
The Patents Court deals only with matters concerning patents, registered designs and appeals against the decision of the Comptroller General of Patents. Cases suitable to be heard by a county court are dealt with at the Central London County Court.
The Patents Court diary and judgment together with a list of all trials and applications set down for hearing are available from the HM Courts Service website at: www.hmcourts-service.gov.uk
During 2009
64 actions, which included trials and appeals, were listed. Of these 30 were •withdrawn due to settlement or by order resulting from an interlocutory hearing. The hearings took 206 court days, not taking into account judgment writing time.
59 interlocutories, which included case management conferences, •applications for directions, summary judgment, applications to strike out etc, were listed and 28 withdrawn by consent. In the majority of cases of those withdrawn the terms of the order sought were agreed by the parties. The average time for this type of hearing was one hour and the total time taken throughout the year was about 32 court days.
Two appeals against the decision of the Comptroller General of Patents were •listed. The total time taken in court was three court days.

Judicial and Court Statistics 2009 | Chapter 5
129
Table 5.1Chancery DivisionSummary of proceedings started, 2007–2009
Number of cases
Nature of originating proceedings 2007 2008 2009
Claims issued and other originating proceedingsLondon 3,534 3,779 4,887Outside London 1 3,762 5,558 2,242
Bankruptcy Court proceedingsBankruptcy petitions 12,479 12,144 10,770Other Originating applications 8,261 10,022 15,341
Companies Court proceedings 2
London 9,099 11,586 12,885Outside London 8,403 8,852 3,370
Patents Court appeals received 3 5 6
Total 45,541 51,946 49,501
Source:Chancery Division (multiple data sources)Notes:1 Contains estimated originating summonses as follows: 185 in 2006, 349 in 2007, 568 in 2008 and 187
in 20092 Excluding transfers from the Chancery Division

Judicial and Court Statistics 2009 | Chapter 5
130
Table 5.2Chancery DivisionMatters dealt with in chambers by masters in London, 2005–2009
Number of cases
2005 2006 2007 2008 2009
Orders made by masters1
Drawn up by drafting section 7,560 6,927 7,040 6,429 7,514Not drawn up 1,982 2,556 2,555 2,119 1,164Drawn up by solicitors 33 15 2 0 0
Transfers Out 301 261 355 276 243
Enforcement IssuesPossession 39 15 23 36 26Writs of fi-fa2 53 35 49 74 61
Appointments before the mastersOn notice 5,438 5,945 6,303 4,557 3,176Without Notice 920 1,102 1,034 960 1,028
Source:Chancery DivisionNotes:1 Includes final and interlocutory orders2 Writ of fieri facias, to enforce a judgment obtained for debt or damages. Renamed a “writ of control”
under the Tribunals, Courts and Enforcement Act 2007

Judicial and Court Statistics 2009 | Chapter 5
131
Table 5.3Chancery DivisionClaims and originating proceedings issued in London by nature of proceedings, 2005–2009
Number of cases
Nature of proceedings 2005 2006 2007 2008 2009
Land
Contracts of sale and purchase 31 10 10 127 366Landlord and Tenant 2 3 5 28 40Mortgages and charges 12 0 0 7 113Squatters and trespassers 0 1 2 10 29Restrictive covenants 1 1 1 3 11Other Proceedings 788 1,114 924 413 276
Business and industryPartnership 41 28 82 54 106Business fraud claims 1 0 3 1 33Contracts of sale & purchase of shares & business 28 14 1 42 270Other Disputes 716 301 246 348 214
Intellectual propertyConfidential information 11 3 21 23 95Passing off and trade marks 105 50 118 142 171Patents and registered designs 1 54 57 111 111 130 Copyright and design right 1 148 120 172 286 374
Professional negligenceClaims against solicitors 52 30 31 80 210Claims against accountants 1 2 0 0 28Claims against surveyors and estate agents 0 0 0 1 17Claims against members of other professions 13 10 31 66 84
Trusts, wills and probateContentious probate actions 115 73 185 106 152Disputes relating to Trust property 27 10 3 13 44Variation of Trusts 8 2 0 19 34Inheritance (provision for dependants) 15 10 43 80 110Guardianship of minors' estate 0 0 8 5 1Charities 0 1 0 3 10Other applications concerning wills and trusts 318 214 237 365 216
OtherOther debts, damages and accounts 1,701 1,102 343 876 157Revenue appeals 16 0 12 71 276Solicitors 15 10 9 47 0Originating process not otherwise classified 0 1,362 936 452 1,320
Total 4,219 4,528 3,534 3,779 4,887
Source:Chancery chambers, bespoke contribution for this publicationNote:1 These matters are dealt with in the Patents Court

Judicial and Court Statistics 2009 | Chapter 5
132
Table 5.4Chancery DivisionCases listed in London disposed of, by listing type, 2009
Number of cases
Total cases
Number disposed of
TotalAfter trial or hearing Otherwise 1
Trial list 784 189 552 741
General list 971 911 110 1,021
Interim hearing list 2 2,745 2,084 507 2,591
Total 4,500 3,184 1,169 4,353
Source:High Court combined workload returnNotes:1 Settled out of court2 These figures comprise the number of cases which are set down in the Interim Hearings List (which
come from previous hearings before a Master or a Judge) and applications which are issued directly to the Interim Applications Judge. The figures relate to all applications before a Judge, and do not include hearings before a Master. They now also include the Interim Applications List
Table 5.5Chancery DivisionOriginating proceedings in Bankruptcy court, 2005–2009
Number of cases
Applications filed 2005 2006 2007 2008 2009
Bankruptcy petitions 1
By creditors 10,339 9,846 8,730 8,610 7,210
By debtors and legal representatives of deceased debtors
2,810 3,713 3,749 3,534 3,560
Other Originating applications 2,256 6,550 8,261 10,022 15,341
Total 15,405 20,109 20,740 22,166 26,111
Source:Chancery Division business returnsNote:1 Figures are for the Royal Courts of Justice only. See Chapter 1 for details of bankruptcy
petitions issued in the county courts

Judicial and Court Statistics 2009 | Chapter 5
133
Table 5.6Chancery DivisionSummary of Companies Court proceedings, 1 London, 2005–2009
Number of cases
2005 2006 2007 2008 2009
Applications filedWinding-up petitions 4,749 5,152 5,313 6,484 6,604
Other petitions, applications and summonsesOriginating 3,326 4,544 3,786 5,102 7,402Non-originating 3,026 4,708 4,732 5,033 7,939Claims transferred in 470 469 510 782 n/a
Orders madeOn winding-up petitions:
Winding-up orders made 1,924 2,371 2,136 2,982 3,425Dismissed/Withdrawn 2,387 2,555 2,270 3,165 3,279
On other petitions, applications and summonses 10,171 11,552 10,154 13,526 15,390
Transfers to county courts 1,228 1,858 1,437 2,681 2,794
Applications before registrarListed 12,395 13,455 12,724 16,466 18,165Unlisted 435 558 513 555 607
Source:Chancery Division business returnsNote:1 Figures are for the Royal Courts of Justice only

Judicial and Court Statistics 2009 | Chapter 5
134

High Court – Queen’s Bench Division
Chapter 6

Judicial and Court Statistics 2009 | Chapter 6
136
Chapter 6: High Court – Queen’s Bench Division
The Queen’s Bench Division deals mainly with civil actions in contract and tort (civil wrongs) and also hears more specialist matters, such as applications for judicial review.
It contains within it the Commercial Court and the Admiralty Court (dealing with shipping matters such as damage to cargo and collision of ships) and administers the Technology and Construction Court (formerly the Official Referees Court) which hears cases involving prolonged examination of technical issues, such as construction disputes.
Information on the data sources used for the High Court statistics can be found in Annex A. Explanations for some of the main terms used in this section can be found in the Glossary. The tables of detailed data can be found immediately following this section of commentary.
At the end of 2008, the Queen’s Bench Division comprised the President of Queen’s Bench Division and 69 High Court judges. Judges of the Queen’s Bench Division also hear the most important criminal cases in the Crown Court (Chapter 4) and they also sit on the Employment Appeals Tribunal.
Key findings for 2009
There were 18,600 proceedings started in the Queen’s Bench Division in •2009, continuing a flat trend seen in the last few years.
In 2009 about 22 per cent of the total claims in the Queen’s Bench were •personal injury actions.
There was an increase of around 170 per cent in the total number of •judgments without trial in the last two years, to 1,600 in 2009.
In 2009, the average length of trials concluded in 3.8 days. Earlier years had •seen a fluctuating trend with a peak of 4.3 days in 2008.
The number of interlocutory applications for masters in London decreased to •9,300 in 2009 from approximately 11,700 in 2008, and a figure similar to that in 2005.
There was a decrease in enforcement proceedings in London, from 8,200 in •2008 to 1,900 in 2009, mainly due to the number of writs of fieri facias decreasing.

Judicial and Court Statistics 2009 | Chapter 6
137
In 2009, there were 230 claims issued in the Admiralty Court, which was a •five year high and over twice the number of cases in the previous year.
The Commercial Court saw a 25 per cent increase in claims from a level of •1,003 in 2008 to 1,256 in 2009.
In the Technology and Construction Court there was a five year high of 528 •actions received, a 44 per cent increase on 2008.
Queen’s Bench Division: Writs & Originating Proceedings issued, 1996-2009
The graph illustrates the sharp decline in the number of proceedings issued in the Queen’s Bench Division in the late 1990s. This was a consequence of the High Court and County Courts Jurisdiction (Amendment) Order 1999, introduced in April 1999 as part of a major package of reforms to civil justice. This imposed a minimum value of £15,000 on claims issued in the High Court, which was raised to £25,000 from April 2009.
Queen’s Bench Division work is dealt with at the Royal Courts of Justice in London and at district registries of the High Court, located at many of the county courts throughout England and Wales. Each registry covers a defined district consisting of one or more county court districts.
Table 6.4 gives figures on the number of originating receipts and trials concluded in the year, as well as the average length of those trials.
0
20,000
40,000
60,000
80,000
100,000
120,000
140,000
20091996 1997 1998 1999 2000 2001 2002 2003 2004 2005 2006 2007 2008
by Central Off ice by District Registries

Judicial and Court Statistics 2009 | Chapter 6
138
Queen’s Bench
The Queen’s Bench Division deals with common law business, that is, actions relating to contract (except those specifically allocated to the Chancery Division - see Chapter 5) and tort. Examples of contract cases dealt with in the Queen’s Bench Division are failure to pay for goods and services and breach of contract.
There are several types of tort (civil wrongs) including wrongs against the person only (e.g. defamation of character, libel) wrongs against property only (e.g. trespass) and wrongs which may be against people or property (e.g. negligence or nuisance). Some matters may involve both contract and tort, e.g. personal injury cases which show negligence and breach of a contractual duty of care. Others may be crimes as well as torts (e.g. assault).
Actions are normally started by way of a claim or an originating summons. A claim is the most common method and is used, for example, when a claim is based on an allegation of fraud or tort; it informs defendants what is claimed against them. An originating summons is used in certain cases, such as applications under specific Acts; it outlines the nature of the case. The hearing of an originating summons is usually before a master or district judge (for descriptions of masters and district judges see Chapter 5).
If a defendant fails to respond to a claim, a claimant may be entitled to a judgment in default. If a defendant responds any of the following may result:
(a) the claimant discontinues the action
(b) the parties settle (i.e. reach agreement)
(c) the court decides that the defendant has no real defence to the action and gives summary judgment under order 14 of the Rules of the Supreme Court
(d) a trial.
There is a right of trial by jury for fraud, libel, slander, and malicious prosecution or false imprisonment cases. In all other cases the judge has discretion to allow trial by jury but it is only used exceptionally. A trial may result in an award of damages or a non-pecuniary remedy such as an injunction (an order to do or not do something). In jury trials the jury decides the amount of damages to be awarded.
Judgments may be enforced in many ways, the following being the most frequently used:
(a) a writ of fieri facias (fi-fa) directing the sheriff (the equivalent of the bailiff in the county courts) by his officers to seize and if necessary sell the debtor’s goods to raise money to pay off the debt
Judicial and Court Statistics 2009 | Chapter 6
139
(b) a writ of possession of land (eviction takes place if necessary to ensure that possession of property or land is recovered)
(c) a writ of delivery of goods which is an order to hand over specific goods
(d) a charging order on land, securities or funds in court (usually on land - this has the same effect as a mortgage, so that if the property is sold the amount of the charge (debt) must be paid out of the proceeds of the sale)
(e) a third party debt (formerly garnishee) order, which orders that a third party, normally a bank, holding money for the judgment debtor pay it to the judgment creditor direct
(f) appointment of a receiver who will manage the judgment debtor’s property or part of it in such a way as to protect the judgment creditor’s interest in it.
An order to attend court for questioning (formerly an oral examination) is a procedure used in connection with enforcement. The debtor is required to attend court to give details of his earnings, expenses, savings, etc., so that the creditor can decide how best to enforce the judgment. Often the debtor will pay before he can be questioned. Alternatively, a High Court judgment for money may be enforced in a county court as if it were a judgment of that court.
Although Queen’s Bench Division cases are only tried at the Royal Courts of Justice and first tier centres outside London, interlocutory proceedings (applications preparatory or incidental to the main proceedings) are dealt with at all district registries and at the Royal Courts of Justice. This area of work (applications to masters in London) decreased in 2009 by 20 per cent to 9,297 (Table 6.5). The court determines what, if anything, must be done before a case can be set down for trial, gives directions as to when this is to be done and where the trial is to take place. If either party is dissatisfied with an order of a master, an appeal may be made to a judge in chambers (a private hearing). Summary caseload statistics are shown in Tables 6.1 to 6.6.
Admiralty Court
The Admiralty Court deals with shipping matters. The two most common matters dealt with are damage to cargo and collision of ships. Most cases are dealt with at the Royal Courts of Justice in London but some are disposed of in district registries upon transfer from London. There is one Admiralty Judge who hears all admiralty cases and a number of interlocutory matters. The Judge is supported by the Admiralty Registrar who hears interlocutory matters and post judgment applications. The Admiralty Marshal is responsible for the detention and sale of ships which are the subject of proceedings in the Admiralty Court. Summary caseload statistics are shown in Tables 6.7 to 6.9.

Judicial and Court Statistics 2009 | Chapter 6
140
Commercial Court
The Commercial Court also deals with shipping matters but is largely concerned with matters regarding contracts related to ships, insurance, carriage of cargo and the construction and performance of mercantile contracts. Other matters dealt with involve banking, international credit, contracts relating to aircraft, the purchase and sale of commodities and the practice of arbitration and questions arising from arbitrations. There are fifteen Commercial Judges who hear all commercial cases and interlocutory applications. Summary caseload statistics are shown in Table 6.10.
Technology and Construction Court
The Technology and Construction Court deals with building and engineering disputes, and computer litigation. Other matters dealt with include professional negligence, sale of goods, valuation disputes, landlord and tenant (especially dilapidations), torts relating to the occupation of land and questions arising from arbitrations and adjudications in building and engineering disputes.
The business of the court also includes any cases in the Chancery or the Queen’s Bench Divisions which involve issues or questions which are technically complex or for which trial by TCC judges is for any reason desirable.
During 2008 there were five full-time senior circuit judges and two High Court judges based in London assigned to the TCC. Other High Court judges sit in the London TCC as necessary. Outside London, nominated circuit judges deal with TCC business on each of the circuits, with further full-time designated TCC judges at Birmingham, Manchester and Liverpool. Summary caseload statistics are shown in Table 6.11.

Judicial and Court Statistics 2009 | Chapter 6
141
Table 6.1Queen’s Bench DivisionSummary statistics on proceedings started, 2005–2009
Number of cases
Nature of proceedings 2005 2006 2007 2008 2009
Claims and originating summonsesIssued by Royal Courts of Justice 3,841 4,246 4,794 5,173 5,694Issued by district registries 1, 2 11,476 14,118 13,711 13,080 12,889
Total 15,317 18,364 18,505 18,253 18,583
Source:Queen’s Bench Division (compilation from multiple sources)Notes:1 Figures for district registries contain annual estimates of the numbers of originating summonses as
follows: 1,195 in 2005; 1,288 in 2006; 1,619 in 2007; 1,337 in 2008 and 992 in 20092 Figures for district registries also include those cases which were issued for enforcement only

Judicial and Court Statistics 2009 | Chapter 6
142
Table 6.2Queen’s Bench DivisionProceedings started, 1 by nature and value of claim, 2009
Number of claims
Nature of claim
Value of claim
Total£15,000 –
£50,000Over
£50,000 Unspecified
Debt (goods sold & delivered, work carried out etc)
289 328 405 1,022
Breach of contract 147 253 403 803
Clinical Negligence 108 141 528 777
Personal Injury Actions 119 200 914 1,233
Other Negligence (inc. professional negligence)
33 55 274 362
Defamation (libel, slander) 52 62 184 298
Tort (e.g. nuisance, trespass, assault, wrongful arrest, etc.)
3 7 10 20
Recovery of land / property 0 0 18 18
Miscellaneous 141 216 804 1,161
Total 892 1,262 3,540 5,694
Source:High Court combined workload returnNote:1 Figures given are for the Royal Courts of Justice only

Judicial and Court Statistics 2009 | Chapter 6
143
Table 6.3Queen’s Bench Division 1Judgment without trial, by type 2 and value of judgment, 2009
Number of judgments
Type of judgment
Value of judgment
Total£15,000 –
£50,000Over
£50,000 Unspecified
By default 235 492 554 1,281
Order by summary judgment (including order 14)
16 102 205 323
Total 251 594 759 1,604
Source:High Court combined workload returnNotes:1 Figures given are for the Royal Courts of Justice only2 Judgments without trial can be by default (i.e. with no response from the defendant) or by summary
judgment (under Order 14 of the Rules of the High Court)
Table 6.4Queen’s Bench Division 1Originating receipts and trials concluded in the year, 2005–2009
Year Number of originating receipts
Number of trials concluded
Average length of trials concluded (days)
2005 3,841 224 4.12006 4,246 199 3.62007 4,794 221 4.12008 5,173 251 4.32009 5,694 196 3.8
Source:High Court combined workload returnNote:1 Figures given are for the Royal Courts of Justice only

Judicial and Court Statistics 2009 | Chapter 6
144
Table 6.5Queen’s Bench Division 1Interlocutory applications 2 for masters in London, 2005–2009
Year Number of applications
2005 9,3352006 7,6262007 8,7942008 11,6602009 9,297
Source:High Court combined workload returnNotes:1 Figures given are for the Royal Courts of Justice only2 Excludes applications for directions or for summary judgment under Order 14 of the rules of the
High Court
Table 6.6Queen’s Bench Division 1Enforcement proceedings issued, 2009
Number of cases
Nature of Enforcement LondonOutside London Total
Writs of fi-fa 2 1,540 48,100 49,640Writs of possession 7 0 7Writs of Delivery 0 0 0Charging orders 76 0 76Final Third Party Debt Orders 186 0 186Application for orders to attend court for questioning
124 47 171
Total 1,933 48,147 50,080
Source:High Court combined workload returnNotes:1 Figures given are for the Royal Courts of Justice only2 Writ of fieri facias, to enforce a judgment obtained for debt or damages. Renamed a “writ of control”
under the Tribunals, Courts and Enforcement Act 2007
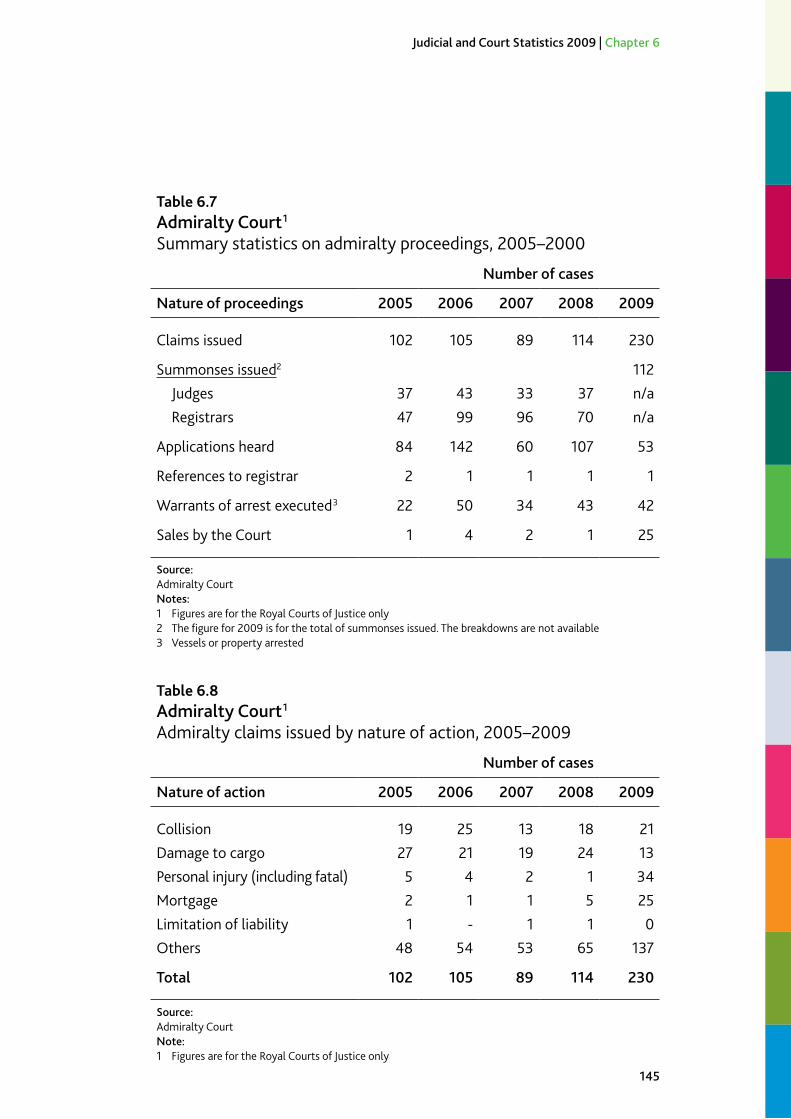
Judicial and Court Statistics 2009 | Chapter 6
145
Table 6.7Admiralty Court 1Summary statistics on admiralty proceedings, 2005–2000
Number of cases
Nature of proceedings 2005 2006 2007 2008 2009
Claims issued 102 105 89 114 230
Summonses issued2 112Judges 37 43 33 37 n/aRegistrars 47 99 96 70 n/a
Applications heard 84 142 60 107 53
References to registrar 2 1 1 1 1
Warrants of arrest executed 3 22 50 34 43 42
Sales by the Court 1 4 2 1 25
Source:Admiralty CourtNotes:1 Figures are for the Royal Courts of Justice only2 The figure for 2009 is for the total of summonses issued. The breakdowns are not available 3 Vessels or property arrested
Table 6.8Admiralty Court 1Admiralty claims issued by nature of action, 2005–2009
Number of cases
Nature of action 2005 2006 2007 2008 2009
Collision 19 25 13 18 21Damage to cargo 27 21 19 24 13Personal injury (including fatal) 5 4 2 1 34Mortgage 2 1 1 5 25Limitation of liability 1 - 1 1 0Others 48 54 53 65 137
Total 102 105 89 114 230
Source:Admiralty CourtNote:1 Figures are for the Royal Courts of Justice only

Judicial and Court Statistics 2009 | Chapter 6
146
Table 6.9Admiralty Court 1Admiralty actions for trial in the High Court set down, tried or otherwise disposed of, 2005–2009
Number of claims
Actions for trial 2005 2006 2007 2008 2009
Total set down 25 10 12 13 17
Tried during year 3 4 3 4 2Otherwise disposed of 19 11 10 9 15
Total tried 22 15 13 13 17
Source:Admiralty CourtNote:1 Figures are for the Royal Courts of Justice only
Table 6.10Commercial Court 1Claims issued showing nature and value of claim, 2009
Number of claims
Nature of claim
Value of claim
Total£15,000 –
£50,000Over
£50,000 Unspecified
Debt 2 2 0 1 3
Breach of contract 12 296 347 655
Miscellaneous 6 84 508 598
Total 20 380 856 1,256
Source:Commercial CourtNotes:1 Figures are for the Royal Courts of Justice only2 Goods sold and delivered, work carried out, etc.

Judicial and Court Statistics 2009 | Chapter 6
147
Table 6.11Technology and Construction Court 1Summary caseload statistics, 2005–2009
Number of actions
2005 2 2006 2007 2008 2009
Received
Claims and originating summonses issued in Registry
274 337 376 341 495
By transfer 66 53 33 25 33
Total 340 390 409 366 528
Disposed of
Tried 3 32 33 39 49
Struck out, settled or discontinued 23 153 160 140 173
Transferred 18 2 7 6 5
Default judgments entered 7 5 16 13 17
Total 51 192 216 198 244
Number of Interlocutory Applications heard 3 496 454 397 374 483
Source:Technology and Construction CourtNotes:1 Figures are for the Royal Courts of Justice only2 Figures for cases tried and cases struck out / settled or discontinued in 2005 are believed to be an undercount.
A complete set of correct figures from the TCC are not available3 Many other Interlocutory Applications were disposed of before hearing, or on the basis of written submissions

Judicial and Court Statistics 2009 | Chapter 6
148

Appellate Courts
Chapter 7

Judicial and Court Statistics 2009 | Chapter 7
150
Chapter 7: Appellate Courts
The various appellate courts are:
The • Judicial Committee of the Privy Council - the final Court of Appeal for 23 Commonwealth territories and four independent Republics within the Commonwealth
The • Supreme Court - the Supreme Court of Appeal in the United Kingdom
The • Court of Appeal - divided into the Criminal Division hearing appeals from the Crown Court and Courts Martial, and the Civil Division hearing appeals mainly against decisions in the High Court and county courts
The • High Court - has three Divisions, Chancery Division (Chapter 5), Queen’s Bench Division (Chapter 6) and Family Division (Chapter 2), each of which handles different types of civil work. It exercises an appellate jurisdiction through its three Divisions in such matters as bankruptcy, judicial review, ‘case stated’ (ruling whether a court or tribunal was wrong in law or in excess of its jurisdiction) and appeals from magistrates’ courts in domestic matters including orders involving children.
Information on the data sources used for the appellate courts’ statistics can be found in Annex A. Explanations for some of the main terms used in this section can be found in the Glossary. The tables of detailed data can be found immediately following this section of commentary.
Key findings for 2009
Some 65 appeals were entered, and 47 disposed of by the Judicial Committee •of the Privy Council during the year, compared to 33 and 58 for 2008 respectively. The vast majority of these appeals were entered overseas.
Of the appeals heard by the Court of Appeal Criminal Division, between •2005 and 2009 there was a 30 per cent reduction in total convictions, a 12 per cent reduction in total sentences and a 23 per cent reduction in the total number of retrials ordered.
In the High Court Queen’s Bench Division in 2009 around 9,100 applications •for permission to apply for judicial review were received, a 27 per cent increase on the corresponding figure of 7,200 for 2008.
In the High Court Family Division in 2009 there were 31 appeals set down for •hearing compared to 58 in the previous year, a reduction of 47 per cent.

Judicial and Court Statistics 2009 | Chapter 7
151
The Judicial Committee of the Privy Council
The Judicial Committee of the Privy Council was given its name and established on its present statutory footing by the Judicial Committee Act 1833. However, the origins of its overseas jurisdiction go back to medieval times when the Sovereign sought his Privy Council’s advice on disputes arising in the Channel Islands. Today, the Judicial Committee of the Privy Council has both a Commonwealth and a domestic jurisdiction.
Appellate Courts: Appeals entered, 1996-20091
1 In October 2009 the UK Supreme Court replaced the Appellate Committee of the House of Lords as the highest court in the UK The 18 applications presented in the House of Lords between January and July 2009, have been included in the 2009 total of House of Lords & Judicial Committee of the Privy Council, whilst the 70 applications presented in the UKSC, between August and December 2009, have not.
0
2000
4000
6000
8000
10000
12000
14000
16000
20091996 1997 1998 1999 2000 2001 2002 2003 2004 2005 2006 2007 2008
House of Lords & Judicial Committee of the Privy Council1
Court of Appeal - Civil Division
Court of Appeal - Criminal Division
High Court
1 In October 2009 the United Kingdom Supreme Court (UKSC) replaced the Appellate Committee of the House of Lords as the highest court in the UK. In 2009 there were a total of 188 applications presented in the House of Lords and the UKSC, 70 of which were presented in the UKSC.

Judicial and Court Statistics 2009 | Chapter 7
152
In its Commonwealth jurisdiction, which is by far the largest part of its work, the Judicial Committee hears appeals from those independent Commonwealth countries which have retained the appeal to Her Majesty in Council or, in the case of Republics, to the Judicial Committee itself. It also hears appeals from the United Kingdom overseas territories. By agreement with the Sultan of Brunei, the Committee can hear appeals from the Brunei Court of Appeal, but in civil matters only, and gives its advice to the Sultan.
The Judicial Committee’s domestic jurisdiction has three main elements:
i. appeals from the Channel Islands and Isle of Man, which are analogous to Commonwealth appeals and are dealt with under the same rules;
ii. appeals under the Veterinary Surgeons Act 1966 from decisions of the Disciplinary Committee of the Royal College of Veterinary Surgeons; until April 2003, appeals also lay from the professional conduct and other committees of the bodies governing the medical, dental and other health-care professions as well, but these now lie to the High Court;
iii. appeals against pastoral schemes under the Pastoral Measure 1983.
Permission to appeal to the Judicial Committee of the Privy Council is usually required. For Commonwealth civil appeals, permission can in many cases be granted by the Court of Appeal of the country or territory concerned. For Commonwealth criminal appeals, permission to appeal cannot be given by the Court of Appeal except where a question of constitutional interpretation arises. Leave to appeal is not required for appeals under the Veterinary Surgeons Act 1966. Where permission to appeal is required and cannot be given or has been refused by the Court of Appeal, the would-be appellant may apply by way of petition to the Judicial Committee for permission to appeal. All permission applications are dealt with on the papers unless they are referred for an oral hearing.
Commonwealth appeals and references are normally heard by a board of five members of the Judicial Committee; other appeals are normally dealt with by a Board of three, which is the quorum.
More information about the Judicial Committee and its work, including the full text of recent judgments and statistics for 1996-2008, can be found on the Privy Council Office website, at http://www.privy-council.org.uk
There may be an eventual decline in the Judicial Committee’s volume of work. New Zealand, one of the largest single sources of appeals, legislated in 2003 to abolish appeals to the Privy Council. The Caribbean Court of Justice, which has now been established, has taken over the Judicial Committee’s appellate jurisdiction in respect of some of the Commonwealth countries in the Caribbean.

Judicial and Court Statistics 2009 | Chapter 7
153
Summary caseload statistics on the work of the Judicial Committee of the Privy Council are shown in Tables 7.1 and 7.2.
The Supreme Court
The UK Supreme Court is the final court of appeal in the United Kingdom. It was created in October 2009 and replaced the House of Lords as the United Kingdom’s highest court.
The UK Supreme Court (UKSC) hears appeals on arguable points of law of general public importance which ought to be considered by the Supreme Court at that time, bearing in mind that the causes will have already been the subject of judicial decision.
The Rules and Practice directions governing the procedures applicable to civil and criminal appeals can be found on the website of the UKSC at www.supremecourt.gov.uk
Since the UKSC replaced the House of Lords during the course of 2009, the statistics regarding petitions for leave to appeal to the highest court received and disposed of (see Tables 7.3a and 7.3b), and appeals received and disposed of (Tables 7.4a, 7.4b and 7.5), have been split. Statistics for cases dealt with by the UKSC towards the end of 2009 are labelled as “August to December 2009”. This is because, even though the UKSC officially came into existence in October, its administrative office was open to receiving cases in August and September. Such cases will have subsequently begun being substantively dealt with by the UKSC from October onwards. No cases were disposed of during these months, but for consistency the UKSC statistics on disposals have also been labelled “August to December”. Statistics on cases received and disposed of by the House of Lords earlier in the year, prior to the UKSC’s creation, are labelled “January to July 2009”.
Civil appeals
An appeal lies to the UKSC:
(1) from any order or judgment of the Court of Appeal in England and Wales, with the permission of that court or, if refused, by permission of the Supreme Court, subject to restrictions in respect of specific matters;
(2) subject to statutory restrictions, direct from a decision of the High Court of Justice in England and Wales by permission of the Supreme Court;
(3) from any order or judgment of the Court of Appeal in Northern Ireland, with the permission of that court or, if refused, by permission of the Supreme Court, subject to restrictions in respect of specific matters;

Judicial and Court Statistics 2009 | Chapter 7
154
(4) subject to statutory restrictions, direct from a decision of the High Court of Justice in Northern Ireland by permission of the Supreme Court;
(5) from the Inner House of the Court of Session in Scotland against a judgment on the whole merits of a cause. No permission required;
(6) from the Inner House of the Court of Session against an interlocutory judgment where there is a difference of opinion among the judges. No permission required;
(7) from the Inner House of the Court of Session where the interlocutory judgment is one sustaining a dilatory defence and dismissing the action. No permission required;
(8) from the Inner House of the Court of Session against any other interlocutory judgments (excluding those listed in (6) and (7) above) with the leave of the Inner House of the Court of Session;
(9) from an interlocutor of the Court of Session granting or refusing a new trial. No permission required;
(10) from an interlocutor of a Lord Ordinary after review by the Inner House of the Court of Session;
(11) from judgments of the Court of Session under section 27 of the Court of Session Act 1988 relating to special cases (subject to certain restrictions); and
(12) from any order or judgment of any court in Scotland from which error or appeal lay on or immediately before 1 November 1876 by common law or by statute.
Appeals and references under the devolution statutes of 1998, which give the Judicial Committee jurisdiction to hear and determine “devolution issues”, i.e. issues as to the functions and powers of the devolved legislative and executive authorities established in Scotland, Northern Ireland and Wales.
Criminal appeals
An appeal lies, with permission, to the Supreme Court at the instance of the defendant or the prosecutor:
(1) from any decision of the Court of Appeal Criminal Division in England and Wales or the Court of Appeal in Northern Ireland on an appeal to that court;
(2) from any decision of the Courts-Martial Appeal Court on an appeal to that court; and

Judicial and Court Statistics 2009 | Chapter 7
155
(3) from any decision of the High Court of Justice in England and Wales or of the High Court of Justice in Northern Ireland in a criminal cause or matter.
Permission may be granted by the court below or, if refused, by the Supreme Court. Permission to appeal in a criminal cause or matter may only be granted if it is certified by the court below that a point of law of general public importance is involved in the decision of that court - and if it appears to that court or to the Supreme Court that the point is one that ought to be considered by the Supreme Court. A certificate is not required for an appeal from a decision of the High Court in England and Wales or in Northern Ireland on a criminal application for habeas corpus, an appeal under s 5(4) of the Human Rights Act 1998, or in contempt of court cases where the decision of the court below was not a decision on appeal.
No appeal lies to the Supreme Court from the High Court of Justiciary in Scotland except under the devolution jurisdiction.
Applications for permission
Applications for permission to appeal are referred to an Appeal Panel of at least three Justices. Permission to appeal is usually determined on the basis of written submissions by the parties, but the Panel may decide to hold a hearing so that counsel can make oral submissions, before the Appeal Panel makes a final decision on the application.
In the House of Lords in 2009, prior to the creation of the Supreme Court, 118 petitions for permission to appeal were presented, 104 and were disposed of, of which 43 were allowed outright. See Table 7.3a for more information.
In the Supreme Court, 70 petitions for permission to appeal were presented, 69 and were disposed of, of which 18 were allowed outright. See Table 7.3b for more information. As noted above, these statistics include cases lodged with the Supreme Court’s administrative office in August and September of 2009 ahead of its formal creation in October.
Appeals
Appeals are heard by a Court, usually consisting of five justices and hearings typically last two days.
In the House of Lords, 40 appeals were presented, of which 31 were from the Civil Division of the Court of Appeal of England and Wales. In the Supreme Court 30 appeals were presented, of which 26 were from the Civil Division of the Court of Appeal of England and Wales. There were 41 and 23 civil appeals determined in the House of Lords and the Supreme Court, respectively. See Tables 7.4a, 7.4b and 7.5 for more information.

Judicial and Court Statistics 2009 | Chapter 7
156
The Court of Appeal
The Court of Appeal is divided into two Divisions, criminal and civil. Its courtrooms and offices are situated in the Royal Courts of Justice in London. The judges of the Court of Appeal are the Lord Chief Justice, the Master of the Rolls and 37 Lords Justices. The President of the Family Division and the Vice-Chancellor of the Chancery Division also sit there for part of their time.
The Criminal Division, presided over by the Lord Chief Justice and the Vice-President of the Criminal Division, hears appeals in criminal matters from the Crown Court. Courts are constituted from the Lord Chief Justice, Vice-President and Lords Justices, assisted by High Court judges as required.
The Civil Division, presided over by the Master of the Rolls, hears appeals mainly against decisions of the High Court and county courts and also of tribunals and certain other courts, such as the Patents Court. In the Civil Division, courts of two or three judges are normally constituted from the Master of the Rolls and the Lords Justices.
Criminal Division
During 2009, there were 7,195 applications for leave to appeal received, of which 1,435 were against conviction in the Crown Court and 5,443 against the sentence imposed. Of the applications for leave to appeal which were considered by a single judge, 22 per cent (275) of those seeking to appeal against conviction were granted as were 31 per cent (1,298) against sentence (22 per cent and 33 per cent respectively in 2008). 477 conviction applications and 763 sentence applications were renewed to the full Court. See Table 7.6.
The total number of applications to renew granted by Full Court fell by 33 per cent, from 809 in 2008 to 546 in 2009, whilst the majority of the other groups of applications by type increased in the same period.
Of the appeals heard by the Full Court during 2009, 38 per cent (164) appeals against conviction were allowed and 73 per cent (1,372) appeals against sentence were allowed. See Table 7.7.
Comparing the previous two years, there was an 18 per cent decrease in retrievals ordered by Full court, bringing the level in 2009 (59) more in line with the 2006 level (58).

Judicial and Court Statistics 2009 | Chapter 7
157
Civil Division
The total number of final appeals filed in 2009 remained at the same level as in 2008 (1,225). There was an 18 per cent decrease in interlocutory appeals filed in 2009 compared to 2008, mainly due a reduction in appeals filed in the Family County Court, from 24 in 2008 to 14 in 2009. Between 2005 and 2009 there was around a 50 per cent reduction in applications set down and disposed of by the registrar / master, a far greater reduction than for Full Court, Single Judge and Permission to Appeal. See Tables 7.8 - 7.10 for more information.
The High Court
The three Divisions of the High Court exercise appellate jurisdiction in the following manner-
(a) the Divisional Court of the Chancery Division hears appeals in revenue matters from the Commissioners of Taxes. All bankruptcy appeals from the county courts and from the High Court Registrars under the Insolvency Act 1986 are heard by a single judge of the Chancery Division
(b) the Divisional Court of the Queen’s Bench Division and the Administrative Court nominated judges, exercise jurisdiction in respect of-
(i) Judicial Review
(ii) appeals by way of ‘case stated’
(iii) habeas corpus
(iv) committal for contempt committed in an inferior court or elsewhere (but not in connection with proceedings in the High Court)
(v) appeals and applications under various statutory provisions including those on planning matters under the Town and Country Planning Acts
(vi) appeals and applications in disciplinary matters concerning healthcare professionals and others.
(c) the Divisional Court of the Family Division hears appeals from magistrates’ courts in a wide variety of domestic matters including orders involving children. The appeals are entered at the Principal Registry in London.
In the Administrative Court, supervisory jurisdiction, by way of judicial review, is exercised over the Crown Court (for matters not relating to trial on indictment), inferior courts and tribunals, and the actions and decisions of public bodies, Government ministers or other persons charged with the performance of public acts and duties. The remedy of judicial review is concerned with the legality and

Judicial and Court Statistics 2009 | Chapter 7
158
propriety of the decision-making process, as distinct from the merits of the decision in question. It is only appropriate when all other avenues of appeal have been exhausted. The Court exercises control when deemed appropriate by making what are known as ‘prerogative orders’. These may for example command a person or body to perform a duty, prohibit an inferior court or tribunal from exceeding its jurisdiction, or quash the decision under challenge.
Appeals by way of case stated arise when a person is dissatisfied on a point of law with a decision of the Crown Court (for matters not relating to trial indictment), a magistrates’ court or other tribunal. The court or tribunal concerned is required to ‘state a case’ by preparing a statement for the opinion of the High Court, giving the facts and the reason for the decision and setting out the question for the High Court.
An application for a writ of habeas corpus is usually made to the Divisional Court, but if no court is sitting a single judge may hear the matter. This procedure provides for a person detained in custody (e.g. in prison, police cell or elsewhere) to challenge the legality of his detention. If the imprisonment is found to be unlawful the court will order release, but otherwise the person concerned is returned to custody.
In 2005 a new jurisdiction was added by s103A of the Nationality Immigration and Asylum Act 2002 – power to order the Asylum and Immigration Tribunal to reconsider an appeal against a decision refusing asylum or other decision of the Border and Immigration Agency (previously known as the UK Immigration and Nationality Directorate). As of 15 February 2010, jurisdiction for these matters passed to the Immigration and Asylum Chamber of the Upper Tribunal.
Chancery Division
There was a large drop in bankruptcy appeals after 2006 because, with effect from October 2006, all bankruptcy cases require permission to appeal. The number of tribunals set down for hearing and total disposals fell between 2008 and 2009 whilst those set down and disposed of in the county courts and Chancery Masters increased. See Table 7.11 for more information.
Administrative Court
There were 9,097 applications for permission to apply for judicial review received in the Administrative Court in 2009. Some 24 per cent (862) of the total applications for permission to apply for judicial review considered in 2009 were granted. Of the 495 substantive applications for judicial review disposed of in 2009, 39 per cent (192) were allowed, 57 per cent (282) were dismissed and 4 per cent (21) were withdrawn (Table 1.12).

Judicial and Court Statistics 2009 | Chapter 7
159
A total of 88 appeals by way of case stated were received in 2009, a decrease of seven per cent on 2008 (95). The vast majority of these, 79 per cent (76) were appeals from magistrates’ courts. Of the cases disposed of in 2009 (96), 55 per cent (53) were allowed and 45 per cent (43) were dismissed (Table 1.13).
A total of 6,435 appeals and applications other than by way of judicial review and case stated were received in the Administrative Court during 2009, an increase of 27per cent on 2008 (5,052). 86 per cent (5,563) of these were Reconsideration (s103a NIAA 2002) appeals (Table 1.14). The transfer of Reconsideration applications to the Upper Tribunal on 15 February 2010, will result in a significant reduction in appeals and applications received by the Administrative Court in 2010.
Regional Offices of the Administrative Court opened in Birmingham, Cardiff, Leeds and Manchester on the 21 April 2009. Seven per cent (1,049) of all applications received in 2009 (15,620) were issued in the Regional Offices.
There was a 27 per cent increase between 2008 and 2009 in applications for permission to apply for judicial review received, mainly due to the increase in the levels of immigration/asylum applications received from 4,643 to 6,660.
Appeals from the magistrates’ courts increased from a level of 59 in 2008 to 76 in 2009, close to a 30 per cent increase.
Family Division
In the Family Division there were 31 appeals set down for hearing and 31 disposals in 2009. The majority of hearings and disposals were under section 94 of the Children Act 1989, continuing a similar trend to previous years.
Cases ‘pending’ for more than one year can be dismissed at the discretion of the President of the Family Division.

Judicial and Court Statistics 2009 | Chapter 7
160
Table 7.1Judicial Committee of the Privy CouncilAppeals entered and disposed of, showing results, 2009
Number of appeals
Courts from which appeals were brought
Number of appeals
entered
Appeals disposed of, by resultAppeals pending
at end of year
Dismissed after
hearing
Varied after
hearing
Allowed after
hearing
Disposed without a
hearing1 Total
Overseas:
Anquilla 1 0 0 1 0 1 0
Antigua and Barbuda 0 1 0 0 0 1 0
The Bahamas 5 2 1 2 0 5 3
Belize 2 0 0 3 0 3 3
Bermuda 3 0 1 0 0 1 4
British Virgin Islands 1 1 0 0 0 1 0
Cayman Islands 2 1 0 0 0 1 1
Dominica 0 0 0 1 0 1 0
Gibraltar 2 0 0 3 0 3 1
Isle of Man 6 0 0 0 0 0 6
Jamaica 9 1 1 5 0 7 4
jersey 4 0 0 2 0 2 2
Mauritius 8 0 0 3 0 3 6
St Christopher & Nevis 2 1 0 0 0 1 2
St Lucia 1 0 0 3 0 3 0
St Vincent and the Grenadines 1 1 0 0 0 1 0
Trinidad and Tobago 16 4 0 5 0 9 8
Turks & Caicos 1 2 0 0 0 2 0
United Kingdom:
Appeals under the Scotland Act 1998 0 0 1 0 0 1 0Appeals under the Veterinary Surgeons Act 1966 1 0 0 0 1 1 0
Total 65 14 4 28 1 47 40
Source:Judicial Committee of the Privy CouncilNote:1 Dismissed for non-prosecution or withdrawn

Judicial and Court Statistics 2009 | Chapter 7
161
Table 7.2Judicial committee of the Privy Council Petitions for special leave to appeal heard, granted and refused, 2009
Number of petitions
Country or jurisdiction of origin Granted Refused
Total number
heard
The Bahamas 1 1 2Belize 3 0 3British Virgin Islands 1 1 2Cayman Islands 2 0 2Guernsey 0 1 1Grenada 2 0 2Isle of Man 0 5 5Jamaica 1 5 6Jersey 1 2 3Mauritius 1 2 3St Christopher and Nevis 1 0 1St Lucia 1 2 3St Vincent and the Grenadines 0 1 1Trinidad and Tobago 1 1 2Turks and Caicos Islands 1 5 6
Total 16 26 42
Source:Judicial Committee of the Privy Council

Judicial and Court Statistics 2009 | Chapter 7
162
Table 7.3aHouse of LordsPetitions for leave to appeal presented and disposed of, showing results, January-July 20091
Number of petitions
Courts from which appeals were brought
Number of petitions
presented
Appeals disposed of, by resultTotal
disposed ofWithdrawn Allowed
Allowed on terms Refused Dismissed
England and Wales
Court of Appeal
Civil 103 1 39 0 51 0 91
Criminal 0 0 0 0 0 0 0
High Court
Civil 0 0 2 0 0 0 2
Criminal 9 0 2 0 3 0 5
Scotland
Court of Session 0 0 0 0 0 0 0
Northern Ireland
Court of Appeal
Civil 4 0 0 1 4 0 5
Criminal 1 0 0 0 1 0 1
High Court
Civil 1 0 0 0 0 0 0
Criminal 0 0 0 0 0 0 0
Other
Courts Martial Appeal Court 0 0 0 0 0 0 0
Attorney General’s reference 0 0 0 0 0 0 0
Total 118 1 43 1 59 0 104
Source:House of LordsNote:1 In October 2009 the United Kingdom Supreme Court (UKSC) replaced the Appellate Committee of the House of Lords as the highest
court in the UK so the figures presented are for January-July 2009 in the House of Lords

Judicial and Court Statistics 2009 | Chapter 7
163
Table 7.3bSupreme CourtApplications for permission to appeal presented and disposed of, showing results, August-December 20091
Number of applications
Courts from which appeals were brought
Number of applications
presented
Appeals disposed of, by resultTotal
disposed ofWithdrawn Allowed
Allowed on terms Refused Dismissed
England and Wales
Court of Appeal
Civil 57 2 18 0 39 0 59
Criminal 9 1 0 0 7 0 8
High Court
Civil 0 0 0 0 0 0 0
Criminal 0 0 0 0 0 0 0
Scotland
Court of Session 3 0 0 0 1 0 1
Northern Ireland
Court of Appeal
Civil 0 0 0 0 0 0 0
Criminal 1 0 0 0 1 0 1
High Court
Civil 0 0 0 0 0 0 0
Criminal 0 0 0 0 0 0 0
Other
Courts Martial Appeal Court 0 0 0 0 0 0 0
Attorney General’s reference 0 0 0 0 0 0 0
Total 70 3 18 0 48 0 69
Source:Supreme CourtNote:1 In October 2009 the United Kingdom Supreme Court (UKSC) replaced the Appellate Committee of the House of Lords as the highest
court in the UK so the figures presented are for August-December 2009 in the UKSC

Judicial and Court Statistics 2009 | Chapter 7
164
Table 7.4aHouse of LordsAppeals presented and disposed of, showing results, January-July 20091
Number of petitions
Courts from which appeals were brought
Appeals presented
Appeals disposed of, by result
Total disposals
Disposed without a judgment Allowed Dismissed
England and Wales
Court of Appeal
Civil 31 2 22 13 37
Criminal 2 0 4 3 7
High Court
Civil 1 0 0 1 1
Criminal 3 0 0 4 4
Scotland
Court of Session 2 1 1 0 2
Northern Ireland
Court of Appeal
Civil 1 1 0 2 3
Criminal 0 0 0 0 0
High Court
Civil 0 0 0 3 3
Criminal 0 0 0 0 0
Other
Courts Martial Appeal Court 0 0 0 0 0
Attorney General’s reference 0 0 0 0 0
Total 40 4 27 26 57
Source:House of LordsNote:1 In October 2009 the United Kingdom Supreme Court (UKSC) replaced the Appellate Committee of
the House of Lords as the highest court in the UK so the figures presented are for January-July 2009 in the House of Lords

Judicial and Court Statistics 2009 | Chapter 7
165
Table 7.4bSupreme CourtAppeals presented and disposed of, showing results, August-December 20091
Number of appeals
Courts from which appeals were brought
Appeals presented
Appeals disposed of, by result
Total disposals
Disposed without a judgment Allowed Dismissed
England and Wales
Court of Appeal
Civil 26 1 3 2 6
Criminal 0 0 0 0 0
High Court
Civil 0 0 0 0 0
Criminal 0 0 0 0 0
Scotland
Court of Session 3 1 0 0 1
Northern Ireland
Court of Appeal 1 0 0 0 0
Civil 0 0 0 0 0
Criminal
High Court 0 0 0 0 0
Civil 0 0 0 0 0
Criminal
Other 0 0 0 0 0
Courts Martial Appeal Court 0 0 0 0 0
Attorney General’s reference
Total 30 2 3 2 7
Source:UK Supreme CourtNote:1 In October 2009 the United Kingdom Supreme Court (UKSC) replaced the Appellate Committee of
the House of Lords as the highest court in the UK so the figures presented are for August-December 2009 in the UKSC

Judicial and Court Statistics 2009 | Chapter 7
166
Table 7.5House of Lords and Supreme CourtCivil appeals (England and Wales) presented from the Court of Appeal, disposed of by judgment, by subject matter in 2005–20091
Number of appeals determined
Subject matter 2005 2006 2007 2008 Jan-July 2009
Aug-Dec 2009
Administrative 10 3 1 13 0 0Arbitration 0 0 1 0 0 0Asylum/Immigration 0 0 4 5 6 7Commercial 2 1 3 3 1 0Company 1 0 1 2 0 3Contract 2 0 3 3 5 1Crime 3 0 2 17 11 2Discrimination 3 1 3 0 0 2Employment 0 7 0 0 1 0European Law 0 1 1 2 0 0Family 4 6 0 1 4 3Finance & Credit 0 0 1 0 0 0Human Rights 19 14 9 10 4 3Intellectual Property 1 0 1 1 2 0International 3 5 0 0 0 0Land 2 3 1 1 1 0Landlord and Tenant 0 0 1 6 1 0Planning 0 1 1 0 0 1Practice & Procedure 2 3 2 2 0 0Revenue 10 5 2 3 2 0Sale of Goods 0 0 0 0 0 0Tort 4 9 8 5 3 1Trusts 2 0 0 0 0 0
Total 68 59 45 74 41 23
Source:House of Lords and Supreme CourtNote:1 In October 2009 the United Kingdom Supreme Court (UKSC) replaced the Appellate Committee of the
House of Lords as the highest court in the UK so the figures presented for 2009 are for January-July in the House of Lords and for August-December in the UKSC

Judicial and Court Statistics 2009 | Chapter 7
167
Table 7.6Court of Appeal (Criminal Division)Applications for leave to appeal, by type and result 2005–2009
Number of applications
2005 2006 2007 2008 2009
Applications received
Conviction 1,661 1,596 1,508 1,588 1,435
Sentence 5,178 5,082 5,087 5,422 5,443
Other Receipts 1 184 259 305 230 317
Total 7,023 6,937 6,900 7,240 7,195
Applications considered by single judge
Conviction
Granted 360 291 288 212 275
Refused 1,111 843 881 774 958
Sentence
Granted 1,541 1,261 1,363 1,204 1,298
Refused 3,092 2,503 2,763 2,468 2,948
Total 6,104 4,898 5,295 4,658 5,479
Applications renewed
Conviction 557 481 520 400 477
Sentence 824 831 845 670 763
Total 1,381 1,312 1,365 1,070 1,240
Applications to renew granted by Full Court
Conviction 141 137 125 146 117
Sentence 326 425 519 663 429
Total 467 562 644 809 546
Source:Court of Appeal (Criminal Division)Note:1 Other Receipts, reported from 2005 onwards, include the following applications: – Applications under s159 Criminal Justice Act 1988 – Interlocutory Appeals under s6 Criminal Justice Act 1987 – Appeals against Minimum Terms for mandatory life sentences set by the High Court under schedule
22 Criminal Justice Act 2003 – References from the Attorney General under s36 Criminal Justice Act 1988 – Prosecution Rights of Appeal – Confiscation and Restraint Order appeals under Proceeds of Crime Act 2002 – Appeals against Wasted Costs Orders under section 3(c) of the Costs in Criminal Cases (General)
(Amendment) Regulations 1991

Judicial and Court Statistics 2009 | Chapter 7
168
Table 7.7Court of Appeal (Criminal Division)Results of appeals heard by Full Court, 2005–2009
Number of appeals
2005 2006 2007 2008 2009
Conviction
Allowed 228 181 196 188 164
Dismissed 386 391 327 250 266
Sentence
Allowed 1,534 1,391 1,632 1,567 1,372
Dismissed 619 575 619 527 515
Number of retrials ordered 1 77 58 83 72 59
Source:Court of Appeal (Criminal Division)Note:1 The number of conviction appeals allowed includes the number of re-trials ordered

Judicial and Court Statistics 2009 | Chapter 7
169
Table 7.8Court of Appeal (Civil Division)Final appeals filed and disposed of, showing court appealed from and results, 2009
Number of appeals
Court or tribunal appealed from
Total appeals
filed
Appeals disposed of, by result
Total disposalsAllowed Dismissed
Dismissed by consent Struck out1
Otherwise disposed of
Chancery 98 35 50 25 1 5 116
Revenue 28 5 5 0 - - 10
Bankruptcy 20 4 8 5 - 1 18
Family Division 27 12 11 5 - 0 28
Queen’s Bench 117 27 41 19 - 2 89
Queen’s Bench Administrative Court 192 66 73 17 - 14 170
Queen’s Bench Commercial 82 19 58 16 1 8 102
Queen’s Bench Admiralty 0 0 0 1 - - 1
County Court 208 65 58 30 1 6 160
County Court Family 51 27 17 3 - 0 47
County Court Admiralty - - - - - - -
Lands Tribunal 4 - 1 1 - - 2
Employment Appeal Tribunal 56 18 26 2 - 0 46
Asylum & Immigration Tribunal 298 209 53 33 1 16 312
Patents Court 27 7 10 1 0 1 19
Social Security Commissioner 5 2 4 0 - - 6
Other Tribunals 12 8 4 1 - - 13
Total 1,225 504 419 159 4 53 1,139
Source:Court of Appeal (Civil Division)Note:1 For failure to provide documents

Judicial and Court Statistics 2009 | Chapter 7
170
Table 7.9Court of Appeal (Civil Division)Interlocutory appeals filed and disposed of, showing court appealed from and results, 2009
Number of appeals
Court or tribunal appealed from
Total appeals
filed
Appeals disposed of, by result
Total disposalsAllowed Dismissed
Dismissed by consent Struck out1
Otherwise disposed of
Chancery 0 - - - - - 0
Revenue - - - - - - 0
Bankruptcy 1 1 1 1 - - 3
Family Division 3 3 0 - - 0 3
Queen’s Bench 22 6 5 5 - 1 17
Queen’s Bench Administrative Court 3 4 1 - - 1 6
Queen’s Bench Commercial 4 1 2 - - - 3
Queen’s Bench Admiralty - - - - - - 0
County Court 1 1 - - - - 1
County Court Family 14 6 7 2 - - 15
County Court Admiralty - - - - - - 0
Lands Tribunal - - - - - - 0
Employment Appeal Tribunal 1 - - - - - 0
Asylum & Immigration Tribunal 1 1 - - - 1 2
Patents Court - - - - - - 0
Social Security Commissioner - - - - - - 0
Other Tribunals - - - - - - 0
Total 50 23 16 8 - 3 50
Source:Court of Appeal (Civil Division)Note:1 For failure to provide documents

Judicial and Court Statistics 2009 | Chapter 7
171
Table 7.10Court of Appeal (Civil Division)Applications set down and disposed of, 2005–2009
Number of applications
2005 2006 2007 2008 2009
Full Court1
Filed 291 230 201 249 265
Disposed 264 245 215 243 245
Single Judge
Set down 286 251 152 213 216
Disposed 274 247 150 195 213
Permission to Appeal
Set down 2,579 2,397 2,574 2,759 2,443
Disposed 2,495 2,530 2,416 2,579 2,573
Registrar / Master
Set down 122 87 79 73 66
Disposed 121 87 83 77 60
Total
Filed / Set down 3,278 2,965 3,006 3,294 2,990
Disposed 3,154 3,109 2,864 3,094 3,091
Source:Court of Appeal (Civil Division)Note:1 Includes new ‘leave to appeal’ cases

Judicial and Court Statistics 2009 | Chapter 7
172
Table 7.11High Court – Chancery DivisionAppeals and special cases from inferior courts and tribunals set down and determined, showing subject matter and results, 2009
Number of appeals
Subject matter
Total set down for
hearing
Appeals disposed of, by result
Total disposals
Allowed after hearing
Dismissed after hearing
Withdrawn or struck out
Bankruptcy
County courts 19 9 5 3 17
High Court Registrars 25 10 10 2 22
Total 44 19 15 5 39
Tribunals1 57 8 18 8 34
County courts & Chancery Masters 33 11 11 4 26
Source:High Court – Chancery DivisionNote:1 From April 2009 the majority of the Tribunal Appeals went under the jurisdiction of The Upper Tribunal, Tax & Chancery Chamber

Judicial and Court Statistics 2009 | Chapter 7
173
Table 7.12High Court – Administrative Court1
Summary statistics on Judicial Review applications 20092
Number of applications
Applications for permission to apply for Judicial Review
Applications for Judicial Review disposed of, by
result
Withdrawn Total
Determined by a Single Judge
Received Granted Refused Allowed Dismissed
Nature of Review
Immigration / Asylum 6,660 344 2,501 52 77 10 139
Criminal 305 66 172 33 21 4 58
Others 2,132 452 937 107 184 7 298
Total 9,097 862 3,610 192 282 21 495
Source:High Court – Administrative CourtNotes:1 Includes Regional Offices of the Administrative Court2 93% of cases received in 2009 were issued in London
Table 7.13High Court – Administrative Court1
Summary statistics on appeals by way of case stated 20092
Number of appeals
Total Received
Appeals disposed of, by result
Determined by the Court
Withdrawn TotalAllowed Dismissed
Court or Tribunal appealed from
Crown Court 20 9 11 0 20
Magistrates’ court 68 44 32 0 76
Total 88 53 43 0 96
Source:High Court – Administrative CourtNotes: 1 Includes Regional Offices of the Administrative Court2 93% of cases received in 2009 were issued in London

Judicial and Court Statistics 2009 | Chapter 7
174
Table 7.14High Court – Administrative Court1
Summary statistics on applications and appeals other than for Judicial Review or by way of case stated, 20091
Number of appeals / applications
Total Received
Appeals / applications disposed of, by result
Determined by a Single Judge
Withdrawn TotalAllowed Dismissed
Nature of appeal / application
Statutory
Planning and related 169 28 74 1 103
Others 674 176 148 10 334
Habeas Corpus 27 1 1 0 2
Committal for contempt 2 0 0 0 0
Reconsideration under s103a NIAA 20023 5,563 921 4158 0 5,079
Total 6,435 1,126 4,381 11 5,518
Source:High Court – Administrative CourtNotes:1 Includes Regional Offices of the Administrative Court2 93% of cases received in 2009 were issued in London3 NIAA 2002 refers to the Nationality, Immigration and Asylum Act of that year

Judicial and Court Statistics 2009 | Chapter 7
175
Table 7.15High Court – Family DivisionAppeals set down and disposed of showing subject matter and results, 2009
Number of appeals
Appeals to Divisional Court from orders made by magistrates’ courts
Total set down for
hearing
Appeals disposed of, by result
Total disposals
Allowed or varied Dismissed
Withdrawn or struck out
Domestic matters
Matrimonial Proceedings and Magistrates’ Act 1960 0 0 0 0 0
Maintenance Orders Act 1958 and Matrimonial Cause Act 1973
0 0 0 0 0
Domestic Proceedings & Magistrates’ Court Act 1978 0 0 0 0 0
Section 47(7) of the Adoption Act 1 0 1 0 1
Appeals under Section 94 of the Children Act 1989 30 8 19 3 30
Total 31 8 20 3 31
Source:Principal Registry of the Family Division

Judicial and Court Statistics 2009 | Chapter 7
176
Table 7.16Appellate courtsSummary statistics on overall caseload, 2005–2009
Number of cases
Court 2005 2006 2007 2008 2009
Judicial Committee of the Privy Council
71 105 97 33 65
House of Lords1
from Courts in England & Wales
73 61 57 62 37
from elsewhere 14 12 15 9 3
Supreme Court2
from Courts in England & Wales
- - - - 26
from elsewhere - - - - 4Court of Appeal
Civil Division 1,239 1,184 1,248 1,286 1,275Criminal Division 3 7,023 6,937 6,900 7,240 7,195
High CourtChancery Division (Bankruptcy appeals only)
137 148 29 57 44
Administrative Court 4 7,872 10,700 11,293 12,316 15,620
Family Division 5 33 59 72 58 31
Total 16,462 19,206 19,711 21,061 24,300
Sources:Individual appellate courts as shownNotes:1 In October 2009 the United Kingdom Supreme Court (UKSC) replaced the Appellate Committee of
the House of Lords as the highest court in the UK so the figures for 2009 are for January to July 20092 In October 2009 the United Kingdom Supreme Court (UKSC) replaced the Appellate Committee of
the House of Lords as the highest court in the UK so the figures for 2009 are for August to December 2009
3 Court of Appeal (Criminal Division) figures include applications for leave to appeal4 Administrative Court figures include applications for permission to apply for Judicial Review, appeals
by way of case stated and statutory appeals; and in addition: - from 2003, statutory Reviews under s101 of the Nationality, Immigration and Asylum Act (NIAA) 2002 - from 2006, Reconsideration under s103a of the NIAA 2002”
5 Family Division figures include appeals under s94 of the Children Act 1989 from 2002 onwards

The Mental Capacity Act
Chapter 8

Judicial and Court Statistics 2009 | Chapter 8
178
Chapter 8: The Mental Capacity Act
The Mental Capacity Act 2005 provides a statutory framework to empower and protect vulnerable people who are not able to make their own decisions. It makes it clear who can take decisions, in which situations, and how they should go about this. It enables people to plan ahead for a time when they may lose capacity.
The Act created two new public bodies to support the statutory framework, both of which are designed around the needs of those who lack capacity:
1. A new Court of Protection.
2. The Public Guardian, supported by the Office of the Public Guardian (OPG).
When the Mental Capacity Act 2005 came into force on 1 October 2007, the role and function of the Court of Protection changed, and in addition, the OPG was established. As there was a change in the type of data collected from October 2007, the data reported on previously for the old Court of Protection and Public Guardianship Office is no longer relevant, and therefore figures presented in this report are not fully comparable with figures published in earlier reports.
The tables of detailed data can be found immediately following this section of commentary.
Key findings for 2009
There were just over 19,000 applications made to the Court of Protection •under the Mental Health Act 2005 in 2009. Around 59 per cent of these (11,336) were for appointment of a property and affairs deputy.
Over 15,000 final orders under the Mental Health Act 2005 were made in •2009, with the vast majority, 76 per cent, being orders appointing deputy for property and affairs. The quarterly figures show an upward trend to Q3 and a fall in the fourth quarter, with a slight rise in Q1 2010.
During 2009, over 108,000 Powers of Attorney (POA) were received by the •Office of the Public Guardian, of which 81 per cent were for Lasting Power of Attorney. The 2009 quarterly figures for the total POAs received show an upward trend and then continue to rise into Q1 of 2010.

Judicial and Court Statistics 2009 | Chapter 8
179
The Court of Protection
The Court of Protection is a specialist court created under the Mental Capacity Act 2005. It makes specific decisions, and also appoints other people (called deputies) to make decisions for people who lack the capacity to do this for themselves. These decisions are related to their property, financial affairs, health, and personal welfare.
The new Court of Protection replaced the office of the Supreme Court with the same name which only dealt with property and financial affairs. Under the Mental Capacity Act, the court also deals with serious decisions relating to health and personal welfare. Previously, such matters were the preserve of the High Court, who could make declarations under its inherent jurisdiction as to whether an act was lawful in the best interests of an adult who lacked capacity. The new Court of Protection is a superior court of record with the same rights, privileges and authority as the High Court.
The Court of Protection now has powers to:
decide whether a person has the capacity to make a particular decision for •themselves;
make declarations, decisions or orders on financial or welfare matters •affecting people who lack capacity to make these decisions;
appoint a deputy to make ongoing decisions for people lacking capacity to •make those decisions;
decide whether a Lasting Power of Attorney (LPA) or Enduring Power of •Attorney (EPA) is valid;
remove deputies or attorneys who fail to carry out their duties; and •
hear cases concerning objections to the registration of an LPA or EPA. •
The majority of applications to the court are decided on the basis of paper evidence without holding a hearing. In around 95 per cent of cases, the applicant does not need to attend court.
Some applications such as those relating to personal welfare, or large gifts or settlements for Inheritance Tax purposes may be contentious and it may be necessary for the court to hold a hearing to decide the case.
The Court of Protection operates from its central registry in Archway, North London, but it also hears cases in a variety of regional courts including Birmingham, Preston, Bristol and Cardiff. During 2009, there have been three full time judges in Archway and a further 26 district judges and 17 circuit judges nominated to hear cases in the regions. Although only a small number of cases result in a hearing, the facility to hold hearings at a location convenient to the parties is one of the successes of the Mental Capacity Act. The diagram below

Judicial and Court Statistics 2009 | Chapter 8
180
shows the breakdown of listed hearings between Archway, the Royal Courts of Justice and the regions.
Court of Protection Hearings (Jan 2009 to Dec 2009)
Around 75 per cent of all applications relate to the court’s property and affairs jurisdiction, predominantly applications to appoint a deputy or to vary the powers of an existing deputy. A deputy order authorises the deputy to take possession or control of the person’s property and affairs and to exercise the same powers of management as if they were beneficial owner, although the court will limit the powers of the deputy if it considers it appropriate to do so. Many deputies are still acting under receivership orders made before October 2007 under the Mental Health Act 1983, which do not confer as wide powers as deputyship. Around 500 applications per month were by existing deputies.
Most applications relating to the court’s personal welfare jurisdiction were for an order appointing a deputy for personal welfare including hybrid applications where the applicant was seeking an order relating to both health and welfare and property and affairs (Table 8.1). Section 50 of the Act imposes a general requirement for the applicant to seek the permission of the court before making an application which, taken together with the requirements in the court rules, means that permission is almost always required for personal welfare applications. As Table 8.2 shows, the court made only 136 orders appointing a deputy for personal welfare, only a slight increase on the previous year. This means the court is refusing permission in up to 70 per cent of applications for a deputy for personal welfare. The reason for this low success rate is that the Code of Practice2 provides that “deputies for personal welfare decisions will only be required on the most difficult cases where:
52%
5%
43%
Archway (London)
RCJ (Royal Courts of Justice)
Regional HearingCentres
2 Mental Capacity Act 2005 Code of Practice (TSO 2007)

Judicial and Court Statistics 2009 | Chapter 8
181
important and necessary actions cannot be carried out without the court’s •authority, or
there is no other way of settling the matter in the best interests of the •person who lacks capacity to make personal welfare decisions.”
2009 saw the increase in applications relating to lasting powers of attorney (LPA) identified at the end of 2008 continue. The majority of these applications were by the Public Guardian who is prevented from registering the instrument if the LPA contains ineffective provisions and he must apply to court for a ruling as to whether the instrument is valid. The Public Guardian introduced new prescribed forms of lasting power of attorney in October 2009 which should reduce the error rate on the forms and therefore applications by the Public Guardian
There were more applications in relation to enduring powers of attorney (EPA) than LPAs, with the majority of the former relating to objections to the registration. Most objections to registration of EPAs are that the attorney is unsuitable to be the donor’s attorney. The equivalent ground for LPAs is that “the attorney proposes to behave in a way that would contrive his authority or would not be in the donor’s best interests.” The burden is therefore on the objector to prove the future intent of an attorney.
Finally, the court continued to receive high volumes of applications by existing deputies or attorneys under a registered EPA or LPA. Most were from former receivers who became deputies on 1 October 2007 who had not yet been ‘converted’ to a deputy, or from deputies who wished to vary the terms of their order.
Office of the Public Guardian
The Office of the Public Guardian (OPG), was established in October 2007, and supports the Public Guardian in registering Enduring Powers of Attorney (EPA), Lasting Powers of Attorney (LPA) and supervising Court of Protection (COP) appointed Deputies.
The OPG is an agency of the Ministry of Justice. The OPG replaced the Public Guardianship Office, the former administrative arm of the Court of Protection, on 1 October 2007, but retained responsibility for the Court’s administration throughout 2008 and until 31 March 2009, at which time it passed to HMCS.
The OPG supports and promotes decision making for those who lack capacity or would like to plan for their future, within the framework of the Mental Capacity Act 2005. The role of the Public Guardian is to protect people who lack capacity from abuse.

Judicial and Court Statistics 2009 | Chapter 8
182
The Public Guardian, supported by the OPG, helps protect people who lack capacity by:
setting up and managing a register of LPA; •
setting up and managing a register of EPA; •
setting up and managing a register of Court appointed Deputies, supervising •Court appointed Deputies, working with other relevant organisations (for example, social services, if the person who lacks capacity is receiving social care);
receiving reports from Attorneys acting under LPAs and from Deputies; and •
dealing with cases, by way of investigations, where concerns are raised about •the way in which Attorneys or Deputies are carrying out their duties.
Powers of Attorney
Enduring Power of Attorney
A Power of Attorney created under the Enduring Powers of Attorney Act 1985 appoints an Attorney to deal with the Donor’s property and financial affairs. Existing EPAs will continue to operate under Schedule 4 of the Mental Capacity Act, which replaces the EPA Act 1985.
It had been anticipated that the volume of EPAs would reduce considerable after the introduction of LPAs, but, as can be seen, volumes have merely stabilised since that time.
EPAs received, 2003 to 2009
0
5000
10000
15000
20000
25000
20092003 2004 2005 2006 2007 2008
EPAs received

Judicial and Court Statistics 2009 | Chapter 8
183
Lasting Power of Attorney
A Power of Attorney created under the Mental Capacity Act appoints an Attorney to make decisions about the Donor’s personal welfare (including healthcare) or deal with the Donor’s property and affairs.
An LPA is a legal document that someone (the Donor) makes using a special form. It allows that person to choose someone now (the Attorney) that they trust to make decisions on their behalf at a time in the future when they either lack the mental capacity or no longer wish to make those decisions themselves.
The decisions could be about the Donor’s property and affairs or about their personal welfare.
Making an LPA is the only way to make plans for a time in the future when you may lack the capacity to make decisions for yourself. An LPA can only be used after it is registered with the OPG.
There are two types of LPA:
1. The Property and Affairs LPA
A Property and Affairs LPA allows the Donor to appoint an Attorney to manage their finances and property whilst they still have capacity to make decisions for themselves. For example, it may be easier for them to give someone the power to carry out tasks such as paying their bills or collecting their benefits or other income. This might be easier for lots of reasons: the Donor might find it difficult to get about or to talk on the telephone, or might be out of the country for long periods of time.
Alternatively, the Donor may include a restriction that the LPA can only be used at a time in the future when they lack the capacity to make decisions for themselves – for example, due to the onset of dementia in later life or as a result of a brain injury.
An Attorney will not be able to make decisions about a Donor’s personal welfare unless they have also been appointed as a Personal Welfare Attorney using a separate LPA.
2. The Personal Welfare LPA
A Personal Welfare LPA allows the Donor to appoint an Attorney to make decisions on their behalf about their personal welfare. A Personal Welfare LPA can only be used when the Donor lacks the capacity to make these decisions for themselves.
An Attorney will not be able to make decisions about a Donor’s property and affairs unless they have also been appointed as a Property and Affairs Attorney using a separate LPA.

Judicial and Court Statistics 2009 | Chapter 8
184
The graph below shows the volumes of LPAs, by type, since their introduction in October 2007 through to December 2008.
LPAs received, January 2009 to December 2009
0
5000
10000
15000
20000
25000
30000
Oct-Dec 09Jan-Mar 09 Apr-Jun 09 Jul-Sep 09
LPAs received
Summary statistics for quarter 4 2008 to quarter 4 2009 are shown in Table 8.3.

Judicial and Court Statistics 2009 | Chapter 8
185
Deputyships
A Deputy is appointed by the Court of Protection, and is legally responsible for acting and making decisions on behalf of a person who lacks capacity to make those decisions for themselves. The level of support and supervision the OPG allocates to a Deputy is decided after carrying out an assessment of the individual circumstances of the case, which is based on:
complexity of the affairs of the person who lacks capacity; •
types of decisions that need to be made; •
care requirements of the person who lacks capacity; and •
the relationship between the Deputy and the person who lacks capacity. •
There are three levels of supervision:
type 1 is close supervision involving regular contact with the Deputy; •
type 2 is lighter touch supervision involving sample monitoring of cases; and •
type 3 applies to Property and Affairs Deputies who manage limited assets •and who the OPG will only contact periodically.
Supervision may involve:
the OPG providing ongoing support when carrying out the role; •
the submission of reports to the OPG when the Court directs; and •
a Court Visitor checking how the Deputyship is being managed. •
The Public Guardian is also personally responsible for the management and organisation of the OPG, including the use of public money and the way it manages its assets. A separate Public Guardian Board scrutinises the work of the Public Guardian and then reports to the Lord Chancellor.

Judicial and Court Statistics 2009 | Chapter 8
186
Tabl
e 8.
1C
ourt
of P
rote
ctio
nSu
mm
ary
case
wor
k st
atis
tics:
Appl
icat
ions
by
quar
ter,
Q1
2009
–Q4
2009
Num
ber o
f cas
es
Type
of p
roce
edin
gs
2009
Jan-
Mar
Apr
-Jun
Jul-
Sep
Oct
-Dec
App
licat
ions
mad
e un
der t
he M
enta
l Cap
acit
y A
ct 2
005
4,60
94,
788
5,13
74,
559
of w
hich
Appl
icat
ions
for a
ppoi
ntm
ent o
f a p
rope
rty
and
affa
irs d
eput
y2,
511
2,97
33,
118
2,73
4pl
us a
pplic
atio
ns fo
r a 'o
ne-o
ff' p
rope
rty
and
affa
irs o
rder
121
316
187
Appl
icat
ions
for a
ppoi
ntm
ent o
f a h
ealth
and
wel
fare
dep
uty
7170
107
88pl
us a
pplic
atio
ns fo
r a 'o
ne-o
ff' h
ealth
and
wel
fare
ord
er30
3928
15
Appl
icat
ions
for a
ppoi
ntm
ent o
f a h
ybrid
dep
uty 2
120
161
205
206
plus
app
licat
ions
for a
'one
-off
' pro
pert
y &
aff
airs
and
hea
lth &
wel
fare
ord
er30
133
6
Appl
icat
ions
for o
rder
s ap
poin
ting
new
trus
tees
311
814
413
912
2
Appl
icat
ions
to e
xecu
te w
ills,
appl
y fo
r gift
s an
d or
ders
for s
ettle
men
t, in
clud
ing
thos
e w
here
ther
e is
an
Endu
ring
Pow
er o
f Att
orne
y or
Las
ting
Pow
er o
f Att
orne
y15
813
617
112
8
Appl
icat
ions
rela
ting
to E
ndur
ing
Pow
ers o
f Att
orne
y 423
324
421
721
7
Appl
icat
ions
rela
ting
to L
astin
g Po
wer
s of A
ttor
ney 4
8696
6360
Appl
icat
ions
by
an e
xist
ing
depu
ty o
r reg
iste
red
atto
rney
553
540
048
743
0
Appl
icat
ions
for d
isch
arge
of t
he d
eput
y (w
here
P c
ease
s to
lack
cap
acity
/the
dep
uty
wis
hes t
o re
tire
/ the
dep
uty
is n
o lo
nger
sui
tabl
e to
act
)11
855
5669
Oth
er38
644
152
547
7
Sour
ce:
Cour
t of P
rote
ctio
nN
otes
:1
The
valu
e of
213
in Q
1 20
09 in
clud
ed s
ome
appl
icat
ions
by
exis
ting
depu
ties.
This
doe
s sh
ow th
ere
was
a s
pike
in a
pplic
atio
ns b
y ex
istin
g de
putie
s, bu
t thi
s was
due
to
the
redu
ctio
n in
the
rate
of i
nter
est p
aid
by th
e Co
urt F
unds
Offi
ce. F
rom
Q2
2009
the
way
app
licat
ions
wer
e re
cord
ed c
hang
ed s
o it
only
incl
uded
app
licat
ions
w
here
ther
e w
as n
o ex
istin
g de
puty
act
ing
for P
2 H
ybrid
is w
here
the
appl
ican
t is
appl
ying
for b
oth
a pr
oper
ty a
nd a
ffai
rs d
eput
y an
d a
heal
th a
nd w
elfa
re d
eput
y3
Appl
icat
ions
mad
e un
der s
ectio
ns 3
6(9)
, 54
and
96(1
)(k)
of t
he T
rust
ee A
ct 1
925,
and
sec
tion
20(2
)(c)
of t
he T
rust
s of L
and
and
Appo
intm
ent o
f Tru
stee
s Act
199
64
Incl
udes
obj
ectio
ns to
regi
stra
tion
and
appl
icat
ions
to d
eter
min
e of
the
valid
ity o
f the
doc
umen
t5
Tran
sitio
n ty
pe a
pplic
atio
ns, a
s re
cord
ed in
Judi
cial
Cou
rt S
tatis
tics
2008
, end
ed in
200
8. T
hey
only
exi
sted
for a
sho
rt ti
me
unde
r a s
peci
fic tr
ansi
tory
pro
visi
on in
the
cour
t rul
es

Judicial and Court Statistics 2009 | Chapter 8
187
Tabl
e 8.
2C
ourt
of P
rote
ctio
nSu
mm
ary
case
wor
k st
atis
tics:
Ord
ers
by q
uart
er, Q
1 20
09–Q
4 20
09N
umbe
r of c
ases
Type
of p
roce
edin
gs
2009
Jan-
Mar
Apr
-Jun
Jul-
Sep
Oct
-Dec
Ord
ers
mad
e un
der t
he M
enta
l Cap
acit
y A
ct 2
005 1
2,90
83,
672
4,34
74,
116
of w
hich
Ord
ers
appo
intin
g de
puty
for p
rope
rty
and
affa
irs2,
051
2,81
13,
334
3,25
2pl
us 'o
ne-o
ff' o
rder
s re
latin
g to
pro
pert
y an
d af
fairs
24
222
orde
rs a
ppoi
ntin
g de
puty
for h
ealth
and
wel
fare
3
1218
5pl
us 'o
ne-o
ff' o
rder
s re
latin
g to
hea
lth a
nd w
elfa
re30
3928
15
Ord
ers
appo
intin
g a
hybr
id d
eput
y 20
21
3pl
us 'o
ne-o
ff' o
rder
s re
latin
g to
bot
h pr
oper
ty &
aff
airs
and
hea
lth &
wel
fare
21
10
Ord
ers
mad
e ap
poin
ting
new
trus
tees
385
8414
411
3
Ord
ers
auth
oris
ing
the
exec
utio
n of
will
s, th
e m
akin
g of
gift
s an
d th
e gr
antin
g of
set
tlem
ents
, in
clud
ing
thos
e re
latin
g to
End
urin
g Po
wer
of A
ttor
ney
and
Last
ing
Pow
er o
f Att
orne
y11
493
109
35
Ord
ers
rela
ting
to E
ndur
ing
Pow
ers o
f Att
orne
y 453
7273
114
Ord
ers
rela
ting
to L
astin
g Po
wer
s of A
ttor
ney 4
5471
6354
Ord
ers
rela
ting
to a
n ex
istin
g de
puty
ship
or a
ttor
neys
hip5
157
199
270
253
Ord
ers d
isch
argi
ng th
e de
puty
(whe
re P
cea
ses t
o la
ck c
apac
ity/t
he d
eput
y w
ishe
s to
retir
e / t
he
depu
ty is
no
long
er s
uita
ble
to a
ct)
6140
4350
Oth
er30
224
423
319
8
Sour
ce:
Cour
t of P
rote
ctio
nN
otes
:1
The
Cour
t’s c
hart
er s
tand
ard
is fo
r an
orde
r to
be m
ade
with
in 2
1 w
eeks
of t
he a
pplic
atio
n be
ing
issu
ed, a
lthou
gh th
e av
erag
e tim
e is
14
wee
ks2
Hyb
rid is
whe
re th
e Co
urt h
as a
ppoi
nted
dep
uty
for b
oth
a pr
oper
ty a
nd a
ffai
rs d
eput
y an
d he
alth
and
wel
fare
3 O
rder
s as a
resu
lt of
app
licat
ions
mad
e un
der s
ectio
ns 3
6(9)
, 54
and
96(1
)(k) o
f the
Trus
tee
Act 1
925,
and
sect
ion
20(2
)(c) o
f the
Trus
ts o
f Lan
d an
d Ap
poin
tmen
t of T
rust
ees
Act 1
996
4 In
clud
es u
phol
ding
or d
ism
issi
ng o
bjec
tions
to re
gist
ratio
n, d
eter
min
ing
the
valid
ity o
f the
doc
umen
t and
dire
ctin
g th
e Pu
blic
Gua
rdia
n to
regi
ster
the
inst
rum
ent
5 Tr
ansi
tion
type
app
licat
ions
, as
reco
rded
in Ju
dici
al C
ourt
Sta
tistic
s 20
08, e
nded
in 2
008.
The
y on
ly e
xist
ed fo
r a s
hort
tim
e un
der a
spe
cific
tran
sito
ry p
rovi
sion
in th
e co
urt r
ules
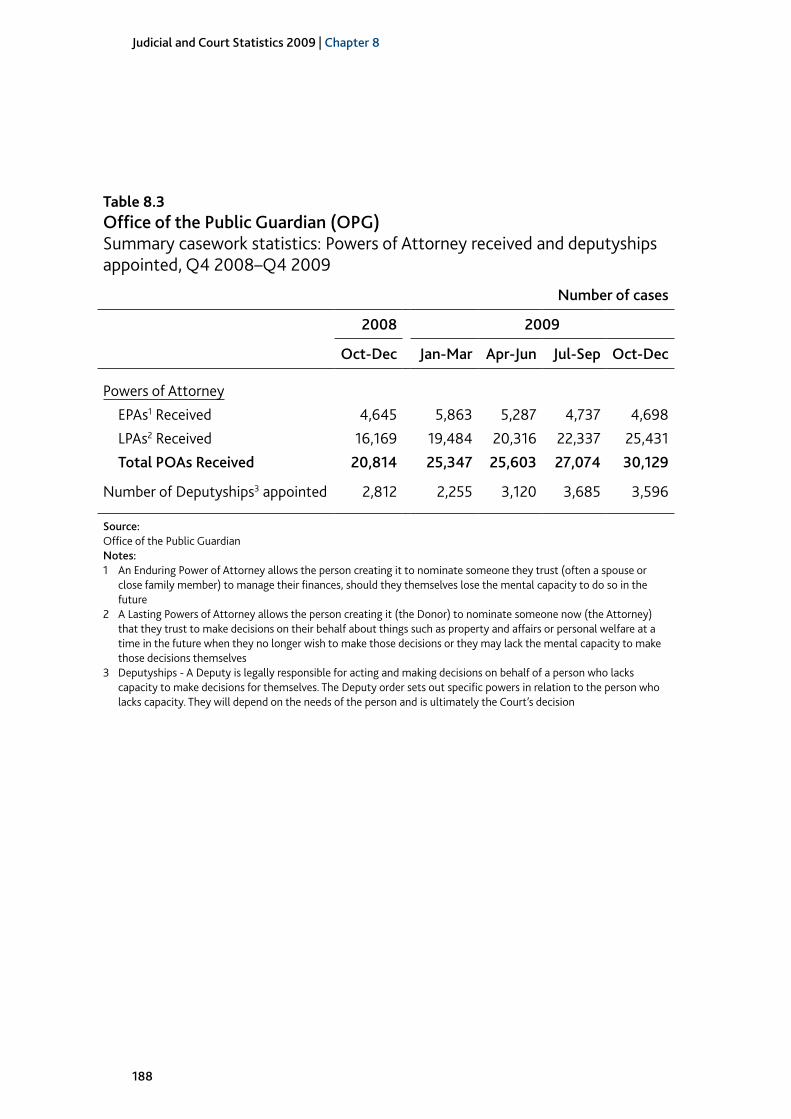
Judicial and Court Statistics 2009 | Chapter 8
188
Table 8.3Office of the Public Guardian (OPG)Summary casework statistics: Powers of Attorney received and deputyships appointed, Q4 2008–Q4 2009
Number of cases
2008 2009
Oct-Dec Jan-Mar Apr-Jun Jul-Sep Oct-Dec
Powers of AttorneyEPAs1 Received 4,645 5,863 5,287 4,737 4,698LPAs2 Received 16,169 19,484 20,316 22,337 25,431Total POAs Received 20,814 25,347 25,603 27,074 30,129
Number of Deputyships3 appointed 2,812 2,255 3,120 3,685 3,596
Source:Office of the Public GuardianNotes:1 An Enduring Power of Attorney allows the person creating it to nominate someone they trust (often a spouse or
close family member) to manage their finances, should they themselves lose the mental capacity to do so in the future
2 A Lasting Powers of Attorney allows the person creating it (the Donor) to nominate someone now (the Attorney) that they trust to make decisions on their behalf about things such as property and affairs or personal welfare at a time in the future when they no longer wish to make those decisions or they may lack the mental capacity to make those decisions themselves
3 Deputyships - A Deputy is legally responsible for acting and making decisions on behalf of a person who lacks capacity to make decisions for themselves. The Deputy order sets out specific powers in relation to the person who lacks capacity. They will depend on the needs of the person and is ultimately the Court’s decision

Offices of the Supreme Court
Chapter 9
Judicial and Court Statistics 2009 | Chapter 9
190
Chapter 9: Offices of the Supreme Court
The Officers of the Senior Court include:
The Official Solicitor to the Senior Courts. The Offices of the Official •Solicitor and the Public Trustee remain an arms length body, the purpose of which is to serve the two statutory office holders, the Official Solicitor to the Senior Courts and the Public Trustee who each have separate statutory and other functions. The Public trustee is not an officer of the Senior Courts. On the 1 April 2009 the Offices of the Official Solicitor and the Public Trustee de-merged from The Court Funds Office with which they had merged on 1 April 2007.
The Tipstaff whose main responsibility is the enforcement of warrants and •orders issued by Judges throughout all divisions of the High Court. Much of the Tipstaff’s work relates to children who either have been, or are at risk of being, abducted.
The tables of detailed data can be found immediately following this section of commentary.
Key findings for 2009
There was a continuation of the upward trends seen in the number of new •referrals to the Official Solicitor for child abduction, from 503 in 2008 to 543 in 2009.
Around 90 per cent of the Tipstaff work relates to Family Division cases. The •total number of warrants executed by the Tipstaff in 2009 was 474, up from 439 in the previous year.
Judicial and Court Statistics 2009 | Chapter 9
191
The Court Funds Office
The Court Funds Office supports the Accountant General and provides a banking service for the civil courts throughout England and Wales. It accounts for money being paid into and out of court, and where necessary administers any investments made with that money.
It administers approximately £4.7 billion of client assets. These assets can be broken down into a mixture of cash held on Special or Basic Interest bearing accounts or investments in the Equity Index Tracker Fund, an investment vehicle managed by Legal and General.
The Offices of the Official Solicitor and the Public Trustee
The Offices of the Official Solicitor and the Public Trustee support both the Official Solicitor and the Public Trustee.
The Official Solicitor is a statutory office holder appointed by the Lord Chancellor under section 90 of the Senior Courts Act 1981. The Lord Chancellor:
acts as last resort litigation friend, and in some cases solicitor, for adults who •lack litigation capacity and children (other than those who are the subject of child welfare proceedings) in court proceedings because they lack decision making capacity in relation to the proceedings;
acts as advocate to the court providing advice and assistance to the court; •
acts as last resort administrator of estates and trustee; •
acts as financial deputy of last resort in relation to Court of Protection clients; •
administers for the Lord Chancellor the International Child Abduction and •Contact Unit in England and Wales (the Central Authority under the Hague and European Conventions on Child Abduction);
administers for the Lord Chancellor the Reciprocal Enforcement Maintenance •Orders Unit which acts as the Central Authority for England & Wales for international maintenance claims; and
is appointed, in place of a parent, to act as the registered contact in the •administration of the Government’s Child Trust Fund scheme for those children in care in England and Wales when there is no other suitable person to do so.
The Public Trustee (appointed under section 8 of the Public Trustee Act 1906) acts as executor or administrator of estates and as the appointed trustee of settlements. His aim is to provide an effective executor and trustee service of last resort on a non-profit-making basis; in so doing, his objective is to secure the best value for the beneficiaries.
Summary caseload statistics on the work of the Office of the Official Solicitor and Public Trustee are shown in Table 9.1

Judicial and Court Statistics 2009 | Chapter 9
192
Tipstaff
The duties of the Tipstaff are many and varied but, in broad practical terms, the Tipstaff is the enforcement officer for the High Court. The principal areas of specific duties emanate from the Queen’s Bench, Chancery and Family Divisions and involve issues of bankruptcy, insolvency, wardship, child abduction, contempt of court and many other miscellaneous orders which involve taking action to enforce, or prevent breach of, orders of the court. At present there is one Tipstaff and two Assistant Tipstaff to cover England & Wales, and they are based at the Royal Courts of Justice in London.
The single biggest area of work for the Tipstaff relates to Family Division cases involving missing or abducted children. The Tipstaff is responsible for executing warrants on a range of possible Orders in these circumstances, including a Collection Order (for the return of a child), a Location Order (for the whereabouts of a child to be discovered), a Passport Order (for the seizure of passports or other travel documents) and Port Alerts (to prevent a child being wrongfully removed from the UK). Orders of these types accounted for 87 per cent of all warrants executed by the Tipstaff in 2009; a two percentage point increase on the previous year, and 89 per cent of all warrants discharged or suspended a six percentage point increase on 2008.
In total, there were 474 warrants executed in 2009 and 567 warrants discharged or suspended, both having increased over the last five years.
During the course of 2009, 474 warrants were executed, an eight per cent increase on 2008, and 567 were discharged or suspended, a 78 per cent increase on 2008.
Summary caseload statistics on the work of the Tipstaff are shown in Table 9.2.

Judicial and Court Statistics 2009 | Chapter 9
193
Table 9.1Office of the Official Solicitor and Public TrusteeSummary casework statistics, 2005–2009
Number of cases
Case type 2005 2006 2007 2008 2009
New referralsFamily Litigation, Medical, Welfare and Divorce 1,087 1,235 1,163 1,270 1,355Child Abduction 402 432 461 503 543Reciprocal Enforcement Maintenance Orders (REMO) 1 777 922 704 1,092 1,345
Civil Litigation (including Contempts) 999 955 988 878 816
Court of Protection 618 580 646 545 515
Child Trust Funds 2 341 4,128 1,508 1,452 1,642
Estates, Trusts, Executorships, Pension & Institutional Funds 13 37 17 8 12
Total (excluding REMOs and Child Trust Funds) 3,119 3,239 3,275 3,204r 3,241
Total 4,237 8,289 5,487 5,748r 6,228
Average number of active cases 3
Family Litigation, Medical, Welfare and Divorce 1,359 1,494 1,499 1,698 1,464Child Abduction 311 332 311 338 357Reciprocal Enforcement Maintenance Orders (REMO) 1 - - - - -
Civil Litigation (including Contempts) 1,183 1,294 1,266 1,251 1,088
Court of Protection 565 760 692 437 502
Child Trust Funds 2 - 1,202 3,714 5,336 6,503
Estates, Trusts, Executorships, Pension & Institutional Funds 2,004 1,759 1,058 552 427
Total (excluding REMOs and Child Trust Funds) 5,422 5,639 4,826 4,276 3,838
Total 5,422 6,841 8,540 9,612 10,341
Source:Office of the Official Solicitor and Public TrusteeNotes:1 Applies from 1 April 2005 only. Relates to international maintenance claims, where one of the parties lives outside the UK in a
country or territory with which the UK has reciprocal arrangements for the enforcement of maintenance2 Applies from 1 April 2005 only. The Official Solicitor can be appointed to act as the registered contact in the administration of
the Child Trust Fund scheme for children in care in England and Wales, where there is no parent able to do so3 Based on the average number of active cases month-by-month within each year shownDash means not applicable

Judicial and Court Statistics 2009 | Chapter 9
194
Table 9.2TipstaffSummary casework statistics, 2005–2009
Number of warrants
Type of warrant 2005 2006 2007 2008 2009
ExecutedBankruptcy 5 21 11 18 19Insolvency 0 8 12 23 11Chancery Division 6 6 6 5 8Queen’s Bench Division 8 12 8 6 7Family Division 28 20 6 16 17
Child Abduction cases 1 333 291 343 371 412
Total 380 358 386 439 474
Discharged or suspendedBankruptcy 10 13 17 17 1Insolvency 11 4 15 17 5Chancery Division 0 26 0 6 19Queen’s Bench Division 1 26 0 3 29Family Division 5 18 14 13 11
Child Abduction cases 1 19 65 133 263 502Total 46 152 179 319 567
Source:TipstaffNote:1 Child Abduction work includes Collection Orders, Location Orders, Passport Orders and Port Alert
Orders. These are all normally associated with cases where a child either has been, or is at risk of being, abducted and taken outside the UK

The Judiciary
Chapter 10

Judicial and Court Statistics 2009 | Chapter 10
196
Chapter 10: The Judiciary
Figures on the number of days sat in court by judges, broken down by region and type of judge are also included in this chapter.
The tables of detailed data can be found immediately following this section of commentary.
Key findings for 2009
As at 1 April 2010, there were 680 circuit judges in England and Wales, •compared with 640 as at 1 April 2009. Even though this is a six per cent increase on 2008 it continues a fluctuating trend. The number of recorders and district judges remained at about the same levels to the previous year, at 1,233 and 448 respectively.
During 2009, around 271,000 days were sat by judges (excluding •magistrates) on all types of work (excluding tribunals and other official functions).
Days sat in the Crown Court accounted for 38 per cent, while for the county •courts and the High Court the proportions were 54 per cent and six per cent respectively.
Justices of the peace (JPs) in the magistracy have varied in number slightly •over the years, declining to a level of 28,607 as at 1 April 2010 from its peak of 29,816 as at 1 April 2007. On 1 April 2009 and 2010, 49 per cent of JPs were men, compared to 50 per cent in the years previous to 2009.
The Judiciary of England and Wales can be separated into the following types of judge:
Heads of Division •
Lords Justices of Appeal •
High Court Judges •
Masters and Registrars of the Supreme Court •
Circuit Judges •
Recorders •
District and Deputy District Judges •
Tribunal Judges •
District and Deputy District Judges (Magistrates’ Courts) •
Justices of the Peace (or Magistrates). •

Judicial and Court Statistics 2009 | Chapter 10
197
Divisional Heads
The Lord Chief Justice is the Head of the Judiciary for England and Wales, and also Head of Criminal Justice. The other Heads of Division are:
the Master of the Rolls, who heads the civil branch of the Court of Appeal •and is Head of Civil Justice
the President of the Queen’s Bench Division •
the President of the Family Division •
the Chancellor of the High Court, who heads the Chancery Division which •handles cases involving large sums of money and nationally important legal financial issues.
Lords Justices
Together with the Lord Chief Justice and the Heads of Divisions, the Lords Justices are judges of the Court of Appeal. As at 1 April 2009 there were 38 Lords Justices in office.
In the Court of Appeal a bench of two or three judges sits on each case. In the Criminal Division the bench consists of the Lord Chief Justice or a Lord Justice and one or more, usually two, High Court judges. In the Civil Division the majority of cases are heard by a bench solely composed of Lords Justices.
High Court judges
There is a statutory limit of 108 High Court Judges who may sit in England and Wales to deal with the more complex and difficult cases.
High Court judges usually sit in London but they also travel to major court centres around the country. They try serious criminal cases, important civil cases and assist the Lords Justices to hear criminal appeals.
High Court judges are assigned to one of the three divisions of the High Court - the Chancery Division, the Queen’s Bench Division and the Family Division.
The Chancery Division deals with company law, partnership claims, conveyancing, land law, probate, patent and taxation cases, and consists of 17 High Court judges, headed by the Chancellor of the High Court. The Division includes three specialist courts: the Companies Court, the Patents Court and the Bankruptcy Court. Chancery Division judges normally sit in London, but also hear cases in Cardiff, Bristol, Birmingham, Manchester, Liverpool, Leeds and Newcastle (see Chapter 5).
The Queen’s Bench Division deals with contract and tort (civil wrongs), judicial reviews and libel, and includes three specialist courts: the Commercial Court, the Admiralty Court and the Administration Court. The Queen’s Bench Division consists of 72 judges, headed by the President of the Queen’s Bench Division (see Chapter 6).

Judicial and Court Statistics 2009 | Chapter 10
198
The Family Division, which deals with family law and probate cases, consists of 19 judges headed by the President of the Family Division (see Chapter 2).
High Court judges are appointed by The Queen on the recommendation of the Lord Chancellor, after a fair and open competition administered by the Judicial Appointments Commission. High Court judges must have had a right of audience - the right of a lawyer to appear and speak as an advocate in a court case - for all proceedings in the High Court for at least ten years, or have been a circuit judge for at least two years.
Circuit Judges, Recorders and District Judges
The bulk of Crown Court work is undertaken by Circuit Judges and Recorders. In the county courts most of the work is undertaken by Circuit Judges, District Judges and deputy District Judges.
Circuit Judges are assigned to a particular circuit and may sit at any of the Crown and county courts on that circuit. Normally Circuit Judges can hear both criminal and civil cases, although some exercise specialist civil jurisdictions or deal wholly or mainly with criminal cases.
Recorders may sit in both the Crown Court and county courts. Most Recorders start by sitting in the Crown Court, although after about two years they might be authorised to sit in the county courts after a period of training. Some Recorders are appointed solely to deal with civil or family work
District Judges are assigned on appointment to a particular circuit and may sit at any of the county courts or District Registries of the High Court in that circuit. A District Registry is part of the High Court situated in various districts of England and Wales dealing with High Court family and civil business.
The number of Circuit Judges, Recorders and District Judges sitting, as at the given dates between 2005 and 2010, are shown in Table 10.1.
District Judges (Magistrates’ Courts)
Unification of the Stipendiary Bench took place following the implementation on 31 August 2000 of Section 78 of the Access to Justice Act 1999. The unification of the bench created a national jurisdiction throughout England and Wales and a change of title from stipendiary magistrates to District Judges (Magistrates’ Courts). There is a single judicial head, the Senior District Judge (Chief Magistrate), who is responsible for the administration of the unified bench.
There were 134 full-time District Judges (Magistrates’ Courts) in post at 1 April 2009. They are salaried members of the judiciary appointed by the Queen on the recommendation of the Lord Chancellor. Generally sitting alone in a magistrates’ court, they are responsible for deciding matters of law and fact and for imposing sentences.

Judicial and Court Statistics 2009 | Chapter 10
199
Their jurisdiction is wide, and covers criminal matters in the adult and youth courts and civil matters, particularly in relation to family matters in the family court, as well as prison adjudication, extradition and terrorism cases. With exactly the same jurisdiction as the magistracy, the caseload of the district judge is generally slanted towards the heavier business, with clerks often allocating the more serious, lengthy and complex cases to them.
The Magistracy (Justices of the Peace)
Justices of the Peace (magistrates) are appointed by the Lord Chancellor on behalf of the Sovereign. In magistrates’ court the Justices usually sit as a bench of three; when sitting as a Youth Court or Family Proceedings Court there must be at least one male and one female Justice on the bench. Magistrates do not need to be legally qualified, but a qualified legal adviser is available to the bench at all times. Magistrates do not require legal training. However, all magistrates must undertake a compulsory programme of practical training which prepares them to sit in court. In the Crown Court, Justices sit with a Judge to hear appeals from magistrates’ courts.
Justices of the Peace, by gender, 2004/5 to 2009/10
Almost all (98 per cent) criminal cases are dealt with by magistrates. The bulk of these are purely summary offences which can only be tried in a magistrates’ court and include motoring offences. The remainder are ‘either way’ offences which may be tried either in a magistrates’ court or in the Crown Court before a judge and jury.
0
2,000
4,000
6,000
8,000
10,000
12,000
14,000
16,000
18,000
2004/05 2005/06 2006/07 2007/08 2008/09 2009-10
Men Women

Judicial and Court Statistics 2009 | Chapter 10
200
Criminal cases involving children and young persons up to and including the age of 17 are normally dealt with in the Youth Court. Justices sitting in the Family Proceedings Court deal with the court’s family business, such as cases concerning children and young persons who are believed to be in need of care, matters concerning residence and contact with children and maintenance (see Chapter 2).
Unlike District Judges (Magistrates’ Court), magistrates are unpaid but receive allowances to cover travelling expenses, subsistence and financial loss occasioned by the performance of their duties.
The numbers of magistrates in England and Wales by gender, as at 1 April from 2005 to 2010 are shown in Table 10.5. Table 10.6 shows a similar time series of their appointments during the financial year.
Judicial sitting days
Figures of the number of days sat in court and chambers by judges (except magistrates) are given in Tables 10.2, 10.3 and 10.4. Table 10.2 gives the time series from 2005 to 2009 of the number of sitting days by judge type. Table 10.3 shows the number of days sat by each category of judge according to the type of work undertaken, and Table 10.4 shows the distribution of days sat by Region.
Sittings by deputy High Court judges include retired Lords Justices, retired High Court judges and Circuit Judges sitting as High Court judges under section 9(1) of the Supreme Court Act 1981 and practitioners sitting as deputy High Court judges under section 9(4) of the Act. Deputy Circuit Judge sittings refer only to sittings by retired Circuit Judges.
0
20,000
40,000
60,000
80,000
100,000
120,000
140,000
20091996 1997 1998 1999 2000 2001 2002 2003 2004 2005 2006 2007 2008
Days Sat (Court & Chambers)
District Judges Recorders Circuit Judges High Court Judges Lords Justices
Judges Sitting Days (All Courts) by judge type, 1995-2008

Judicial and Court Statistics 2009 | Chapter 10
201
Table 10.1 The JudiciaryCircuit judges, Recorders and District judges in post in each circuit, as at given dates, 1 2005–2010
Type of Judge2 2005 2006 2007 2008 2009 2010
Circuit JudgesMidland 89 87 88 87 91 93North Eastern 75 76 75 78 79 80Northern 94 88 89 104 107 103South Eastern3 285 269 262 288 270 307Wales 41 38 36 32 32 36Western 59 61 62 64 61 61Other 0 0 27 0 0 0
Total 643 619 639 653 640 680
RecordersMidland 204 225 176 204 212 202North Eastern 135 144 102 127 131 131Northern 177 176 140 166 160 155South Eastern3 596 580 523 569 513 549Wales 83 89 69 69 62 56Western 155 180 166 170 157 140Other 0 0 25 0 0 0
Total 1,350 1,394 1,201 1,305 1,235 1,233
District Judges 4
Midland 64 62 57 67 68 68North Eastern 61 61 62 62 65 65Northern 63 64 67 77 77 76South Eastern3 167 151 147 160 161 164Wales 32 32 34 24 24 25Western 46 49 46 48 49 50Other 0 0 18 0 0 0
Total 433 419 431 438 444 448
Source:Judicial Communications OfficeNotes:1 Figures are at 1 April from 2007, and at 1 January in earlier years2 Some judicial office holders hold more than one judicial appointment. In such cases, the appointment
that the judicial office holder undertakes the majority of their time is known as their primary appointment. In order to avoid double counting of judges this table shows figures for primary appointments only
3 Includes Royal Courts of Justice4 Excluding Family Division

Judicial and Court Statistics 2009 | Chapter 10
202
Table 10.2The JudiciaryDays sat 1 by judge type, 2005–2009Type of Judge 2005 2006 20072 2008 2009
Lords Justices 3,766 3,365 3,894 4,090 4,587
High Court judges 13,563 13,452 14,257 14,129 20,508
Deputy High Court judges 3,311 3,416 3,197 3,333 1,105
Circuit judges 106,190 108,932 105,058 111,779 114,018
Deputy circuit judges 2,094 1,922 2,020 2,562 2,223
Recorders 23,487 24,291 26,191 23,490 22,255
District judges 77,362 77,737 74,212 80,204 84,024
Deputy district judges 21,798 17,430 19,118 22,343 22,219
Total 3 251,571 250,544 247,946 261,929 270,936
Source:HM Courts Service and CREST systemNotes:1 Days sat in court and chambers2 These figures represent only the days sat in court or in chambers in the jurisdictions shown. Judges
sit in other areas, and also undertake a range of other functions outside the courtroom that are not shown here

Judicial and Court Statistics 2009 | Chapter 10
203
Tabl
e 10
.3Th
e Ju
dici
ary
Day
s sa
t 1 by
judg
es s
how
ing
type
of w
ork
deal
t with
, 200
9
Type
of j
udge
Cour
t of A
ppea
lH
igh
Cour
t
Crow
n Co
urt
Coun
ty c
ourt
Tota
lCr
imin
alCi
vil
Chan
cery
D
ivisi
onQ
ueen
’s Be
nch
Div
ision
2Fa
mily
D
ivisi
onT&
C co
urt 3
Gen
eral
Lis
t
Fam
ily La
w
Publ
icPr
ivat
e
Lord
s Jus
tices
724
3,84
815
00
00
00
04,
587
Hig
h Co
urt j
udge
s1,
326
149
1,83
49,
324
3,54
743
13,
691
2812
553
20,5
08
Dep
uty
Hig
h Co
urt j
udge
s0
1520
163
264
133
282
103
2618
1,105
Circ
uit j
udge
s31
40
108
375
211
779
,074
12,0
0515
,652
6,37
111
4,01
8
Dep
uty
circu
it ju
dges
00
00
00
1,30
525
744
122
02,
223
Reco
rder
s12
011
243
030
17,8
112,
348
907
992
22,2
55
Dist
rict j
udge
s0
00
00
00
55,6
234,
797
23,6
0584
,024
Dep
uty
dist
rict j
udge
s0
00
00
00
20,2
4162
1,91
722
,219
Tota
l 42,
376
4,01
22,
270
9,80
53,
813
711
102,
163
90,6
0322
,009
33,17
527
0,93
6
Sour
ce:
HM
Cou
rts S
ervi
ce, C
REST
sys
tem
Not
es:
1 D
ays
sat i
n co
urt a
nd c
ham
bers
2 Ad
mira
lty C
ourt
and
Adm
inis
trat
ive
Cour
t sitt
ings
are
incl
uded
in th
e Q
ueen
’s Be
nch
Div
isio
n fig
ures
3 T&
C co
urt =
Tec
hnol
ogy
and
Cons
truc
tion
Cour
t4
Thes
e fig
ures
repr
esen
t onl
y th
e da
ys s
at in
cou
rt o
r in
cham
bers
in th
e ju
risdi
ctio
ns s
how
n. Ju
dges
sit
in o
ther
are
as, a
nd a
lso
unde
rtak
e a
rang
e of
oth
er fu
nctio
ns o
utsi
de th
e co
urtr
oom
that
are
not
sho
wn
here

Judicial and Court Statistics 2009 | Chapter 10
204
Table 10.4The JudiciaryDays sat 1 by HMCS region, 2009
HMCS region Days sat3
London 58,582Midlands 38,502North East 30,594North West 40,333South East 47,925South West 26,018Royal Courts of Justice 15,030Wales 13,952
Total 2 270,936
Source:HM Courts Service and CREST systemNotes:1 Days sat in court and chambers2 These figures represent only the days sat in court or in chambers in the jurisdictions shown. Judges
sit in other areas, and also undertake a range of other functions outside the courtroom that are not shown here.
3 Figures have been estimated

Judicial and Court Statistics 2009 | Chapter 10
205
Table 10.5The MagistracyJustices of the Peace (JPs)1 by gender, as at 1 April 2005 - 1 April 2010
Number of JPs
Year Men Women Total
2005 14,273 14,027 28,3002006 14,519 14,346 28,8652007 15,007 14,809 29,8162008 14,672 14,747 29,4192009 14,472 14,798 29,2702010 14,067 14,540 28,607
Source:Ministry of Justice – Magistrates Recruitment and Appointments BranchNote:1 Including the areas in North-West England where magistrates were appointed by the Chancellor of
the Duchy of Lancaster, rather than by the Lord Chancellor, prior to April 2005
Table 10.6The MagistracyJustices of the Peace appointed1, by gender, 2005/06–2009/10
Number of JPs
Year Men Women Total
2005/06 1,132 1,080 2,2122006/07 1,225 1,187 2,4122007/08 927 972 1,8992008/09 814 959 1,7732009/10 759 873 1,632
Source:Ministry of Justice – Magistrates Recruitment and Appointments BranchNote:1 Including the areas in North-West England where magistrates were appointed by the Chancellor of
the Duchy of Lancaster, rather than by the Lord Chancellor, prior to April 2005

Judicial and Court Statistics 2009 | Chapter 10
206

Assessment of litigation costs, and publicly funded legal services
Chapter 11

Judicial and Court Statistics 2009 | Chapter 11
208
Chapter 11: Assessment of litigation costs, and publicly funded legal services
This chapter deals with the funding of litigation work, whether through an award of costs to a successful litigant on the completion of court proceedings, or through public Legal Aid schemes. The tables of detailed data can be found immediately following this section of commentary.
Key findings for 2009There were 11,526 cost bills assessed in the Supreme Court Costs Office in •2009, continuing a decline from 12,131 in the previous year. Of these, civil legal aid assessments fell by 24 per cent to 3,933 between 2008 and 2009.
About 98 per cent of defendants in Crown Court trials received publicly- •funded legal representation, where representation was known, the same as in the previous year.

Judicial and Court Statistics 2009 | Chapter 11
209
Detailed Assessment of Costs in Civil Proceedings
The detailed assessment of costs is the process of examining and if, necessary, reducing the bill of costs of a solicitor or Litigant in Person. Costs include not only the solicitor’s own professional fees, but also disbursements incurred including barristers’ and experts’ fees. The purpose of detailed assessment is:
a. to determine how much costs a successful party in litigation is entitled to recover from his unsuccessful opponent
b. in publicly funded cases to determine the amount which a solicitor or barrister is to be paid out of public funds
c. under the Solicitors’ Act to determine how much a client should have to pay his solicitor.
The office responsible for assessing costs depends on the type of case and whether it is publicly funded. The Senior Courts Costs Office (SCCO) deals mainly with costs relating to all proceedings in the Chancery, Family and Queen’s Bench Divisions of the High Court, the Court of Appeal (Civil Division) and the London County Court Group. It also deals with costs in matters involving the Court of Protection, various tribunals and assessments transferred from other county courts and district registries. It also deals with appeals against the determination of costs in the Crown Court. The Privy Council, House of Lords, Lands Tribunal, and, except as above, district registries and county courts are responsible for the detailed assessment of costs in their respective courts.
In 2009, the SCCO assessed 11,526 bills as against to 12,131 in 2008. The reduction in between parties’ assessments of bills of costs in civil cases was only 5 per cent in 2009 and this reflects the levelling out of the impact of Predictable Costs in Road Traffic Cases, the reduction in technical challenges to Conditional Fee Agreements and fixed success fees. The reduction of 23 per cent in the number of legal aid only assessments is a result of the introduction of standard fees in Section 31 Public Law care proceedings. Following the marked increase in appeals from Crown Court determining officers in 2007, these have now returned to levels regularly seen in previous years. Court of Protection assessments continue to increase and reached over 5000 for the first time. A random sample over seven years (2002-2009) of completed between parties’ assessments shows an average reduction of 25.9 per cent. The average reduction in Court of Protection bills is 16 per cent.
Summary caseload statistics on the work of the Supreme Court Costs Office is shown in Tables 11.1 and 11.2.
Separate statistics on costs assessments carried out by the Judicial Committee of the Privy Council and the House of Lords are shown in Table 11.3.

Judicial and Court Statistics 2009 | Chapter 11
210
Publicly-funded legal services
The Legal Services Commission (LSC) operates the two Legal Aid schemes in England and Wales, through which nearly all publicly-funded legal services are commissioned from independent suppliers. These schemes are described below.
The Community Legal Service (CLS) provides civil and family legal services. Work commissioned via the CLS is divided into two types:
- Legal advice and assistance (known as “Legal Help”), help at Court, and legal representation in front of the Asylum and Immigration or Mental Health Review Tribunals. This is known as “Controlled work” for contracting purposes.
- Legal representation by solicitors and barristers in civil or family cases which could go to court (other than in Very High Cost Cases which are managed individually under separate contracts). This is known as “Licensed work” for contracting purposes.
The Criminal Defence Service (CDS) which provides legal services to those arrested, charged or prosecuted in connection with a criminal offence. Work commissioned via the CDS is similarly divided into two broad types:
- Advice and / or representation in Police stations and magistrates’ courts
- Representation in the Crown Court and higher courts
Summary statistics on the monies spent and work commissioned by the CLS and CDS are shown in Table 11.4. Since the LSC annual report for 2009/10 is not due to be published until later in 2010, the expenditure-related figures in this table could not be updated for this report. The LSC annual report for 2009/10 will be available at: www.legalservices.gov.uk/aboutus/how/strategic_publications.asp#annual
However, for 2008/09 the LSC’s civil and crime providers delivered nearly 2.9 million acts of assistance. LSC also increased the number of cases of initial civil advice and assistance, on areas like debt and housing, to over one million. More detail on these issues is available from the website of Legal Services Commission at: www.legalservices.gov.uk.
Under the Access to Justice Act 1999, legal representation is available to anyone facing criminal proceedings before any Court where it is in the interests of justice that public funding be granted. The “Interests of Justice test” is set out in Schedule 5 of the Act, and guidance on its application is available from the Legal Services Commission website.

Judicial and Court Statistics 2009 | Chapter 11
211
An accused person can be granted publicly funded representation (by means of a Representation Order) where the court decides that it is in the interests of justice to do so. In making this decision, the court will take into account, among other factors, whether the charge is so serious that the defendant may be imprisoned or lose his job if convicted, or suffer serious damage to his reputation.
A Representation Order covers all criminal proceedings, including preliminary or incidental hearings and any related bail proceedings. Where a defendant has a Representation Order in a magistrates’ court or the Crown Court the representation order covers obtaining advice on appeal, as well as the preparation of any application for leave to appeal, or giving notice of appeal against conviction or sentence. However, it does not cover the costs of an appeal itself, although an application for a further representation order can be made directly to the Court of Appeal to cover those proceedings.
Since 2 October 2006, defendants appearing before the magistrates’ court have been required to pass an additional test of financial eligibility to qualify for publicly funded representation. This ‘means test’ takes account of a defendant’s personal circumstances (e.g. size of family) as well as their basic income. As of 2 April 2007, applicants can therefore have a gross annual income of up to £21,487 and still qualify for legal aid. During the first twelve months of this scheme, just over 90 per cent of all ‘means test’ applications were granted.
In 2009, around 126,000 applications were made in magistrates’ courts for representation in the Crown Court (for committed, sent for trial or committed for sentence cases) (Table 11.7).
Overall, around 98 per cent of Crown Court defendants in cases committed or sent for trial, where known, were in receipt of publicly-funded legal representation, with the remainder either receiving privately-funded representation or going unrepresented (Table 11.6). The corresponding figure for defendants committed to the Crown Court for sentence after a summary trial was 93 per cent, and for those appealing against the decisions of magistrates’ courts, 67 per cent.
Statistics on the funding of Crown Court representation are given in Tables 11.5 to 11.7.

Judicial and Court Statistics 2009 | Chapter 11
212
Table 11.1Supreme Court Costs OfficeNumber of costs bills assessed, by type of case giving rise to the bill, 2005–2009
Number of bills
Type of case 2005 2006 2007 2008 2009
"Between parties" assessments 3,062 2,459 2,205 1,888 1,788
Civil legal aid assessments 5,939 6,315 5,756 5,146 4,319
Receivers' costs in the Court of Protection 4,438 4,082 4,528 4,710 5,054
Appeals against determination of costs in the Crown Court 333 366 528 387 365
Total assessments 13,772 13,222 13,017 12,131 11,526
Source:Supreme Court Costs Office

Judicial and Court Statistics 2009 | Chapter 11
213
Tabl
e 11
.2Su
prem
e C
ourt
Cos
ts O
ffice
Num
ber o
f cos
ts b
ills
asse
ssed
and
thei
r est
imat
ed to
tal a
nd a
vera
ge v
alue
s, by
juris
dict
ion
of o
rigin
al c
ase,
200
5–20
09
Orig
inal
cas
e ju
risdi
ctio
n
2005
2006
2007
2008
2009
Cost
bill
s as
sess
edEs
timat
ed
tota
l val
ue 1
Estim
ated
av
erag
e va
lue
Cost
bill
s as
sess
edEs
timat
ed
tota
l val
ue 1
Estim
ated
av
erag
e va
lue
Cost
bill
s as
sess
edEs
timat
ed
tota
l val
ue1
Estim
ated
av
erag
e va
lue
Cost
bill
s as
sess
edEs
timat
ed
tota
l val
ue 1
Estim
ated
av
erag
e va
lue
Cost
bill
s as
sess
edEs
timat
ed
tota
l val
ue 1
Estim
ated
av
erag
e va
lue
Cour
t of A
ppea
l (Ci
vil)
458
£8,19
8,20
0£1
7,900
522
£11,7
51,8
50£2
2,51
353
7£1
6,79
1,556
£31,2
6951
3£7
,691
,000
£14,
992
415
£7,6
25,0
00£1
8,37
3
Hig
h Co
urt
Que
en’s
Benc
h D
ivisi
on2
1,430
£98,
670,
000
£69,
000
1,550
£81,6
37,4
83£5
2,66
91,3
94£6
9,88
2,96
8£5
0,13
11,3
01£4
1,914
,968
£32,
218
1,500
£59,
522,
000
£39,
681
Chan
cery
Div
ision
349
£19,
195,
000
£55,
000
237
£25,
454,
000
£107
,401
203
£17,1
17,9
86£8
4,32
522
3£1
4,24
3,00
0£6
3,87
022
5£2
1,471
,000
£95,
427
Fam
ily D
ivisi
on3,
870
£46,
440,
000
£12,
000
4,15
0£6
0,73
5,123
£14,
635
4,24
8£7
3,21
7,952
£17,2
363,
292
£50,
150,
000
£15,
234
2,93
0£3
7,414
,000
£12,
769
Adm
inist
rativ
e Cou
rt239
0£8
,580
,000
£22,
000
325
£5,4
14,2
00£1
6,65
933
2£3
,910
,931
£11,7
8027
5£2
,534
,000
£9,2
15*
**
Cour
t of P
rote
ctio
n4,
438
£21,7
46,2
00£4
,900
4,08
2£2
0,41
0,00
0£5
,000
4,52
8£2
6,90
6,68
8£5
,942
4,71
0£2
6,90
6,68
8£5
,713
5,05
4£3
9,52
7,176
£7,8
21
Trib
unal
s11
4£5
,415
,000
£47,5
0013
5£4
,996
,764
£37,0
1362
£2,10
5,64
5£3
3,96
210
3£3
,577
,000
£34,
728
110
£14,
058,
000
£127
,800
Coun
ty co
urts
32,
390
£59,
750,
000
£25,
000
1,855
£60,
803,
875
£32,
778
1,185
£30,
494,
538
£25,
734
1,327
£25,
404,
000
£19,
144
927
£30,
672,
000
£33,
087
Crow
n Co
urt
(App
eals
agai
nst i
nitia
l co
st d
eter
min
atio
ns)
333
**
366
**
528
**
387
**
365
**
Tota
l13
,772
13,2
2213
,017
12,13
111
,526
Sour
ce:
Supr
eme
Cour
t Cos
ts O
ffice
Not
es:
1 Es
timat
ed v
alue
s ar
e fo
r “br
ough
t-in
” bi
lls (i
.e. b
efor
e th
e pr
oces
s of d
etai
led
asse
ssm
ent)
. A ra
ndom
sam
ple
over
the
year
s 20
02-2
009
of c
ompl
eted
“be
twee
n pa
rtie
s” a
sses
smen
ts s
how
s tha
t thi
s pr
oces
s le
d to
an
aver
age
redu
ctio
n of
25.
9% in
the
valu
e of
thes
e bi
lls
2 Fr
om 2
009
Que
en’s
Benc
h D
ivis
ion
incl
udes
Adm
inis
trat
ive
Cour
t3
Coun
ty c
ourt
figu
res
incl
ude
asse
ssm
ents
of b
ills
in 6
0 ba
nkru
ptcy
cas
es fo
r 200
6, 2
1 ca
ses f
or 2
007,
35 c
ases
for 2
008
and
386
case
s for
200
9 *
Aver
ages
are
not
sho
wn
whe
re th
ere
are
few
er th
an 2
0 ca
ses
in a
giv
en y
ear

Judicial and Court Statistics 2009 | Chapter 11
214
Tabl
e 11
.3Ju
dici
al C
omm
itte
e of
the
Priv
y C
ounc
il an
d H
ouse
of L
ords
Num
ber o
f cos
ts b
ills
asse
ssed
and
thei
r tot
al a
nd a
vera
ge a
llow
ed v
alue
s, 20
05–2
009
2005
2006
2007
2008
2009
Cost
bill
s as
sess
edEs
timat
ed
tota
l val
ue
Estim
ated
av
erag
e va
lue
Cost
bill
s as
sess
edEs
timat
ed
tota
l val
ue
Estim
ated
av
erag
e va
lue
Cost
bill
s as
sess
edEs
timat
ed
tota
l val
ue
Estim
ated
av
erag
e va
lue
Cost
bill
s as
sess
edEs
timat
ed
tota
l val
ue
Estim
ated
av
erag
e va
lue
Cost
bill
s as
sess
edEs
timat
ed
tota
l val
ue
Estim
ated
av
erag
e va
lue
Judi
cial C
omm
ittee
of t
he P
rivy C
ounc
il
Petit
ions
for s
pecia
l lea
ve
to a
ppea
l5
£33,
237
**
**
4£1
8,00
6*
4£1
42,2
89*
**
*
Appe
als
10£3
42,5
26*
10£7
37,0
33*
8£4
42,4
28*
9£8
05,12
7*
**
*
Hou
se o
f Lor
ds1
Petit
ions
for l
eave
to
appe
al25
£108
,263
£4,3
3125
£108
,497
£4,3
3930
£95,
374
£3,17
926
£86,
251
£3,3
1737
£156
,861
£4,2
39
Appe
als
24£1
,235
,405
£51,4
7514
£1,4
33,7
52£1
02,4
1024
£1,6
52,13
8£6
8,83
930
£2,16
4,42
1£7
2,147
30£2
,329
,208
£77,6
40
Sour
ce:
Judi
cial C
omm
ittee
of t
he P
rivy
Coun
cil a
nd Ju
dicia
l Offi
ce, H
ouse
of L
ords
Not
es:
1 Th
e Su
prem
e Co
urt c
ame
into
bei
ng o
n 1 O
ctob
er 2
009.
The
dat
a fo
r 200
9 in
clud
es 11
app
eals
and
6 pe
titio
ns fo
r lea
ve w
hich
wer
e H
ouse
of L
ords
case
s, ce
rtifi
ed in
the
Supr
eme
Cour
t *
Aver
ages
are
not
show
n w
here
ther
e ar
e fe
wer
than
20
case
s in
a gi
ven
year

Judicial and Court Statistics 2009 | Chapter 11
215
Table 11.4Publicly-funded legal servicesSummary statistics on activity and expenditure, 2005/06–2008/09 1
2005/06 2006/07 2007/08 2008/09 1
Community Legal Service (CLS)
Civil and Family: Representation
Cash payments (£m) £806.8 £774.2 £801.9 ..
Acts of Assistance (thousands) 2 194.8 179.5 165.8 149.9
Civil and Family: Advice and Assistance (“Legal help”)
Cash payments (£m) £284.1 £261.4 £260.4 ..
Acts of Assistance (thousands) 3 801.4 884.6 834.6 927.7
CLS total
Total cash payments (£m) £1,090.9 £1,035.6 £1,062.3 ..
Operating receipts (£m) £259.8 £226.7 £218.2 ..
Total net expenditure (£m) £831.1 £808.9 £844.1 ..
Total Acts of Assistance (thousands) 996.2 1064.1 1000.4 1077.6
Criminal Defence Service (CDS)
Criminal: Police stations and magistrates’ courts
Cash payments (£m) £501.9 £529.4 £486.7 ..
Acts of Assistance (thousands) 1488.9 1473.8 1378.5 1520
Criminal: Crown Court and higher courts
Cash payments (£m) £695.5 £647.9 £693.4 ..
Acts of Assistance (thousands) 121.5 120.7 123.5 124.4
CDS total
Total cash payments (£m) £1,197.4 £1,177.3 £1,180.1 ..
Operating receipts (£m) 4 £0.6 £5.9 £1.1 ..
Total net expenditure (£m) £1,196.8 £1,171.4 £1,179.0 ..
Total Acts of Assistance (thousands) 1610.4 1594.5 1502.0 1644.4
All publicly funded legal services 5
Total cash payments (£m) £2,288.3 £2,212.9 £2,242.4 ..
Operating receipts (£m) £260.4 £232.6 £219.3 ..
Total net expenditure (£m) £2,027.9 £1,980.3 £2,023.1 ..
Total Acts of Assistance (thousands) 2606.6 2658.6 2502.4 2722.0
Source:Legal Services Commission’s Annual Reports for years shownNotes:1 Figures marked with .. were not available when this report was being produced, but will be included in table Fund 1 of Legal
Services Commission’s annual report for 2009/10 when it is published in the autumn2 From 2008/09 the figure for acts of assistance for civil representation has been calculated on a different basis and therefore
not directly comparable with previous years’ figures3 The figures for acts of assistance for Legal Help do not include telephone triage acts of assistance. With those included, the
figures for 2007/08 and 2008/09 would have been 1,004.2 and 1,163.6 respectively4 All “cash payments” figures represent gross expenditure, except for Criminal Higher payments up to 2004/05, which
represent net expenditure. This is because Criminal Higher legal aid was funded directly, rather than via the Legal Services Commission, prior to April 2005. CDS operating receipts up to 2004/05 therefore exclude any income relating to Criminal Higher work
5 The scope of legal work covered by both the CDS and the CLS has changed during the period covered by this table. For details of these scope changes, please see the Legal Services Commission’s annual reports and other related documents

Judicial and Court Statistics 2009 | Chapter 11
216
Table 11.5Funding of Crown Court representationNumber of applications 1 for public funding filed in the Crown Court, by type of proceeding and result, 2005–2009
Number of applications
Type of proceeding 2005(r) 2006(r) 2007(r) 2008(r) 2009
Committed / Sent for trial 2,745 2,711 5,126 4,583 3,758Committed for sentence 4,945 7,575 10,903 10,394 9,694Appeals against magistrates’ court decisions 3,163 3,559 5,379 5,346 5,014
Source:CREST system, HM Courts ServiceNote:1 Includes a small number of applications for extensions of public funding which were filed and granted in the magistrates’ court
Table 11.6Funding of Crown Court representationDefendants and appellants in the Crown Court, by type of proceeding and type of representation, 2008
Defendants
Type of proceeding
Represented under criminal public funding
Privately / not represented Unknown 1 Total
Committed / Sent for trial 109,278 2,164 1,030 112,472
Committed for sentence 28,612 2,286 4,796 35,694
Appeals against magistrates’ court decisions 6,684 3,346 4,166 14,196
Source:CREST system, HM Courts ServiceNote:1 Defendants and appellants who do not have their type of representation recorded in CREST are classified as ‘Unknown’
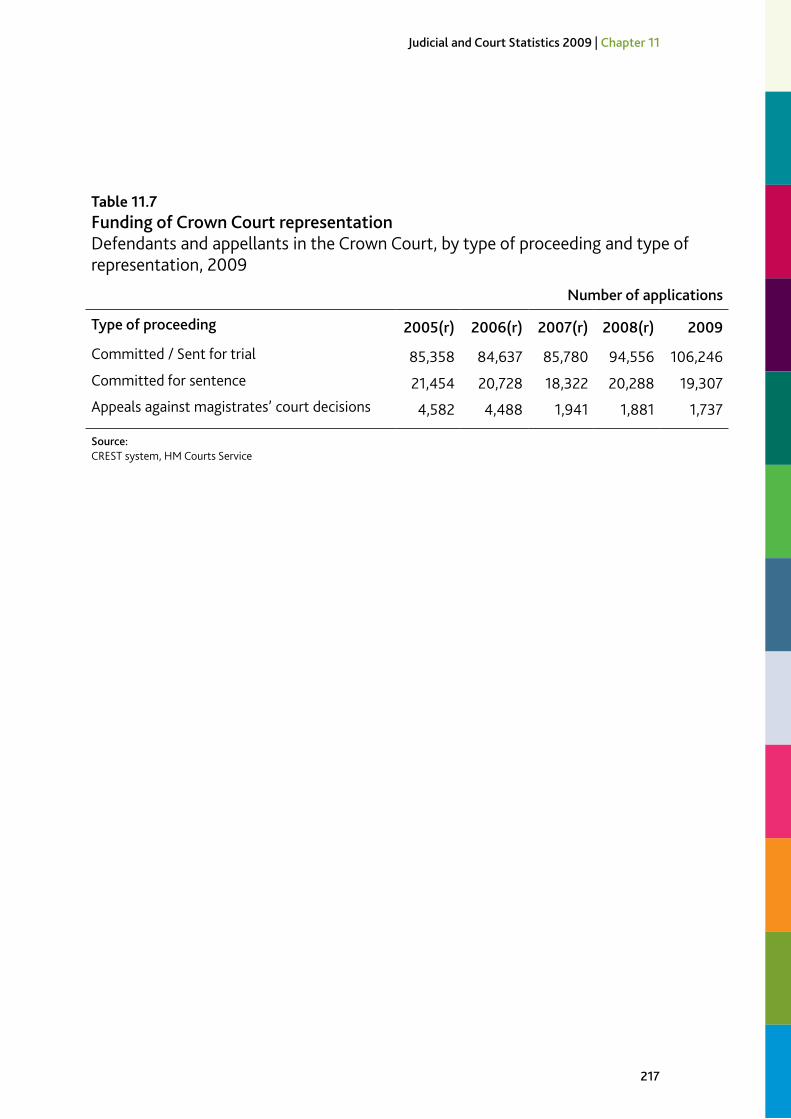
Judicial and Court Statistics 2009 | Chapter 11
217
Table 11.7Funding of Crown Court representationDefendants and appellants in the Crown Court, by type of proceeding and type of representation, 2009
Number of applications
Type of proceeding 2005(r) 2006(r) 2007(r) 2008(r) 2009
Committed / Sent for trial 85,358 84,637 85,780 94,556 106,246Committed for sentence 21,454 20,728 18,322 20,288 19,307Appeals against magistrates’ court decisions 4,582 4,488 1,941 1,881 1,737
Source:CREST system, HM Courts Service

Judicial and Court Statistics 2009 | Chapter 11
218

Data quality and sources
Annex A

Judicial and Court Statistics 2009 | Annex A
220
Annex A: Data sources and data quality
This annex gives brief details of data sources for the figures given in this report, along with a brief discussion on data quality. All data in this edition of Judicial and Court Statistics relates to the calendar year 2009, unless otherwise noted.
Chapter 1: County courts (non-family)
This information has principally been produced using the Management Information System (MIS), a data warehousing facility drawing data directly from court-based administrative systems. Most data shown in the tables have been sourced from the county court administrative system CaseMan, used by court staff for case management purposes. This contains good quality information about the incidence and dates of major events in a case’s progress through the court system. Statistical quality assurance procedures include the identification and removal of duplicate entries for the same event in a case, and checks that data have been collated for all courts to ensure completeness.
The numbers of insolvency petitions, applications for administration orders and administration orders made are sourced from manual counts made by court staff. Since April 2009 these have been recorded in the One Performance Truth (OPT) database, a web-based data monitoring system allowing direct inputting of performance data by court staff. Prior to April 2009 they were inputted into the Business Management System, designed for the purpose of monitoring and assessing court workloads. Quality assurance measures are in place to ensure that data are of sufficient quality, including querying with courts where their counts look unusually high or low and obtaining corrected figures if errors are identified.
Table 1.9 shows statistics on unspecified “money” claims, broken into several value ranges. The figures split by amount are counted based on the claim issue fee paid, this indicating the value range of the claim. The issue fee was either not present or didn’t correspond to any of the claim value ranges (sometimes due to exemption or remission) in around four per cent of claims in each year.
The numbers of small claims hearings and trials are sourced from CaseMan. Their accuracy is dependent on court staff entering correct hearing outcome codes onto the system, which is not essential information for case administration purposes. As a result, these statistics are considered to be of lower quality than the other main case event volumes derived from CaseMan.

Judicial and Court Statistics 2009 | Annex A
221
Table 1.14 shows the average time between case issue, allocation to track (for fast and multi-track cases) and the start of a small claims hearing or trial, plus statistics on the duration of small claims hearings and trials. The statistics on average times between the major case milestones are sourced from CaseMan. The statistics on hearing / trial durations are sourced from, respectively, the small claims sampler and the trial sampler. The small claims sampler is a manual form which 29 county courts (from a total of around 216 across England and Wales) are required to complete for three months during the year. The trial sampler is a manual form which all county courts are required to complete for two months during the year. As such, these statistics represent the results for minority subsets, and are not based on all such hearings/trials occurring across England and Wales during the year.
Figures in Table 1.21 showing the numbers of repossessions of property by county court bailiffs have been revised from those previously published. This is due to a revised methodology which takes account of the outcomes of warrants which are recorded onto the county court case management systems (CaseMan and Possession Claim Online) by courts to which warrants were transferred following issue. Although the courts which issued the warrants are supposed to record the outcomes of them, this has not always happened in practice.
The overall totals have been revised up by three per cent for all years except 2007 and 2008. For these the revisions are bigger, for mortgage repossessions by 10 per cent in 2007 and 15 per cent in 2008 and for landlord repossessions by six per cent in 2007 and by seven per cent in 2008. The revisions are larger for mortgage repossessions than landlord repossessions, with the latter tending to be more local events so fewer warrants get transferred to other courts to be executed. Table 1.23 shows the new results and the differences between the new and old results.

Judicial and Court Statistics 2009 | Annex A
222
Table 1.23Comparison of the old and new repossessions of property by bailiffs counts, England and Wales, 2005-2008Old count = the number of repossessions recorded by the courts in whose name the warrants were issuedNew count = the number of repossessions recorded by all courts
Number of repossessions
Type of case 2005 2006 2007 2008
Mortgage repossessionNew 12,850 21,017 23,894 35,823Old 12,488 20,401 21,769 31,148
% difference 3% 3% 10% 15%Social landlord repossession
New 24,416 23,179 20,667 20,249Old 23,714 22,583 19,356 18,556
% difference 3% 3% 7% 9%Private landlord repossession
New 4,004 4,120 4,356 4,445Old 3,873 4,021 4,086 4,109
% difference 3% 2% 7% 8%Accelerated repossession
New 6,002 6,775 7,557 7,575Old 5,872 6,657 7,426 7,463
% difference 2% 2% 2% 2%Other
New 2,337 2,297 2,104 2,074Old 2,240 2,193 2,006 2,023
% difference 4% 5% 5% 3%Total
New 49,609 57,388 58,578 70,166Old 48,187 55,855 54,643 63,299
% difference 3% 3% 7% 11%
Source:HMCS CaseMan system and Possession Claim OnlineNotes:1 Includes warrants issued in the County Court Bulk Centre and via Money Claim Online and Possession Claim Online2 The vast majority of warrant of repossession outcomes are repossession, the warrant being suspended by an order made by
the court and the warrant being withdrawn

Judicial and Court Statistics 2009 | Annex A
223
Chapter 2: Family matters
The data on the family matters is principally sourced from the county court administrative system FamilyMan, used by court staff for case management purposes and containing good quality information about a case’s progress through the family courts. Some data are also sourced from the OPT database. Statistical quality assurance procedures include the identification and removal of duplicate entries for the same case on the administrative systems, and checks that data have been collated for all courts to ensure completeness.
Some points to note about counting rules in the statistics:
A disposal which occurs in one quarter or year may relate to an application •which was initially made in an earlier period.
An application of one type may lead to an order of a different type being made. •
The statistics on matrimonial, ancillary relief and domestic violence •proceedings are counted by case. The statistics on public law and private law proceedings relate to the number of children which are subject to applications: for example if two children are the subject of a single case then the children would be counted separately in the statistics. Different types of orders may be made in respect of different children involved in a case.
Public law and private law Children Act figures are given in Tables 2.1 to 2.4. Data for the Family Proceedings Courts which share premises and administrative systems with county courts is sourced from FamilyMan. Data for other Family Proceedings Courts was provided on electronic summary returns submitted to HMCS Business Information Division on a monthly basis. The figures shown for Family Proceedings Courts pre 2007 are weighted estimates based on data from a subset of courts. There are known data quality problems with these, which are likely to be an undercount.
During this year, a review of the data compilation methodology was carried out by Ministry of Justice statisticians to develop a more accurate process for counting public and private law applications made at county courts, Family Proceedings Courts and the High Court. As a result of this work, a new methodology has been established and introduced as of this volume which incorporates a more robust and well-understood process for calculating the number of applications; some steps of the previous compilation methodology were not clearly documented and understood. The new methodology has been based on aggregating up from case level data held on the FamilyMan system and continues to use monthly return data for Family Proceedings Courts which do not share premises with county courts. It includes processes designed to remove the double-counting of cases transferred between courts.

Judicial and Court Statistics 2009 | Annex A
224
The statistics shown in Table 2.1 of this report therefore incorporate revisions to the previously published statistics for 2005 to 2009 as a result of the introduction of this new methodology. It is not possible to revise FPC figures prior to 2008 using the new methodology, and there may therefore be a shortfall in the overall totals for those years. However, the revised figures below represent the best estimates for public and private law application figures during the years 2005 to 2007. The table below summarises how these compare to previously published figures.
Table 2.1Family mattersRevised figures for the number of children involved in Public and Private Law applications, made in each tier of court, 2005 to 2009
Number of children
Previously published figures
Year
Public law Private law
FPC CC HC Total FPC CC , HC Total
2005 15,830 6,440 840 23,110 15,820 85,600 910 102.3302006 13,660 6,870 840 21,370 16,410 86,270 990 103,6702007 13,640 6,260 900 20,790 19,190 87,210 780 107,1802008 13,680 5,800 740 20,220 19,360 93,390 850 113,5902009 19,160 6,520 560 26,230 30,530 102,280 970 133,780
Revised figures using new methodology
Year
Public law Private law
FPC CC HC Total FPC CC , HC Total
2005 15,830 6,390 450 22,660 15,820 93,300 1,210 110,3302006 13,660 6,500 360 20,510 16,410 93,920 1,180 111,5102007 13,640 5,630 380 19,650 19,190 94,650 1,000 114,8402008 14,200 5,180 380 19,760 18,040 101,440 1,020 120,5002009 19,760 5,770 290 25,810 27,670 108,670 1,150 137,480

Judicial and Court Statistics 2009 | Annex A
225
The statistics for private law applications in the county courts have been revised upwards by between 6 per cent and 9 per cent in each year; this is believed to be as a result of the process for removing the double-counting of cases transferred between county courts in the previous methodology subtracting too many such cases. The figures for private law applications in family proceedings courts (FPCs) have been revised downwards, believed to be due to the double-counting of some cases transferred from county courts to FPCs in the previous figures.
Figures on the number of matrimonial proceedings are given in Table 2.5. Statistics on the number of divorces occurring each year in England and Wales are also published by the Office for National Statistics (ONS). The Ministry of Justice’s divorce statistics are sourced directly from the FamilyMan system, while the ONS data are compiled from “D105” forms used by the courts to record decrees absolute, which are supplied to ONS for compiling the central index of decrees absolute. There are small differences between the number of divorces as recorded by the two sets of statistics: 0.7 per cent for 2008 data. There are believed to be some differences in the quality assurance and compilation processes currently used to produce the statistics. Statisticians at the Ministry of Justice and ONS are working together with HM Courts Service to reconcile these differences as closely as possible. However some of this difference will be accounted for by the fact that the two sets of figures do not count precisely the same cases: for example, the ONS statistics include annulments while the MoJ figures do not; conversely the MoJ data include dissolutions of civil partnerships which are excluded from the ONS counts.
Percentage differences
Year
Public law Private law
FPC CC HC Total FPC CC , HC Total
2005 0.0% -0.9% -46.6% -1.9% 0.0% 9.0% 32.9% 7.8%2006 0.0% -5.5% -57.5% -4.0% 0.0% 8.9% 19.4% 7.6%2007 0.0% -10.0% -58.1% -5.5% 0.0% 8.5% 28.1% 7.1%2008 3.8% -10.6% -49.4% -2.3% -6.8% 8.6% 20.0% 6.1%2009 3.1% -11.6% -49.1% -1.6% -9.4% 6.2% 18.0% 2.8%

Judicial and Court Statistics 2009 | Annex A
226
Table 2.7
Number of disposals
Year
In respect of child(ren)
Not in respect of child(ren) Total
Published figures Revised
Published figures Revised
Published figures Revised
2006 14,308 14,157 14,184 13,821 28,492 27,9782007 13,903 13,367 14,497 13,234 28,400 26,6012008 13,094 11,596 14,767 11,921 27,861 23,517
Figures on the number of applications for ancillary relief given in Tables 2.6 and 2.7 differ from those previously published due to the implementation of a new methodology which allows duplicate records to be removed. Some duplicates had been included in previously published figures. The table below summarises the revisions.
Disposal of applications for ancillary relief made in county courts, revised figures for 2006-2008
Table 2.6
Number of disposals
Year
Uncontested
Initially contested, subsequently
consented Contested Total
Published figures Revised
Published figures Revised
Published figures Revised
Published figures Revised
2006 83,463 81,283 22,271 22,026 6,221 5,952 111,955 109,2612007 77,356 77,221 21,668 20,961 6,732 5,640 105,756 103,8222008 66,570 67,042 21,530 17,976 6,331 5,541 94,431 90,559
Figures for Table 2.10 and 2.11 were provided by the Principal Registry of the Family Division, a division of the High Court.

Judicial and Court Statistics 2009 | Annex A
227
Adoption
An adoption order made by a court extinguishes the rights, duties and obligations of the natural parents or guardian and vests them in the adopters. On adoption the child becomes, for virtually all purposes in law, the child of its adoptive parents and has the same rights of inheritance of property as any children born to the adoptive parents.
The Adoption and Children Act 2002 was implemented on 30 December 2005, replacing the Adoption Act 1976. The key changes resulting from the new act are:
alignment of adoption law with the Children Act 1989 to ensure that the •child’s welfare is the most important consideration when making decisions
provision for adoption orders to be made in favour of unmarried couples •
the introduction of Special Guardianship Orders, intended to provide •permanence for children for whom adoption is not appropriate.
The Office for National Statistics will publish adoption figures for 2009 later in 2010.
Chapter 3: Magistrates’ courts
Since 2008 the HMCS Performance Database ‘OPT’ has been used for collecting data on most aspects of magistrates’ courts activity. This is a web-based performance system which enables aggregation to national level. In most cases the 2008 data is comparable with earlier data, but this does not apply to caseload data. The data sources used within this chapter are briefly discussed below.
Defendants Proceeded Against
The figures presented here are derived from the Completed Proceedings report on the HMCS Performance Database ‘OPT’, which covers all cases dealt with in magistrates’ courts – criminal and otherwise.
The statistics on completed proceedings is populated based on information contained on the Libra Management Information System and Manual data collection. This contains good quality information about magistrates’ courts’ caseloads. Data provided by the courts must be checked and verified at case level by court staff before being submitted on OPT, and the centrally collated data are subject to further checks including the investigation of apparent anomalies in the data. Completed proceedings contains good quality information about case completed at the magistrates’ courts and the composition of the caseload. However, the data are necessarily subject to the inaccuracies inherent in any large-scale data recording system.

Judicial and Court Statistics 2009 | Annex A
228
In previous bulletins, figures were obtained from the Office for Criminal Justice Reform (OCJR) Court Proceedings Database, which collected data from a variety of administrative databases held by courts and police forces. Due to a changeover in the data collection system, comparable data were not available for 2008. As the datasets in OPT and the Court Proceedings Database are not identical, results cannot be directly compared. Therefore in this bulletin no comparison is made between the caseload figures for 2008 and earlier years.
The OPT data is case-based, so where a case has more than one offence, only the most serious offence is counted.
Timeliness
Information on timeliness of cases proceeded against in the magistrates’ courts is taken from a sample survey, the Time Intervals Survey (TIS). TIS reports on the average (mean) time taken between stages of proceedings for defendants in completed criminal cases in magistrates’ courts. Information on adult indictable/ triable-either-way cases and adult charged summary cases are collected in one week of each quarter. Information on adult summonsed summary offences is additionally collected in the first and third quarters. Information on youth defendants in both indictable and summary cases is collected in four weeks of each quarter.
Each sample provides one estimate of the average time taken – different samples would produce different average times. Therefore the margin of error associated with each sample is provided to estimate the likely range within which the ‘true’ average time falls. This 95 per cent confidence interval lies between the sample average +/- the margin of error. The size of the margin of error and width of the confidence interval is dependent on the sample size.
The figures on timeliness are based on defendants: where a case involved more than one defendant, each defendant is considered individually.
Timeliness results are ‘snapshot’ estimates rather than exact measures. They are vulnerable to external factors such as sampling, human error and case-mix changes, as any such survey would be. The data undergo various levels of checking: manual verification at input stage by court managers; electronic validation by database software; and manual validation and verification by central HMCS and MoJ staff.
Further details on TIS are available at: http://www.justice.gov.uk/publications/timeintervals.htm

Judicial and Court Statistics 2009 | Annex A
229
Trials
The figures presented on trials are collected and processed by the Business Information Division in HMCS. Prior to April 2007 the data was collected on the cracked and ineffective trial monitoring forms. The online HMCS Performance Database ‘OPT’ was introduced in April 2007 and has been used since then for data collection. The figures are vulnerable to external factors such as human error and missing data due to non-returns.
The numbers of effective, cracked and ineffective trials are monitored, as well as the reasons for cracked and ineffective trials. These individual reasons were then grouped as per overleaf (the available choice of reasons for recorders changed in 2006 as shown).

Judicial and Court Statistics 2009 | Annex A
230
Groupings of Recordable Reasons for Cracked TrialsGrouping Individual reasons –
up to 2005Individual reasons – 2006 onwards
Late guilty plea ac-cepted
Late guilty plea, first time •offered by defendant
Late guilty plea, previously •rejected by prosecution
Acceptable guilty plea(s) •entered late, offered for the first time by the defence
Acceptable guilty plea(s) •entered late, previously rejected by the prosecution
Guilty plea to alterna-tive new charge
Guilty plea to alternative new •charge - first time offered by defence
Guilty plea to alternative new •charge, previously rejected by prosecution
Acceptable guilty plea(s) to •alternative new charge, first time offered by defence
Acceptable guilty plea(s) to •alternative new charge, previously rejected by the prosecution
Defendant bound over
Defendant bound over – first •time offered by defence
Defendant bound over – •previously rejected by prosecution
Defendant bound over, •offered for the first time by the defence
Defendant bound over, •previously rejected by the prosecution
Prosecution end case
Prosecution end case - •insufficient evidence
Prosecution end case – •witness absent/withdrawn
Prosecution end case – other •
Prosecution end case: •insufficient evidence
Prosecution end case: witness •absent / withdrawn
Prosecution end case: public •interest grounds
Prosecution end case: •adjournment refused
Other Other – specify in comments •box
Unable to proceed with trial •because defendant incapable through alcohol / drugs
Defendant deceased •

Judicial and Court Statistics 2009 | Annex A
231
Groupings of Recordable Reasons for Ineffective TrialsGrouping Individual reasons –
up to 2005Individual reasons – 2006 onwards
Prosecution not ready
Prosecution not ready •
Prosecution not ready •(disclosure problems)
Prosecution not ready: served •late notice of additional evidence on defence
Prosecution not ready: specify •in comments
Prosecution failed to disclose •unused material
Prosecution witness absent
Prosecution witness absent •– police
Prosecution witness absent – •other
Prosecution witness absent: •police
Prosecution witness absent: •professional / expert
Prosecution witness absent: •other
Defendant absent
Defendant absent – did not •attend
Defendant absent – ill •
Defendant absent not •produced from custody
Defendant absent – did not •proceed in absence (judicial discretion)
Defendant ill or otherwise •unfit to proceed
Defendant not produced by •PECS
Defendant not ready
Defence not ready •
Defence not ready (disclosure •problems)
Defence not ready: specify in •comments (inc. no instructions)
Defence not ready: disclosure •problems
Defence witness absent
Defence witness absent • Defence witness absent •

Judicial and Court Statistics 2009 | Annex A
232
Grouping Individual reasons – up to 2005
Individual reasons – 2006 onwards
Other Lack of court time / •magistrate availability
Overlisting •
Other – specify in comments •box
Another case over-ran •
Judge / magistrate availability •
Case not reached / •insufficient cases drop out / floater not reached
Equipment / accommodation •failure
No interpreter available •
Prosecution advocate •engaged in another trial
Prosecution advocate failed •to attend
Prosecution increased time •estimate – insufficient time for trial to start
Defence asked for additional •prosecution witness to attend
Defence increased time •estimate, insufficient time for trial to start
Defence advocate engaged in •other trial
Defence advocate failed to •attend
Defendant dismissed •advocate
Enforcement
The figures presented on fine enforcement are from the debt analysis return (DAR) collected and processed by the Business Information Division in HMCS. The information is collated to provide national figures. The online HMCS Performance Database ‘OPT’ was introduced in April 2007 and has been used since then for data collection. The data collected provides good quality information on fines collected and processed. However, the figures are vulnerable to external factors such as human error and missing data due to non-returns.

Judicial and Court Statistics 2009 | Annex A
233
Information prior to 2004 has not been provided. The collection of enforcement information (DAR) was revised in April 2003 so that it no longer contained confiscation or civil amounts, and is therefore not available prior to that date in a similar format.
Further information is available at: http://lcjb.cjsonline.gov.uk/ncjb/42.html
Chapter 4: Crown Court
This information has been produced using the Management Information System (MIS), a data warehousing facility drawing data directly from court-based administrative systems. Most data shown in the tables have been sourced from the Crown Court administrative system CREST, used by court staff for case management purposes. This contains good quality information about the incidence and dates of major events as each case progresses in the Crown Court. Statistical quality assurance procedures include the identification and removal of duplicate entries, checks of apparent anomalies and checks for completeness.
The Ministry of Justice’s “Criminal Statistics” publication also contains data on the number of proceedings heard in the Crown Court. Both sets of figures are produced from the same core source (the CREST system), but they are not directly comparable as there are known differences between them. These are due to a number of factors, including differences in the data collation mechanics and the counting and validation rules used, and they reflect different underlying drivers of the analyses being performed. By way of broad illustration, Criminal Statistics counts numbers of defendants and is focused on the final outcomes of criminal court proceedings, while the court statistics presented here count numbers of cases and is focused on flows through the court system. Work is currently under way to investigate and review the differences between the two sets of statistics and compilation processes, with a view to aligning the two datasets in future.
During 2006 changes were made to the Crown Court centres. A new Crown Court centre was created, Mold, which was a satellite court, became independent, and Warrington, which was independent, became a satellite of Chester. Welsh courts that were satellites of Chester (Caernarvon and Dolgellau) became satellites of Mold. These changes were made in preparation for the change in the regions which made Cheshire a part of the North West and Wales a region on its own. When Mold became independent, the information about the existing cases being dealt with was copied to the new system from Chester. This meant that some cases existed on both systems and data have been adjusted accordingly to avoid duplication in the statistics for this period.

Judicial and Court Statistics 2009 | Annex A
234
Chapters 5, 6 and 7: High Court and Appellate Courts
All the statistics in these chapters are provided specifically for this publication, and are ultimately sourced based on information contained on a range of administrative systems used by court staff for case management purposes.
The Judicial and Court Statistics compilation team carry out some statistical quality assurance procedures on receipt of the data, such as checks of apparent anomalies.
Chapters 8, 9, 10 and 11: Mental Capacity Act; Offices of the Supreme Court; The Judiciary; and Assessment of litigation costs, and publicly funded legal services
Information for the Mental Capacity Act, the Office of the Supreme Court, the Judiciary and Assessment of litigation costs, and publicly funded legal services have been produced using the Management Information System (MIS), a data warehousing facility drawing data directly from court-based administrative systems. Most data shown in the tables have been sourced from the Court of Protection, the Office of the Public Guardian, the Office of the Official Solicitor and Public Trustee, Tipstaff, Judicial Communication Office, Supreme Court Costs Office and the Crown Court administrative system CREST. These MISs contain good quality information about a cases progress. Statistical quality assurance procedures include the identification and removal of duplicate entries, checks of apparent anomalies and checks for completeness.
Queries
Enquiries about the statistics within each chapter should be sent to the Ministry of Justice using the details provided in the Contacts section at the end of this report. Some requests will be forwarded to the relevant office.

Judicial and Court Statistics 2009 | Glossary
235
Glossary
This glossary provides a brief description of some of the main terms used in the Commentary section of this report. For further information, please contact the Justice Statistics Analytical Services division using the details provided in the Explanatory Notes section at the end of this bulletin.
County courts (non-family)
Administration order: Combines a debtor’s debts under certain conditions (see footnote to Table 1.22), enabling the debtor to make regular payments to the court which are then distributed to the various creditors.
Attachment of earnings order: Obliges the debtor’s employer to deduct a set sum from the debtor’s pay and forward it to the court.
Charging order: Enables the creditor to obtain security for the payment against an asset(s), typically property, owned by the debtor.
Claims for recovery of land: Include claims for the repossession of property by a mortgage lender, social or private landlord e.g. where the mortgagee or tenant fails to keep up with mortgage or rental payments.
Small claim / fast track / multi track cases: If a claim is defended, the next step is for further information to be provided by the parties following which a judge in the county court assigns the case to one of three case management tracks. The “small claims track” is for less complex cases, which generally have claim values of up to £5,000. The “fast track” is for more complicated cases, generally with a claim value of over £5,000 and up to £15,000 for proceedings issued before 6 April 2009, otherwise £25,000. The “multi track” is for the most complex cases which are not allocated to the small claim or fast track. Many defended cases are settled by the parties involved, or withdrawn, either before or after allocation to one of these tracks. Around half of cases allocated to the small claims track are resolved at small claims hearings while a much lesser proportion of cases allocated to the fast or multi track are disposed of by trials.
Specified “money” claims: Claims made by an individual, company or organisation for a specified amount of money e.g. £15,000.
Unspecified “money” claims: Claims made by an individual, company or organisation for an unspecified amount of money e.g. when claiming for damages/compensation for loss or injury, the amount claimed is limited to £10,000.

Judicial and Court Statistics 2009 | Glossary
236
Third party debt order: Enables the creditor to secure payment by freezing and then seizing money owed or payable by a third party to the debtor.
Warrant of committal: Enforces a judgment for which the penalty for failure to comply is imprisonment. It authorises the bailiff to arrest the person and deliver them to prison or court.
Warrant of delivery: Enforces a judgment for the return of particular goods or items.
Warrant of execution: To enforce a judgment made where unless the amount due under the warrant is paid, saleable items owned by the debtor can be recovered by the court and sold.
Warrant of possession: To enforce a court order for the repossession of property.
Family matters
Ancillary Relief: This refers to a number of different types of order used to settle financial disputes during divorce proceedings. Examples include: periodical payments, pension sharing, property adjustment and lump sums, and they can be made in favour of either the former spouse or the couple’s children.
Application: The act of asking the court to make an order.
Decree Absolute: This is the final order made in divorce proceedings that can be applied for six weeks and one day after a decree nisi has been given. Once this is received, the couple are no longer legally married and are free to remarry.
Decree Nisi: This is the first order made in divorce proceedings and is given when the court is satisfied that there are reasonable grounds for granting the divorce. It is used to apply for a decree absolute.
Dissolution: The legal termination of a marriage by a decree of divorce, nullity or presumption of death or of a civil partnership by the granting of a dissolution order.
Divorce: This is the legal ending of a marriage.
Judicial Separation: This is a type of order that does not dissolve a marriage but absolves the parties from the obligation to live together. This procedure might, for instance, be used if religious beliefs forbid or discourage divorce.
Non-molestation Order: This is a type of civil injunction used in domestic violence cases. It prevents the applicant and/or any relevant children from being molested by someone who has previously been violent towards them. Since July 2007, failing to obey the restrictions of these orders has been a criminal offence for which someone could be arrested.

Judicial and Court Statistics 2009 | Glossary
237
Nullity: This is where a marriage is ended by being declared not valid. This can either be because the marriage was void (not allowed by law) or because the marriage was voidable (the marriage was legal but there are circumstances that mean it can be treated as if it never took place).
Occupation Order: This is a type of civil injunction used in domestic violence cases. It restricts the right of a violent partner to enter or live in a shared home.
Order: The document bearing the seal of the court recording its decision in a case.
Petition: (for divorce): An application for a decree nisi or a judicial separation order.
Private Law: Refers to Children Act 1989 cases where two or more parties are trying to resolve a private dispute. This is commonly where parents have split-up and there is a disagreement about contact with, or residence of, their children.
Public Law: Refers to Children Act 1989 cases where there are child welfare issues and a local authority, or an authorised person, is stepping in to protect the child and ensure they get the care they need.
Magistrates’ courts
Adult breach proceedings: Proceedings against an adult defendant (aged 18 or over) who has breached an order which was previously imposed against him/her.
Adult indictable cases: The most serious offences, such as murder and rape, which must be heard at a Crown Court. The involvement of the magistrates’ court is generally brief: a decision is made on whether to grant bail, and other legal issues, such as reporting restrictions, are considered. The case is then passed to the Crown Court.
Adult summary proceedings: The less serious offences, where the defendant is an adult (aged 18 or over). The defendant is not usually entitled to trial by jury, so these cases are disposed of in the magistrates’ courts. Summary offences are subdivided into Summary Motoring and Summary Non-Motoring cases:
Adult summary motoring proceedings: • Offences, such as driving whilst disqualified, speeding and failure to stop.
Adult summary non-motoring proceedings: • Offences such as TV license evasion, minor assaults and criminal damage where less than £5000 worth of damage is caused.
Adult triable-either-way cases: These are more serious than summary offences, and can be dealt with either by magistrates or before a judge and jury at the Crown Court. Such offences include dangerous driving and theft and handling stolen goods. A defendant can invoke his/her right to trial in the Crown Court, or

Judicial and Court Statistics 2009 | Glossary
238
the magistrates can decide that a case is sufficiently serious that it should be dealt with in the Crown Court where tougher sentences can be imposed if the defendant is found guilty.
Charge or laying of information: In the Time Intervals Survey, this relates to the date the defendant is first charged at a police station (for charged cases: those where an individual is arrested and formally accused of a crime at a police station) or the date information is laid (for summonsed cases: those where an individual receives a written summons advising that an action has been begun against him/her, and that s/he is required either to appear in person, or to respond in writing, to the court regarding the alleged offence).
‘Cracked’ trial: See Crown Court.
Completion: The date a defendant’s case is completed in the magistrates’ courts: either when a final decision is reached or the case is passed to the Crown Court. The Time Intervals Survey only reports on completed cases.
First listing: The date of the first hearing of the case in a magistrates’ court, whether or not the defendant is present.
‘Ineffective’ trial: See Crown Court.
Youth proceedings: These are proceedings of any type where the defendant is a youth, aged between 10 and 17.
Crown Court
The Crown Court is a unitary court which sits in approximately 77 different locations across England and Wales. It deals with serious criminal cases, which can be classified into the following four categories:
(a) Sent for trial cases: Cases sent for trial by the magistrates’ court because they can only be heard by the Crown Court.
(b) Committed for trial cases: Cases which can be heard in either a magistrates’ court or the Crown Court. A defendant can elect to be tried in the Crown Court or a magistrate can decide that a case is sufficiently serious that it should be dealt with in the Crown Court.
(c) Committed for sentence cases: Cases transferred to the Crown Court for sentencing where defendants are found guilty in the magistrates’ court. This happens if a magistrate is of the opinion that a greater punishment should be imposed than they are allowed to impose.
(d) Appeals against the decisions of magistrates’ courts.

Judicial and Court Statistics 2009 | Glossary
239
Bench warrant: A bench warrant is issued for a person deemed to be in contempt of court – usually as a result of that person’s failure to appear at their court appearance. Once a bench warrant has been issued, the case is considered disposed of. Following the apprehension of the person, the bench warrant is executed and the case is reopened.
Cases dealt with: Cases that have been heard by the court.
Circuit: A geographical area where a judge has the judicial authority to decide on cases. The jurisdiction can encompass a range of counties or districts.
Circuit Judge: A judge who normally sits in the county court and/or Crown Court.
Class: Offences are classified according to their seriousness. In the Crown Court, there are three classes of criminal offence; and the class of a case is based on the most serious offence. Class 1 offences are the most serious offences. They include treason and murder and are generally heard by a High Court Judge. Class 2 offences include rape and are usually heard by a Circuit Judge under the authority of the Presiding Judge. Class 3 includes all other offences such as kidnapping, grievous bodily harm and robbery, which are normally heard by a Circuit Judge or Recorder.
‘Cracked’ trial: A trial that does not go ahead on the day and does not need be re-scheduled and the case has reached an outcome. This occurs when an acceptable plea is offered by the defendant or the prosecution offers no evidence against the defendant.
Disposal: The completion of a case referred to the Crown Court.
‘Effective’ trial: A trial which begins on the scheduled date and reaches a conclusion.
Guilty plea: A guilty plea is recorded if a defendant either: (i) pleads guilty to all counts; (ii) pleads guilty to some counts and not guilty to others and no jury is sworn in respect of the not guilty counts; or (iii) pleads not guilty to some or all counts but offers a guilty plea to alternatives which are accepted (providing no jury is sworn in respect of other counts). A case is treated as a guilty plea only if pleas of guilty are recorded in respect of all defendants.
Hearing time: The total duration of all hearings heard in the Crown Court for each case including preliminary, main and sentence hearings.
High Court Judge: A judge who sits in the High Court of Justice.
‘Ineffective’ trial: A trial that does not go ahead on the scheduled trial date due to action or inaction by one or more of the prosecution, the defence or the court and a further listing for trial is required.
Judicial and Court Statistics 2009 | Glossary
240
Indictable only offence: One which must and can only be tried in the Crown Court before a judge and jury (sent for trial).
Receipt: A case referred to the Crown Court.
Recorder: A recorder’s jurisdiction is broadly similar to that of a Circuit Judge, but generally handles less complex or serious matters coming before the court.
Waiting time: The length of time between the date of sending or committal, and the start of the substantive Crown Court hearing.
High Court
Admiralty Court: Deals with shipping and maritime disputes, such as ship collisions and damage to cargo.
Bankruptcy: Insolvency (inability to pay debts) of individuals.
Bankruptcy and Companies Court: Deals with cases involving companies and company or individual insolvency / bankruptcy. It primarily deals with matters under the Insolvency Act 1986, the Company Directors Disqualification Act 1986, the Companies Act 1985 and the Financial Services and Markets Act 2000.
Chancery Division: One of the three divisions of the High Court (along with the Queen’s Bench Division and Family Division), and considers matters in relation to trust law, the administration of estates, guardianship and charities.
Commercial Court: Deals with complex cases arising out of business disputes, both national and international, including in relation to international trade and banking.
Comptroller General of Patents: The head of the UK Patent Office.
Family Division: One of the three divisions of the High Court (along with the Chancery Division and Queen’s Bench Division), and is concerned with matrimonial matters and proceedings relating to children or adults who cannot make decisions for themselves.
Interlocutory proceedings: Court hearings that take place before the full trial.
Master: Judicial officer of the High Court who primarily deals with procedural matters.
Patents Court: Specialist court which deals with matters concerning intellectual property such as patents and registered designs.

Judicial and Court Statistics 2009 | Glossary
241
Queen’s Bench Division: One of the three divisions of the High Court (along with the Chancery Division and Family Division), and deals with civil disputes including those relating to breach of contract, personal injuries, commercial cases, libel and slander.
Royal Courts of Justice: Administratively part of Her Majesty’s Courts Service, and is the building in London which houses the Court of Appeal, the High Court and the Probate Service.
Technology and Construction Court: Deals with building and engineering disputes and computer litigation.
Tort: Any private or civil wrong, not including a breach of contract, for which private damages may be claimed.
Writs of fieri facias (fi-fa): Orders an officer to take or sell property belonging to a debtor until the value of the property taken equals the amount of the debt. This is also called a writ of control.
Appellate Courts
Allowed: Appeals given a final result of ‘Allowed’ or ‘Allowed with consent’.
Appeal: A formal request to a higher court that the verdict or ruling of a court be overturned.
Dismissed: Appeals given a final result of ‘Refused’.
Dismissed by Consent: Appeals given a final result of ‘Dismissed with consent’.
Filed: Cases filed / setdown within period.
Habeas corpus: An order requiring a prisoner to be brought to court, to allow the court to determine if their detention is lawful.
Otherwise Disposed: Appeals given a final result of ‘Not our Jurisdiction’, ‘Totally Without Merit’, ‘Varied with Consent’, ‘Other Result’, and ‘Remitted’.
Struck out for failure to provide documents: Appeals given a final result of ‘Dismissal List’ or ‘Struck out’.

Judicial and Court Statistics 2009 | Glossary
242
Terms used in the other chapters of this bulletin
Enduring Power of Attorney: The Mental Capacity Act 2005 replaced Enduring Powers of Attorney with a new and different type of power of attorney called a Lasting Power of Attorney (see below).
Lasting Power of Attorney: A legal document that allows a person (called the “Donor”) to choose someone now (called the “Attorney”) that they trust to make decisions on their behalf at a time in the future when they either lack the mental capacity or no longer wish to make those decisions themselves. The decisions would typically be concerning the Doner’s finances, property or their personal health and welfare. The Office of the Public Guardian help individuals set up and managed Enduring and Lasting Powers of Attorney.

Judicial and Court Statistics 2009 | Explanatory notes
243
Explanatory notes
1. This report provides statistics on activity in the county, family, Crown and magistrates’ courts of England and Wales along with statistics on the work of the High Court, Court of Appeal, UK Supreme Court and some associated offices and agencies. This is the fourth annual court statistics report to be published by the Ministry of Justice. Previous editions were published by the Department for Constitutional Affairs and its predecessors. For the 2005 edition and earlier years it was entitled “Judicial Statistics”.
2. Quarterly statistics on activity in the county, family, Crown and magistrates’ courts are also published by the Ministry of Justice in the statistical report “Court Statistics Quarterly”. Statistics for Q2 (April to June) of 2010 are published by the Ministry of Justice at the same time as this edition of Judicial and Court Statistics.
3. Breakdowns of many of the summary figures presented in this bulletin, such as split by case type or by HM Courts Service area, are available on request. Please contact the Justice Statistics Analytical Services division using the details below.
4. Revisions: The statistics published in this bulletin represent final figures for the 2009 calendar year. For the statistics relating to the civil, family, magistrates’ and Crown courts in chapters 1 to 4, provisional figures for each quarter of 2009 (and, when aggregated, for the calendar year) have already been published in editions of “Court Statistics Quarterly”. As these statistics are primarily sourced for administrative databases, they are, as standard, revised to take account of any late amendments to the records. This report presents the final figures for 2009, which incorporate revisions to the previously-published statistics to account for any such late amendments. The 2009 statistics would not usually be revised further to reflect any future updates to administrative sources. The revised statistics for 2009 are also included within the Q2 (April to June) 2010 edition of “Court Statistics Quarterly”
Symbols and conventions
The following symbols have been used throughout the tables in this bulletin:
0 = Nil - = Not applicable n/a = Not available (r) = Revised data (p) = Provisional data * = Averages are not shown where there are fewer than 20 cases in a given year

Judicial and Court Statistics 2009 | Contacts
244
Contacts
Press enquiries on the contents of this bulletin should be directed to the Ministry of Justice or HM Courts Service press offices:
Peter MorrisTel: 020 3334 3531 Email: [email protected]
Mark Kram Tel: 020 3334 6697 Email: [email protected]
Other enquiries about these statistics should be directed to the Justice Statistics Analytical Services division of the Ministry of Justice:
Iain Bell Chief Statistician Ministry of Justice 9th floor 102 Petty France London SW1H 9AJTel: 020 3334 3737 Email: [email protected]
General enquiries about the statistical work of the Ministry of Justice can be e-mailed to: [email protected]
General information about the official statistics system of the UK is available from www.statistics.gov.uk


© Crown copyright Produced by the Ministry of Justice
Alternative formats are available on request from [email protected]


