JUj^ntkhi TWELFTH FEDERAL RESERVE DISTRICT FEDERAL RESERVE BANK OF SAN FRANCISCO Monetary Policy in a Recession Period . 54 Member Bank Earnings in 1957 .... 59 Review of Business Conditions ........... 66 Digitized for FRASER http://fraser.stlouisfed.org/ Federal Reserve Bank of St. Louis
Transcript
JUj ntkhi
T W E L F T H F E D E R A L R E S E R V E D I S T R I C T
F E D E R A L R E S E R V E B A N K O F S A N F R A N C I S C O
Monetary Policy in a Recession Period . 54
Member Bank Earnings in 1957 . . . . 59
Review of Business Conditions...........66
Digitized for FRASER http://fraser.stlouisfed.org/ Federal Reserve Bank of St. Louis
M O N E T A R Y P O L I C Y IN A R E C E S S I O N P E R I O D '
IT has been evident for some months now that the long postwar boom has been inter
rupted again, and that the American economy has once more entered the recession phase of the business cycle. Declining output in many fields, rising unemployment, reduction of the average workweek, lower corporate profits, a drop in sales, and many other indexes attest to the worsening of economic conditions since late last summer.
Cyclical economic fluctuations may be attributed largely to variations in the nation’s total flow of expenditures, since in a free enterprise economy like ours it is primarily spending which determines what is produced, given the economy’s productive resources. It is buying by individuals, business firms, and government units that moves goods off the shelves and out of the warehouses, and thereby leads to the production of new goods.
Although most spending is done out of current income, an important part of it is done out of borrowed or saved funds. Individuals, firms, and governments can all spend more than their current income by borrowing; by saving, they can spend less. Hence, because of changes in the rates of borrowing and saving, marked fluctuations in spending can occur and the total demand for goods and services can at any time either exceed or fall short of the total value of current output. The attempt by businessmen to adjust their rates of output to such changes in demand results in those fluctuations in production, employment, and prices that we commonly call the business cycle.
While the process of creating and extinguishing debt thus leads to a good deal of economic instability, it also provides the monetary authorities with a means of influenc-1 Although this article is concerned with the economic situation
as it presently exists, it may be useful to compare it with a prior article on monetary policy written during the boom and published in this Review, December 1956, pp. 150-154.
ing the general level of economic activity. Through its influence over the supply of bank credit and hence over borrowing and lending, a central bank can affect that portion of total demand which depends on or is related to borrowed funds. During a boom, for instance, when the public as a whole is trying to spend too much, the Federal Reserve System will normally attempt to discourage borrowing— and hence spending out of borrowed funds— by making such funds more difficult and costly to obtain. During a business recession, on the other hand, it will attempt to stimulate borrowing and spending by making credit cheaper and more plentiful. Thus, whereas an inflationary boom calls for a restrictive credit or “tight money” policy, a period of business recession calls for an “easy money” policy.
To ease credit conditions, the Federal Reserve System can make use of any or all of the three traditional instruments of monetary policy: open market operations, changes in reserve requirements, and changes in the discount rate. All three of these have been employed during the past half year.
The expression “open market operations” refers to the buying and selling of United States Government securities in the money market (that is, from or to securities dealers). The Federal Reserve System, taken as a whole, possesses a portfolio of such securities now valued at more than $23 billion, and it may at any time sell part of these or buy more. When it buys securities, its payments for these purchases put newly creatcd funds into circulation. These funds are normally deposited in various banks, which can use them as additions to their reserves. Such reserves must be held by member banks of the System in the form of balances at their Reserve Banks amounting to certain specified proportions of their demand and time deposits. When the
54
Digitized for FRASER http://fraser.stlouisfed.org/ Federal Reserve Bank of St. Louis
April 1958 M O N T H L Y R E V IE W
banks receive additional reserves, they are able to hold a larger volume of deposits and hence expand their loans and/or investments. Conversely, sales of securities by the System take funds out of circulation, which reduces bank reserves and compels the banks (if their deposits were up to the limits permitted by their reserves) to curtail their loans and/or investments. There are a number of other factors that affect bank reserves, too, such as movements of hand-to-hand currency into and out of the banks, gold purchases or sales by the Treasury, and changes in various types of deposits at the Federal Reserve Banks. Consequently, the System is not able to control precisely the total volume of bank reserves through its open market operations. Nevertheless, this is a sufficiently flexible and effective monetary instrument so that it can do so within fairly close limits.
During the last three months of 1957, the Federal Reserve System provided the economy with more than $1 billion in additional funds through purchases of United States Government securities. Most of this was to enable the banks to meet the normally increased demand for hand-to-hand currency at that time of the year, but part of it was intended to provide them with additional reserves and thereby to ease the credit situation. During January of this year, approximately the same amount of money— $1 billion—was absorbed by the System through net sales of securities. This was done not to tighten the credit situation again but to offset in part the normal post-Christmas return flow of currency to the banks, which amounted to more than $1.3 billion during January. Since such returned currency is credited to the reserve accounts of the banks in the same way as funds obtained from open market operations, the net result of these two factors during January was to provide the banks with several hundred million dollars in additional reserves.
More recently the System has made use of its authority to change reserve requirements, that is, the minimum ratios of reserves to deposits which member banks are required to maintain. These were reduced one-half percentage point about the end of February 1958, and another one-half point near the end of March. Again in April they were reduced so that required reserve ratios now stand at 18 percent of demand deposits for central reserve city banks (those in downtown New York and Chicago), 16Vi percent for reserve city banks (those in 48 other specified large cities), 11 percent for the country banks (all other member banks), and at 5 percent of time deposits for banks in all three groups. Approximately $1.5 billion in reserves was released to the banks by the three recent reductions. These released reserves can serve as the basis for an increase of several billion dollars in total loans or investments, and thus in deposits of the banking system.
The third instrument of monetary policy, changes in the discount rate, is probably the one which receives the most attention from the public although it is not necessarily the most important of the three. The discount rate is the interest rate charged by a Federal Reserve Bank to its member banks when the latter borrow from it. Such borrowing is normally done for short periods when the banks unexpectedly find themselves short of reserves. A reduction in the discount rate makes it cheaper for banks to obtain additional reserves in case of need. This may induce them to lend more freely and/or to reduce the interest rates they charge their own customers. For instance, on occasion there has been a very close timing relationship between changes in the discount rate by the Reserve Banks and changes by commercial banks in the prime rate (the interest rate charged the largest and best customers). However, the common belief that movements of all short-term interest rates
55
Digitized for FRASER http://fraser.stlouisfed.org/ Federal Reserve Bank of St. Louis
FEDERAL R E SE R V E B A N K O F S A N F R A N C I S C O
or of bank loan rates alone correspond closely to movements of the discount rate is quite mistaken. The latter is only one of many factors influencing the former. Interest rates are determined by all of the factors that affect the demand for and supply of particular types of credit.
Although the direct effects of changes in the discount rate are not as significant as many persons suppose, the psychological effects are sometimes very important. Last November, for instance, the Federal Reserve Banks reduced the discount rate from V/z to 3 percent. This action was widely interpreted as representing a shift from the previous so-called “tight money” policy to an “easy money” policy. Anticipating that this would result in lower interest rates generally and hence higher prices for bonds and other fixed-interest securities, investors rushed to buy the latter. As a result, the prices of such securities rose sharply and interest rates plummeted during the succeeding two months. The sharpness of this reaction at a time when the banks’ reserve positions were not changing much was an indication of the sensitivity of the credit markets to Federal Reserve actions, at least under certain conditions. Further cuts in the discount rate this year have brought it down to 13A percent. These reductions have had much less effect than that of November since they merely indicated continuance of the credit easing policy rather than any reversal of policy.
The net effect of these various types of credit easing action taken by the Federal Reserve System during the past half year has been to lower the general pattern of interest rates and to ease the banks’ reserve positions. The tightness or ease of the latter may be measured by comparing the banks’ excess of reserves over and above the amount required as backing against their deposits with the amount they have borrowed from the Federal Reserve Banks. If the excess reserves are
greater than the borrowings, the banks are said to have “free reserves.” If the borrowings are greater than the excess reserves, the banks are said to operate on “net borrowed reserves.” Last summer, the banks were operating on net borrowed reserves which often ran well over one-half billion dollars. By March of this year, their reserve situation had eased to the point where they had free reserves of about one-half billion dollars. There has thus been a net change of roughly one billion dollars in their reserve position.
Easier credit encourages borrow ing and spending in various w ays
To what extent and in what ways does a more plentiful supply of cheap credit stimulate borrowing and hence spending? This is a difficult question and one to which the answers are far from certain. But we may get some clues to them by considering a few specific types of borrowing and seeing how easy credit conditions have affected or might affect these.
The most immediate effect probably is on bank lending. During a period of tight money, banks not only charge higher interest rates but also ration the limited supply of credit. They do this in various ways: by raising their credit standards, by not taking on new customers, by filling only part of their customers’ credit demands, etc. If credit is later made more plentiful, the banks are enabled to fill these previously unsatisfied demands. Of course, some of the latter disappear during a business recession, when some prospective borrowers change their minds about wanting credit, but they do not all disappear immediately. In addition to being able to meet part of these previously unsatisfied demands for credit, the banks can stimulate additional demand by lowering the interest rates they charge, since there are always some “marginal” customers who are undecided whether
56
Digitized for FRASER http://fraser.stlouisfed.org/ Federal Reserve Bank of St. Louis
April 1958 M O N T H L Y R E V IE W
or not to borrow and who can be influenced favorably by a reduction in the cost.
One type of bank credit of particular importance is loans to business firms for the purpose of carrying inventories. Total business inventories have amounted to nearly $90 billion recently, and a large part of these undoubtedly were purchased with bank credit. During the past six months or longer, most firms have been trying to reduce the size of their inventories, partly because these had grown too large in many cases, partly because a leveling off or decline in sales (either actual or anticipated) had reduced the need for stocks, and partly because high interest rates had increased the cost of holding such stocks. Indeed, in its early stages at least the current business recession was mainly an inventory adjustment of the sort that our economy goes through every few years. Such adjustments probably cannot be prevented once inventories are considered to be excessive, but the pressure for liquidation can be lightened by a drop in interest rates, since this will reduce the cost of holding stocks. This should also hasten the day when businessmen will decide that they have cut their inventories far enough and that they can now afford to start placing new orders for goods.
Despite the recent easing of credit restrictions, total bank loans increased somewhat less during the last two months of 1957 and decreased somewhat more during the first two months of 1958 than in the corresponding period of the two previous years. This is to be expected, since during a business recession many individuals and firms are reluctant to borrow in order to make purchases, and many of them repay bank loans, e.g., by cutting down on their inventories. This does not indicate that credit easing has had no effect; bank loans would undoubtedly have dropped even further if tight credit restrictions had remained in effect.
Although the banks’ total loans have declined recently, there has been an appreciable rise in their investments since last summer— that is, in their holdings of Government and other securities. This has been made possible both by the easing of reserve conditions and by the decline in loans. The purchase of securities by the banking system gives rise to deposits just as does the making of loans, and consequently the total volume of demand or checking deposits (which make up the bulk of the money supply) has not declined during the past six months and has even increased slightly (on a seasonally adjusted basis) during the first two months of this year.
When banks buy securities directly from the Government, they provide the latter with funds to cover its deficits. Indirectly, therefore, they contribute to the total volume of spending of the economy, just as when they make loans to individuals or firms. If the banks buy Government securities from private parties instead, they furnish the previous holders with liquid funds and thereby increase the total liquidity of the economy. Part of these additional funds will probably be used to repay bank loans, but some part of them will either be spent immediately or held in readiness to be spent when opportunities arise. Thus, credit easing has a stimulating effect on spending, not only if the banks make more loans but even if they merely buy Government securities.
Corporations and state and local governments finance a considerable part of their capital expansion programs out of borrowed funds, usually by issuing bonds. Such bond issues are particularly sensitive to changes in interest rates because the interest has to be paid over a period of many years and because some Government units are subject to legal or political limitations ca the interest rates they can pay. The recent policy of monetary restraint was intended in part to encourage
57
Digitized for FRASER http://fraser.stlouisfed.org/ Federal Reserve Bank of St. Louis
FED ERAL R E SE R V E B A N K OF S A N F R A N C I S C O
postponement of some of these security offerings, which were supporting an unparalleled capital boom and thereby contributing to the inflationary pressures. As a result, some bond issues that had been announced during 1956 and 1957 were withdrawn because of the high interest rates that would have had to be paid on them, and probably others that were contemplated were never announced for the same reason. Although many local government projects were too urgent to be deferred, others, which were dependent upon revenues, such as certain toll roads, could be and were postponed for a time.
During recent months, however, as a result of the sharp drop in interest rates, some of these bond issues have been dusted off and sold to the public, and the proceeds used to undertake expansion programs or public improvements that had previously been postponed. This has been particularly true of state and local government issues. Such offerings to raise new capital were at record levels during January and February of this year, and for the entire first quarter totalled nearly $2.3 billion, as compared with $1.8 and $1.5 billion in the first quarters of 1957 and 1956, respectively. Corporate security offerings (mostly bonds but including some stocks) are estimated at $3.2 billion for the first quarter of this year, down from the record $3.5 billion issued during the same period of last year but considerably larger than any other quarter of 1956 or 1957. It is known that the reduced level of interest rates played an important part in the timing of a number of the recent offerings.
Mortgage credit is another type that is particularly sensitive to changes in interest rates, because of legal limitations on certain types of mortgages and because such loans are usually made for lengthy periods. Interest rates on alternative investments above the fixed maximum rates on mortgages guaranteed
by the Veterans Administration and the Federal Housing Administration undoubtedly held down somewhat the volume of residential construction during the boom of 1955-57. Since last summer, however, there has been a drop in the rates on conventional mortgages, and a reduction in the discounts at which VA and FHA mortgages have been selling. Partly as a result of the reduced cost and increased availability of credit, applications for FHA loans during the first three months of this year were at a rate considerably higher than during the same period of last year.
Other types of credit extension similarly tend to be stimulated by a general reduction of interest rates. It may be that the effects on any particular type of credit are likely to be only modest, since it is primarily the marginal borrowers-—those who are not quite decided whether or not to borrow—-who are affected. Nevertheless, modest increases in many different types of credit can add up to a substantial over-all increase and have a significant effect on total spending.
M onetary m easures not an economic cure-all
Useful as they can be if properly employed, monetary measures are not a cure-all for our economic ills. They cannot alone maintain a fully prosperous economy. Lower interest rates will not entirely prevent cutbacks in inventories if these have become excessive, nor will they prevent a reduction in new capital expenditures if businessmen become worried about the future. Once it becomes apparent that the boom is at an unsustainable level, and general economic conditions start to worsen, it is almost inevitable that inventory liquidation and other adjustments will continue for some time.
Nevertheless, a prompt and vigorous easing of credit conditions can do much to moderate
58
Digitized for FRASER http://fraser.stlouisfed.org/ Federal Reserve Bank of St. Louis
April 1958 M O N T H L Y R E V IE W
a recession. It can, first of all, insure that the supply of bank credit is adequate to meet all legitimate demands for it and thereby avoid adding to deflationary pressures through credit restrictions. Secondly, by lowering interest rates it can attract marginal or undecided borrowers. Thirdly, lower interest rates can also attract after a time those potential borrowers whose spending projects are postponable within limits (for instance, home buyers or business firms planning capital improvements) and who, because they take a long-run view of economic trends, try to do their borrowing when interest rates are low. Finally, credit easing can set the stage for an early recovery by insuring that whenever business begins to improve it will not be hampered by unavailability or high cost of funds.
Because credit easing alone is not able to prevent or to cure the cyclical fluctuations of our economy, it needs to be supplemented by the proper fiscal policies and possibly by other types of measures. This may involve changes in taxes, expenditures, or other elements of Government policy. Whatever fiscal measures are taken, it is important that they be adapted to the particular situation being dealt with—
since each business recession differs from its predecessors— and that they be properly coordinated with the monetary measures taken so that they all pull in the same direction.
Even monetary and fiscal measures combined may not be immediately effective in bringing a business recession to an end. They require some time to make their effects fully felt and there are large sectors of the economy which, as a rule, are fairly insensitive to their influence. At the same time, care must be taken to insure that monetary or other antirecession measures do not overshoot the mark and make more difficult the control of inflation once a recovery movement gets under way. Too much should not be expected of these measures, or else disappointment with their actual accomplishments may lead to complete rejection and a search for panaceas. Used properly, both monetary and fiscal measures can do a great deal to moderate and shorten business recessions and, in general, to help contain economic fluctuations within tolerable limits. This is as much as can be expected of them in an enterprise economy, where individuals and business firms have a large measure of freedom to make their own decisions and their own mistakes.
Mem ber Bank Earnings in 1 957
To t a l earnings of member banks in the Twelfth District for 1957 increased by the
same percentage over 1956 as they did in 1956 over the previous year.
This single statement conceals as much information as it conveys, for significant changes in the structure of bank assets and in earnings from these assets took place during 1957. Member banks, which had been selling securities in order to expand their loan port
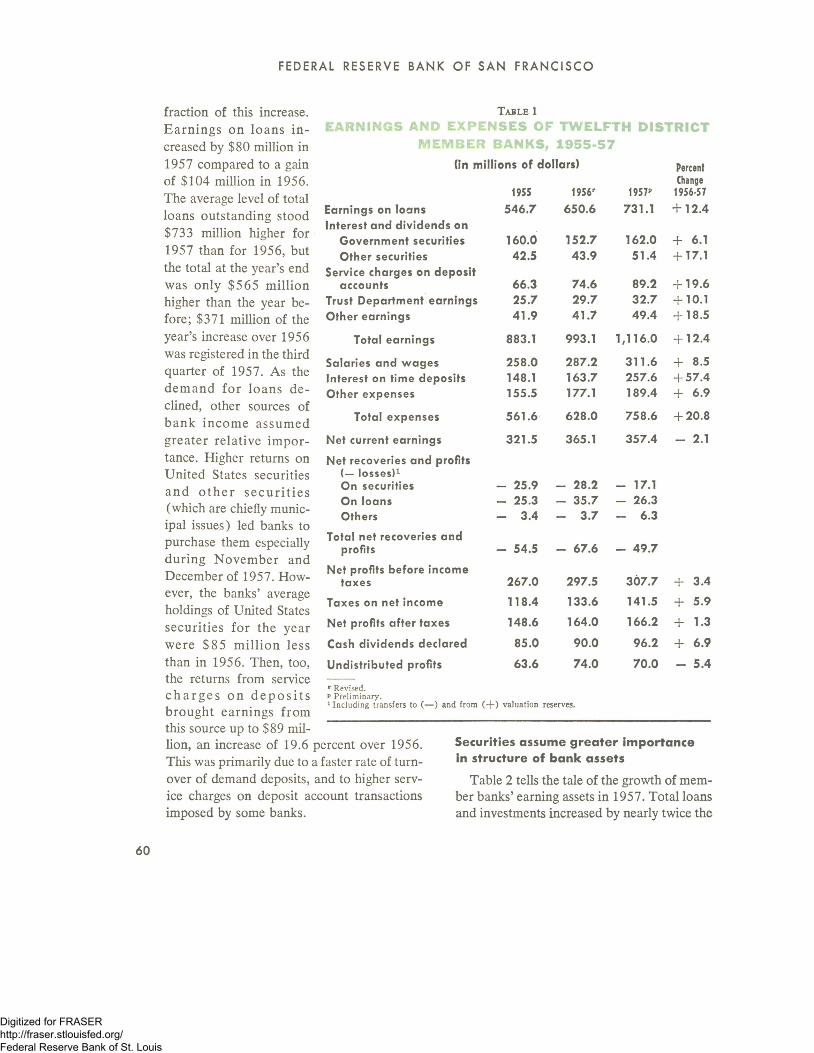
folios in 1955 and 1956, now began to acquire securities. An important factor affecting net current bank earnings was the sharp rise in expenses due principally to increased interest payments on time deposits. Table 1 summarizes the changes in the composite earnings statement for District member banks.
Total operating earnings of District member banks were up $123 million over 1956, but earnings on loans accounted for a smaller
59
Digitized for FRASER http://fraser.stlouisfed.org/ Federal Reserve Bank of St. Louis
FED ERAL RESER V E B A N K O F S A N F R A N C I S C O
T a b l e 1
EARNINGS AND EXPENSES OF TWELFTH DISTRICT M E M B E R BANKS, 1 9 5 5 - 5 7
(in millions of dollars) PercentChange
1955 1956r w 1956-57
Earnings on loans 546.7 650.6 731.1 + 12.4Interest and dividends on
Salaries and wages 258.0 287.2 311.6 + 8.5Interest on time deposits 148.1 163.7 257.6 + 57.4Other expenses 155.5 177.1 189.4 + 6.9
Total expenses 561.6 628.0 758.6 + 20.8
Net current earnings 321.5 365.1 357.4 - 2.1
Net recoveries and profits (— losses)1 On securities - 25.9 - 28.2 - 17.1On loans - 25.3 - 35.7 - 26.3Others - 3.4 - 3.7 - 6.3
Total net recoveries and profits - 54.5 - 67.6 - 49.7
Net profits before income taxes 267.0 297.5 307.7 + 3.4
Taxes on net income 118.4 133.6 141.5 + 5.9
Net profits after taxes 148.6 164.0 166.2 + 1.3
Cash dividends declared 85.0 90.0 96.2 + 6.9
Undistributed profits 63.6 74.0 70.0 - 5.4
r Revised. p Preliminary.1 Including transfers to (— ) and from ( + ) valuation reserves.
fraction of this increase.Earn ings on loans in creased by $80 million in 1957 compared to a gain of $104 million in 1956.The average level of total loans outstanding stood $733 million higher for 1957 than for 1956, but the total at the year’s end was only $565 million higher than the year before; $371 million of the year’s increase over 1956 was registered in the third quarter of 1957. As the dem and for loans declined, other sources of bank income assumed greater relative im portance. Higher returns on United States securities and o th e r se c u ritie s (which are chiefly municipal issues) led banks to purchase them especially during November and December of 1957. However, the banks’ average holdings of United States securities for the year were $85 m illion less than in 1956. Then, too, the returns from service c h a rg e s on d e p o s its brought earnings from this source up to $89 million, an increase of 19.6 percent over 1956. This was primarily due to a faster rate of turnover of demand deposits, and to higher service charges on deposit account transactions imposed by some banks.
Securities assum e greater im portance in structure of bank assets
Table 2 tells the tale of the growth of member banks’ earning assets in 1957. Total loans and investments increased by nearly twice the
60
Digitized for FRASER http://fraser.stlouisfed.org/ Federal Reserve Bank of St. Louis
April 1958 M O N T H L Y R E V IE W
1956 increment. In 1956 the growth of bank loans was partially offset by bank sales of securities, since loans offered a higher return. However, in 1957 banks began to purchase securities to supplement their earnings on loans and the base of total bank earnings was broadened.
Business loans accounted for nearly two- thirds of the total expansion of loans during 1957. All other types of loans, except real estate loans, expanded during the year. Mortgages which were guaranteed by the Government and carried lower interest rates fixed by law were at a disadvantage in a money market in which prevailing interest costs reached the highest point in a generation.Unlike 1956, farmers increased their debt to District member banks and agricultural loans were up 7 percent from 1956.Loans to individuals grew at a slightly more rapid rate than in 1956 chiefly due to an increase in retail automobile instalment loans outstanding.
In 1957 Twelfth District members banks demonstrated a renewed interest in U nited States Government securities, adding $331 million to their holdings in the second half of 1957, with the major part of the aquisi- tion concentrated in the last two months of the year. At the same time banks continued to acquire other securities, although in somewhat smaller amounts. As a result
of the Treasury refunding operations of the fourth quarter of 1957, member banks added substantially to their holdings of certificates of indebtedness, exchanging maturing notes and bonds for the offered certificates. Treasury issues in refinancing operations carried on in the second half of the year bore rates up to 4 percent, making these a very attractive investment. Rates on new issues of Treasury bills provided a striking illustration, rising to 3.66 percent in mid-October, and thereafter declining rapidly. The increase in the average rate of return on Government securities from 2.27 percent in 1956 to 2.53 percent in 1957
T a b l e 2
P R IN C IP A L R E S O U R C E AND L IA B IL IT Y ITEM S OF A L L M EM B ER B A N KS IN T H E T W E L F T H D IS T R IC T
1956 AND 1957(in millions of dollars)
Dec. 31r Dec. 31- Dollar Percent1956 1957 Change Change
Loans and investments 20,949 21,938 + 989 + 4.7Loans and discounts
Digitized for FRASER http://fraser.stlouisfed.org/ Federal Reserve Bank of St. Louis
FEDERAL RESER V E B A N K OF S A N F R A N C I S C O
testifies to the growing desirability of these issues.
A ve rage return on loans rises
Since income from loans increased more, proportionally, comparing 1957 with 1956, than did the amount of loans outstanding, it is clearly implied that higher interest rates contributed heavily to the record earnings on loans. The over-all rate of return on outstanding loans jumped from 5.47 percent in 1956 to 5.72 percent in 1957. The higher rates which predominated did not apply to all loans outstanding, since many or most of these loans were contracted in earlier periods. Interest rates rose on the average of one full percentage point between mid-1955-—the beginning of a boom— and the end of 1957. As loans reached maturity they were replaced in banks’ portfolios by new loans bearing higher rates of interest. A quarterly survey of selected short-term business loans shows an average rise from 4.65 percent in December 1956, to 5.13 percent in December 1957. Business loans generally carry a lower rate of interest than other types of loans, but the change in the market rate for business loans is usually symptomatic of changes in the interest rate structure for other types of loans.
Earnings on securities climb as holdings and rates on securities rise
While United States Government securities still supplied the greatest part of earnings on investments, earnings on other types of securities advanced substantially over 1956. District member banks made net purchases of municipal and corporate securities in every quarter of 1957 except the first. Flotations of corporates and municipals were larger in 1957 than in 1956 and carried higher rates than in the previous year. Greater holdings of these securities and higher yields accounted for a 17 percent gain in earnings from this resource.
Service charges on deposit accounts, the third ranking source of commercial bank income after loans and Government securities, contributed over $89 million to the earnings of District member banks in 1957. The rate at which demand deposit accounts were utilized, i.e., debits to demand deposits, was 7 percent greater than in 1956, although total demand deposits decreased by about 1 percent during the year. This factor, in combination with increased service charges on deposit accounts, led to an increase of almost 20 percent in this source of income over 1956.
Banks continued to receive income from activities ancillary to their traditional banking operations. Other earnings, a category which covers rentals on safe deposit boxes and real estate, interest earned on time deposits at other banks, and income from the title and foreign departments of the bank, rose by more than 18 percent in 1957 in contrast to a decline of one-half of one percent in 1956. Earnings from trust departments afforded nearly $33 million in income to banks, up 10 percent from a year earlier.
Bank expenses set new records
While bank earnings reached a record high in 1957, the costs of banking operations also explored new heights. Indeed, so rapidly did bank expenses rise, that net current earnings, or the spread between total operating earnings and expenses, fell off 2 percent from the preceding year. The greatest source of expense to banks in 1957 sprang from much larger interest payments on time deposits. In order to attract savings deposits, many District commercial banks increased the rate paid on such accounts by a full percentage point at the beginning of 1957. Higher rates proved sufficiently attractive to increase time deposits at District member banks $ 1 Va billion by the end of the year. Due to the combination of higher rates paid and a larger amount of time
62
Digitized for FRASER http://fraser.stlouisfed.org/ Federal Reserve Bank of St. Louis
April 1958 M O N T H L Y R E V IE W
C h a r t 1
EARNINGS AND EXPENSES OF MEMBER BANKS
1955 1956 1957 1955 1956 195?Note: The Earnings categories are as follows: A. All other; B. Charges on deposit accounts;
C. Interest and dividends on other securities; D. Interest on United States Governments; E. Earnings on loans.The Expenses categories are: A. All other; B. Interest on time deposits; C. Wages and salaries.
deposits, interest paid on these deposits increased more than 57 percent over 1956. The ratio of interest cost to total time deposits rose from 1.77 percent in 1956 to 2.39 percent in 1957. Other funds available to banks also proved to be more expensive than they had been in 1956. The discount rates on borrowings from the Federal Reserve went to 3 Vz percent in August 1957, the highest rate in the postwar period. The costs of borrowing from other banks increased in similar fashion. (Chart 1)
Other expenses of operation increased, but at a more moderate rate than in 1956. Wages and salaries paid by District member banks rose 8 percent in 1957. The cost of keeping up banking offices, i.e., occupancy, maintenance, utilities, and supplies, rose by only a little more than half of the 1956 increase.
Profits after taxes increased only slightly
Although earnings were cut into quite deeply by rising operating expenses in 1957, loss offsets and transfers to reserves declined more than one- fourth from 1956. Reversing the downward trend of the two previous years, securities prices recovered and rose markedly in November and December. Losses, charge-olfs, and transfers to valuation reserves, all connected with securities transactions, went from $40 million in1956 to $25 million in 1957. At the same time, the offsetting items of recoveries, profits, and transfers from valuation reserves changed from
$12 million in 1956 to $8 million in 1957, cutting the offset to net current earnings to $17 million in 1957 where it had been $28 million in 1956.
Since loans at District member banks grew by only about one-third of the 1956 increase, valuation reserves in 1957 did not grow as much as in 1956. Losses, charge-offs, and transfers to valuation reserves on loans were $9 million less in 1957 than they were in 1956. Recoveries and transfers from valuation reserves increased slightly in 1957 over the preceding year.
Losses from charge-offs and transfers to reserves made for a smaller deduction from net bank revenues in 1957, and consequently taxes took a somewhat larger slice than they did in 1956. Taxes on net income amounted to $141.5 million, or 46 percent of net in-
63
Digitized for FRASER http://fraser.stlouisfed.org/ Federal Reserve Bank of St. Louis
FEDERAL RESER V E B A N K OF S A N F R A N C I S C O
T a b l e 3
RA TIO TO C A P IT A L A CCO U N TS AND R A T E S O F R ETU R N ON EARN IN G
A S S E T S — T W ELF T H D IS T R IC T M EM B ER B A N K S, 1955-57
Ratios to capital accounts
Net current ea rn ings 1955 1356 1957
A ll bank s 22.1 22 .8 2 0 .91 3 largest 22 .5 2 3 .0 21.1Other 2 0 .7 2 1 .6 1 9 .9
Net profits after taxes
A ll banks 10.2 10.2 9.71 3 largest 10.6 10.6 9.7Other 8.7 8.4 9.7
Jtes of return on
Loans
A ll banks 5.5 5.5 5 .71 3 largest 5.4 5.4 5.6Other 5.9 6.0 6.0
G overnm ent securities
A ll bank s 2.1 2.3 2.51 3 largest 2.1 2.3 2.5O ther 2.1 2.3 2.5
Note: Capital accounts, loans, and Government securities items on which ratios are based are averages of Call Report data on March 4, 1957, June 6, 1957, and October 11, 1957.
come, compared with 44.9 percent of profits in 1956. In terms of dollar amounts, profits after taxes of District member banks were slightly greater than $166 million, surpassing the record year of 1956 by 1.3 percent and establishing a new mark. It should not be inferred, however, that stockholders received a greater return on their invested capital merely because net profits of banks increased. Capital accounts increased by $89 million in1957 while net profits made a gain of only $2 million. On the basis of the rate of return to invested capital, banking was a less profitable undertaking in 1957 than in the two previous years. Table 3 shows that the ratios of net current earnings and profits after taxes to capital accounts declined by about 2 percent and one-half of one percent respectively.
Cash dividends declared in 1957 amounted to $96.2 million, an increase of $6.2 million over 1956. This represented a disbursement of 57.9 percent of profits after taxes as dividends compared with 54 percent in 1956.
Conversely, additions to undivided profits declined from $74 million in 1956 to $70 million in 1957.
District bank profits fall behind nation
Comparisons of preliminary data on earnings for District member banks and for member banks in the nation show that the marked increase in operating expenses of District banks was not matched by member banks outside the District. While total expenses of District member banks rose by almost 21 percent, total expenses of member banks in the nation went up less than 15 percent. The explanation probably lies in the fact that interest payments on time deposits have been consistently higher in the District than in the rest of the nation, particularly since the maximum rate paid on such deposits increased to 3 percent.
T a b l e 4
P E R C E N T CH A N G ES IN S E L E C T E D EA R N IN GS AND E X P E N S E IT E M S O F T W ELFT H D I S T R I C T M E M B E R B A N K S B Y S I Z E
G R O U P S, 1 9 5 6 - 5 7
13All Largest Other
Banks Banks Banks
Earn ings on loans + 12.4 + 12.9 + 10.0
Interest and d iv idends onGovernm ent securities + 6.1 + 5.5 + 7.9
Other securities + 17.1 + 16.8 + 18.4
Service charges on deposit+ 19.6 + 18 .7 + 2 2 . 7accounts
Trust departm ent ea rn ings + 10.1 + 10.4 + 8.7
Total earn ings + 12.4 + 12 .7 + 10 .9
Sa larie s and w ages + 8.5 + 8.2 + 9.5
Interest on time deposits + 57.4 + 5 9 . 5 + 4 7 . 2
Total expenses + 2 0 . 8 + 2 2 . 0 + 16.2
Net current earn ings - 2.1 - 2 .7 + 0.6
Profits before taxes + 3.4 - 0.5 + 2 4 . 2
Taxes on net income + 5.9 + 2.6 + 2 3 . 3
Net profits after taxes + 1.3 - 2 .9 + 2 4 . 8
C ash d iv idend s declared + 6.9 + 5.9 + 16.1
Note: Figures presented in this table for the 13 largest banks are not entirely comparable, particularly for components of total earnings and expenses, because during 1957 a number of smaller banks went out of existence, some of which were consolidated with banks in the 13 largest group. Adjustments for this factor would probably have little effect on the 13 largest figures but might mean significant changes in the figures for the other banks.
64
Digitized for FRASER http://fraser.stlouisfed.org/ Federal Reserve Bank of St. Louis
April 1958 M O N T H L Y R E V IE W
Consequently, while net current earnings of member banks in the United States showed a gain of 6 percent over 1956, net current earnings in the District fell off 2 percent from1956. The increase in earnings on loans was about equal for member banks both in the District and in the nation. Net losses, charge- offs, and transfers to reserves were about the same for the District as for the nation.
Although net current earnings of District banks declined from 1956, net profits before taxes rose relatively more in the District than in the nation. This may be accounted for by the greater charge-offs for losses and transfers to reserves that took place for member banks in the nation for 1956 and which did not decline in similar proportion in 1957. Thus, net profits before taxes for District banks increased by almost twice the percentage of that for banks in the United States in 1957. However, taxes rose by a greater proportion for District banks so that the increase in profits after taxes was about the same for both groups. Net current earnings and profits after taxes, relative to capital accounts, continued to run somewhat higher for the District, as did the rate of return on loans. The increase in cash dividends declared was lower for the District: 7 percent as compared with 10 percent for member banks in the nation.
Outlook for 1958
On the basis of the developments of the fourth quarter of 1957 and the first quarter of 1958, certain tentative conclusions may be drawn with regard to the prospects of the banking community in the remainder of 1958. Interest rates have fallen from the high levels reached in late 1957 in one of the most abrupt declines in history. Not only may banks earn a lower rate of return on new loans, but the demand for loans may be less strong than in1957, and the total amount of loans outstanding on which interest is being earned may be smaller. On the other hand, interest paid by banks is at a high level and changes in this rate typically lag changes in earnings.
During the contraction of the business cycle banks customarily buy securities as a source of earnings. If proposals for tax cuts and increased federal spending become law, the Treasury will incur a fair sized deficit. It may be expected that commercial banks will purchase a major portion of new Treasury issues. The rates on new issues of United States Government securities have been trending downward in recent months, so that banks will earn a poorer return on these securities than they did in 1957. In the absence of unforeseen developments, this combination of factors would spell a decline in the net profit of member banks.
65
Digitized for FRASER http://fraser.stlouisfed.org/ Federal Reserve Bank of St. Louis
FEDERAL R ESER V E B A N K O F S A N F R A N C I S C O
Review of Business Conditions
Pr e l i m i n a r y data for March indicate less than the usual seasonal improvement in
business conditions. Assessment of developments is complicated by the unduly severe weather in many parts of the nation, but recent evidence on plant and equipment spending, total business sales, inventories, and manufacturers’ new orders point to continued weakness. The few encouraging bits of data are scattered: an upswing in orders for machine tools, pumps, and turbines, and an appearance of optimism among purchasing agents.
Em ploym ent increase less than seasonal
Total employment rose 300,000 between February and March to 62.3 million, or about 2.5 percent less than a year ago. The increase was about 200,000 less than usually expected at this time of year. The failure of employment to show the usual seasonal gain is due in some degree to adverse weather which has limited expansion of agricultural and construction activity and has restrained activity at retail stores. Unemployment, in contrast to the normal seasonal pattern, rose slightly in March, and the seasonally adjusted number at 4.8 million was 200,000 higher than in February. Unemployment reached 7.0 percent of the labor force, after allowing for seasonal fluctuations. This was the highest monthly rate since 1949. A large part of the decline in nonagricultural employment from a year ago, about 70 percent, was concentrated in durable goods manufacturing lines. Construction and transportation also recorded larger than average declines. The only significant gains from a year ago were reported in finance, services, and Government.
Construction activity still high in do llar volum e
The dollar volume of construction “put- in-place” rose seasonally from February to March, establishing a new first quarter record of $9.7 billion. The Commerce and Labor Departments, agencies gathering these data, expressed the opinion that the increase in dollar volume over the last year was less than the rise in construction costs. Contract awards through February offer further evidence that physical volume of activity has been slipping. Total construction awards dropped 10 percent from January and February of 1957.
Retail sa les ap p ear to suffer from adverse w eather
February retail sales fell about 3 percent from January after seasonal adjustment, and in many areas declines in some weeks were clearly related to unfavorable weather. March figures did not show any improvement, again because of the weather factors. Total retail sales in March were off 1 percent from February and 2 percent from a year ago. The weeks in which declines were recorded appear to be largely associated with severe storms. Automobile sales, after an improvement at the end of February which carried through the first ten days of March, fell from a daily average of 13,500 in the first ten days of the month to 13,000 in the second ten days, but recovered and reached a daily average of 15,500 in the last ten days of the month. Sales, however, were still well below a year ago.
Plant and equipm ent spend ing estim ates revised dow nw ard
A measure of the current situation not affected by weather is the estimate of plant and equipment spending for 1958. Businessmen
(56
Digitized for FRASER http://fraser.stlouisfed.org/ Federal Reserve Bank of St. Louis
April 1 958 M O N T H L Y R E V IE W
are now reported planning to spend 13 percent less for new plant and equipment in1958, whereas a few months ago the estimate was only 7 percent below last year’s peak. Figures released in mid-March by the Department of Commerce and the Securities and Exchange Commission have reduced the estimates for the fourth quarter of 1957 and the first quarter of this year by more than 3 percent from the previous estimate. Plant and equipment spending in the first three months of 1958, therefore, was more than 6 percent below the 1957 average, and second quarter spending is expected to be off by 12 percent. The decline from the 1957 level during the second half of this year will be more than 15 percent.
A new report released by the Department of Commerce indicates that the drop in new projects, 30 percent, is much greater than the anticipated decline in total capital spending by manufacturing firms, 17 percent. Public utilities, the only other line covered in the report, also intend to start a lower dollar volume of projects this year than in 1957. The anticipated effect of the decline in new projects is a much sharper drop in orders for equipment than that suggested by the figures on total spending and a smaller backlog of projects at the start of 1959 than at the beginning of this year.
M anufacturers’ sales, new orders, and backlogs continue to slide
Another set of indicators which do not appear very susceptible to changes in weather are manufacturers’ sales and orders. Manufacturers’ sales have dropped 16 percent in the 13 months ending in February. New orders have fallen by 20 percent in the past 15 months, while unfilled orders have declined by 24 percent in 14 months. Manufacturers’ sales and new orders have already fallen farther than they did in the previous two re
cessions; unfilled orders, on the other hand, have not fallen as far or for such a long period as in these prior declines. February figures for new orders are off by only a small amount, $200 million, but monthly figures are erratic and subject to substantial revision.
Inventories— still too h igh?
The most recent seasonally adjusted data for inventories indicate that despite reduction at a rate of $2.7 billion in the fourth quarter of 1957, inventories are still generally high relative to sales, and in a number of lines stocks have increased absolutely with production cuts smaller than declines in sales.
Business inventories, after seasonal adjustment in February, had declined $2.0 billion since their peak last summer, and cuts by manufacturers accounted for $1.7 billion or almost 90 percent of the total drop. Yet in February manufacturers’ stocks were a little over twice monthly sales, the highest ratio at any time in the postwar period, and well above the high ratios of the 1948-49 and 1953-54 recessions.
Manufacturers of durables have almost all been successful in cutting stocks on hand since last September. The onset of inventory reduction, however, lagged behind the drop in sales by two months, and sales have fallen more than inventories. Inventories are particularly heavy relative to sales in the machinery industries and transportation equipment. Despite reduced buying of raw materials by metal fabricators, their inventory-sales ratio has risen substantially since last summer. At the end of February stocks were equal to almost 2Vi times monthly sales. Thus far, durables manufacturers have confined their cuts primarily to purchased goods and goods in process. Finished goods inventories remain at the same level as last October. Only a small increase in the inventory-sales ratio for nondurables has been recorded since the decline in sales set in
67
Digitized for FRASER http://fraser.stlouisfed.org/ Federal Reserve Bank of St. Louis
FEDERAL R ESERVE B A N K O F S A N F R A N C I S C O
last summer; but in paper, chemicals, and petroleum there is serious difficulty in bringing stocks into line.
Prices still rising
While the downturn in business activity is unmistakable, consumer and wholesale prices continue to rise. Conditions affecting the supply of agricultural commodities, weather, and the phase of the cattle cycle have been important in forcing prices up. In March, for example, prices received by farmers rose 4 percent, the sharpest monthly increase in seven years. Higher quotations for meat animals were the most important factor, reinforced by increases in prices of potatoes, fruits, and eggs. A broad list of other farm commodities also contributed small amounts to the sharp rise in over-all farm prices. The Consumer Price Index rose 0.2 percent in February, primarily in response to higher food prices, and again in March for the same reason.
Wholesale prices for March, estimated on a preliminary basis at 119.6, rose 0.7 percent from February, or the largest monthly increase in 15 months. All but a very small part of the rise is attributable to farm and food prices. Prices of industrial goods remained firm during March, but cracks began to appear in the price front in late March. Among other price cuts an announcement by Aluminium Ltd. of Canada that it was reducing the price of aluminum 2 cents per pound was followed by domestic producers with a similar cut effective April 1. Reports of unannounced price concessions for some types of durable manufactures are also becoming more numerous.
Twelfth District output slips
Over-all business activity in the Twelfth District continued to decline in February and early March, although the extent of the de
cline was moderate when compared with other parts of the nation. Pacific Coast factory output during February, as indicated by man- hours worked at production lines, fell 1 percent after adjustment for seasonal factors, or about the same as during December and January. Almost all manufacturing industries recorded lower manpower usage during the month, although the important food processing group showed a gain of 2 percent and the lumber and wood products group was unchanged.
The few current measures of actual physical output which are available showed mixed developments. Ingot steel production in the Western District (including Colorado) during February was slightly higher than in January after adjustment to reflect the smaller number of working days. The weekly operating rates of Western steel producers during March averaged about 7 percent higher than the February rate. Although there has been a slight improvement in demand for some types of steel, it appears that some of the strength in February and March production came from the buildup of semi-finished steel stocks by one major steel producer prior to an anticipated April shutdown for plant reorganization. Further cutbacks in production were reported at the Pacific Northwest plants of a major aluminum firm, to become effective in early April. An additional reduction is scheduled for the end of the month.
Redwood lumber production fell contra- seasonally in February, after having exceeded its year-ago level in January. The severe rains in California during the month contributed to the decline, but the inflow of new orders was also down. Production of Douglas fir and Western pine was below year-ago levels in February and March, and the gap between present and year-ago levels tended to widen over the two-month period. For the first time
68
Digitized for FRASER http://fraser.stlouisfed.org/ Federal Reserve Bank of St. Louis
April 1958 M O N T H L Y R E V IE W
in five years, the usual seasonal rise in Douglas fir lumber prices was absent this February and March. Douglas fir plywood production fell off for several weeks in March as some plants closed following the late February price cut to $64 per thousand square feet. The lower price was a sharp stimulant to the inflow of new orders, and by late March production had rebounded to a new high. The increase in orders encouraged producers to raise their prices back to the mid-January level of $72, however, and by late March the weekly inflow of new orders had fallen to the early February level.
Employment slips in District
Employment at non-farm establishments in the Twelfth District declined in February at about the same rate as in late 1957, after having shown primarily seasonal movements in January. Manufacturing employment fell by about one-half of one percent in February. This was the seventh consecutive month of decline, and as in most previous months it was centered among durable goods manufacturing firms. Mining employment has fallen by more than 9 percent in the Twelfth District over the past year, compared with a drop nationally of about 5 percent. After having held up well in January, District employment in both contract construction and wholesale and
retail trade declined sharply in February. The losses occurred primarily in California, where the moderate strength shown by construction employment during the previous six months suggests that part of the decline may be attributed to the severe rains during the month. Continuation of the rains during most of March and into early April undoubtedly had further adverse effect on construction activity.
Unem ploym ent records some seasonal im provem ent
The unfavorable business developments in California during February were reflected in higher unemployment, although other Twelfth District states reported approximately the usual seasonal movements. In California, insured unemployment has risen to more than twice the level of February 1957, while the average for the Twelfth District as a whole was about 80 percent higher. In early March, most District states began to show the usual seasonal downturn in insured unemployment, although California and Arizona still remained at the late February level. However, the extent of the improvement is difficult to gauge because of the increasing exhaustion of unemployment benefits. The rate of over-all unemployment on the Pacific Coast was 5.6 percent of the labor force in February, the highest rate since before the Korean War.
69
Digitized for FRASER http://fraser.stlouisfed.org/ Federal Reserve Bank of St. Louis
FEDERAL R E S E R V E B A N K OF S A N F R A N C I S C O
BUSINESS INDEXES — TWELFTH DISTRICT*( 1 9 4 7 - 4 9 a v e ra g e = 1 0 0 )
1 Adjusted for seasonal variation, except where indicated. Except for departm ent store statistics, all indexes are based upon d a ta from outside sources, as follows: lumber, California Redwood Association and U.S. B ureau of the Census; petroleum, cement, copper, and lead, U.S. B ureau of M ines; electric power, Federal Power Commission; nonagricultural and m anufacturing employment, U.S. Bureau of Labor Statistics and cooperating s ta te agencies; re ta il food prices, U.S. Bureau of Labor S tatistics; carloadings, various railroads and railroad associations; and foreign trade, U.S. B ureau of the Census. * D aily average. * N ot adjusted for seasonal variation. 4 Los Angeles, San Francisco, and Seattle indexes combined. ‘ Commercialcargo only, in physical volume, for Los Angeles, San Francisco, San Diego, Oregon, and W ashington customs d istricts; s tarting with Ju ly 1950, “ special category” exports are excluded because of security reasons. • Annual figures are as of end of year, m onthly figures as of la st W ednesday in m onth. 7Dem and deposits, excluding interbank and U.S. Gov’t deposits, less cash items in process of collection. M onthly d a ta partly estim ated. ■ Average rates on loans made in five m ajor cities. • Changes from end of previous m onth or year. 10 M inus sign indicates flow of funds out of the D istrict in the case of commercial operations, and excess of receipts over disbursements in the case of Treasury operations. u E nd of year and end of m onth figures. u D ebits to to tal deposits except interbank prior to 1942. D ebits to demand deposit* exoept U.S. G overnm ent and interbank deposits from 1942. t>— Preliminary. r— Revised.
70
Digitized for FRASER http://fraser.stlouisfed.org/ Federal Reserve Bank of St. Louis
Digitized for FRASER http://fraser.stlouisfed.org/ Federal Reserve Bank of St. Louis
Digitized for FRASER http://fraser.stlouisfed.org/ Federal Reserve Bank of St. Louis