Julio Montaner MD, FRCPC, FCCP Director, BC-Centre for Excellence on HIV/AIDS Professor of Medicine and Chair, AIDS Research Providence Health Care - University of British Columbia President, International AIDS Society When to Start?
Transcript
Julio Montaner MD, FRCPC, FCCPDirector, BC-Centre for Excellence on HIV/AIDS Professor of Medicine and Chair, AIDS Research
Providence Health Care - University of British ColumbiaPresident, International AIDS Society
When to Start?
Integrating HIV Prevention and Treatment from Slogans to Impact
J Salomon1*, D Hogan1, J Stover2, K Stanecki3, NWalker3-4, P Ghys3, B Schwartländer5
PLoS Medicine, http://www.plosmedicine.org January 2005, Volume 2, Issue 1, e16
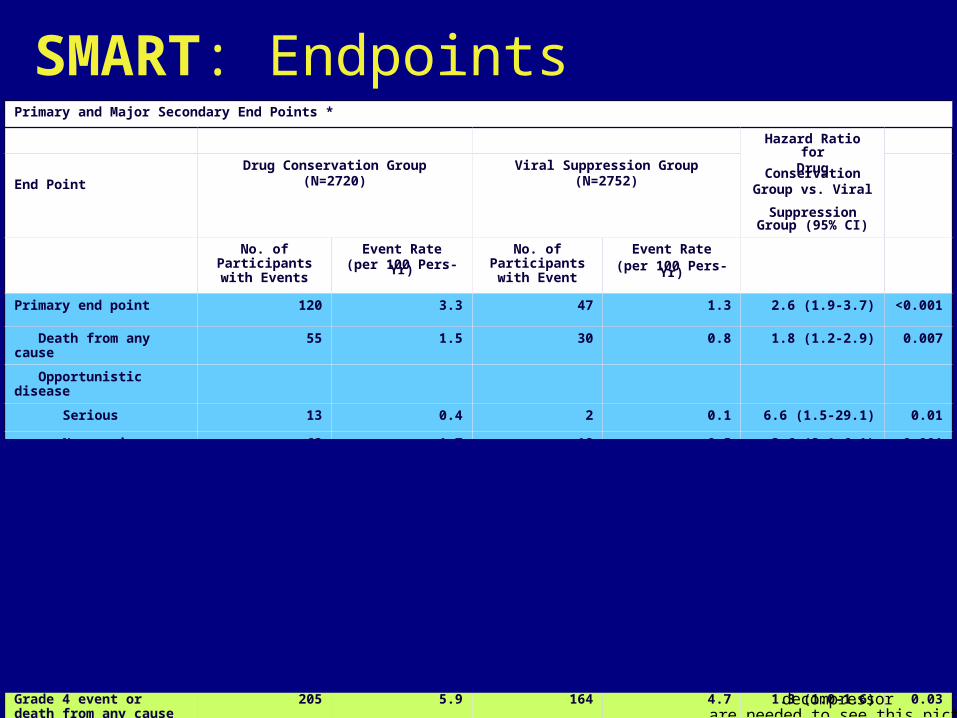
Serious non ADI/non-OD-Death OD/Serious non ADI &All Cause Death
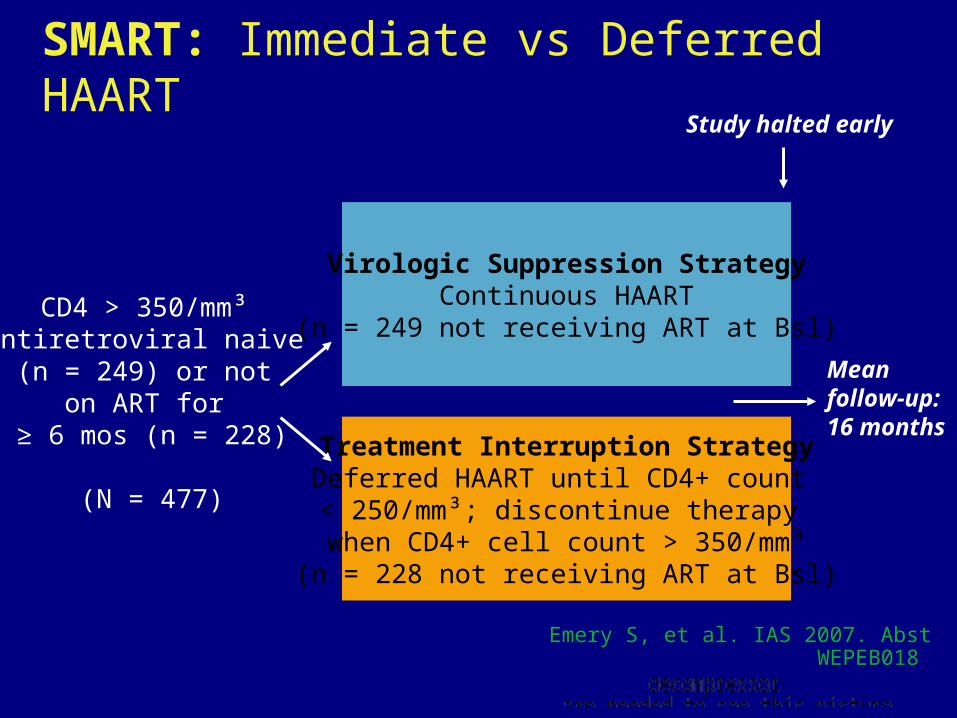
SMART: Immediate vs Deferred HAART
Emery S, et al. IAS 2007. Abst WEPEB018
SMART: Summary
Continued HAART better than Intermittent HAART
– Survival
– AIDS and non AIDS events
– Adverse effects
– Quality of life
– Differences remained when HAART was re-started
What is driving the excess morbidity and mortality?
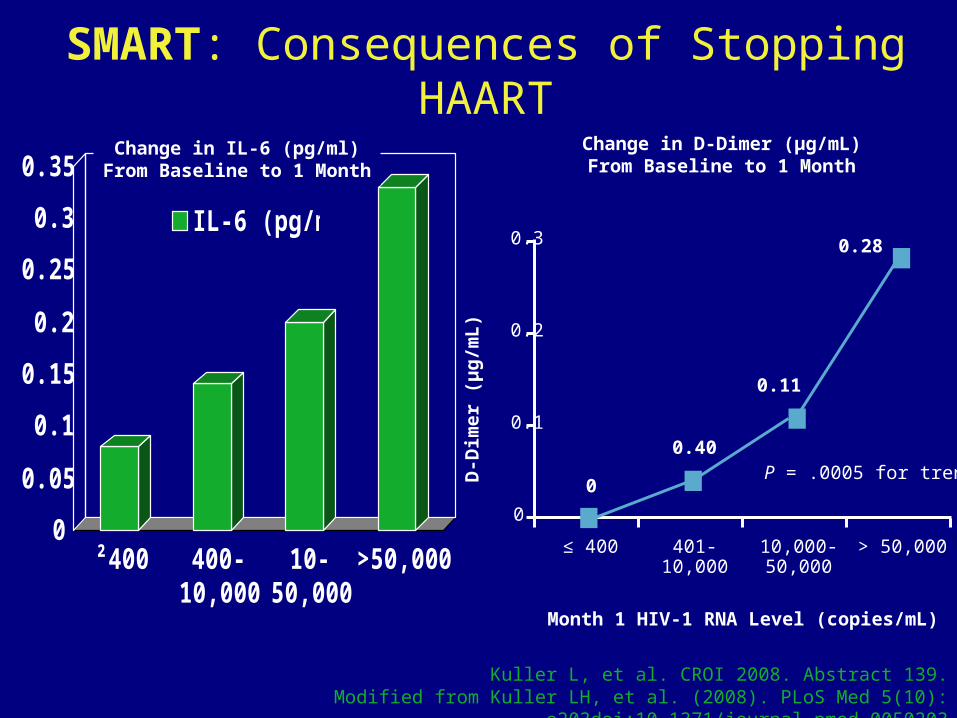
SMART: Consequences of Stopping HAART
Change in D-Dimer (µg/mL)From Baseline to 1 Month
Month 1 HIV-1 RNA Level (copies/mL)
0
0.2
0.3
D-D
imer
(µ
g/m
L)
> 50,00010,000-50,000
401-10,000
≤ 400
0.28
0.11
0.40
0
0.1
P = .0005 for trend
0
0.05
0.1
0.15
0.2
0.25
0.3
0.35
²400 400-10,000
10-50,000
>50,000
IL-6 (pg/ml)
Change in IL-6 (pg/ml)From Baseline to 1 Month
Kuller L, et al. CROI 2008. Abstract 139.Modified from Kuller LH, et al. (2008). PLoS Med 5(10):
e203doi:10.1371/journal.pmed.0050203
Kuller L, et al. CROI 2008. Abstract 139.Modified from Kuller LH, et al. (2008). PLoS Med 5(10):
e203doi:10.1371/journal.pmed.0050203
Risk of Death Associated with Biomarker Levels at Entry
Risk of Death Associated with Latest Biomarker Level
Risk of Death Associated with Change in Biomarker Levels
SMART: Risk of Death and Biomarkers
New Evidence
ICAAC/IDSA 2008 & CROI 2009
NA-ACCORD, established in 2006, includes 22 HIV cohorts
– Analysis includes patients with CD4 count 351-500/mm3 at study visit
between 1996-2006
Compared outcomes based on Rx according to
– Immediate treatment: initiated HAART within 1.5 years of first CD4 count
in 351-500/mm3 range
– Deferred treatment: did not initiate HAART within 1.5 years of first CD4
count in 351-500/mm3 range. Included patients who did not initiate
treatment after reaching CD4 count < 350 l/mm3
Primary outcome: death from any cause
Kitahata MM, et al. ICAAC/IDSA 2008. Abstract H-896b.
Survival Benefit With Earlier vs Deferred HAART
Survival Benefit With Earlier vs Deferred HAART
Kitahata MM, et al. ICAAC/IDSA 2008. Abstract H-896b.
Increased relative hazard of death with deferral of HAART remained unchanged when adjusted for IDU or for HCV co-infection, which were both independent predictors of mortality
Parameter Associated With Risk of Death Relative Hazard (95% CI)
Older age (per 10 yrs)
BL CD4+ cell count (per 100 cells/mm3 increase)
1.6
1.0 2.50.1
Deferral of HAART until < 350 cells/mm3 (vs starting at 350-500 cells/mm3)
Female sex
0.9
1.7
1.1
P Value
< .001
.290
< .001
.083
M Kitahata for
CROI 2009
.51
24
Haz
ard
Rat
io f
or A
IDS
or
Dea
th
0 100 200 300 400 500CD4 threshold (cells/mm3)
Hazard ratios for AIDS or death, adjusted for lead times and unseen events
Comparison Hazard ratio (95% CI)
276-375 vs 376-475 1.19 (0.96 to 1.47)
251-350 vs 351-450 1.28 (1.04 to 1.57)
226-325 vs 326-425 1.21 (1.01 to 1.46)
ART Cohort Collaboration
Jonathan A C Sterne CROI, 2009
When to Start ARTA Policy Evaluation While Awaiting Trial Results: South Africa
Walensky et al CROI 2009 Abstract 596b
• Used a published mathematical model of HIV-infection in South Africa to simulate co-trimoxazole prophylaxis plus 3 alternative ART initiation strategies:
• No ART (for comparison only)
• ART at CD4 <250/μL or severe opportunistic disease (OD)
• ART at CD4 <350/μL or severe OD
• Projected 5-year morbidity, mortality, and costs, in a South African cohort of HIV-infected persons with mean age 33 years.
• Natural history and healthcare utilization data derived from the Cape Town AIDS Cohort.
• Assumed 2 sequential ART regimens (NNRTI-based followed by PI-based), with published 48-week viral suppression rates of 84% and 71%, and per person annual costs of $288 and $564.
When to Start ARTA Policy Evaluation While Awaiting Trial Results: South Africa
Walensky et al CROI 2009 Abstract 596b
• Over a 5-year, 4.7 million HIV+ South Africans will become eligible to start ART in the CD4 250 to 350/μL window.
• Assuming all eligible patients present for care and that ART is equally effective in the CD4 250 to 350/μL range, initiation of ART at <350/μL compared to <250/μL would result in fewer total OD (730,272 vs 951,370) and fewer total deaths (244,249 vs 497,059).
• Starting at <350/μL would also lead to additional (discounted) treatment costs of $1.4 billion over the next 5 years.
• As long as the probability that the trial will confirm a survival benefit to earlier ART is judged to be greater than 17%, a policy of initiating ART at CD4 <350/μL is cost-effective and should be used over the next 5 years.
• Conclusions: Earlier ART initiation in South Africa will reduce morbidity and mortality substantially, and will be cost-effective. In anticipation of trial results, treatment guidelines should be liberalized to allow for earlier ART initiation (CD4<350/μL).
Summary
- HIV is a chronic inflammatory disease
- Inflammation: important driver of non-AIDS events- heart, liver, kidney, etc- malignancies
- Inflammation: important driver of CD4 decline- ADIs at a late stage of the disease
Summary
- HIV is a chronic inflammatory disease
- Inflammation: important driver of non-AIDS events- heart, liver, kidney, etc- malignancies
- Inflammation: important driver of CD4 decline- ADIs at a late stage of the disease
Summary
- HIV is a chronic inflammatory disease
- Inflammation: important driver of non-AIDS events- heart, liver, kidney, etc- malignancies
- Inflammation: important driver of CD4 decline- ADIs at a late stage of the disease
When to Start Antiretroviral TherapyWhen to Start Antiretroviral Therapy
Measure Recommendation Comments
Symptomatic HIV disease Therapy recommended
Asymptomatic HIV disease
CD4 <350/µL Therapy recommended Recommendation strengthened since 2006
CD4 >350/µL Therapy should be considered and decision individualized
Correlates of faster HIV disease progression:
High viral load (>100,000 RNA copies/mL)
Rapidly declining CD4 (>100/µL per year)
Coexistent conditions influenced by uncontrolled viremia:
Presence of, or high risk for, cardiovascular disease
Active HBV or HCV
HIV-associated nephropathy
Examples
Antiretroviral Treatment of Adult HIV InfectionAntiretroviral Treatment of Adult HIV Infection2008 Recommendations of the IAS-USA2008 Recommendations of the IAS-USAHammer SM; Eron JJ, Jr.; Reiss P; Schooley RT; Thompson MA; Walmsley S; Hammer SM; Eron JJ, Jr.; Reiss P; Schooley RT; Thompson MA; Walmsley S; Cahn P; Fischl MA; Gatell JM; Hirsch MS; Jacobsen DM; Montaner JSG; Cahn P; Fischl MA; Gatell JM; Hirsch MS; Jacobsen DM; Montaner JSG; Richman DD; Yeni P; Volberding PA. Richman DD; Yeni P; Volberding PA.
Review of data from 2003-2005 from 176 sites in 42 countries (N = 33,008)
Since 2000, CD4+ cell count at initiation in developed countries stable at approximately 150-200 cells/mm3, increasing in sub-Saharan Africa from 50-100 cells/mm3
When to Start: The Real World
Egger M, et al. CROI 2007. Abstract 62.
QuickTime™ and a decompressor
are needed to see this picture.
QuickTime™ and a decompressor
are needed to see this picture.
DTES
BCHA1
HA2
HA4
HA5
AIDS Death Rate in British Columbia
HA3
Eric Druyts, et al. BC-CfE, in preparation, 2009 Eric Druyts, et al. BC-CfE, in preparation, 2009
AIDS Death Rate in British Columbia
0
20
40
60
80
100
120
140
1601987
1988
1989
1990
1991
1992
1993
1994
1995
1996
1997
1998
1999
2000
2001
2002
2003
2004
2005
2006
year
rate
per
100,0
00 p
op
ula
tio
n
Vancouver Total (joinpoint) City Centre (joinpoint) Downtown Eastside (joinpoint)
Vancouver Total (observed) City Centre (observed) Downtown Eastside (observed)
Eric Druyts, et al. BC-CfE, in preparation, 2009
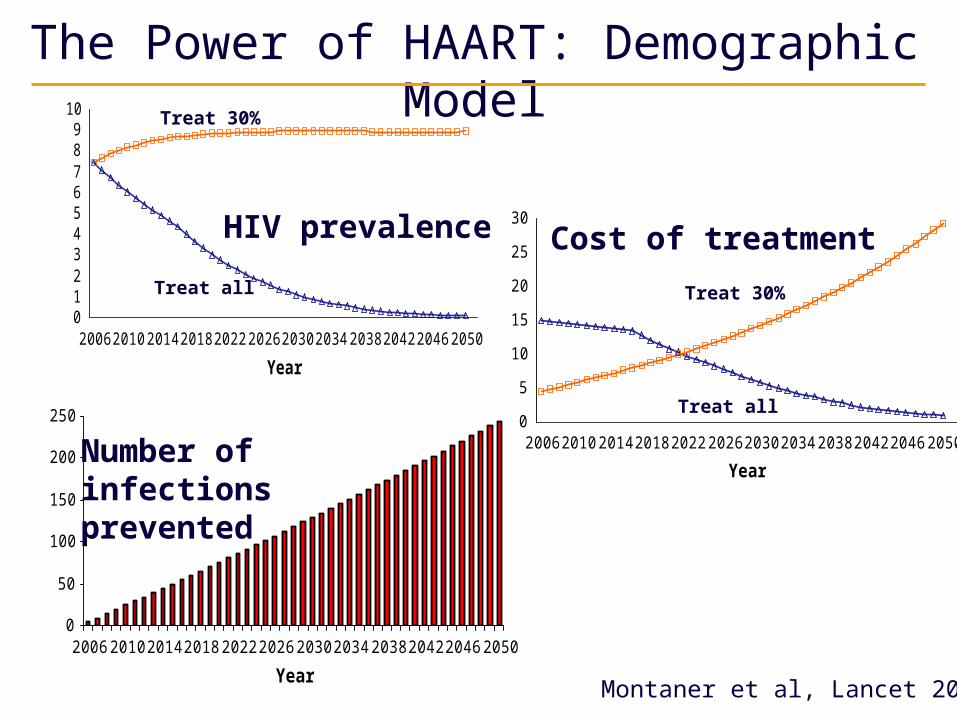
Expanded HAART Coverage: an Aid to HIV Prevention
Montaner et al, Lancet, IAS, Toronto, 2006
250
300
350
400
450
500
1995 2005 2015 2025 2035Year
Nu
mb
er
of
Ne
w In
fec
tio
ns
N o intervention Immediate uptake 3 years uptake 6 years uptake
Expected Impact of an Increase in HAART Coverage from current 50% of Medically Eligible
to 75% on New HIV Infections in BC
V D Lima, et al JID July 1st 2008
• Net benefit is an economic
measure that
incorporates survival
and QoL
• 1 Quality adjusted life year
(QALY) valued at $50K
* All Values discounted at
3% per year, using
2005 CDN$5 10 15 20 25 30
02
00
40
06
00
80
01
00
01
20
0
Time (years)
Ne
t Be
ne
fit (
mill
ion
$ C
an
20
05
)
Scenario 2 relative to Scenario 1Scenario 3 relative to Scenario 2
Transmission modelIncremental net benefit (Millions of CDN $) over 30 years
Baseline = Status Quo
Scenario I = Incremental Benefit going from Baseline to 50% coverage with Expanded Eligibility (n=761)
Scenario II = Added Incremental Benefit going from Scenario I to 75% coverage Expanded Eligibility (n=1187)
Scenario I
Scenario II
K Johnston et al, in progress, 2009
When to Start HAART?A matter of Perspective
years0
200
400
600
800
1000
1200
Viral Load
CD4 Count
When to Start HAART?A matter of Perspective
0
200
400
600
800
1000
1200
years
years
0
200
400
600
800
1000
1200
Viral Load
CD4 Count
When to Start HAART?A matter of Perspective
0
200
400
600
800
1000
12000
200
400
600
800
1000
1200
years
years
years
0
200
400
600
800
1000
1200
Viral Load
CD4 Count
When to Start HAART?A matter of Perspective
0
200
400
600
800
1000
12000
200
400
600
800
1000
1200
years
years
years
0
200
400
600
800
1000
1200
Viral Load
CD4 Count
AIDS Nov 27th 2008, The EconomistDeploying the drugs used to treat AIDS may be the way to limit its spread
QuickTime™ and a decompressor
are needed to see this picture.
Illustration by Peter Schrank
Acknowledgements
P. CahnP. Cahn
J.J. Eron J.J. Eron
M. A. FischlM. A. Fischl
J. M. GatellJ. M. Gatell
S.M. HammerS.M. Hammer
M. S. HirschM. S. Hirsch
D. M. JacobsenD. M. Jacobsen
P. ReissP. Reiss
D. D. RichmanD. D. Richman
R.T. Schooley R.T. Schooley
M.A. ThompsonM.A. Thompson
P. A. VolberdingP. A. Volberding
S. Walmsley S. Walmsley
P. YeniP. Yeni
L. Akagi
A. Alimente
A. Anis
R. Barrios
J. Bishop
G. Bondy
K. Buchanan
D. Burge
I. Day
J. Forbes
S. Guillemi
R. Harrigan
M. Harris
S. Smith
R.S. Hogg
E. Lun
W. A. McLeod
D. Money
V. Montessori
P. Philips
N. Pick
N. Press
P. M. Sestak
D. Shahvarani
C. Sherlock
G. Tsang
M. Tyndall
W. O’Briain
In partnership withDira Sengwe
5th IAS Conference on HIV Pathogenesis, Treatment and Prevention