+ All Categories
Home > Documents > July 1, 2013 - June 30, 2016 Community Health Needs Assessment · 2017-08-21 · July 1, 2013 -...

July 1, 2013 - June 30, 2016 Community Health Needs Assessment · 2017-08-21 · July 1, 2013 -...

Date post: 05-Jul-2020
Category:
Upload: others
View: 2 times
Download: 0 times
Share this document with a friend
53
Approved by: Mission and Community Benefits Committee June 14, 2013 Approved by: Baylor Health Care System Board of Trustees June 24, 2013 Approved by: Baylor Health Care System Operation, Policy and Procedure Board June 25, 2013 July 1, 2013 - June 30, 2016 FINAL Community Health Needs Assessment BHCS.954.V8.2013 tm.6.13
Transcript

Approved by: Mission and Community Benefits Committee June 14, 2013Approved by: Baylor Health Care System Board of Trustees June 24, 2013Approved by: Baylor Health Care System Operation, Policy and Procedure BoardJune 25, 2013

July 1, 2013 - June 30, 2016

FINAL

Community Health Needs Assessment

BHCS.954.V8.2013 tm.6.13

2 | P a g e

Table of Contents Executive Summary .................................................................................................................................... 3

Community Health Needs ...................................................................................................................... 4

Key Contributors ........................................................................................................................................ 9

Assessment Methodology .......................................................................................................................... 10

Baylor Frisco Community Definition ................................................................................................... 11

Community Health Needs Assessment ................................................................................................ 15

Public Participation .............................................................................................................................. 15

Regional Healthcare Partnership Region 9 (Executive Summary) .................................................. 16

Regional Healthcare Partnership Region 18 (Executive Summary) ................................................ 17

Appendix A ................................................................................................................................................. 19

Appendix B ................................................................................................................................................. 38

3 | P a g e

Executive Summary

Baylor Medical Center at Frisco (Baylor Frisco) is committed to serving all the neighborhoods in its

service area and recognizes the importance of keeping a local focus in effectively meeting

community needs. This Community Health Needs Assessment (CHNA) was conducted during the

tax year ending June 30, 2013. Its purpose is to identify the health needs of the communities served

by Baylor Frisco and meet the requirements for community benefit planning as set forth in state and

federal laws, including, but not limited to, Texas Health and Safety Code Chapter 311 and Internal

Revenue Code Section 501(r).

About the Hospital

Opened in 2002 as Frisco Medical Center, Baylor Frisco is a model health care facility designed

with the patient in mind. The 68-bed hospital has a hotel-like atmosphere, creating a comfortable,

relaxing and patient-friendly environment with a focus on service and hospitality. From the gourmet

food service to the private patient suites, Baylor Frisco has created a “culture of care” for its guests.

Baylor Frisco is a joint venture between Baylor Health Care System and United Surgical Partners

International, and local physicians. The Hospital is operated as a part of a sustainable, integrated

health care delivery system with BHCS and other affiliated hospitals and health care providers

(System). As an affiliate of BHCS, the Hospital is operated in furtherance of BHCS’s charitable

purpose and mission and is required to adhere to high standards for medical quality, patient safety

and patient satisfaction. These standards help ensure consistency and are set forth by the System.

The Hospital, along with other BHCS affiliates, provides community benefit activities reflective of

the System mission: “Founded as a Christian ministry of healing, Baylor Health Care System exists

to serve all people through exemplary health care, education, research and community service.”

CHNA Summary

Creating healthy communities requires a high level of mutual understanding and collaboration with

community individuals and partner groups. The development of this assessment brings together

information from community health leaders and providers along with local residents for the

purposes of researching, prioritizing and documenting the community health needs for the

geographies served by Baylor Frisco. This health assessment will serve as the foundation for

community health improvement efforts for next three years.

The FY 2013 CHNA brings together a variety of health status information. This assessment

consolidates information from the recent community health needs assessment conducted for Texas’

Regional Healthcare Partnership Region 9 (Region 9 RHP) and Region 18 (Region 18 RHP). Each

of these reports was developed with input from people representing the broad interest of the

community and people with special knowledge or expertise in public health.

The importance and benefit of compiling information from other recognized assessments are as follows:

1. Increases knowledge regarding community health needs and resources.

2. Creates a common understanding of the community's priorities as it relates to health needs.

3. Enhances relationships and mutual understanding between and among stakeholders.

4. Provides a basis upon which community stakeholders can make decisions about how they

can contribute to improving the health of the community.

4 | P a g e

5. Provides rationale for current and future financers to support efforts to improve the health of

the community.

6. Creates opportunities for collaboration in the delivery of services to the community.

7. Provides the hospital with guidance as to how it can align its services and community

benefit programs to best meet needs.

Community Health Needs

Analysis of the Region 9 RHP report and Region 18 RHP report revealed the following community

health needs in the Baylor Frisco community.

Capacity–Primary and Specialty Care

o RHP 9 identified that the demand for primary and specialty care services exceeds

available physicians in these areas, thus limiting health care access.

Primary Care Access Adults

o No county within RHP 18 has a public hospital. Local hospitals, public health

departments, and publically funded clinics are the staples of the health care system in

the Region.

o While no county within RHP 18 is a Health Professions Shortage Area or a

Medically Underserved Area (according to federal criteria), there are pockets with

severely limited access to primary and preventive care leading to potentially

preventable hospital admissions and emergency department visits.

Primary Care Access Children

o Of the reported emergency department visits for the uninsured, 14.7 percent were for

children under age 15. Preventable admissions for children tend to involve asthma or

respiratory illnesses and accidents.

o Race, ethnicity, poverty, chronic diseases, other health problems and low birth

weight babies are all factors associated with the need for expanded access to primary

care for children. Among the three counties in the region, an average of 7.7 percent

of all newborns were considered low birth weight.

Behavioral Health–Adult, Pediatric and Jail Populations

o Behavioral health–either as a primary or secondary condition–accounts for substantial

patient volume and costs for health care providers, and is often utilized at capacity.

Despite this, behavioral health remains a substantial unmet need in the population.

o Dallas County residents suffering from behavioral health illnesses often confront

decision-making barriers. These barriers can impact preventive care and treatment

decisions, thereby influencing aspects of their physical health.

o The presence of a co-occurring behavioral health condition is associated with increased

case severity of medical encounters and a 36 percent increase in the average charges-

per-encounter. In RHP 9, 100 percent of the 10 most frequently admitted patients had a

co-occurring behavioral health diagnosis. These 10 individuals incurred more than $26

million in costs between 2007 and 2011; however, only one-fifth of their hospital

emergency department visits were for a mental health or substance abuse issue. Sixty-

5 | P a g e

one percent of those 10 individuals were uninsured, while 24 percent were on Medicaid,

12 percent were on Medicare and 3 percent were insured.

o The number of Dallas County children receiving publicly funded mental health

services tripled from 2000 to 2010. In Dallas County, the number of children

identified with a diagnosable emotional disturbance or addictive disorder has

increased to approximately 142,000 children with 5 percent of those children

experiencing a significant impairment as a result. Among youth between the ages of

12-17, 7.2 percent have experienced a major depressive episode.

o The structure of the behavioral health system (including mental health and substance

abuse) in RHP 9 struggles to meet the demand of patients in the community. Unlike

most of Texas, the majority of behavioral health services for Medicaid and indigent

patients are delivered through the NorthSTAR program instead of the traditional

Local Mental Health Authority (LMHA) system. NorthSTAR provides both mental

health and substance abuse treatment to over 60,000 Medicaid enrollees and indigent

uninsured annually. While NorthSTAR has greatly expanded access to care, it has

struggled with funding and infrastructure challenges. The growth in enrollment has

outpaced funding such that the funding per person served is 30 percent less than

when the program started in 1999 and is half that of the state average for other

LMHAs. Texas is 50th in mental health funding nationwide, and therefore the

funding per person served in RHP 9 is among the lowest in the nation.

o The number of NorthSTAR enrollees booked into jail has been steadily increasing,

and 27 percent of all bookings to the Dallas County Jail are currently referred to jail

behavioral health services.

Co-morbid Medical and Behavioral Health Conditions

o A co-morbid psychiatric condition was present among 25 percent to 50 percent of

the highest preventable admissions of the uninsured.

o Though Collin and Rockwall counties participate in the NorthSTAR Behavioral Health

System, they are still in great need of behavioral health services, though they have been

perceived as having less demand for these services compared to Dallas County. The three

areas of greatest need in behavioral health (mostly related to mental health and chemical

dependency) are: increased access to care; targeted resources to prevent relapse and

higher cost care; and expanded diversity of evidence-based services such as jail

diversion/mental health courts, peer-counseling, and integrated physical/behavioral

care.

o It is estimated that over half of the people in community-based behavioral health

programs are uninsured.

Emergency Department (ED) Usage and Readmissions

o ED visits are on the rise, and EDs are becoming overcrowded due to reduced

inpatient capacity and impaired patient flow.

o An analysis of ED encounters demonstrates that many members of the population are

accessing EDs for both urgent and non-urgent conditions. This is mostly due to the

patient’s lack of understanding of their medical conditions, and/or

6 | P a g e

uninsured/underinsured status. The RHP 9 finds the following related to ED usage:

Over the most recent four quarters of available data, conditions for which the

most volume of care was provided in an emergency outpatient setting were:

low back pain, hypertension, pain/joint aching, chronic bronchitis and asthma.

Further assessment demonstrates that, with the exception of asthma, over 68

percent of encounters for the top primary health conditions listed above were

either non-emergent or emergent/primary care treatable, meaning that the care

could have been provided effectively in a primary care setting.

For ED encounters that resulted in a hospital admission, the most common

health conditions by volume were stroke, diabetes, congestive heart failure,

weak/failing kidneys, chronic bronchitis and heart attack.

When reviewing by payer type, diabetes is the top condition for the uninsured

and Medicaid.

Emergency/Urgent Care

o During the first quarter of 2012, 18.7 percent of emergency

department visits to hospitals in RHP 18 and Dallas County were by

the uninsured. This is an increase of 15 percent over the previous

year.

Access to Care for Low Income Population

o The community suffers a lack of preventive health care, quality medical care and

supportive post-acute care services that promote the health of its residents.

Community health and patient-centered medical home locations may not promote

convenient access. Enrollment in health insurance programs is inconsistent across

the demographic.

Multiple Chronic Conditions

o Similar to national trends, total service area (TSA) residents exhibit increasing

diagnoses of chronic conditions. It is common that the pathology for one condition

may also affect other body systems, resulting in co-occurrence or multiple chronic

conditions (MCC). The presence of MCCs adds a layer of complexity to disease

management.

Prenatal Care

o In RHP 18, more than a quarter of pregnant women in each county (28 percent in

Collin, 42 percent in Grayson, and 31 percent in Rockwall) do not receive prenatal

care during the first trimester. Higher proportions of white women–compared to

black and Hispanic women–receive early prenatal care.

Health Professions Shortage

o RHP 18 shows patient flow to resources outside of the regional counties provide an

important opportunity to recognize limited or underdeveloped resources in these

three counties that if expanded would reduce the burden on hospitals in Dallas.

Preventable Acute Care Admissions

o Between January 2011 and April 2012, 4.3 percent of Parkland Hospital’s

discharged patients from RHP 18 were preventable admissions. This represents a

need for expanded primary care access in RHP 18.

7 | P a g e

Diabetes

o In every county in RHP 18, the highest proportion of uninsured, potentially

preventable admissions (PPAs) is diabetes for long-term problems.

Heart Disease

o In Collin and Grayson counties, asthma and hypertension admissions include a

substantial proportion of uninsured events.

o In all three regional counties, congestive heart failure was the second highest

contributor to hospital admissions. The first was bacterial pneumonia. Both are

conditions of increased incidence in the elderly population.

Elderly at Home and Nursing Home Patients

o In Collin and Grayson counties, a few zip codes contributed the largest number of

admissions for several preventable admissions. This may suggest that outreach to

nursing homes in these zip codes could be an effective tactic to reduce admissions.

o In all three regional counties, congestive heart failure was the second highest

contributor to hospital admissions. The first was bacterial pneumonia. Both are

conditions of increased incidence in the elderly population.

o Grayson County in particular has a growing elderly population.

The identified community health needs as outlined below were reviewed and prioritized with input

from BHCS senior leadership, the BHCS Mission and Community Benefit Committee and

approved by the BHCS Board of Trustees. In prioritizing the needs of the community BHCS

adopted the methodology established in the collaborated CHNAs used for this assessment. Priority

will be assigned as follows:

Needs identified as Top Priorities in the each of the collaborated CHNAs are assigned High

Priority for BHCS.

Needs identified as Top Priorities in more than one of the collaborated CHNAs are assigned

Medium Priority for BHCS.

Needs identified as Top Priorities in only one of the collaborated CHNAs are assigned Low

Priority for BHCS.

In developing a plan to address all identified community health needs, the Hospital and the System

found that aggregating the needs allows for significant, crosscutting initiatives. Therefore, the

Hospital’s community health implementation plan organizes the aggregated, prioritized needs as

follows:

High Priority

Access to Care for Low Income/Underserved

Behavioral Health

Co-morbid Medical and Behavioral Health Conditions

Emergency Department and Urgent Care

Multiple Chronic Conditions

8 | P a g e

Medium Priority

Prenatal Care

Preventable Acute Care Admissions

Elderly at Home and Nursing Home Patients

9 | P a g e

Key Contributors

Regional Healthcare Partnership Region 9

Baylor Health Care System

Children’s Medical Center

Dallas County Medical Society

Dallas Fort Worth Hospital Council

HCA North Texas

Lakes Regional MHMR

Methodist Health System

North Texas Behavioral Authority

Parkland Health and Hospital System

Texas Health Resources

Texas Scottish Rite Hospital for Children

University of Texas Southwestern Medical Center

Regional Healthcare Partnership Region 18

Baylor Health Care System

Children and Community Health Center McKinney

Childrens’ Legacy Hospital Plano

Collin County Adult Clinic

Collin County Health Care Services

Grayson County Public Health Department

HCA North Texas

Health Services of North Texas

Healthcare Committee of Collin County

Lakes Regional MHMR

LifePath Systems

Plano Children’s Medical Clinic

Tenet Healthcare Corporation

Texas Department Health Services Region 2/3

Texas Health Resources

Texoma Community Center

Texoma Medical Center

University of Texas Southwestern Medical Center

10 | P a g e

Assessment Methodology To complete this CHNA, BHCS staff participated in the development of several CHNAs with other

health care providers throughout the Dallas/Fort Worth Metroplex. These efforts include the Region

9 RHP report and Region 18 RHP report. The methodology for each is detailed below (see the

appendix for the complete assessments). Once the assessments were completed, the identified

community health needs were reviewed and prioritized with input from the Baylor Frisco Hospital

Advisory Board, Baylor Frisco management and BHCS senior leadership. In prioritizing the needs

of the community BHCS adopted the methodology established in the collaborated CHNAs used for

this assessment. Priority will be assigned as follows: Needs identified as Top Priorities in both of

the collaborated CHNAs are assigned High Priority for BHCS. Needs identified as Top Priorities in

only one of the collaborated CHNAs are assigned Medium Priority for BHCS.

Regional Healthcare Partnership Region 9

The Texas Health and Human Services Commission originally defined the geographic boundaries

of RHP 9 as Collin, Dallas, Denton, Ellis, Fannin, Grayson, Kaufman, Navarro and Rockwall

counties. However, subsequently, in May 2012, the Health and Human Services Commission issued

a revised state map, reducing RHP 9 to two counties: Dallas and Kaufman. In analyzing

demographic and patient flow patterns, it was determined that the CHNA would cover the original

Texas Health and Human Services Commission-defined region. Specific county information is

available as appropriate and provided in this report.

To conduct this CHNA, a CHNA Task Force was convened with representatives from local

hospitals, medical centers, and other health care providers from a multi-county geographic area.

Members of the CHNA Task Force included experts from the following organizations: Baylor

Health Care System; Children’s Medical Center; Dallas County Behavioral Health Leadership

Team; Dallas County Medical Society; HCA North Texas; Homeward Bound; Methodist Health

System; North Texas Behavioral Health Authority; Parkland Health and Hospital System; Scottish

Rite Hospital for Children; Texas Health Resources; UT Southwestern Medical Center;

ValueOptions of Texas.

This core planning team reviewed and identified the regional priorities through data analysis, expert

presentations and committee feedback. The criteria used by the Task Force to identify the regional

priorities were: degree of population impact, financial burden on the health care system, alignment

with intervention categories, and health issues whose solutions lend themselves to regional-based

approaches. Whenever possible, regional, county and local data were obtained for assessment.

Indicators and data sources were selected based on consistency and availability of data from reliable

data sources.

11 | P a g e

Baylor Frisco Community Definition

BHCS and its affiliated hospitals serve a 12 county area known as the Dallas/Fort Worth Metroplex.

BHCS divides its service areas into three regions: the Eastern Region, the Central Region and the

Western Region. BHCS’ health care services are provided through a network of more than 300

access points, including 30 owned/operated/ventured/affiliated hospitals, joint ventured ambulatory

surgical centers, satellite outpatient locations, senior centers and more than 180 HealthTexas

Provider Network physician clinics. BHCS uses the health care industry’s standard “80 percent”

rule to define each hospital service areas.

80 Percent Rule = 50 percent of inpatient volume from Primary Service Area (PSA) + 30

percent inpatient volume from Secondary Service Area (SSA)–both of which make up the

Total Service Area (TSA)

The following steps were taken to assure true representation of the area served:

Outlier zip codes were removed.

Missing zip codes adjacent to the facility were included.

12 | P a g e

Zip codes needed to complete the contiguous service area were included.

Located in Collin County, Baylor Frisco serves the Eastern Region of the System. Its total service

area (TSA) includes zip codes from Allen, Carrollton, Dallas and Richardson. The TSA comprises:

An urban/suburban geographic area

Service area population: 1,350,179

Service area ethnicity: White Non Hispanic = 57.7 percent; Black Non Hispanic = 9.2 percent;

Hispanic = 19.8 percent; Asian and Pacific Islanders Non-Hispanic = 10.6 percent; all others =

2.7 percent

Service area payer mix: managed care = 48.0 percent; Medicaid = 11.1 percent; Medicare =

31.9 percent; self pay/charity = 8.4 percent; other = 0.6 percent

Service area household average income: $95,214

Service area living below the Federal Poverty Level (FPL): 5.4 percent (compared to 10.5

percent living below the FPL in the Dallas/Fort Worth Metroplex, and 10.2 percent living below

the FPL in the United States)

Number of other hospitals serving the community: 25 hospitals other than Baylor Frisco

Medically underserved: The Baylor Frisco service area contains multiple medically underserved

areas or populations.

Service area education: less than high school = 4.5 percent; some high school = 5.0 percent;

high school diploma = 17.4 percent; some college/associates degree = 29.7 percent; bachelor’s

degree or greater = 43.5 percent

Service area male population = 676,841; service area female population = 673,338

Service area age: 0-14 = 23.6 percent; 15-17 = 4.3 percent; 18-24 = 7.8 percent; 25-34 = 15.2

percent; 35-54 = 31.9 percent; 55-64 = 9.4 percent; 65+ = 7.7 percent

Baylor Regional Medical Center at Plano Service Area Providers

Hospitals

Baylor Institute For Rehabilitation At Frisco

Baylor Medical Center At Carrollton

Baylor Medical Center At Frisco

Baylor Regional Medical Center At Plano

Bush Renner

Centennial Medical Center

Childrens Medical Center Legacy

Columbia Medical Center Of McKinney Subsidiary, L.P.

Emerus Hospital

Forest Park Medical Frisco

Healthsouth Plano Rehabilitation Hospital

Lifecare Hospitals Of Plano

Medical Center Of Mckinney-Wysong Campus

Medical Center Of Plano

Methodist McKinney Hospital LLC

Methodist Richardson Medical Center

Plano Specialty Hospital

13 | P a g e

Reliant Rehabilitation Hospital North Texas

Select Specialty Hospital - Dallas

Texas Health Center For Diagnostics & Surgery Plano

Texas Health Presbyterian Hospital Allen

Texas Health Presbyterian Hospital Plano

The Heart Hospital Baylor Plano

The Hosptial At Craig Ranch

Twin Creeks Hospital

Ambulatory Surgery Centers

Baylor Ambulatory Endoscopy Center

Baylor Surgicare At Carrollton

Baylor Surgicare At Plano

Baylor Surgicare At Plano Parkway LLC

Breckenridge Surgery Center

Centennial Surgery Center

Cook Childrens Pediatric Surgery Center

Dallas IVF Surgery Center LLC

East Loop Surgery Center LP

Faith Surgical Center, LLC

Frisco Reproductive Surgery Center

Gastrointestinal Endoscopy Center

Heritage Surgery Center

Institute For Minimally Invasive Surgery

Legacy Surgery Center Of Frisco

McKinney Surgery Center

North Dallas Surgicare

Outpatient Surgery Center

Pain Care Of North Texas LLC

Park Ventura Endoscopy Center

Plastic And Cosmetic Surgery Center Of Texas

Preston Plaza Surgery Center

Stonebridge Surgery Center

Surgery Center Of Plano

Surgery Center Of Richardson

Surgery Center Of Texas

Texas Endoscopy

Texas Endoscopy LLC

The Surgery Centre At Craig Ranch

Windhaven Surgery Center LLC

Freestanding ER

Legacy ER

First Choice Emergency Room - Murphy

E-Care Emergency Center

ER Centers of America, Inc.

First Choice Emergency Room - Plano

14 | P a g e

Psychiatric Facilities

Carrollton Springs

Texas Health Seay Behavioral Health Center Plano

15 | P a g e

Community Health Needs Assessment

Public Participation

Baylor Frisco and BHCS have fostered continued community participation and outreach activities

through membership in the Dallas Fort Worth Hospital Council. They have used data from this

collaboration of health care providers, including data that served as the basis for this CHNA. This

data–drawn from a variety of local, state and federal sources–represents the most recent evaluation

of Dallas/Fort Worth residents’ health status and the assets available to the community for

improving health.

In addition, data was drawn from the Healthy North Texas website (www.healthytexas.org), which

was created under the direction of the Dallas Fort Worth Hospital Council Foundation’s

Community Health Collaborative. The website features data regarding overall population health. It

boasts more than 100 local health indicators that can be compared across other Texas regions and

the nation. The information can be used to expose crucial health concerns in North Texas, including

incidents of diabetes, breast cancer and suicide. The site also has a database of information detailing

ways to combat these health ailments. Sponsors of the site include Blue Cross Blue Shield of Texas,

Communities Foundation of Texas, HCA North Texas, JPS Health Network, Methodist Health

System, Texas Health Resources, University of North Texas Health Science Center and Baylor

Health Care System.

BHCS Community Benefit Committee

Community health needs identified in this document have also been reviewed and approved by the

BHCS Community Benefit Committee.

The mission and role of the BHCS Community Benefit Committee is to assist the Board of Trustees

in setting direction, identifying priorities, and monitoring performance in mission and vision

integration into community benefits across BHCS. The Committee is comprised of trustees (current

System and community board members) and other community representatives appointed by the

BHCS board of trustees. The Committee will meet twice annually, or upon the request of the

Committee chair. The current chair is Dr. Jim Denison.

16 | P a g e

Regional Healthcare Partnership Region 9 (Executive Summary)

To develop the Community Needs Assessment, a regional Task Force was convened by

representatives from the following organizations: Baylor Health Care System, Children’s Medical

Center, Dallas County Medical Society, Dallas County Behavioral Health Leadership Team, HCA

North Texas, Methodist Health System, North Texas Behavioral Health Authority, Parkland Health

& Hospital System, Scottish Rite Hospital for Children, Texas Health Resources, UT Southwestern

Medical Center, and ValueOptions of Texas.

This Task Force reviewed and identified the regional needs through data analysis, expert

presentations, and committee discussions. The major criteria used to identify and rank regional

priorities included population impact, alignment with intervention categories, and whether solutions

lend to regional based approaches. The following priorities were identified as the region’s major

community health needs:

Capacity - Primary and Specialty Care

The demand for primary and specialty care services exceeds that of available physicians in these

areas, thus limiting health care access.

Behavioral Health - Adult, Pediatric and Jail Populations

Behavioral health, either as a primary or secondary condition, accounts for substantial volume and

costs for health care providers, and is often utilized at capacity, while still leaving a substantial

unmet need in the population.

Chronic Disease - Adult and Pediatric

Many individuals in North Texas suffer from chronic diseases that present earlier in life. They also

are becoming more prevalent and result in health complications.

Patient Safety and Hospital-acquired Conditions

Hospitals in the region address patient safety and care quality on a daily basis. It is a continuous

process and always at the forefront of any strategy of a health care entity. An ongoing coordinated

effort among providers is needed to improve patient safety and quality throughout the region.

Emergency Department Usage and Readmissions

Emergency departments are treating high volumes of patients with preventable conditions or

conditions that could be addressed in a primary care setting. Additionally, readmissions are higher

than desired, particularly for those with severe chronic disease or behavioral health issues.

Palliative Care

Overall, costs are higher in skilled nursing facilities, long-term care facilities, hospice and home

health sectors, and slightly higher in physician services.

Oral Health

In Texas, preventive dental visits are below the recommended levels, and access can be a problem

for minorities, the elderly, children on Medicaid and other low-income children. Compounding the

problem is the shortage of dentists in Texas, which stands at approximately 60 percent of the

national ratio of dentists-to-population.

17 | P a g e

Regional Healthcare Partnership Region 18 (Executive Summary)

RHP 18 subscribes collectively to the principles recommended by the Population Health

Institute in its annual national health outcomes and health factors report. Namely, that healthy

communities depend on, and are derived from, community members working together to

assess needs and resources, focusing on issues deemed by consensus to be the most

important, and creating effective policies and programs to favorably impact population health.

In addition to the community needs identified through national, state and local sources, RHP

18 also is attending to six of the 12 health indicators identified by the U.S. Center for Disease

Control in Healthy People 2020. These six indicators have emerged as important areas of need in

the planning process for the Texas Healthcare Transformation and Quality Improvement

Program in Collin, Grayson and Rockwall counties.

• Access to health services

• Clinical preventive services

• Injury and violence

• Maternal, infant, and child health

• Nutrition, physical activity and obesity

• Social determinants of medical and behavioral health problems

Table 10 on the following page provides a list of 14 broadly defined community needs (CN) per

HHSC protocol to which providers have linked DSRIP projects.

Table 10.

Identification

Number

Brief Description of

Community Needs

Addressed through RHP

Plan

Data Source for Identified Needs

CN.1 Primary care - adults Request for PPA Data -DSHS Warehouse

CN.2 Primary care - children Texas Department of State Health Services

web site selected data:

http://www.dshs.state.tx.us/wellness/data.shtm

CN.3 Prenatal care Texas Department of State Health Services

web site selected data:

http://www.dshs.state.tx.us/wellness/data.shtm

CN.4 Urgent and emergency care

ED data, DFW Hospital Council Foundation

CN.5 Co-morbid medical and

behavioral health conditions -

all ages

DSHS data request; NorthSTAR Dashboard

CN.6 Health professions shortage Federal government Health

Indicators Warehouse website

18 | P a g e

CN.7 Preventable acute care

admissions

Data request to DSHS

CN.8 Diabetes DSHS PPA Data

CN.9 Cardiovascular Disease 2009 Texas Behavioral Risk Factors

Surveillance System, Center for Health

Statistics, Department of State Health

Services. Available online at:

http://www.dshs.state.tx.us/chs/brfss/query/brf

ss_ form.shtm.

CN.10 Elderly at home, and

Nursing Home patients

Extrapolated from DSHS PPA data

CN.11 Behavioral Health -

all components - all

ages

DSHS data website; Previously conducted

studies and needs assessments available

publicly.

CN.12 Other special populations at-risk DSHS data and surveillance reports

CN.13 Communicable disease Center for Disease Control

CN.14 Obesity and its co-morbid

risk factors

http://www.window.state.tx.us/specialrpt/obes

ity cost/epidemic.php

19 | P a g e

Appendix A

Regional Healthcare Partnership Region 9 Community Needs Assessment

20 | P a g e

Section III. Community Needs Assessment To develop the Community Needs Assessment, a regional Task Force was convened by

representatives from the following organizations: Baylor Health Care System, Children’s Medical

Center, Dallas County Medical Society, Dallas County Behavioral Health Leadership Team, HCA

North Texas, Methodist Health System, North Texas Behavioral Health Authority, Parkland Health

& Hospital System, Scottish Rite Hospital for Children, Texas Health Resources, UT Southwestern

Medical Center, and ValueOptions of Texas.

This Task Force reviewed and identified the regional needs through data analysis, expert

presentations, and committee discussions. The major criteria used to identify and rank regional

priorities included population impact, alignment with intervention categories, and whether solutions

lend to regional based approaches. The following priorities were identified as the region’s major

community health needs:

Capacity - Primary and Specialty Care - The demand for primary and specialty care services exceeds that of available medical physicians in these areas, thus limiting healthcare access. Behavioral Health - Adult, Pediatric and Jail Populations - Behavioral health, either as a primary or secondary condition, accounts for substantial volume and costs for existing healthcare providers, and is often utilized at capacity, despite a substantial unmet need in the population. Chronic Disease - Adult and Pediatric - Many individuals in North Texas suffer from chronic diseases that present earlier in life, are becoming more prevalent, and exhibit complications. Patient Safety and Hospital Acquired Conditions – Hospitals in the region address patient safety

and care quality on a daily basis. It is a continuous improvement initiative and is always at the

forefront of any strategy for a health care entity. An ongoing coordinated effort among providers is

needed to improve patient safety and quality throughout the region.

Emergency Department Usage and Readmissions - Emergency departments are treating high

volumes of patients with preventable conditions, or conditions that are suitable to be addressed in a

primary care setting. Additionally, readmissions are higher than desired, particularly for those with

severe chronic disease or behavioral health.

Palliative Care - Overall, costs are high in skilled nursing facilities, long term care facilities, hospice

and home health sectors, and slightly higher in physician services.

Oral Health - In Texas, preventive dental visits are below the recommended levels, and access can

be a problem for minorities, the elderly, children on Medicaid, and other low income children.

Compounding the issue is the shortage of dentists in Texas at approximately 60% of the national

ratio of dentists to the population.

21 | P a g e

Demographics and Regional Description

Based on population alone, Texas is the second largest state in the nation with more than 25 million

people. From 2000 to 2010, Texas experienced a 20% growth in population, as compared to only a

9.7% increase nationally. Originally, the North Texas RHP 9 Region was defined to include Collin,

Dallas, Denton, Ellis, Fannin, Grayson, Kaufman, Navarro, and Rockwall counties. The broader

demographics were considered to be representative of the narrower final RHP boundaries and as

demonstrated in Figure 3 below, there is considerable in- migration from the original RHP counties

to Dallas County for health care services.

In the North Texas RHP 9 region (original definition), the 2011 population is estimated to be

4,611,612 and is expected to grow by 9.5% by 2016 to 5,048,283 residents.3

The most prevalent

age group is 35-54 years (27.6%), followed by the 0-14 age group (20.2%).

While 15.1% of adults have less than some high school level of education, approximately 85% of

adults have at least a high school degree.

White non-Hispanics represent 48.1% of the population, followed by Hispanics, Black non-

Hispanics, Asians, and others, respectively.4

Approximately 44% of Dallas-Fort Worth residents

are New Americans (defined as either foreign born or the children of foreign born) of which 46%

are undocumented. English is not the language spoken in 32% of homes in North Texas and over

239 languages are spoken in the North Texas Area, with more than 1/3 reflecting African cultures

new to the region.5

Figure 1: Regional Demographic Snapshot

3

US Census Data, Thompson Reuters/Claritas Market Expert Data Extract, 2012. 4

ibid. 5

DFW International Community Alliance. 2010 North Texas Progress Report.

22 | P a g e

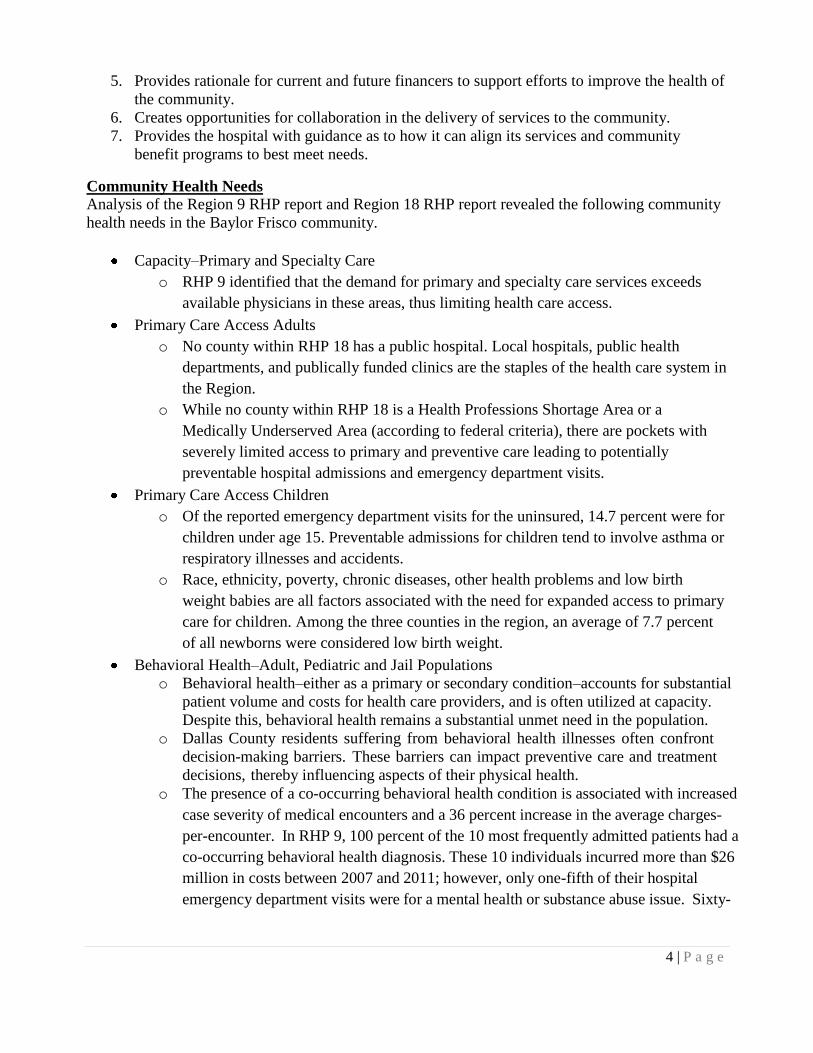
Within Dallas County specifically, 29.6% of children under 18 live below the federal poverty level

and 15.8% of adults between 18 to 64 years live below the federal poverty level.6

Figure 2: Summary of Uninsured in Dallas County7

Health Delivery System and Patient Migration Patterns

Data analysis identified patient migration patterns within multiple RHP regions. Many individuals

receive healthcare services in nearby counties. In the pediatric population, Dallas County residents

account for 75% of the outpatient services and 74% of the inpatient services. In the adult

population, Dallas County residents account for 77% and 73% of the outpatient and inpatient

population, respectively.8

Figure 3: Interconnectedness of Healthcare

Delivery System: Dallas County Encounters from

Patients with Adjacent County of Residence,

20119

The locations of charitable clinics in Dallas County

are shown on the map below. Additional analysis is

warranted to determine the causal factors of the patient flow and migration patterns and how they

relate to the locations of clinics/other service sites in the region. It is apparent though that the data

presents strong justification to consider a broader geographic area for the purposes of this

assessment.

6

US Census Data. www.census.gov, 2011. 7

Communities Foundation of Texas, Assets and Opportunities Profile. February 2012. 8

DFWHC Foundation, Information and Quality Services Data Warehouse, 2011 9

ibid

23 | P a g e

Figure 4: Location of Charitable Clinics in North Texas10

Regional Health Care Capacity

Physician Supply and Availability

RHP 9 is affected by the limited physician capacity in primary and select specialties. According to

the Health Professions Resource Center, primary care physician supply trends have consistently

increased to a current statewide rate of 70 per 100,000 people in 2011.11

In 2011, the RHP 9 region

demonstrated a physician need in excess of over 30% of the current workforce and by 2016 the

physician need is expected to be 50% higher than projected availability.12

With such a shortage of

physicians, which is disparately worse in rural areas of Texas, many residents seek primary care and

non-emergent treatment in emergency departments, resulting in increased healthcare costs and

higher volumes of preventable and avoidable cases in the ED.

Medical Education

Dallas County is home to the University of Texas Southwestern Medical Center, an academic

medical center that trains over 1000 medical students and approximately 1300 clinical residents

annually. Many training and residency placements are completed within the DFW Metroplex

providing an important source of physicians to the local healthcare system.

Medically Underserved and Shortage Areas

A Health Professional Shortage Area (HPSA) is a federally designated geographic area, a facility or

population group with a shortage of primary care physicians (or dental or mental health providers)

as defined by a population-to-primary care physician ratio of at least 3,500:1 in 10

Parkland Health & Hospital System. Charitable Clinic Locations Report. 2012. 11

Health Professions Resource Center, Center for Health Statistics, Department of State Health Services, October

2011. 12

ibid.

24 | P a g e

addition to other requirements designated by the U.S. Department of Health and Human Services.13

Poverty rate, infant mortality rate, fertility rate and physical distance from care are all considerations

in scoring for HPSA designation.

Medically Underserved Areas or Populations (MUA/MUP) are generally defined by the federal

government to include areas of populations with a shortage of personal health care services or

groups of people who may have cultural or linguistic barriers to health care. In RHP 9, Dallas

County has significant HPSA and MUA regions that overlap and Kaufman County is a county-

level HPSA with no MUAs.

Children/Youth

The impact of the limited primary and specialty care is profound for children and families in the

region. The current pediatric need is more than 80% of the current supply in the region. In Dallas

County alone, over 36.2% of children were enrolled in Medicaid in 2010, exacerbating the issue of

availability of pediatric primary care access and treatment.14

Data also indicates that many of the

pediatric specialists have limited capacity, creating a backlogged pipeline for those needing

specialty services after seeking primary care.

Behavioral Health

Behavioral Health System Structure and Funding

The behavioral health system (including mental health and substance use) in RHP 9 differs from

that of the rest of the state in that the majority of behavioral services for Medicaid and indigent

patients are delivered through the NorthSTAR program instead of the traditional Local Mental

Health Authority (LMHA) system. It is a managed behavioral healthcare carve-out program,

administered by ValueOptions of Texas under a Medicaid 1915(b) waiver under the oversight of the

North Texas Behavioral Health Authority (NTBHA), and it provides both mental health and

substance use treatment to over 60,000 Medicaid enrollees and indigent uninsured annually.

Over the past decade, the NorthSTAR program has greatly expanded access to care. However, this

high level of access results in funding and infrastructure challenges. Since the program’s inception,

the growth in enrollment has outpaced funding such that the funding per person served is 30% less

than when the program started in 1999 and is half that of the state average for other LMHAs15

.

Given that Texas is 50th in mental health funding nationwide16

, the funding per person served in

RHP 9 is among the lowest in the nation.

Mortality Trends in the Behavioral Health Population

An inadequate supply of behavioral health services is one of the most significant unmet health

needs of RHP 9. A recent study in Texas found that NorthSTAR was one of only four LMHAs in

which age-adjusted mortality rates were significantly higher for the mental health population

compared to the general population. Consistent with the NASMHPD study, the majority of 13

US Department of Health and Human Services. 2012. 14

Children’s Medical Center. Beyond ABC Report, 2011. 15

TriWest/Zia Partners. Assessment of the Community Behavioral Health Delivery System in Dallas County, 2010. 16

National Alliance on Mental Illness. State Mental Health Cuts: The Continuing Crisis. March 2011

25 | P a g e

deaths in this region were due to medical illness, and most of those were due cardiovascular

disease.17

The NorthSTAR system differs from the rest of the state in that it includes patients with

primary diagnoses of substance use disorders, a preliminary analysis of death records showed

similar mortality rates between the mental health and substance abuse populations.18

Cost Trends in the Behavioral Health Population

The financial implications of caring for those with behavioral health conditions are substantial and

impact resources within the healthcare institutions of RHP 9. Analysis of DFW Hospital Council

Foundation data demonstrates that charges associated with the care of mental health patients more

than doubles from $50,000,000 to over $100,000,000 between the ages of 17 through 21. Charges

continue to rise through adulthood, and between the ages of 47-65, the estimated charges for mental

health encounters are higher than those of all other conditions combined. When substance abuse

encounters are included, this difference is even greater.19

Figure 5: Age and Charge Distribution by Mental Health and Substance Abuse Encounter

(2010Q3-2011Q3)20

In RHP 9, the presence of a co-occurring behavioral health condition is associated with increased

case severity of medical encounters and a 36% increase in the average charges per encounter. In

RHP 9, 100% of the 10 most frequently admitted patients had a co-occurring behavioral health

diagnosis depicted in Figure 5. These 10 individuals incurred a cost of more than $26 million

between 2007 and 2011; however only 1/5 of their hospital emergency department visits were for a

mental health or substance abuse issue. Sixty-one percent were uninsured (24% Medicaid, 12%

Medicare, and 3% Insured).

17

Mortality of Public Mental Health clients treated at the Local Mental Health Authorities of Texas, 2012. 18

Personal communication between EA Becker and M Balfour 19

Dallas Fort Worth Hospital Council Foundation, Readmission Patterns by Mental Health & Substance Abuse, 2012 20

DFWHC Foundation, Information and Quality Services Data Warehouse, 2012.

26 | P a g e

Figure 6: Mental Health and Substance Abuse: Intersection

Figure 7: Top Ten High Emergency Department Utilizers: Mental Health and Substance Abuse Integration - Behavioral Health and Primary Care

The percentage of residents below 200% Federal Poverty Level in Dallas County who receive

behavioral healthcare in primary care settings is 19.8% which is significantly lower than the national

average of 37.1%.21

Parkland, the largest primary care provider to low-income populations in Dallas

County, is not a NorthSTAR provider and consequently, some who may be successfully served in

primary care settings are referred to NorthSTAR. This may result in dilution of limited NorthSTAR

resources, as well as coordination of care issues for those with high complexity co-occurring illness.

An analysis of the diabetic population at Parkland revealed that diabetics receiving antipsychotic

medications from the NorthSTAR system were twice as likely to receive second-generation

antipsychotics, which adversely affect metabolic indicators associated with poor diabetes outcomes,

compared to those receiving antipsychotics from the Parkland pharmacy.22

21 TriWest/Zia Partners. Assessment of the Community Behavioral Health Delivery System in Dallas County, 2010.

22

Balfour, ME et al. Highlighting High Utilizers: How can our systems better meet their needs? Institute on Psychiatric

Services Annual Meeting, 2011.

27 | P a g e

The funding challenges combined with the complexity of the behavioral health system may

adversely impact sub-populations with the highest needs. The number of NorthSTAR enrollees

booked into jail has been steadily increasing as shown below in Figure 823

, and 27% of all book- ins

to the Dallas County Jail are currently referred to jail behavioral health services.24

Homeless

individuals with behavioral health conditions cost three times as much and are booked into jail

twice as often as the general NorthSTAR population.25

Among high utilizers, these relationships

are magnified, as illustrated below.

Figure 8: Behavioral Health Patient Factors for Top 20% Utilizers of NorthSTAR, Dallas

County Jail, and Terrell State Hospital, 2010

Figure 9: Behavioral Health Costs for Top 20% Utilizers of NorthSTAR, Dallas County Jail,

and Terrell State Hospital, 2010

23

Ron Stretcher and Jill Reese, Dallas County Criminal Justice Department 24

Communication between Wassem Ahmed, Medical Director-Parkland Jail Behavioral Health and M. Balfour, MD 25

Balfour, ME. Homelessness, Criminal Justice, and the NorthSTAR Top 200 Report, 2011.

28 | P a g e

Children/Youth

The number of Dallas County children receiving publicly funded mental health services has tripled

from 2000 to 2010. In Dallas County, the number of children identified with a diagnosable

emotional disturbance or addictive disorder has increased to approximately 142,000 children with

5% of those children experiencing a significant impairment as a result. Among youth between the

ages of 12-17, 7.2% have experienced a major depressive episode.

Cultural and Linguistic Minorities

Hispanics comprise 40% of the population but only 25% of the NorthSTAR population.26

While

there is a lack of services available and written materials available in Spanish, it is difficult to

characterize the extent of the need, because data on primary language is not collected.

Demand for Behavioral Health Services

Following the economic downturn in 2009, there was a 17% increase in 23-hour observation visits

at Green Oaks Hospital, mostly accounted for by new enrollees to NorthSTAR. More recently,

there has been a sharp spike in 23-hour observation utilization, with Feb 2012 visits 26% higher

compared to Dec 2011 (and 25% higher compared to Feb 2011).27

This increase coincided with

both regulatory oversight limiting the capacity of Parkland’s Psychiatric ED by 50% and a

reduction in funding for outpatient services in the NorthSTAR system.

In addition to hospital-type services, there is also a need for less-acute levels of behavioral care in

order to prevent the need for these high-cost services. A sub-acute crisis residential level of care

exists but there are only 21 beds for the entire NorthSTAR region. The Behavioral Health

Leadership Team has identified the highest need for service development to be post-crisis

“wraparound” services to reduce the 20% 30-day readmission rate to crisis services, and peer-

driven services to engage clients early in order to prevent crisis episodes.

Chronic Disease

Similar to national trends, North Texas is experiencing increasing rates of many chronic diseases,

including heart disease, cancer and stroke. Also there are increasing rates of asthma and diabetes in

adults within the Dallas County Metropolitan Statistical Area as shown below.

Figure 10: Dallas County Adults with Asthma and

Diabetes

In an assessment of ED utilization, the five encounter

types that were most frequent and of highest volume

are those for chronic conditions of asthma, chronic bronchitis, pain/aching of

26 TriWest/Zia Partners. Assessment of the Community Behavioral Health Delivery System in Dallas County, 2010.

27 ValueOptions of Texas

29 | P a g e

joints, sinusitis, and hay fever.28

There were slight variations presented when encounters were

analyzed by payer type. More Medicaid and uninsured patients sought treatment for asthma than those

with insurance or Medicare and for the uninsured specifically, diabetes was listed as the 5th

top

condition, while not even listed as a top 5 condition for the insured or Medicaid.

Figure 11: Volume for Adult Outpatient Emergency Department Encounters (2010Q3 -

2011Q3)29

Asthma

Over the past decade, asthma has become a widespread public health problem that has increased in

both Texas and the United States. Asthma has a major impact on the health of the population and the

burden falls unevenly on some populations. According to Texas Behavioral Risk Factor Surveillance

System in 2005, approximately 1.5 million adults (ages 18 and older) and 389,000 children (ages 0-17)

were reported to have asthma at the time.30

And in 2006, the state of Texas spent over $391.5 million

for inpatient admissions with a primary discharge diagnosis of asthma.31

In 2008, the state of Texas had a risk-adjusted admission rate of 72.5 per 100,000 cases.32

Although

Dallas County had a slightly higher rate at 89.1 per 100,000 cases, six of the ten counties surrounding

Dallas County were significantly more burdened with a risk-adjusted admission rate of greater than

92.2 per 100,000 cases. Only one county of the ten had a lower risk-adjusted rate (Rockwall County)

at 70.5 per 100,000 cases. Other North Texas counties’ astham admission rates are shown in the table

below.

28 Dallas Fort Worth Hospital Council Foundation, Information and Quality Services Data Warehouse. March 2011.

29

Dallas Fort Worth Hospital Council Foundation, Information and Quality Services Data Warehouse. March 2011. 30

Asthma Coalition of Texas. Texas Asthma Plan. 2007-2010. 31

Asthma Coalition of Texas. 2012. 32

AHRQ Prevention Indicators. Adult Asthma Admission Rate. 2008

30 | P a g e

Diabetes

Diabetes affects 11.4% of the population in Dallas County, which is above both the state average of

10% and the national average of 8%. In patients seen throughout the regional healthcare system and

who are residents of Dallas County, the top five primary diagnoses, those patients with an

underlying condition of diabetes were 29% for pneumonia, 39% for septicemia, 31% for other

rehabilitation, 34% of urinary tract infection and 45% of acute kidney failure.33

Those with diabetes

had a higher mortality percentage than those without in four of the five top inpatient diagnoses

revealing that a co-morbidity of diabetes increases your risk for

mortality.

Dallas County’s top seven diagnoses for ER patients were Acute URI Unspecified, Otitis Media,

abdominal pain, chest pain unspecified, urinary tract infection, headache and other chest pain.

Within those top seven diagnoses, 20%-45% had an underlying condition of diabetes. Specifically,

of all patients who came to the ER with chest pain as a diagnosis, 21%-25% had a comorbidity of

diabetes. Of patients presenting with abdominal pain, urinary tract infections and headache, 10%

also had diabetes.

33

Doughty, P. et al. Diabetes in Dallas County: Provider Report. 2011

31 | P a g e

Figure 12: Prevalence of Co-Occurring Diabetes, Dallas County 2009-2010

Children/Youth.

Between 2000 and 2010, the number of Children’s Medical Center admissions of youth with a

primary or secondary diagnosis of diabetes increased by 34%. With the association of diabetes and

obesity, there is also cause for concern of the future trajectory as low income preschool obesity

within the Dallas Metropolitan Statistical Area was 17.2% in 2009, placing many young children at

higher rates of developing diabetes in later years.34

Cost/Charge.

Isolation of a specific “direct cost” is complicated. However, it is understood that the societal

burden for this condition is extremely large and has manifestations in healthcare service utilization

due to increases complexity and severity of other co-occurring medical conditions. Additionally,

there are important societal costs of lower economic productivity of individuals with severe diabetic

complications. The magnitude of the issues is only projected to increase as more people begin to

develop diabetes at earlier in life.

Patient Safety and Quality and Hospital Acquired Conditions

The DFWHC Foundation’s 77 hospitals had 1,706 adverse hospital events in 2010. These events

included air embolism, Legionnaires, Iatrogenic Pneumothorax, delirium, blood incompatibility,

glycemic control issues and Clostridium difficile, which are not part of the ten adverse events

specified by CMS. A significant portion was made up of Medicare patients (46%) and insured

(54%) according to the claims data within the DFWHC Foundation claims data warehouse.

Emergency Department Usage and Readmissions

An analysis of the emergency department encounters demonstrates that many in the population are

accessing emergency departments for both urgent and non-urgent conditions. Over the most recent

four quarters of data, the conditions for which the most volume of care

34 Children’s Medical Center. Beyond ABC Report, 2012

was provided in an emergency outpatient setting were: low back pain, hypertension, pain/joint

32 | P a g e

aching, chronic bronchitis, and asthma.Further assessment demonstrates that, with the exception of

asthma, over 68% of the encounters for the top primary health conditions listed above were either

non-emergent or emergent/primary care treatable, in that the care could have been provided

effectively in a primary care setting. For asthma, approximately 98.1% of all encounters were

emergent, however the condition could have been potentially avoidable or preventable if effective

ambulatory care could have been received during the illness episode.35

For emergency department encounters that resulted in a hospital admission, the most common health

conditions by volume include stroke, diabetes, congestive heart failure, weak/failing kidneys,

chronic bronchitis and heart attack. When reviewing by payer type, diabetes is the top condition for

the uninsured and Medicaid and the 5th

top condition for those who are insured.

Figure 14: Adult Inpatient Emergency Department Encounters (2010Q3 - 2011Q3)36

Specific to children, the high volume ED encounters includes asthma, diabetes, pain/aching joints,

and arthritis most frequently. Regardless of payer type, asthma and diabetes are the top conditions

for ER and inpatient admissions.

Figure 15: Pediatric Inpatient Emergency Department Encounters (2010Q3 - 2011Q3)37

35

DFWHC Foundation, Information and Quality Services Data Warehouse, 2011. 36

Ibid. 37

Ibid.

33 | P a g e

In North Texas, all-cause readmissions as defined by a subsequent admission within 30 days from

the incident encounter of any type has demonstrated a downward trend since 2008.38

Many hospitals

are working to continue improvement in this area, specifically for readmission related to congestive

heart failure, acute myocardial infarction, and pneumonia.

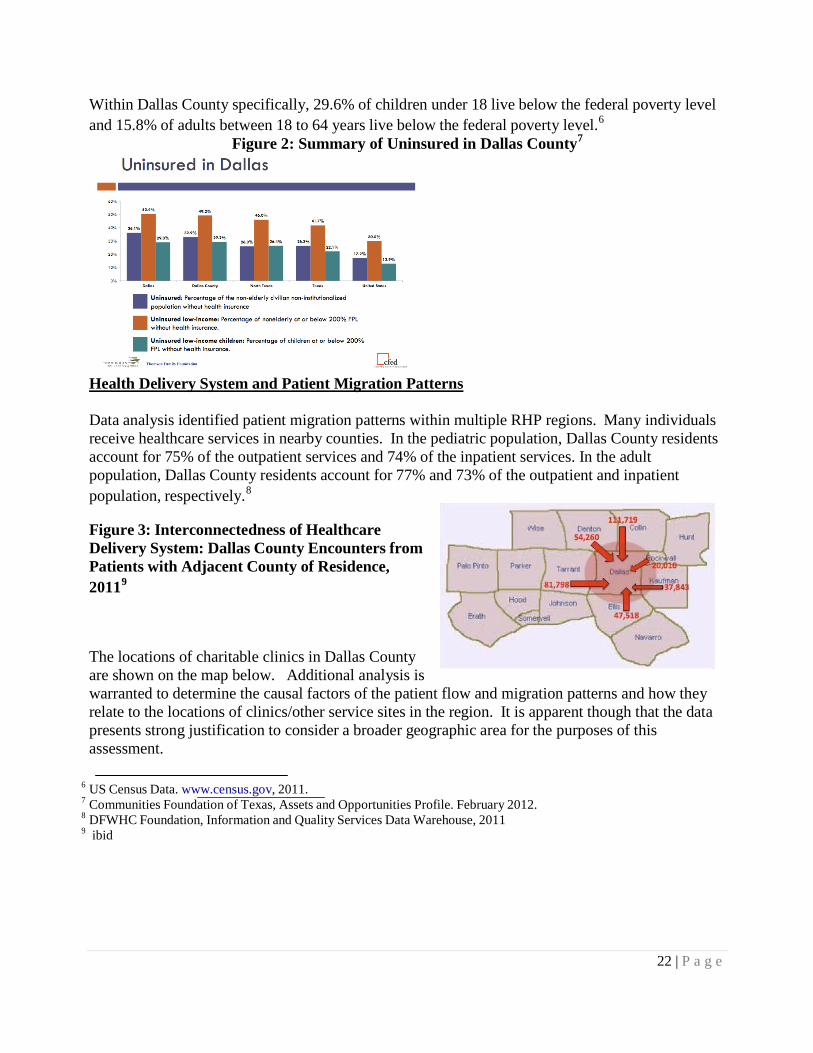
As evidenced by an assessment of 10 individual high utilizers in the region, there is a strong

relationship between readmissions and behavioral health. Each patient has some component of

mental health or substance abuse history over the course of their encounter history.

Figure 16: Top Ten High Emergency Department Utilizers: Mental Health and Substance

Abuse

Cost/Charge From quarter 3 of 2010 to quarter 3 of 2011, the estimated charges associated with all regional

emergency outpatient encounters was $312,816,490 and for emergency inpatient encounters, the

total charges increase to $2,076,778,420. For emergency inpatient encounters, there was little

charge variation across insured, Medicaid, Medicare, and Uninsured payer types.

Palliative Care

Palliative care is an important factor in the care delivery system of RHP 9. Overall, Medicare

reimbursements to providers in Dallas County are higher than average and higher than the 50th

percentile in the country during a patient’s last two years of life signifying a large volume of

palliative care services being provided. Even within the health service area of RHP 9, there is

variability of the percentage of deaths occurring within hospitals, ranging from 0.69 percent to

1.17 when compared to the national average.

Oral Health

Tooth decay (dental caries) is the most common chronic childhood disease. In 2003, the proportion

of Texas children reported to have teeth in excellent or very good condition was lower than the

national average and lower within all age, sex, and racial/ethnic subgroups.

38 DFWHC Foundation, Information and Quality Services Database, 2010.

34 | P a g e

Figure 17: Oral Health – Condition of Teeth for Texas Children (2003)

Condition of Teeth: Excellent

or very good Preventive Dental Care: ≥ 1 Visit within Past Year

US % Texas % US % Texas %

Age Group

All children 0–17 64.3 57.6 67.6 61.6

Age (years) 1–5 75.8 70.7 46.8 48.4

6–11 61.7 50.9 83.4 74.8

12–17 67.4 61.2 79.4 69.7

Socioeconomic status

0–99% Federal poverty level 45.4 40.7 54.1 56.0

100–199% Federal poverty level 56.5 48.9 61.6 52.6

200–399% Federal poverty level 71.2 66.7 73.0 67.4

≥400% Federal poverty level 78.1 78.3 77.8 73.3

Race/ethnicity

White 69.3 65.4 70.6 64.4

Black 57.4 53.4 62.6 64.9

Dental problems in adults are equally problematic. According to the U.S. Surgeon39

most adults in

the U.S. show signs of periodontal or gingival diseases and severe periodontal disease affects 14

percent of adults (ages 45–54 years). However, a little less than two-thirds of adults report visiting

a dentist within the past 12 months, and those with incomes at or above the poverty level are twice

as likely to report a dental visit in the past 12 months as those below the poverty level. The

American Dental Association cited the major reason for not accessing regular oral health care is the

high cost of dental care. And the number of individuals who lack dental insurance is more than 2.5

times the number of those who lack medical insurance.

Effective health policies intended to expand access, improve quality, or contain costs must consider

the supply, distribution, preparation, and utilization of the workforce. According to the National

Health Service Corps, Texas needs 784 additional dentists to achieve the recommended ratio of one

dentist for every 3,000 residents. The overall supply of dentists in Texas has been consistently

below the national average of 59-60 dentists per 100,000 for many years.40

In 2006, Texas had 36.0

dentists per 100,000 and it has been declining since.

39

National Institute of Health. National Institute of Dental and Craniofacial Research. “Oral Health in America: A

Report of the Surgeon General. 2000. 40

State Department of Health & Human Services, Center for Health Statistics Health Professions Resource Center.

Publication No. 25-12581. E-Publication No. E25-12581. March 2007.

35 | P a g e

Summary of Community Needs

Identification Number

Brief Description of Community Needs Addressed in RHP Plan

Data Source for Identified Need

CN.1 Community Description – Demographics

US Census Data, DFW International Community Alliance Report, Communities Foundation of Texas Report

CN.2

Regional Healthcare Infrastructure and Patient Migration Patterns

DFWHC Foundation, Information Quality and Services Data Warehouse, Parkland Health and Hospital System

CN.3

Healthcare Capacity

Health Professions Resource Center, Center for Health Statistics, US Department of Health and Human Services; Children’s Medical Center Beyond ABC Report; Horizons (2012): The Dallas County Community Health Needs Assessment

CN.4

Primary Care and Pediatrics

Health Professions Resource Center, Center for Health Statistics, US Department of Health and Human Services, Children’s Medical Center Beyond ABC Report

CN.5

Behavioral Health

TriWest/Zia Partners Report, National Alliance on Mental Illness, DFWHC Foundation, Information Quality and Services Data Warehouse

CN.6

Behavioral Health and Primary Care

TriWest/Zia Partners Report, National Alliance on Mental Illness, DFWHC Foundation, Information Quality and Services Data Warehouse, Horizons: The Dallas County Community Health Needs Assessment

CN.7 Behavioral Health and Jail Population

Dallas County Criminal Justice Department, Parkland Health and Hospital System

CN.8

Specialty Care

DFWHC Foundation, Information and Quality Services Data Warehouse retrieved March 2012, Children’s Medical Center Beyond ABC Report, 2011 US Census Data, Thompson Reuters/Claritas Market Expert Extract prepared by Devin Hill, Baylor Health Care System, generated February 2012.

CN.9

Chronic Disease

DFWHC Foundation Information Quality and Services Data Warehouse, Diabetes in Dallas County Report, Children’s Medical Center Beyond ABC Report, Horizons: The Dallas County Community Health Needs Assessment

CN.10

Oral Health

US Department of Health and Human Services Healthy People 2010, Texas Department of State Health Services Oral Health Program, DSHS Primary Care Office

CN.11

Patient Safety and Quality DFWHC Foundation Information Quality and Services Data Warehouse, Institute of Medicine Report

CN.12 Emergency Department Usage and Readmissions

DFWHC Foundation Information Quality and Services Data Warehouse

CN.13 Palliative Care Barnato et al., Teno et al., Wennenberg et al.

36 | P a g e

References

1. TriWest Group, Zia Partners, and Dallas County Behavioral Health System Redesign Task Force. “Assessment

of the Community Behavioral Health Delivery System in Dallas County: Detailed Report.” Dallas, TX. September 30, 2010.

2. Dallas Fort Worth Hospital Council Foundation. Information and Quality Services (IQSC) Data Warehouse. Irving, TX. Retrieved, March 2012.

3. Dallas Fort Worth Hospital Council Foundation. Healthy North Texas: Community Health Website. www.healthyntexas.org. Irving, TX. Retrieved, March 2012.

4. Institute of Medicine. “For the Public’s Health: Investing in a Healthier Future.” Washington D.C., April 10, 2012

5. Parkland Health and Hospital System. 6. Public Health Institute. ”Best Practices for Community Health Needs Assessment and Implementation

Strategy Development: A Review of Scientific Methods, Current Practices, and Future Potential. Report of Proceedings from a Public Forum and Interview of Experts.” Atlanta, GA. July 11-13, 2011.

7. The Center for Health and Public Service Research, Robert F. Wagner Graduate School of Public Service. New York University. NYU ED Algorithm wagner.nyu.edu/chpsr/index.html?p=25. Retrieved, April 2012.

8. Doughty, P and Jones, J. Dallas Fort Worth Hospital Council Foundation. “Diabetes in Dallas County: Provider Report.” September, 2011.

9. North Texas Behavioral Health Authority. Data Book. www.ntbha.org/reports.aspx. Retrieved, April, 2012. 10. Communities Foundation of Texas. Assets and Opportunities Profile, North Texas.

http://www.cftexas.org/netcommunity/page.aspx?pid=953. February 16, 2012. 11. US Census Bureau. www.census.gov Retrieved April, 2012. 12. Pickens, S. Parkland Health and Hospital System. Charitable Clinics in North Texas: Presentation.

March 2012 13. Anderson, G.F. Medicare and chronic conditions. New England Journal of Medicine. 353(3): 305-209. 2005. 14. deVries E.N., Ramrattan M.A., Smorenburg, S.M., Gouma, D.J., Boermeester, M.A. The incidence and nature

of in-hospital adverse events: a systematic review. Quality and Safety in Healthcare. 2008. 17(30): 216-223. 15. Institute of Medicine. Living Well with Chronic Illness: A Call for Public Health Action.

Committee on Living Well with Chronic Disease: Public Health Action to Reduce Disability and Improve Functioning and Quality of Life. February 2012.

16. Children’s Medical Center. Beyond ABC: Assessing Children’s Health in Dallas County. 2011. 17. US Census Data. Thompson Reuters/Claritas Market Expert Extract. Prepared by Devin Hill, Baylor Health

Care System. Generated, February 2012. 18. DFW International Community Alliance. 2010 North Texas Progress Report. www.dfwinternational.org.

Retrieved, February 2012. 19. US Census Data. www.census.gov. Retrieved, March 2012. 20. National Alliance on Mental Illness. State Mental Health Cuts: The Continuing Crisis.

http://www.nami/org/Template.cf.?Section=state_budget_cuts_report. March 2011. 21. Parks J., Svedsen D. (eds). Morbidity and Mortality in People with Serious Mental Illness.

Alexandria, VA. The National Association of State Mental Health Program Directors, 2006. http://www.nasmhpd.org/general_files/publications/med_directors_pubs/Technical%20Report %20n%20Morbidity%20and%20Mortality%20-%20Final%2011-06.pfd

37 | P a g e

22. Reynolds, R.J, Shafer, A.B., and Becker, E.A. Mortality of Public Mental Health Clients treated at the Local Mental Health Authorities of Texas. Texas Public Health Association Journal. 2012. Apr 64(2):35-40.

23. JEN Associates. Beneficiary Risk Management: Prioritizing High Risk SMI Patients for Case Management/Coordination. February 2010. www.dhcs.ca.gov/progovpart/documents/high%20Priority%20SMI%20Application%20Exec%202 4Feb2010v2.pfd

24. Balfour, M.E., Van der Feltz-Cornelis C., Rosen L.A., Cline C.A., Moffic S. Highlighting High Utilizers: How can or systems better meet their needs? Institute on Psychiatric Services Annual Meeting. Workshop 3. San Francisco, CA. October 2011.

25. Balfour M.E. Homelessness, Criminal Justice, and the NorthSTAR Top 200. Report to the Dallas County Behavioral Health Leadership Team. February 2011. http://www.dallasbhlt.org/index.php?option=com_content&view=article&id=95

26. Value Options of Texas. 27. Edwards, J., Pickens, S., Schultz, L., Erickson, N., Dykstra, D. (2012). Horizons: The Dallas County Community

Health Needs Assessment. Dallas, TX: Dallas County Health and Human Services and Parkland Health and Hospital System.

28. Cook Children’s Center for Children’s Health Data Website. http://www.centerforchildrenshealth.org/en-us/Resources/Pages/Resources.aspx Accessed October 2012.

29. United Way Denton County. Assets and Needs Assessment Report for Denton County. August 2011. 41

38 | P a g e

Appendix B

Regional Healthcare Partnership Region 18 Community Needs Assessment

39 | P a g e

Section III. Community Needs Assessment

This section of the RHP-18 Plan provides information prescribed by HHSC. All data sources are

identified.

Geographic, Socio-Demographic and Economic Characteristics

The Regional Healthcare Partnership 18 (RHP-18) consists of three counties (Collin, Grayson and

Rockwall) in North Texas, geographically located directly north of Dallas County. In the southern borders

of Collin County metropolitan areas overlap with Dallas County. The overlap of city limits across county

lines is an important consideration for the RHP-18 plan.

According to the U.S. Census Bureau, there are an estimated 1,014,935 residents in RHP-18,

approximately 172,879 (17%) of whom are estimated to be uninsured. The Texas Department of State

Health Services (DSHS) Medicaid website reports that in 2012, 64,288 (6.3%) individuals in RHP-18

were enrolled in Medicaid, reflecting increases over 2011, of 10% in Collin, 3% in Grayson, and 2% in

Rockwall.

Collin and Rockwall counties are included in the Dallas-Fort Worth-Arlington Standard Metropolitan

Statistical Area (SMSA) as defined by the U.S. Census Bureau. Grayson County is part of the Sherman-

Denison SMSA. While none of these counties is classified as rural or small, large contiguous areas of

each county are considered remote when considering access to health care. The urban population density

in Collin County is 2,754 persons per square mile compared to Dallas' 3,401. Regarding rural populations,

in Grayson County, 43% of the population lives in rural areas as defined by the U.S. Census Bureau, in

Rockwall 16%, and in Collin, 5%. In Grayson County, the rural population density is 58 compared to

Collin's 71, and Rockwall's 141. As a comparison, Dallas County's rural density is about 90.

Healthcare providers have historically been located close to the urban sectors of RHP-18, particularly in

Collin County where eight acute care hospitals are located along the Southern-most border.

Health Status

Table 2 displays 18 indicators for the three counties in RHP-18 that we believe to be germane to this

community needs assessment, with comparison data for Texas and the Nation. The sources are noted

below the table.

While these high-level indicators influence the overall approach to the plan for expanding and

transforming Medicaid services, data reporting existing services and their utilization, population health

status and changes, are proxies for estimates of need. The qualitative analyses of these data combined

with the perspectives of the county government, the citizens, and the healthcare providers enable us to

pinpoint specific issues/needs that have been subsequently addressed by the performing providers as

parties to this plan. Thus this RHP-18 plan relied both on high level and local assessments to establish and

guide the projects, milestones, metrics and outcomes selected for the proposed 2011-16, Delivery System

Reform Incentive Payment (DSRIP) projects.

Each county in RHP-18 has distinguishing characteristics and some features in common. As shown in

Table 1, these communities have relatively healthy economies, and the communities are predominantly

comprised of White Non-Hispanic residents. The culture is continuously changing, however, and some

demographic features indicate important areas for attention. A distinguishing feature of Collin County for

example, is the presence of a large Asian population compared to the rest of Texas and the sizeable

40 | P a g e

proportion of individuals who speak a language other than English at home.

Increases in non-farm employment, retail sales, median and per capita income indicate economic growth

in Collin and Rockwall counties. Grayson County appears to have strong economic indicators, but faces a

growing elderly population, decreased employment, and limited access to primary medical care.

41 | P a g e

Table 1. RHP 18 County and State Indicators

Land area in square miles, 2010

COLLIN

841

GRAYSON

933

ROCKWALL

127

TEXAS

261,231.71

Persons per square mile, 2010 930 130 617 96

Population, 2011 estimate 812,226 121,419 81,290 25,674,681

Population change 4/1/10 - 7/1/11 4% 0.4% 4% 2%

Proportion of population enrolled in Medicaid 5% 13% 6% 13%

Persons under 18 years, percent, 2011

28%

24%

29%

27%

Persons under 18 enrolled in Medicaid 11% 28% 12% 32%

Persons 65 years and over, percent, 2011 8% 16% 10% 11%

Female persons, percent, 2011 51% 51% 51% 50%

Persons below poverty level, percent (2) 7% 14% 6% 17%

Percent population uninsured (ages 0 - 64) 17% 25% 19% 26%

Black

9%

6%

6%

12%

White 76% 89% 89% 81%

White non-Hispanic 62% 78% 73% 45%

Hispanic or Latino 15% 12% 17% 38%

Asian 12% 1% 3% 4%

Other racial ethnic groups 1.0% 2.0% 1.0% 1.0%

Foreign Born (2) 17% 6% 9% 16%

Over age 5: speak other language at home (2) 25% 10% 15% 34%

High school graduates over age 25 (2)

93%

85%

91%

80%

Bachelor's degree or higher over age 25 (2) 48% 19% 36% 26%

Veterans (2) 42,078 10,176 5,425 1,635,367

Housing units (3)

300,960

53,727

27,939

9,977,436

Households (2) 268,042 45,545 24,790 8,539,206

Per capita money in previous 12 months (2) $37,362 $23,242 $33,274 $24,870

Median household income (2) $80,504 $46,875 $78,032 $49,646

Private nonfarm employment change 2000-09 56% -4% 74% 11%

Retail sales per capita, 2007 $16,850 $13,493 $12,797 $13,061

(1) 2011 estimates

(2) Averages for five years 2006-10

(3) for 2010

42 | P a g e

Table 2 displays key health indicators for each RHP-18 county. These data were obtained for each county

at: http://www.countyhealthrankings.org/#app/texas/2012/measures/factors/9/map. Of particular note in

this table are the rates of low birth weight infants that are only slightly lower than the average for all

Texas counties, and higher than the national average. Also of note, RHP-18 counties overall have lower

proportions of uninsured residents than the State as a whole but higher than the national estimates.

Table 2. Health Outcomes and Health Facts (1)

Health Outcomes

Texas

Collin

1

Grayson

125

Rockwall

3

National

MORTALITY RANKING 2 138 3

Premature death 7,186 4,038 8,901 4,584 5,466

MORBIDITY RANKING 14 121 8

Poor or fair health 19% 11% 19% 6% 10%

Poor physical health days 3.6 2.7 3.7 2.9 2.6

Poor mental health days 3.3 2.5 5.8 3.1 2.3

Low birthweight 8.20% 7.60% 7.40% 7.00% 6%

Health Factors 2 54 4

HEALTH BEHAVIORS RANKING 1 52 5

Adult smoking 19% 11% 24% 8% 14%

Adult obesity 29% 25% 27% 27% 25%

Physical inactivity 25% 22% 27% 27% 21%

Excessive drinking 16% 13% 11% missing 8%

Motor vehicle crash death rate 17 9 25 11 12

Teen birth rate 63 24 63 26 22

CLINICAL CARE RANKING 2 45 17

Un insured 26% 17% 25% 19% 11%

Primary care physicians 1,050:1 681:1 1,305:1 1,080:1 631:1

Preventable hospital stays 73 66 73 82 49

Diabetic screening 81% 85% 83% 85% 89%

SOCIAL AND ECONOMIC

RANKING 3 81 5

Unemployment 8.20% 7.50% 8.40% 7.60% 5.40%

Children in poverty 26% 10% 21% 9% 13%

Children in single-parent households 32% 18% 33% 20% 20%

(2) University of Wisconsin Population Health Institute. County Health Rankings 2012. Accessible at

www.countyhealthrankings.org.

Diabetic screening is the percent of Medicaid patients with diabetes who receive recommended annual screening

43 | P a g e

Rates of chronic disease vary slightly by source. The sources we used indicate that prevalence rates in

RHP-18 for targeted conditions in this plan are equal to or lower than the State of Texas (%) for Asthma

(8.2%), Diabetes (9.7%), overweight/obesity (66.7%), and Cardiovascular Disease (8.2%). More than a

quarter of pregnant women in each county (28% in Collin, 42% in Grayson, and 31% in Rockwall) do not

receive prenatal care within the first trimester. Higher proportions of White, compared to Black and

Hispanic women, receive early prenatal care.

None of these counties has a public hospital. Local hospitals, public health departments, and publically funded clinics are the staples of the healthcare system in RHP-18. Table 3 displays total numbers from http://www.healthindicators.gov/ the Health Indicators Warehouse website, for hospital and personnel resources in RHP-18. Regarding public health departments, Collin and Grayson counties have full service public health departments. Rockwall County, however, has a different structure inasmuch as this county utilizes a city office of code enforcement and cooperates with the Dallas County Health Department for other public health related functions.

While none of these counties is a Health Professions Shortage Area or a Medically Underserved Area according to Federal criteria, there are pockets of severely limited access to primary and preventive care leading to potentially preventable hospital admissions (PPAs).

There are currently two Federally Qualified Health Clinics in RHP-18. Although it is difficult to pinpoint

precisely how many primary care physicians are available per/1,000 residents, and even more difficult to

document the number of physicians who accept Medicaid or uninsured persons (if any), the below table

reflects the best available data from the CDC, DSHS, and other few national websites that count

healthcare workers at the county level.

Table 3. Healthcare Resources

Hospital Resources Collin

Acute care hospitals 10

Grayson

3

Rockwall

2

Total RHP 18

15

Psychiatric care licensed beds 0 0 0 0

Healthcare Personnel

Direct Care Physicians 1,483 245 113 1,841

Primary Care Physicians 691 86 60 837

Physician Assistants and Nurse Practitioners 357 55 36 448

EMS Personnel Per 100,000 population 187 447 323 Not Available

http://www.dshs.state.tx.us/chs/hprc/tables/Emergency-Medical-Services-(EMS)-by-County-of-Residence---

September,-2011/

Collin ranked 223 for EMS personnel

Grayson ranked 53 for EMS personnel

Rockwall ranked 105 for EMS personnel

Texas ranks 42nd with 212/100,000 physicians

44 | P a g e

Key health challenges specific to region

Potentially Preventable Hospital Admissions and ED Utilization

Tables 4, 5 and 6 present each county’s data for each of the 10 conditions identified by DSHS as

Potentially Preventable Hospital Admissions (PPAs) in Texas over a five year period of time (2006-10).

We provide presented total admissions, average length of stay (ALOS), total charges in millions, average

charge, percent of uninsured admissions, and the zip codes representing approximately half of the total

admissions for that county per PPA. Some data were unavailable for Grayson and Rockwall counties

(shaded).

Collin County

Table 4 on the following page provides Collin County data. The county seat in Collin County is

McKinney. The median age in Collin County is 34, and 8% of residents are over age 65 (Table 1). Seven

percent of Collin County residents live in poverty. In FY 2009, Collin County reported $669,300 spent for

indigent health care

.

In Collin County, two zip code areas (75070 and 75069) contributed the largest number of admissions for

angina, bacterial pneumonia, congestive heart failure (CHF), dehydration, and hypertension. These factors

may suggest that outreach to nursing homes may be important. The top three highest average charges

were for pneumonia, CHF, and urinary tract infections (UTI), followed by chronic obstructive pulmonary

disease (COPD), long-term diabetes problems, and asthma. Potentially Preventable Admissions - Five Years: 2006 - 2010

Collin County

PPA Total (Per

Year)

ALOS*

Total

Charges

Ave. Charge

Percent

Uninsured

Combining Zip

Codes 2 50% **

070, 069, 098, 002,

Angina 183 (37) 1.9 $ 3.4 $ 18,366 6.0% other

Asthma

1796 (359)

4.6

$ 54.8

$ 30,501

13.7%

069, 287, 075, other

Bacterial

Pneumonia

5090 (1018)

5.6

$ 189.1

$ 37,157

6.5%

069,070, 002, other

Congestive

Heart Failure

4950 (990)

5.4

$ 182.5

$ 36,866

5.8%

069, 070, 023, other

COPD

2505 (410)

5.4

$ 87.6

$ 34,970

5.2%

069, 002, 098, other

070, 069, 023, 002,

Dehydration 1394 (279) 3.6 $ 28.9 $ 20,760 4.4% other

Diabetes - Short

Term

819 (164)

3.8

$ 22.4

$ 27,950

26.0%

287, 034, 069, 098,

023, other

Diabetes - Long

Term

1639 (328)

6.6

$ 69.3

$ 42,276

11.3%

069, 098, 025, 002,

other

069, 287, 070, 074,

Hypertension 1016 (203) 2.8 $ 23.1 $ 22,715 18.5% other

069, 075, 023, 074,

UTI 3643 (729) 4.4 $ 92.6 $ 25,418 7.5% 002, other

45 | P a g e

Grayson County

Table 5 provides Grayson County data. The county seat for Grayson County is Sherman, located near the

Oklahoma border. The median age is 40, and 16% of the residents are over age 65 (Table 1). Fourteen

percent of the population lives in poverty.

Potentially Preventable Admissions - Five Years: 2006 - 2010

Gr ayson County

PPA

Total (Per

Ye ar)

ALOS *

Total

Charges

Ave. Charge

Percent

Un ins ured

Combining Zip

Codes 2 50% **

Angina

Asthma

519 (104)

4.1

$ 9.7

$ 18,640

13.9%

020, 090, 092

Bacterial

Pneumonia

2322 (464)

5.3

$ 51.6

$ 22,229

5.1%

020, 090, 092

Congestive

Heart Failure

1982 (396)

5.3

$ 44.3

$ 22,341

3.9%

020, 090, 092

COPD

1624 (325)

4.7

$ 32.6

$ 20,066

4.4%

020, 090

Dehydration

646 (129)

3.9

$ 9.5

$ 14,630

3.4%

020, 090

Diabetes - Short

Term

306 (61)

3.8

$ 5.3

$ 17,242

22.5%

020, 090

Diabetes - Long

Term 662 (132) 5.8 $ 16.3 $ 24,653 7.3% 090, 020

Hypertension

351 (70)

2.9

$ 4.9

$ 14,002

12.8%

020, 090, 092

UTI

1331 (266)

4.6

$ 22.2

$ 16,670

4.9%

020, 090, 092

In FY 2009, Grayson County reported $1,711,234 spent for indigent health care.In Grayson County, two

zip code areas (75020 and 090) contributed the largest number of admissions. The highest charges over

this five-year period were for pneumonia, CHF, and COPD, followed by UTI and asthma. These data also

suggest follow up with nursing home residents may be important. No data were available for angina.

46 | P a g e

Rockwall County

Table 6 provides data for Rockwall County. The county seat for Rockwall County is Rockwall. The

median age is 36, and 10% of the population is over age 65. In Rockwall County, 6.4% of the residents

live in poverty (Table 1). In FY 2009, Rockwall County reported $197,026 spent for indigent health care.

The greatest proportion of admissions for pneumonia, CHF, COPD, and UTI came from zip code 75087.

PPAs with the highest charges were long-term complications of diabetes, pneumonia, and CHF. Data

were not available for angina, asthma, or hypertension.

In every county in RHP-18, the highest proportion of uninsured potentially preventable admissions

(PPAs) is diabetes for long-term problems. In Collin and Grayson, asthma and hypertension admissions

include a substantial proportion of uninsured events. Of note is the presence of a co-morbid psychiatric

condition in between 25% to 50% of these PPAs.

47 | P a g e

Other issues in PPAs and ED use in contiguous counties

Due to the close proximity and overlap between Collin and Dallas counties admissions to hospitals in

Dallas County are of importance in planning the healthcare system. Admissions to Parkland Memorial

Hospital (Parkland) for all RHP-18 counties are important, and admissions to all local RHP-18 hospitals

are also critical data for planning.

Table 7 provides PPAs to hospitals located in Dallas County for Collin County residents for the past 15

months, by the total number of admissions, and the proportion of private insurance, public insurance, and

uninsured events. Dallas County has a health and behavioral health care system of immense resources for

Medicaid and uninsured populations, compared to RHP-18. Thus, it is an important aspect of the system

when considering healthcare needs in RHP-18, in that patient flow to resources outside of RHP-18

provide an important opportunity to recognize limited or underdeveloped resources in these three counties

that if expanded would reduce the burden on hospitals in Dallas particularly Parkland Memorial Hospital

as the only major public hospital a large geographic area. RHP-18 also relies on private healthcare

facilities in Dallas County for behavioral health emergencies.

Table 7. Collin County PPA to All Dallas County Hospitals January 2011- march 2012

Diabe te s Diabe te s Angina

Payme nt Short Long

Conge stive Bacte rial De hydration

Source Te rm Te rm

He art Failure Pne umonia

Hype rte nsion

tr

(Not

e ate d)

Adult

Asthma

UTI COP

D

Totals

Totals 126 83 168 252 72 48 6 33 164 91 1043

Insure d 71% 43% 38% 48% 58% 52% 50% 55% 38% 43% 48%

&

Me dicare

13%

48%

55%

47%

35%

31%

17%

30%

56%

53%

44%

Uninsure d 17% 8% 8% 4% 7% 17% 33% 15% 5% 4% 8%

Tables 8 and 9 on the following pages provide information about the admissions from RHP-18 to all

hospitals in these three counties and to Dallas County hospitals, combined, and admissions to Parkland

Memorial Hospital. Interestingly, as shown in Table 8 and its accompanying graph, admissions were

lower for Medicaid patients in 2010 compared to 2009, but higher for uninsured patients in 2010

compared to 2009. It is unclear if this is a trend or an anomaly.

In the first quarter of 2012 there were 14,035 Emergency Department (ED) visits reported for uninsured

residents of RHP-18 to hospitals in RHP-18 and Dallas County hospitals combined (18.7% of all events),

an increase of 15% over the previous year. Reported Medicaid and Medicare covered ED visits were

22,891, an increase of 23% over the same quarter in 2011. We also know from available data that an

estimated 25% of these events are for individuals who are released without needing inpatient care.

Between January 2011 and April 2012, Parkland Memorial Hospital (Parkland) discharged 577 uninsured

admissions back to RHP-18, 4.3% of which were for PPAs. These individuals represent a population that

will have access to expanded primary care services under the DSRIP projects proposed in this plan.

48 | P a g e

T able 8: RHP 18 A dm issions to A ll Hospitals

Medicaid

2008

Medicaid

2009

Medicaid

2010

Uninsu red

2008

Uninsu red

2009

Uninsu red

2010

6,085 8,643 7 ,408 4,537 5,022 5,1 00

2,67 7 2,7 91 3,020 1 ,050 1 ,17 0 1 ,239

668 839 7 85 468 421 451

9,430 12,27 3 11 ,213 6,055 6,61 3 6,7 90

As shown in Table 9 and its accompanying

graph above, RHP-18 admissions to Parkland

Memorial have decreased in the total number of

uninsured events. This may be a function of patient

transfers among hospitals in the general

metropolitan area or increasing enrollment in

Medicaid

Data in tables 7, 8 and 9 were obtained by request,

from the Dallas-Fort Worth Hospital Council

Foundation.

The needs in RHP-18 regarding PPAs and ED

visits are at the heart of our plan to expand

primary care access and implement innovative

community interventions.

49 | P a g e

Children's Health

Compared to 2009, the number of children of Hispanic ethnicity is on the rise in Collin and Grayson

counties and on the decline in Rockwall. In addition, there are increases in the number of Black children in

all three counties. The Black population nearly doubled in Collin, and there were decreasing numbers of

White non-Hispanic children in Collin and Rockwall counties. The infant mortality rate was 5.2 per 1,000

in Collin, 5.7 in Grayson, and 3.0 in Rockwall.

In Collin County, an estimated 26,798 children are uninsured, 8,039 of whom live in households earning

200% or less of the Federal Poverty Level (FPL). Grayson and Rockwall counties have 5,380 (1,264 ::

200% FPL) and 3,514 (1,118 :S 200% FPL) in that status, respectively. In 2011, rates of confirmed victims of

child abuse per 1,000 were 5.4 in Collin, 10.2 in Grayson, and 3.3 in Rockwall counties.

Of the 14,035 reported uninsured ED events for RHP-18, 14.7% were for children under age 15. PPAs for

children tend to involve asthma or respiratory illnesses and accidents. National statistics suggest that 1 out of

7 pre-school age children in low-income families is obese, and 17% of children age 2 to 19. White

Hispanic boys, and Black, non-Hispanic girls are at higher risk for obesity than other race and ethnic

groups.

Statistics for 2008 reflect that in Collin County, ~8% of all births were considered low birth weight

babies, in Grayson County, 7%, and in Rockwall County 8.2%. Race, ethnicity, poverty, chronic diseases,

health problems, and low birth weight babies are all factors associated with the need for expanded access to

primary care for children.

A generally accepted national risk estimate for youth needing mental health and chemical dependency

treatment is 9%. Youth are typically underserved because they do not come to the attention of schools or

families without a precipitating event usually violent. Many youth enter the public mental health system

though the juvenile justice system. Family courts need more resources for referrals for troubled youth and

families ordered for evaluation and possible counseling to avoid the child being removed from the home and

placed in supervised living or foster care

Behavioral Health

The greatest three needs in behavioral health (mental health and chemical dependency) are increased

access to care, targeted resources to prevent relapse/re-hospitalization/higher cost care, and expanded

diversity of evidence-based services such as jail diversion/mental health courts, peer-counseling, and

integrated physical/behavioral care. Crisis response systems are limited, and access to public inpatient

care is primarily on an emergency basis primarily utilizing local law enforcement and Dallas County

based programs for homeless and crisis services. Estimates are that over half of the persons in community

based behavioral healthcare programs are uninsured.

Collin and Rockwall counties participate in the NorthSTAR Behavioral Health System operated by Value

Options, a private for-profit insurance corporation (3,793 persons received services in the third quarter of

2012). LifePath Systems serves Collin County, and Rockwall County residents are served by Lakes

Regional MHMR Center that also serves fourteen other counties in North Texas. Individuals who need

behavioral health services in the NorthSTAR area must meet the same clinical criteria used statewide but

must also document stricter financial eligibility to gain access to care.

Under the principle of open access, Collin and Rockwall County residents have equal access to care

50 | P a g e

throughout the geopolitical area covered by NorthSTAR. Collin and Rockwall County residents,

particularly those in proximity to Dallas, can acquire behavioral health services anywhere in the seven

counties by choice or as a consequence of insufficient locally available services. According to the DSHS

“NorthSTAR Data Book: Summary Information on County Trends, FY06-FY11”, the NorthSTAR system

spends less than one-half of the per client amount spent in the rest of Texas. NorthSTAR’s open access

also has had an unintended consequence of certain services, such as jail diversion, veterans’ services,

mobile crisis, supported housing, and after hours clinics being centralized in Dallas County rather than

distributed more evenly in Collin and Rockwall counties.

Two major shifts in the NorthSTAR system for behavioral health occurred in 2010. Outpatient providers’

contract became a flat-rate contract resulting in limited access for new mental health clients with consequent

referrals of some residents to other NorthSTAR providers in Dallas. In September of 2009, Value

Options eliminated Supportive Outpatient Therapy for substance abuse treatment, requiring these

consumers to meet the higher level of care criteria of Intensive Outpatient Treatment to access care.

Collin County has been perceived traditionally by the NorthSTAR system as having less demand for

behavioral health services than its largest contiguous county, Dallas. Collin County’s behavioral health

services needs however, are apparent from the direct and synthetic estimates of need and in the historical

patterns of services utilization by Collin County residents documented in a published 2010 report. While

the population in Collin County has grown 59% over the past 10 years, LifePath Systems has not

expanded its capacity, and due to funding cuts has been forced to reduce services available by almost 50%

from the baseline of 1999.

According to a study conducted by The Strategic Planning and Population Medicine Department of the

Parkland Health & Hospital System, titled “Collin County Community Checkup 2008”, the arrest rate for all

drug offenses increased from 180.1 per 100,000 persons in 2002 to 276.1 in 2006. Substance abuse (SA)

related death rates increased from 33 per 100,000 persons in 2000 to 33.6 in 2004. These statistics reflect

the increasing need for qualified chemical dependency provider, and the importance of early

intervention services to prevent criminal justice involvement and SA related deaths.

http://www.dfwhc.org/documents/CollinCountyCommunityCheckup2008_000.pdf. Rockwall County has

identified a critical need to improve jail diversion services. Family services to improve early intervention

with juveniles to prevent criminal activities is also a critical need.

A large population not getting access to treatment is the working-poor not eligible for state-funded

services, but unable to actually pay the full cost of behavioral health services. According to a 2012

Substance Abuse and Mental Health Services Administration (SAMHSA) approximately 20% of the

population met the criteria for “Any Mental Illness” during a 12 month period, resulting in an estimated

155,685 Collin County individuals each year that should be receiving behavioral health services.

http://www.samhsa.gov/data/NSDUH/2k12Findings/CBHSQDataReviewC2MentalHealth2012.htm

Physical and Behavioral Health services are also often not available or available in a timely manner to

individuals with Intellectual and Developmental Disabilities (DD).Individuals with DD meet with access

obstacles or long waiting periods for appointments, as there are too few providers who accept Medicaid.

Few providers are experienced or trained in treating DD individuals with co-morbid psychiatric disorders.

RHP 18 has an estimated 2011 population of 1,014,935 (Census quick facts). The Center for Disease

Control (CDC) estimated in 2012 that 1 in 88 individuals has an autism spectrum disorder (ASD). Studies

also show that somewhere between one and 3 percent of Americans have DD. Thus approximately 20,289

51 | P a g e

individuals in RHP-18 may have DD. Using the CDC estimate, 11,533 individuals would have ASD.

Approximately 55% of individuals with ASD also have an IQ under 70 (~6,343 individuals). People with

ASD are at much higher risk (75%) of developing mental illness than people with IDD. People with IDD

are estimated to experience mental illness at a rate of 33%. (Quintero and Flick, 2010)

Lakes Regional MHMR serves Rockwall County, as part of the NorthSTAR service system. Evidence

suggests that an area of need is to expand access to services to segments of the community who have

heretofore had limited access to care.

Texoma Community Center serves Grayson County. Evidence suggests that an area of need is to expand

access to services to segments of the community that have heretofore had limited access to care.

Projected major changes in demographics, insurance coverage, and healthcare infrastructure expected to

occur during the waiver period of FFY 2012 – FFY 2016

In the next five years, RHP-18 will increase in population at a rate of approximately 5.5% per year.

Growth overall in RHP-18 is expected to be 25% over the 2010 census by the year 2020. The proportion

of uninsured adults and children with household incomes :: 200% of FPL is likely to increase. There is a

gap (100% vs. 200%) between the poverty eligibility criteria in RHP-18 counties and other healthcare

systems.

The multi-cultural demographic character of the three counties will continue to become more complex. So

much about the health of a community depends on the choices its citizens make and the values upheld by its

community organizations, public and private. Economic conditions that drive health consumer choices will

need to change to redirect health services utilization patterns away from higher-cost emergent care

systems to lower cost effective and sustaining community support systems including health education,

prevention, and long-term engagement with the healthcare consumer.

Local private and public providers need to become as easy to access as the ED, if we are going to

influence healthcare consumer choices. Medical home models must provide wrap-around continuity of

care programs for at-risk patients with co-morbid physical and mental challenges. Local clinics and

hospitals must develop community-centered partnerships with efficient targeted patient registries, referral

procedures, and follow up services to effectively engage families in a wellness model versus an illness

model of care.

The DSRIP projects proposed by hospitals and community services providers are directed at these types of

systems changes.

The suicide rate in Grayson County is ~15/100,000 compared to 8.5 for Collin, 10 for Dallas, and 13.8 for

Rockwall counties. Counties contiguous with Grayson County have suicide rates similar to those in

Grayson County. Evidence points to the need for expanded services and increased rapid access to care as

well as continuity of information for patients across county borders. One way to do this in more rural

areas is to enhance technical capabilities through telemedicine archiving and transmitting capabilities,

increasing the number of providers with more flexible policies regarding eligible populations, addressing

substance abuse, and ensuring services for co-morbid medical and behavioral health conditions.

Summary

RHP-18 subscribes collectively to the principles recommended by the Population Health Institute in the

annual national health outcomes and health factors report. These are that healthy communities depend on

52 | P a g e

and are derived from community members working together to assess needs and resources, focus on

issues deemed by consensus to be the most important, and create effective policies and programs to

favorably impact population health.

In addition to the community needs identified through national, state and local sources, RHP-18 also is

attending to six of the 12 health indicators identified by the U.S. Center for Disease Control in Healthy

People 2020. These six indicators have emerged as important areas of need in the planning process for the

Texas Healthcare Transformation and Quality Improvement Program in Collin, Grayson, and Rockwall

counties of Texas.

• Access to health services

• Clinical preventive services

• Injury and violence

• Maternal, Infant, and Child Health

• Nutrition, Physical Activity and Obesity

• Social Determinants of medical and behavioral health problems

Table 10 on the following page provides the list of 14 broadly defined community needs (CN) per HHSC

protocol to which providers have linked DSRIP projects.

Table 10.

Identification

Number

Brief Description of

Community Needs Addressed

through RHP Plan

Data Source for Identified Needs

CN.1

Primary care - adults

Request for PPA Data -DSHS Warehouse CN.2

Primary care - children

Texas Department of State Health Services web

site selected data:

http://www.dshs.state.tx.us/wellness/data.shtm CN.3

Prenatal care

Texas Department of State Health Services web

site selected data:

http://www.dshs.state.tx.us/wellness/data.shtm

CN.4

Urgent and Emergency care

ED data DFW Hospital Council Foundation CN.5

Co-morbid medical and

behavioral health conditions - all

ages

DSHS data request; NorthSTAR Dashboard

CN.6

Health professions shortage Federal Government Health Indicators

Warehouse website

CN.7

Preventable acute care admissions

Data request to DSHS

CN.8

Diabetes

DSHS PPA Data

53 | P a g e

CN.9

Cardiovascular Disease

2009 Texas Behavioral Risk Factors Surveillance

System, Center for Health Statistics, Department

of State Health Services. Available online at:

http://www.dshs.state.tx.us/chs/brfss/query/brfss_

form.shtm.

CN.10 Elderly at home, and Nursing

Home patients

Extrapolated from DSHS PPA data

CN.11 Behavioral Health - all

components - all ages

DSHS data website; Previously conducted studies

and needs assessments available publicly

CN.12

Other special populations at-risk

DSHS data and surveillance reports

CN.13

Communicable Disease

Center for Disease Control

CN.14 Obesity and its co-morbid risk

factors

http://www.window.state.tx.us/specialrpt/obesity

cost/epidemic.php


Recommended