32
July 2010 From “V” to “U” Benjamin Tal
| Date post: | 21-Dec-2015 |
| Category: |
Documents |
| View: | 216 times |
| Download: | 0 times |

July 2010
From “V” to “U”
Benjamin Tal

| 2
Impact of US Stimulus Package and Inventory Changes on US GDP Growth
-2
-10
1
23
4
5
67
8
09Q:2
09Q:3
09Q:4
10Q:1
10Q:2
10Q:3
10Q:4
11Q:1
11Q:2
11Q:3
11Q:4
fiscal stimulus inventories
Forecast
impact on quarterly growth (%-pts)

| 3
US Core CPI Slowest in Half Century
-4
0
4
8
12
16
J an-62 J an-70 J an-78 J an-86 J an-94 J an-02 J an-10
(five-month % chg, s.a. annualized)
| 4
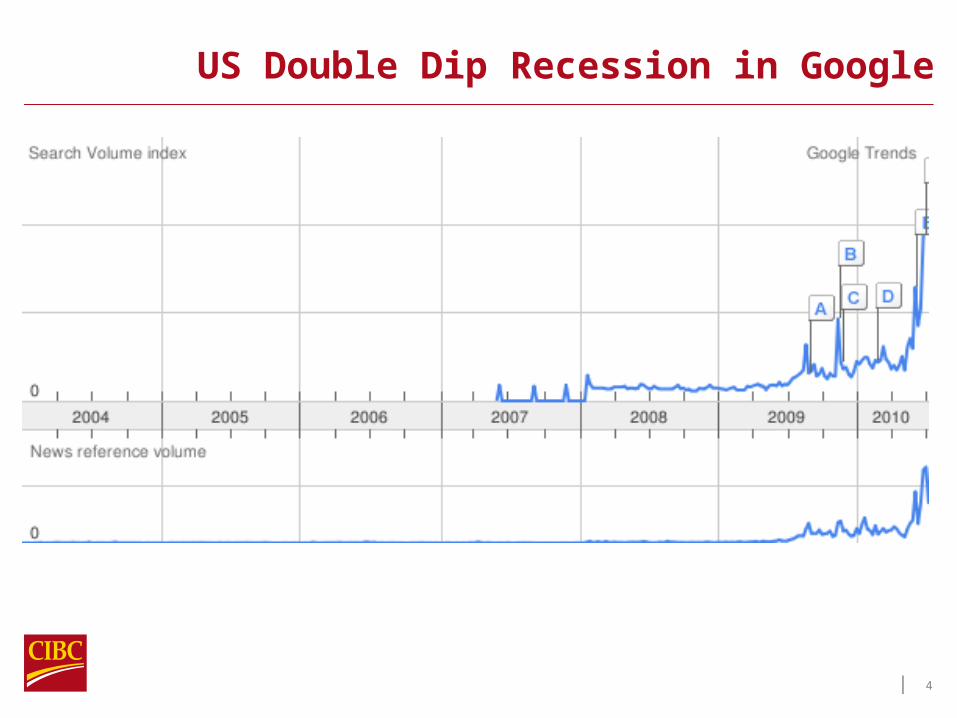
US Double Dip Recession in Google

| 5
Probability of Recession
0
0.10.2
0.3
0.40.5
0.6
0.70.8
0.9Ja
n-6
9Ja
n-7
1Ja
n-7
3Ja
n-7
5Ja
n-7
7Ja
n-7
9Ja
n-8
1Ja
n-8
3Ja
n-8
5Ja
n-8
7Ja
n-8
9Ja
n-9
1Ja
n-9
3Ja
n-9
5Ja
n-9
7Ja
n-9
9Ja
n-0
1Ja
n-0
3Ja
n-0
5Ja
n-0
7Ja
n-0
9
| 6
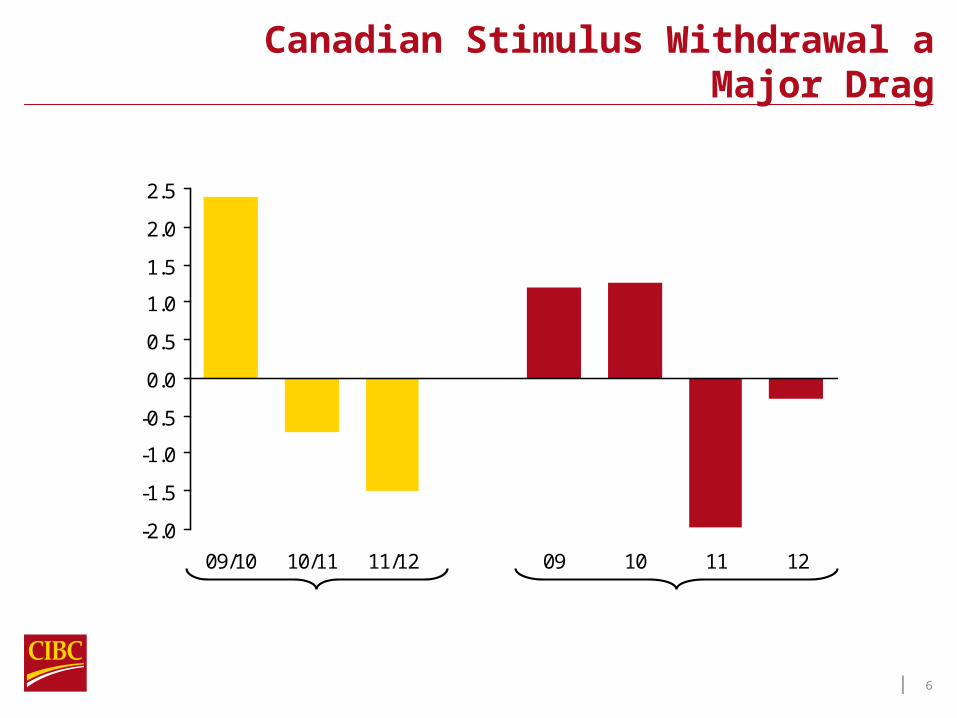
Canadian Stimulus Withdrawal aMajor Drag
-2.0
-1.5
-1.0
-0.5
0.0
0.5
1.0
1.5
2.0
2.5
09/10 10/11 11/12 09 10 11 12
Fiscal Yr (Accrual Basis) Calendar Yr (Cash Basis)
Chg in Fed-Prov Fiscal Stimulus, % of GDP

| 7
OIS Implied BoC Expectations
0%
20%
40%
60%
80%
100%
1st FAD 2nd FAD 3rd FAD 4th FAD
May 31st J uly 13thMarket Snapshot as of:
Prob of 25 bps Hike

| 8
Hikes Will Still Leave Rates Lowby Historical Standards
0
1
2
3
4
5
6
May- 05 Mar- 06 J an- 07 Nov- 07 Sep- 08 J ul- 09 May- 10 Mar- 11
%
Cdn overnight rate
10- yr USTForecast
10-yr Cda
Dec 2011

| 9
Stability Fund Covers Refinancing
0
100
200
300
400
500
600
700
800
Debt refinancing J un10-Dec11
Stability Fund
€ billion
Spain
Greece
PortugalI reland
IMF
EU

| 10
Size of Fiscal Cuts Needed to Stabilize Net Debt-to-GDP Ratio
% of GDP
0
2
4
6
8
10
12
14
J apan UnitedStates
UK Greece Italy Germany Canada AdvancedG- 20
Economies
| 11
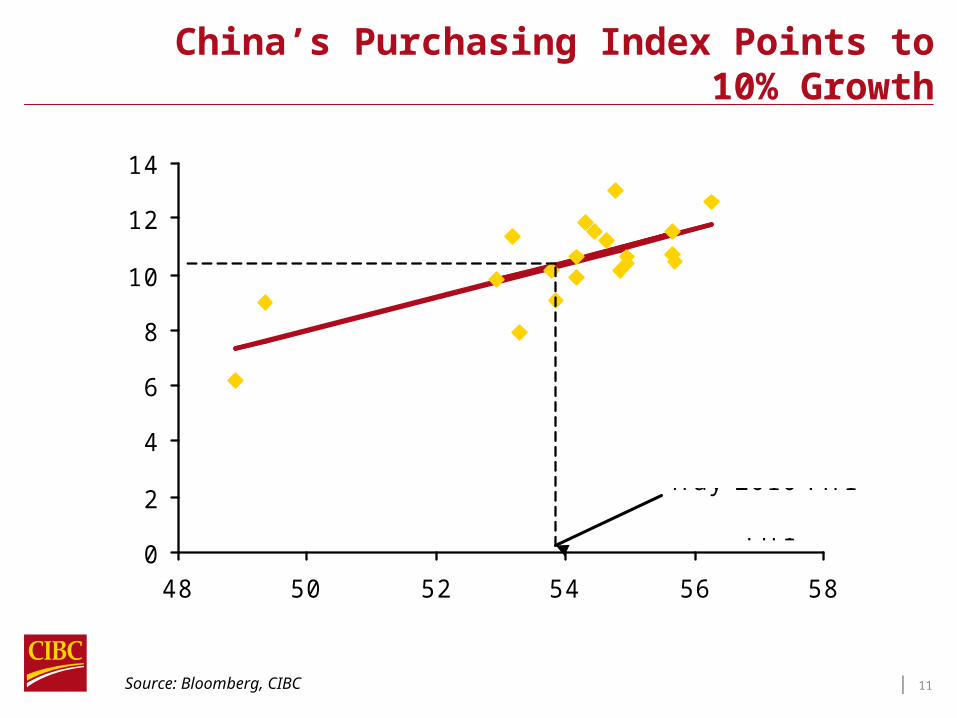
China’s Purchasing Index Points to 10% Growth
0
2
4
6
8
10
12
14
48 50 52 54 56 58
GDP y/y growth (% )
PMI
May 2010 PMI
Source: Bloomberg, CIBC

| 12
Chinese Stocks Don’t Always Reflect Economy
1,000
1,200
1,400
1,600
1,800
2,000
2,200
2,400
00:Q1 01:Q3 03:Q1 04:Q34
5
6
7
8
9
10
11
Shanghai C omposite (LHS)
Real GDP, y/y % chng (RHS)
Source: Bloomberg, CIBC
| 13
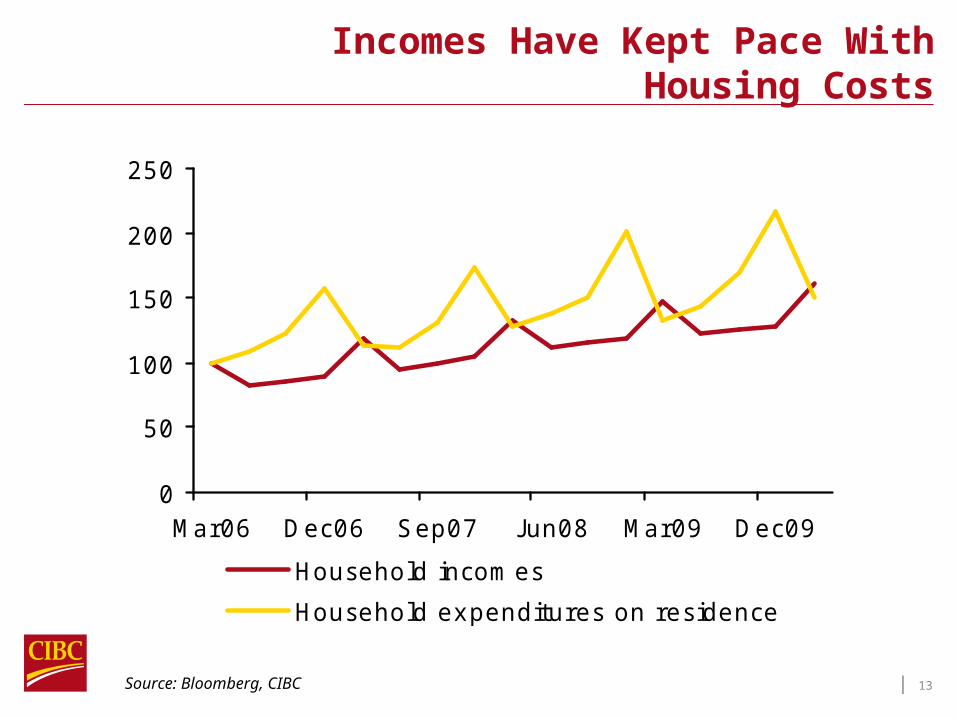
Incomes Have Kept Pace With Housing Costs
Source: Bloomberg, CIBC
0
50
100
150
200
250
Mar06 Dec06 Sep07 J un08 Mar09 Dec09
Household incomes
Household expenditures on residence
I ndex=100 in March 2006
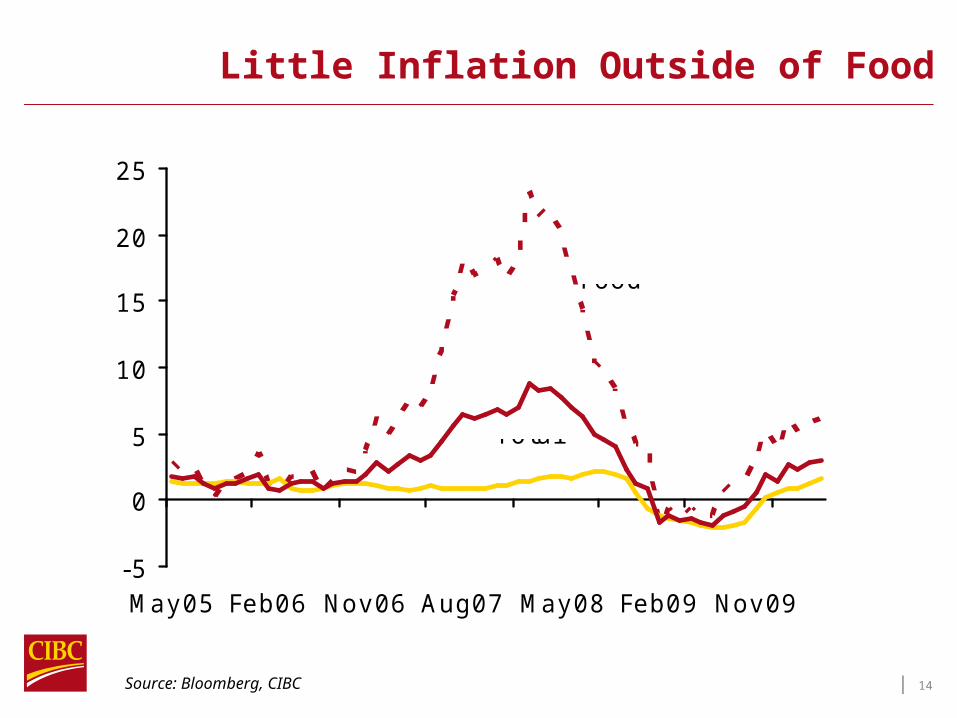
| 14
Little Inflation Outside of Food
Source: Bloomberg, CIBC
-5
0
5
10
15
20
25
May05 Feb06 Nov06 Aug07 May08 Feb09 Nov09
Food
Non-Food
Total
y/y % chg. in C PI

| 15
Canadian Dollar Rich Relative to Commodities
300
400
500
600
700
800
900
1000
Jan-08 May-08 Sep-08 Jan-09 May-09 Sep-09 Jan-10 May-10
0.90
0.95
1.00
1.05
1.10
1.15
1.20
1.25
1.30
BoC Commodity Price I ndex (L) Canadian Dollar (R)
C$ per US$ (reverse scale)
Index, 1972 =100

| 16
Fixed Income Inflows Driving C$ Appreciation: C$ to Average Near Parity Through 2011
-10
-5
0
5
10
15
20
25
Dec-04 Dec-05 Dec-06 Dec-07 Dec-08 Dec-09
75
80
85
90
95
100
105
Net Purchases of C$ Bonds (L) Canadian Dollar (R)
$billions (3mn Total) US¢/C$
n/a

| 17
Global Economy to Slow in the Second Half
0
2
4
6
8
10
12
US Eurozone C hina
1H10F 2H10F
annualized q/q real GDP growth, %
Source: CIBC

| 18
Analysts’ Track Record in PredictingS&P 500 Earnings
0
20
40
60
80
100
120
140
90 91 92 93 94 95 96 97 98 99 00 01 02 03 04 05 06 07 08 09
08
09
Index-adjusted
Note: Line shows evolution of "bottom-up" consensus reported by Thomson Reuters over time. Last obs is actual for year.
Source: Thomson Reuters, CIBC

| 19
US Earnings Growth Expectations Have Been Ratcheted Up More Aggressively Than in
Canada
Source: Thomson Reuters, CIBC
15
20
25
30
35
40
J an-09
Mar-09
May-09
J ul-09
Sep-09
Nov-09
J an-10
Mar-10
May-10
TSX C omposite S&P 500
Date of Analysts' Survey
concensus expectations for 2010 earnings growth (% )

| 20
Capital Intensive IndustriesBehind Manufacturing Rebound
Source: US Bureau of Economic Analysis, CIBC
* Thousand US$ per worker (2004)
-15 -10 -5 0 5 10 15
Semiconductors
C hemical
Primary metal
PaperC omputer &
electronicWood
TextilesApparel &
leatherPrinting
Furniture
Avgcapital intensity* = $53.3
Avgcapital
intensity* = $210
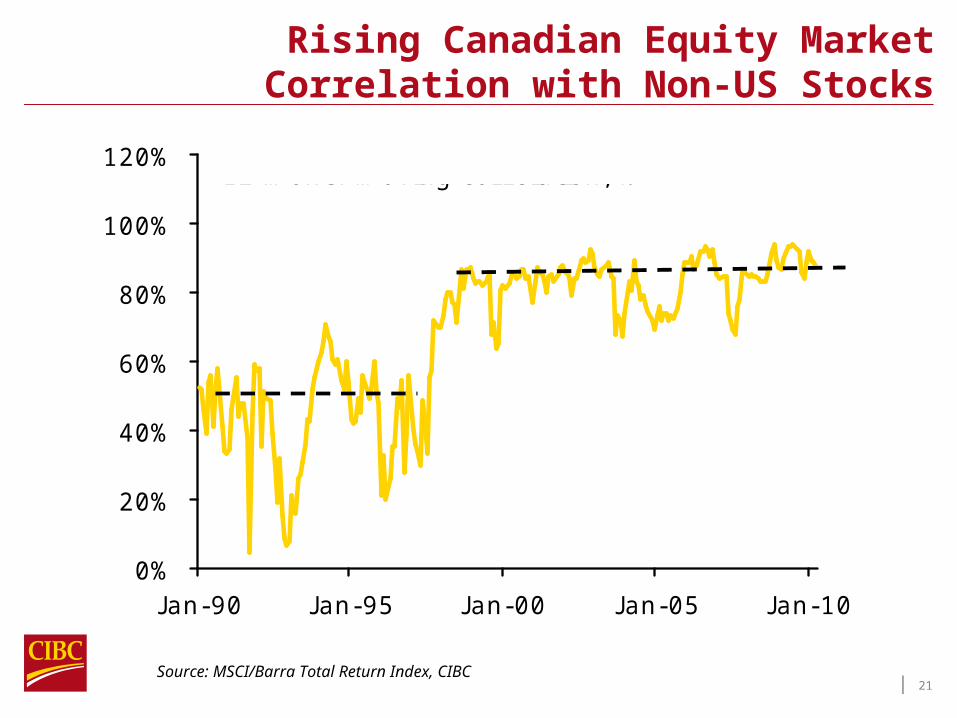
| 21
Rising Canadian Equity Market Correlation with Non-US Stocks
Source: MSCI/Barra Total Return Index, CIBC
0%
20%
40%
60%
80%
100%
120%
J an-90 J an-95 J an-00 J an-05 J an-10
12 month moving correlation, %
(44% avg)
(83% avg)

| 22
Canadian Equities More Correlated with Global Stocks in Bad Times
Source: MSCI/Barra Total Return Index, CIBC
Correlation - World vs. Canada
0%10%20%30%40%50%60%70%80%
World Total Return 1std deviation or more
above average
World Total Return 1std deviation or more
below average

| 23
Correlation of TSX Sector Returns to World Equities During Periods of Global Underperformance*
Source: MSCI/Barra Total Return Index, CIBC
0% 20% 40% 60% 80%
FinancialsI ndustrials
MaterialsC ons. Disc.
EnergyUtility
I nfo TechC ons. S tp.
HealthTelcomm
* MSC I World Total Return 1 std deviation or more
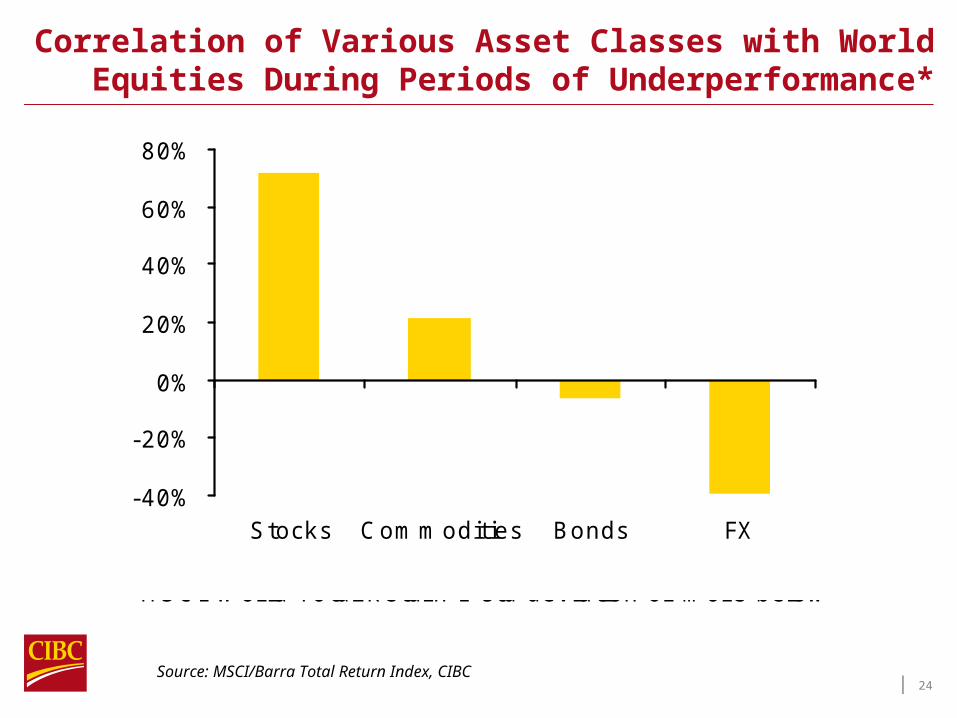
| 24
Correlation of Various Asset Classes with World Equities During Periods of Underperformance*
Source: MSCI/Barra Total Return Index, CIBC
-40%
-20%
0%
20%
40%
60%
80%
Stocks C ommodities Bonds FX
* MSC I World Total Return 1 std deviation or more below

| 25
Exposure of Exporting Nations to the Eurozone
0 10 20 30 40 50 60
C anada
Korea
J apan
I ndia
US
C hina
Brazil
Russia
UK
% of total exports going to Eurozone in 2009
Source: EuroStat, CIBC

| 26
Canada’s Government Debt Burdenthe Least Onerous
Note: Based on IMF projections
0
50
100
150
200
250
Net
Gross
2010 general govt debt- to-GDP ratio, %
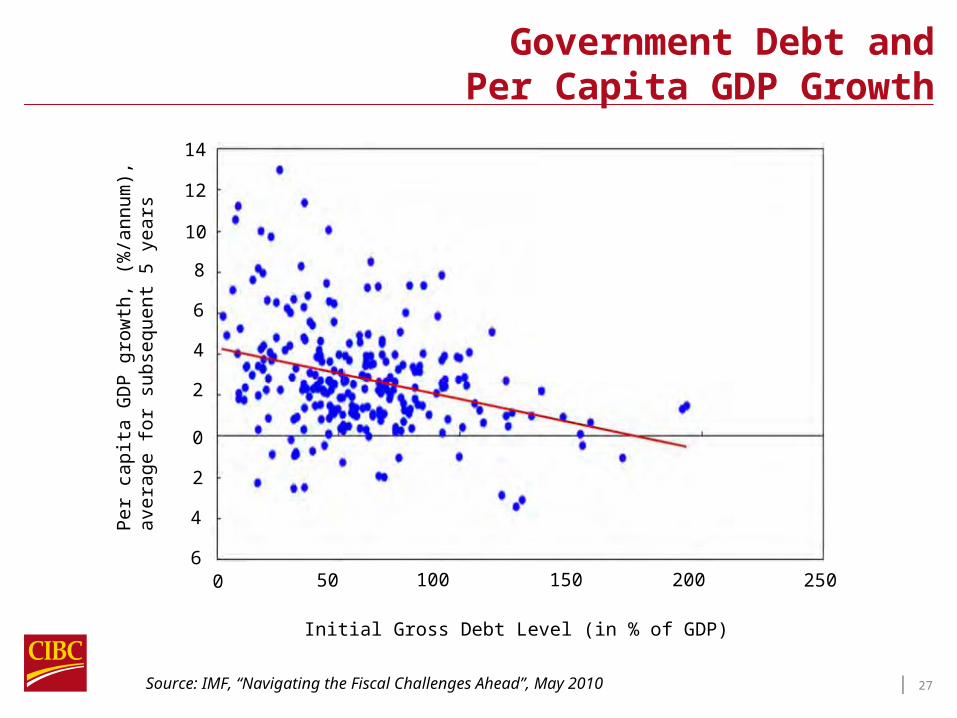
| 27
Government Debt and Per Capita GDP Growth
Source: IMF, “Navigating the Fiscal Challenges Ahead”, May 2010
0 50 100 150 200 250
14
12
10
8
6
4
2
0
2
4
6
Per
capit
a G
DP g
row
th, (%
/ann
um
),
avera
ge f
or
subse
quent
5 y
ears
Initial Gross Debt Level (in % of GDP)
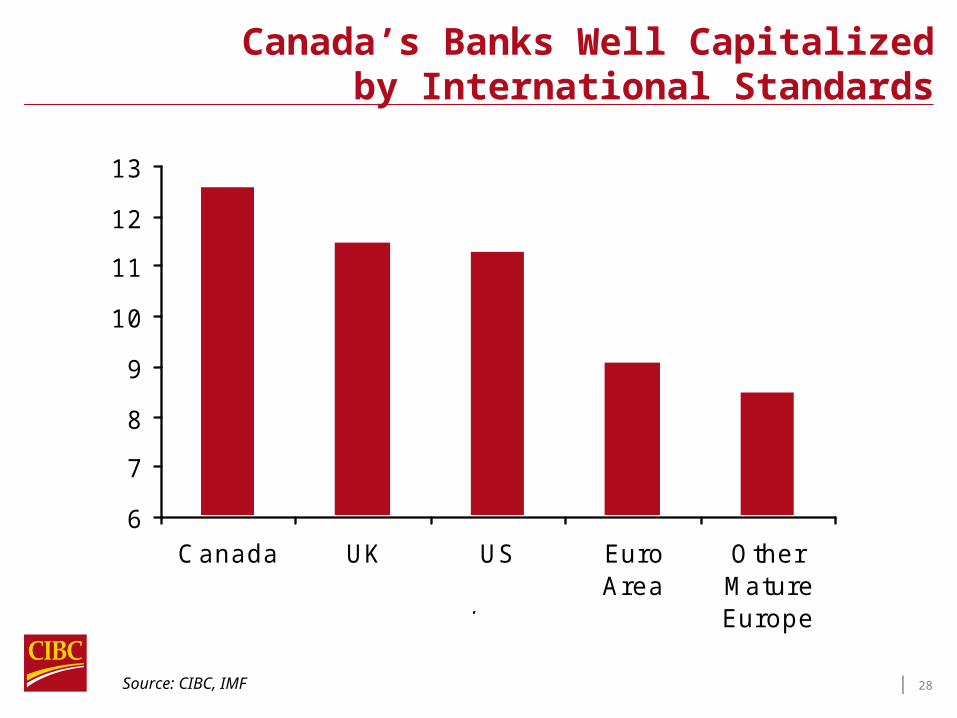
| 28
Canada’s Banks Well Capitalizedby International Standards
Source: CIBC, IMF
6
7
8
9
10
11
12
13
C anada UK US EuroArea
OtherMatureEurope
Average Tier 1 C apital Ratio, %
Source: CIBC WM, IMF

| 29
Projected Growth in Economically Active Population, 2010-2015
Source: International Labour Organization
-4
-3
-2
-1
0
1
2
3
4
5
C anada UnitedStates
WesternEurope
J apan
%
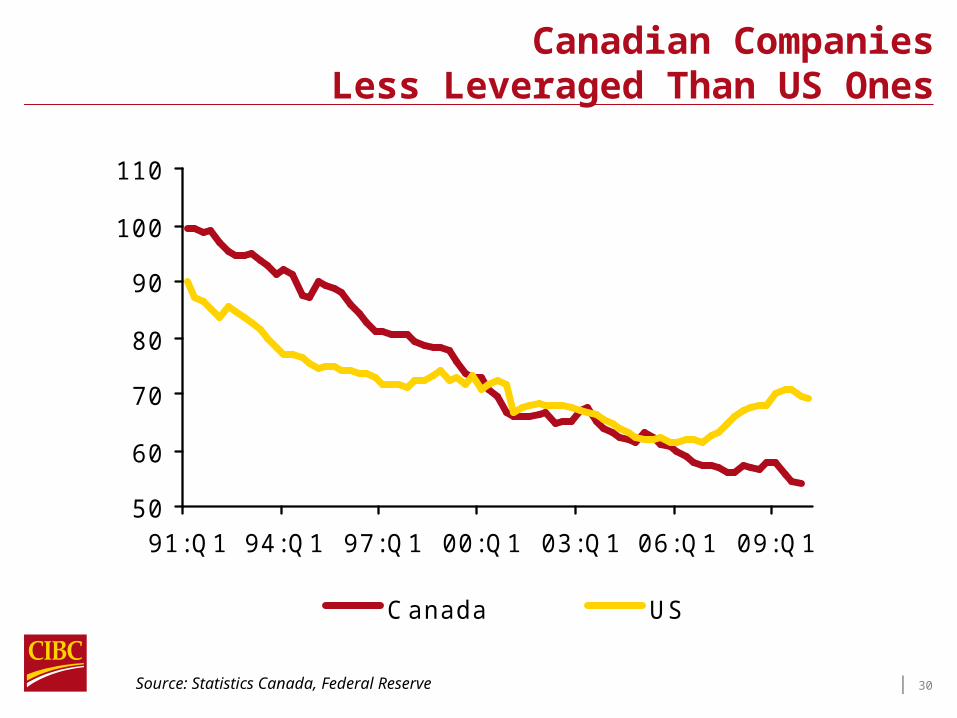
| 30
Canadian Companies Less Leveraged Than US Ones
50
60
70
80
90
100
110
91:Q1 94:Q1 97:Q1 00:Q1 03:Q1 06:Q1 09:Q1
C anada US
Debt-to-Equity Ratio ex financials, %
09:Q4
Source: Statistics Canada, Federal Reserve

| 31
Thank You
This material was prepared for investment professionals only and is not for public distribution. It is for informational purposes only and is not intended to convey investment, legal, or tax advice. The material and/or its contents may not be reproduced without the express written consent of Renaissance Investments.

| 32
Questions &
Answers


