62
July 31, 2017

July 31, 2017

1
July 31, 2017
Dear Friends,
The rally of hope is upon us. In such rallies, the upbeat momentum over takes disciplined behaviour. More and
more investors see their direct investments outperforming well-established benchmarks and funds. At that, the
spike in gains from IPOs and from low float counters is begins to rise. Thus, the chase for higher and faster returns
makes investors scurry for riskier assets which leads them into the penny stocks segment. This makes the investors
lose focus on potential risks. Till the going is good, retail investors are blocked from buying due to constant upper
circuits. But when the market turns, the retail investors are locked in at lower circuits.
Kotak Bank), you would have made tons of money on listing.But if you had purchased at around that time post listing, you needed to wait for
years (till 2004) to see the return on a sustainable basis on your holding.
In the present market where sentiment has pushed up the prices into the fair value plus zone, the rally is being driven by hope rather than greed
for most part of the market. At the current levels, some pockets of value remain, especially in the IT and the Pharma sector. But these are contra
plays. The breakout in these sectors will be dependent on defining events and regulatory changes, but which don�t seem to be visible currently.
Our funds are currently betting big on the shift in savings from physical assets to financial assets. At that, the confluence of major regulatory
changes like GST, declining inflation, reducing interest rates is creating a ground for sustainable long term growth. We continue to believe that
long term SIP and opportunistic allocation would create wealth for the investors.
In conclusion, protecting capital from mistakes is as important as making it grow. It is therefore important that risk appropriate asset
allocation is followed and self-discipline is enforced in the present market. Because creation of wealth is not the function of luck but of
enterprise, value and expertise.
Thanks and Regards,
Nilesh Shah
Managing Director
EXPERT SPEAK
It is important that investors begin
to measure the long term potential
co s t o f t he i r s ho r t t e rm
investments. It is the long term
view on earnings, value and
scalability that creates wealth in
equities. The temperament of
equities investor should be that
of a bamboo farmer (and
manifold over). A bamboo may
remain a seedling for years and
then in few weeks it will grow so
rapidly that the plant will outgrow
the farmer. Likewise a good stock
may remain dormant for years, and
then it will speed up with the
velocity that will confound many.
For example, had you invested in
Kotak Mahindra Finance IPO (later
Growing Through Asset Allocation
Therefore, don�t choose on the basis of past return, choose on the basis of proven management, effective business and a good
outlook. The market has reached maturity level for most part where governance gets a premium. Small pocket of market, especially in the
penny and low floating stocks is driven by momentum.
1

Key Variables & Their Impact On Equities
GST to impact near-term activity especially informal segment
Improving operating leverage, falling interest costs and improvement in working capital can accelerate earnings, but a bit back-ended (FY18). Key is improvement in capacity utilisation
India stands out among global asset classes with prospects of strong long term growth. Our tax policy has spooked FII couple off times. Budget FY 18 should reassure them.
Focus on improving financial savings of households
Higher disinvestment target and repair of leveraged balance sheet to create supply in markets.
Fall in interest rates to help revive demand and reduce stress for companies with significant debt. Market expecting better transmission of rates.
GST � landmark reform implemented, can result in higher tax compliance
Economy
Corporate Earnings
FII Flow
DII Flow
Supply of paper
Interest Rates Transmission
Policy/Reform Initiative
Key Variables Short - term Medium - term Remarks
INDIA: Low interest rates are here to stayThe up-move in the Indian equities market continued in the month of July 2017. The benchmark Nifty Index crossed the 10,000 mark for the first time in history
aided by strong inflows from domestic investors. On the macro front, CPI (Consumer Price Inflation) posted another weak print while the monsoon progress has
been on track reviving hope of rural demand recovery.
RBI monetary policy: Policy rates cut by 25bps in line with expectations; Further moves to be data dependentRBI in the monetary policy review reduced the policy repo rate by 25 basis points from 6.25% to 6.0%. RBI has however maintained their neutral stance given the
likely upward movement of inflation during the second half of the year. The RBI remains focused on its commitment of keeping headline inflation close to 4% on a
durable basis.
While the trajectory of CPI inflation has been lower than projected, RBI points out to the fact that there are several factors contributing to the uncertainty around
the baseline inflation trajectory. The next course of action on policy rates would be determined by data on inflation. There is room for rates to go down further by
another 25bps (especially given the real interest rates), however the timing of the same could be pushed out a bit and not front ended in nature.
While RBI believes that banks have been able to transmit lower policy rates to new lending under the MCLR regime (marginal cost lending rate), the rate
transmission for the existing loans has been slow especially under the base rate regime. RBI is looking into this matter and setting up a committee to do so.
Earnings growth in Q1FY18: Mixed bag but largely in line with expectations; supports valuations One of the key factors supporting the market has been the Q1FY18 earnings season. While many sectors witnessed de-stocking on account of the implementation
of GST (Goods and services Tax), so far the numbers reported have been by and large in line with expectations (barring a few misses for some companies) albeit on
the back of muted expectations.
Major sectors which surprised on the upside include cement and industrials while earnings for FMCG and auto so far have been mixed in nature. Private sector
banks, especially the retail focussed private banks have also reported strong trends in loan growth and earnings with largely stable asset quality. Large corporate
banks on the other hand have reported continued stress on the balance sheet and elevated credit costs. Large cap cement names posted strong results on back of
higher realization while costs were largely in check despite surge in fuel cost. In the consumer and FMCG space, the sector has by and large managed to stave off
many of the fears relating to de-stocking. However rise in raw material costs led to some earnings disappointments. Technology as a sector saw muted trends in
the quarter which is typically seasonally strong. The benchmark Nifty index is now trading at 20xFY18E EPS and 17xFY19E EPS (on a free float basis).
Savings deposit rate cut below 4% by SBI (State Bank of India): A first post deregulation of interest rates on savings depositsState Bank of India (SBI) has cut its savings deposit rate for deposits less than Rs 1 crore to 3.5% from an earlier level of 4%. For savings deposits of more than Rs 1
crore, the rate remains 4%. This is the first time after the de-regulation of interest on SA (savings accounts) deposits has there been a cut in rates below 4%.
Off late, there has been significant pressure on margins especially for large corporate lenders with pressure on lending yields. This cut in SA rates would help these
banks to offset some of the margin pressure especially as credit growth remains muted. The cut in deposit rates by banks is also positive for flows into mutual funds
and insurance companies which have gained prominence as avenues of financial savings.
Monsoons: progressing well so far; augurs well for a rural revivalThe monsoon season has been progressing well. Based on data received till July 26, 2017, the cumulative rainfall was 5.9% above normal. On a regional
cumulative basis, most of India remained in normal to excess rainfall with some parts of south India remaining deficient. Out of the 36 sub-divisions across India, till
date, eight have received excess rainfall, 25 have received normal rainfall, and three have received deficient rainfall.
EQUITY VIEW
2

Key Events:
� Central Banks Actions: =>Reserve Bank of India (RBI) cut its key lending rate by 25 basis points to its lowest since November 2010, in its latest Monetary Policy review
=>The Federal Reserve kept interest rates unchanged and said it expected to start winding down its massive holdings of bonds "relatively soon" in a sign of confidence in the U.S. economy
=>The European Central Bank left its ultra easy monetary policy stance unchanged as expected, keeping rates at record lows and even leaving the door open to more asset buys if the outlook worsens.
� India's annual retail inflation eased to a record low of 1.54 % during June, as prices of vegetables and pulses and products further contracted. Factory output growth also slowed to 1.7 %in May.
� The index of industrial production in May rose 1.7 % compared to a year ago, slower than the 3.1 % growth seen in April.
� India's export grew by 4.39 % to $ 23.56 billion in June. Import too rose by 19 % to $ 36.52 billion in June from $ 30.68 billion in the year-ago month due to rise in inward shipments of oil and gold. A rise in import shot up the country's trade deficit to $ 12.96 billion in the month under review from $ 8.11 billion in June 2016
� Foreign direct investment (FDI) grew by 23 % to USD 10.02 billion during April-May this fiscal
� Attracted by one of the highest yields in Asia, foreigners bid for 104.42 billion rupees ($1.6 billion) of corporate debt quotas, exceeding the 74.18-billion rupee target and taking inflows to near the overall cap of $51 billion.
� Japan and the European Union have formally agreed an outline free trade deal which will ease the movement of goods between two of the world's largest economies.
Debt Outlook:
The RBI in the recent MPR delivered a much desired rate cut of 25 bps
We believe that March 2018 inflation would be in the band of 3.5-4.00% vs RBI projection of 3.50-4.50% and this would open up space for RBI to reduce policy rate by 25 bps.
With the cut of 25 bps and neutral stance, the yield curve is likely to remain steep
In the near term, we expect the 10 year gilt to trade in the 6.40-6.60% band till any further trigger
The MSS limits have ben hiked to 2.5tn and therefore the OMO sale will slow down which will be positive for rates
Rate rally not over and spike in yields should be used to add duration by the investors who can take volatility
Short term curve was already discounting a rate cut , MSS issuance can put some pressure on 3-6m yields
The 6-24m yield curve is expected to remain steep and will start flattening once the expectation starts building in.
Items Jul-17 Jun-17 Change
Reverse Repo 6.00% 6.00% Nil
Repo 6.25% 6.25% Nil
CRR 4.00% 4.00% Nil
SLR 20.00% 20.00% Nil
Mibor Overnight 6.25% 6.25% Nil
Call(O/N) 6.08% 6.11% -3 bps
CBLO 6.18% 6.05% 13bps
1 yr T Bill 6.24% 6.35% -11 bps
10 G Sec 6.46% 6.51% -5 bps
5 Year AAA 7.15% 7.32% -17 bps
USD/INR 64.18 64.58 0.40paise
Source: RBI; Bloomberg, Data as of 31st July 2017.
DEBT VIEW
Key Variables & their Impact On Interest Rates in 2017
Denotes fall in interest rates
Medium � term (6month � 2 years)Key Variables
Inflation
Rupee
Credit Demand
Government Borrowing
RBI Policy
Global Event Risk
Corporate bond Spread
Debt FII flow
Liquidity
Short - term (3-6 month)
3

Gold has been traditionally perceived to be a safe haven currency at the time of geo political risk or Dollar weakening or fed rate cut.
In the month of July, the gold prices have gone up in dollar terms however appreciation in the Rupee during the period has reduced quantum of returns in
rupee term.
The Brent crude prices have gone up by around 10% in July month. The oil prices were oscillating between 45-55$ mark. On a broader trend, the brent
crude prices are on the downward slide despite the production cut by Oil producing countries.
To sum it up, we expect the gold prices to remain range bound from here other assets particularly bonds and equities may do well.
We continue to believe that India story is unfolding and it has a long way to go. Therefore, for long term growth seekers, equities are likely to be a better play
followed by bonds and then gold bonds for domestic investors.
4
SENSEX P/B (x)
Stretched
Bubble
CheapOver Invest
80% ‐ 90%
AttractiveNeutral +
65% ‐ 75%
FairNeutral
50%
Fair Value PlusNeutral ‐
35% ‐ 45%
Under Invest
15%‐ 25%
Exit
5% ‐ 10%
Market Equity Allocaion
Suggested equity allocation
(Assuming 50% equity
allocation as neutral)
Markets Fairly Valued Few Indicators Like PE Indicate Over-valuation, While Other Composite Indicators Like P/B Or Market Cap To GDP Suggest Valuations Still Having Room To Expand
Market Valuation Indicators
GOLD VIEW
15000
18000
21000
24000
27000
30000
33000
Jul‐1
4
Jul‐1
4
Aug‐
14
Sep‐
14
Oct
‐14
Dec‐
14
Dec‐
14
Jan‐
15
Feb‐
15
Mar
‐15
Apr‐
15
May
‐15
Jun‐
15
Jul‐1
5
Aug‐
15
Sep‐
15
Oct
‐15
Nov
‐15
Dec‐
15
Jan‐
16
Feb‐
16
Mar
‐16
Apr‐
16
May
‐16
Jun‐
16
Jul‐1
6
Aug‐
16
Sep‐
16
Oct
‐16
Nov
‐16
Dec‐
16
Jan‐
17
Feb‐
17
Mar
‐17
Apr‐
17
May
‐17
Jun‐
17
Jul‐1
7
Attractive 10x‐12x
Fair 12x‐16x
Fair Value Plus 16‐18x
Stretched 18x‐20x
Cheap 9x ‐ 10x
0
20
40
60
80
100
120
19
90
19
91
19
92
19
93
19
94
19
95
19
96
19
97
19
98
19
99
20
00
20
01
20
02
20
03
20
04
20
05
20
06
20
07
20
08
20
09
20
10
20
11
20
12
20
13
20
14
20
15
20
16
20
17
20
18
E
India's Market Cap to GDP(%)
1.5
2.2
2.9
3.6
4.3
5.0
5.7
6.4
7.1
Jul‐
91
Jul‐
92
Jul‐
93
Jul‐
94
Jul‐
95
Jul‐
96
Jul‐
97
Jul‐
98
Jul‐
99
Jul‐
00
Jul‐
01
Jul‐
02
Jul‐
03
Jul‐
04
Jul‐
05
Jul‐
06
Jul‐
07
Jul‐
08
Jul‐
09
Jul‐
10
Jul‐
11
Jul‐
12
Jul‐
13
Jul‐
14
Jul‐
15
Jul‐
16
Jul‐
17
4
12-month forward Sensex P/E (x)

Issuer/Instrument Industry/Rating % to Net Assets
Equity & Equity related (Listed/Awaiting listing on Stock Exchange)HDFC Bank Ltd. Banks 9.14
ICICI Bank Ltd. Banks 5.81
Reliance Industries Ltd. Petroleum Products 5.01
IndusInd Bank Ltd. Banks 4.69
Infosys Ltd. Software 4.68
ITC Ltd. Consumer Non Durables 4.57
Maruti Suzuki India Limited Auto 3.86
Larsen And Toubro Ltd. Construction Project 3.57
State Bank Of India Banks 3.50
Hero MotoCorp Ltd. Auto 2.99
Axis Bank Ltd Banks 2.59
Tata Motors Ltd - DVR Auto 2.22
GAIL (India) Ltd. Gas 2.05
Bharat Petroleum Corporation Ltd. Petroleum Products 2.01
Shree Cement Ltd. Cement 1.99
Zee Entertainment Enterprises Ltd. Media and Entertainment 1.93
Cadila Healthcare Ltd. Pharmaceuticals 1.74
Britannia Industries Ltd. Consumer Non Durables 1.54
Ultratech Cement Ltd. Cement 1.36
Apollo Hospitals Enterprises Ltd. Healthcare Services 1.34
Bayer Cropscience Ltd. Pesticides 1.34
The Ramco Cements Ltd Cement 1.30
ICICI Prudential Life Insurance
Company Ltd. Finance 1.27
Kajaria Ceramics Ltd. Construction 1.26
Sun TV Limited. Media and Entertainment 1.22
Fag Bearings India Ltd. Industrial Products 1.20
Bank Of Baroda Banks 1.15
HCL Technologies Ltd. Software 1.13
Persistent Systems Limited Software 1.10
Bharat Electronics Ltd Industrial Capital Goods 1.08
Strides Shasun Ltd. Pharmaceuticals 1.06
Indraprastha Gas Ltd. Gas 1.05
Torrent Pharmaceuticals Ltd. Pharmaceuticals 1.01
Issuer/Instrument Industry/Rating % to Net Assets
Motherson Sumi Systems Ltd. Auto Ancillaries 0.95
Sanofi India Ltd. Pharmaceuticals 0.94
National Thermal Power
Corporation Limited. Power 0.93
Petronet LNG Ltd. Gas 0.91
Arvind Ltd Textile Products 0.90
DR.Lal Pathlabs Ltd Healthcare Services 0.89
DB Corp Limited Media and Entertainment 0.87
MRF Limited Auto Ancillaries 0.87
Castrol (India ) Ltd. Petroleum Products 0.86
HDFC Ltd. Warrants Finance 0.85
Tech Mahindra Ltd. Software 0.85
Laurus Labs Ltd Pharmaceuticals 0.83
Solar Industries India Limited Chemicals 0.75
Supreme Industries Limited Industrial Products 0.64
Bharat Earth Movers Ltd. Industrial Capital Goods 0.61
Bharat Financial
Inclusion Limited Finance 0.56
Yes Bank Ltd Banks 0.52
GE Power India Limited Industrial Capital Goods 0.51
Vedanta Ltd. Non - Ferrous Metals 0.50
Bata India Ltd. Consumer Durables 0.42
Listed/Awaiting Listing on Stock Exchange - Total 96.92
Futures
RBL Bank Ltd-AUG2017 1.25
Futures (Market value represents Notional Value) - Total 1.25
TERM DEPOSITS
AXIS Bank Ltd. 0.46
Term Deposits - Total 0.46
Collateral Borrowing & Lending obligation 3.02
Net Current Assets/(Liabilities) -1.65
Grand Total 100.00
Note: Term Deposit as provided above is towards margin for derivatives transactions
* For Fund Manager experience, please refer page 54-55. ## Risk rate assumed to be 6.25% (FBIL Overnight MIBOR rate as on 31st July 2017). **Total Expense Ratio excludes applicable B15 fee and service tax. For last three dividends, please refer page no 56-58. For scheme performance, please refer page no 45-53
SYSTEMATIC INVESTMENT PLAN (SIP)
Scheme Inception : - December 29, 1998. The returns are calculated by XIRR approach assuming investment of 10,000/- on the 1st working `day of every month. XIRR helps in calculating return on investments given an initial and final value and a series of cash inflows and outflows and taking the time of investment into consideration. Since inception returns are assumed to be starting from the beginning of the subsequent month from the date of inception. # Benchmark ; ̂ Additional Benchmark
Kotak 50 NAV as on July 31, 2017: `37.337 (Dividend Option), `39.616 (Direct Dividend Option), `214.594 (Growth Option), `224.574 (Direct Growth Option)
Monthly SIP of 10000`
Total amount invested ( )`
Total Value as on July 31, 2017( )`
Scheme Returns (%)
Nifty 50 ( )#`
Nifty 50 Returns (%)
S&P BSE SENSEX ( )^`
S&P BSE SENSEX Returns (%)
1 year 3 years 5 years 7 years 10 years Since Inception
120,000 360,000 600,000 840,000 1,200,000 2,240,000
134,995 443,852 907,555 1,425,139 2,402,447 15,531,142
24.08 14.09 16.58 14.84 13.31 18.12
136,500 434,380 836,566 1,283,988 2,125,229 9,215,034
26.58 12.60 13.26 11.92 11.01 13.53
136,061 427,109 816,928 1,251,399 2,065,365 9,179,069
25.85 11.43 12.30 11.20 10.47 13.50
Systematic Investment Plan (SIP) If you had invested `10,000 every month
Riskometer
yletaredo
M
Moderate
Low
High
Low
High
LOW HIGH
Moderately
Benchmark: Nifty 50Fund Manager: AAUM:
AUM: Allotment date: December 29, 1998
KOTAK 50An Open - Ended Equity Scheme
Investment Objective
To generate capital appreciation from a portfolio of predominantly equity and equity related securities. The portfolio will generally comprise of equity and equity re lated inst ruments of around 50 companies which may go up to 59 companies but will not exceed 59 at any point in time. However, there is no assurance that the objective of the scheme will be realized.
Available Plans/Options
A) B) Direct Plan Regular Plan
Options: Dividend Payout, Dividend Reinvestment & Growth (applicable for all plans)
Dividend Frequency
Trustee�s Discretion
Ratios
$Source: ICRA MFI Explorer.
Minimum Investment Amount
Initial Investment: `5000 and in multiple of `1 for purchase and for ̀ 0.01 for switches
Additional Investment: ̀ 1000 & in multiples of ̀ 1
Ideal Investments Horizon: 3 years & above
Load Structure
Entry Load: Nil. (applicable for all plans)
Exit Load:
I For redemptions / switch outs (including SIP/STP) within 1 year from the date of allotment of units: 1%.
ii) For redemption/switch outs (including SIP/STP) after 1 year from the date of allotment of units: Nil.
Regular:2.17%; Direct: 1.00%
Investment Style:
Style
Product Label
This product is suitable for investors who are seeking*:� Long term capital growth� Investment in portfolio of predominantly equity & equity
related securities* Investors should consult their financial advisors if in doubt about whether the product is suitable for them.
Investors understand that their principal will be at moderately high risk
Total Expense Ratio**
`1,392.11 crs`1,405.10 crs
Mr. Harish Krishnan*
SECTOR ALLOCATION (%)
(As on July 31, 2017)
PORTFOLIO
Value Blend Growth Size
Large
Mid
Small
Portfolio Turnover
$Beta
$Sharpe##
$Standard Deviation
69.39%
0.98
0.61
13.55%
35.98
31.33
13.61
12.82
10.84
10.89
11.71
7.76
9.91
6.52
4.22
5.57
3.86
4.83
2.00
0.78
4.65 4.04 4.02
Benchmark
Scheme
Financial Services Energy Automobile IT Consumer Goods Pharma
Constructions Cement & Cement Products Industrial Manufacturing Media & Entertainment
5

Issuer/Instrument Industry/Rating % to Net Assets
Issuer/Instrument Industry/Rating % to Net Assets
Note: Term Deposit as provided above is towards margin for derivatives transactions
* For Fund Manager experience, please refer page 54-55. ## Risk rate assumed to be 6.25% (FBIL Overnight MIBOR rate as on 31st July 2017). **Total Expense Ratio excludes applicable B15 fee and service tax. For last three dividends, please refer page no 56-58. For scheme performance, please refer page no 45-53
SYSTEMATIC INVESTMENT PLAN (SIP)
Scheme Inception : - July 27,2005. The returns are calculated by XIRR approach assuming investment of 10,000/- on the 1st working day of `every month. XIRR helps in calculating return on investments given an initial and final value and a series of cash inflows and outflows and taking the time of investment into consideration. Since inception returns are assumed to be starting from the beginning of the subsequent month from the date of inception. # Benchmark ; ̂ Additional Benchmark
Kotak Classic Equity NAV as on July 31, 2017: ̀ 22.901 (Dividend Option), ̀ 24.525 (Direct Dividend Option), ̀ 44.929 (Growth Option), `47.547 (Direct Growth Option)
Monthly SIP of 10000`
Total amount invested ( )`
Total Value as on July 31, 2017 ( )`
Scheme Returns (%)
Nifty 100 ( )#`
Nifty 100 Returns (%)
Nifty 50 ( )^`
Nifty 50 Returns (%)
1 year 3 years 5 years 7 years 10 years Since Inception
120,000 360,000 600,000 840,000 1,200,000 1,450,000
137,907 453,140 905,094 1,431,287 2,463,557 3,352,163
28.94 15.54 16.47 14.96 13.78 13.08
137,023 442,683 865,452 1,336,005 2,238,574 3,071,461
27.46 13.91 14.64 13.03 11.99 11.76
136,500 434,380 836,566 1,283,988 2,125,229 2,912,326
26.58 12.60 13.26 11.92 11.01 10.96
Systematic Investment Plan (SIP) If you had invested `10,000 every month
Riskometer
yletaredo
M
Moderate
Low
High
Low
High
LOW HIGH
Moderately
Benchmark: Nifty 100Fund Manager: Mr. Deepak Gupta* AAUM: `106.20 crs
AUM: `106.33 crsAllotment date: July 27, 2005
KOTAK CLASSIC EQUITYAn Open - Ended Equity Scheme
Investment Objective
To generate capital appreciation from a diversified portfolio of equity and equity related securities. However, there is no assurance that the objective of the scheme will be realized.
Available Plans/Options
A) B) Direct Plan Regular Plan
Options: Dividend Payout, Dividend Reinvestment & Growth (applicable for all plans)
Dividend Frequency
Trustee�s Discretion
Ratios
$Source: ICRA MFI Explorer.
Minimum Investment Amount
Initial Investment: `5000 and in multiple of `1 for purchase and for ̀ 0.01 for switches
Additional Investment: ̀ 1000 & in multiples of ̀ 1
Ideal Investments Horizon: 3 years & above
Load Structure
Entry Load: Nil. (applicable for all plans)
Exit Load: Nil. (applicable for all plans),
Total Expense Ratio**
Regular:2.69%; Direct: 1.21%
Investment Style:
Style
Product Label
This product is suitable for investors who are seeking*:� Long term capital growth� Investment in portfolio of predominantly equity & equity
related securities* Investors should consult their financial advisors if in doubt about whether the product is suitable for them.
Investors understand that their principal will be at moderately high risk
Equity & Equity related (Listed/Awaiting listing on Stock
Exchange)Infosys Ltd. Software 5.50Hindalco Industries Ltd Non - Ferrous Metals 4.72Reliance Industries Ltd. Petroleum Products 4.50Power Grid Corporation Of India Ltd. Power 3.91Tata Consultancy Services Ltd. Software 3.05Maruti Suzuki India Limited Auto 2.94ITC Ltd. Consumer Non Durables 2.92Grasim Industries Ltd. Cement 2.83Hero MotoCorp Ltd. Auto 2.81National Thermal PowerCorporation Limited. Power 2.74Hindustan PetroleumCorporation Ltd. Petroleum Products 2.72GAIL (India) Ltd. Gas 2.65Bharat PetroleumCorporation Ltd. Petroleum Products 2.62HDFC Ltd. Warrants Finance 2.06HDFC Bank Ltd. Banks 2.00IndusInd Bank Ltd. Banks 1.65Tata Communications Ltd Telecom - Services 1.57AU Small Finance Bank Ltd. Banks 1.55Tata Steel Limited. Ferrous Metals 1.53State Bank Of India Banks 1.47Vedanta Ltd. Non - Ferrous Metals 1.42HDFC Ltd. Finance 1.39Bajaj Finserv Ltd. Finance 1.35Wipro Ltd. Software 1.31Piramal Enterprises Limited Pharmaceuticals 1.26Tech Mahindra Ltd. Software 1.19Colgate Palmolive (India ) Ltd. Consumer Non Durables 1.16Sun TV Limited. Media and Entertainment 1.14Indraprastha Gas Ltd. Gas 1.08Laurus Labs Ltd Pharmaceuticals 1.01Eris Lifesciences Ltd Pharmaceuticals 0.79Indian Oil Corporation Ltd Petroleum Products 0.70
The Ramco Cements Ltd Cement 0.69Aditya Birla Capital Ltd Finance 0.68Avenue Supermarts Ltd Retailing 0.64JSW Steel Ltd. Ferrous Metals 0.64Bajaj Finance Limited Finance 0.59Axis Bank Ltd Banks 0.56S Chand And Company Ltd Media and Entertainment 0.56Eicher Motors Ltd Auto 0.51Tata Motors Ltd - DVR Auto 0.34HCL Technologies Ltd. Software 0.20ICICI Bank Ltd. Banks 0.207.5% Vedanta ReedemablePreference Shares Non - Ferrous Metals 0.17Biocon Ltd. Pharmaceuticals 0.06RBL Bank Ltd Banks 0.03Listed/Awaiting Listing on Stock Exchange - Total 75.41Futures HDFC Bank Ltd.-AUG2017 6.27ICICI Bank Ltd.-AUG2017 2.99ITC Ltd.-AUG2017 1.69Bharat Petroleum Corporation Ltd.-AUG2017 1.61IndusInd Bank Ltd.-AUG2017 1.39Hindustan Unilever Ltd.-AUG2017 1.31RBL Bank Ltd-AUG2017 1.20HCL Technologies Ltd.-AUG2017 1.18Biocon Ltd.-AUG2017 0.98Axis Bank Ltd-AUG2017 0.94Bajaj Finance Limited-AUG2017 0.81Futures (Market value represents Notional Value) - Total 20.37
TERM DEPOSITS AXIS Bank Ltd. 4.00Term Deposits - Total 4.00
Collateral Borrowing & Lending obligation 21.35Net Current Assets/(Liabilities) -21.13Grand Total 100.00
SECTOR ALLOCATION (%)
(As on July 31, 2017)
Value Blend Growth Size
Large
Mid
Small
PORTFOLIO
Portfolio Turnover
$Beta
$Sharpe##
$Standard Deviation
175.42%
0.98
0.53
13.30%
33.65
27.13
12.65
22.52
10.06
12.42
4.46
8.31
12.43
7.72
10.05
6.61
5.08
4.10
2.05
3.52
0.83
1.71
2.13
1.57
Benchmark
Scheme
Financial Services Energy IT Metals
Consumer Goods
Automobile
Pharma Cement & Cement Products Media & Entertainment Telecom
6

Investment Objective
To generate capital appreciation from a diversified portfolio of equity and equity related securities. However, there is no assurance that the objective of the scheme will be realized.
Available Plans/Options
A) B) Direct Plan Regular Plan
Options: Dividend Payout, Dividend Reinvestment & Growth (applicable for all plans)
Dividend Frequency
Trustee�s Discretion
Ratios
$Source: ICRA MFI Explorer.
Minimum Investment Amount
Initial Investment: `5000 and in multiple of `1 for purchase and for ̀ 0.01 for switches
Additional Investment: `1000 & in multiples of ̀ 1
Ideal Investments Horizon: 3 years & above
Load Structure
Entry Load: Nil. (applicable for all plans)
Exit Load:
I) For redemptions / switch outs (including SIP/STP) within 1 year from the date of allotment of units: 1%
ii) For redemptions / switch outs (including SIP/STP) after 1 year from the date of allotment of units: NIL
Total Expense Ratio**
Regular:2.12%; Direct: 0.97%
7
SYSTEMATIC INVESTMENT PLAN (SIP)
Scheme Inception : - September 09, 2004. The returns are calculated by XIRR approach assuming investment of 10,000/- on the 1st working `day of every month. XIRR helps in calculating return on investments given an initial and final value and a series of cash inflows and outflows and taking the time of investment into consideration. Since inception returns are assumed to be starting from the beginning of the subsequent month from the date of inception. # Benchmark ; ̂ Additional Benchmark Kotak Opportunities NAV as on July 31, 2017: `28.421 (Dividend Option), `29.912 (Direct Dividend Option), `112.581 (Growth Option), `117.796 (Direct Growth Option)
This product is suitable for investors who are seeking*:� Long term capital growth� Investment in portfolio of predominantly equity &
equity related securities* Investors should consult their financial advisors if in doubt about whether the product is suitable for them.
Product Label
Investors understand that their principal will be at moderately high risk
Riskometer
yletaredo
M
Moderate
Low
High
Low
High
LOW HIGH
Moderately
SECTOR ALLOCATION (%)
* For Fund Manager experience, please refer page 54-55. ## Risk rate assumed to be 6.25% ( FBIL Overnight MIBOR rate as on 31st July 2017). **Total Expense Ratio excludes applicable B15 fee and service tax. For last three dividends, please refer page no 56-58. For scheme performance, please refer page no 45-53
Monthly SIP of 10000`
Total amount invested ( )`
Total Value as on July 31, 2017( )`
Scheme Returns (%)
Nifty 500 ( )#`
Nifty 500 Returns (%)
Nifty 50 ( )^`
Nifty 50 Returns (%)
1 year 3 years 5 years 7 years 10 years Since Inception
120,000 360,000 600,000 840,000 1,200,000 1,550,000
138,871 480,551 1,021,577 1,629,013 2,815,443 4,971,958
30.56 19.70 21.44 18.59 16.27 16.71
137,793 452,295 900,534 1,386,861 2,298,285 3,635,473
28.75 15.41 16.26 14.08 12.48 12.39
136,500 434,380 836,566 1,283,988 2,125,186 3,434,177
26.58 12.60 13.26 11.92 11.01 11.60
Systematic Investment Plan (SIP) If you had invested `10,000 every month
PORTFOLIO
Note: Term Deposit as provided above is towards margin for derivatives transactions
Equity & Equity related (Listed/Awaiting listing on Stock Exchange)HDFC Bank Ltd. Banks 6.41Reliance Industries Ltd. Petroleum Products 5.11ITC Ltd. Consumer Non Durables 4.43State Bank Of India Banks 3.95Hero MotoCorp Ltd. Auto 3.57ICICI Bank Ltd. Banks 3.35IndusInd Bank Ltd. Banks 3.31Larsen And Toubro Ltd. Construction Project 2.75Shree Cement Ltd. Cement 2.67GAIL (India) Ltd. Gas 2.31Bharat Earth Movers Ltd. Industrial Capital Goods 2.23HDFC Ltd. Finance 2.20Hindustan PetroleumCorporation Ltd. Petroleum Products 2.13Infosys Ltd. Software 2.03Maruti Suzuki India Limited Auto 2.00Dalmia Bharat Ltd. Cement 1.99UPL Ltd Pesticides 1.89Coromandel International Ltd. Fertilisers 1.87Axis Bank Ltd Banks 1.79Zee Entertainment Enterprises Ltd. Media and Entertainment 1.71Bajaj Finance Limited Finance 1.66Torrent Pharmaceuticals Ltd. Pharmaceuticals 1.63Bharat Petroleum Corporation Ltd. Petroleum Products 1.60Indraprastha Gas Ltd. Gas 1.59Max Financial Services Ltd. Finance 1.58Ultratech Cement Ltd. Cement 1.52Petronet LNG Ltd. Gas 1.47Avenue Supermarts Ltd Retailing 1.46Healthcare Global Enterprises Ltd. Healthcare Services 1.41DR.Lal Pathlabs Ltd Healthcare Services 1.32ICICI Prudential Life InsuranceCompany Ltd. Finance 1.32Mahindra & Mahindra Ltd. Auto 1.28Arvind Ltd Textile Products 1.26The Ramco Cements Ltd Cement 1.17Britannia Industries Ltd. Consumer Non Durables 1.13
Tata Motors Ltd. Auto 1.11Linde India Ltd. Chemicals 1.10MRF Limited Auto Ancillaries 1.07JK Cement Ltd. Cement 1.05SRF Ltd. Textile Products 1.05Fag Bearings India Ltd. Industrial Products 1.04Techno Electric &Engineering Co Ltd. Construction Project 1.00Multi Commodity Exchange ofIndia Limited Finance 0.94Bata India Ltd. Consumer Durables 0.85AIA Engineering Limited Industrial Products 0.83Equitas Holdings Ltd Finance 0.83National Buildings ConstructionCorporation Limited Construction 0.74Sun PharmaceuticalsIndustries Ltd. Pharmaceuticals 0.69Ashok Leyland Ltd. Auto 0.64Whirlpool of India Ltd. Consumer Durables 0.63Va Tech Wabag Limited Engineering Services 0.60Lupin Ltd. Pharmaceuticals 0.59HDFC Ltd. Warrants Finance 0.56Bank Of Baroda Banks 0.54Cummins India Ltd. Industrial Products 0.52Persistent Systems Limited Software 0.52Container Corporation ofIndia Ltd. Transportation 0.48Swaraj Engines Ltd Industrial Products 0.366% Redm Preference Sh ZeeEntertainment Enterprises Ltd Media and Entertainment 0.07Listed/Awaiting Listing on Stock Exchange - Total 96.91
TERM DEPOSITS AXIS Bank Ltd. 0.78Term Deposits - Total 0.78
Collateral Borrowing & Lending obligation 2.74Net Current Assets/(Liabilities) -0.43Grand Total 100.00
Benchmark: Nifty 500Fund Manager: Mr. Harsha Upadhyaya* AAUM: `1,728.87 crs
AUM: `1,739.80 crsAllotment date: September 9, 2004
KOTAK OPPORTUNITIESAn Open - Ended Equity Growth Scheme (As on July 31, 2017)
51.01%
1.02
0.90
14.07%
Portfolio Turnover
$Beta
$Sharpe ##
$Standard Deviation
Investment Style
StyleValue Blend Growth Size
Large
Mid
Small
31.66
28.44
11.36
14.21
9.32
9.68
12.27
8.49
2.32
8.40
2.99
4.99
4.28
4.49
1.05
3.76
5.24
2.91
0.09
2.73
Benchmark
Scheme
Financial Services Energy Automobile Consumer Goods Cement & Cement Products
Industrial Manufacturing Constructions Fertilisers & Pesticides Pharma Healthcare Services
Issuer/Instrument Industry/Rating % to Net Assets
Issuer/Instrument Industry/Rating % to Net Assets
�In reality, patience is crucial, but is a very rare investment commodity�
7

Investment Objective
The investment objective of the scheme is to generate long-term capital appreciation from a portfolio of equity and equity related securities, generally focused on a few selected sectors. However, there is no assurance that the objective of the scheme will be realized.
Available Plans/Options
A) B) Direct Plan Regular Plan
Options: Dividend Payout, Dividend Reinvestment & Growth (applicable for all plans)
Dividend Frequency
Trustee�s Discretion
Ratios
Source: $ICRA MFI Explorer.
Minimum Investment Amount
Initial Investment: `5000 and in multiple of `1 for purchase and for ̀ 0.01 for switches
Additional Investment: `1000 & in multiples of ̀ 1
Ideal Investments Horizon: 3 years & above
Load Structure
Entry Load: Nil. (applicable for all plans)
Exit Load:
I) For redemptions / switch outs (including SIP/STP) within 1 year from the date of allotment of units:1%
ii) For redemptions / switch outs (including SIP/STP) after 1 year from the date of allotment of units: NIL
Total Expense Ratio**
Regular: 1.97%; Direct: 1.00%
7
SYSTEMATIC INVESTMENT PLAN (SIP)
Scheme Inception : - September 11, 2009. The returns are calculated by XIRR approach assuming investment of 10,000/- on the 1st working `day of every month. XIRR helps in calculating return on investments given an initial and final value and a series of cash inflows and outflows and taking the time of investment into consideration. Since inception returns are assumed to be starting from the beginning of the subsequent month from the date of inception. # Benchmark ; ̂ Additional Benchmark
Kotak Select Focus Fund NAV as on July 31, 2017: `24.272 (Dividend Option), ` 25.446 (Direct Dividend Option), ` 31.88 (Growth Option), `33.291 (Direct Growth Option)
Product Label
Investors understand that their principal will be at moderately high risk
Riskometer
yletaredo
M
Moderate
Low
High
Low
High
LOW HIGH
Moderately
* For Fund Manager experience, please refer page 54-55.. ## Risk rate assumed to be 6.25% ( FBIL Overnight MIBOR rate as on 31st July 2017). **Total Expense Ratio excludes applicable B15 fee and service tax. For last three dividends, please refer page no 56-58. For scheme performance, please refer page no 45-53
PORTFOLIO
Benchmark: Nifty 200Fund Manager: Mr. Harsha Upadhyaya* AAUM: `12,253.02 crs
AUM: `12,770.01 crsAllotment date: September 11, 2009
KOTAK SELECT FOCUS FUNDAn Open - Ended Equity Scheme (As on July 31, 2017)
36.24%
1.01
0.96
14.14%
Portfolio Turnover
$Beta
$Sharpe##
$Standard Deviation
Investment Style
Note: Term Deposit as provided above is towards margin for derivatives transactions
Equity & Equity related (Listed/Awaiting listing on Stock Exchange) HDFC Bank Ltd. Banks 6.43Reliance Industries Ltd. Petroleum Products 4.81State Bank Of India Banks 4.40ITC Ltd. Consumer Non Durables 4.36Hero MotoCorp Ltd. Auto 3.58IndusInd Bank Ltd. Banks 3.35Maruti Suzuki India Limited Auto 3.34ICICI Bank Ltd. Banks 3.19HDFC Ltd. Finance 3.08Ultratech Cement Ltd. Cement 2.78Larsen And Toubro Ltd. Construction Project 2.71GAIL (India) Ltd. Gas 2.54Shree Cement Ltd. Cement 2.33Bajaj Finance Limited Finance 2.17The Ramco Cements Ltd Cement 2.13Hindustan PetroleumCorporation Ltd Petroleum Products 2.03Bharat Electronics Ltd Industrial Capital Goods 2.00Indraprastha Gas Ltd. Gas 1.94Axis Bank Ltd Banks 1.81Mahindra & Mahindra Ltd. Auto 1.76Britannia Industries Ltd. Consumer Non Durables 1.69Infosys Ltd. Software 1.66Petronet LNG Ltd. Gas 1.62Max Financial Services Ltd. Finance 1.49Arvind Ltd Textile Products 1.43ICICI Prudential Life InsuranceCompany Ltd Finance 1.39RBL Bank Ltd Banks 1.34Bajaj Finserv Ltd. Finance 1.15Bharat PetroleumCorporation Ltd. Petroleum Products 1.09Bharat Earth Movers Ltd. Industrial Capital Goods 1.08Godrej Consumer Products Ltd. Consumer Non Durables 1.02MRF Limited Auto Ancillaries 1.02Bayer Cropscience Ltd. Pesticides 0.98Tata Motors Ltd. Auto 0.97Cadila Healthcare Ltd. Pharmaceuticals 0.89
Equitas Holdings Ltd Finance 0.80Federal Bank Ltd. Banks 0.79HCL Technologies Ltd. Software 0.74Ashok Leyland Ltd. Auto 0.69Container Corporation ofIndia Ltd. Transportation 0.62Kec International Ltd. Construction Project 0.62Jk Lakshmi Cement Ltd. Cement 0.57Laurus Labs Ltd Pharmaceuticals 0.56Sun PharmaceuticalsIndustries Ltd. Pharmaceuticals 0.56Lupin Ltd. Pharmaceuticals 0.55Techno Electric &Engineering Co Ltd. Construction Project 0.50Bata India Ltd. Consumer Durables 0.46Solar Industries India Limited Chemicals 0.46AIA Engineering Limited Industrial Products 0.44Bank Of Baroda Banks 0.33HDFC Ltd. Warrants Finance 0.31Max India Limited Healthcare Services 0.26Whirlpool of India Ltd. Consumer Durables 0.26Avenue Supermarts Ltd Retailing 0.22Navkar Corporation Limited Transportation 0.21Kirloskar Oil Engines Ltd. Industrial Products 0.146% Redm Preference Sh ZeeEntertainment Enterprises Ltd Media and Entertainment 0.01Listed/Awaiting Listing on Stock Exchange - Total 89.66Futures CNX NIFTY-AUG2017 2.39RBL Bank Ltd-AUG2017 0.55Futures (Market value represents Notional Value) - Total 2.94
TERM DEPOSITS AXIS Bank Ltd. 0.94Term Deposits - Total 0.94
Collateral Borrowing & Lending obligation 10.13Net Current Assets/(Liabilities) -3.67Grand Total 100.00
1 year 3 years 5 years 7 years Since Inception
120,000 360,000 600,000 840,000 950,000
139,012 483,784 1,060,738 1,732,391 2,069,105
30.79 20.18 23.00 20.32 19.12
137,259 446,449 879,004 1,352,082 1,578,294
27.85 14.50 15.27 13.36 12.52
136,500 434,380 836,566 1,283,988 1,504,150
26.58 12.60 13.26 11.92 11.34
Systematic Investment Plan (SIP) If you had invested `10,000 every month
Monthly SIP of 10000`
Total amount invested ( )`
Total Value as on July 31, 2017( )`
Scheme Returns (%)
Nifty 200 ( )#`
Nifty 200 Returns (%)
Nifty 50 ( )^`
Nifty 50 Returns (%)
This product is suitable for investors who are seeking*:� Long term capital growth� Investment in portfolio of predominantly equity &
equity related securities generally focussed on a few selected sectors.
* Investors should consult their financial advisors if in doubt about whether the product is suitable for them.
Style
SECTOR ALLOCATION (%) Value Blend Growth Size
Large
Mid
Small
�Wealth is made more due to understanding rather than information�
Issuer/Instrument Industry/Rating % to Net Assets
Issuer/Instrument Industry/Rating % to Net Assets
33.06
32.84
12.19
14.64
9.72
11.36
12.02
8.00
2.24
7.80
1.79
3.67
3.73
3.22
5.48
2.56
9.40 0.41
2.40
1.43
Benchmark
Scheme
Financial Services Energy Automobile Consumer Goods Cement & Cement Products
Industrial Manufacturing Constructions Pharma IT Textiles
8
Investment Objective
To generate long-term capital appreciation from a diversified portfolio of equity and equity related securities and enable investors to avail the income tax rebate, as permitted from time to time. However, there is no assurance that the objective of the scheme will be realized.
Available Plans/Options
A) Regular Plan B) Direct Plan
Options: Dividend Payout & Growth (applicable for all plans)
Dividend Frequency
Trustee�s Discretion
Ratios
Source: $ICRA MFI Explorer.
Minimum Investment Amount
Initial Investment: `500 and in multiple of `500
Additional Investment: `500 & in multiples of ̀ 500
Ideal Investments Horizon: 3 years & above
Load Structure
Entry Load: Nil. (applicable for all plans)
Exit Load: Exit Load is not applicable for Kotak Tax Saver Scheme. (applicable for all plans)
Total Expense Ratio**
Regular: 2.39%; Direct: 1.37%
7
SYSTEMATIC INVESTMENT PLAN (SIP)
Product Label
Investors understand that their principal will be at moderately high risk
Riskometer
yletaredo
M
Moderate
Low
High
Low
High
LOW HIGH
Moderately
* For Fund Manager experience, please refer page 54-55.. ## Risk rate assumed to be 6.25% ( FBIL Overnight MIBOR rate as on 31st July 2017). **Total Expense Ratio excludes applicable B15 fee and service tax.For last three dividends, please refer page no 56-58. For scheme performance, please refer page no 45-53
PORTFOLIO
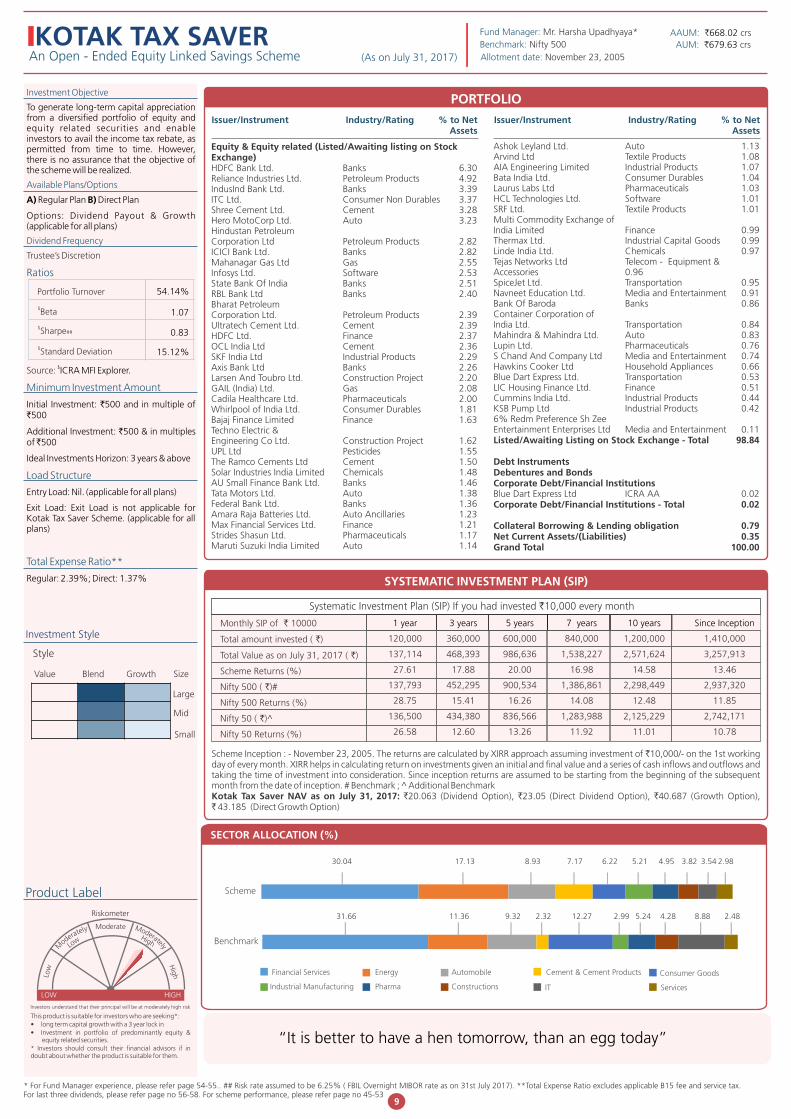
Benchmark: Nifty 500Fund Manager: Mr. Harsha Upadhyaya* AAUM: ` crs 668.02
AUM: ` crs679.63Allotment date: November 23, 2005
KOTAK TAX SAVERAn Open - Ended Equity Linked Savings Scheme (As on July 31, 2017)
54.14%
1.07
0.83
15.12%
Portfolio Turnover
$Beta
$Sharpe##
$Standard Deviation
Investment Style
Ashok Leyland Ltd. Auto 1.13Arvind Ltd Textile Products 1.08AIA Engineering Limited Industrial Products 1.07Bata India Ltd. Consumer Durables 1.04Laurus Labs Ltd Pharmaceuticals 1.03HCL Technologies Ltd. Software 1.01SRF Ltd. Textile Products 1.01Multi Commodity Exchange ofIndia Limited Finance 0.99Thermax Ltd. Industrial Capital Goods 0.99Linde India Ltd. Chemicals 0.97Tejas Networks Ltd Telecom - Equipment & Accessories 0.96SpiceJet Ltd. Transportation 0.95Navneet Education Ltd. Media and Entertainment 0.91Bank Of Baroda Banks 0.86Container Corporation ofIndia Ltd. Transportation 0.84Mahindra & Mahindra Ltd. Auto 0.83Lupin Ltd. Pharmaceuticals 0.76S Chand And Company Ltd Media and Entertainment 0.74Hawkins Cooker Ltd Household Appliances 0.66Blue Dart Express Ltd. Transportation 0.53LIC Housing Finance Ltd. Finance 0.51Cummins India Ltd. Industrial Products 0.44KSB Pump Ltd Industrial Products 0.426% Redm Preference Sh ZeeEntertainment Enterprises Ltd Media and Entertainment 0.11Listed/Awaiting Listing on Stock Exchange - Total 98.84
Debt Instruments Debentures and Bonds Corporate Debt/Financial Institutions Blue Dart Express Ltd ICRA AA 0.02Corporate Debt/Financial Institutions - Total 0.02
Collateral Borrowing & Lending obligation 0.79Net Current Assets/(Liabilities) 0.35Grand Total 100.00
Equity & Equity related (Listed/Awaiting listing on Stock Exchange)HDFC Bank Ltd. Banks 6.30Reliance Industries Ltd. Petroleum Products 4.92IndusInd Bank Ltd. Banks 3.39ITC Ltd. Consumer Non Durables 3.37Shree Cement Ltd. Cement 3.28Hero MotoCorp Ltd. Auto 3.23Hindustan PetroleumCorporation Ltd Petroleum Products 2.82ICICI Bank Ltd. Banks 2.82Mahanagar Gas Ltd Gas 2.55Infosys Ltd. Software 2.53State Bank Of India Banks 2.51RBL Bank Ltd Banks 2.40Bharat PetroleumCorporation Ltd. Petroleum Products 2.39Ultratech Cement Ltd. Cement 2.39HDFC Ltd. Finance 2.37OCL India Ltd Cement 2.36SKF India Ltd Industrial Products 2.29Axis Bank Ltd Banks 2.26Larsen And Toubro Ltd. Construction Project 2.20GAIL (India) Ltd. Gas 2.08Cadila Healthcare Ltd. Pharmaceuticals 2.00Whirlpool of India Ltd. Consumer Durables 1.81Bajaj Finance Limited Finance 1.63Techno Electric &Engineering Co Ltd. Construction Project 1.62UPL Ltd Pesticides 1.55The Ramco Cements Ltd Cement 1.50Solar Industries India Limited Chemicals 1.48AU Small Finance Bank Ltd. Banks 1.46Tata Motors Ltd. Auto 1.38Federal Bank Ltd. Banks 1.36Amara Raja Batteries Ltd. Auto Ancillaries 1.23Max Financial Services Ltd. Finance 1.21Strides Shasun Ltd. Pharmaceuticals 1.17Maruti Suzuki India Limited Auto 1.14
Scheme Inception : - November 23, 2005. The returns are calculated by XIRR approach assuming investment of 10,000/- on the 1st working `day of every month. XIRR helps in calculating return on investments given an initial and final value and a series of cash inflows and outflows and taking the time of investment into consideration. Since inception returns are assumed to be starting from the beginning of the subsequent month from the date of inception. # Benchmark ; ̂ Additional BenchmarkKotak Tax Saver NAV as on July 31, 2017: `20.063 (Dividend Option), `23.05 (Direct Dividend Option), `40.687 (Growth Option), ` 43.185 (Direct Growth Option)
Monthly SIP of 10000`
Total amount invested ( )`
Total Value as on July 31, 2017 ( )`
Scheme Returns (%)
Nifty 500 ( )#`
Nifty 500 Returns (%)
Nifty 50 ( )^`
Nifty 50 Returns (%)
1 year 3 years 5 years 7 years 10 years Since Inception
120,000 360,000 600,000 840,000 1,200,000 1,410,000
137,114 468,393 986,636 1,538,227 2,571,624 3,257,913
27.61 17.88 20.00 16.98 14.58 13.46
137,793 452,295 900,534 1,386,861 2,298,449 2,937,320
28.75 15.41 16.26 14.08 12.48 11.85
136,500 434,380 836,566 1,283,988 2,125,229 2,742,171
26.58 12.60 13.26 11.92 11.01 10.78
Systematic Investment Plan (SIP) If you had invested `10,000 every month
Style
This product is suitable for investors who are seeking*:� long term capital growth with a 3 year lock in� Investment in portfolio of predominantly equity &
equity related securities.* Investors should consult their financial advisors if in doubt about whether the product is suitable for them.
SECTOR ALLOCATION (%)
Value Blend Growth Size
Large
Mid
Small
31.66
30.04
11.36
17.13
9.32
8.93
2.32
7.17
12.27
6.22
2.99
5.21
5.24
4.95
4.28
3.82
8.88
3.54
2.48
2.98
Benchmark
Scheme
Financial Services Energy Automobile Cement & Cement Products Consumer Goods
Industrial Manufacturing Pharma Constructions IT Services
Issuer/Instrument Industry/Rating % to Net Assets
Issuer/Instrument Industry/Rating % to Net Assets
�It is better to have a hen tomorrow, than an egg today�
9

Investment Objective
To generate capital appreciation from a diversified portfolio of equity and equity related securities. However, there is no assurance that the objective of the scheme will be realized.
Available Plans/Options
A) Regular Plan B) Direct Plan
Options: Dividend Payout, Dividend Reinvestment & Growth (applicable for all plans)
Dividend Frequency
Trustee�s Discretion
Ratios
Source: $ICRA MFI Explorer.
Minimum Investment Amount
Initial Investment: `5000 and in multiple of `1 for purchase and for ̀ 0.01 for switches
Additional Investment: `1000 & in multiples of ̀ 1
Ideal Investments Horizon: 3 years & above
Load Structure
Entry Load: Nil. (applicable for all plans)
Exit Load:
I) For redemptions / switch outs (including SIP/STP) within 1 year from the date of allotment of units:1%
ii) For redemptions / switch outs (including SIP/STP) after 1 year from the date of allotment of units:NIL
Total Expense Ratio**
Regular: 2.37%; Direct: 1.11%
7
SYSTEMATIC INVESTMENT PLAN (SIP)
Product Label
Investors understand that their principal will be at moderately high risk
Riskometer
yletaredo
M
Moderate
Low
High
Low
High
LOW HIGH
Moderately
* For Fund Manager experience, please refer page 54-55.. ## Risk rate assumed to be 6.25% ( FBIL Overnight MIBOR rate as on 31st July 2017). **Total Expense Ratio excludes applicable B15 fee and service tax. For last three dividends, please refer page no 56-58. For scheme performance, please refer page no 45-53
PORTFOLIO
Benchmark: Nifty Midcap 100Fund Manager: Mr. Pankaj Tibrewal* AAUM: ` crs 709.71
AUM: ` crs718.43Allotment date: February 24, 2005
KOTAK MID-CAPAn Open - Ended Equity Growth Scheme (As on July 31, 2017)
45.97%
1.01
1.03
15.33%
Portfolio Turnover
$Beta
$Sharpe##
$Standard Deviation
Investment StyleStyle
Equity & Equity related (Listed/Awaiting listing on Stock Exchange) Techno Electric &Engineering Co Ltd. Construction Project 2.68V.S.T Tillers Tractors Ltd Auto 2.60Strides Shasun Ltd. Pharmaceuticals 2.55IndusInd Bank Ltd. Banks 2.52ICICI Bank Ltd. Banks 2.47Fag Bearings India Ltd. Industrial Products 2.44Solar Industries India Limited Chemicals 2.40Motherson Sumi Systems Ltd. Auto Ancillaries 2.37Atul Ltd. Chemicals 2.33Federal Bank Ltd. Banks 2.30Apollo Hospitals Enterprises Ltd. Healthcare Services 2.29Shriram City Union Finance Ltd. Finance 2.16JK Cement Ltd. Cement 2.08Torrent Pharmaceuticals Ltd. Pharmaceuticals 2.06Finolex Cables Ltd. Industrial Products 2.01Amara Raja Batteries Ltd. Auto Ancillaries 1.97Laurus Labs Ltd Pharmaceuticals 1.88Persistent Systems Limited Software 1.88Sundaram Finance Ltd. Finance 1.87Whirlpool of India Ltd. Consumer Durables 1.85Bajaj Finserv Ltd. Finance 1.74Allcargo Global Logistics Ltd. Transportation 1.73Bharat Forge Ltd. Industrial Products 1.66Cadila Healthcare Ltd. Pharmaceuticals 1.66Hawkins Cooker Ltd Household Appliances 1.65Sun TV Limited. Media and Entertainment 1.65S Chand And Company Ltd Media and Entertainment 1.62SRF Ltd. Textile Products 1.60Eveready Industries India Ltd. Consumer Non Durables 1.59Hindustan PetroleumCorporation Ltd Petroleum Products 1.57DB Corp Limited Media and Entertainment 1.55The Ramco Cements Ltd Cement 1.49Mcleod Russel India Ltd Consumer Non Durables 1.48Mahindra & Mahindra FinancialServices Ltd. Finance 1.46BSE Ltd Finance 1.42
Thermax Ltd. Industrial Capital Goods 1.41Navneet Education Ltd. Media and Entertainment 1.39SKF India Ltd Industrial Products 1.39AU Small Finance Bank Ltd. Banks 1.38Kewal Kiran Clothing Limited. Textile Products 1.38Kajaria Ceramics Ltd. Construction 1.36Va Tech Wabag Limited Engineering Services 1.36Avenue Supermarts Ltd Retailing 1.25Arvind Ltd Textile Products 1.20Castrol (India ) Ltd. Petroleum Products 1.16Divi s Laboratories Limited Pharmaceuticals 1.13ICICI Prudential Life InsuranceCompany Ltd Finance 1.12Bank Of Baroda Banks 1.11UPL Ltd Pesticides 1.03Shriram TransportFinance Co Ltd. Finance 1.02Supreme Industries Limited Industrial Products 1.00Axis Bank Ltd Banks 0.98JMC Projects (India) Ltd Construction 0.98Voltas Ltd. Construction Project 0.98MRF Limited Auto Ancillaries 0.96Bajaj Finance Limited Finance 0.84Jk Lakshmi Cement Ltd. Cement 0.80WPIL Ltd Industrial Products 0.73Pennar Engineered BuildingSystems Limited Ferrous Metals 0.58Listed/Awaiting Listing on Stock Exchange - Total 95.12Futures RBL Bank Ltd-AUG2017 2.08Futures (Market value represents Notional Value) - Total 2.08
TERM DEPOSITS AXIS Bank Ltd. 0.28Term Deposits - Total 0.28
Collateral Borrowing & Lending obligation 3.95Net Current Assets/(Liabilities) -1.43Grand Total 100.00
Notes: Term Deposit as provided above is towards margin for derivatives transactions. Midcap and Small cap stocks as a % age of Net Assets: 68.88%.
Monthly SIP of 10000`
Total amount invested ( )`
Total Value as on July 31, 2017 ( )`
Scheme Returns (%)
Nifty Midcap 100 ( )#`
Nifty Midcap 100 Returns (%)
Nifty 50 ( )^`
Nifty 50 Returns (%)
1 year 3 years 5 years 7 years 10 years Since Inception
120,000 360,000 600,000 840,000 1,200,000 1,500,000
135,786 488,897 1,132,641 1,852,764 3,357,646 4,823,438
25.40 20.94 25.73 22.21 19.53 17.35
137,871 486,863 1,050,510 1,622,885 2,805,759 4,173,159
28.88 20.64 22.59 18.48 16.20 15.28
136,500 434,380 836,566 1,283,988 2,125,229 3,161,390
26.58 12.60 13.26 11.92 11.01 11.28
Systematic Investment Plan (SIP) If you had invested `10,000 every month
Scheme Inception : - February 24,2005. The returns are calculated by XIRR approach assuming investment of 10,000/- on the 1st working day `of every month. XIRR helps in calculating return on investments given an initial and final value and a series of cash inflows and outflows and taking the time of investment into consideration. Since inception returns are assumed to be starting from the beginning of the subsequent month from the date of inception. # Benchmark ; ̂ Additional BenchmarkKotak Mid-cap NAV as on July 31, 2017: `39.393 (Dividend Option), `41.827 (Direct Dividend Option), `74.005 (Growth Option), `78.215 (Direct Growth Option)
This product is suitable for investors who are seeking*:� Long term capital growth� Investment in equity & equity related securities
predominantly in mid cap stocks.* Investors should consult their financial advisors if in doubt about whether the product is suitable for them.
SECTOR ALLOCATION (%)
Value Blend Growth Size
Large
Mid
Small
Issuer/Instrument Industry/Rating % to Net Assets
Issuer/Instrument Industry/Rating % to Net Assets
�Aim to beat in�ation with equity mutual funds�
23.26
24.47
7.08
10.63
9.05
9.27
6.53
7.91
12.55
7.55
8.24
7.04
1.58
6.21
4.56
6.00
1.58
4.73
2.86
4.37
Benchmark
Scheme
Financial Services Industrial Manufacturing Pharma Automobile Consumer Goods
Services Media & Entertainment Constructions Chemicals Cement & Cement Products
10

Investment Objective
The investment objective of the scheme is to generate long-term capital appreciation from a portfolio of equity and equity related securities, by investing predominantly in mid and small cap companies. However, there is no assurance that the objective of the scheme will be realized.
Available Plans/Options
A) Regular Plan B) Direct Plan
Options: Dividend Payout, Dividend Reinvestment & Growth (applicable for all plans)
Dividend Frequency
Trustee�s Discretion
Ratios
Source: $ICRA MFI Explorer.
Minimum Investment Amount
Initial Investment: `5000 and in multiple of `1 for purchase and for ̀ 0.01 for switches
Additional Investment: `1000 & in multiples of ̀ 1
Ideal Investments Horizon: 3 years & above
Load Structure
Entry Load: Nil. (applicable for all plans)
Exit Load:
I For redemptions / switch outs (including SIP/STP) within 1 year from the date of allotment of units:1%.
ii) For redemption/switch outs (including SIP/STP) after 1 year from the date of allotment of units: Nil.
Total Expense Ratio**
Regular: 2.09%; Direct: 0.89%
7
SYSTEMATIC INVESTMENT PLAN (SIP)
Product Label
Investors understand that their principal will be at moderately high risk
Riskometer
yletaredo
M
Moderate
Low
High
Low
High
LOW HIGH
Moderately
SECTOR ALLOCATION (%)
* For Fund Manager experience, please refer page 54-55.. ## Risk rate assumed to be 6.25% ( FBIL Overnight MIBOR rate as on 31st July 2017). **Total Expense Ratio excludes applicable B15 fee and service tax.For last three dividends, please refer page no 56-58. For scheme performance, please refer page no 45-53
PORTFOLIO
Benchmark: S&P BSE MID SMALL CAPFund Manager: Mr. Pankaj Tibrewal* AAUM: ` crs 2,132.31
AUM: ` crs2,181.80Allotment date: March 30, 2007
KOTAK EMERGING EQUITYAn Open - Ended Equity Growth Scheme (As on July 31, 2017)
30.69%
0.93
1.17
15.05%
Portfolio Turnover
$Beta
$Sharpe##
$Standard Deviation
Investment Style
Style
Equity & Equity related (Listed/Awaiting listing on Stock Exchange) IndusInd Bank Ltd. Banks 3.48Fag Bearings India Ltd. Industrial Products 2.85Bharat Earth Movers Ltd. Industrial Capital Goods 2.48Apollo Hospitals Enterprises Ltd. Healthcare Services 2.43Atul Ltd. Chemicals 2.39Federal Bank Ltd. Banks 2.38Motherson Sumi Systems Ltd. Auto Ancillaries 2.35Strides Shasun Ltd. Pharmaceuticals 2.29Bata India Ltd. Consumer Durables 2.26Solar Industries India Limited Chemicals 2.06Finolex Cables Ltd. Industrial Products 2.05Sundaram Finance Ltd. Finance 1.99Persistent Systems Limited Software 1.96Navneet Education Ltd. Media and Entertainment 1.92Whirlpool of India Ltd. Consumer Durables 1.88Kirloskar Oil Engines Ltd. Industrial Products 1.86Amara Raja Batteries Ltd. Auto Ancillaries 1.84Shriram City Union Finance Ltd. Finance 1.84ICICI Bank Ltd. Banks 1.83Kajaria Ceramics Ltd. Construction 1.80Eveready Industries India Ltd. Consumer Non Durables 1.79Kewal Kiran Clothing Limited. Textile Products 1.78Coromandel International Ltd. Fertilisers 1.77SKF India Ltd Industrial Products 1.76V-Guard Industries Ltd. Industrial Capital Goods 1.71The Ramco Cements Ltd Cement 1.70Allcargo Global Logistics Ltd. Transportation 1.68SRF Ltd. Textile Products 1.65Mahindra & MahindraFinancial Services Ltd. Finance 1.62Ramkrishna Forgings Ltd. Industrial Products 1.62Torrent Pharmaceuticals Ltd. Pharmaceuticals 1.62Britannia Industries Ltd. Consumer Non Durables 1.53DB Corp Limited Media and Entertainment 1.52Hawkins Cooker Ltd Household Appliances 1.52Laurus Labs Ltd Pharmaceuticals 1.44Bank Of Baroda Banks 1.43
Thermax Ltd. Industrial Capital Goods 1.43Equitas Holdings Ltd Finance 1.38Va Tech Wabag Limited Engineering Services 1.38Zee EntertainmentEnterprises Ltd Media and Entertainment 1.34Carborundum Universal Ltd. Industrial Products 1.32Oberoi Realty Ltd Construction 1.32Sheela Foam Ltd Consumer Durables 1.18Supreme Industries Limited Industrial Products 1.13PNC INFRATECH LIMITED Construction 1.11ICICI Prudential Life InsuranceCompany Ltd Finance 1.09Emami Ltd. Consumer Non Durables 1.02Bajaj Finance Limited Finance 0.97Divi s Laboratories Limited Pharmaceuticals 0.94Castrol (India ) Ltd. Petroleum Products 0.89Shriram Transport Finance Co Ltd. Finance 0.88Kec International Ltd. Construction Project 0.85Indraprastha Gas Ltd. Gas 0.84Jk Lakshmi Cement Ltd. Cement 0.81Kirloskar Brothers Ltd. Industrial Products 0.74Zuari Agro Chemicals Ltd Fertilisers 0.70D-Link (India) Ltd Hardware 0.66Pennar Engineered BuildingSystems Limited Ferrous Metals 0.55WPIL Ltd Industrial Products 0.54RBL Bank Ltd Banks 0.01Listed/Awaiting Listing on Stock Exchange - Total 93.16Futures RBL Bank Ltd-AUG2017 2.19Futures (Market value represents Notional Value) - Total 2.19
TERM DEPOSITS AXIS Bank Ltd. 0.69Term Deposits - Total 0.69
Collateral Borrowing & Lending obligation 5.95Net Current Assets/(Liabilities) -1.99Grand Total 100.00
Notes: Term Deposit as provided above is towards margin for derivatives transactions. Midcap and Small cap stocks as a % age of Net Assets: 87.98%.
Scheme Inception : - March 30, 2007. The returns are calculated by XIRR approach assuming investment of 10,000/- on the 1st working day of `every month. XIRR helps in calculating return on investments given an initial and final value and a series of cash inflows and outflows and taking the time of investment into consideration. Since inception returns are assumed to be starting from the beginning of the subsequent month from the date of inception. # Benchmark ; ̂ Additional BenchmarkKotak Emerging Equity NAV as on July 31, 2017: `25.384 (Dividend Option), `28.595 (Direct Dividend Option), `37.139 (Growth Option), `39.089 (Direct Growth Option)
1 year 3 years 5 years 7 years 10 years Since Inception
120,000 360,000 600,000 840,000 1,200,000 1,250,000
135,766 494,921 1,202,432 1,992,769 3,488,768 3,665,447
25.36 21.82 28.24 24.27 20.24 19.52
140,076 492,581 1,057,673 1,625,956 2,730,457 2,884,995
32.59 21.48 22.88 18.54 15.69 15.28
136,500 434,380 836,566 1,283,988 2,125,229 2,249,991
26.58 12.60 13.26 11.92 11.01 10.84
Systematic Investment Plan (SIP) If you had invested `10,000 every month
Monthly SIP of 10000`
Total amount invested ( )`
Total Value as on July 31, 2017( )`
Scheme Returns (%)
S&P BSE MidSmallCap ( )#`
S&P BSE MidSmallCap Returns (%)
Nifty 50 ( )^`
Nifty 50 Returns (%)
This product is suitable for investors who are seeking*:� Long term capital growth� Investment in equity & equity related securities
predominantly in mid & small cap companies* Investors should consult their financial advisors if in doubt about whether the product is suitable for them.
Value Blend Growth Size
Large
Mid
Small
Issuer/Instrument Industry/Rating % to Net Assets
Issuer/Instrument Industry/Rating % to Net Assets
21.78
21.09
9.49
20.68
13.25
10.26
6.37
7.01
7.25
6.29
1.90
4.78
2.73
4.45
5.52
4.23
6.15
4.18
3.78
2.62
Benchmark
Scheme
Financial Services Industrial Manufacturing Consumer Goods Services Pharma
Media & Entertainment Chemicals Constructions AutomobileIT
11

Investment Objective
The investment objective of the Scheme is to generate long-term capital appreciation f r o m a d i v e r s i f i e d p o r t f o l i o o f predominantly (at least 65%) equity and equity-related securities of companies involved in economic development of India as a result of potential investments in infrastructure and unfolding economic reforms.However, there is no assurance that the objective of the scheme will be realized.
Available Plans/Options
A) Regular Plan B) Direct Plan
Options: Dividend Payout, Dividend Reinvestment & Growth (applicable for all plans)
Dividend Frequency
Trustee�s Discretion
Ratios
Source: $ICRA MFI Explorer.
Minimum Investment Amount
Initial Investment: `5000 and in multiple of `1 for purchase and for ̀ 0.01 for switches
Additional Investment: `1000 & in multiples of ̀ 1
Ideal Investments Horizon: 3 years & above
Load Structure
Entry Load: Nil. (applicable for all plans)
Exit Load:
I) For redemptions / switch outs (including SIP/STP) within 1 year from the date of allotment of units: 1%;
ii) For redemptions / switch outs (including SIP/STP) after 1 year from the date of allotment of units: NIL;
Total Expense Ratio**
Regular: 2.53%; Direct: 1.13%
7
SYSTEMATIC INVESTMENT PLAN (SIP)
Product Label
* For Fund Manager experience, please refer page 54-55. ## Risk rate assumed to be 6.25% ( FBIL Overnight MIBOR rate as on 31st July 2017). **Total Expense Ratio excludes applicable B15 fee and service tax.For last three dividends, please refer page no 56-58. For scheme performance, please refer page no 45-53
PORTFOLIO
Benchmark: S&P BSE � 100Fund Manager: Mr. Harish Krishnan* AAUM: ` crs 308.03
AUM: ` crs318.56Allotment date: February 25, 2008
KOTAK INFRASTRUCTURE & ECONOMIC REFORM FUND
An Open - Ended Equity Growth Scheme (As on July 31, 2017)
41.59%
0.90
0.80
14.98%
Portfolio Turnover
$Beta
$Sharpe##
$Standard Deviation
Investment Style
Equity & Equity related (Listed/Awaiting listing on Stock Exchange) Shree Cement Ltd. Cement 6.58Indraprastha Gas Ltd. Gas 5.18Bharat Earth Movers Ltd. Industrial Capital Goods 5.15Larsen And Toubro Ltd. Construction Project 4.78Kirloskar Oil Engines Ltd. Industrial Products 4.44Container Corporation ofIndia Ltd. Transportation 3.95SKF India Ltd Industrial Products 3.91National Thermal PowerCorporation Limited Power 3.61AIA Engineering Limited Industrial Products 3.41Cummins India Ltd. Industrial Products 3.41GAIL (India) Ltd. Gas 3.25Ultratech Cement Ltd. Cement 3.25Fag Bearings India Ltd. Industrial Products 3.14Kajaria Ceramics Ltd. Construction 3.08Solar Industries India Limited Chemicals 2.82Thermax Ltd. Industrial Capital Goods 2.73Bharti Airtel Ltd. Telecom - Services 2.63KSB Pump Ltd Industrial Products 2.17Allcargo Global Logistics Ltd. Transportation 2.15
Tejas Networks Ltd Telecom - Equipment & Accessories 2.06Mahanagar Gas Ltd Gas 1.96AU Small Finance Bank Ltd. Banks 1.85Linde India Ltd. Chemicals 1.78Petronet LNG Ltd. Gas 1.76The Ramco Cements Ltd Cement 1.70Bharat Electronics Ltd Industrial Capital Goods 1.68Gujarat Gas Company Ltd Gas 1.60MRF Limited Auto Ancillaries 1.52GE Power India Limited Industrial Capital Goods 1.46Jk Lakshmi Cement Ltd. Cement 1.44Supreme Industries Limited Industrial Products 1.34Gateway Distriparks Ltd. Transportation 1.29Somany Ceramics Ltd. Construction 1.26PNC INFRATECH LIMITED Construction 0.89GP Petroleums Limited Petroleum Products 0.86Dalmia Bharat Ltd. Cement 0.83JMC Projects (India) Ltd Construction 0.60WPIL Ltd Industrial Products 0.54Listed/Awaiting Listing on Stock Exchange - Total 96.06Collateral Borrowing & Lending obligation 5.05Net Current Assets/(Liabilities) -1.11Grand Total 100.00
1 year 3 years 5 years 7 years Since Inception
120,000 360,000 600,000 840,000 1,140,000
137,850 475,582 1,066,278 1,631,212 2,554,018
28.84 18.96 23.21 18.63 16.28
136,975 441,237 856,882 1,315,703 2,063,201
27.38 13.68 14.24 12.60 12.05
136,500 434,380 836,566 1,283,988 2,009,306
26.58 12.60 13.26 11.92 11.52
Systematic Investment Plan (SIP) If you had invested `10,000 every month
Monthly SIP of 10000`
Total amount invested ( )`
Total Value as on July 31, 2017 ( )`
Scheme Returns (%)
S&P BSE 100 ( )#`
S&P BSE 100 Returns (%)
Nifty 50 ( )^`
Nifty 50 Returns (%)
Scheme Inception : - February 25, 2008. The returns are calculated by XIRR approach assuming investment of 10,000/- on the 1st working day `of every month. XIRR helps in calculating return on investments given an initial and final value and a series of cash inflows and outflows and taking the time of investment into consideration. Since inception returns are assumed to be starting from the beginning of the subsequent month from the date of inception. # Benchmark ; ̂ Additional Benchmark
Kotak Infrastructure & Economic Reform Fund NAV as on July 31, 2017: ̀ 19.592 (Dividend Option), ̀ 22.051 (Direct Dividend Option), `20.851 (Growth Option), ̀ 22.067 (Direct Growth Option)
This product is suitable for investors who are seeking*:� Long term capital growth� Long term capital appreciation by investing in equity and
equity related instruments of companies contributing to infrastructure and economic development of India
* Investors should consult their financial advisors if in doubt about whether the product is suitable for them.
Investors understand that their principal will be at high risk
Riskometer
yletaredo
M
Moderate
Low
High
Low
High
LOW HIGH
Moderately
Style
SECTOR ALLOCATION (%)
Value Blend Growth Size
Large
Mid
Small
Issuer/Instrument Industry/Rating % to Net Assets
Issuer/Instrument Industry/Rating % to Net Assets
�Money is not everything in life. Make sure that you have made enough money before making that statement� - Warren Buffe�
22.36 13.80 13.75 11.02 7.39 5.835.05
4.784.60
3.61 7.81
Industrial Products Cement
Gas
Industrial Capital GoodsTransportation
ConstructionCBLO & Term Deposits & Rev.RepoConstruction Project
Chemicals
PowerREST
12

15.71 14.59 12.97 6.18 5.05 4.92 4.79 4.60
4.34
3.81 23.04
Government Dated Securities BanksDebentures and Bonds
Auto
CBLO & Term Deposits & Rev.Repo
Media and EntertainmentPharmaceuticals Industrial Products
Finance
Consumer Non Durables
Others
Investment ObjectiveTo achieve growth by investing in equity & equity related instruments, balanced with income generation by investing in debt &money market instruments. However, there is no assurance that the objective of the scheme will be realized.
Available Plans/OptionsA) Regular Plan B) Direct Plan Options: Dividend Payout, Dividend Reinvestment & Growth (applicable for all plans)
Dividend FrequencyHalf Yearly (25th of Mar/Sep)
Ratios
Source: $ICRA MFI Explorer.
Minimum Investment AmountInitial Investment: `5000 and in multiple of `1 for purchase and for ̀ 0.01 for switches
Additional Investment: `1000 & in multiples of ̀ 1
Ideal Investments Horizon: 3 years & above
Load StructureEntry Load: Nil. (applicable for all plans)Exit Load: i) For redemption/switch out of upto 10% of the initial investment amount (limit) purchased or switched in within 1 year from the date of allotment: Nil.ii) If units redeemed or switched out are in excess of the limit within 1 year from the date of allotment: 1%.iii) If units are redeemed or switched out on or alter 1 year from the date of allotment: Nil.
Total Expense Ratio**Regular: 2.12%; Direct: 0.92%
7
SYSTEMATIC INVESTMENT PLAN (SIP)
* For Fund Manager experience, please refer page 54-55.. ## Risk rate assumed to be 6.25% ( FBIL Overnight MIBOR rate as on 31st July 2017). **Total Expense Ratio excludes applicable B15 fee and service tax. For last three dividends, please refer page no 56-58. For scheme performance, please refer page no 45-53
PORTFOLIO
Benchmark: Crisil Balanced Fund
Fund Manager: Mr. Pankaj Tibrewal and
Mr. Abhishek Bisen*
AAUM: ` crs 1,809.89 AUM: ` crs1,889.01
Allotment date: November 25, 1999
KOTAK BALANCEAn Open - Ended Balanced Scheme (As on July 31, 2017)
19.60%
1.14
0.63
10.72%
Portfolio Turnover
$Beta
$Sharpe##
$Standard Deviation
Investment Style
Note: Term Deposit as provided above is towards margin for derivatives transactions
SECTOR ALLOCATION (%)
Equity & Equity related (Listed/Awaiting listing on Stock Exchange) HDFC Bank Ltd. Banks 3.22State Bank Of India Banks 3.18ICICI Bank Ltd. Banks 2.79Tata Motors Ltd. Auto 1.87Larsen And Toubro Ltd. Construction Project 1.85ITC Ltd. Consumer Non Durables 1.82V.S.T Tillers Tractors Ltd Auto 1.79Fag Bearings India Ltd. Industrial Products 1.73IndusInd Bank Ltd. Banks 1.73Zee EntertainmentEnterprises Ltd Media and Entertainment 1.66Apollo Hospitals Enterprises Ltd. Healthcare Services 1.57GAIL (India) Ltd. Gas 1.56Axis Bank Ltd Banks 1.51Motherson Sumi Systems Ltd. Auto Ancillaries 1.46Infosys Ltd. Software 1.44Maruti Suzuki India Limited Auto 1.43JK Cement Ltd. Cement 1.36Strides Shasun Ltd. Pharmaceuticals 1.31Atul Ltd. Chemicals 1.27Bank Of Baroda Banks 1.25Thermax Ltd. Industrial Capital Goods 1.22HDFC Ltd. Finance 1.21Kajaria Ceramics Ltd. Construction 1.20GlaxoSmithkline ConsumerHealthcare Ltd Consumer Non Durables 1.16Mahindra & Mahindra Ltd. Auto 1.09Techno Electric &Engineering Co Ltd. Construction Project 1.08Whirlpool of India Ltd. Consumer Durables 1.01Gujarat Gas Company Ltd Gas 1.00The Ramco Cements Ltd Cement 0.99S Chand And Company Ltd Media and Entertainment 0.96Laurus Labs Ltd Pharmaceuticals 0.95Reliance Industries Ltd. Petroleum Products 0.92Federal Bank Ltd. Banks 0.90Sun TV Limited. Media and Entertainment 0.86Finolex Cables Ltd. Industrial Products 0.84Mcleod Russel India Ltd Consumer Non Durables 0.83DB Corp Limited Media and Entertainment 0.81Eris Lifesciences Ltd Pharmaceuticals 0.78Kirloskar Oil Engines Ltd. Industrial Products 0.77Solar Industries India Limited Chemicals 0.75Cipla Ltd. Pharmaceuticals 0.73Bharat Forge Ltd. Industrial Products 0.72BSE Ltd Finance 0.71ICICI Prudential Life InsuranceCompany Ltd Finance 0.69Mahindra & Mahindra FinancialServices Ltd. Finance 0.66Music Broadcast Limited Media and Entertainment 0.63Persistent Systems Limited Software 0.62SRF Ltd. Textile Products 0.62
Lupin Ltd. Pharmaceuticals 0.55Ramkrishna Forgings Ltd. Industrial Products 0.54Va Tech Wabag Limited Engineering Services 0.54Tata Consultancy Services Ltd. Software 0.52Equitas Holdings Ltd Finance 0.49Divi s Laboratories Limited Pharmaceuticals 0.47Arvind Ltd Textile Products 0.40Shriram Transport Finance Co Ltd. Finance 0.35Inter Globe Aviation Ltd Transportation 0.34HDFC Ltd. Warrants Finance 0.23RBL Bank Ltd Banks 0.01Listed/Awaiting Listing on Stock Exchange - Total 64.95Futures RBL Bank Ltd-AUG2017 1.40Futures (Market value represents Notional Value) - Total 1.40
Debt Instruments Debentures and Bonds Corporate Debt/Financial Institutions Mahindra & MahindraFinancial Services Ltd. FITCH IND AAA 2.62LIC Housing Finance Ltd. CRISIL AAA 0.03Tata Sons Ltd. CRISIL AAA 0.01Corporate Debt/Financial Institutions - Total 2.66Public Sector Undertakings U P Power Corporation Ltd(GuaranteedBy UP State Government) FITCH IND AA(SO) 3.59Bank of India CRISIL A+ 1.84Vijaya Bank ICRA AA- 1.62Syndicate Bank CARE AA- 1.50Punjab & Sind Bank ICRA A+ 0.77Allahabad Bank FITCH IND A 0.53Konkan Railway Corporation Ltd. ICRA AAA 0.28Power Finance Corporation Ltd. CRISIL AAA 0.18Public Sector Undertakings - Total 10.31Government Dated Securities 7.61% Central Government SOV 7.806.79% Central Government SOV 4.217.73% Central Government SOV 2.827.70% State Government SOV 0.388.18% State Government SOV 0.288.45% State Government SOV 0.118.27% State Government SOV 0.058.29% State Government SOV 0.047.35% Central Government SOV 0.018.43% State Government SOV 0.01Government Dated Securities - Total 15.71
TERM DEPOSITS AXIS Bank Ltd. 0.45Term Deposits - Total 0.45
Collateral Borrowing & Lending obligation 4.60Net Current Assets/(Liabilities) -0.08Grand Total 100.00
Scheme Inception : - November 25,1999. The returns are calculated by XIRR approach assuming investment of 10,000/- on the 1st working `day of every month. XIRR helps in calculating return on investments given an initial and final value and a series of cash inflows and outflows and taking the time of investment into consideration. Since inception returns are assumed to be starting from the beginning of the subsequent month from the date of inception. # Benchmark ; ̂ Additional BenchmarkKotak Balance NAV as on July 31, 2017: ̀ 17.034 (Dividend Option), ̀ 18.264 (Direct Dividend Option), ̀ 23.619 (Growth Option) ̀ 24.94 (Direct Growth Option)
Monthly SIP of 10000`
Total amount invested ( )`
Total Value as on July 31, 2017 ( )`
Scheme Returns (%)
CRISIL Balanced Fund ( )#`
CRISIL Balanced Fund Returns (%)
Nifty 50 ( )^`
Nifty 50 Returns (%)
1 year 3 years 5 years 7 years 10 years Since Inception
120,000 360,000 600,000 840,000 1,200,000 2,130,000
131,187 443,969 865,271 1,354,166 2,275,338 9,827,905
17.82 14.11 14.63 13.41 12.29 15.36
132,730 430,784 819,392 1,260,397 2,081,384 NA
20.35 12.02 12.43 11.40 10.62 NA
136,500 434,380 836,566 1,283,988 2,125,229 8,179,485
26.58 12.60 13.26 11.92 11.01 13.63
Systematic Investment Plan (SIP) If you had invested `10,000 every month
Style
Investors understand that their principal will be at moderately high risk
Riskometer
yletaredo
M
Moderate
Low
High
Low
High
LOW HIGH
Moderately
This product is suitable for investors who are seeking*:� Long term capital growth� Investment in equity & equity related securities
balanced with income generation by investing in debt & money market instruments
* Investors should consult their financial advisors if in doubt about whether the product is suitable for them.
Product Label
Value Blend Growth Size
Large
Mid
Small
Issuer/Instrument Industry/Rating % to Net Assets
Issuer/Instrument Industry/Rating % to Net Assets
13

Investment ObjectiveThe investment objective of the scheme is to generate capital appreciation and income by predominantly investing in arbitrage opportunities in the cash and derivatives segment of the equity market, and by investing the balance in debt and money market instruments. However, there is no assurance that the objective of the scheme will be realized.
Available Plans/OptionsA) Regular Plan B) Direct Plan Options: Dividend Payout, Dividend Reinvestment & Growth (applicable for all plans) Dividend FrequencyFortnightly (Every alternate Monday from the 1st record date), Monthly (Monday preceding the last Thursday of the month), Bimonthly (Monday preceding the last Thursday of the following months - January, March, May, July, September, November)
Ratios
Source: $ICRA MFI Explorer. Minimum Investment AmountInitial Investment: `5000 and in multiple of `1 for purchase and for ̀ 0.01 for switchesAdditional Investment: `1000 & in multiples of ̀ 1Ideal Investments Horizon: 3 months & above
Load StructureEntry Load: Nil. (applicable for all plans)Exit Load: I) For redemptions/switch outs (including SIP/STP) within 30 days from the date of allotment of units: 0.25%II) For redemptions/switch outs (including SIP/STP) after 30 days from the date of allotment of units: Nil
Total Expense Ratio**Regular: 0.89%; Direct: 0.42%
7* For Fund Manager experience, please refer page 54-55. For last three dividends, please refer page no 56-58. For scheme performance, please refer **Total Expense Ratio excludes applicable B15 fee and service tax.page no 45-53
Benchmark: Nifty 50 ArbitrageFund Manager: Mr. Deepak Gupta* AAUM: ` crs 7,260.07
AUM: ` crs8,080.54Allotment date: September 29, 2005
KOTAK EQUITY ARBITRAGEAn Open - Ended Equity Growth Scheme (As on July 31, 2017)
Investment Style
Value Blend Growth Size
Large
Mid
Small
Style
Issuer/Instrument Industry/Rating % to Net Assets % to Net Assets Derivatives
Equity & Equity related (Listed/Awaiting listing on Stock Exchange) Hedged Infosys Ltd. Software 2.16 -2.17Shriram Transport Finance Co Ltd. Finance 1.81 -1.83Bank Of Baroda Banks 1.79 -1.80State Bank Of India Banks 1.57 -1.57MRF Limited Auto Ancillaries 1.48 -1.49Vedanta Ltd. Non - Ferrous Metals 1.41 -1.42JSW Steel Ltd. Ferrous Metals 1.32 -1.32UPL Ltd Pesticides 1.29 -1.30Bharat Forge Ltd. Industrial Products 1.28 -1.29Sun Pharmaceuticals Industries Ltd. Pharmaceuticals 1.25 -1.26Federal Bank Ltd. Banks 1.24 -1.25Hindustan Zinc Ltd. Non - Ferrous Metals 1.16 -1.16IDFC Bank Limited Banks 1.11 -1.12Lupin Ltd. Pharmaceuticals 1.07 -1.08Power Finance Corporation Ltd. Finance 1.01 -1.02DLF Limited Construction 0.97 -0.98Tata Chemicals Ltd. Chemicals 0.91 -0.91Aurobindo Pharma Ltd. Pharmaceuticals 0.78 -0.79Suzlon Energy Ltd. Industrial Capital Goods 0.74 -0.75Sun TV Limited. Media and Entertainment 0.70 -0.71Century Textiles & Industries Ltd. Cement 0.69 -0.69Grasim Industries Ltd. Cement 0.68 -0.68Oil & Natural Gas Corporation Ltd. Oil 0.68 -0.67Apollo Tyres Ltd. Auto Ancillaries 0.66 -0.67Reliance Capital Ltd. Finance 0.64 -0.64Tata Global Beverages Limited Consumer Non Durables 0.64 -0.63Ashok Leyland Ltd. Auto 0.61 -0.61Castrol (India ) Ltd. Petroleum Products 0.59 -0.59Escorts Ltd. Auto 0.58 -0.58Titan Company Ltd. Consumer Durables 0.58 -0.59Glenmark Pharmaceuticals Ltd Pharmaceuticals 0.57 -0.58Jindal Steel & Power Ltd. Ferrous Metals 0.57 -0.58Ultratech Cement Ltd. Cement 0.56 -0.56Piramal Enterprises Limited Pharmaceuticals 0.54 -0.54Tata Motors Ltd - DVR Auto 0.54 -0.54IDFC Limited Finance 0.53 -0.54National Thermal Power Corporation Limited Power 0.53 -0.53Tata Communications Ltd Telecom - Services 0.53 -0.53Divi s Laboratories Limited Pharmaceuticals 0.51 -0.51Tech Mahindra Ltd. Software 0.50 -0.51The South Indian Bank Ltd. Banks 0.50 -0.51Exide Industries Ltd Auto Ancillaries 0.49 -0.49Strides Shasun Ltd. Pharmaceuticals 0.49 -0.49GMR Infrastructure Ltd. Construction Project 0.46 -0.46Jaiprakash Associates Ltd Cement 0.46 -0.47Can Fin Homes Ltd. Finance 0.44 -0.44CESC Ltd. Power 0.44 -0.44Godrej Industries Ltd Consumer Non Durables 0.44 -0.44India Cements Ltd. Cement 0.44 -0.44ITC Ltd. Consumer Non Durables 0.44 -0.44Muthoot Finance Ltd Finance 0.44 -0.44Petronet LNG Ltd. Gas 0.44 -0.44LIC Housing Finance Ltd. Finance 0.43 -0.43Max Financial Services Ltd. Finance 0.43 -0.43Manappuram Finance Ltd Finance 0.42 -0.42NMDC Ltd. Minerals/Mining 0.42 -0.42Gujarat State Fertilizers & Chemicals Ltd. Fertilisers 0.40 -0.40Bata India Ltd. Consumer Durables 0.39 -0.39Colgate Palmolive (India ) Ltd. Consumer Non Durables 0.39 -0.39Fortis Healthcare India Ltd Healthcare Services 0.39 -0.39ICICI Prudential Life Insurance Company Ltd Finance 0.39 -0.39Karnataka Bank Ltd Banks 0.39 -0.39Indiabulls Real Estate Ltd Construction 0.37 -0.37Adani Power Ltd Power 0.35 -0.36Amara Raja Batteries Ltd. Auto Ancillaries 0.34 -0.35Bajaj Finserv Ltd. Finance 0.34 -0.34IRB Infrastructure Developers Ltd Construction 0.34 -0.35Engineers India Ltd. Construction Project 0.33 -0.33Bharat Heavy Electricals Ltd. Industrial Capital Goods 0.32 -0.32Jain Irrigation Systems Ltd. Industrial Products 0.32 -0.33Maruti Suzuki India Limited Auto 0.32 -0.32Reliance Power Ltd Power 0.32 -0.32Indian Bank Banks 0.31 -0.31Indraprastha Gas Ltd. Gas 0.31 -0.31PVR Ltd Media and Entertainment 0.30 -0.31United Breweries Ltd. Consumer Non Durables 0.30 -0.30Dewan Housing Finance Corporation Ltd. Finance 0.28 -0.28Reliance Infrastructure Ltd Power 0.28 -0.28
PORTFOLIO
Short Medium Long Volatility
Low
Medium
High
Maturity
Investors understand that their principal will be at moderately low risk
yletaredo
M
Moderate
Low
High
Low
High
LOW HIGH
Moderately
This product is suitable for investors who are seeking*:� Income from arbitrage opportunities in the equity market� Investment in arbitrage opportunities in the cash &
derivatives segment of the equity market.* Investors should consult their financial advisors if in doubt about whether the product is suitable for them.
Riskometer
Product Label
402.10%
0.47
0.93
0.47%
Portfolio Turnover
$Beta
$Sharpe##
$Standard Deviation
14

7
KOTAK EQUITY ARBITRAGEAn Open - Ended Equity Growth Scheme (As on July 31, 2017)
Issuer/Instrument Industry/Rating % to Net Assets % to Net Assets Derivatives
PORTFOLIO
JSW Energy Ltd. Power 0.27 -0.28Tata Motors Ltd. Auto 0.27 -0.27Cholamandalam Investment and Finance Company Ltd Finance 0.26 -0.26Development Credit Bank Ltd. Banks 0.26 -0.26NCC Limited Construction Project 0.26 -0.27Tata Elxsi Ltd. Software 0.26 -0.26Balkrishna Industries Ltd Auto Ancillaries 0.25 -0.25Equitas Holdings Ltd Finance 0.25 -0.25Indian Oil Corporation Ltd Petroleum Products 0.25 -0.25Jet Airways (India) Ltd. Transportation 0.25 -0.26PC Jeweller Ltd Consumer Durables 0.25 -0.26Raymond Limited Textile Products 0.25 -0.25Rural Electrification Corporation Ltd Finance 0.25 -0.26ICICI Bank Ltd. Banks 0.24 -0.24Tata Steel Limited. Ferrous Metals 0.24 -0.25TV18 Broadcast Ltd Media and Entertainment 0.24 -0.24KPIT Technologies LImited Software 0.23 -0.23Bharat Financial Inclusion Limited Finance 0.22 -0.23Britannia Industries Ltd. Consumer Non Durables 0.22 -0.22Reliance Defence & Engineering Ltd Industrial Capital Goods 0.22 -0.22SREI Infrastructure Finance Ltd Finance 0.22 -0.22Hindustan Construction Co.Ltd Construction Project 0.21 -0.21MindTree Ltd. Software 0.21 -0.21National Buildings Construction Corporation Limited Construction 0.21 -0.21Torrent Power Ltd Power 0.21 -0.22ACC Ltd. Cement 0.20 -0.20Housing Development and Infrastructure Limited Construction 0.20 -0.20IFCI Ltd. Finance 0.20 -0.20Reliance Industries Ltd. Petroleum Products 0.20 -0.20Bharat Earth Movers Ltd. Industrial Capital Goods 0.19 -0.19Shree Cement Ltd. Cement 0.19 -0.19Godfrey Phillips India Ltd. Consumer Non Durables 0.18 -0.18Hero MotoCorp Ltd. Auto 0.18 -0.18PTC India Ltd. Power 0.18 -0.18Punjab National Bank Banks 0.18 -0.18United Spirits Ltd. Consumer Non Durables 0.18 -0.18Berger Paints (I) Ltd. Consumer Non Durables 0.17 -0.17CG Power and Industrial Solutions Limited Industrial Capital Goods 0.17 -0.17Oil India Limited Oil 0.17 -0.18Adani Enterprises Ltd Trading 0.15 -0.15Balrampur Chini Mills Ltd Consumer Non Durables 0.15 -0.15Cadila Healthcare Ltd. Pharmaceuticals 0.15 -0.15Granules India Ltd. Pharmaceuticals 0.15 -0.15Reliance Communications Ltd. Telecom - Services 0.15 -0.15Ujjivan Financial Services Ltd Finance 0.15 -0.16Hindalco Industries Ltd Non - Ferrous Metals 0.14 -0.14National Aluminium Company Ltd Non - Ferrous Metals 0.14 -0.14Wockhardt Ltd. Pharmaceuticals 0.14 -0.15Bharat Electronics Ltd Industrial Capital Goods 0.13 -0.13GAIL (India) Ltd. Gas 0.13 -0.13Indiabulls Housing Finance Ltd. Finance 0.13 -0.13Inter Globe Aviation Ltd Transportation 0.13 -0.13L&T Finance Holdings Ltd Finance 0.13 -0.13Oriental Bank of Commerce Banks 0.13 -0.14Siemens Ltd. Industrial Capital Goods 0.13 -0.13Bosch Limited Auto Ancillaries 0.12 -0.12Container Corporation of India Ltd. Transportation 0.12 -0.12Kaveri Seed Company Ltd. Consumer Non Durables 0.12 -0.12Mahanagar Gas Ltd Gas 0.12 -0.13Marico Ltd. Consumer Non Durables 0.12 -0.12Pidilite Industries Ltd. Chemicals 0.12 -0.12The Ramco Cements Ltd Cement 0.12 -0.12Chennai Petroleum Corporation Ltd Petroleum Products 0.11 -0.11Dalmia Bharat Ltd. Cement 0.11 -0.12Mahindra & Mahindra Ltd. Auto 0.10 -0.10Motherson Sumi Systems Ltd. Auto Ancillaries 0.10 -0.10Nestle India Ltd. Consumer Non Durables 0.10 -0.10Sintex Industries Ltd. Industrial Products 0.10 -0.10Adani Port and Special Economic Zone Limited Transportation 0.09 -0.09Ajanta Pharma Ltd. Pharmaceuticals 0.09 -0.09Andhra Bank Banks 0.09 -0.09Coal India Ltd. Minerals/Mining 0.09 -0.09Havells India Ltd. Consumer Durables 0.09 -0.09Axis Bank Ltd Banks 0.08 -0.09Dish TV India Ltd. Media and Entertainment 0.08 -0.08Just Dial Limited Software 0.08 -0.08Kajaria Ceramics Ltd. Construction 0.08 -0.08Mangalore Refinery And Petrochemicals Ltd. Petroleum Products 0.08 -0.07NHPC Limited Power 0.08 -0.08Syndicate Bank Banks 0.08 -0.08
15

KOTAK EQUITY ARBITRAGEAn Open - Ended Equity Growth Scheme (As on July 31, 2017)
Issuer/Instrument Industry/Rating % to Net Assets % to Net Assets Derivatives
PORTFOLIO
Capital First Ltd Finance 0.06 -0.06CEAT Ltd. Auto Ancillaries 0.06 -0.06Hindustan Petroleum Corporation Ltd Petroleum Products 0.06 -0.06Idea Cellular Ltd. Telecom - Services 0.06 -0.06Indo Count Industries Ltd. Textiles - Cotton 0.06 -0.06IndusInd Bank Ltd. Banks 0.06 -0.06Union Bank Of India Banks 0.06 -0.06Yes Bank Ltd Banks 0.06 -0.06Larsen And Toubro Ltd. Construction Project 0.05 -0.05Tata Power Co. Ltd. Power 0.05 -0.05Cummins India Ltd. Industrial Products 0.04 -0.04Eicher Motors Ltd Auto 0.04 -0.04Bajaj Auto Ltd. Auto 0.03 -0.03Bharat Petroleum Corporation Ltd. Petroleum Products 0.03 -0.03HCL Technologies Ltd. Software 0.03 -0.03Mahindra & Mahindra Financial Services Ltd. Finance 0.03 -0.03SRF Ltd. Textile Products 0.03 -0.03Dr Reddys Laboratories Ltd Pharmaceuticals 0.02 -0.02Industrial Development Bank of India Ltd. Banks 0.02 -0.02Page Industries Ltd Textile Products 0.02 -0.02Tata Consultancy Services Ltd. Software 0.02 -0.02Ambuja Cements Ltd Cement 0.01 -0.01Biocon Ltd. Pharmaceuticals 0.01 -0.01HDFC Ltd. Finance 0.01 -0.01NIIT Technologies Ltd Software 0.01 -0.01Oracle Financial Services Software Ltd Software 0.01 -0.01Repco Home Finance Limited. Finance 0.01 -0.01Torrent Pharmaceuticals Ltd. Pharmaceuticals 0.01 -0.01Hedged - Total 65.69 -66.11Listed/Awaiting Listing on Stock Exchange - Total 65.69 -66.11Mutual Fund Units Kotak Floater Short Term Direct Growth Mutual Fund Units 8.89 Kotak Corporate Bond Fund Direct Growth Mutual Fund Units 0.63 Mutual Fund Units - Total 9.52 Debt Instruments Debentures and Bonds Corporate Debt/Financial Institutions Indiabulls Housing Finance Limited ICRA AAA 2.48 Kotak Mahindra Prime Ltd. CRISIL AAA 1.06 Corporate Debt/Financial Institutions - Total 3.54 Money Market Instruments Commercial Paper(CP)/Certificate of Deposits(CD) Corporate Debt/Financial Institutions Bajaj Finance Limited CRISIL A1+ 5.48 HDFC Ltd. CRISIL A1+ 0.31 Corporate Debt/Financial Institutions - Total 5.79 TERM DEPOSITS AXIS Bank Ltd. 5.34 IndusInd Bank Ltd. 3.34 HDFC Bank Ltd. 3.13 IDFC Bank Limited 0.74 Ratnakar Bank Ltd 0.32 Kotak Mahindra Bank Ltd. 0.15 Term Deposits - Total 13.02 Collateral Borrowing & Lending obligation 0.49 Net Current Assets/(Liabilities) 1.95 Grand Total 100.00
Note:Term Deposit as provided above is towards margin for derivatives transactions
Kotak Equity Arbitrage NAV as on July 31, 2017: `10.7393 (Dividend Option), `10.8863 (Direct Dividend Option), `23.8717 (Growth Option), `24.4212 (Direct Growth Option), `19.9704 (Bimonthly Option), `20.1622 (Direct Bimonthly Option), `23.2986 (Fortnightly Dividend, ̀ 23.7851 (Direct Fortnightly Dividend)
SECTOR ALLOCATION (%)
13.51 9.52 9.08 8.17 5.79 5.78 3.54
3.51
3.50
3.46
34.14
CBLO & Term Deposits & Rev.Repo
Mutual Fund Units
Finance BanksCommercial Paper (CP)/Certi�cate of Deposits (CD)
PharmaceuticalsDebentures and Bonds Software Auto AncillariesCement
Others
16

Investment ObjectiveThe investment objective of the scheme is to generate capital appreciation and income by predominantly investing in arbitrage opportunities in the cash and derivatives segment of the equity market, and enhance returns with a moderate exposure in equity & equity related instruments. However, there is no assurance that the objective of the scheme will be realized.Available Plans/OptionsA) Regular Plan B) Direct Plan Options: Dividend Payout, Dividend Reinvestment & Growth (applicable for all plans) Dividend FrequencyMonthly (12th of every month) Quarterly (20th of March, June, September and December of every year)Ratios
Source: $ICRA MFI Explorer. Minimum Investment AmountInitial Investment: `5000 and in multiple of `1 for purchase and for ̀ 0.01 for switchesAdditional Investment: `1000 & in multiples of `1 for purchase and for `0.01 for switchesIdeal Investments Horizon: 3 years & aboveLoad StructureEntry Load: Nil.Exit Load:I) For redemption / switch out of upto 10% of the initial investment amount (limit) purchased or switched in within 1 year from the date of allotment: Nil. ii) If units redeemed or switched out are in excess of the limit within 1 year from the date of allotment: 1%.iii) If units are redeemed or switched out on or after 1 year from the date of allotment: Nil.
Total Expense Ratio**Regular: 2.11%; Direct: 1.39%
7* For Fund Manager experience, please refer page 54-55. For last three dividends, please refer page no 56-58. For scheme performance, please refer **Total Expense Ratio excludes applicable B15 fee and service tax.page no 45-53
Benchmark: 75% of Nifty 50 Arbitrage index and 25% in Nifty 50
Fund Manager: Mr. Deepak Gupta &
Mr. Abhishek Bisen*
AAUM: ` crs 798.35
AUM: ` crs817.40Allotment date: October 13, 2014
KOTAK EQUITY SAVINGS FUNDAn Open Ended Equity Fund (As on July 31, 2017)
206.69%Portfolio Turnover
Investment Style
Style
Issuer/Instrument Industry/Rating % to Net Assets % to Net Assets Derivatives
PORTFOLIO
Equity & Equity related (Listed/Awaiting listing on Stock Exchange)Non-HedgeHDFC Ltd. Warrants Finance 1.87 HDFC Ltd. Finance -1.74ITC Ltd. Consumer Non Durables 1.84 IndusInd Bank Ltd. Banks 1.17 Bharat Petroleum Corporation Ltd. Petroleum Products 1.11 Power Grid Corporation Of India Ltd Power 1.07 Yes Bank Ltd Banks 1.03 Reliance Industries Ltd. Petroleum Products 1.01 Infosys Ltd. Software 0.83 Bajaj Finance Limited Finance 0.77 National Thermal Power Corporation Limited Power 0.77 Varun Beverages Ltd Consumer Non Durables 0.77 Bharat Earth Movers Ltd. Industrial Capital Goods 0.75 Grasim Industries Ltd. Cement 0.70 Maruti Suzuki India Limited Auto 0.63 Tata Motors Ltd - DVR Auto 0.59 Tata Steel Limited. Ferrous Metals 0.55 Laurus Labs Ltd Pharmaceuticals 0.53 Eris Lifesciences Ltd Pharmaceuticals 0.51 Zee Entertainment Enterprises Ltd Media and Entertainment 0.50 Hero MotoCorp Ltd. Auto 0.45 0.17Godfrey Phillips India Ltd. Consumer Non Durables 0.44 Mcleod Russel India Ltd Consumer Non Durables 0.44 Petronet LNG Ltd. Gas 0.41 Tata Consultancy Services Ltd. Software 0.34 The Ramco Cements Ltd Cement 0.34 Piramal Enterprises Limited Pharmaceuticals 0.30 Vedanta Ltd. Non - Ferrous Metals 0.30 Muthoot Finance Ltd Finance 0.29 Hindustan Unilever Ltd. Consumer Non Durables 0.28 JSW Steel Ltd. Ferrous Metals 0.28 Indraprastha Gas Ltd. Gas 0.27 Bajaj Finserv Ltd. Finance 0.26 Colgate Palmolive (India ) Ltd. Consumer Non Durables 0.25 GAIL (India) Ltd. Gas 0.25 AU Small Finance Bank Ltd. Banks 0.23 HCL Technologies Ltd. Software 0.23 ICICI Bank Ltd. Banks 0.23 Indian Oil Corporation Ltd Petroleum Products 0.21 Housing & Urban Development Corporation Ltd Finance 0.19 RBL Bank Ltd-AUG2017 0.17Aditya Birla Capital Ltd Finance 0.17 Wipro Ltd. Software 0.16 Oil & Natural Gas Corporation Ltd. Oil 0.15 Hindustan Petroleum Corporation Ltd Petroleum Products 0.12 Central Depository Services (India) Ltd Finance 0.11 HDFC Bank Ltd. Banks 0.07 1.94Tata Communications Ltd Telecom - Services 0.07 Tata Motors Ltd. Auto 0.07 Tech Mahindra Ltd. Software 0.07 Axis Bank Ltd Banks 0.04 0.38S Chand And Company Ltd Media and Entertainment 0.04 Sun Pharmaceuticals Industries Ltd. Pharmaceuticals 0.04 Chennai Super Kings Cricket Ltd. Media and Entertainment 0.02 Biocon Ltd. Pharmaceuticals 0.01 0.56Non-Hedged- Total 24.13 1.48Hedged GMR Infrastructure Ltd. Construction Project 4.96 -5.01Fortis Healthcare India Ltd Healthcare Services 4.38 -4.41Hindalco Industries Ltd Non - Ferrous Metals 3.38 CNX NIFTY-AUG2017 -3.82Suzlon Energy Ltd. Industrial Capital Goods 2.41 -2.43Jain Irrigation Systems Ltd. Industrial Products 2.08 -2.10IDFC Bank Limited Banks 1.92 -1.94Ujjivan Financial Services Ltd Finance 1.67 -1.68Infosys Ltd. Software 1.44 -1.44Reliance Capital Ltd. Finance 1.30 -1.31Century Textiles & Industries Ltd. Cement 1.02 -1.02Bharat Electronics Ltd Industrial Capital Goods 0.98 -0.98Vedanta Ltd. Non - Ferrous Metals 0.97 -0.97Tata Communications Ltd Telecom - Services 0.90 -0.90The South Indian Bank Ltd. Banks 0.90 -0.91Jaiprakash Associates Ltd Cement 0.88 -0.89IDFC Limited Finance 0.84 -0.85Ashok Leyland Ltd. Auto 0.71 -0.72India Cements Ltd. Cement 0.71 -0.71Indiabulls Real Estate Ltd Construction 0.64 -0.64Mangalore Refinery And Petrochemicals Ltd. Petroleum Products 0.55 -0.52Manappuram Finance Ltd Finance 0.52 -0.52JSW Energy Ltd. Power 0.51 -0.51Bata India Ltd. Consumer Durables 0.49 -0.49Escorts Ltd. Auto 0.47 -0.47SREI Infrastructure Finance Ltd Finance 0.46 -0.46Kaveri Seed Company Ltd. Consumer Non Durables 0.43 -0.43Aurobindo Pharma Ltd. Pharmaceuticals 0.41 -0.41Dalmia Bharat Ltd. Cement 0.40 -0.40Dewan Housing Finance Corporation Ltd. Finance 0.39 -0.40Tata Elxsi Ltd. Software 0.39 -0.39
This product is suitable for investors who are seeking*:� Income from arbitrage opportunities in the equity
market & long term capital growth� Investment predominantly in arbitrage opportunities in
the cash & derivatives segment of the equity market and equity & equity related securities
* Investors should consult their financial advisors if in doubt about whether the product is suitable for them.
Value Blend Growth Size
Large
Mid
Small
Investors understand that their principal will be at moderately high risk
Riskometer
yletaredo
M
Moderate
Low
High
Low
High
LOW HIGH
Moderately
Product Label
17

7
(As on July 31, 2017)
Issuer/Instrument Industry/Rating % to Net Assets % to Net Assets Derivatives
PORTFOLIO
KOTAK EQUITY SAVINGS FUNDAn Open Ended Equity Fund
Indian Bank Banks 0.35 -0.36Wockhardt Ltd. Pharmaceuticals 0.34 -0.34Castrol (India ) Ltd. Petroleum Products 0.32 -0.32Shriram Transport Finance Co Ltd. Finance 0.29 -0.29Gujarat State Fertilizers & Chemicals Ltd. Fertilisers 0.25 -0.25Housing Development and Infrastructure Limited Construction 0.22 -0.22CESC Ltd. Power 0.19 -0.19Equitas Holdings Ltd Finance 0.18 -0.18Sun Pharmaceuticals Industries Ltd. Pharmaceuticals 0.17 -0.17Federal Bank Ltd. Banks 0.16 -0.16HDFC Ltd. Finance 0.15 -0.15Tech Mahindra Ltd. Software 0.15 -0.15IRB Infrastructure Developers Ltd Construction 0.14 -0.14Adani Power Ltd Power 0.11 -0.11Glenmark Pharmaceuticals Ltd Pharmaceuticals 0.11 -0.11Capital First Ltd Finance 0.10 -0.10Maruti Suzuki India Limited Auto 0.10 -0.10National Aluminium Company Ltd Non - Ferrous Metals 0.10 -0.10NCC Limited Construction Project 0.10 -0.10Sun TV Limited. Media and Entertainment 0.10 -0.10TV18 Broadcast Ltd Media and Entertainment 0.10 -0.10UPL Ltd Pesticides 0.10 -0.10IFCI Ltd. Finance 0.09 -0.09Apollo Tyres Ltd. Auto Ancillaries 0.08 -0.08Britannia Industries Ltd. Consumer Non Durables 0.08 -0.08Exide Industries Ltd Auto Ancillaries 0.07 -0.07Reliance Power Ltd Power 0.07 -0.07The Ramco Cements Ltd Cement 0.07 -0.07Andhra Bank Banks 0.06 -0.06Jindal Steel & Power Ltd. Ferrous Metals 0.05 -0.05Granules India Ltd. Pharmaceuticals 0.04 -0.04KPIT Technologies LImited Software 0.04 -0.04Power Finance Corporation Ltd. Finance 0.04 -0.04Bharat Heavy Electricals Ltd. Industrial Capital Goods 0.03 -0.03Hindalco Industries Ltd Non - Ferrous Metals 0.03 -0.03Pidilite Industries Ltd. Chemicals 0.03 -0.03Tata Chemicals Ltd. Chemicals 0.03 -0.03Amara Raja Batteries Ltd. Auto Ancillaries 0.02 -0.02Balrampur Chini Mills Ltd Consumer Non Durables 0.02 -0.02DLF Limited Construction 0.02 -0.02IndusInd Bank Ltd. Banks 0.02 -0.02Siemens Ltd. Industrial Capital Goods 0.02 -0.02Coal India Ltd. Minerals/Mining 0.01 -0.01Hindustan Construction Co.Ltd Construction Project 0.01 -0.01Karnataka Bank Ltd Banks 0.01 -0.01PC Jeweller Ltd Consumer Durables 0.01 -0.01Rural Electrification Corporation Ltd Finance 0.01 -0.01Hedged - Total 41.90 -42.53Listed/Awaiting Listing on Stock Exchange - Total 66.03 -41.05Preference Shares (Listed/Awaiting listing on Stock Exchange) 3DPLM Software Solutions Ltd Software 0.11 7.5% Vedanta Reedemable Preference Shares Non - Ferrous Metals 0.58 Preference Shares - Total 0.69 Mutual Fund Units Kotak Floater Short Term Direct Growth Mutual Fund Units 9.18 Mutual Fund Units - Total 9.18 Debt Instruments Debentures and Bonds Corporate Debt/Financial Institutions HDFC Bank Ltd. CRISIL AA+ 3.13 Kotak Mahindra Prime Ltd. CRISIL AAA 3.10 Indiabulls Housing Finance Limited CARE AAA 2.54 Corporate Debt/Financial Institutions - Total 8.77 Government Dated Securities 8.53% State Government SOV 0.64 Government Dated Securities - Total 0.64 TERM DEPOSITS AXIS Bank Ltd. 4.75 HDFC Bank Ltd. 3.02 IndusInd Bank Ltd. 2.19 Kotak Mahindra Bank Ltd. 0.24 Term Deposits - Total 10.20
Collateral Borrowing & Lending obligation 1.59 Net Current Assets/(Liabilities) 2.90 Grand Total 100.00
Kotak Equity Savings Fund NAV as on July 31, 2017: `12.7627 (Growth Option), `11.1788 (Monthly Dividend Option), `11.1641 (Quarterly Dividend Option), `13.0067 (Direct Growth Option), `11.4078 (Direct Monthly Dividend Option), `11.2461 (Direct Quarterly Dividend Option)
Note:Term Deposit as provided above is towards margin for derivatives transactions
18

7
(As on July 31, 2017)
KOTAK EQUITY SAVINGS FUNDAn Open Ended Equity Fund
SYSTEMATIC INVESTMENT PLAN (SIP)Monthly SIP of 10000`
Total amount invested ( )`
Total Value as on July 31, 2017 ( )`
Scheme Returns (%)
75% NIFTY 50 ARBITRAGE + 25% Nifty 50 ( )#`
75% NIFTY 50 ARBITRAGE + 25% Nifty 50 Returns (%)
Nifty 50 ( )^`
Nifty 50 Returns (%)
1 year Since Inception
120,000 340,000
128,047 389,713
12.73 9.63
126,327 379,921
9.97 7.79
136,500 408,671
26.58 13.09
Systematic Investment Plan (SIP) If you had invested `10,000 every month
Scheme Inception : - October 13, 2014. The returns are calculated by XIRR approach assuming investment of 10,000/- on the 1st working day `of every month. XIRR helps in calculating return on investments given an initial and final value and a series of cash inflows and outflows and taking the time of investment into consideration. Since inception returns are assumed to be starting from the beginning of the subsequent month from the date of inception. # Benchmark ; ̂ Additional Benchmark
SYSTEMATIC INVESTMENT PLAN (SIP)
SECTOR ALLOCATION (%)
�Be greedy when others are fearful, be fearful when others are greedy. The greatest pro�ts are made when you are not part of the crowd.�
11.79 9.70 9.18 8.77 6.19 5.36
5.074.55
4.38
4.19 30.82
CBLO & Term Deposits & Rev.Repo Finance Mutual Fund Units
Debentures and Bonds
Banks
Non - Ferrous Metals
Construction ProjectConsumer Non Durables
Healthcare Services
Industrial Capital Goods
Others
19

Investment Objective
The investment objective of the scheme is to generate capital appreciation from a diversified portfolio of equity & equity re lated instruments across market capitalisation and sectors. However, there is no assurance that the objective of the scheme will be realized.
Available Plans/Options
A) Regular Plan B) Direct Plan
Options: Dividend Payout & Growth (applicable for all plans)
Dividend Frequency
Trustee�s Discretion
Ratios
Source: $ICRA MFI Explorer.
Minimum Investment Amount
The scheme is a close ended scheme. The units of the scheme can be traded on the stock exchange.
Load Structure
Entry Load: Nil. (applicable for all plans)
Exit Load: Nil. (applicable for all plans)
Total Expense Ratio**
Regular: 2.48%; Direct: 1.98%
7
Product Label
Investors understand that their principal will be at moderately high risk
Riskometer
yletaredo
M
Moderate
Low
High
Low
High
LOW HIGH
Moderately
SECTOR ALLOCATION (%)
* For Fund Manager experience, please refer page 54-55. For last three dividends, please refer page no 56-58. For scheme performance, please refer **Total Expense Ratio excludes applicable B15 fee and service tax.page no 45-53
PORTFOLIO
Benchmark: Nifty 200Fund Manager: Mr. Harish Krishnan* AAUM: ` crs 453.04
AUM: ` crs463.03Allotment date: May 06, 2015
KOTAK INDIA GROWTH FUND SERIES I3 years Close- Ended Equity Scheme (As on July 31, 2017)
38.54%Portfolio Turnover
Investment Style
Equity & Equity related (Listed/Awaiting listing on Stock
Exchange)
HDFC Bank Ltd. Banks 8.67
ICICI Bank Ltd. Banks 7.84
Reliance Industries Ltd. Petroleum Products 6.80
IndusInd Bank Ltd. Banks 6.40
Maruti Suzuki India Limited Auto 5.36
Larsen And Toubro Ltd. Construction Project 5.22
Hero MotoCorp Ltd. Auto 4.74
Shree Cement Ltd. Cement 4.50
Infosys Ltd. Software 4.15
Britannia Industries Ltd. Consumer Non Durables 4.02
State Bank Of India Banks 3.99
Tata Motors Ltd - DVR Auto 3.51
Axis Bank Ltd Banks 3.37
Bharat Earth Movers Ltd. Industrial Capital Goods 3.36
Kajaria Ceramics Ltd. Construction 2.91
GAIL (India) Ltd. Gas 2.87
Sun TV Limited. Media and Entertainment 2.87
Persistent Systems Limited Software 2.79
Laurus Labs Ltd Pharmaceuticals 2.73
BSE Ltd Finance 2.22
Motherson Sumi Systems Ltd. Auto Ancillaries 2.11
Ultratech Cement Ltd. Cement 1.75
Zee Entertainment
Enterprises Ltd Media and Entertainment 1.64
Entertainment Network
(India) Ltd. Media and Entertainment 1.15
Equitas Holdings Ltd Finance 1.09
Listed/Awaiting Listing on Stock Exchange - Total 96.06
TERM DEPOSITS
AXIS Bank Ltd. 0.43
Term Deposits - Total 0.43
Collateral Borrowing & Lending obligation 3.97
Net Current Assets/(Liabilities) -0.46
Kotak India Growth Fund Series I NAV as on July 31, 2017: ̀ 13.1043 (Dividend Option), ̀ 13.2644 (Direct Dividend Option), ̀ 13.1043 (Growth Option), ̀ 13.2644 (Direct Growth Option)
Note: Term Deposit as provided above is towards margin for derivatives transactions
This product is suitable for investors who are seeking*:� Long term capital growth� Investment in equity and equity related securities across
market capitalisation and sectors* Investors should consult their financial advisors if in doubt about whether the product is suitable for them.
Style
Value Blend Growth Size
Large
Mid
Small
33.06
33.58
9.72
15.71
12.19
9.67
3.73
8.14
9.40
6.94
2.24
6.25
0.84
5.66
12.02
4.02
1.79
3.36
5.48
2.73
Benchmark
Scheme
Financial Services Automobile Energy Constructions IT
Cement & Cement Products Media & Entertainment Consumer Goods Industrial Manufacturing Pharma
Issuer/Instrument Industry/Rating % to Net Assets
Issuer/Instrument Industry/Rating % to Net Assets
�People tend to overreact to bad news and slowly to good news. Take advantage of the asymmetry in reaction�
20

Issuer/Instrument Industry/Rating % to Net Assets
Issuer/Instrument Industry/Rating % to Net Assets
* For Fund Manager experience, please refer page 54-55. For scheme performance, please refer page no 45-53 **Total Expense Ratio excludes applicable B15 fee and service tax.
Benchmark: CRISIL Liquid FundFund Manager: AAUM:
AUM: Allotment date: November 4, 2003
KOTAK LIQUIDAn Open - Ended Debt Scheme
Investment Objective
To provide reasonable returns and high level of liquidity by investing in debt and money market instruments of different maturities so as to spread risk across different kinds of issuers in the debt markets. However, there is no assurance that the objective of the scheme will be realized.
Available Plans/Options
A) Regular Plan B) Direct Plan
Options: Dividend Payout,
Dividend Reinvestment & Growth
(applicable for all plans)
Dividend Frequency
Daily, Weekly (Every Monday) (applicable for all plans)
Ratios
$Source: ICRAMFI Explorer. Standard Deviation is calculated on Annualised basis using 3 years history of monthly returns.
Minimum Investment Amount
Initial Investment: `5000 and in multiple of `1 for purchase and for `0.01 for switches
Additional Investment: `1000 & in multiples of ̀ 1
Ideal Investment Horizon: 1 - 15 days
Load Structure
Entry Load: Nil. (applicable for all plans)
Exit Load: Nil. (applicable for all plans)
Regular:0.07%; Direct: 0.02%
Investment Style:
This product is suitable for investors who are seeking*:
� Income over a short term investment horizon� Investment in debt & money market securities* Investors should consult their financial advisors if in doubt about whether the product is suitable for them.
Total Expense Ratio**
`12,972.25 crs`12,075.91 crs
Mr. Deepak Agrawal*
ALLOCATION (%)
RATING PROFILE (%)
(As on July 31, 2017)
PORTFOLIO
Short Medium Long Volatiliy
Low
Medium
High
Maturity
Average Maturity of the portfolio based on total maturity of fixed rate and immediate reset date of floating rate instruments : 0.12 years
Kotak Liquid Fund NAV as on July 31, 2017: `3362.4468 (Growth Option), `3369.9987 (Direct Growth Option),`1001.2357 (Weekly Dividend), ̀ 1006.3461 (Direct Weekly Dividend), ̀ 1222.8100 (Daily Dividend), ̀ 1222.8100 (Direct Daily Dividend)
Product Label
Investors understand that their principal will be at low risk
Riskometer
yletaredo
M
Moderate
Low
High
Low
High
LOW HIGH
Moderately
Debt Instruments
Debentures and Bonds
Public Sector Undertakings
Power Finance Corporation Ltd. CRISIL AAA 2.55
Rural Electrification
Corporation Ltd. CRISIL AAA 1.04
Public Sector Undertakings - Total 3.59
Money Market Instruments
Commercial Paper(CP)/Certificate of Deposits(CD)
Corporate Debt/Financial Institutions
HDFC Bank Ltd. CARE A1+ 12.27
HDFC Ltd. ICRA A1+ 6.33
AXIS Bank Ltd. CRISIL A1+ 4.61
Reliance Industries Ltd. ICRA A1+ 4.14
Piramal Finance Limited ICRA A1+ 4.09
Shriram Transport
Finance Co Ltd. CRISIL A1+ 3.71
IDFC Bank Limited CRISIL A1+ 3.26
Tata Capital Financial
Services Limited ICRA A1+ 2.46
Tata Steel Limited FITCH A1+(IND) 2.06
HDFC Ltd. CARE A1+ 1.84
Aditya Birla Finance Ltd. ICRA A1+ 1.65
India Infoline Finance Limited ICRA A1+ 1.65
Reliance Jio Infocomm Limited CARE A1+ 1.65
IIFL Wealth Finance Ltd. ICRA A1+ 1.44
ICICI Bank Ltd. ICRA A1+ 0.82
Larsen and Toubro Ltd. CRISIL A1+ 0.82
Muthoot Finance Ltd CRISIL A1+ 0.82
Edelweiss Commodities
Services Ltd. CRISIL A1+ 0.61
Barclays Investments &
Loan (India) Ltd. ICRA A1+ 0.41
Ford Credit India Pvt. Ltd. FITCH IND A1+ 0.41
Canfin Homes Ltd ICRA A1+ 0.40
Bajaj Finance Limited CRISIL A1+ 0.37
Sundaram Finance Ltd. CRISIL A1+ 0.04
Corporate Debt/Financial Institutions - Total 55.86
Public Sector Undertakings
Steel Authority of India Ltd. CARE A1+ 3.30
Small Industries Development
Bank Of India. CRISIL A1+ 2.03
PNB Housing Finance Ltd. CRISIL A1+ 1.44
Public Sector Undertakings - Total 6.77
Reverse Repo 3.14
Treasury Bills
91 Days Treasury Bill 07/09/2017 SOV 13.67
91 Days Treasury Bill 26/10/2017 SOV 9.29
77 Days Cash Management
Treasury Bill 16/08/2017 SOV 6.98
91 Days Treasury Bill 24/08/2017 SOV 5.24
91 Days Treasury Bill 12/10/2017 SOV 2.45
91 Days Treasury Bill 14/09/2017 SOV 1.18
63 Days Cash Management
Bill 08/08/2017 SOV 0.24
Treasury Bills - Total 39.05
Net Current Assets/(Liabilities) -8.41
Grand Total 100.00
.
62.63 39.05 3.59 3.14- 8.41
Commercial Paper (CP)/Certi�cate of Deposits (CD) Treasury BillsDebentures and Bonds
CBLO & Term Deposits & Rev.Repo
Net Current Assets
105.27 3.14- 8.41
A1+, A1+(IND), AAA, IND A1+, SOV CBLO & Term Deposits & Rev.Repo Net Current Assets
�The de�nition of great company is one that will remain great for many many years..�
21
$Standard Deviation
Modified Duration
Portfolio Yield
0.11%
0.12yrs
6.36%

Issuer/Instrument Industry/Rating % to Net Assets
Issuer/Instrument Industry/Rating % to Net Assets
* For Fund Manager experience, please refer page 54-55. For scheme performance, please refer page no 45-53 **Total Expense Ratio excludes applicable B15 fee and service tax.
Benchmark: CRISIL Liquid FundFund Manager: AAUM:
AUM: Allotment date: July 14, 2003
KOTAK FLOATER SHORT TERMAn Open - Ended Debt Scheme
Investment Objective
To reduce the interest rate risk associated with investments in fixed rate instruments by investing predominantly in floating rate securities, money market instruments and using appropriate derivatives. However, there is no assurance that the objective of the scheme will be realized.
Available Plans/Options
A) Regular Plan B) Direct Plan
Options: Dividend Payout (w.e.f May 15, 2017, Under Monthly Dividned option only), Dividend Reinvestment & Growth (applicable for all plans
Dividend Frequency
Daily, Weekly (Every Monday) and Monthly (12th of every Month)
Ratios
$Source: ICRAMFI Explorer. Standard Deviation is calculated on Annualised basis using 3 years history of monthly returns.
Minimum Investment Amount
Initial Investment: ` 5 0 0 0 U n d e r growth, weekly dividend and monthly dividend option & `1,00,000 under Daily Dividend Reinvestment option,
Additional Investment: `1000 & in multiples of ̀ 1
Ideal Investment Horizon: 1-15 days
Load Structure
Entry Load: Nil. (applicable for all plans)
Exit Load: Nil (applicable for all plans)
Regular:0.10%; Direct: 0.05%
Investment Style:
Product Label
This product is suitable for investors who are seeking*:
� Income over a short term investment horizon� Investment in floating rate securities, debt & money
market securities* Investors should consult their financial advisors if in doubt about whether the product is suitable for them.
Total Expense Ratio**
`12,549.83 crs`11,800.83 crs
Mr. Deepak Agrawal*
(As on July 31, 2017)
PORTFOLIO
Investors understand that their principal will be at low risk
Riskometer
yletaredo
M
Moderate
Low
High
Low
High
LOW HIGH
Moderately
Average Maturity of the portfolio based on total maturity of fixed rate and immediate reset date of floating rate instruments : 0.12 years
Kotak Floater Short Term Fund NAV as on July 31, 2017: `2722.2642 (Growth Option), `2728.416 (Direct Growth Option),`1013.1944 (Weekly Dividend), `1022.8737 (Direct Weekly Dividend), `1004.7185 (Monthly Dividend), `1010.0652 (Direct Monthly Dividend), ̀ 1011.6200 (Daily Dividend), ̀ 1011.6200 (Direct Daily Dividend)
Short Medium Long Volatiliy
Low
Medium
High
Maturity
$Standard Deviation
Modified Duration
Portfolio Yield
0.11%
0.12 yrs
6.45%
Debt Instruments
Debentures and Bonds
Corporate Debt/Financial Institutions
Nabha Power Ltd. ( backed by
unconditional and irrevocable
guarantee by Larsen & Toubro Ltd ) ICRA AAA 1.39
Altico Capital India Pvt Ltd FITCH IND AA-(SO) 0.52
Corporate Debt/Financial Institutions - Total 1.91
Money Market Instruments
Commercial Paper(CP)/Certificate of Deposits(CD)
Corporate Debt/Financial Institutions
Muthoot Finance Ltd CRISIL A1+ 7.88
AXIS Bank Ltd. ICRA A1+ 7.85
HDFC Bank Ltd. CARE A1+ 5.70
Reliance Industries Ltd. ICRA A1+ 4.69
HDFC Ltd. CRISIL A1+ 4.00
Piramal Finance Limited ICRA A1+ 3.93
Suraksha Realty Ltd ( Secured by
Equity shares of Sun
Pharmaceuticals Industries Ltd ) ICRA A1+(SO) 3.56
ECL Finance Limited CRISIL A1+ 3.16
Reliance Jio Infocomm Limited CARE A1+ 2.57
India Infoline Finance Limited ICRA A1+ 2.37
Suraksha Realty Ltd ( Secured by
Equity shares of Sun
Pharmaceuticals Industries Ltd ) CARE A1+(SO) 2.04
Bajaj Finance Limited CRISIL A1+ 1.97
Tata Steel Limited FITCH A1+(IND) 1.97
Tata Chemicals Ltd. CRISIL A1+ 1.57
Larsen and Toubro Ltd. CRISIL A1+ 1.53
Manappuram Finance Ltd CRISIL A1+ 1.50
Tata Power Company Ltd. ICRA A1+ 1.18
Shriram City Union Finance Ltd. CARE A1+ 0.99
IDFC Bank Limited ICRA A1+ 0.87
Adani Transmission Ltd FITCH IND A1+(SO) 0.79
Nirma Ltd. CRISIL A1+ 0.79
Tata Motors Finance Solutions
Private Limited CARE A1+ 0.79
Trapti Trading & Investments
Private Limited ICRA A1+ 0.59
HDFC Ltd. ICRA A1+ 0.40
HDFC Ltd. CARE A1+ 0.39
Hero Cycles Ltd. CRISIL A1+ 0.24
TGS Investment & Trade Private Ltd. ICRA A1+ 0.20
Corporate Debt/Financial Institutions - Total 63.52
Public Sector Undertakings
Steel Authority of India Ltd. CARE A1+ 7.08
Small Industries Development
Bank Of India. CRISIL A1+ 1.98
Indian Railway Finance
Corporation Ltd. CRISIL A1+ 1.57
Public Sector Undertakings - Total 10.63
Bill Rediscounting
AXIS Bank Bill Rediscounting- 29/09/2017 2.36
Bill Rediscounting - Total 2.36
Reverse Repo 0.08
Treasury Bills
80 Days Cah Management
Bill 18/09/2017 SOV 7.68
91 Days Treasury Bill 24/08/2017 SOV 5.02
77 Days Cash Management
Treasury Bill 16/08/2017 SOV 3.96
91 Days Treasury Bill 10/08/2017 SOV 2.32
91 Days Treasury Bill 07/09/2017 SOV 1.86
91 Days Treasury Bill 12/10/2017 SOV 0.27
Treasury Bills - Total 21.11
Collateral Borrowing & Lending obligation 0.06
Net Current Assets/(Liabilities) 0.33
Grand Total 100.00
ALLOCATION (%)
RATING PROFILE (%)
74.15 21.11 2.361.910.33
0.14
Commercial Paper (CP)/Certi�cate of Deposits (CD) Treasury BillsBill Rediscounting
Debentures and Bonds
Net Current Assets
CBLO & Term Deposits & Rev.Repo
96.65 2.36 0.52 0.33 0.14
A1+, A1+(IND), A1+(SO), AAA, IND A1+(SO), SOV Bill RediscountingIND AA-(SO) Net Current Assets
CBLO & Term Deposits & Rev.Repo
�A good �nancial plan is a road map that shows us exactly how the choices we make today will affect our future.�
22

Issuer/Instrument Industry/Rating % to Net Assets
Issuer/Instrument Industry/Rating % to Net Assets
* For Fund Manager experience, please refer page 54-55. For scheme performance, please refer page no 45-53 **Total Expense Ratio excludes applicable B15 fee and service tax.
Benchmark: CRISIL Liquid Fund Fund Manager: AAUM:
AUM: Allotment date: August 13, 2004
KOTAK TREASURY ADVANTAGE FUNDAn Open - Ended Debt Scheme
Investment Objective
The investment objective of the Scheme is to generate returns through investments in debt and money market instruments with a view to reduce the interest rate risk. However, there is no assurance or guarantee that the investment objective of the scheme will be achieved.
Available Plans/Options
A) Regular Plan B) Direct Plan
Options: Dividend Payout, Dividend Reinvestment & Growth (applicable for all plans)
Dividend Frequency
Daily, Monthly (12th of every Month) and Weekly (Every Monday)
Ratios
$Source: ICRAMFI Explorer. Standard Deviation is calculated on Annualised basis using 3 years history of monthly returns.
Minimum Investment Amount
Initial Investment: (i) Dividend Re-investment & Growth- `5000 & above (ii) Dividend Payout (Weekly) - ̀ 1,00,00,000 & above
Additional Investment: `1000 & in multiples of ̀ 1
Ideal Investment Horizon: 1-3 months
Load Structure
Entry Load: Nil. (applicable for all plans)
Exit Load: Nil (applicable for all plans)
Regular:0.60%; Direct: 0.25%
Investment Style:
Product Label
This product is suitable for investors who are seeking*:
� Income over a short term investment horizon� Investment in debt & money market securities* Investors should consult their financial advisors if in doubt about whether the product is suitable for them.
Total Expense Ratio**
`8,982.59 crs`8,584.91 crs
Mr. Deepak Agrawal*
(As on July 31, 2017)
PORTFOLIO
Riskometer
Average Maturity of the portfolio based on total maturity of fixed rate and immediate reset date of floating rate instruments : 0.62 years.
K o t a k Tr e a s u r y A d v a n t a g e F u n d N AV a s o n J u l y 3 1 , 2 0 1 7 : ` 1 0 . 0 7 9 8 ( D a i l y D i v i d e n d O p t i o n ) ,`10.0805 (Daily Dividend - Direct), `26.6890 (Growth Option), `10.2204 (Monthly Dividend Option), `10.1543 (Weekly Dividend Option), `12.2262 (Monthly Dividend - Direct), ̀ 10.1709 (Weekly Dividend - Direct), ̀ 27.0465 (Growth - Direct Option)
Short Medium Long Volatiliy
Low
Medium
High
Maturity
yletaredo
M
Moderate
Low
High
Low
High
LOW HIGH
Moderately
Notes: ̂ Fully or Partly blocked against Interest Rate Swap (IRS). Hedging Position through Interest Rate Swaps as on 31 Jul 2017 is 24.45% of the net assets.
Debt Instruments Debentures and Bonds Corporate Debt/Financial InstitutionsReliance Jio Infocomm Limited(^) CRISIL AAA 8.20Kotak Mahindra Prime Ltd.(^) CRISIL AAA 4.09Shriram Transport Finance Co Ltd. FITCH IND AA+ 3.53Indiabulls Housing Finance Limited CARE AAA 2.54AXIS Bank Ltd. CRISIL AA+ 2.47IDFC Bank Limited ICRA AAA 2.45Sheba Properties Ltd. CARE AA+ 2.38Indiabulls Housing Finance Limited(^) ICRA AAA 2.34ICICI Home Finance Company Limited(^) ICRA AAA 2.23Nabha Power Ltd. ( backed by unconditional and irrevocable guarantee by Larsen & Toubro Ltd ) (^) ICRA AAA 1.96LIC Housing Finance Ltd.(^) CRISIL AAA 1.93HDFC Ltd.(^) CRISIL AAA 1.48Tata Motors Finance Ltd CRISIL AA 1.31Tata Motors Finance Ltd CARE AA+ 1.19Kotak Mahindra Investments Ltd. CRISIL AAA 1.17Vedanta Ltd. CRISIL AA 1.00Mahindra & Mahindra Financial Services Ltd. FITCH IND AAA 0.82LIC Housing Finance Ltd. CARE AAA 0.62Tata Capital Financial Services
Limited ICRA AA+ 0.41Mandava Holdings Private Limited( backed by unconditional and irrevocable undertaking by Axis Capital ) ICRA AAA 0.39
Tata Motors Ltd.(^) CARE AA+ 0.30Cholamandalam Investment and Finance Company Ltd ICRA AA 0.06
Tata Sons Ltd. CRISIL AAA 0.02
Corporate Debt/Financial Institutions - Total 42.89Public Sector Undertakings
National Bank for Agriculture & Rural Development(^) CRISIL AAA 8.02
Power Finance Corporation Ltd.(^) CRISIL AAA 4.80Canara Bank CRISIL AAA 0.70Export-Import Bank of India.(^) CRISI AAA 0.36PNB Housing Finance Ltd.(^) CARE AA 0.31Rural Electrification Corporation Ltd. CRISILAAA 0.13Allahabad Bank CRISIL AA- 0.09National Housing Bank CRISI AAA 0.09
Indian Railway Finance
Corporation Ltd. CRISILAAA 0.07Power Grid Corporation of
India Ltd. CRISIL AAA 0.06
Public Sector Undertakings - Total 14.63Government Dated Securities
7.61% Central Government SOV 2.458.75% State Government SOV 0.337.75% State Government SOV 0.128.52% State Government SOV 0.128.00% State Government SOV 0.096.79% Central Government SOV 0.01
Government Dated Securities - Total 3.12Futures
7.61% GS 09/05/2030-AUG2017 -2.45
Futures (Market value represents Notional Value) -Total -2.45Money Market Instruments Commercial Paper(CP)/Certificate of Deposits(CD) Corporate Debt/Financial Institutions
Reliance Industries Ltd. ICRA A1+ 4.66Nabha Power Ltd. ( Backed byLetter of Comfort from L&T ) ICRA A1+ 4.56Sun Pharma Laboratories Limited ICRA A1+ 3.41Tata Motors Ltd. ICRA A1+ 3.36AXIS Bank Ltd. CRISIL A1+ 2.33Tata Capital Financial Services Limited CRISIL A1+ 2.25Tata Motors Ltd. CRISIL A1+ 2.24
IndusInd Bank Ltd. CRISIL A1+ 0.85HDFC Bank Ltd. CARE A1+ 0.57HDFC Ltd. ICRA A1+ 0.40
IDFC Bank Limited ICRA A1+ 0.06
Corporate Debt/Financial Institutions - Total 24.69Public Sector Undertakings
Export-Import Bank of India. CRISIL A1+ 3.67
Public Sector Undertakings - Total 3.67Bill Rediscounting
AXIS Bank Bill Rediscounting- 29/09/2017 2.31
Bill Rediscounting - Total 2.31Reverse Repo 2.38Treasury Bills
91 Days Treasury Bill 05/10/2017 SOV 2.9491 Days Treasury Bill 21/09/2017 SOV 0.31
182 Days Treasury Bill 19/10/2017 SOV 0.2991 Days Treasury Bill 07/09/2017 SOV 0.29
Treasury Bills - Total 3.83
TERM DEPOSITS HDFC Bank Ltd. 0.08
Term Deposits - Total 0.08
Collateral Borrowing & Lending obligation 0.69Net Current Assets/(Liabilities) 4.16Grand Total 100.00
Investors understand that their principal will be at moderately low risk
$Standard Deviation
Modified Duration
Portfolio Yield
0.42%
0.54 yrs
6.87%
ALLOCATION (%)
RATING PROFILE (%)
57.52 28.36 4.16 3.83 3.153.122.31-2.45
Debentures and Bonds Commercial Paper (CP)/Certi�cate of Deposits (CD)
Net Current Assets Treasury Bills
CBLO & Term Deposits & Rev.Repo
Government Dated Securities Bill Rediscounting Derivatives
Bill Rediscounting
80.09 12.74 4.16 3.152.31
A1+, AAA, IND AAA, SOV AA+, IND AA+, AA, AA- Net Current AssetsCBLO & Term Deposits & Rev.Repo
Derivatives
-2.45
23

Issuer/Instrument Industry/Rating % to Net Assets
Issuer/Instrument Industry/Rating % to Net Assets
* For Fund Manager experience, please refer page 54-55. For scheme performance, please refer page no 45-53 **Total Expense Ratio excludes applicable B15 fee and service tax.
Benchmark: CRISIL Short Term Bond Fund Index
Fund Manager: AAUM: AUM:
Allotment date: December 29,1998
KOTAK BANKING AND PSU DEBT FUNDAn Open - Ended Debt Scheme
Investment Objective
To generate income by predominantly investing in debt & money market securities issued by Banks & PSUs and Reverse repos in such securities, sovereign securities issued by the Central Government and State Governments, and / or any security unconditionally guaranteed by the Govt. of India. However, there is no assurance that the objective of the scheme will be realized.
Available Plans/Options
A) Regular Plan B) Direct Plan
Options: Dividend Payout, Dividend Reinvestment & Growth (applicable for all plans)
Dividend Frequency
Daily, Monthly (12th of every Month) & Annual
Ratios
$Source: ICRAMFI Explorer. Standard Deviation is calculated on Annualised basis using 3 years history of monthly returns.
Minimum Investment Amount
Initial Investment: Dividend Payout, Dividend Re-investment & Growth ̀ 5000 & above.
Additional Investment: `1000 & in multiples of ̀ 1.
Ideal Investment Horizon: 1-3 months
Load Structure
Entry Load: Nil. (applicable for all plans)
Exit Load: Nil (applicable for all plans)
Regular:0.50%; Direct: 0.15%
Investment Style:
Total Expense Ratio**
`1,100.77 crs
`1,151.02 crs
Mr. Deepak Agrawal*
(As on July 31, 2017)
PORTFOLIO
Average Maturity of the portfolio based on total maturity of fixed rate and immediate reset date of floating rate instruments 2.92 years.
Kotak Banking And PSU Debt Fund NAV as on July 31, 2017: `38.0294 (Growth Option), `38.4410 (Direct Growth Option),`10.6508 (Monthly Dividend), ̀ 10.7524 (Direct Monthly Dividend), ̀ 10.1949 (Daily Dividend Reinvestment), ̀ 10.2665 (Direct Daily Dividend
Short Medium Long Volatiliy
Low
Medium
High
Maturity
$Standard Deviation
Modified Duration
Portfolio Yield
2.06%
2.26 yrs
7.18%
7.18%
This product is suitable for investors who are seeking*:
� Income over a short term investment horizon� Investment in debt & money market securities* Investors should consult their financial advisors if in doubt about whether the product is suitable for them.
Product Label
Riskometer
yletaredo
M
Moderate
Low
High
Low
High
LOW HIGH
Moderately
Investors understand that their principal will be at moderately low risk
Debt Instruments
Debentures and Bonds
Corporate Debt/Financial Institutions
AXIS Bank Ltd. CRISIL AA+ 3.50
Corporate Debt/Financial Institutions - Total 3.50
Public Sector Undertakings
National Bank for Agriculture & Rural
Development CRISIL AAA 8.27
Bank Of Baroda CARE AA 7.95
Power Finance Corporation Ltd. CRISIL AAA 6.24
Indian Railway Finance
Corporation Ltd. CRISIL AAA 4.36
State Bank Of India. CRISIL AA+ 4.02
Union Bank of India CRISIL AAA 3.10
State Bank of Travancore CRISIL AAA 3.07
State Bank Of India. CRISIL AAA 2.68
Canara Bank CRISIL AAA 2.65
Punjab National Bank CARE AA 2.62
Union Bank of India CARE AA 2.23
Bank Of Baroda CARE AA+ 2.02
Power Finance Corporation Ltd. ICRA AAA 1.80
Rural Electrification Corporation Ltd. CRISIL AAA 1.66
Power Grid Corporation of India Ltd. CRISIL AAA 1.45
Powergrid Vizag Transminssion
Ltd. ( backed by unconditional and
irrevocable guarantee by
Powergrid Corp ) CRISIL AAA(SO) 1.17
Steel Authority of India Ltd. FITCH IND AA 0.34
Public Sector Undertakings - Total 55.63
Government Dated Securities
7.68% Central Government SOV 12.32
8.53% State Government SOV 3.20
8.52% State Government SOV 1.96
8.00% State Government SOV 0.44
Government Dated Securities - Total 17.92
Money Market Instruments
Commercial Paper(CP)/Certificate of Deposits(CD)
Corporate Debt/Financial Institutions
AXIS Bank Ltd. CRISIL A1+ 8.07
Corporate Debt/Financial Institutions - Total 8.07
Collateral Borrowing & Lending obligation 10.66
Net Current Assets/(Liabilities) 4.22
Grand Total 100.00
ALLOCATION (%)
RATING PROFILE (%)
59.13 17.92 10.66 8.07 4.22
Debentures and Bonds
Government Dated SecuritiesCBLO & Term Deposits & Rev.Repo
Commercial Paper (CP)/Certi�cate of Deposits (CD)Net Current Assets
62.44 22.68 10.66 4.22
A1+, AAA, AAA(SO), SOV AA+, AA, IND AA CBLO & Term Deposits & Rev.RepoNet Current Assets
�If investing is entertaining, if you�re having fun, you�re probably not making any money. Good investing is boring.�
24

Issuer/Instrument Industry/Rating % to Net Assets
Issuer/Instrument Industry/Rating % to Net Assets
Benchmark: CRISIL Liquid Fund Fund Manager: AAUM:
AUM: Allotment date: March 6, 2008
KOTAK LOW DURATION FUND An Open - Ended Debt Scheme
Investment Objective
The primary objective of the Scheme is to generate income through investment primarily in low duration debt & money market securities. However, there is no assurance that the objective of the scheme will be realized.
Available Plans/Options
A) Regular B) Direct Plan
Options: Dividend Payout, Dividend Reinvestment & Growth (dividend payout is available under monthly dividend only) (applicable for all plans)
Dividend Frequency
Weekly (every Monday), Monthly (12th of every month)and Normal (as decided by Trustees)
Ratios
$Source: ICRAMFI Explorer. Standard Deviation is calculated on Annualised basis using 3 years history of monthly returns.
Minimum Investment Amount
Initial Investment: `5000 and in multiple of `1 for purchase and for `0.01 for switches
Additional Investment: `1000 & in multiples of `1 for purchase and for `0.01 for switches.
Ideal Investment Horizon: 1-3 months
Load Structure
Entry Load: Nil.
Exit Load: Nil.
Any exit load charged (net off Service Tax, if any) shall be credited back to the Scheme;
Regular:1.01%; Direct: 0.26%
Investment Style:
Total Expense Ratio**
`5,906.46 crs`6,279.02 crs
Mr. Deepak Agrawal*
(As on July 31, 2017)
PORTFOLIO
Average Maturity of the portfolio based on total maturity of fixed rate and immediate reset date of floating rate instruments : 1.16 years
Kotak Low Duration Fund NAV as on `1061.7329 (Normal Dividend), ` 2034.4585 (Standard Plan-Growth Option), July 31, 2017: `1015.4205 (Standard Plan-Weekly Dividend), `1022.4677 (Standard Plan-Monthly Dividend), ` 2089.0647 (Direct Plan- Growth Option), `1200.1843 (Direct Plan- Weekly Dividend), ̀ 1037.8885 (Direct Plan- Monthly Dividend)
Short Medium Long Volatiliy
Low
Medium
High
Maturity
$Standard Deviation
Modified Duration
Portfolio Yield
0.73%
0.96 yrs
7.76%
This product is suitable for investors who are seeking*:
� Regular income over short term� Income by focusing on low duration securities* Investors should consult their financial advisors if in doubt about whether the product is suitable for them.
Product Label
Riskometer
Investors understand that their principal will be at moderate risk
yletaredo
M
Moderate
Low
High
Low
High
LOW HIGH
Moderately
* For Fund Manager experience, please refer page 54-55. For scheme performance, please refer page no 45-53. For last three dividends, please refer **Total Expense Ratio excludes applicable B15 fee and service tax. page no 56-58
Notes: ̂ Fully or Party blocked against Interest Rate Swap (IRS). Hedging Position through Interest Rate Swaps as on 31 Jul 2017 is 14.29% of the net assets
Debt Instruments Debentures and Bonds Corporate Debt/Financial Institutions Vedanta Ltd. CRISIL AA 9.94HDFC Ltd. CRISIL AAA 5.31AXIS Bank Ltd.(^) CRISIL AA+ 5.30S D Corporation Private Limited ( DSRA Guarantee from Shapoorji Pallonji and Company Private Limited) CARE AA+(SO) 4.88Manappuram Finance Ltd(^) ICRA AA- 4.07Innovador Traders Pvt Ltd ( backed by unconditional and irrevocable undertaking by Piramal ) ICRA AA-(SO) 3.43Sahyadri Agencies Ltd ( Secured by Equity shares of Jyothy Laboratories Ltd ) BRICKWORK BWR A(SO) 2.97Muthoot Finance Ltd(^) CRISIL AA 2.90Tata Motors Ltd. CARE AA+ 2.79Nirma Ltd.(^) CRISIL AA 2.49Varun Beverages Limited CRISIL AA- 2.39Karelides Traders Private Ltd. ( backed by unconditional and irrevocable undertaking by a wholly owned subsidiary of Piramal Enterprises Ltd ) ICRA AA-(SO) 2.28Adani Power Ltd ( Secured by Equity shares of Adani Ports and SEZ Ltd, Adani Transmission and Adani Enterprises) BRICKWORK BWR AA-(SO) 1.79Nuvoco Vistas Corporation Ltd.(^) CRISIL AA 1.46Pune Solapur Expressways Pvt. Ltd. ( toll road project of Tata Realty & Infrastructure Ltd, 100 subsidiary of Tata Sons ) ICRA A 1.40ECL Finance Limited CARE AA 1.31Intime Properties Ltd. FITCH IND AAA 0.94HPCL Mittal Energy Ltd. ICRA AA 0.72Indiabulls Housing Finance Limited ICRA AAA 0.72Piramal Finance Limited ICRA AA 0.67India Infoline Housing Finance Ltd. ICRA AA 0.65Edelweiss Housing Finance Limited ICRA AA 0.63Indiabulls Housing Finance Limited CARE AAA 0.57Altico Capital India Pvt Ltd FITCH IND AA- 0.56Mandava Holdings Private Limited ( backed by unconditional and irrevocable undertaking by Axis Capital ) ICRA AAA 0.54Muthoot Fincorp Ltd. CRISIL A- 0.49Trends In Vogue Pvt Ltd. ( backed by unconditional and irrevocable undertaking by Axis Capital ) ICRA AAA(SO) 0.45Indostar Capital Finance Private Limited CARE AA- 0.37LIC Housing Finance Ltd.(^) CRISIL AAA 0.31SP Jammu Udhampur Highway Ltd. ( backed by unconditional and irrevocable guarantee of Shapoorji Pallonji & Co Pvt Ltd ) ICRA AAA 0.20Reliance Jio Infocomm Limited CRISIL AAA 0.16HDB Financial Services Ltd. CRISIL AAA 0.08
IDFC Bank Limited ICRA AAA 0.08Nabha Power Ltd. ( backed by unconditional and irrevocable guarantee by Larsen & Toubro Ltd ) ICRA AAA 0.08Aspire Home Finance Corporation Ltd ICRA AA- 0.05Shapoorji Pallonji Energy Gujarat Private Limited ( backed by unconditional and irrevocable guarantee of Shapoorji Pallonji & Co Pvt Ltd ) ICRA AA(SO) 0.05Grand View Estates Pvt Ltd ( backed by unconditional and irrevocable guarantee of Shapoorji Pallonji & Co Pvt Ltd ) ICRA AA 0.02Corporate Debt/Financial Institutions - Total 63.05Public Sector Undertakings National Bank for Agriculture & Rural Development(^) CRISIL AAA 3.59Bank Of Baroda(^) CARE AA 1.70Oriental Bank of Commerce(^) ICRA A 1.65Andhra Bank(^) CRISIL AA- 1.61Bank Of Baroda CARE AA+ 0.45Allahabad Bank CRISIL AA- 0.30Rural Electrification Corporation Ltd. CRISIL AAA 0.18Public Sector Undertakings - Total 9.48Government Dated Securities 8.15% State Government SOV 1.828.21% State Government SOV 1.828.39% State Government SOV 0.11Government Dated Securities - Total 3.75Money Market Instruments Commercial Paper(CP)/Certificate of Deposits(CD) Corporate Debt/Financial Institutions Suraksha Realty Ltd ( Secured by Equity shares of Sun Pharmaceuticals Industries Ltd ) CARE A1+(SO) 3.65S D Corporation Private Limited ( DSRA Guarantee from Shapoorji Pallonji and Company Private Limited) CARE A1+(SO) 2.42Shapoorji Pallonji and Company Private Limited ICRA A1+ 2.35JM Financial Products Limited CRISIL A1+ 1.92HDFC Bank Ltd. CARE A1+ 1.19Bajaj Finance Limited CRISIL A1+ 0.79Reliance Infrastructure Ltd ( Backed by SBLC of ICICI Bank) FITCH IND A1+ 0.47HDFC Ltd. CARE A1+ 0.39HDFC Ltd. ICRA A1+ 0.39Corporate Debt/Financial Institutions - Total 13.57Public Sector Undertakings PNB Housing Finance Ltd. CARE A1+ 3.36Public Sector Undertakings - Total 3.36Treasury Bills 91 Days Treasury Bill 12/10/2017 SOV 4.17Treasury Bills - Total 4.17
Collateral Borrowing & Lending obligation 0.05Net Current Assets/(Liabilities) 2.57Grand Total 100.00
ALLOCATION (%)
RATING PROFILE (%)
72.53 16.93 4.17 3.75 2.57
0.05
Debentures and Bonds Commercial Paper (CP)/Certi�cate of Deposits (CD)
Treasury Bills
Government Dated Securities
Net Current AssetsCBLO & Term Deposits & Rev.Repo
Net Current Assets
52.81 37.59 6.512.57 0.47
0.05
AA+, AA+(SO), AA, AA(SO), AA-, AA-(SO), BWR AA-(SO), IND AA- A1+, A1+(SO), AAA, AAA(SO), IND AAA, SOVA, BWR A(SO), A- BBB+ CBLO & Term Deposits & Rev.Repo
25

Issuer/Instrument Industry/Rating % to Net Assets
Issuer/Instrument Industry/Rating % to Net Assets
Benchmark: Crisil Short - Term Bond Fund Fund Manager: AAUM:
AUM: Allotment date: May 2, 2002
KOTAK BOND SHORT TERMAn Open - Ended Debt Scheme
Investment Objective
The investment objective of the Scheme is to provide reasonable returns and high level of liquidity by investing in debt instruments s u c h a s b o n d s , d e b e n t u r e s a n d Government securities; and money market i n s t r u m e n t s s u c h a s t r e a s u r y bills,commercial papers, certificates of deposit, including repos in permitted securities of different maturities, so as to spread the risk across different kinds of issuers in the debt markets. The Scheme may invest in the call money/termmoney market in terms of RBI guidelines in this respect. To reduce the risk of the portfolio, the Scheme may also use various derivative and hedging products from time to time, in the manner permitted by SEBI. Subject to the maximum amount permitted from time to time, the Scheme may invest in offshore securities in the manner allowed by SEBI/RBI, provided such investments are in conformity with the investment objective of the Scheme and the prevailing guidelines and Regulations. However, there is no assurance that the objective of the scheme will be realized.
Available Plans/Options
A) Regular Plan B) Direct Plan
Options: Dividend Payout, Dividend Reinvestment & Growth (applicable for all plans)
Dividend Frequency
Monthly (12th of every Month), Half Yearly (20th of Mar/Sept) and normal (as decided by Trustees)
Ratios
$Source: ICRAMFI Explorer. Standard Deviation is calculated on Annualised basis using 3 years history of monthly returns.
Minimum Investment Amount
Initial Investment: (i) Dividend Re-investment & Growth - `5000 & above (ii) Dividend Payout (Monthly Dividend) - `50,000 & aboveAdditional Investment: ̀ 1000 & in multiples of ̀ 1Ideal Investments Horizon: 6 months & above
Load Structure
Entry Load: Nil. (applicable for all plans)Exit Load: Nil.
Regular:1.10%; Direct: 0.25%
Investment Style:
Total Expense Ratio**
`8,390.00 crs`8,665.65 crs
Mr. Deepak Agrawal*
(As on July 31, 2017)
PORTFOLIO
Average Maturity of the portfolio based on total maturity of fixed rate and immediate reset date of floating rate instruments : 2.49 years.Kotak Bond Short Term Fund NAV as on July 31, 2017: `31.5318 (Growth Option), `32.5524 (Direct Growth Option),`10.1361 (Monthly Dividend), ̀ 10.3984 (Direct Monthly Dividend),`11.6242 (Half Yearly Dividend), ̀ 11.6498 (Direct Half Yearly Dividend)
This product is suitable for investors who are seeking*:
� Regular income over short term� Income by focusing on low duration securities* Investors should consult their financial advisors if in doubt about whether the product is suitable for them.
* For Fund Manager experience, please refer page 54-55. For scheme performance, please refer page no 45-53. For last three dividends, please refer **Total Expense Ratio excludes applicable B15 fee and service tax.page no 56-58
Notes: ̂ Fully or Party blocked against Interest Rate Swap (IRS). Hedging Position through Interest Rate Swaps as on 31 Jul 2017 is 12.62% of the net assets.
Debt Instruments
Debentures and Bonds
Corporate Debt/Financial Institutions
HDFC Ltd.(^) CRISIL AAA 7.54
Nabha Power Ltd. ( backed by
unconditional and irrevocable
guarantee by Larsen &
Toubro Ltd ) (^) ICRA AAA 6.15
LIC Housing Finance Ltd. CRISIL AAA 5.52
Mahindra & Mahindra Financial
Services Ltd.(^) FITCH IND AAA 5.08
Kotak Mahindra Prime Ltd. CRISIL AAA 4.32
Reliance Jio Infocomm Limited CRISIL AAA 4.18
Gruh Finance Ltd CRISIL AAA 2.82
Bajaj Finance Limited CRISIL AAA 2.32
Indiabulls Housing Finance
Limited CARE AAA 2.19
Bajaj Finance Limited FITCH IND AAA 1.82
Dewan Housing Finance
Corporation Ltd. CARE AAA 1.40
Fullerton India Credit Co. Ltd.(^) CARE AAA 1.17
BMW India Financial Services
Private Limited CRISIL AAA 1.16
HDB Financial Services Ltd. CRISIL AAA 0.88
Kotak Mahindra Investments Ltd. CRISIL AAA 0.58
Tata Sons Ltd. CRISIL AAA 0.58
Indiabulls Housing Finance
Limited ICRA AAA 0.49
IOT Utkal Energy Services Ltd. CRISIL AAA(SO) 0.44
East-North Interconnection
Company Limited CRISIL AAA(SO) 0.06
Corporate Debt/Financial Institutions - Total 48.70
Public Sector Undertakings
Power Finance Corporation
Ltd.(^) CRISIL AAA 11.82
ONGC Manglore
Petrochemicals Ltd. FITCH IND AAA 4.45
Small Industries Development
Bank Of India. CARE AAA 4.01
Export-Import Bank of India. CRISIL AAA 1.76
National Bank for Agriculture
& Rural Development CRISIL AAA 1.65
Rural Electrification
Corporation Ltd.(^) CRISIL AAA 1.54
PNB Housing Finance Ltd. CARE AAA 1.34
Indian Railway Finance
Corporation Ltd. CRISIL AAA 0.15
Steel Authority of India Ltd. FITCH IND AA 0.03
Public Sector Undertakings - Total 26.75
Government Dated Securities
7.68% Central Government SOV 7.52
6.79% Central Government SOV 2.58
8.53T State Government SOV 2.16
8.26% State Government SOV 1.81
8.21% State Government SOV 1.32
7.61% Central Government SOV 1.22
8.45% State Government SOV 1.15
8.39% State Government SOV 0.64
8.55% State Government SOV 0.49
8.50% State Government SOV 0.37
8.27% State Government SOV 0.36
8.52% State Government SOV 0.18
1.44% Central Government SOV 0.12
Government Dated Securities - Total 19.92
Money Market Instruments
Commercial Paper(CP)/Certificate of Deposits(CD)
Corporate Debt/Financial Institutions
Bajaj Finance Limited CRISIL A1+ 0.69
Corporate Debt/Financial Institutions - Total 0.69
Treasury Bills
91 Days Treasury Bill 07/09/2017 SOV 1.72
Treasury Bills - Total 1.72
Collateral Borrowing & Lending obligation 0.03
Net Current Assets/(Liabilities) 2.19
Grand Total 100.00
Short Medium Long Volatiliy
Maturity
Low
Medium
High
$Standard Deviation
Modified Duration
Portfolio Yield
1.91%
2.01 yrs
7.12%
ALLOCATION (%)
RATING PROFILE (%)
97.75 2.19 0.03
0.03
A1+, AAA, AAA(SO), IND AAA, SOV Net Current Assets CBLO & Term Deposits & Rev.Repo IND AA
75.45 19.92 2.19 1.720.69
0.03
Debentures and Bonds Government Dated Securities
Net Current Assets Treasury Bills
Commercial Paper (CP)/Certi�cate of Deposits (CD)
CBLO & Term Deposits & Rev.Repo
Product Label
Riskometer
yletaredo
M
Moderate
Low
High
Low
High
LOW HIGH
Moderately
Investors understand that their principal will be at moderately low risk
�Don�t try to buy at the bottom and sell at the top. It can�t be done except by liars � Bernard Baruch�
26

Issuer/Instrument Industry/Rating % to Net Assets
Issuer/Instrument Industry/Rating % to Net Assets
Benchmark: CRISIL Composite Bond Fund Fund Manager: AAUM:
AUM: Allotment date: May 26, 2008
KOTAK FLEXI DEBTAn Open - Ended Debt Scheme
Investment ObjectiveTo maximize returns through an active management of a portfolio of debt and money market securities. However, there is no assurance that the objective of the scheme will be realized.
Available Plans/OptionsA)Regular Plan B)Direct Plan Options: Dividend Payout, Dividend Reinvestment & Growth(applicable for all plans)
Dividend FrequencyDaily Dividend Reinvestment, Weekly Dividend Reinvestment (Every Monday), Monthly Dividend Payout and Reinvestment (12th of every Month) (w.e.f June 1, 2017), Q u a r t e r l y D i v i d e n d P a y o u t a n d Reinvestment (20th of March, June, September and December of every year) (applicable for all plans)
Ratios
$Source: ICRAMFI Explorer. Standard Deviation is calculated on Annualised basis using 3 years history of monthly returns.
Minimum Investment AmountInitial Investment: `5000 and in multiple of `1 for purchase and for `0.01 for switches
Additional Investment: `1000 & in multiples of ̀ 1
Ideal Investment Horizon: 6 months & above
Load StructureEntry Load: Nil. (applicable for all plans)Exit Load: Nil
Regular:0.90%; Direct:0.35%
Investment Style:
Total Expense Ratio**
`1,136.57 crs `1,155.42 crs
Mr. Deepak Agrawal*
(As on July 31, 2017)
PORTFOLIO
Average Maturity of the portfolio based on total maturity of fixed rate and immediate reset date of floating rate instruments : 6.57 years
Kotak Flexi Debt Fund NAV as on July 31, 2017: `21.7554 (Growth Option), `22.3789 (Direct Growth Option),`10.5299 (Weekly Dividend), `12.8622 (Direct Weekly Dividend), `10.0345 (Daily Dividend), `10.1020 (Direct Daily Dividend), `10.9104 (Quarterly Dividend), ̀ 10.7027 (Direct Quarterly Dividend)
* For Fund Manager experience, please refer page 54-55. For scheme performance, please refer page no 45-53. For last three dividends, please refer **Total Expense Ratio excludes applicable B15 fee and service tax.page no 56-58
Notes: ̂ Fully or Party blocked against Interest Rate Swap (IRS). Hedging Position through Interest Rate Swaps as on 31 Jul 2017 is 8.60% of the net assets.
Medium Long Volatiliy
Maturity
Low
Medium
High
Short
Debentures and Bonds
Corporate Debt/Financial Institutions
Bajaj Finance Limited(^) CARE AAA 10.32
Bhopal Dhule Transmission
Company Ltd.(^) CRISIL AAA 4.36
Mahindra & Mahindra
Financial Services Ltd. CARE AAA 3.49
Reliance Ports And Terminals
Limited CRISIL AAA 3.07
Reliance Jio Infocomm Limited(^) CRISIL AAA 1.84
Indiabulls Housing Finance Limited CARE AAA 0.44
SP Jammu Udhampur
Highway Ltd. ( backed by
unconditional and irrevocable
guarantee of Shapoorji Pallonji &
Co Pvt Ltd ) ICRA AAA 0.14
Corporate Debt/Financial Institutions - Total 23.66
Public Sector Undertakings
Bank Of Baroda CARE AA 2.20
Power Grid Corporation of
India Ltd. CRISIL AAA 1.35
PNB Housing Finance Ltd. CARE AAA 0.45
Export-Import Bank of India. CRISIL AAA 0.09
Power Finance Corporation Ltd. CRISIL AAA 0.04
Rural Electrification
Corporation Ltd. CRISIL AAA 0.04
Public Sector Undertakings - Total 4.17
Government Dated Securities
6.79% Central Government SOV 23.47
7.68% Central Government SOV 16.37
8.53% State Government SOV 9.27
8.27% State Government SOV 6.33
8.26% State Government SOV 4.51
8.06% State Government SOV 4.48
8.45% State Government SOV 1.94
1.44% Central Government SOV 1.38
8.21% State Government SOV 0.94
9.49% State Government SOV 0.48
Government Dated Securities - Total 69.17
Collateral Borrowing & Lending obligation 0.75
Net Current Assets/(Liabilities) 2.25
Grand Total 100.00
Product Label
This product is suitable for investors who are seeking*:
� Income over a short term investment horizon� Investment in debt & money market securities* Investors should consult their financial advisors if in doubt about whether the product is suitable for them.
Riskometer
yletaredo
M
Moderate
Low
High
Low
High
LOW HIGH
Moderately
Investors understand that their principal will be at moderately low risk
$Standard Deviation
Modified Duration
Portfolio Yield
4.21%
4.77yrs
7.24 %
ALLOCATION (%)
RATING PROFILE (%)
69.17 27.83 2.250.75
Government Dated Securities Debentures and Bonds Net Current Assets CBLO & Term Deposits & Rev.Repo
94.80 2.25 2.20 0.75
AAA, SOV Net Current Assets AA CBLO & Term Deposits & Rev.Repo
�There is a close logical connection between the concept of a safety margin and the principle of diversi�cation.�
27

Issuer/Instrument Industry/Rating % to Net Assets
Issuer/Instrument Industry/Rating % to Net Assets
Benchmark: CRISIL Composite Bond Fund Fund Manager: AAUM:
AUM: Allotment date: May 11, 2010
KOTAK INCOME OPPORTUNITIES FUNDAn Open - Ended Debt Scheme
Investment ObjectiveThe investment objective of the scheme is to generate income by investing in debt /and money market securities across the yield curve and credit spectrum. The scheme would also seek to maintain reasonable liquidity within the fund. However, there is no assurance that the objective of the scheme will be realized.
Available Plans/OptionsA) Regular Plan B) Direct Plan
Options: Dividend Payout, Dividend Reinvestment & Growth (applicable for all plans)
Dividend FrequencyWeekly (Every Monday), Monthly (12th of every Month), Quarterly (20th of Mar, Jun, Sep and Dec of every Year), Annual (12th of March).
Ratios
$Source: ICRAMFI Explorer. Standard Deviation is calculated on Annualised basis using 3 years history of monthly returns.
Minimum Investment AmountInitial Investment: `5000 and in multiple of `1 for purchase and for `0.01 for switches
Additional Investment: `1000 & in multiples of ̀ 1
Ideal Investments Horizon: 1 year & above
Load StructureEntry Load: Nil. (applicable for all plans)
Exit Load: I) For redemption / switch out of upto 10% of the initial investment amount (limit) purchased or switched in within 1 year from the date of allotment: Nil.
II) If units redeemed or switched out are in excess of the limit within 1 year from the date of allotment: 1%.
iii) If units are redeemed or switched out on or after 1 year from the date of allotment: Nil.
Regular:1.60%; Direct: 0.90%
Investment Style:
Total Expense Ratio**
`4,394.07 crs `4,475.44 crs
Mr. Deepak Agrawal*
(As on July 31, 2017)
PORTFOLIO
Notes: ̂ Fully or Party blocked against Interest Rate Swap (IRS). Hedging Position through Interest Rate Swaps as on 31 Jul 2017 is 15.57% of the net assets.
Average Maturity of the portfolio based on total maturity of fixed rate and immediate reset date of floating rate instruments : 2.59 years.Kotak Income Opportunities Fund NAV as on July 31, 2017: `18.4250 (Growth Option), `19.2298 (Direct Growth Option),`10.0142 (Weekly Dividend), `10.4397 (Direct Weekly Dividend), `10.3611 (Monthly Dividend), `10.5831 (Direct Monthly Dividend), `10.7613 (Quarterly Dividend), ̀ 10.1442 (Direct Quarterly Dividend), ̀ 10.5414 (Annual Dividend), ̀ 14.4431 (Direct Annual Dividend).
$Standard Deviation
Modified Duration
Portfolio Yield
1.84%
2.02yrs
8.34%
* For Fund Manager experience, please refer page 54-55. For scheme performance, please refer page no 45-53. For last three dividends, please refer **Total Expense Ratio excludes applicable B15 fee and service tax.page no 56-58
Medium Long Volatiliy
Maturity
Low
Medium
High
Short
Product Label
This product is suitable for investors who are seeking*:
� Income over a medium term investment horizon� Investment in debt & money market securities* Investors should consult their financial advisors if in doubt about whether the product is suitable for them.
Riskometer
yletaredo
M
Moderate
Low
High
Low
High
LOW HIGH
Moderately
Investors understand that their principal will be at moderately low risk
Debt Instruments Debentures and Bonds Corporate Debt/Financial InstitutionsVedanta Ltd. CRISIL AA 7.90Innovador Traders Pvt Ltd ( backed by unconditional and irrevocable undertaking by Piramal ) ICRA AA-(SO) 4.47HPCL Mittal Pipelines Ltd. ICRA AA 4.44Reliance Jio Infocomm Limited(^) CRISIL AAA 3.77HPCL Mittal Energy Ltd. ICRA AA 3.70Tata Power Renewable Energy Ltd. ( Guaranteed by Tata Power Company Ltd) CARE AA(SO) 3.15HDFC Ltd. CRISIL AAA 2.72India Infoline Housing Finance Ltd. ICRA AA 2.72DLF Emporio Ltd(^) CRISIL AA 2.31AU Small Finance Bank Ltd. FITCH IND A+ 2.28Nirma Ltd.(^) CRISIL AA 2.26Karelides Traders Private Ltd. ( backed by unconditional and irrevocable undertaking by a wholly owned subsidiary of Piramal Enterprises Ltd ) ICRA AA-(SO) 2.25Indiabulls Housing Finance Limited(^) ICRA AAA 2.24Janalakshami Financial Services Ltd.(^) ICRA A 2.24K Raheja IT Park (Hyderabad) Ltd. FITCH IND AAA(SO) 2.24Vizag General Cargo Berth Private Limited ( backed by unconditional and irrevocable guarantee of Vedanta Ltd ) CRISIL AA(SO) 2.03Nuvoco Vistas Corporation Ltd. CRISIL AA 1.95ECL Finance Limited(^) ICRA AA 1.82Indiabulls Housing Finance Limited CARE AAA 1.76Tata Power Company Ltd. CRISIL AA- 1.76Prestige Estates Projects Limited ICRA A+ 1.70AXIS Bank Ltd.(^) CRISIL AA+ 1.58Reliance Ports And Terminals Limited(^) CRISIL AAA 1.36Muthoot Finance Ltd CRISIL AA 1.30ECL Finance Limited BRICKWORK BWR AA 1.23Ananta Landmarks Pvt Ltd. UNRATED 1.13Edelweiss Agri Value Chain Limited ( Unconditional and irrevocable guarantee from Edelweiss Financial Services Limited) CARE AA(SO) 1.13Tata Steel Limited(^) BRICKWORK BWR AA 1.12Asirvad Microfinance Private Limited ( 85 subsidiary of Manappuram Finance Ltd ) CRISIL A+ 0.79Dalmia Cement (Bharat) Ltd ICRA AA 0.77ECL Finance Limited CARE AA 0.59Piramal Finance Limited(^) ICRA AA 0.59Kolte-Patil Developers Limited CRISIL A+ 0.56Manappuram Finance Ltd CRISIL AA- 0.56SP Jammu Udhampur Highway Ltd. ( backed by unconditional and irrevocable guarantee of Shapoorji Pallonji & Co Pvt Ltd ) ICRA AAA 0.56
SBK Properties Pvt Ltd. ( Guaranteed by a Kalyani Group company ) ICRA AA- 0.54Bhopal Dhule Transmission Company Ltd. CRISIL AAA 0.40Continental Drug Company P Ltd ( Secured by Equity shares of Zee Entertainment Enterprises Ltd ) BRICKWORK BWR A+ 0.36Nabha Power Ltd. ( backed by unconditional and irrevocable guarantee by Larsen & Toubro Ltd ) ICRA AAA 0.34Tata Capital Financial Services Limited ICRA AA+ 0.34Essel Lucknow Raebareli Toll Roads Limited CARE AAA 0.33Piramal Enterprises Limited ICRA AA 0.23Mandava Holdings Private Limited ( backed by unconditional and irrevocable undertaking by Axis Capital ) ICRA AAA 0.18Indostar Capital Finance Private Limited CARE AA- 0.05Shriram Transport Finance Co Ltd. CRISIL AA+ 0.04LIC Housing Finance Ltd. CRISIL AAA 0.02Corporate Debt/Financial Institutions - Total 75.81Public Sector Undertakings U P Power Corporation Ltd ( Guaranteed By UP State Government ) (^) FITCH IND AA(SO) 4.14PNB Housing Finance Ltd. CARE AAA 3.82Union Bank of India CARE AA 1.46Corporation Bank CRISIL A 1.21Oriental Bank of Commerce ICRA A 1.21Punjab & Sind Bank ICRA A+ 1.11Bank of India CRISIL A+ 0.93Power Grid Corporation of India Ltd. CRISIL AAA 0.81Bank Of Baroda CARE AA 0.80Andhra Bank CRISIL AA- 0.56Indian Railway Finance Corporation Ltd. CRISIL AAA 0.56Syndicate Bank CARE AA- 0.52Bank Of Baroda CARE AA+ 0.46Canara Bank CRISIL AAA 0.23Allahabad Bank CRISIL AA- 0.22Bank of India BRICKWORK BWR AA- 0.14Konkan Railway Corporation Ltd. ICRA AAA 0.12Steel Authority of India Ltd. FITCH IND AA 0.02Public Sector Undertakings - Total 18.32Money Market Instruments Commercial Paper(CP)/Certificate of Deposits(CD) Corporate Debt/Financial Institutions JM Financial Products Limited CRISIL A1+ 2.14S D Corporation Private Limited ( DSRA Guarantee from Shapoorji Pallonji and Company Private Limited) CARE A1+(SO) 0.99Corporate Debt/Financial Institutions - Total 3.13
Collateral Borrowing & Lending obligation 0.51Net Current Assets/(Liabilities) 2.23Grand Total 100.00
ALLOCATION (%)
RATING PROFILE (%)
94.13 3.13 2.23 0.51
Debentures and Bonds Commercial Paper (CP)/Certi�cate of Deposits (CD)Net Current Assets
CBLO & Term Deposits & Rev.Repo
59.15 24.59 12.39 2.231.13
0.51
AA+, AA, AA(SO), BWR AA, IND AA, IND AA(SO), AA-, AA-(SO), BWR AA- A1+, A1+(SO), AAA, IND AAA(SO)
A+, BWR A+, IND A+, A Net Current Assets Unrated CBLO & Term Deposits & Rev.Repo
28

Issuer/Instrument Industry/Rating % to Net Assets
Issuer/Instrument Industry/Rating % to Net Assets
Benchmark: CRISIL Composite Bond Fund Fund Manager: AAUM:
AUM: Allotment date: September 21, 2007
KOTAK CORPORATE BOND FUNDAn Open - Ended Debt Scheme
Investment ObjectiveThe Fund seeks to generate income and capital appreciation largely through a focus on investments in corporate debt securities. However, there is no assurance or guarantee that the investment objective of the scheme will be achieved.
Available Plans/OptionsA) Regular Plan B) Direct Plan
Options: Dividend Payout, Dividend Reinvestment & Growth (applicable for all plans)
Dividend FrequencyMonthly (12th of every Month), Quarterly (20th of Mar, Jun, Sep and Dec of every Year)
Ratios
$Source: ICRAMFI Explorer. Standard Deviation is calculated on Annualised basis using 3 years history of monthly returns.
Minimum Investment AmountInitial Investment: `5000 and in multiple of `1 for purchase and for `0.01 for switches
Additional Investment: `1000 & in multiples of `1for purchase and for `0.01 for switches.
Ideal Investment Horizon: 1 Year & Above
Load StructureEntry Load: Nil. (applicable for all plans)
Exit Load: Nil. (applicable for all plans)
Regular:0.55%; Direct: 0.25%
Investment Style:
Total Expense Ratio**
`1,103.91 crs`1,054.70 crs
Mr. Deepak Agrawal*
(As on July 31, 2017)
PORTFOLIO
Notes: (^) Fully or Party blocked against Interest Rate Swap (IRS). Hedging Position through Interest Rate Swaps as on 31 Jul 2017 is 9.03% of the net assets.
Average Maturity of the portfolio based on total maturity of fixed rate and immediate reset date of floating rate instruments : 1.37 years
Kotak Corporate Bond Fund NAV as on July 31, 2017: ̀ 2195.2063 (Standard Plan-Growth Option), ̀ 1051.3862 (Standard Plan-Monthly Dividend), `1057.9437 (Standard Plan-Quarterly Dividend), `2234.5463 (Direct Plan- Growth Option), `1105.2306 (Direct Plan- Monthly Dividend)
$Standard Deviation
Modified Duration
Portfolio Yield
1.21%
1.15yrs
7.04%
* For Fund Manager experience, please refer page 54-55. For scheme performance, please refer page no 45-53. For last three dividends, please refer **Total Expense Ratio excludes applicable B15 fee and service tax.page no 56-58
Medium Long Volatiliy
Maturity
Low
Medium
High
Short
Product Label
This product is suitable for investors who are seeking*:
� Regular income over short term� Income by investing in fixed income securities of
varying maturities & credit* Investors should consult their financial advisors if in doubt about whether the product is suitable for them.
Riskometer
yletaredo
M
Moderate
Low
High
Low
High
LOW HIGH
Moderately
Investors understand that their principal will be at moderately low risk
Debt InstrumentsDebentures and Bonds Corporate Debt/Financial Institutions LIC Housing Finance Ltd. CARE AAA 9.04Bhopal Dhule Transmission Company Ltd. CRISIL AAA 7.62Mahindra & Mahindra Financial Services Ltd.(^) FITCH IND AAA 7.40Reliance Jio Infocomm Limited(^) CRISIL AAA 7.17Nabha Power Ltd. ( backed by unconditional and irrevocable guarantee by Larsen & Toubro Ltd ) ICRA AAA 5.59Indiabulls Housing Finance Limited CARE AAA 4.12Dewan Housing Finance Corporation Ltd. CARE AAA 2.75ICICI Home Finance Company Limited ICRA AAA 2.55HDB Financial Services Ltd. CRISIL AAA 1.64Indiabulls Housing Finance Limited ICRA AAA 1.18LIC Housing Finance Ltd. CRISIL AAA 0.97SP Jammu Udhampur Highway Ltd. ( backed by unconditional and irrevocable guarantee of Shapoorji Pallonji & Co Pvt Ltd ) ICRA AAA 0.64HDFC Ltd. CRISIL AAA 0.54IOT Utkal Energy Services Ltd. CRISIL AAA(SO) 0.51Bajaj Finance Limited FITCH IND AAA 0.23Ultratech Cement Ltd. CRISIL AAA 0.16
Corporate Debt/Financial Institutions - Total 52.11Public Sector Undertakings
PNB Housing Finance Ltd. CARE AAA 5.44Power Grid Corporation of India Ltd. CRISIL AAA 4.24ONGC Manglore Petrochemicals Ltd. FITCH IND AAA 3.87Canara Bank CRISIL AAA 2.44Power Finance Corporation Ltd.(^) CRISIL AAA 1.37Export-Import Bank of India. CRISIL AAA 1.07Rural Electrification Corporation Ltd. CRISIL AAA 0.95National Housing Bank CRISIL AAA 0.73Powergrid Vizag Transminssion Ltd. ( backed by unconditional and irrevocable guarantee by Powergrid Corp ) CRISIL AAA(SO) 0.66National Bank for Agriculture & Rural Development CRISIL AAA 0.47Indian Railway Finance Corporation Ltd. CRISIL AAA 0.45Airports Authority of India CRISIL AAA 0.09
Public Sector Undertakings - Total 21.78Money Market Instruments Commercial Paper(CP)/Certificate of Deposits(CD) Corporate Debt/Financial Institutions HDFC Bank Ltd. CARE A1+ 9.02BMW India Financial Services Private Limited CRISIL A1+ 4.01
Corporate Debt/Financial Institutions - Total 13.03
Collateral Borrowing & Lending obligation 6.69Net Current Assets/(Liabilities) 6.39Grand Total 100.00
ALLOCATION (%)
RATING PROFILE
86.92 6.69 6.39
A1+, AAA, AAA(SO), IND AAA CBLO & Term Deposits & Rev.Repo Net Current Assets
73.89 13.03 6.69 6.39
Debentures and Bonds Commercial Paper (CP)/Certi�cate of Deposits (CD)CBLO & Term Deposits & Rev.Repo
Net Current Assets
�In the short run the market is a voting machine, but in the long run it is a weighing machine.�
29

Details p
rovid
ed are as o
n Ju
ly 31st, 2017. N
ote: ^
UST =
Ultra Sh
ort Term
plan
, ^^
STP= Sh
ort Term
plan
. **AA
A also
inclu
des A
1+,A
1+(SO
), AA
A(SO
), IND
AA
A , N
et curren
t Assets, C
BLO
, Term D
epo
sit and
Rev rep
o. Fo
r Ko
tak Gilt Fu
nd
: Cash
and
Cash
Equ
ivalent is in
clud
ed u
nd
er Gilt.
For Liq
uid
schem
es ( Ko
tak Liqu
id Sch
eme an
d K
otak Flo
ater Sho
rt Term ) an
d Liq
uid
plu
s schem
es (Ko
tak Treasury A
dvan
tage an
d K
otak Lo
w D
uratio
n) T-b
ill is inclu
ded
in A
AA
. �AA
� inclu
des A
A,A
A+
,AA
-.
Nil
Nil
40.71% A
AA
52.78% A
A
25.51% A
AA
64.11% G
ilt8.65%
AA
YTM
%Exit Lo
adM
on
thly
Avg
. AU
M
(Rs cro
res)
Averag
e M
aturity
(years)
Cu
rrent Po
rtfolio
Q
uality**
Ideal In
vestmen
t H
orizo
nK
ey Differen
tiator
6.36
6.45
6.87
7.76
7.04
7.18
7.12
8.34
8.37
7.24
7.26
6.81
Nil
12,972.25
12,549.83
8,982.59
5,906.46
1,103.91
1,100.77
8,390.00
4,394.07
4,456.34
1,136.57
3,075.83
627.95
0.12
0.12
0.62
1.16
1.37
2.92
2.49
2.59
3.45
6.57
11.26
11.45
100% A
AA
1-15 days
1-15 days
1-3 Mo
nth
s
1-3 Mo
nth
s
6 Mo
nth
san
d ab
ove
6 Mo
nth
s an
d ab
ove
6 Mo
nth
s an
d ab
ove
1 Year and
abo
ve
2.5 Yearsan
d ab
ove
6 Mo
nth
s an
d ab
ove
1 Year and
abo
ve
1 Year and
abo
ve
Matu
rity < 91 d
ays
Matu
rity < 91 d
ays
Mo
dified
du
ration
< 6 m
on
ths
Mo
dified
du
ration
betw
een 6 � 12 m
on
ths
80-100% co
rpo
rate b
on
d exp
osu
re
Hig
h q
uality B
ankin
g&
PSU assets
Avg
Mat b
etween
1-3 years
Up
to 65%
in >
1 yr pap
ers,try to
capitalize o
nm
ispriced
credits
Avg
Mat b
etween
3-7 years
Dyn
amic strateg
y, du
ration
has n
ever go
ne ab
ove 5 years.
Dyn
amic strateg
y,n
o cap
on
du
ration
Dyn
amic strateg
y,n
o cap
on
du
ration
0.12
0.12
0.54
0.96
1.15
2.26
2.01
2.02
2.61
4.77
6.69
6.80
Nil
87.27% A
AA
12.73% A
A
Nil
100% A
AA
Nil
59.38% A
AA
,17.93%
Gilt
22.69% A
A
Nil
Nil
100% G
ilt
Nil
78.34% A
AA
,21.63%
Gilt
0.03% A
A
99.49% A
AA
0.52%A
A
Schem
e Nam
e
Liqu
id-A
gg
ressive
UST^
-Ag
gressive
28.62% A
AA
69.18% G
ilt2.20%
AA
Nil
Dyn
amic STP
Inco
me-A
gg
ressive
Cu
rrent Sch
eme
Positio
nin
g
Liqu
id-
Co
nservative
UST^
-Co
nservative
UST^
-Ag
gressive
Ban
king
and
PSU
Gilt-A
gg
ressive
With
draw
al up
to 15%
of
investm
ent am
t with
in 1 yr:
Nil W
ithin
18 mo
nth
s : 2%,
After 18 m
on
ths : N
il
31.68% A
AA
,56.89%
AA
,0.35%
Gilt
Accru
al
With
draw
al up
to 10%
of
investm
ent am
t with
in 1 yr:
Nil W
ithin
1 year : 1% ,
After 1 year : N
il
27.34% A
AA
59.14% A
AA
ccrual
STP^^
-Co
nservative
Deb
t Fun
ds R
eady R
eckon
er
Ko
tak Liqu
id
Schem
e
Mo
dified
Du
ration
(years)
Ko
tak Gilt
Investm
ent
Ko
tak Floater
Sho
rt Term
Ko
tak Treasury
Ad
vantag
e #
Ko
tak Low
Du
ration
Ko
tak Co
rpo
rateB
on
d
Ko
tak Ban
king
& PSU
Deb
t
Ko
tak Bo
nd
Sho
rt Term
Ko
tak Inco
me
Op
po
rtun
ities
Ko
tak Med
ium
Term
Ko
tak Flexi Deb
t
Ko
tak Bo
nd
Mutual Fund investments are subject to market risks, read all scheme related documents carefully.
Kotak 50
Kotak Midcap
Kotak Opportunities
Kotak Classic Equity
Kotak Select Focus Fund
Kotak Tax Saver
Kotak Emerging Equity Scheme
Equity Scheme
Kotak Balance Fund
Kotak Equity Savings Fund
Kotak Equity Arbitrage Fund
� Long term capital growth� Investment in portfolio of predominantly equity & equity related securities
� Long term capital growth� Investment in equity & equity related securities predominantly in mid cap stocks
� Long term capital growth� Investment in portfolio of predominantly equity & equity related securities
� Long term capital growth� Investment in portfolio of predominantly equity & equity related securities
� Long term capital growth� Investment in portfolio of predominantly equity & equity related securities generally focused on a few selected sectors
� Long term capital growth with a 3 year lock in� Investment in portfolio of predominantly equity & equity related securities
� Long term capital growth� Investment in equity & equity related securities predominantly in mid & small cap companies.
� Long term capital growth� Investment in equity & equity related securities balanced with income generation by investing in debt & money market instruments
� Income from arbitrage opportunities in the equity market & long term capital growth� Investment predominantly in arbitrage opportunities in the cash & derivatives segment of the equity market and equity & equity related securities
� Income from arbitrage opportunities in the equity market
� Investment in arbitrage opportunities in the cash & derivatives segment of the equity market.
� Long term capital growth� Long term capital appreciation by investing in equity and equity related instruments of companies contributing to infrastructure and economic development of India
Kotak Infrastructure &
Economic Reform Fund
(formerly known as
�PineBridge Infrastructure
& Economic Reform Fund�)
Debt Scheme
Kotak Bond
Kotak Gilt Investment
Kotak Medium Term Fund
Kotak Low Duration Fund (Formerly known as PineBridgIndia Short Term Fund)
Kotak Banking andPSU Debt Fund
Kotak Treasury Advantage Fund
Kotak Flexi Debt
Kotak Corporate Bond Fund (Formerly known as PineBridgeIndia Total Return Bond Fund)
Kotak Income Opportunities
Kotak Bond Short Term
Kotak Liquid
Name of the Scheme This product is suitable for investors who are seeking* Riskometer
Riskometer
Low
Moderately
Low
Moderate ModeratelyHigh
High
Investors understand that their principal will be at moderately low risk
Low High
Riskometer
Low
Moderately
Low
Moderate ModeratelyHigh
High
Investors understand that their principal will be at moderate risk
Low High
Riskometer
Low
Moderately
Low
Moderate ModeratelyHigh
High
Investors understand that their principal will be at low risk
Low High Kotak Floater Short Term
� Income over a long investment horizon� Investments in sovereign securities issued by the Central and/or State Government(s) and / or reverse repos in such securities.
� Income over a long investment horizon� Investment in debt & money market securities
� Income over a medium term investment horizon� Investment in debt, government securities & money market instruments with a portfolio weighted average maturity between 3-7 years
� Regular Income over short term� Income by focusing on low duration securities
� Income over a short to medium term investment horizon� Investment in debt & money market securities of PSUs, Banks & government securities
� Income over a short term investment horizon� Investment in debt & money market securities
� Income over a short term investment horizon� Investment in floating rate securities, debt & money market securities
� Income over a short term investment horizon� Investment in debt & money market securities
� Income over a medium term investment horizon� Investment in debt & money market securities
� Income over a medium term horizon� Investment in debt & money market securities
� Income over a medium term investment horizon� Investment in debt & money market securities
� Regular Income over short term� Income by investing in fixed income securities of varying maturities and credit
Riskometer
Low
Moderately
Low
Moderate ModeratelyHigh
High
Investors understand that their principal will be at High risk
Low High
Riskometer
Low
Moderately
Low
Moderate ModeratelyHigh
High
Investors understand that their principal will be at Moderately High risk
Low High
Riskometer
Low
Moderately
Low
Moderate ModeratelyHigh
High
Investors understand that their principal will be at Moderately low risk
Low High

Equity Funds Ready Reckoner
The performance and the other funds managed by the fund managers, please refer to page No. 45-55. Details provided are as on July 31st, 2017. Ratio Source: ICRA MFI Explorer. Risk rate assumed to be 6.25% . *For Kotak Midcap Fund & Kotak Emerging Equity Fund the stocks falling within the mcap range in Nifty Midcap 100 & S&P BSE Mid Small Cap, respectively, would be considered as midcap stocks. Any stock which would have mcapabove the highest mcap of these benchmarks would be considered as largecap, and any stock would have mcap below the lowest mcap would be considered as smallcap. For Tax Saver Fund: Minimum Initial Investment: 500. Additional Investment: 500 & inmultiples of 500. For all other Equity Schemes : Minimum Initial Investment: 5000. Additional Investment: 1000 & inmultiples of 1"
(24254 to 1978 crs)*MIDCAP
DEBT + CASH
LARGECAP(>24254 crs)*
(<1978 crs)*
SMALLCAPN/A: Field not applicable to the scheme owing to its investment theme. Risk Factor: Mutual Fund investments are subject to market risks, read all scheme related documents carefully. Continuous offer of units of all schemes available at NAV based prices.
Kotak 50a. Favours industry leaders in cost, innovation, brand, competence, etc. with a proven execution track record across cyclesb. High conviction and long term calls taken
Key Features
Kotak Classic Equity
Kotak Opportunities
Kotak Select Focus Fund
Kotak Tax Saver
Kotak Midcap
Kotak Emerging Equity Scheme
Kotak Infrastructure
& Economic Reform Fund
Kotak Balance Fund
Kotak Equity Arbitrage Fund
Thematic: Infrastructure
Large cap
Investment Theme
Large cap
Multi Cap
ELSS
Mid Cap
Mid and Small Cap
Balanced
Equity Arbitrage
Equity Savings
Invest with industry leaders
Product Positioning
Long term wealth creators
Spotting the hidden gems
Focus on few selected sectors
Tax advantage with potential equity growth
Spot them young, watch them grow
Emerging leaders
True to label
Best of both worlds: equity
& debt
Arbitrage opportunities
a. Focus on sustainable large cap stories which can withstand market shocksb. These are companies with pricing power for their competitive advantage or entry barriers
a. Invests in a few sectors as the various sectors of the economy tend to perform differently at different points of timeb. Flexibility to move across market caps depending on their attractiveness during the economic phase
a. Stands for winning investment ideas across the mid & small cap range offering decent growth trajectory over the medium to long term horizonb. Buy and hold strategyc. Riskier than a large cap fund but offers faster growth rate since it has a smaller based. d. 15%-20% allocation to large cap opportunities as tactical plays
a. Equity portion: Multi cap strategy to identify outstanding companies having well managed and durable businesses with predictable earnings powerb. Debt portion: Actively managed with medium to long term maturityc. Lower volatility than a pure equity or debt fund
a. Discovers arbitrage opportunities by simultaneously entering transactions of long position in cash and exactly off-setting short position in futuresb. Equity position is completely hedged
Identifies investment opportunities across market capitalisation and sectors
a. Portfolio is diversified across sectors and market capitalization segmentsb. Offers dual benefits of growth and tax savings
a. Identifies the hidden growth potential of mid-cap sized companiesb. Portfolio exhibits higher volatility than large caps however tends to have a larger return basec. Buy and hold strategy
a. Identifies ""flow related"" companies - These benefit from spending from government, private and household (in terms of properties). They are not asset owners.b. Focus on high quality companies exhibiting superior ROE, positive cash flow, low leverage in an otherwise challenging environment
Conservative portfolio with a blend of:a. Income generation - through arbitrage opportunities & debt investment.b. Growth potential - through moderate participation in equity marketsc. Tax efficiency - through equity orientation
Monthly AAUM
(Rs. Crs)Benchmark
Fund Manager Mcap (%)
Mr. Harish Krishnan
1,392.11
106.20
1,728.87
12,253.02
668.02
709.71
2,132.31
308.03
1,809.89
7,260.07
798.35
Underweight
1. Financial Services2. IT3. Metals
Beta
0.98
0.98
1.02
1.01
1.07
1.01
0.93
0.90
1.14
0.47
0.96
13.55
13.30
14.07
14.14
15.12
15.33
15.05
14.98
10.72
0.47
3.41
0.61
0.53
0.90
0.96
0.83
1.03
1.17
0.80
0.63
0.93
0.61
Nifty 50
Mr. Deepak Gupta
Mr. Harsha Upadhyaya
Mr. Harsha Upadhyaya
Mr. Harsha Upadhyaya
Mr. Pankaj Tibrewal
Mr. Pankaj Tibrewal
Mr. Harish Krishnan
Mr. Pankaj Tibrewal
& Mr. Abhishek
Bisen
Mr. Deepak Gupta
Mr. Deepak Gupta
& Mr. Abhishek
Bisen
Nifty 100
Nifty 500
Nifty 200
Nifty 500
Nifty Midcap
100
S&P BSE Mid
Small Cap
S&P BSE 100
Crisil Balanced
Fund
Nifty 50 Arbitrage
Index
75% of Nifty 50
Arbitrage Index + 25% of Nifty 50
N/A
N/A
34.6327.624.1233.63
75.5717.007.43
62.9034.381.311.40
17.5361.8215.994.66
N/A
Overweight
1. Industrial Manufacturing2. Media & Entertainment3. Cement & Cement Products
1. Energy 2. Metals3. IT
1. Cement & Cement Products2. Energy3. Fertilisers & Pesticides
1. Cement & Cement Products 2. Energy3. Industrial Manufacturing
1. Energy2. Cement & Cement Products3. Industrial Manufacturing
1. Media & Entertainment2. Industrial Manufacturing3. Chemicals
1. Industrial Manufacturing2. Media & Entertainment3. Chemicals
N/A
N/A
N/A
N/A
1. Financial Services2. Consumer Goods3. Constructions
1. Information technology2. Metals3. Consumer Goods
1. Information technology2. Metals3. Consumer Goods
1. Consumer Goods2. Information technology3. Metals
1. Energy2. Consumer Goods3. Metals
1. Energy2. Consumer Goods3. Metals
N/A
N/A
N/A
N/A
69.2627.593.15
75.2522.891.86
85.759.300.564.40
22.9354.5119.782.79
Standard Deviation
Sharpe 3 yearsAlpha
5.23%
2.41%
7.03%
9.09%
6.85%
3.49%
5.57%
8.4%
3%
0.23%
NAKotak Equity Savings Fund
Scheme Name

Issuer/Instrument Industry/Rating % to Net Assets
Issuer/Instrument Industry/Rating % to Net Assets
Benchmark: CRISIL Composite Bond Fund Fund Manager: AAUM:
AUM: Allotment date: March 21, 2014
KOTAK MEDIUM TERM FUNDAn Open - Ended Debt Scheme
Investment ObjectiveThe investment objective of the scheme is to generate regular income and capital appreciation by investing in a portfolio of medium term debt and money market instruments. However, there is no assurance that the objective of the scheme will be realized.
Available Plans/OptionsA) Regular Plan B) Direct Plan
Options: Dividend Payout, Dividend Reinvestment & Growth (applicable for all plans)
Dividend FrequencyQuarterly (20th of Mar, Jun, Sep and Dec of every Year), Annually (12th of March)
Ratios
$Source: ICRAMFI Explorer. Standard Deviation is calculated on Annualised basis using 3 years history of monthly returns.
Minimum Investment AmountInitial Purchase: `5,000/- and in multiples of 1 for purchases and for `0.01 for switches.
Additional Purchase: `1000 & in multiples of ̀ 1.for purchases and for ̀ 0.01 for switches.
Ideal Investment Horizon: 2.5 years & above
Load StructureEntry Load: Nil. (applicable for all plans)
Exit Load: i) For redemption / switch out of upto 15% of the initial investment amount (limit) purchased or switched in within 18 months from the date of allotment: Nil.
ii) If units redeemed or switched out are in excess of the limit within 18 months from the date of allotment: 2%.
iii) If units are redeemed or switched out on or after 18 months from the date of allotment: Nil.
Regular:1.70%; Direct: 0.98%
Investment Style:
Total Expense Ratio**
` 4,456.34 crs` 4,515.88 crs
Mr. Deepak Agrawal*
(As on July 31, 2017)
PORTFOLIO
Notes: ̂ Fully or Party blocked against Interest Rate Swap (IRS). Hedging Position through Interest Rate Swaps as on 31 Jul 2017 is 16.51% of the net assets.
Average Maturity of the portfolio based on total maturity of fixed rate and immediate reset date of floating rate instruments : 3.45 years
Kotak Medium Term Fund NAV as on July 31, 2017: `13.9284 (Growth Option), `14.3887 (Direct Growth Option),`10.6110 (Quarterly Dividend), ̀ 10.6244 (Direct Quarterly Dividend), ̀ 10.7979 (Annual Dividend), ̀ 14.4235 (Direct Annual Dividend).
$Standard Deviation
Modified Duration
Portfolio Yield
2.27%
2.61yrs
8.37%
* For Fund Manager experience, please refer page 54-55. For scheme performance, please refer page no 45-53. For last three dividends, please refer **Total Expense Ratio excludes applicable B15 fee and service tax.page no 56-58
Product Label
This product is suitable for investors who are seeking*:� Income over a medium term investment horizon� Investment in debt, government securities & money market
instruments with a portfolio weighted average maturity between 3-7 years
* Investors should consult their financial advisors if in doubt about whether the product is suitable for them.
Short Medium Long Volatiliy
Low
Medium
High
Maturity
Riskometer
Investors understand that their principal will be at moderate risk
yletaredo
M
Moderate
Low
High
Low
High
LOW HIGH
Moderately
Debt InstrumentsDebentures and BondsCorporate Debt/Financial InstitutionsReliance Jio Infocomm Limited(^) CRISIL AAA 8.20K Raheja IT Park (Hyderabad) Ltd. FITCH IND AAA(SO) 4.44Nuvoco Vistas Corporation Ltd.(^) CRISIL AA 4.42HPCL Mittal Energy Ltd. ICRA AA 3.26Piramal Finance Limited(^) ICRA AA 3.21Vizag General Cargo Berth Private Limited ( backed by unconditional and irrevocable guarantee of Vedanta Ltd ) CRISIL AA(SO) 3.02Dalmia Cement (Bharat) Ltd ICRA AA 3.00Edelweiss Housing Finance Limited ICRA AA 2.94AXIS Bank Ltd. CRISIL AA+ 2.57Tata Power Company Ltd.(^) CRISIL AA- 2.46Vedanta Ltd.(^) CRISIL AA 2.40Birla Corporation Ltd. CARE AA 2.02Nirma Ltd.(^) CRISIL AA 2.01ECL Finance Limited ICRA AA 1.81Prestige Estates Projects Limited ICRA A+ 1.68Reliance Utilities And Power Private Limited CRISIL AAA 1.63Tata Steel Limited CARE AA 1.51The Indian Hotels Company Ltd. CARE AA+ 1.45HPCL Mittal Pipelines Ltd. ICRA AA 1.26Ananta Landmarks Pvt Ltd. UNRATED 1.12Bhopal Dhule Transmission Company Ltd. CRISIL AAA 1.07Indiabulls Housing Finance Limited CARE AAA 1.01Tata Steel Limited BRICKWORK BWR AA 1.00Muthoot Finance Ltd CRISIL AA 0.90Edelweiss Agri Value Chain Limited ( Unconditional and irrevocable guarantee from Edelweiss Financial Services Limited) CARE AA(SO) 0.89Janalakshami Financial Services Ltd. ICRA A 0.88Essel Lucknow Raebareli Toll Roads Limited CARE AAA 0.79Tata Power Renewable Energy Ltd. ( Guaranteed by Tata Power Company Ltd) CARE AA(SO) 0.75SBK Properties Pvt Ltd. ( Guaranteed by a Kalyani Group company ) ICRA AA- 0.61AU Small Finance Bank Ltd. FITCH IND A+ 0.60Bajaj Finance Limited CARE AAA 0.56East-North Interconnection Company Limited CRISIL AAA(SO) 0.56L & T Housing Finance Ltd. CARE AA+ 0.56Reliance Ports And Terminals Limited(^) CRISIL AAA 0.56Tata Motors Ltd. CARE AA+ 0.55
ECL Finance Limited BRICKWORK BWR AA 0.44Asirvad Microfinance Private Limited ( 85 subsidiary of Manappuram Finance Ltd ) CRISIL A+ 0.42Intime Properties Ltd. FITCH IND AAA 0.32IOT Utkal Energy Services Ltd. CRISIL AAA(SO) 0.23Tata Capital Financial Services Limited ICRA AA+ 0.22Mandava Holdings Private Limited ( backed by unconditional and irrevocable undertaking by Axis Capital ) ICRA AAA 0.17LIC Housing Finance Ltd. CRISIL AAA 0.11SP Jammu Udhampur Highway Ltd. ( backed by unconditional and irrevocable guarantee of Shapoorji Pallonji & Co Pvt Ltd ) ICRA AAA 0.11Corporate Debt/Financial Institutions - Total 67.72Public Sector Undertakings U P Power Corporation Ltd ( Guaranteed By UP State Government ) FITCH IND AA(SO) 7.34PNB Housing Finance Ltd.(^) CARE AAA 3.98Power Finance Corporation Ltd. CRISIL AAA 2.86Oriental Bank of Commerce ICRA A 1.86Bank Of Baroda CARE AA 1.69Andhra Bank(^) CRISIL AA- 1.61Union Bank of India CARE AA 1.36Indian Railway Finance Corporation Ltd. CRISIL AAA 1.33Bank of India CRISIL A+ 1.15Punjab & Sind Bank ICRA A+ 1.10Corporation Bank CRISIL A 0.98IDBI Bank Ltd ICRA BBB- 0.81Syndicate Bank CARE AA- 0.58Union Bank of India FITCH IND AA 0.55Bank of India BRICKWORK BWR AA- 0.51Bank of Maharashtra CARE CARE BBB+ 0.47State Bank of Travancore CRISIL AAA 0.25Konkan Railway Corporation Ltd. ICRA AAA 0.12Public Sector Undertakings - Total 28.55Government Dated Securities 1.44% Central Government SOV 0.35Government Dated Securities - Total 0.35Money Market Instruments Commercial Paper(CP)/Certificate of Deposits(CD) Corporate Debt/Financial Institutions BMW India Financial Services Private Limited CRISIL A1+ 0.11Corporate Debt/Financial Institutions - Total 0.11
Collateral Borrowing & Lending obligation 0.24Net Current Assets/(Liabilities) 3.03Grand Total 100.00
ALLOCATION (%)
RATING PROFILE (%)
96.27 3.03 0.35 0.240.11
Debentures and Bonds
Net Current Assets
Government Dated Securities
CBLO & Term Deposits & Rev.Repo
Commercial Paper (CP)/Certi�cate of Deposits (CD)
56.9028.76 8.67 3.03
1.281.12
0.24
AA+, AA, AA(SO), BWR AA, IND AA, IND AA(SO), AA-, BWR AA- A1+, AAA, AAA(SO), IND AAA, IND AAA(SO), SOV
A+, IND A+, A Net Current Assets BBB-, CARE BBB+ Unrated CBLO & Term Deposits & Rev.Repo
30

Issuer/Instrument Industry/Rating % to Net Assets
Issuer/Instrument Industry/Rating % to Net Assets
Benchmark: Crisil Composite Bond Fund Fund Manager: AAUM:
AUM: Allotment date: November 25, 1999
KOTAK BONDAn Open - Ended Debt Scheme
Investment ObjectiveTo create a portfolio of debt and money market instruments of different maturities so as to spread the risk across a wide maturity horizon & different kinds of issuers in the debt market. However, there is no assurance that the objective of the scheme will be realized.
Available Plans/OptionsA) Regular Plan B) Direct Plan
Options: Dividend Payout, Dividend Reinvestment & Growth (applicable for all plans)
Dividend FrequencyQuarterly (20th of Mar/Jun/Sep/Dec), Half Yearly (20th of Mar/Sept), Annual (12th of Mar) (applicable for all plans)
Ratios
$Source: ICRAMFI Explorer. Standard
Deviation is calculated on Annualised basis using 3 years history of monthly returns.
Minimum Investment AmountInitial Investment: `5000 and in multiple of `1 for purchase and for `0.01 for switches
Additional Investment: `1000 & in multiples of ̀ 1
Ideal Investments Horizon: 1 year & above
Load StructureEntry Load: Nil. (applicable for all plans)
Exit Load: Nil. (applicable for all plans)
Regular:1.80%; Direct: 0.90%
Investment Style:
Total Expense Ratio**
`3,075.83 crs`2,971.73 crs
Mr. Abhishek Bisen*
(As on July 31, 2017)
PORTFOLIO
Average Maturity of the portfolio based on total maturity of fixed rate and immediate reset date of floating rate instruments : 11.26 years.Kotak Bond Fund NAV as on July 31, 2017: `48.0354 (Growth Option), `49.7050 (Direct Growth Option),`10.9079 (Quarterly Dividend), ̀ 13.4518 (Direct Quarterly Dividend), ̀ 29.4297 (Annual Dividend), ̀ 22.4660 (Direct Annual Dividend)
$Standard Deviation
Modified Duration
Portfolio Yield
6.91%
6.69yrs
7.26%
* For Fund Manager experience, please refer page 54-55. For scheme performance, please refer page no 45-53. For last three dividends, please refer **Total Expense Ratio excludes applicable B15 fee and service tax.page no 56-58
Product Label
This product is suitable for investors who are seeking*:
� Income over long term investment horizon� Investment in debt & money market securities* Investors should consult their financial advisors if in doubt about whether the product is suitable for them.
Riskometer
Investors understand that their principal will be at moderate risk
yletaredo
M
Moderate
Low
High
Low
High
LOW HIGH
Moderately
Debt InstrumentsDebentures and Bonds Corporate Debt/Financial Institutions Mahindra & Mahindra Financial Services Ltd. FITCH IND AAA 5.00
IDFC Bank Limited ICRA AAA 0.85East-North Interconnection
Company Limited CRISIL AAA(SO) 0.80
HDFC Ltd. CRISIL AAA 0.04Vedanta Ltd. CRISIL AA 0.03
Hindalco Industries Ltd. CRISIL AA 0.01
Corporate Debt/Financial Institutions - Total 6.73Public Sector Undertakings
U P Power Corporation Ltd ( Guaranteed By UP State Government ) FITCH IND AA(SO) 5.62
Nuclear Power Corporation Of
India Ltd. CRISIL AAA 4.24
Andhra Bank CRISIL AA- 2.97
Allahabad Bank FITCH IND A 1.73State Bank Of India. CRISIL AA+ 0.01
Public Sector Undertakings - Total 14.57Government Dated Securities
6.79% Central Government SOV 32.547.61% Central Government SOV 18.077.73% Central Government SOV 6.81
6.62% Central Government SOV 5.851.44% Central Government SOV 0.367.06% Central Government SOV 0.27
7.19% State Government SOV 0.098.72% State Government SOV 0.09
8.13% Central Government SOV 0.04
Government Dated Securities - Total 64.12Money Market Instruments Commercial Paper(CP)/Certificate of Deposits(CD) Corporate Debt/Financial Institutions
Bajaj Finance Limited CRISIL A1+ 5.02
Corporate Debt/Financial Institutions - Total 5.02
Collateral Borrowing & Lending obligation 0.19Net Current Assets/(Liabilities) 9.37Grand Total 100.00
Short Medium Long Volatiliy
Maturity
Low
Medium
High
ALLOCATION (%)
RATING PROFILE (%)
64.12 21.30 9.37 5.02
0.19
Government Dated Securities Debentures and BondsNet Current Assets
Commercial Paper (CP)/Certi�cate of Deposits (CD)CBLO & Term Deposits & Rev.Repo
80.07 9.37 8.64 1.73
0.19
A1+, AAA, AAA(SO), IND AAA, SOV Net Current Assets AA+, AA, IND AA(SO), AA- IND A
CBLO & Term Deposits & Rev.Repo
�An investment in knowledge pays the best interest.�
31

Issuer/Instrument Industry/Rating % to Net Assets
Issuer/Instrument Industry/Rating % to Net Assets
Benchmark: ISEC Composite Fund Manager: AAUM:
AUM: Allotment date: Regular Plan - December 29, 1998;PF & Trust Plan - November 11, 2003
KOTAK GILT INVESTMENTAn Open - Ended Debt Scheme
Investment ObjectiveTo generate risk-free returns through investments in sovereign securities issued by the Central and /or State Government(s) and/ or reverse repos in such securities. However, there is no assurance that the objective of the scheme will be realized.
Available Plans/OptionsA) Regular Non Direct Plan,
B) PF & Trust Non Direct Plan,
C) Regular Direct Plan, D) PF & Trust Direct Plan/
Options: Dividend Payout, Dividend Reinvestment & Growth (applicable for all plans)
Dividend FrequencyQuarterly (20th of Mar/Jun/Sep/Dec)
Ratios
$Source: ICRAMFI Explorer. Standard Deviation is calculated on Annualised basis using 3 years history of monthly returns.
Minimum Investment AmountInitial Investment: `5000 and in multiple of `1 for purchase and for `0.01 for switches
Additional Investment: `1000 & in multiples of ̀ 1
Ideal Investments Horizon: 1 year & above
Load StructureEntry Load: (a) Regular Plan - Entry: Nil. (b) PF & Trust Plan - Entry: Nil. (applicable for all plans)
Exit Load: (a) Regular Plan - Exit: Nil. (b) PF&Trust Plan - Exit: Nil. (applicable for all plans)
Regular:1.40%; Direct: 0.40%
Investment Style:
Total Expense Ratio**
` 627.95 crs`656.34 crs
Mr. Abhishek Bisen*
(As on July 31, 2017)
PORTFOLIO
Average Maturity of the portfolio based on total maturity of fixed rate and immediate reset date of floating rate instruments : 11.45 years.
Kotak Gilt Investment Fund NAV as on July 31, 2017: `59.0704 (Regular-Growth), `61.7949 (Regular-Growth-Direct),`13.1623 (Quarterly-Dividend), `13.9524 (Quarterly-Dividend Direct), `60.4328 (PF & Trust-Growth), `63.2756 (PF & Trust-Growth Direct), `11.7667 (PF & Trust-Quarterly Dividend ),
* For Fund Manager experience, please refer page 54-55. For scheme performance, please refer page no 45-53. For last three dividends, please refer **Total Expense Ratio excludes applicable B15 fee and service tax.page no 56-58
Product Label
This product is suitable for investors who are seeking*:� Income over a long investment horizon� Investments in sovereign securities issued by the Central
and/or State Government(s) and / or reverse repos in such securities.
* Investors should consult their financial advisors if in doubt about whether the product is suitable for them.
Riskometer
Investors understand that their principal will be at moderate risk
yletaredo
M
Moderate
Low
High
Low
High
LOW HIGH
Moderately
Short Medium Long Volatiliy
Maturity
Low
Medium
High
Government Dated Securities
6.79% Central Government SOV 44.00
7.61% Central Government SOV 20.05
7.73% Central Government SOV 8.12
6.62% Central Government SOV 7.16
7.73% State Government SOV 1.56
8.27% State Government SOV 0.80
8.52% State Government SOV 0.56
7.70% State Government SOV 0.47
7.86% State Government SOV 0.31
8.43% State Government SOV 0.16
8.21% State Government SOV 0.08
8.39% State Government SOV 0.06
Government Dated Securities - Total 83.33
Collateral Borrowing & Lending obligation 14.93
Net Current Assets/(Liabilities) 1.74
Grand Total 100
$Standard DeviationA)Regular P lan,B) PF & Trust Plan
Modified Duration
Portfolio Yield
7.97%7.97%
6.80 yrs
6.81%
ALLOCATION (%)
RATING PROFILE (%)
83.33 14.93 1.74
Government Dated Securities CBLO & Term Deposits & Rev.Repo Net Current Assets
83.33 14.93 1.74
SOV CBLO & Term Deposits & Rev.Repo Net Current Assets
�Four most dangerous words in investing '' it's different this time''�
32

Issuer/Instrument Industry/Rating % to Net Assets
Issuer/Instrument Industry/Rating % to Net Assets
Benchmark: CRISIL MIP Blended
Fund Manager: AAUM: AUM:
Allotment date: December 02, 2003
KOTAK MONTHLY INCOME PLAN
Investment ObjectiveTo enhance returns over a portfolio of Debt Instruments with a moderate exposure in Equity and Equity related Instruments. However, there is no assurance that the objective of the scheme will be realized.Available Plans/OptionsA) Regular Plan B) Direct PlanOptions: Dividend Payout, Dividend Reinvestment & Growth (applicable for all plans)Dividend FrequencyMonthly (12th of every Month) Quarterly (20th of Mar/Jun/Sep/Dec)Ratios
$Source: ICRAMFI Explorer. Standard Deviation is calculated on Annualised basis using 3 years history of monthly returns. Minimum Investment AmountInitial Investment: (i) Dividend Re-investment & Growth and Dividend Payout (Quarterly) - `5000 & above (ii) Dividend Payout (Monthly) - `50,000 & above Additional Investment: ̀ 1000 & in multiples of ̀ 1Ideal Investments Horizon - 1 year & aboveLoad StructureEntry Load: Nil. (applicable for all plans)Exit Load: i) For redemption / switch out of upto 10% of the initial investment amount (limit) purchased or switched in within 1 year from the date of allotment: Nil. ii) If units redeemed or switched out are in excess of the limit within 1 year from the date of allotment: 1%.iii) If units are redeemed or switched out on or after 1 year from the date of allotment: Nil.
Regular:2.28%; Direct: 1.08%
Investment Style:
Total Expense Ratio**
` 319.46 crs`331.07 crs
Mr. Devender Singhal & Mr. Abhishek Bisen*
(As on July 31, 2017)
PORTFOLIO
Note: Term Deposit as provided above is towards margin for derivatives transactions.Average Maturity of the portfolio based on total maturity of fixed rate and immediate reset date of floating rate instruments 7.52 years.Kotak Monthly Income Plan Fund NAV as on July 31, 2017: `29.2107 (Growth Option), `30.4707 (Direct Growth Option),`13.2323 (Monthly Dividend), ̀ 13.5719 (Direct Monthly Dividend), ̀ 14.4716 (Quarterly Dividend), ̀ 14.9654 (Direct Quarterly Dividend)
* For Fund Manager experience, please refer page 54-55. For scheme performance, please refer page no 45-53. For last three dividends, please refer **Total Expense Ratio excludes applicable B15 fee and service tax.page no 56-58
Product Label
This product is suitable for investors who are seeking*:� Income & capital growth over a long term horizon� Investment in a portfolio of debt instruments with a
moderate exposure in equity & equity related instruments* Investors should consult their financial advisors if in doubtabout whether the product is suitable for them.
Riskometer
Investors understand that their principal will be at moderate risk
yletaredo
M
Moderate
Low
Low
High
LOW HIGH
Moderately
$Standard Deviation
Modified Duration
Portfolio Yield
3.92%
4.87yrs
7.43%
An Open Ended Income Scheme. Monthly Income is not assured & is subject to availability of distributable surplus
Equity & Equity related (Listed/Awaiting listing on Stock
Exchange)
Infosys Ltd. Software 1.74
ITC Ltd. Consumer Non Durables 1.72
ICICI Bank Ltd. Banks 1.01
Bata India Ltd. Consumer Durables 0.98
State Bank Of India Banks 0.94
Tata Motors Ltd. Auto 0.85
Sun TV Limited. Media and Entertainment 0.82
Tata Communications Ltd Telecom - Services 0.81
Hero MotoCorp Ltd. Auto 0.76
Maruti Suzuki India Limited Auto 0.61
Jubilant Foodworks Limited Consumer Non Durables 0.60
Manpasand Beverages Ltd. Consumer Non Durables 0.57
Eris Lifesciences Ltd Pharmaceuticals 0.54
Whirlpool of India Ltd. Consumer Durables 0.50
India Cements Ltd. Cement 0.49
Federal Bank Ltd. Banks 0.46
Godfrey Phillips India Ltd. Consumer Non Durables 0.46
MindTree Ltd. Software 0.45
HDFC Ltd. Warrants Finance 0.44
Phillips Carbon Black Ltd. Chemicals 0.44
VST Industries Limited Consumer Non Durables 0.42
Axis Bank Ltd Banks 0.41
Hindalco Industries Ltd Non - Ferrous Metals 0.40
Bharat Earth Movers Ltd. Industrial Capital Goods 0.36
GAIL (India) Ltd. Gas 0.36
GP Petroleums Limited Petroleum Products 0.36
TV18 Broadcast Ltd Media and Entertainment 0.36
Granules India Ltd. Pharmaceuticals 0.34
Tata Steel Limited. Ferrous Metals 0.34
AU Small Finance Bank Ltd. Banks 0.25
Mcleod Russel India Ltd Consumer Non Durables 0.24
The Ramco Cements Ltd Cement 0.23
JMC Projects (India) Ltd Construction 0.20
Tech Mahindra Ltd. Software 0.19
Tata Motors Ltd - DVR Auto 0.10
JK Cement Ltd. Cement 0.01
Listed/Awaiting Listing on Stock Exchange - Total 19.76
Debt Instruments
Debentures and Bonds
Corporate Debt/Financial Institutions
Mahindra & Mahindra Financial
Services Ltd. FITCH IND AAA 4.49
LIC Housing Finance Ltd. CRISIL AAA 0.79
Corporate Debt/Financial Institutions - Total 5.28
Public Sector Undertakings
Vijaya Bank ICRA AA- 3.70
Syndicate Bank CARE AA- 3.15
Punjab & Sind Bank ICRA A+ 2.99
Public Sector Undertakings - Total 9.84
Government Dated Securities
7.61% Central Government SOV 23.85
6.79% Central Government SOV 16.09
8.18% State Government SOV 6.30
7.73% Central Government SOV 4.83
8.72% State Government SOV 2.64
8.27% State Government SOV 1.58
Government Dated Securities - Total 55.29
TERM DEPOSITS
AXIS Bank Ltd. 0.18
Term Deposits - Total 0.18
Collateral Borrowing & Lending obligation 8.70
Net Current Assets/(Liabilities) 0.95
Grand Total 100.00
Style ALLOCATION (%)
RATING PROFILE (%)
55.29 19.76 15.12 8.88 0.95
Government Dated Securities Equities Debentures and BondsCBLO & Term Deposits & Rev.Repo
Net Current Assets
60.57 19.76 8.88 6.852.99
0.95
AAA, IND AAA, SOV EquitiesCBLO & Term Deposits & Rev.Repo AA- A+Net Current Assets
High
�Try to learn from your mistakes - better yet, learn from the mistakes of others!�
Value Blend Growth Size
Large
Mid
Small
33

Issuer/Instrument Industry/Rating % to Net Assets
Issuer/Instrument Industry/Rating % to Net Assets
Benchmark:
Fund Manager: AAUM: AUM:
Allotment date: January 21, 2011KOTAK MULTI ASSET ALLOCATION FUND
Investment ObjectiveThe investment objective of the scheme is to g e n e r a t e i n c o m e b y i n v e s t i n g predominantly in debt and money market securities, to generate growth by taking moderate exposure to equity and equity re l a t ed i n s t r umen t s and p rov i de diversification by investing in Gold ETFs. However, there is no assurance that the objective of the scheme will be realized.Available Plans/OptionsA) Regular Plan B) Direct PlanOptions: Dividend Payout, Dividend Reinvestment & Growth (applicable for all plans))Dividend FrequencyMonthly (12th of Every Month), Quarterly (20th of Mar/Jun/Sep/Dec), Annual (12th of March)Ratios
$Source: ICRAMFI Explorer. Standard Deviation is calculated on Annualised basis using 3 years history of monthly returns. Minimum Investment AmountInitial Investment: `10000 and in multiple of `1 for purchase and for `0.01 for switchesAdditional Investment: `1000 & in multiples of ̀ 1Ideal Investments Horizon: 1 year & aboveLoad StructureEntry Load: Nil. (applicable for all plans)Exit Load: i) For exit within 1 year from thedate of allotment of units: 1%. ii) For exitafter 1 year from the date of allotmentof units: Nil. iii) Any exit load charged (netoff Service Tax, if any) shall be credited backto the Scheme.Note - Units issued on reinvestment ofdividends shall not be subject to exit load(applicable for all plans)
Regular:2.40%; Direct: 0.45%
`15.83 crs`15.86 crs
Mr. Deepak Gupta & Mr. Abhishek Bisen*
(As on July 31, 2017)
PORTFOLIO
Note: Term Deposit as provided above is towards margin for derivatives transactions.Average Maturity of the portfolio based on total maturity of fixed rate and immediate reset date of floating rate instruments: 4.00 years.Kotak Multi Asset Allocation Fund NAV as on July 31, 2017: `16.9028 (Growth Option), `17.8423 (Direct Growth Option),`14.0948 (Monthly Dividend), ̀ 12.5190 (Quarterly Dividend), `13.0217 (Direct Quarterly Dividend), `11.8857 (Annual Dividend), `12.6676 (Direct Annual Dividend)
* For Fund Manager experience, please refer page 54-55. For scheme performance, please refer page no 45-53. For last three dividends, please refer **Total Expense Ratio excludes applicable B15 fee and service tax.page no 56-58
This product is suitable for investors who are seeking*:� Income & capital growth over a long term horizon� Investment in a portfolio of diversified asset classes of debt,
equity & gold* Investors should consult their financial advisors if in doubtabout whether the product is suitable for them.
$Standard Deviation
Modified Duration
Portfolio Yield
3.15%
3.03yrs
7.32%
An Open - Ended Hybrid Scheme 65% CRISIL Short Term Bond Fund, 25% Nifty 50 and 10% Price of Gold.
Investment Style:
Total Expense Ratio**
Equity & Equity related (Listed/Awaiting listing on Stock
Exchange)Bharat Petroleum Corporation Ltd. Petroleum Products 0.98Power Grid Corporation Of India Ltd Power 0.94Yes Bank Ltd Banks 0.89IndusInd Bank Ltd. Banks 0.88Hindalco Industries Ltd Non - Ferrous Metals 0.85ITC Ltd. Consumer Non Durables 0.83Tata Steel Limited. Ferrous Metals 0.82Reliance Industries Ltd. Petroleum Products 0.81Infosys Ltd. Software 0.73National Thermal Power Corporation Limited Power 0.71Grasim Industries Ltd. Cement 0.70Bajaj Finance Limited Finance 0.67Hero MotoCorp Ltd. Auto 0.56Laurus Labs Ltd Pharmaceuticals 0.51Hindustan Unilever Ltd. Consumer Non Durables 0.49Maruti Suzuki India Limited Auto 0.44HDFC Ltd. Finance 0.40Petronet LNG Ltd. Gas 0.35Tata Motors Ltd. Auto 0.33Zee Entertainment Enterprises Ltd Media and Entertainment 0.32ICICI Bank Ltd. Banks 0.30The Ramco Cements Ltd Cement 0.30Axis Bank Ltd Banks 0.28Eicher Motors Ltd Auto 0.28Piramal Enterprises Limited Pharmaceuticals 0.28Tata Consultancy Services Ltd. Software 0.28AU Small Finance Bank Ltd. Banks 0.25JSW Steel Ltd. Ferrous Metals 0.25Housing & Urban Development Corporation Ltd Finance 0.23Bajaj Finserv Ltd. Finance 0.22Vedanta Ltd. Non - Ferrous Metals 0.22Larsen And Toubro Ltd. Construction Project 0.19Muthoot Finance Ltd Finance 0.19State Bank Of India Banks 0.19Aditya Birla Capital Ltd Finance 0.17HCL Technologies Ltd. Software 0.16Tata Motors Ltd - DVR Auto 0.16
Indian Oil Corporation Ltd Petroleum Products 0.14S Chand And Company Ltd Media and Entertainment 0.13Wipro Ltd. Software 0.13Central Depository Services (India) Ltd Finance 0.12HDFC Bank Ltd. Banks 0.11Oil & Natural Gas Corporation Ltd. Oil 0.11Indraprastha Gas Ltd. Gas 0.10Hindustan Petroleum Corporation Ltd Petroleum Products 0.09Tata Communications Ltd Telecom - Services 0.07Tech Mahindra Ltd. Software 0.06Biocon Ltd. Pharmaceuticals 0.05Hindustan Zinc Ltd. Non - Ferrous Metals 0.03Sun Pharmaceuticals Industries Ltd. Pharmaceuticals 0.02Listed/Awaiting Listing on Stock Exchange - Total 18.32Mutual Fund Units Kotak Mutual Fund - Kotak Gold ETF Mutual Fund Units 9.70Mutual Fund Units - Total 9.70Futures CNX NIFTY-AUG2017 -1.43Futures (Market value represents Notional Value) - Total -1.43Debt Instruments Debentures and Bonds Corporate Debt/Financial Institutions Hindalco Industries Ltd. CRISIL AA 5.44Corporate Debt/Financial Institutions - Total 5.44Government Dated Securities 8.45% State Government SOV 19.948.53% State Government SOV 19.907.29% State Government SOV 12.538.72% State Government SOV 10.03Government Dated Securities - Total 62.40
TERM DEPOSITS AXIS Bank Ltd. 1.58Term Deposits - Total 1.58
Net Current Assets/(Liabilities) 3.99Grand Total 100.00
ALLOCATION (%)
RATING PROFILE (%)
62.40 18.32 9.70 5.44 3.99 1.58- 1.43
Government Dated Securities Equities Mutual Fund UnitsDebentures and Bonds Net Current AssetsCBLO & Term Deposits & Rev.RepoDerivatives
62.40 18.32 9.70 5.44 3.99 1.58
SOV Equities Mutual Fund Units AA Net Current Assets
CBLO & Term Deposits & Rev.Repo
Derivatives
- 1.43
Riskometer
yletaredo
M
Moderate
Low
High
Low
High
LOW HIGH
Moderately
Product Label
Investors understand that their principal will be at moderately high risk �Focus on the price of the company rather than price of the share�
Style
Value Blend Growth Size
Large
Mid
Small
34

Details of exposure across all Debt Funds of Kotak Mahindra Mutual Fund as on July 31, 2017
Issuer Name%age of Exposure
to Debt AUM $ Issuer Name%age of Exposure
to Debt AUM $AU Small Finance Bank Ltd. 0.18AXIS Bank Ltd. 4.32Aasan Corporate Solutions Private Limited ( Guaranteed by a Piramal Group Company ) 0.10Adani Power Ltd ( Secured by Equity shares of Adani Ports and SEZ Ltd, Adani Transmission and Adani Enterprises) 0.29Adani Transmission Ltd 0.14Aditya Birla Finance Ltd. 0.28Airports Authority of India 0.04Allahabad Bank 0.14Altico Capital India Pvt Ltd 0.14Ananta Landmarks Pvt Ltd. 0.14Andhra Bank 0.40Asirvad Microfinance Private Limited ( 85% subsidiary of Manappuram Finance Ltd ) 0.08Aspire Home Finance Corporation Ltd 0.10BMW India Financial Services Private Limited 0.21Bajaj Capital Ventures Pvt. Ltd. ( Secured by Equity shares of Bajaj Corp. Ltd ) 0.11Bajaj Finance Limited 1.96Bank Of Baroda 0.57Bank of India 0.22Bank of Maharashtra 0.03Barclays Investments & Loan (India) Ltd. 0.07Bhopal Dhule Transmission Company Ltd. 0.28Birla Corporation Ltd. 0.13CBLO/REVERSE REPO 1.90Camden Industries Ltd. ( backed by unconditional and irrevocable undertaking of Axis Capital ) 0.07Canara Bank 0.18Canfin Homes Ltd 0.07Central Government 17.80Cholamandalam Investment and Finance Company Ltd 0.01Continental Drug Company P Ltd ( Secured by Equity shares of Zee Entertainment Enterprises Ltd ) 0.32Corporation Bank 0.14DLF Emporio Ltd 0.14Dalmia Cement (Bharat) Ltd 0.28Dewan Housing Finance Corporation Ltd. 0.21ECL Finance Limited 1.06East-North Interconnection Company Limited 0.08Edelweiss Agri Value Chain Limited ( Unconditional and irrevocable guarantee from Edelweiss Financial Services Limited) 0.40Edelweiss Commodities Services Ltd. 0.41Edelweiss Housing Finance Limited 0.28Edisons Utility Works Pvt.Ltd. ( Secured by Equity shares of Zee Entertainment Enterprises Ltd ) 0.16Emami Enclave Makers Pvt Ltd. ( Secured by Equity shares of Emami Ltd ) 0.07Essel Lucknow Raebareli Toll Roads Limited 0.07Export-Import Bank of India. 0.80Family Credit Ltd. 0.06Ford Credit India Pvt. Ltd. 0.07Fullerton India Credit Co. Ltd. 0.14Grand View Estates Pvt Ltd ( backed by unconditional and irrevocable guarantee of Shapoorji Pallonji & Co Pvt Ltd ) 0.26Gruh Finance Ltd 0.35HDB Financial Services Ltd. 0.28HDFC Bank Ltd. 3.38HDFC Ltd. 4.33HPCL Mittal Energy Ltd. 0.50HPCL Mittal Pipelines Ltd. 0.35Hero Cycles Ltd. 0.04High Point Properties Pvt LTD ( backed by unconditional and irrevocable guarantee of Shapoorji Pallonji & Co Pvt Ltd ) 0.12Hindalco Industries Ltd. 0.00Hinduja Leyland Finance Ltd. 0.14ICICI Bank Ltd. 0.14ICICI Home Finance Company Limited 0.43IDBI Bank Ltd 0.05IDFC Bank Limited 1.05IIFL Wealth Finance Ltd. 0.24IL & FS Transportation Networks Limited ( Secured by Equity shares of IL & FS Ltd ) 0.10IOT Utkal Energy Services Ltd. 0.11India Infoline Finance Limited 0.69India Infoline Housing Finance Ltd. 0.27Indiabulls Housing Finance Limited 1.42Indian Oil Corporation Ltd. 0.02Indian Railway Finance Corporation Ltd. 0.59Indostar Capital Finance Private Limited 0.14IndusInd Bank Ltd. 0.10Innovador Traders Pvt Ltd ( backed by unconditional and irrevocable undertaking by Piramal ) 0.58Intime Properties Ltd. 0.10JM Financial Products Limited 0.33Janalakshami Financial Services Ltd. 0.21K Raheja IT Park (Hyderabad) Ltd. 0.42Karelides Traders Private Ltd. ( backed by unconditional and irrevocable undertaking by a wholly owned subsidiary of Piramal Enterprises Ltd ) 0.34Kolte-Patil Developers Limited 0.06Konkan Railway Corporation Ltd. 0.02Kotak Mahindra Investments Ltd. 0.21
Kotak Mahindra Prime Ltd. 1.24L & T Housing Finance Ltd. 0.03LIC Housing Finance Ltd. 1.50Larsen and Toubro Ltd. 0.41MA MULTI TRADE PVT LTD ( Secured by Equity shares of Bajaj Corp. Ltd ) 0.11Mahindra & Mahindra Financial Services Ltd. 1.47Manappuram Finance Ltd 0.92Mandava Holdings Private Limited ( backed by unconditional and irrevocable undertaking by Axis Capital ) 0.19Muthoot Finance Ltd 1.91Muthoot Fincorp Ltd. 0.04Nabha Power Ltd. ( Backed by Letter of Comfort from L&T ) 0.54Nabha Power Ltd. ( backed by unconditional and irrevocable guarantee by Larsen & Toubro Ltd ) 1.71National Bank for Agriculture & Rural Development 1.87National Housing Bank 0.18Nirma Ltd. 0.64Nuclear Power Corporation Of India Ltd. 0.17Nuvoco Vistas Corporation Ltd. 0.56ONGC Manglore Petrochemicals Ltd. 0.63Oriental Bank of Commerce 0.34PNB Housing Finance Ltd. 1.32Piramal Enterprises Limited 0.01Piramal Finance Limited 1.80Power Finance Corporation Ltd. 3.39Power Grid Corporation of India Ltd. 0.34Powergrid Vizag Transminssion Ltd. ( backed by unconditional and irrevocable guarantee by Powergrid Corp ) 0.03Prestige Estates Projects Limited 0.28Pune Solapur Expressways Pvt. Ltd. ( toll road project of Tata Realty & Infrastructure Ltd, 100% subsidiary of Tata Sons ) 0.12Punjab & Sind Bank 0.17Punjab National Bank 0.04Reliance Industries Ltd. 2.07Reliance Infrastructure Ltd ( Backed by SBLC of ICICI Bank) 0.04Reliance Jio Infocomm Limited 3.15Reliance Ports And Terminals Limited 0.17Reliance Utilities And Power Private Limited 0.10Rural Electrification Corporation Ltd. 0.79S D Corporation Private Limited ( DSRA Guarantee from Shapoorji Pallonji and Company Private Limited) 0.70SBK Properties Pvt Ltd. ( Guaranteed by a Kalyani Group company ) 0.07SP Jammu Udhampur Highway Ltd. ( backed by unconditional and irrevocable guarantee of Shapoorji Pallonji & Co Pvt Ltd ) 0.10Sahyadri Agencies Ltd ( Secured by Equity shares of Jyothy Laboratories Ltd ) 0.26Shapoorji Pallonji Energy Gujarat Private Limited ( backed by unconditional and irrevocable guarantee of Shapoorji Pallonji & Co Pvt Ltd ) 0.08Shapoorji Pallonji and Company Private Limited 0.21Sheba Properties Ltd. 0.28Shriram City Union Finance Ltd. 0.17Shriram Transport Finance Co Ltd. 1.05Small Industries Development Bank Of India. 1.34Sneha Abasan Pvt Ltd ( Secured by Equity shares of Emami Ltd ) 0.05Sneha Enclave Pvt Ltd ( Secured by Equity shares of Emami Ltd ) 0.03State Bank Of India. 0.18State Bank of Travancore 0.07State Government 2.73Steel Authority of India Ltd. 2.08Sun Pharma Laboratories Limited 0.41Sundaram BNP Paribas Home Finance Ltd 0.07Sundaram Finance Ltd. 0.02Suraksha Realty Ltd ( Secured by Equity shares of Sun Pharmaceuticals Industries Ltd ) 1.30Syndicate Bank 0.12TGS Investment & Trade Private Ltd. 0.03Tata Capital Financial Services Limited 0.83Tata Capital Housing Finance Ltd; 0.08Tata Chemicals Ltd. 0.28Tata Motors Finance Ltd 0.30Tata Motors Finance Solutions Private Limited 0.14Tata Motors Ltd. 0.98Tata Power Company Ltd. 0.47Tata Power Renewable Energy Ltd. ( Guaranteed by Tata Power Company Ltd) 0.24Tata Sons Ltd. 0.10Tata Steel Limited 0.94The Indian Hotels Company Ltd. 0.09Trapti Trading & Investments Private Limited 0.10Trends In Vogue Pvt Ltd. ( backed by unconditional and irrevocable undertaking by Axis Capital ) 0.24U P Power Corporation Ltd ( Guaranteed By UP State Government ) 1.04Ultratech Cement Ltd. 0.02Union Bank of India 0.30Varun Beverages Limited 0.21Vedanta Ltd. 1.63Vijaya Bank 0.06Vizag General Cargo Berth Private Limited ( backed by unconditional and irrevocable guarantee of Vedanta Ltd ) 0.30Total 100.00
Industry / Sector %age of Exposure to Debt AUM $
BANK 10.12CASH(CBLO/REVERSE REPO) 1.97CORPORATES 28.94FINANCIAL SERVICES 22.69GOI/TBILLS 17.83NBFC 17.37REAL ESTATE 1.08Total 100.00
$ - Includes Hybrid schemes - debt schemes having equity exposure
35

Issuer/Instrument Industry/Rating % to Net Assets
Issuer/Instrument Industry/Rating % to Net Assets
* For Fund Manager experience, please refer page 54-55. For scheme performance, please refer page no 45-53 **Total Expense Ratio excludes applicable B15 fee and service tax.
Benchmark: Crisil Balanced FundFund Manager: AAUM:
AUM: Allotment date: August 9, 2004
KOTAK ASSET ALLOCATOR FUND
Investment ObjectiveThe investment objective of the scheme is to generate long-term capital appreciation from a portfolio created by investing in specified open-ended equity, and debt schemes of Kotak Mahindra Mutual Fund. However, there is no assurance that the investment objective of the Scheme will be realized.
Available Plans/OptionsA) Regular Plan B) Direct Plan Options: Dividend Payout,Dividend Reinvestment & Growth (applicable for all plans)
Dividend FrequencyTrustee�s Discretion
Minimum Investment AmountInitial Investment: `5000 and in multiple of `1 for purchase and for `0.01 for switchesAdditional Investment: `1000 & in multiples of ̀ 1Ideal Investment Horizon: 3 years & above
Load StructureEntry Load: Nil. (applicable for all plans)Exit Load: I) 1% if exit before 1 year from date of allotment. II) Nil if exit after 1 year from the date of allotment.
Exit Load shall be applicable incase of switch from Regular Plan (where broker code is mentioned) to Direct Plan
Exit Load shall not be applicable: Incase of switch from Regular Plan
( w h e r e n o b r o k e r c o d e i s mentioned) to Direct Plan
In case of switch from Direct Plan to Regular Plan.
Regular:1.70%; Direct: 0.74%
Total Expense Ratio**
`32.27 crs`32.52 crs
Mr. Deepak Gupta*
SECTOR ALLOCATION (%)
(As on July 31, 2017)
PORTFOLIO
Equity & Equity related (Listed/Awaiting listing on Stock Exchange)Mutual Fund Units Kotak Treasury Advantage Fund Direct Growth Debt Scheme 59.78 Kotak Bond Direct Plan Growth Debt Scheme 19.40 Kotak Select Focus Fund Direct Growth Equity Scheme 9.94
Kotak Liquid Direct Plan Growth Debt Sceme 8.45
Mutual Fund Units - Total 97.57 Collateral Borrowing & Lending obligation 1.84 Net Current Assets/(Liabilities) 0.59 Grand Total 100.00
Product Label
Investors understand that their principal will be at moderately High Risk
Riskometer
yletaredo
M
Moderate
Low
High
Low
High
LOW HIGH
Moderately
This product is suitable for investors who are seeking*:� Long term capital growth� Investment in open-ended diversified equity schemes and debt schemes of Kotak Mahindra
Mutual Fund* Investors should consult their financial advisors if in doubt about whether the product is suitable for them.
Kotak Asset Allocator Fund NAV as on July 31, 2017: `72.434 (Dividend Option), `74.100 (Direct Dividend Option), `74.413(Growth Option), `75.458 (Direct Growth Option)
An Open - Ended Equity Scheme
87.63 9.94 1.84 0.59
Debt Scheme Equity Scheme CBLO & Term Deposits & Rev.Repo Others
�A defensive investor can always prosper by looking patiently and calmly through the wreckage of a bear market.�
Investment Style
Style
Value Blend Growth Size
Large
Mid
Small
36

Issuer/Instrument Industry/Rating % to Net Assets
Issuer/Instrument Industry/Rating % to Net Assets
* For Fund Manager experience, please refer page 54-55. For scheme performance, please refer page no 45-53 **Total Expense Ratio excludes applicable B15 fee and service tax.
Benchmark: Standard & Poor's 500 Total Return Net Index in USD is thebenchmark of the underlying scheme. The same converted into INR using RBI reference rate will be the benchmark for the scheme.
Fund Manager: AAUM: AUM: Allotment date: December 20, 2013KOTAK US EQUITY FUND
An Open Ended Fund of Funds Scheme Investing OverseasInvestment Objective
The primary investment objective of the scheme is to provide long term capital appreciation by investing in units of a fund that invests predominantly in equity and equity related securities of companies having assets, products or operations in the United States. However, there is no assurance that the investment objective of the Scheme will be realized.
Available Plans/Options
A) Regular Plan B) Direct Plan
Options: Dividend Payout,
Dividend Reinvestment &
Growth (applicable for all plans)
Dividend Frequency
Trustee�s Discretion
Minimum Investment Amount
Initial Investment: `5000 and in multiple of `1 for purchase and for `0.01 for switches
Additional Investment: `1000 & in multiples of ̀ 1
Ideal Investment Horizon: 3 years & above
Load Structure
Entry Load: Nil. (applicable for all plans)
Exit Load: I) For redemptions / switch outs (including SIP/STP) within 1 year from the date of allotment of units: 1%;
ii) For redemptions / switch outs (including SIP/STP) after 1 year from the date of allotment of units: NIL;
Regular:1.40%; Direct: 0.63%
Investment Style:
Total Expense Ratio**
`4.74 crs`4.59 crs
Mr. Deepak Gupta*
SECTOR ALLOCATION (%)
(As on July 31, 2017)
PORTFOLIO
Equity & Equity related (Listed/Awaiting listing on Stock Exchange)Mutual Fund Units Pinebridge US Large Cap Resear ch Enhance Fund Overseas Mutual Fund 99.99
Mutual Fund Units - Total 99.99
Net Current Assets/(Liabilities) 0.01Grand Total 100.00
Product Label
This product is suitable for investors who are seeking*:� Long term capital growth� Long term capital appreciation by investing in
Units of PineBridge US Large Cap Research Enhanced Fund which in turn invests in equity and equity related securities of companies having assets, products or operations in the United States.
* Investors should consult their financial advisors if in doubt about whether the product is suitable for them.
Investors understand that their principal will be at high risk
Riskometer
yletaredo
M
Moderate
Low
High
Low
High
LOW HIGH
Moderately
Kotak US Equity Fund NAV as on July 31, 2017: `13.621 (Dividend Option), `14.006 (Direct Dividend Option), `14.005 (Growth Option), `13.624 (Direct Growth Option)
99.99 0.01
Overseas Mutual Fund Others
�Investing isn�t about beating others at their game. It�s about controlling yourself at your own game.�
Style
Value Blend Growth Size
Large
Mid
Small
37

Issuer/Instrument Industry/Rating % to Net Assets
Issuer/Instrument Industry/Rating % to Net Assets
* For Fund Manager experience, please refer page 54-55. For scheme performance, please refer page no 45-53 **Total Expense Ratio excludes applicable B15 fee and service tax.
Benchmark: MSCI Emerging Market
Fund Manager:
AAUM: AUM: Allotment date: September 26, 2007KOTAK GLOBAL EMERGING MARKET FUND
An Open - Ended Equity Scheme
Investment Objective
The investment objective of the scheme is to generate long-term capital appreciation by investing in an overseas mutual fund scheme that invest in a diversified portfolio of securities as prescribed by SEBI from time to time in global emerging markets. However, there is no assurance that the objective of the scheme will be realized.
Available Plans/Options
A) Regular Plan B) Direct Plan
Options: Dividend Payout,
Dividend Reinvestment &
Growth (applicable for all plans)
Dividend Frequency
Trustee�s Discretion
Minimum Investment Amount
Initial Investment: `5000 and in multiple of `1 for purchase and for `0.01 for switches
Additional Investment: `1000 & in multiples of ̀ 1
Ideal Investment Horizon: 3 years & above
Load Structure
Entry Load: Nil. (applicable for all plans)
Exit Load: I) For exit within 1 year from the date of allotment of units: 1%.
ii) For exit after 1 year from the date of allotment of units: Nil
Regular:1.80%; Direct: 0.83%
Investment Style:
Total Expense Ratio**
`27.95 crs`28.05 crs
Mr. Deepak Gupta (Dedicated fund manager for Fund Managers overseas investment) & Mr.Abhishek Bisen*
SECTOR ALLOCATION (%)
(As on July 31, 2017)
PORTFOLIO
Equity & Equity related (Listed/Awaiting listing on Stock Exchange) Mutual Fund Units MGF Asian Small Equity Fund Class I Overseas Mutual Fund 69.24 ishares MSCI Emerging Markets ETF Overseas Mutual Fund 26.22
Mutual Fund Units - Total 95.46 Net Current Assets/(Liabilities) 4.54Grand Total 100.00
Product Label
This product is suitable for investors who are seeking*:� Long term capital growth� Investment in overseas mutual fund schemes
that invest in a diversified portfolio of securities in global emerging markets
* Investors should consult their financial advisors if in doubt about whether the product is suitable for them.
Investors understand that their principal will be at high risk
Riskometer
yletaredo
M
Moderate
Low
High
Low
High
LOW HIGH
Moderately
Kotak Global Emerging Market Fund NAV as on July 31, 2017: `14.483 (Dividend Option), `14.536 (Direct Dividend Option), `14.483 (Growth Option), ̀ 15.037 (Direct Growth Option)
95.46 4.54
Overseas Mutual Fund Others
�The intelligent investor shouldn�t ignore Mr.Market entirely. Instead, you should do business with him- but only to the extent that it serves your interests�
Style
Value Blend Growth Size
Large
Mid
Small
38

Issuer/Instrument Industry/Rating % to Net Assets
Issuer/Instrument Industry/Rating % to Net Assets
* For Fund Manager experience, please refer page 54-55. For scheme performance, please refer page no 45-53 **Total Expense Ratio excludes applicable B15 fee and service tax.
Benchmark: Financial Times Gold Mines Total Price Index, in USD is the benchmark of Falcon Gold Equity Fund. The above translated to INR using the RBI Reference Rate will be the benchmark of Kotak World Gold Fund.
Fund Manager: AAUM: AUM: Allotment date: June 06, 2008KOTAK WORLD GOLD FUND
An Open � Ended Fund of Funds Scheme
Investment Objective
The primary investment objective of the Scheme is to provide long term capital appreciation by investing predominantly in units of Falcon Gold Equity Fund. The Scheme may, at the discretion of the Investment Manager, also invest in the units of other similar overseas mutual fund schemes. The Scheme may also invest a certain portion of its corpus in debt and money market securities and/or units of debt/liquid schemes of Mutual Funds, in order to meet liquidity requirements from time to time. However, there is no assurance that the investment objective of the Scheme will be realized.
Available Plans/Options
A) Regular Plan B) Direct Plan
Options: Dividend Payout,
Dividend Reinvestment &
Growth (applicable for all plans)
Dividend Frequency
Trustee�s Discretion
Minimum Investment Amount
Initial Investment: `5000 and in multiple of `1 for purchase and for `0.01 for switches
Additional Investment: `1000 & in multiples of ̀ 1
Ideal Investment Horizon: 3 years & above
Load Structure
Entry Load: Nil. (applicable for all plans)
Exit Load:
I) For redemptions / switch outs (including SIP/STP) within 1 year from the date of allotment of units: 1%;
ii) For redemptions / switch outs (including SIP/STP) after 1 year from the date of allotment of units: NIL;
Regular:1.90%; Direct: 1.16%
Investment Style:
Total Expense Ratio**
`40.73 crs`41.25 crs
Mr. Deepak Gupta*
SECTOR ALLOCATION (%)
(As on July 31, 2017)
PORTFOLIO
Equity & Equity related (Listed/Awaiting listing on Stock Exchange) Mutual Fund Units Falcon Gold Equity ASIA Overseas Mutual Fund 99.55
Mutual Fund Units - Total 99.55
Collateral Borrowing & Lending obligation 0.97 Net Current Assets/(Liabilities) -0.52 Grand Total 100.00
Product Label
This product is suitable for investors who are seeking*:� Long term capital growth� Long term capital appreciation by investing in
units of Falcon Gold Equity Fund which in turn invests in international securities of gold product ion, process ing and market ing companies
* Investors should consult their financial advisors if in doubt about whether the product is suitable for them.
Investors understand that their principal will be at high risk
Riskometer
yletaredo
M
Moderate
Low
High
Low
High
LOW HIGH
Moderately
Kotak World Gold Fund NAV as on July 31, 2017: `7.545 (Dividend Option), `7.816 (Direct Dividend Option), `9.102 (Growth Option), `9.408 (Direct Growth Option)
99.55-0.52 0.97
Overseas Mutual Fund CBLO & Term Deposits & Rev.Repo Others
�Stocks are slaves of earning power. In the short term market is like a voting machine. Flows count. In the long term market is like a weighing machine.
Only the fundamentals count�
Style
Value Blend Growth Size
Large
Mid
Small
39

Investment Objective
The investment objective of Kotak Gold ETF is to generate returns that are in line with the returns on investment in physical gold, subject to tracking error. However, there is no assurance that the investment objective of the Scheme will be realized.
Available Plan
Regular Plan
Minimum Investment Amount
Through Exchange:10 Units,
Through AMC: 10000 Units,
Ideal Investment Horizon: 3 years and above
Load Structure
Entry Load: Nil. (applicable for all plans)
Exit Load: Nil (applicable for all plans)
Total Expense Ratio**
Regular: 1.00%
7
Product Label
Investors understand that their principal will be at moderately high risk
Riskometer
yletaredo
M
Moderate
Low
High
Low
High
LOW HIGH
Moderately
SECTOR ALLOCATION (%)
* For Fund Manager experience, please refer page 54-55.**Total Expense Ratio excludes applicable B15 fee and service tax. For scheme performance, please refer page no 45-53
Issuer/Instrument Industry/Rating % to Net Assets
Issuer/Instrument Industry/Rating % to Net Assets
PORTFOLIO
Benchmark: Price of GoldFund Manager: Mr. Abhishek Bisen* AAUM: `406.92 crs
AUM: `414.00 crsAllotment date: July 27, 2007
KOTAK GOLD ETFAn Open Ended Gold Exchange Traded Fund (As on July 31, 2017)
Gold
Gold Fineness99.5 Gold 99.95
Listed/Awaiting Listing on Stock Exchange - Total 99.95
Net Current Assets/(Liabilities) 0.05
Grand Total 100.00
NAV
Kotak Gold ETF NAV as on July 31, 2017: ̀ 258.7077
Tracking Error: 0.06%
This product is suitable for investors who are seeking*:� Returns in line with physical gold over medium to long
term, subject to tracking error� Investment in physical gold* Investors should consult their financial advisors if in doubt about whether the product is suitable for them.
99.95 0.05
Gold Others
�It is never your thinking that makes money, it is your investing in the market that makes money.�
40

Investment Objective
The investment objective of the scheme is to provide returns before expenses that closely correspond to the total returns of the CNX Nifty subject to tracking errors. However, there is no assurance that the investment objective of the Scheme will be realized.
Available Plan
Regular Plan
Ratios
Minimum Investment Amount
Through Exchange:1 Unit,
Through AMC: 50000 Units,
Ideal Investment Horizon: 3 years and above
Load Structure
Entry Load: Nil. (applicable for all plans)
Exit Load: Nil (applicable for all plans)
Total Expense Ratio**
Regular: 0.10%
7
Product Label
Investors understand that their principal will be at moderately high risk
Riskometer
yletaredo
M
Moderate
Low
High
Low
High
LOW HIGH
Moderately
SECTOR ALLOCATION (%)
Issuer/Instrument Industry/Rating % to Net Assets
Issuer/Instrument Industry/Rating % to Net Assets
PORTFOLIO
Benchmark: Nifty 50Fund Manager: Mr. Deepak Gupta* AAUM: ` crs 521.60
AUM: ` crs518.61Allotment date: February 2, 2010
KOTAK NIFTY ETFAn Open Ended Exchange Traded Fund[Eligible scheme under Rajiv Gandhi Equity Savings Scheme (RGESS)]
(As on July 31, 2017)
NAV
Portfolio Turnover:
Tracking Error:
76.67%
0.08%
* For Fund Manager experience, please refer page 54-55. **Total Expense Ratio excludes applicable B15 fee. For scheme performance, please refer page no 45-53. For last three dividends, please refer page no 56-58
Equity & Equity related (Listed/Awaiting listing on Stock Exchange)
HDFC Bank Ltd. Banks 9.48
HDFC Ltd. Finance 7.46
Reliance Industries Ltd. Petroleum Products 7.02
ITC Ltd. Consumer Non Durables 6.36
Infosys Ltd. Software 5.30
ICICI Bank Ltd. Banks 5.09
Larsen And Toubro Ltd. Construction Project 3.86
Tata Consultancy Services Ltd. Software 3.48
Kotak Mahindra Bank Ltd. Banks 3.26
State Bank Of India Banks 3.04
Maruti Suzuki India Limited Auto 2.70
Axis Bank Ltd Banks 2.32
Tata Motors Ltd. Auto 2.19
IndusInd Bank Ltd. Banks 2.17
Hindustan Unilever Ltd. Consumer Non Durables 2.16
Yes Bank Ltd Banks 1.73
Mahindra & Mahindra Ltd. Auto 1.71
Sun Pharmaceuticals
Industries Ltd. Pharmaceuticals 1.54
Bharti Airtel Ltd. Telecom - Services 1.45
Asian Paints Ltd. Consumer Non Durables 1.37
Vedanta Ltd. Non - Ferrous Metals 1.36
HCL Technologies Ltd. Software 1.34
Power Grid Corporation
Of India Ltd Power 1.29
Oil & Natural Gas
Corporation Ltd. Oil 1.25
Hero MotoCorp Ltd. Auto 1.24
Ultratech Cement Ltd. Cement 1.11
National Thermal Power
Corporation Limited Power 1.07
Eicher Motors Ltd Auto 1.05
Bajaj Auto Ltd. Auto 1.00
Tata Steel Limited. Ferrous Metals 1.00
Indiabulls Housing Finance Ltd. Finance 0.99
Indian Oil Corporation Ltd Petroleum Products 0.98
Bharat Petroleum
Corporation Ltd. Petroleum Products 0.96
Wipro Ltd. Software 0.96
Coal India Ltd. Minerals/Mining 0.85
Adani Port and Special
Economic Zone Limited Transportation 0.84
Hindalco Industries Ltd Non - Ferrous Metals 0.84
Zee Entertainment
Enterprises Ltd Media and Entertainment 0.78
Dr Reddys Laboratories Ltd Pharmaceuticals 0.76
Bharti Infratel Ltd. Telecom - Equipment & Accessories 0.74
Cipla Ltd. Pharmaceuticals 0.74
Lupin Ltd. Pharmaceuticals 0.65
GAIL (India) Ltd. Gas 0.63
Tech Mahindra Ltd. Software 0.63
Bosch Limited Auto Ancillaries 0.58
Aurobindo Pharma Ltd. Pharmaceuticals 0.53
Ambuja Cements Ltd Cement 0.51
Bank Of Baroda Banks 0.41
Tata Power Co. Ltd. Power 0.39
ACC Ltd. Cement 0.38
Tata Motors Ltd - DVR Auto 0.35
Listed/Awaiting Listing on Stock Exchange - Total 99.90
Net Current Assets/(Liabilities) 0.10
Grand Total 100.00
Kotak Nifty ETF NAV as on July 31, 2017: ̀ 101.7096
This product is suitable for investors who are seeking*:� Long term capital growth� Investment in stocks comprising the underlying index
and endeavours to track the benchmark index* Investors should consult their financial advisors if in doubt about whether the product is suitable for them.
27.50 11.71 10.24 9.89 8.96 8.45 4.223.86
2.20
2.7510.22
Banks Software AutoConsumer Non Durables
Petroleum Products
FinancePharmaceuticals
Construction Project
Power
Non - Ferrous MetalsOthers
�Planning for a child? Plan your �nances as well�
4141

Investment Objective
The investment objective of the scheme is to provide returns before expenses that closely correspond to the total returns of the BSE SENSEX subject to tracking errors. However, there is no assurance that the investment objective of the Scheme will be realized.
Available Plan
Regular Plan
Ratios
Minimum Investment Amount
Through Exchange:1 Unit,
Through AMC: 10000 Units,
Ideal Investment Horizon: 3 years and above
Load Structure
Entry Load: Nil. (applicable for all plans)
Exit Load: Nil (applicable for all plans)
Total Expense Ratio**
Regular: 0.25%
7
Product Label
Investors understand that their principal will be at moderately high risk
Riskometer
yletaredo
M
Moderate
Low
High
Low
High
LOW HIGH
ModeratelySECTOR ALLOCATION (%)
Issuer/Instrument Industry/Rating % to Net Assets
Issuer/Instrument Industry/Rating % to Net Assets
PORTFOLIO
Benchmark: S&P BSE SENSEXFund Manager: Mr. Deepak Gupta* AAUM: ` crs 12.05
AUM: ` crs12.22Allotment date: June 6, 2008
KOTAK SENSEX ETFAn Open Ended Exchange Traded Fund[Eligible scheme under Rajiv Gandhi Equity Savings Scheme (RGESS)]
(As on July 31, 2017)
NAV
Portfolio Turnover:
Tracking Error:
19.87%
0.12%
* For Fund Manager experience, please refer page 54-55. **Total Expense Ratio excludes applicable B15 fee. For scheme performance, please refer page no 45-53. For last three dividends, please refer page no 56-58
Equity & Equity related (Listed/Awaiting listing on Stock Exchange)
HDFC Bank Ltd. Banks 11.68
HDFC Ltd. Finance 9.17
Reliance Industries Ltd. Petroleum Products 8.64
ITC Ltd. Consumer Non Durables 7.83
Infosys Ltd. Software 6.52
ICICI Bank Ltd. Banks 6.25
Larsen And Toubro Ltd. Construction Project 4.63
Tata Consultancy Services Ltd. Software 4.28
Kotak Mahindra Bank Ltd. Banks 3.57
State Bank Of India Banks 3.48
Maruti Suzuki India Limited Auto 3.31
Axis Bank Ltd Banks 2.81
Tata Motors Ltd. Auto 2.78
Hindustan Unilever Ltd. Consumer Non Durables 2.66
Mahindra & Mahindra Ltd. Auto 2.11
Sun Pharmaceuticals
Industries Ltd. Pharmaceuticals 1.85
Bharti Airtel Ltd. Telecom - Services 1.78
Asian Paints Ltd. Consumer Non Durables 1.69
Power Grid Corporation
Of India Ltd Power 1.58
Hero MotoCorp Ltd. Auto 1.51
Oil & Natural Gas
Corporation Ltd. Oil 1.47
National Thermal Power
Corporation Limited Power 1.31
Bajaj Auto Ltd. Auto 1.23
Tata Steel Limited. Ferrous Metals 1.23
Wipro Ltd. Software 1.18
Adani Port and Special
Economic Zone Limited Transportation 1.14
Coal India Ltd. Minerals/Mining 1.00
Dr Reddys Laboratories Ltd Pharmaceuticals 0.94
Cipla Ltd. Pharmaceuticals 0.91
Lupin Ltd. Pharmaceuticals 0.80
Tata Motors Ltd - DVR Auto 0.42
Listed/Awaiting Listing on Stock Exchange - Total 99.76
Net Current Assets/(Liabilities) 0.24
Grand Total 100.00
Kotak Sensex ETF NAV as on July 31, 2017: ̀ 328.4141
This product is suitable for investors who are seeking*:� Long term capital growth� Investment in stocks comprising the underlying index
and endeavours to track the benchmark index* Investors should consult their financial advisors if in doubt about whether the product is suitable for them.
27.79 12.18 11.98 11.36 9.17 8.64 4.63 4.50
2.89
1.78 5.08
Banks Consumer Non Durables
Software
Auto Finance
Petroleum Products
Construction Project
Pharmaceuticals Power
Telecom - Services
Others
�Time is a friend of a wonderful business, and enemy of the mediocre�
42

Investment Objective
The investment objective of the scheme is to provide returns before expenses that closely correspond to the total returns of stocks as represented by the CNX Bank Index subject to tracking errors. There can be no assurance or guarantee that the investment objective of the scheme will be achieved.
Available Plan/Options
Regular Plan
Option - Dividend Payout
Ratios
Minimum Investment Amount
Through Exchange:1 Unit,
Through AMC: 15000 Units,
Ideal Investment Horizon: 3 years and above
Load Structure
Entry Load: Nil. (applicable for all plans)
Exit Load: Nil (applicable for all plans)
Total Expense Ratio**
Regular: 0.20%
7
SECTOR ALLOCATION (%)
Issuer/Instrument Industry/Rating % to Net Assets
Issuer/Instrument Industry/Rating % to Net Assets
PORTFOLIO
Benchmark: Nifty BankFund Manager: Mr. Deepak Gupta* AAUM: ` crs 3,638.81
AUM: ` crs3,827.33Allotment date: December 04, 2014
KOTAK BANKING ETFAn Open Ended Exchange Traded Fund (As on July 31, 2017)
NAV
* For Fund Manager experience, please refer page 54-55. **Total Expense Ratio excludes applicable B15 fee. For scheme performance, please refer page no 45-53. For last three dividends, please refer page no 56-58
Kotak Banking ETF NAV as on July 31, 2017: ̀ 256.3398
This product is suitable for investors who are seeking*:� Long term capital growth� Investment in stocks comprising the underlying index
and endeavours to track the benchmark index* Investors should consult their financial advisors if in doubt about whether the product is suitable for them.
Equity & Equity related (Listed/Awaiting listing on Stock Exchange)
HDFC Bank Ltd. Banks 32.84
ICICI Bank Ltd. Banks 17.61
Kotak Mahindra Bank Ltd. Banks 11.28
State Bank Of India Banks 10.54
Axis Bank Ltd Banks 8.03
IndusInd Bank Ltd. Banks 7.51
Yes Bank Ltd Banks 6.01
Federal Bank Ltd. Banks 2.03
Bank Of Baroda Banks 1.42
Punjab National Bank Banks 1.10
IDFC Bank Limited Banks 0.72
Canara Bank Banks 0.68
Listed/Awaiting Listing on Stock Exchange - Total 99.77
Futures
CNX BANK INDEX-AUG2017 0.18
Futures (Market value represents Notional Value) - Total 0.18
Net Current Assets/(Liabilities) 0.05
Grand Total 100.00
Portfolio Turnover:
Tracking Error:
36.34%
0.08%
Product Label
Investors understand that their principal will be at high risk
Riskometer
yletaredo
M
Moderate
Low
High
Low
High
LOW HIGH
Moderately
99.77 0.18 0.05
Banks Derivatives Others
�Investing without research is like playing poker without looking at the cards�
43

Investment Objective
The investment objective of the scheme is to provide returns that closely correspond to the total returns of CNX PSU Bank Index, subject to tracking errors. However, there is no assurance that the investment objective of the Scheme will be realized.
Available Plan
Regular Plan
Ratios
Minimum Investment Amount
Through Exchange:1 Unit,
Through AMC: 10000 Units,
Ideal Investment Horizon: 3 years and above
Load Structure
Entry Load: Nil. (applicable for all plans)
Exit Load: Nil (applicable for all plans)
Total Expense Ratio**
Regular: 0.49%
7
SECTOR ALLOCATION (%)
Issuer/Instrument Industry/Rating % to Net Assets
Issuer/Instrument Industry/Rating % to Net Assets
PORTFOLIO
Benchmark: Nifty PSU BankFund Manager: Mr. Deepak Gupta* AAUM: ` crs 193.21
AUM: `206.01 crsAllotment date: November 8, 2007
KOTAK PSU BANK ETFAn Open Ended Exchange Traded Fund (As on July 31, 2017)
NAV
Portfolio Turnover:
Tracking Error:
175.08%
0.25%
* For Fund Manager experience, please refer page 54-55. **Total Expense Ratio excludes applicable B15 fee. For scheme performance, please refer page no 45-53. For last three dividends, please refer page no 56-58
Kotak PSU Bank ETF NAV as on July 31, 2017: ̀ 374.0611
This product is suitable for investors who are seeking*:� Long term capital growth� Investment in stocks comprising the underlying index
and endeavours to track the benchmark index* Investors should consult their financial advisors if in doubt about whether the product is suitable for them.
Equity & Equity related (Listed/Awaiting listing on Stock Exchange)
State Bank Of India Banks 69.01
Bank Of Baroda Banks 9.33
Punjab National Bank Banks 7.19
Canara Bank Banks 4.45
Bank of India Banks 2.50
Union Bank Of India Banks 2.39
Industrial Development
Bank of India Ltd. Banks 1.31
Oriental Bank of Commerce Banks 1.07
Allahabad Bank. Banks 0.99
Syndicate Bank Banks 0.91
Andhra Bank Banks 0.79
Listed/Awaiting Listing on Stock Exchange - Total 99.94
Net Current Assets/(Liabilities) 0.06
Grand Total 100.00
Product Label
Investors understand that their principal will be at high risk
Riskometer
yletaredo
M
Moderate
Low
High
Low
High
LOW HIGH
Moderately
99.94 0.06
Banks Others
�The only thing you should do with pro forma earnings is ignore them.�
44

Scheme Performances as on July 31, 2017
45
Kotak 50 - Dividend
Scheme Inception date is 29/12/1998. Mr. Harish Krishnan has been managing the fund since 01/01/2014Different plans have different expense structure. The performance details provided herein are of regular plan ^Past performance may or may not be sustained in future.*All payouts during the period have been reinvested in the units of the scheme at the then prevailing NAV. Returns >= 1 year: CAGR (Compounded Annualised Growth Rate). N.A stands for data not available. Note: Point to Point (PTP) Returns in INR shows the value of 10,000/- investment made at inception. Source: ICRA MFI Explorer. # Name of Scheme Benchmark. ## Name of Additional Benchmark.
SchemeReturns ^ (%) Nifty 50 # (%)
S&P BSE Sensex ## (%) Current Value of Standard Investment of ` 10000 in the
Scheme (`) Benchmark #(`)Additional
Benchmark # # (`)
Since Inception(Dec 29, 1998) 19.85 14.06 13.58 290,330 115,477 106,736
Last 1 Year 15.28 16.56 15.82
Last 3 Years 14.51 9.27 7.88 NA
Last 5 Years 17.02 14.01 13.53
Kotak Classic Equity Fund - Growth
Scheme Inception date is 27/07/2005. Mr. Deepak Gupta has been managing the fund since 01/01/2017.
Different plans have different expense structure. The performance details provided herein are of regular plan
^Past performance may or may not be sustained in future.*All payouts during the period have been reinvested in the units of the scheme at the then prevailing NAV. Returns >= 1 year: CAGR (Compounded Annualised Growth Rate). N.A stands for data not available. Note: Point to Point (PTP) Returns in INR shows the value of 10,000/- investment made at inception. Source: ICRA MFI Explorer. # Name of Scheme Benchmark. ## Name of Additional Benchmark.
SchemeReturns ^ (%)
Nifty 100# (%)
Nifty 50## (%) Current Value of Standard Investment of ` 10000 in the
Scheme (`) Benchmark #(`)Additional
Benchmark # # (`)
Since Inception(Jul 27, 2005) 13.32 13.38 13.00 44,929 45,220 43,453
Last 1 Year 20.04 17.76 16.56
Last 3 Years 13.24 10.83 9.27 NA
Last 5 Years 17.13 15.29 14.01
Kotak Opportunities - Growth
SchemeReturns ^ (%) Nifty 500 # (%) Nifty 50 ## (%) Current Value of Standard Investment of ` 10000 in the
Scheme (`) Benchmark #(`)Additional
Benchmark # # (`)
Since Inception(Sep 09, 2004) 20.65 15.32 15.07 112,581 62,883 61,110
Last 1 Year 24.02 19.84 16.56
Last 3 Years 19.41 12.38 9.27 NA
Last 5 Years 20.88 16.33 14.01
Scheme Inception date is 09/09/2004. Mr. Harsha Upadhyaya has been managing the fund since 04/08/2012.
Different plans have different expense structure. The performance details provided herein are of regular plan
^Past performance may or may not be sustained in future.*All payouts during the period have been reinvested in the units of the scheme at the then prevailing NAV. Returns >= 1 year: CAGR (Compounded Annualised Growth Rate). N.A stands for data not available. Note: Point to Point (PTP) Returns in INR shows the value of 10,000/- investment made at inception. Source: ICRA MFI Explorer. # Name of Scheme Benchmark. ## Name of Additional Benchmark.
Kotak Select Focus Fund - Growth
Scheme Inception date is 11/09/2009. Mr. Harsha Upadhyaya has been managing the fund since 04/08/2012.
Different plans have different expense structure. The performance details provided herein are of regular plan
^Past performance may or may not be sustained in future.*All payouts during the period have been reinvested in the units of the scheme at the then prevailing NAV. Returns >= 1 year: CAGR (Compounded Annualised Growth Rate). N.A stands for data not available. Note: Point to Point (PTP) Returns in INR shows the value of 10,000/- investment made at inception. Source: ICRA MFI Explorer. # Name of Scheme Benchmark. ## Name of Additional Benchmark.
SchemeReturns ^ (%)
Nifty 200 # (%) Nifty 50## (%) Current Value of Standard Investment of ` 10000 in the
Scheme (`) Benchmark #(`)Additional
Benchmark # # (`)
Since Inception(Sep 11, 2009) 15.83 10.36 9.77 31,880 21,767 20,866
Last 1 Year 23.74 18.80 16.56
Last 3 Years 20.58 11.49 9.27 NA
Last 5 Years 22.94 15.63 14.01
45

46
Kotak Emerging Equity - Growth
Scheme Inception date is 26/09/2007. Mr. Abhishek Bisen has been managing the fund since 04/04/2011.
Different plans have different expense structure. The performance details provided herein are of regular plan
^Past performance may or may not be sustained in future.*All payouts during the period have been reinvested in the units of the scheme at the then prevailing NAV. Returns >= 1 year: CAGR (Compounded Annualised Growth Rate). N.A stands for data not available. Note: Point to Point (PTP) Returns in INR shows the value of 10,000/- investment made at inception. Source: ICRA MFI Explorer. # Name of Scheme Benchmark. ## Name of Additional Benchmark.
SchemeReturns^ (%)
S&P BSE MidSmallCap# (%)
Nifty 50## (%) Current Value of Standard Investment of ` 10000 in the
Scheme (`) Benchmark #(`)Additional
Benchmark # # (`)
Since Inception(Mar 30, 2007) 13.52 12.35 9.83 37,139 33,346 26,369
Last 1 Year 22.39 26.43 16.56
Last 3 Years 25.29 19.72 9.27 NA
Last 5 Years 27.27 21.00 14.01
Kotak Tax Saver Scheme - Growth
Scheme Inception date is 23/11/2005. Mr. Harsha Upadhyaya has been managing the fund since 25/08/2015.
Different plans have different expense structure. The performance details provided herein are of regular plan
^Past performance may or may not be sustained in future.*All payouts during the period have been reinvested in the units of the scheme at the then prevailing NAV. Returns >= 1 year: CAGR (Compounded Annualised Growth Rate). N.A stands for data not available. Note: Point to Point (PTP) Returns in INR shows the value of 10,000/- investment made at inception. Source: ICRA MFI Explorer. # Name of Scheme Benchmark. ## Name of Additional Benchmark.
SchemeReturns^ (%)
Nifty 500# (%)
Nifty 50## (%) Current Value of Standard Investment of ` 10000 in the
Scheme (`) Benchmark #(`)Additional
Benchmark # # (`)
Since Inception(Nov 23, 2005) 12.75 12.34 12.25 40,687 38,986 38,630
Last 1 Year 22.30 19.84 16.56
Last 3 Years 19.23 12.38 9.27 NA
Last 5 Years 18.55 16.33 14.01
Kotak Midcap - Growth
Scheme Inception date is 24/02/2005. Mr. Pankaj Tibrewal has been managing the fund since 21/01/2010.
Different plans have different expense structure. The performance details provided herein are of regular plan
^Past performance may or may not be sustained in future.*All payouts during the period have been reinvested in the units of the scheme at the then prevailing NAV. Returns >= 1 year: CAGR (Compounded Annualised Growth Rate). N.A stands for data not available. Note: Point to Point (PTP) Returns in INR shows the value of 10,000/- investment made at inception. Source: ICRA MFI Explorer. # Name of Scheme Benchmark. ## Name of Additional Benchmark.
SchemeReturns ^ (%)
Nifty Midcap 100 # (%) Nifty 50 ## (%) Current Value of Standard Investment of ` 10000 in the
Scheme (`) Benchmark #(`)Additional
Benchmark # # (`)
Since Inception(Feb 24, 2005) 17.46 15.85 13.63 74,005 62,347 49,030
Last 1 Year 22.28 25.18 16.56
Last 3 Years 23.01 19.52 9.27 NA
Last 5 Years 24.65 20.88 14.01
Kotak Infrastructure and Economic Reform Fund - Growth
Scheme Inception date is 25/02/2008. Mr. Harish Krishnan has been managing the fund since 01/02/2015.
Different plans have different expense structure. The performance details provided herein are of regular plan
^Past performance may or may not be sustained in future.*All payouts during the period have been reinvested in the units of the scheme at the then prevailing NAV. Returns >= 1 year: CAGR (Compounded Annualised Growth Rate). N.A stands for data not available. Note: Point to Point (PTP) Returns in INR shows the value of 10,000/- investment made at inception. Source: ICRA MFI Explorer. # Name of Scheme Benchmark. ## Name of Additional Benchmark.
SchemeReturns^ (%)
S&P BSE 100 # (%) Nifty 50 ## (%) Current Value of Standard Investment of ` 10000 in the
Scheme (`) Benchmark #(`)Additional
Benchmark # # (`)
Since Inception(Feb 25, 2008) 8.10 7.15 7.26 20,851 19,186 19,376
Last 1 Year 23.46 17.70 16.56
Last 3 Years 18.57 10.17 9.27 NA
Last 5 Years 20.92 14.80 14.01
46

47
Scheme Inception date is 25/11/1999. Mr. Abhishek Bisen has been managing the fund since 15/04/2008. Mr. Pankaj Tibrewal has been managing the fund since 25/08/2015.
Different plans have different expense structure. The performance details provided herein are of regular plan
^Past performance may or may not be sustained in future.*All payouts during the period have been reinvested in the units of the scheme at the then prevailing NAV. Returns >= 1 year: CAGR (Compounded Annualised Growth Rate). N.A stands for data not available. Note: Point to Point (PTP) Returns in INR shows the value of 10,000/- investment made at inception. Source: ICRA MFI Explorer. # Name of Scheme Benchmark. ## Name of Additional Benchmark.
Kotak Balance
SchemeReturns ^ (%)
CRISIL Balanced Fund #(%) Nifty 50 ## (%) Current Value of Standard Investment of ` 10000 in the
Scheme (`) Benchmark #(`)Additional
Benchmark # # (`)
Since Inception(Nov 25, 1999) 15.20 NA 11.76 122,273 NA 71,537
Last 1 Year 15.84 14.36 16.56
Last 3 Years 13.11 10.11 9.27
Last 5 Years 14.89 12.71 14.01
Kotak Equity Arbitrage Fund - Growth
Scheme Inception date is 29/09/2005. Mr. Deepak Gupta has been managing the fund since 01/09/2008.
Different plans have different expense structure. The performance details provided herein are of regular plan
^Past performance may or may not be sustained in future.*All payouts during the period have been reinvested in the units of the scheme at the then prevailing NAV. Returns >= 1 year: CAGR (Compounded Annualised Growth Rate). N.A stands for data not available. Note: Point to Point (PTP) Returns in INR shows the value of 10,000/- investment made at inception. Source: ICRA MFI Explorer. # Name of Scheme Benchmark. ## Name of Additional Benchmark.
SchemeReturns ^ (%)
Nifty 50 Arbitrage Index # (%)
Nifty 50## (%) Current Value of Standard Investment of ` 10000 in the
Scheme (`) Benchmark #(`)Additional
Benchmark # # (`)
Since Inception(Sep 29, 2005) 7.62 NA 12.08 23,872 NA 38,592
Last 1 Year 6.14 5.36 16.56
Last 3 Years 6.89 6.65 9.27 NA
Last 5 Years 7.81 7.35 14.01
Kotak Equity Savings Fund - Growth
SchemeReturns ^ (%)
75% NIFTY 50 ARBITRAGE
+ 25% Nifty 50 # (%)
Nifty 50 # # (%) Current Value of Standard Investment of ` 10000 in the
Scheme (`) Benchmark #(`)Additional
Benchmark ## (`)
Since Inception(Oct 13, 2014) 9.10 7.44 9.16 12,763 12,226 12,781
Last 1 Year 10.31 8.18 16.56 NA
Scheme Inception date is 13/10/2014. Mr. Deepak Gupta has been managing the fund since 17/09/2014. Mr. Abhishek Bisen has been managing the fund since 17/09/2014.
Different plans have different expense structure. The performance details provided herein are of regular plan
^Past performance may or may not be sustained in future.*All payouts during the period have been reinvested in the units of the scheme at the then prevailing NAV. Returns >= 1 year: CAGR (Compounded Annualised Growth Rate). N.A stands for data not available. Note: Point to Point (PTP) Returns in INR shows the value of 10,000/- investment made at inception. Source: ICRA MFI Explorer. # Name of Scheme Benchmark. ## Name of Additional Benchmark.
OTHER PERFORMANCE
Kotak India Growth Fund - Series I - Regular Plan - Growth
Scheme Inception date is 06/05/2015. Mr. Harish Krishnan has been managing the fund since 06/05/2015
Different plans have different expense structure. The performance details provided herein are of regular plan
^Past performance may or may not be sustained in future.*All payouts during the period have been reinvested in the units of the scheme at the then prevailing NAV. Returns >= 1 year: CAGR (Compounded Annualised Growth Rate). N.A stands for data not available. Note: Point to Point (PTP) Returns in INR shows the value of 10,000/- investment made at inception. Source: ICRA MFI Explorer. # Name of Scheme Benchmark. ## Name of Additional Benchmark.
Scheme (`) Benchmark #(`)Additional
Benchmark # # (`)
Since Inception(May 06, 2015) 12.84 12.11 10.27 13,104 12,916 12,445
Last 1 Year 16.05 18.80 16.56
Last 3 Years NA 11.49 9.27 NA
Last 5 Years NA 15.63 14.01
SchemeReturns ^ (%)
Nifty 200 # (%) Nifty 50 ## (%) Current Value of Standard Investment of ` 10000 in the
47

48
Kotak Liquid - Regular Plan - Growth
Scheme Inception date is 04/11/2003. Mr. Deepak Agrawal has been managing the fund since 01/05/2007.
Different plans have different expense structure. The performance details provided herein are of regular plan
^Past performance may or may not be sustained in future.*All payouts during the period have been reinvested in the units of the scheme at the then prevailing NAV. Returns >= 1 year: CAGR (Compounded Annualised Growth Rate). N.A stands for data not available. Note: Point to Point (PTP) Returns in INR shows the value of 10,000/- investment made at inception. Source: ICRA MFI Explorer. # Name of Scheme Benchmark. ## Name of Additional Benchmark.
SchemeReturns^ (%)
CRISIL Liquid Fund # (%)
CRISIL 1 Year TBill## (%) Current Value of Standard Investment of ` 10000 in the
Scheme (`) Benchmark #(`)Additional
Benchmark # # (`)
Since Inception(Nov 04, 2003) 7.48 6.96 5.95 26,946 25,206 22,144
Last 1 Year 6.81 6.79 6.42
Last 3 Years 7.85 7.78 7.54 NA
Last 5 Years 8.38 8.23 7.32
Kotak Floater - Short Term - Growth
Scheme Inception date is 14/07/2003. Mr. Deepak Agrawal has been managing the fund since 01/11/2006.
Different plans have different expense structure. The performance details provided herein are of regular plan
^Past performance may or may not be sustained in future.*All payouts during the period have been reinvested in the units of the scheme at the then prevailing NAV. Returns >= 1 year: CAGR (Compounded Annualised Growth Rate). N.A stands for data not available. Note: Point to Point (PTP) Returns in INR shows the value of 10,000/- investment made at inception. Source: ICRA MFI Explorer. # Name of Scheme Benchmark. ## Name of Additional Benchmark.
SchemeReturns^ (%)
Crisil Liquid Fund# (%)
CRISIL 1 Year T-Bill## (%) Current Value of Standard Investment of ` 10000 in the
Scheme (`) Benchmark #(`)Additional
Benchmark # # (`)
Since Inception(Jul 14, 2003) 7.38 6.89 5.94 27,223 25,528 22,500
Last 1 Year 6.87 6.79 6.42
Last 3 Years 7.93 7.78 7.54 NA
Last 5 Years 8.44 8.23 7.32
Kotak Treasury Advantage Fund - Growth
Scheme Inception date is 13/08/2004. Mr. Deepak Agrawal has been managing the fund since 01/04/2008.
Different plans have different expense structure. The performance details provided herein are of regular plan
^Past performance may or may not be sustained in future.*All payouts during the period have been reinvested in the units of the scheme at the then prevailing NAV. Returns >= 1 year: CAGR (Compounded Annualised Growth Rate). N.A stands for data not available. Note: Point to Point (PTP) Returns in INR shows the value of 10,000/- investment made at inception. Source: ICRA MFI Explorer. # Name of Scheme Benchmark. ## Name of Additional Benchmark.
SchemeReturns ^ (%)
CRISIL Liquid Fund# (%)
CRISIL 1 Year TBill## (%) Current Value of Standard Investment of ` 10000 in the
Scheme (`) Benchmark #(`)Additional
Benchmark # # (`)
Since Inception(Aug 13, 2004) 7.86 7.14 6.07 26,689 24,455 21,472
Last 1 Year 7.51 6.79 6.42
Last 3 Years 8.33 7.78 7.54 NA
Last 5 Years 8.67 8.23 7.32
Kotak Banking and PSU Debt Fund - Growth
Scheme Inception date is 29/12/1998. Mr. Deepak Agrawal has been managing the fund since 01/08/2008.
Different plans have different expense structure. The performance details provided herein are of regular plan
^Past performance may or may not be sustained in future.*All payouts during the period have been reinvested in the units of the scheme at the then prevailing NAV. Returns >= 1 year: CAGR (Compounded Annualised Growth Rate). N.A stands for data not available. Note: Point to Point (PTP) Returns in INR shows the value of 10,000/- investment made at inception. Source: ICRA MFI Explorer. # Name of Scheme Benchmark. ## Name of Additional Benchmark.
SchemeReturns^ (%)
CRISIL Short Term Bond Fund #(%)
CRISIL 1 Year Tbill##(%)
Current Value of Standard Investment of ` 10000 in the
Scheme (`) Benchmark #(`)Additional
Benchmark # # (`)
Since Inception(Dec 29, 1998) 7.45 NA 6.65 38,029 NA 33,117
Last 1 Year 9.00 8.37 6.42
Last 3 Years 8.99 9.14 7.54 NA
Last 5 Years 9.07 9.08 7.32
48

Kotak Low Duration Fund - Growth
Scheme Inception date is 06/03/2008. Mr. Deepak Agrawal has been managing the fund since 01/02/2015.
Different plans have different expense structure. The performance details provided herein are of regular plan
^Past performance may or may not be sustained in future.*All payouts during the period have been reinvested in the units of the scheme at the then prevailing NAV. Returns >= 1 year: CAGR (Compounded Annualised Growth Rate). N.A stands for data not available. Note: Point to Point (PTP) Returns in INR shows the value of 10,000/- investment made at inception. Source: ICRA MFI Explorer. # Name of Scheme Benchmark. ## Name of Additional Benchmark.
SchemeReturns^ (%)
CRISIL Liquid Fund # (%)
CRISIL 1 Year TBill## (%) Current Value of Standard Investment of ` 10000 in the
Scheme (`) Benchmark #(`)Additional
Benchmark # # (`)
Since Inception(Mar 06, 2008) 7.84 7.63 6.48 20,345 19,975 18,060
Last 1 Year 8.31 6.79 6.42
Last 3 Years 9.13 7.78 7.54 NA
Last 5 Years 8.68 8.23 7.32
49
Kotak Bond Short Term Plan - Growth
Scheme Inception date is 02/05/2002. Mr. Deepak Agrawal has been managing the fund since 11/07/2007.
Different plans have different expense structure. The performance details provided herein are of regular plan
^Past performance may or may not be sustained in future.*All payouts during the period have been reinvested in the units of the scheme at the then prevailing NAV. Returns >= 1 year: CAGR (Compounded Annualised Growth Rate). N.A stands for data not available. Note: Point to Point (PTP) Returns in INR shows the value of 10,000/- investment made at inception. Source: ICRA MFI Explorer. # Name of Scheme Benchmark. ## Name of Additional Benchmark.
SchemeReturns^ (%)
CRISIL Short Term Bond Fund #(%)
CRISIL 1 Year Tbill##(%) Current Value of Standard Investment of ` 10000 in the
Scheme (`) Benchmark #(`)Additional
Benchmark # # (`)
Since Inception(May 02, 2002) 7.82 7.32 5.97 31,532 29,373 24,227
Last 1 Year 7.95 8.37 6.42
Last 3 Years 8.77 9.14 7.54 NA
Last 5 Years 8.67 9.08 7.32
Kotak Flexi Debt - Regular Plan - Growth
Scheme Inception date is 26/05/2008. Mr. Deepak Agrawal has been managing the fund since 25/11/2012.
Different plans have different expense structure. The performance details provided herein are of regular plan
^Past performance may or may not be sustained in future.*All payouts during the period have been reinvested in the units of the scheme at the then prevailing NAV. Returns >= 1 year: CAGR (Compounded Annualised Growth Rate). N.A stands for data not available. Note: Point to Point (PTP) Returns in INR shows the value of 10,000/- investment made at inception. Source: ICRA MFI Explorer. # Name of Scheme Benchmark. ## Name of Additional Benchmark.
SchemeReturns ^ (%)
CRISIL Composite Bond Fund #(%)
CRISIL 1 Year TBill ##(%) Current Value of Standard Investment of ` 10000 in the
Scheme (`) Benchmark #(`)Additional
Benchmark # # (`)
Since Inception(May 26, 2008) 8.83 8.27 6.48 21,755 20,744 17,807
Last 1 Year 9.96 9.94 6.42
Last 3 Years 10.15 11.00 7.54 NA
Last 5 Years 9.73 9.61 7.32
Kotak Income Opportunities Fund - Growth
SchemeReturns^ (%)
CRISIL Short Term Bond Fund # (%)
CRISIL 1 Year TBill## (%) Current Value of Standard Investment of ` 10000 in the
Scheme (`) Benchmark #(`)Additional
Benchmark # # (`)
Since Inception(May 11, 2010) 8.82 8.47 6.82 18,425 18,000 16,113
Last 1 Year 8.99 8.37 6.42
Last 3 Years 9.61 9.14 7.54 NA
Last 5 Years 9.34 9.08 7.32
Scheme Inception date is 11/05/2010. Mr. Deepak Agrawal has been managing the fund since 12/04/2010.
Different plans have different expense structure. The performance details provided herein are of regular plan
^Past performance may or may not be sustained in future.*All payouts during the period have been reinvested in the units of the scheme at the then prevailing NAV. Returns >= 1 year: CAGR (Compounded Annualised Growth Rate). N.A stands for data not available. Note: Point to Point (PTP) Returns in INR shows the value of 10,000/- investment made at inception. Source: ICRA MFI Explorer. # Name of Scheme Benchmark. ## Name of Additional Benchmark.
49

50
Kotak Corporate Bond Fund - Growth
Scheme Inception date is 21/09/2007. Mr. Deepak Agrawal has been managing the fund since 01/02/2015.
Different plans have different expense structure. The performance details provided herein are of regular plan
^Past performance may or may not be sustained in future.*All payouts during the period have been reinvested in the units of the scheme at the then prevailing NAV. Returns >= 1 year: CAGR (Compounded Annualised Growth Rate). N.A stands for data not available. Note: Point to Point (PTP) Returns in INR shows the value of 10,000/- investment made at inception. Source: ICRA MFI Explorer. # Name of Scheme Benchmark. ## Name of Additional Benchmark.
SchemeReturns^ (%)
CRISIL Composite Bond Fund #(%)
CRISIL 1 Year Tbill##(%)
Current Value of Standard Investment of ` 10000 in the
Scheme (`) Benchmark #(`)Additional
Benchmark # # (`)
Since Inception(Sep 21, 2007) 8.30 8.15 6.44 21,952 21,667 18,506
Last 1 Year 8.54 9.94 6.42
Last 3 Years 10.21 11.00 7.54 NA
Last 5 Years 8.77 9.61 7.32
Kotak Medium Term Fund - Regular Plan - Growth
Scheme Inception date is 21/03/2014. Mr. Deepak Agrawal has been managing the fund since 22/06/2015.
Different plans have different expense structure. The performance details provided herein are of regular plan
^Past performance may or may not be sustained in future.*All payouts during the period have been reinvested in the units of the scheme at the then prevailing NAV. Returns >= 1 year: CAGR (Compounded Annualised Growth Rate). N.A stands for data not available. Note: Point to Point (PTP) Returns in INR shows the value of 10,000/- investment made at inception. Source: ICRA MFI Explorer. # Name of Scheme Benchmark. ## Name of Additional Benchmark.
SchemeReturns ^(%)
CRISIL Composite Bond Fund # (%)
CRISIL 10 Year Gilt## (%) Current Value of Standard Investment of ` 10000 in the
Scheme (`) Benchmark #(`)Additional
Benchmark # # (`)
Since Inception(Mar 21, 2014) 10.35 11.36 11.05 13,928 14,361 14,226
Last 1 Year 9.20 9.94 9.83
Last 3 Years 10.10 11.00 11.15 NA
Scheme Inception date is 25/11/1999. Mr. Abhishek Bisen has been managing the fund since 01/04/2008.
Different plans have different expense structure. The performance details provided herein are of regular plan
^Past performance may or may not be sustained in future.*All payouts during the period have been reinvested in the units of the scheme at the then prevailing NAV. Returns >= 1 year: CAGR (Compounded Annualised Growth Rate). N.A stands for data not available. Note: Point to Point (PTP) Returns in INR shows the value of 10,000/- investment made at inception. Source: ICRA MFI Explorer. # Name of Scheme Benchmark. ## Name of Additional Benchmark.
SchemeReturns ^ (%)
CRISIL Composite Bond Fund #(%)
CRISIL 10 Year Gilt##(%) Current Value of Standard Investment of ` 10000 in the
Scheme (`) Benchmark #(`)Additional
Benchmark # # (`)
Since Inception(Nov 25, 1999) 9.28 NA NA 48,035 NA NA
Last 1 Year 7.79 9.94 9.83
Last 3 Years 9.96 11.00 11.15
Last 5 Years 8.63 9.61 8.60
Kotak Bond - Regular Plan - Growth
Kotak Gilt - Investment - Regular - Growth
SchemeReturns (%) ^ (%)
I-SEC Composite Gilt Index # (%)
CRISIL 10 Year Gilt## (%) Current Value of Standard Investment of ` 10000 in the
Scheme (`) Benchmark #(`)Additional
Benchmark # # (`)
Since Inception(Dec 29, 1998) 10.02 NA NA 59,070 NA NA
Last 1 Year 9.78 9.22 9.83
Last 3 Years 11.41 11.05 11.15 NA
Last 5 Years 9.23 9.84 8.60
Scheme Inception date is 29/12/1998. Mr. Abhishek Bisen has been managing the fund since 15/04/2008.
Different plans have different expense structure. The performance details provided herein are of regular plan
^Past performance may or may not be sustained in future.*All payouts during the period have been reinvested in the units of the scheme at the then prevailing NAV. Returns >= 1 year: CAGR (Compounded Annualised Growth Rate). N.A stands for data not available. Note: Point to Point (PTP) Returns in INR shows the value of 10,000/- investment made at inception. Source: ICRA MFI Explorer. # Name of Scheme Benchmark. ## Name of Additional Benchmark.
50

51
Kotak Monthly Income Plan - Growth
Scheme Inception date is 02/12/2003. Mr. Abhishek Bisen has been managing the fund since 01/04/2008. Mr. Devender Singhal has been managing the fund since 25/08/2015.
Different plans have different expense structure. The performance details provided herein are of regular plan
^Past performance may or may not be sustained in future.*All payouts during the period have been reinvested in the units of the scheme at the then prevailing NAV. Returns >= 1 year: CAGR (Compounded Annualised Growth Rate). N.A stands for data not available. Note: Point to Point (PTP) Returns in INR shows the value of 10,000/- investment made at inception. Source: ICRA MFI Explorer. # Name of Scheme Benchmark. ## Name of Additional Benchmark.
SchemeReturns^ (%)
CRISIL MIP Blended # (%)
CRISIL 10 Year Gilt## (%) Current Value of Standard Investment of ` 10000 in the
Scheme (`) Benchmark #(`)Additional
Benchmark # # (`)
Since Inception(Dec 02, 2003) 8.16 8.33 5.85 29,211 29,876 21,759
Last 1 Year 11.25 11.00 9.83
Last 3 Years 11.62 10.87 11.15 NA
Last 5 Years 11.47 10.40 8.60
Kotak Multi Asset Allocation Fund - Growth
SchemeReturns^ (%)
65% Crisil Short term Bond Fund ,
25%Nifty50 & 10% Prices of Gold
#(%)
CRISIL 10 Year Gilt## (%)
Current Value of Standard Investment of ` 10000 in the
Scheme (`) Benchmark #(`)Additional
Benchmark # # (`)
Since Inception(Feb 08, 2010) 8.37 9.06 7.93 16,903 17,613 16,461
Last 1 Year 8.47 8.47 9.83
Last 3 Years 8.33 8.64 11.15 NA
Last 5 Years 8.28 9.55 8.60
Scheme Inception date is 21/01/2011. Mr. Abhishek Bisen has been managing the fund since 31/12/2010. Mr. Deepak Gupta has been managing the fund since 10/09/2013.
Different plans have different expense structure. The performance details provided herein are of regular plan
^Past performance may or may not be sustained in future.*All payouts during the period have been reinvested in the units of the scheme at the then prevailing NAV. Returns >= 1 year: CAGR (Compounded Annualised Growth Rate). N.A stands for data not available. Note: Point to Point (PTP) Returns in INR shows the value of 10,000/- investment made at inception. Source: ICRA MFI Explorer. # Name of Scheme Benchmark. ## Name of Additional Benchmark.
Kotak Asset Allocator Fund - Growth
Scheme Inception date is 09/08/2004. Mr. Deepak Gupta has been managing the fund since 01/09/2008.
Different plans have different expense structure. The performance details provided herein are of regular plan
^Past performance may or may not be sustained in future.*All payouts during the period have been reinvested in the units of the scheme at the then prevailing NAV. Returns >= 1 year: CAGR (Compounded Annualised Growth Rate). N.A stands for data not available. Note: Point to Point (PTP) Returns in INR shows the value of 10,000/- investment made at inception. Source: ICRA MFI Explorer. # Name of Scheme Benchmark. ## Name of Additional Benchmark.
SchemeReturns^ (%)
CRISIL Balanced Fund # (%)
S&P BSE SENSEX## (%) Current Value of Standard Investment of ` 10000 in the
Scheme (`) Benchmark #(`)Additional
Benchmark # # (`)
Since Inception(Aug 09, 2004) 16.72 12.49 15.11 74,413 46,082 62,132
Last 1 Year 13.13 14.36 15.82
Last 3 Years 12.22 10.11 7.88 NA
Last 5 Years 17.26 12.71 13.53
Kotak Gilt - Investment - PF and Trust - Growth
Scheme Inception date is 11/11/2003. Mr. Abhishek Bisen has been managing the fund since 15/04/2008.
Different plans have different expense structure. The performance details provided herein are of regular plan
^Past performance may or may not be sustained in future.*All payouts during the period have been reinvested in the units of the scheme at the then prevailing NAV. Returns >= 1 year: CAGR (Compounded Annualised Growth Rate). N.A stands for data not available. Note: Point to Point (PTP) Returns in INR shows the value of 10,000/- investment made at inception. Source: ICRA MFI Explorer. # Name of Scheme Benchmark. ## Name of Additional Benchmark.
SchemeReturns ^ (%)
I-SEC Composite Gilt Index # (%)
CRISIL 10 Year Gilt## (%) Current Value of Standard Investment of ` 10000 in the
Scheme (`) Benchmark #(`)Additional
Benchmark # # (`)
Since Inception(Nov 11, 2003) 7.77 7.60 5.77 27,939 27,345 21,607
Last 1 Year 9.77 9.22 9.83
Last 3 Years 11.46 11.05 11.15
Last 5 Years 9.28 9.84 8.60
5151

52
Kotak World Gold Fund - Growth
Scheme Inception date is 06/06/2008. Mr. Deepak Gupta has been managing the fund since 01/02/2015.
Different plans have different expense structure. The performance details provided herein are of regular plan
^Past performance may or may not be sustained in future.*All payouts during the period have been reinvested in the units of the scheme at the then prevailing NAV. Returns >= 1 year: CAGR (Compounded Annualised Growth Rate). N.A stands for data not available. Note: Point to Point (PTP) Returns in INR shows the value of 10,000/- investment made at inception. Source: ICRA MFI Explorer. # Name of Scheme Benchmark. ## Name of Additional Benchmark.
SchemeReturns^ (%)
Financial Times Gold Mines Total -
Price # (%)
Nifty 50## (%) Current Value of Standard Investment of ` 10000 in the
Scheme (`) Benchmark #(`)Additional
Benchmark # # (`)
Since Inception(Jun 06, 2008) -1.07 -1.96 8.87 9,066 8,339 21,775
Last 1 Year -28.85 -27.48 16.56
Last 3 Years -6.03 1.32 9.27 NA
Last 5 Years -7.47 -7.27 14.01
Kotak Global Emerging Market Fund - Growth
Scheme Inception date is 26/09/2007. Mr. Abhishek Bisen has been managing the fund since 04/04/2011.
Different plans have different expense structure. The performance details provided herein are of regular plan
^Past performance may or may not be sustained in future.*All payouts during the period have been reinvested in the units of the scheme at the then prevailing NAV. Returns >= 1 year: CAGR (Compounded Annualised Growth Rate). N.A stands for data not available. Note: Point to Point (PTP) Returns in INR shows the value of 10,000/- investment made at inception. Source: ICRA MFI Explorer. # Name of Scheme Benchmark. ## Name of Additional Benchmark.
SchemeReturns ^ (%)
MSCI Emerging Market index # (%)
Nifty 50 ## (%) Current Value of Standard Investment of ` 10000 in the
Scheme (`) Benchmark #(`)Additional
Benchmark # # (`)
SchemeReturns ^ (%) Current Value of Standard Investment of ` 10000 in the
Scheme (`) Benchmark #(`)Additional
Benchmark # # (`)
Since Inception(Sep 26, 2007) 3.83 3.91 7.50 14,483 14,593 20,397
Last 1 Year 8.08 17.17 16.56
Last 3 Years -0.13 1.80 9.27
Last 5 Years 6.21 5.22 14.01
Kotak Gold ETF
SchemeReturns^ (%)
Price of Gold# (%)
CRISIL 10 Year Gilt## (%) Current Value of Standard Investment of ` 10000 in the
Scheme (`) Benchmark #(`)Additional
Benchmark # # (`)
Since Inception(Jul 27, 2007) 11.21 12.54 7.28 28,998 32,656 20,222
Last 1 Year -11.31 -10.31 9.83
Last 3 Years -0.13 0.98 11.15 NA
Last 5 Years -2.26 -1.17 8.60
Scheme Inception date is 27/07/2007. Mr. Abhishek Bisen has been managing the fund since 15/04/2008.
Different plans have different expense structure. The performance details provided herein are of regular plan
^Past performance may or may not be sustained in future.*All payouts during the period have been reinvested in the units of the scheme at the then prevailing NAV. Returns >= 1 year: CAGR (Compounded Annualised Growth Rate). N.A stands for data not available. Note: Point to Point (PTP) Returns in INR shows the value of 10,000/- investment made at inception. Source: ICRA MFI Explorer. # Name of Scheme Benchmark. ## Name of Additional Benchmark.
Kotak US Equity Fund - Growth S&P 500 International
Total Return Net Index # (%)
SchemeReturns^ (%)
Nifty 50## (%) Current Value of Standard Investment of ` 10000 in the
Scheme (`) Benchmark #(`)Additional
Benchmark # # (`)
Since Inception 8.93 12.23 14.01 13,621 15,174 16,061
Last 1 Year 10.05 11.42 16.56 NA
Last 3 Years 9.62 12.84 9.27
Scheme Inception date is 20/12/2013. Mr. Deepak Gupta has been managing the fund since 01/02/2015.
Different plans have different expense structure. The performance details provided herein are of regular plan
^Past performance may or may not be sustained in future.*All payouts during the period have been reinvested in the units of the scheme at the then prevailing NAV. Returns >= 1 year: CAGR (Compounded Annualised Growth Rate). N.A stands for data not available. Note: Point to Point (PTP) Returns in INR shows the value of 10,000/- investment made at inception. Source: ICRA MFI Explorer. # Name of Scheme Benchmark. ## Name of Additional Benchmark.
52

53
Scheme Inception date is 10/12/2014. Mr. Deepak Gupta has been managing the fund since 24/11/2014.
Different plans have different expense structure. The performance details provided herein are of regular plan
^Past performance may or may not be sustained in future.*All payouts during the period have been reinvested in the units of the scheme at the then prevailing NAV. Returns >= 1 year: CAGR (Compounded Annualised Growth Rate). N.A stands for data not available. Note: Point to Point (PTP) Returns in INR shows the value of 10,000/- investment made at inception. Source: ICRA MFI Explorer. # Name of Scheme Benchmark. ## Name of Additional Benchmark.
Nifty Bank#(%)
Kotak Sensex ETF
Scheme Inception date is 06/06/2008. Mr. Deepak Gupta has been managing the fund since 25/02/2011.Different plans have different expense structure. The performance details provided herein are of regular plan ^Past performance may or may not be sustained in future.*All payouts during the period have been reinvested in the units of the scheme at the then prevailing NAV. Returns >= 1 year: CAGR (Compounded Annualised Growth Rate). N.A stands for data not available. Note: Point to Point (PTP) Returns in INR shows the value of 10,000/- investment made at inception. Source: ICRA MFI Explorer. # Name of Scheme Benchmark. ## Name of Additional Benchmark.
SchemeReturns ^ (%)
S&P BSE SENSEX# (%)
Nifty 50## (%) Current Value of Standard Investment of ` 10000 in the
Scheme (`) Benchmark #(`)Additional
Benchmark # # (`)
Since Inception(Jun 06, 2008) 9.51 8.37 8.87 22,968 20,880 21,775
Last 1 Year 16.98 15.82 16.56
Last 3 Years 9.03 7.88 9.27 NA
Last 5 Years 14.78 13.53 14.01
Kotak PSU Bank ETF
Scheme Inception date is 08/11/2007. Mr. Deepak Gupta has been managing the fund since 25/02/2011.Different plans have different expense structure. The performance details provided herein are of regular plan ^Past performance may or may not be sustained in future.*All payouts during the period have been reinvested in the units of the scheme at the then prevailing NAV. Returns >= 1 year: CAGR (Compounded Annualised Growth Rate). N.A stands for data not available. Note: Point to Point (PTP) Returns in INR shows the value of 10,000/- investment made at inception. Source: ICRA MFI Explorer. # Name of Scheme Benchmark. ## Name of Additional Benchmark.
SchemeReturns ^ (%)
Nifty 50 ## (%)Nifty PSU Bank#(%) Current Value of Standard Investment of ` 10000 in the
Scheme (`) Benchmark #(`)Additional
Benchmark # # (`)
Since Inception(Nov 08, 2007) 4.52 2.65 6.03 15,382 12,900 17,683
Last 1 Year 30.04 29.84 16.56
Last 3 Years 2.50 1.94 9.27 NA
Last 5 Years 7.10 4.70 14.01
Kotak Nifty ETF
Scheme Inception date is 08/02/2010. Mr. Deepak Gupta has been managing the fund since 25/02/2011.
Different plans have different expense structure. The performance details provided herein are of regular plan
^Past performance may or may not be sustained in future.*All payouts during the period have been reinvested in the units of the scheme at the then prevailing NAV. Returns >= 1 year: CAGR (Compounded Annualised Growth Rate). N.A stands for data not available. Note: Point to Point (PTP) Returns in INR shows the value of 10,000/- investment made at inception. Source: ICRA MFI Explorer. # Name of Scheme Benchmark. ## Name of Additional Benchmark.
SchemeReturns^ (%) Nifty 50 # (%)
S&P BSE SENSEX## (%) Current Value of Standard Investment of ` 10000 in the
Scheme (`) Benchmark #(`)Additional
Benchmark # # (`)
Since Inception(Feb 08, 2010) 11.73 10.55 10.00 22,930 21,169 20,404
Last 1 Year 17.86 16.56 15.82
Last 3 Years 10.53 9.27 7.88 NA
Last 5 Years 15.28 14.01 13.53
SchemeReturns ^ (%)
Nifty 50 ## (%) Current Value of Standard Investment of ` 10000 in the
Scheme (`) Benchmark #(`)Additional
Benchmark # # (`)
Since Inception(Dec 10, 2014)) 13.21 12.34 7.35 13,878 13,597 12,060
Last 1 Year 32.84 32.25 16.56 NA
Kotak Banking ETF
53

Scheme Names
Kotak Emerging Equity - Growth
Kotak Midcap - Growth
Kotak Balance - Dividend
1 YEAR 3 YEAR 5 YEAR Since Inception
SchemeReturns(%)^
BenchmarkReturns (%)^*
SchemeReturns(%)^
BenchmarkReturns (%)^*
SchemeReturns(%)^
BenchmarkReturns (%)^*
SchemeReturns(%)^
BenchmarkReturns (%)^*
Scheme Names
Kotak PSU Bank ETF
Kotak Banking ETF
Kotak Classic Equity Fund - Growth
1 YEAR 3 YEAR 5 YEAR Since Inception
SchemeReturns(%)^
BenchmarkReturns (%)^*
SchemeReturns(%)^
BenchmarkReturns (%)^*
SchemeReturns(%)^
BenchmarkReturns (%)^*
SchemeReturns(%)^
BenchmarkReturns (%)^*
Kotak World Gold Fund - Growth
Kotak Global Emerging Market Fund - Growth
Kotak Equity Arbitrage Fund - Growth
Top 3
Bottom 3
ABOUT OUR FUND MANAGERS
54
Name: Mr. Harsha UpadhyayaMr. Harsha Upadhyaya manages 3 funds of Kotak Mahindra Mutual Fund.Kotak Opportunities (Aug 4, �12), Kotak Select Focus Fund (Aug 4, �12), Kotak Tax Saver (Aug. 25,'15)Business ExperienceMr. Harsha has nearly two decades of rich experience spread over Equity Research and Fund Management. His prior stints have been with companies such as DSP BlackRock, UTI Asset Management, Reliance Group and SG Asia Securities. Mr. Harsha is a Bachelor of Engineering (Mechanical) from National Institute of Technology, Suratkal, a Post Graduate in Management (Finance) from Indian Institute of Management, Lucknow and Chartered Financial Analyst from the CFA Institute.
Name: Mr. Harish KrishnanMr. Harish Krishnan manages 3 funds of Kotak Mahindra Mutual Fund.Kotak 50 (Nov. 15, �13), Kotak Infrastructure & Economic Reform Fund (Jan31,'15), Kotak India Growth Fund Series I (May 06, �15).Business ExperienceMr. Harish has a decade of experience spread over Equity Research and Fund Management. Prior to joining Kotak Mutual Fund, he was based out of Singapore and Dubai, managing Kotak's offshore funds. Mr. Harish has also worked at Infosys Technologies Ltd in his earlier stint. He is a Bachelor of Technology (Electronics & Communications) from Government Engineering College, Trichur, a post Graduate in Management from Indian Institute of Management, Kozhikode and a Chartered Financial Analyst from the CFA Institute.
Name: Mr. Pankaj TibrewalMr. Pankaj Tibrewal manages 3 funds of Kotak Mahindra Mutual Fund.Kotak Midcap (Jan. 21,�10) , Kotak Emerging Equity (May 27,'10), Kotak Balance (Aug. 25,'15)Business ExperienceMr. Pankaj is a graduate in Commerce from St. Xavier's College, Kolkata and holds a Master's degree in Finance from Manchester University. He has been associated with the mutual fund industry since 2003 where he has managed several debt and equity schemes. He has been a part of the organization since January 2010. Mr. Pankaj's earlier stint was with Principal Mutual Fund.
Scheme Names
Kotak Opportunities - Growth
Kotak Select Focus Fund - Growth
Kotak Tax Saver Scheme - Growth
1 YEAR 3 YEAR 5 YEAR Since Inception
SchemeReturns(%)^
BenchmarkReturns (%)^*
SchemeReturns(%)^
BenchmarkReturns (%)^*
SchemeReturns(%)^
BenchmarkReturns (%)^*
SchemeReturns(%)^
BenchmarkReturns (%)^*
Kotak Opportunities - Growth, *Name of the Benchmark - Nifty 500, Scheme Inception date is 09/09/2004. Mr. Harsha Upadhyaya has been managing the fund since 04/08/2012.Kotak Select Focus Fund - Growth, *Name of the Benchmark - Nifty 200, Scheme Inception date is 11/09/2009. Mr. Harsha Upadhyaya has been managing the fund since 04/08/2012.Kotak Tax Saver Scheme - Growth, *Name of the Benchmark - Nifty 500, Scheme Inception date is 23/11/2005. Mr. Harsha Upadhyaya has been managing the fund since 25/08/2015.
Scheme Names
Kotak Infrastructure and Economic Reform Fund - Growth
Kotak India Growth Fund - Series I - Regular Plan - Growth
Kotak 50 - Dividend
1 YEAR 3 YEAR 5 YEAR Since Inception
SchemeReturns(%)^
BenchmarkReturns (%)^*
SchemeReturns(%)^
BenchmarkReturns (%)^*
SchemeReturns(%)^
BenchmarkReturns (%)^*
SchemeReturns(%)^
BenchmarkReturns (%)^*
Kotak Infrastructure and Economic Reform Fund - Growth, *Name of the Benchmark - S&P BSE 100, Scheme Inception date is 25/02/2008. Mr. Harish Krishnan has been managing the fund since 31/01/2015.Kotak India Growth Fund - Series I - Regular Plan - Growth, *Name of the Benchmark - Nifty 200, Scheme Inception date is 06/05/2015. Mr. Harish Krishnan has been managing the fund since 06/05/2015Kotak 50 - Dividend, *Name of the Benchmark - Nifty 50, Scheme Inception date is 29/12/1998. Mr. Harish Krishnan has been managing the fund since 15/11/2013.
Kotak Emerging Equity - Growth, *Name of the Benchmark - S&P BSE MidSmallCap, Scheme Inception date is 30/03/2007. Mr. Pankaj Tibrewal has been managing the fund since 27/05/2010.Kotak Midcap - Growth, *Name of the Benchmark - Nifty Free Float Midcap 100, Scheme Inception date is 24/02/2005. Mr. Pankaj Tibrewal has been managing the fund since 21/01/2010.Kotak Balance - Dividend, *Name of the Benchmark - CRISIL Balanced Fund � Aggressive Index, Scheme Inception date is 25/11/1999. Mr. Pankaj Tibrewal has been managing the fund since 25/08/2015. Mr. Abhishek Bisen has been managing the fund since 15/04/2008.
Name: Mr. Deepak GuptaMr. Deepak Gupta manages 13 funds of Kotak Mahindra Mutual Fund.Kotak Equity Arbitrage (Sept.1,�08), Kotak Asset Allocator Fund (Sept.1,�08), Kotak Global Emerging Market Fund (Apr.4,�11), (Dedicated fund manager for over seas investment), Kotak Balance (Aug. 25,'15), Kotak Multi Asset Allocation Fund (Sept.10,�13), Kotak Equity Savings Fund (Oct. 13, '14), Kotak World Gold Fund (Jan.31,�15), Kotak US Equity Fund (Jan.31,�15), Kotak PSU Bank ETF (Nov. 8, �07), Kotak SENSEX ETF (Jun. 6, �08), Kotak NIFTY ETF (Feb. 8, �10), Kotak Banking ETF (Dec. 11, �14), Kotak Classic Equity (Jan. 1, '17).
Business ExperienceMr. Deepak has almost 10 years of experience in the mutual fund industry. He had joined the Equity Fund Management team as a research analyst. He is now an Equity Fund Manager. Mr. Deepak is a Graduate in Commerce from Mumbai University. He is a qualified Chartered Accountant, a Cost Accountant and has cleared the AIMR CFA Level 3.
24.02 19.84 19.41 12.38 20.88 16.33 20.65 15.32
23.74 18.80 20.58 11.49 22.94 15.63 15.83 10.36
22.30 19.84 19.23 12.38 18.55 16.33 12.75 12.34
23.46 17.70 18.57 10.17 20.92 14.80 8.10 7.15
16.05 18.80 NA NA NA NA 12.84 12.11
15.28 16.56 14.51 9.27 17.02 14.01 19.85 14.06
22.39 26.43 25.29 19.72 27.27 21.00 13.52 12.35
22.28 25.18 23.01 19.52 24.65 20.88 17.46 15.85
15.84 14.36 13.11 10.11 14.89 12.71 15.20 NA
32.84 32.25 NA NA NA NA 13.21 12.34
30.04 29.84 2.50 1.94 7.10 4.70 4.52 2.65
20.04 17.76 13.24 10.83 17.13 15.29 13.32 13.38
8.08 17.17 -0.13 1.80 6.21 5.22 3.83 3.91
6.14 5.36 6.89 6.65 7.81 7.35 7.62 NA
-28.85 -27.48 -6.03 1.32 -7.47 -7.27 -1.07 -1.96
54

Kotak Balance - Dividend, *Name of the Benchmark - CRISIL Balanced Fund � Aggressive Index, Scheme Inception date is 25/11/1999. Mr. Pankaj Tibrewal has been managing the fund since 25/08/2015. Mr. Abhishek Bisen has been managing the fund since 15/04/2008.Kotak Monthly Income Plan - Growth, *Name of the Benchmark - CRISIL MIP Blended, Scheme Inception date is 02/12/2003. Mr. Abhishek Bisen has been managing the fund since 01/04/2008. Mr. Devender Singhal has been managing the fund since 25/08/2015.Kotak Equity Savings Fund - Growth, *Name of the Benchmark - 75% NIFTY 50 ARBITRAGE + 25% Nifty 50, Scheme Inception date is 13/10/2014. Mr. Deepak Gupta has been managing the fund since 17/09/2014. Mr. Abhishek Bisen has been managing the fund since 17/09/2014.Kotak Bond - Regular Plan - Growth, *Name of the Benchmark - CRISIL Composite Bond Fund, Scheme Inception date is 25/11/1999. Mr. Abhishek Bisen has been managing the fund since 01/04/2008.Kotak Gold Fund - Growth, *Name of the Benchmark - Price of Gold, Scheme Inception date is 25/03/2011. Mr. Abhishek Bisen has been managing the fund since 04/03/2011.Kotak Gold ETF, *Name of the Benchmark - Price of Gold, Scheme Inception date is 27/07/2007. Mr. Abhishek Bisen has been managing the fund since 01/08/2008.
Scheme Names
Kotak Balance - Dividend
Kotak Monthly Income Plan - Growth
Kotak Equity Savings Fund - Growth
1 YEAR 3 YEAR 5 YEAR Since Inception
SchemeReturns(%)^
BenchmarkReturns (%)^*
SchemeReturns(%)^
BenchmarkReturns (%)^*
SchemeReturns(%)^
BenchmarkReturns (%)^*
SchemeReturns(%)^
BenchmarkReturns (%)^*
Kotak Bond - Regular Plan - Growth
Kotak Gold ETF
Kotak Gold Fund - Growth
Top 3
Bottom 3
Kotak Banking ETF, *Name of the Benchmark - Nifty Bank, Scheme Inception date is 10/12/2014. Mr. Deepak Gupta has been managing the fund since 24/11/2014.Kotak PSU Bank ETF, *Name of the Benchmark - Nifty PSU Bank , Scheme Inception date is 08/11/2007. Mr. Deepak Gupta has been managing the fund since 25/02/2011.Kotak Classic Equity Fund - Growth, *Name of the Benchmark - Nifty 100, Scheme Inception date is 27/07/2005. Mr. Deepak Gupta has been managing the fund since 01/01/2017.Kotak Global Emerging Market Fund - Growth, *Name of the Benchmark - MSCI Emerging Market index, Scheme Inception date is 26/09/2007. Mr. Abhishek Bisen has been managing the fund since 04/04/2011.Kotak Equity Arbitrage Fund - Growth, *Name of the Benchmark - Nifty 50 Arbitrage Index, Scheme Inception date is 29/09/2005. Mr. Deepak Gupta has been managing the fund since 01/09/2008.Kotak World Gold Fund - Growth, *Name of the Benchmark - Financial Times Gold Mines Total - Price, Scheme Inception date is 06/06/2008. Mr. Deepak Gupta has been managing the fund since 01/02/2015.
Name: Mr. Abhishek Bisen
Mr. Abhishek Bisen manages 9 funds of Kotak Mahindra Mutual Fund.
Kotak Balance (Apr. 15, 2008), Kotak Monthly Income Plan (Apr. 15, �08), Kotak Bond (Regular Plan) (Apr. 15, �08), Kotak Gilt Investment (Regular & PF-Trust) (Apr. 15, �08), Kotak Global Emerging Market Fund (Apr. 15, �08), Kotak Multi Asset Allocation Fund (Jan. 21, �11), Kotak Equity Savings Fund (Oct. 13, '14), Kotak Gold ETF (Jul. 27, �07), Kotak Gold Fund (Mar. 25, '11)
Business Experience
Mr. Abhishek has been associated with the company since October 2006 and his key responsibilities include fund management of debt schemes. Prior to joining Kotak AMC, Me, Abhishek was working with Securities Trading Corporation Of India Ltd where he was looking at Sales & Trading of Fixed Income Products apart from doing Portfolio Advisory. He has been awarded twice as one of the Highly Commended Investors in Indian Rupees Bonds from the Asset magazine Hong Kong. His educational background is B.A (Management) and MBA (Finance).
Name: Mr. Deepak Agrawal
Mr. Deepak Agrawal manages 10 & All FMPs funds of Kotak Mahindra Mutual Fund.
(Kotak Bond Short Term (Apr. 14, �08), Kotak Flexi Debt (Jul. 11, �07), Kotak Floater Short Term (Nov. 25, �07), Kotak Liquid (Jul. 11, �12), Kotak Kotak Banking and PSU Debt Fund (Apr. 14, �08), Kotak Treasury Advantage Fund (Formerly Known as Kotak Floater Long Term Scheme) (Jul. 11, �07), Kotak Income Opportunities Fund (May 11, '10), Kotak Medium Term Fund (Mar. 21, �14), Kotak Low Duration Fund (Jan. 31, �15), Kotak Corporate Bond Fund (Jan. 31, �15), All Fixed Maturity Plans in existence (Aug. 13,'15),
Business Experience
Mr. Deepak's career has started from Kotak AMC when he joined the organization in December 2002 where he was initially in Research, Dealing and then moved into Fund Management from November 2006. Mr. Deepak is a Post Graduate in Commerce, Chartered Account and Company Secretary.
Scheme Names
Kotak Flexi Debt - Regular Plan - Growth
Kotak Medium Term Fund -Regular Plan - Growth
1 YEAR 3 YEAR 5 YEAR Since Inception
SchemeReturns(%)^
BenchmarkReturns (%)^*
SchemeReturns(%)^
BenchmarkReturns (%)^*
SchemeReturns(%)^
BenchmarkReturns (%)^*
SchemeReturns(%)^
BenchmarkReturns (%)^*
Kotak Treasury Advantage Fund - Growth
Kotak Floater - Short Term - Growth
Kotak Liquid - Regular Plan - Growth
Top 3
Bottom 3
Kotak Banking and PSU Debt Fund - Growth
Kotak Flexi Debt - Regular Plan - Growth, *Name of the Benchmark - CRISIL Composite Bond Fund, Scheme Inception date is 26/05/2008. Mr. Deepak Agrawal has been managing the fund since 25/11/2012.Kotak Medium Term Fund - Regular Plan - Growth, *Name of the Benchmark - CRISIL Composite Bond Fund, Scheme Inception date is 21/03/2014. Mr. Deepak Agrawal has been managing the fund since 22/06/2015.Kotak Banking and PSU Debt Fund - Growth, *Name of the Benchmark - CRISIL Short Term Bond Fund, Scheme Inception date is 29/12/1998. Mr. Deepak Agrawal has been managing the fund since 01/08/2008.Kotak Treasury Advantage Fund - Growth, *Name of the Benchmark - CRISIL Liquid Fund, Scheme Inception date is 13/08/2004. Mr. Deepak Agrawal has been managing the fund since 01/04/2008.Kotak Floater - Short Term - Growth, *Name of the Benchmark - CRISIL Liquid Fund, Scheme Inception date is 14/07/2003. Mr. Deepak Agrawal has been managing the fund since 01/11/2006.Kotak Liquid - Regular Plan - Growth, *Name of the Benchmark - CRISIL Liquid Fund, Scheme Inception date is 04/11/2003. Mr. Deepak Agrawal has been managing the fund since 01/05/2007.
55
Kotak Monthly Income Plan - Growth, *Name of the Benchmark - CRISIL MIP Blended, Scheme Inception date is 02/12/2003. Mr. Abhishek Bisen has been managing the fund since 01/04/2008. Mr. Devender Singhal has been managing the fund since 25/08/2015.
Scheme Names
Kotak Monthly IncomePlan - Growth
1 YEAR 3 YEAR 5 YEAR Since Inception
SchemeReturns(%)^
BenchmarkReturns (%)^*
SchemeReturns(%)^
BenchmarkReturns (%)^*
SchemeReturns(%)^
BenchmarkReturns (%)^*
SchemeReturns(%)^
BenchmarkReturns (%)^*
Name: Mr. Devender Singhal
Mr. Devender Singhal manages 1 fund of Kotak Mahindra Mutual Fund.
Kotak Monthly Income Plan (Aug. 25,�15)
Business Experience
Mr. Devender has been associated with the Kotak Group since July 2007. He is responsible for the research coverage of FMCG, Automobiles and Media sectors at Kotak AMC since Feb 2009. Devender has an overall working experience of 14 years in equity research and fund management. Prior to joining Kotak AMC, Devender worked with the PMS divisions of Kotak, Religare, Karvy and P N Vijay Financial Services.
15.84 14.36 13.11 10.11 14.89 12.71 15.20 NA
11.25 11.00 11.62 10.87 11.47 10.40 8.16 8.33
10.31 8.18 NA NA NA NA 9.10 7.44
7.79 9.94 9.96 11.00 8.63 9.61 9.28 NA
-9.17 -10.31 -1.11 0.98 -2.99 -1.17 2.97 5.03
-11.31 -10.31 -0.13 0.98 -2.26 -1.17 11.21 12.54
9.96 9.94 10.15 11.00 9.73 9.61 8.83 8.27
9.20 9.94 10.10 11.00 NA NA 10.35 11.36
9.00 8.37 8.99 9.14 9.07 9.08 7.45 NA
7.51 6.79 8.33 7.78 8.67 8.23 7.86 7.14
6.87 6.79 7.93 7.78 8.44 8.23 7.38 6.89
6.81 6.79 7.85 7.78 8.38 8.23 7.48 6.96
11.25 11.00 11.62 10.87 11.47 10.40 8.16 8.33
55

Kotak Asset Allocator Fund (Earlier Know asKotak Equity FOF)
Record Date Cum Dividend NAV `/UnitAug-30-10 37.774 Individual/ HUF: 0.878 Others: 0.819
DIVIDEND HISTORY
54
May-29-17 27.748 0.85Feb-28-17 26.279 0.50Nov-22-16 24.246 0.80
Kotak Opportunities
Record Date Cum Dividend NAVCum Dividend NAV `/Unit
Record Date Cum Dividend NAV `/UnitJun-28-16 39.046 1.50Dec-30-16 33.071 1.35Jun-15-16 36.692 1.40
Kotak Classic Equity
Record Date Cum Dividend NAVCum Dividend NAV `/UnitJul-24-17 23.433 0.70Jul-15-16 19.692 0.50Nov-20-15 18.450 0.50
Kotak 50 - Dividend
Equity Schemes
Record Date Cum Dividend NAV `/UnitJul-24-17 10.7772 0.0501
Jun-27-17 10.7860 0.0589
May-22-17 10.7864 0.0593
Kotak Equity Arbitrage Fund - Monthly Dividend Option
Kotak Midcap
Record Date Cum Dividend NAVCum Dividend NAV `/UnitFeb-27-17 36.403 1.45Feb-23-16 26.770 1.00Feb-27-15 30.866 1.00
Kotak Tax Saver
Record Date Cum Dividend NAVCum Dividend NAV `/UnitJun-29-17 22.144 0.40Mar-29-17 19.432 0.75Jan-27-17 18.889 0.72
Kotak Emerging Equity
Record Date Cum Dividend NAVCum Dividend NAV `/UnitMay-26-17 26.010 1.59May-27-16 21.196 1.30Apr-28-15 21.499 2.10
Kotak Select Focus
Record Date Cum Dividend NAVCum Dividend NAV `/UnitSep-30-16 21.349 1.25Oct-12-15 17.739 1.00Sept-26-14 17.791 1.00
Record Date Cum Dividend NAV `/Unit
Kotak Equity Arbitrage Fund - Bimonthly Dividend
Jul-24-17 20.1641 0.2164May-22-17 23.1300 0.1692Mar-27-17 20.1404 0.0233
56
Kotak SENSEX ETFRecord Date Cum Dividend NAVCum Dividend NAV `/Unit
Kotak PSU Bank ETF
Mar-10-17 297.6072 7.50Nov-21-14 290.4602 6.00
Mar-10-17 334.3964 7.00Nov-21-14 428.2343 19.00
Cum Dividend NAVRecord Date `/Unit
ETF Schemes
Kotak Infrastructure and Economic Reform
Jul-12-17 11.137 0.05Jun-12-17 11.076 0.05My-12-17 10.937 0.05
Kotak Equity Saving Fund - Monthly Dividend Option
Record Date Cum Dividend NAVCum Dividend NAV `/Unit
Jul-12-17 13.3106 Individual/ HUF: 0.0704 Others: 0.0653Jun-12-17 13.2900 Individual/ HUF: 0.0717 Others: 0.0665May-12-17 13.0991 Individual/ HUF: 0.0693 Others: 0.0642
Record Date Cum Dividend NAV `/UnitKotak Equity Saving Fund - Quarterly Dividend
Kotak Monthly Income Plan - Monthly Dividend
Kotak Monthly Income Plan - Quarterly Dividend
Record Date
Record Date
Cum Dividend NAV
Cum Dividend NAV
`/Unit
`/UnitJun-20-17 14.6880 Individual/ HUF: 0.2116 Others: 0.1960Mar-20-17 14.1501 Individual/ HUF: 0.1243 Others: 0.1151Dec-20-16 14.0413 Individual/ HUF: 0.1627 Others: 0.1508
Hybrid Schemes
Record Date Cum Dividend NAV `/UnitJul-25-17 17.127 0.12Jun-27-17 16.797 0.11May-25-17 16.806 0.11
Kotak Balance
Jun-20-17 11.118 0.150 Mar-20-17 10.896 0.150 Dec-20-16 10.580 0.150
Record Date Cum Dividend NAV `/UnitFeb-23-17 17.564 0.50
Jun-23-15 15.260 0.50
Kotak Nifty ETFRecord Date Cum Dividend NAVCum Dividend NAV `/Unit
Mar-10-17 904.9522 10.00May-06-16 785.7880 11.00Nov-21-14 858.2720 9.50
Jul-31-17 23.2986 0.0591
Jul-17-17 23.2957 0.0562
Jul-03-17 23.301 0.0615
Record Date Cum Dividend NAV `/Unit
Kotak Equity Arbitrage Fund - Fortnightly Dividend Option
56

Kotak Bond Regular Plan-Annual DividendRecord Date Cum Dividend NAV `/Unit
Mar-20-14 21.2977 Individual/ HUF: 0.2158 Others: 0.2067Mar-20-13 22.5941 Individual/ HUF: 1.4008 Others: 1.2006
57
Kotak Bond Short Term - Monthly DividendRecord Date Cum Dividend NAV `/Unit
Jul-12-17 10.1359 Individual/ HUF: 0.0338 Others: 0.0313Jun-12-17 10.1955 Individual/ HUF: 0.0768 Others: 0.0711May-12-17 10.1301 Individual/ HUF: 0.0296 Others: 0.0274
Kotak Bond Short Term-Half Yearly DividendRecord Date Cum Dividend NAV `/Unit
Sep-21-15 11.519 Individual/ HUF: 0.4471 Others: 0.4142Dec-30-14 11.1187 Individual/ HUF: 0.1759 Others: 0.1631Sep-22-14 10.8686 Individual/ HUF: 0.0519 Others: 0.0497
Kotak Income Opportunities Fund-Annual DividendRecord Date Cum Dividend NAV `/Unit
Mar-15-17 11.2098 Individual/ HUF: 0.7411 Others: 0.6866Mar-14-16 11.0308 Individual/ HUF: 0.6162 Others: 0.5709Mar-20-15 11.2454 Individual/ HUF: 0.7911 Others: 0.7337
Kotak Income Opportunities Fund-Monthly DividendRecord Date Cum Dividend NAV `/Unit
Jul-12-17 10.3444 Individual/ HUF: 0.0275 Others: 0.0254Jun-12-17 10.3921 Individual/ HUF: 0.0619 Others: 0.0574May-12-17 10.3367 Individual/ HUF: 0.0360 Others: 0.0333
Kotak Income Opportunities Fund-Quarterly DividendRecord Date Cum Dividend NAV `/Unit
Jun-20-17 10.9396 Individual/ HUF: 0.1905 Others: 0.1765Mar-20-17 10.7754 Individual/ HUF: 0.0770 Others: 0.0713Dec-20-16 10.9004 Individual/ HUF: 0.1880 Others: 0.1741
Kotak Floater Short Term-Monthly DividendRecord Date Cum Dividend NAV `/Unit
Jul-12-17 1006.7657 Individual/ HUF: 3.9187 Others: 3.6306Jun-12-17 1006.9019 Individual/ HUF: 4.0171 Others: 3.7218Apr-15-17 1006.5869 Individual/ HUF: 3.7896 Others: 3.5110
Kotak Treasury Advantage Fund-Monthly DividendRecord Date Cum Dividend NAV `/Unit
Jul-12-17 10.2397 Individual/ HUF: 0.0445 Others: 0.0412Jun-12-17 10.2467 Individual/ HUF: 0.0496 Others: 0.0459May-12-17 10.2298 Individual/ HUF: 0.0374 Others: 0.0346
Debt Schemes
Kotak Flexi Debt Regular Plan-Quarterly Dividend Record Date Cum Dividend NAV `/Unit
Jun-20-17 11.2091 Individual/ HUF: 0.2831 Others: 0.2623Dec-20-16 11.2067 Individual/ HUF: 0.2896 Others: 0.2683Sep-20-16 12.1487 Individual/ HUF: 0.9284 Others: 0.8602
Kotak Corporate Bond Fund-Regular Plan Monthly Dividend
Record Date Cum Dividend NAV `/UnitJul-12-17 1052.3691 Individual/ HUF: 4.2199 Others: 3.9097Jun-12-17 1056.6880 Individual/ HUF: 7.3393 Others: 6.7997May-12-17 1051.8646 Individual/ HUF: 3.8555 Others: 3.5721
Kotak Corporate Bond Fund-Regular Quarterly DividendRecord Date Cum Dividend NAV `/Unit
Jun-20-17 1070.4266 Individual/ HUF: 15.9660 Others: 14.7922Mar-20-17 1062.9423 Individual/ HUF: 11.1398 Others: 10.3208Dec-20-16 1070.3117 Individual/ HUF: 17.6919 Others: 16.3912
Kotak Gilt Investment Regular Plan-Quarterly DividendRecord Date Cum Dividend NAV `/Unit
Jun-20-17 13.5005 Individual/ HUF: 0.2132 Others: 0.1976Mar-20-17 12.7811 Individual/ HUF: 0.0754 Others: 0.0699Dec-20-16 13.7660 Individual/ HUF: 0.4694 Others: 0.4349
Kotak Gilt Investment PF and Trust Plan- Quarterly Dividend
Record Date Cum Dividend NAV `/UnitJun-20-17 12.0690 Individual/ HUF: 0.1906 Others: 0.1766Mar-20-17 11.4258 Individual/ HUF: 0.0673 Others: 0.0624Dec-20-16 12.3073 Individual/ HUF: 0.4205 Others: 0.3895
Kotak Banking and PSU Debt Fund-Monthly DividendRecord Date Cum Dividend NAV `/Unit
Jul-12-17 10.6501 Individual/ HUF: 0.0424 Others: 0.0393Jun-12-17 10.7300 Individual/ HUF: 0.1001 Others: 0.0928May-12-17 10.6514 Individual/ HUF: 0.0434 Others: 0.0402
Kotak-Bond Regular Plan- Quarterly Dividend OptionRecord Date Cum Dividend NAV `/Unit
Jun-20-17 11.1699 Individual/ HUF: 0.1876 Others: 0.1738Mar-20-17 10.7213 Individual/ HUF: 0.0721 Others: 0.0668Dec-20-16 11.3996 Individual/ HUF: 0.3079 Others: 0.2853
DEBT Schemes
Kotak Banking and PSU Debt Fund-Annual DividendRecord Date Cum Dividend NAV `/Unit
Mar-15-17 16.8762 Individual/ HUF: 1.0169 Others: 0.9421Mar-14-16 16.6687 Individual/ HUF: 0.8840 Others: 0.8190Mar-20-15 16.7914 Individual/ HUF: 0.9986 Others: 0.9261
57

5658
Debt Schemes
Kotak Multi Asset Allocation Fund-Annual DividendRecord Date Cum Dividend NAV `/Unit
Mar-15-17 12.4159 Individual/ HUF: 0.8339 Others: 0.7726Mar-13-16 11.4291 Individual/ HUF: 0.1276 Others: 0.1182Mar-20-15 12.0308 Individual/ HUF: 0.6000 Others: 0.5564
Debt Schemes
Kotak Multi Asset Allocation Fund-Monthly DividendRecord Date Cum Dividend NAV `/Unit
Oct-13-16 13.3724 Individual/ HUF: 0.0505 Others: 0.0468Jun-12-15 11.8504 Individual/ HUF: 0.0288 Others: 0.0267Apr-13-15 12.2623 Individual/ HUF: 0.0612 Others: 0.0567
Kotak Medium Term Fund-Quarterly DividendRecord Date Cum Dividend NAV `/Unit
Jun-20-17 10.8122 Individual/ HUF: 0.0505 Others: 0.0468Mar-20-17 10.5845 Individual/ HUF: 0.0505 Others: 0.0468Dec-20-16 10.6838 Individual/ HUF: 0.1487 Others: 0.1378
Kotak Medium Term Fund-Annual DividendRecord Date Cum Dividend NAV `/Unit
Mar-15-17 11.2826 Individual/ HUF: 0.6428 Others: 0.5956Mar-14-16 11.0913 Individual/ HUF: 0.6217 Others: 0.5760
Kotak Multi Asset Allocation Fund-Quarterly DividendRecord Date Cum Dividend NAV `/Unit
Jun-20-17 12.5111 Individual/ HUF: 0.1632 Others: 0.1512Mar-20-17 12.2925 Individual/ HUF: 0.1180 Others: 0.1094Dec-20-16 12.1481 Individual/ HUF: 0.1220 Others: 0.1130
Kotak Low Duration Fund-Regular Plan Monthly DividendRecord Date Cum Dividend NAV `/Unit
Jul-12-17 1024.0583 Individual/ HUF: 4.5274 Others: 4.1945Jun-12-17 1024.9588 Individual/ HUF: 5.1778 Others: 4.7971May-12-17 1023.402 Individual/ HUF: 4.0534 Others: 3.7554
58

How to read Fact Sheet
For details contact us at:KOTAK MAHINDRA ASSET MANAGEMENT COMPANY LIMITED: 6th Floor, Kotak Infiniti, Building No. 21, Infinity Park, Off Western Express Highway, Gen. A. K. Vaidya Marg, Malad (East), Mumbai � 400 097. Tel.: 91-22-66056825 Fax: 91-22-6638 4455 E-mail: [email protected] www.kotakamc.com. Corporate Office of Asset Website: Management Company: 2nd Floor, 12-BKC, Plot No C-12, G Block, BKC, Bandra (East),Mumbai - 400 051
Agra: 0562-4009647Ahmedabad: 079-26779888/ 26766077Ajmer: 0145-2628881Aligarh: 0571-6453223Allahabad: 0532-6456177Ambala: 0171-6451570/71Amritsar: 0183-6575777/ 6576777Anand: 02692-650281Aurangabad: 0240-6611189Bangalore: 080-66128050/ 51Bareilly: 0581-6452934Bhavnagar: 0278-2569511Bhilai: 0788-2225385Bhopal: 0755-6461018Bhubaneshwar: 0674-6510250/9583340099Bhuj: 02832-653976Calicut: 495-6576552Chandigarh: 0172-4671885/ 5049476Chennai: 044-28221333/ 45038171Cochin: 0484-6533110/ 4064646Coimbatore: 422-6572165Cuttack: 0671-6510166/ 9776000093Dehradun: 135-2742900/ 6453000Dhanbad: 0326-6450798/09709157970Durgapur: 0343-6456038/ 2544609Goa: 0832-6650490
Gorakpur: 0551-2204127Gurgaon: 0124-6464077Guwahati: 0361-2734784Hubli: 0836-6450140Hyderabad: 040-66178140/ 41/ 42Indore: 0731-6453390Jaipur:141-6503339/ 2373879Jalandhar: 0181-2233481Jalgaon: 0257-2237131/ 32Jammu: 0191-2470779Jamnagar: 0288-6540129Jamshedpur: 0657-2317041/6543474/9570000685Jodhpur: 0291-2630625Kanpur: 0512-6454641/ 2541017Kolhapur: 0231-6610390/ 91Kolkata: 033-22822411/ 12/ 13/ 14Kottayam: 0481-6452922Lucknow: 522-4021168/ 4021169Ludhiana: 0161-4646602/ 4646604Mangalore: 0824-6452006Meerut: 0121-4007753Mumbai: 022-66056825Mumbai: (Thane): 022-65970185/ 186Muradabad: 0591-6456667Mysore: 0821-6541192Nagpur: 0712-2425052/8577
Nashik: 253-6574255New Delhi: 011-66306900/ 02Panipat: 0180-2632062Patiala: 0175-6451766Patna: 0612-6451120Pondicherry: 9962029229Pune: 020-20251526/27/29Raipur: 0771-4270917Rajkot: 0281-6620735Ranchi: 0651-6454629/ 2332274/9709001533Rourkela: 0661-6450114/ 9776640098Salem: 0427-6450115Shimla: 0177-6451211/ 2807911Silliguri: 0353-2522012Surat: 0261-6450004/ 6536677Trichur: 0487-2430115Trichy: 0431-6460668Trivandrum: 0471-4470134Udaipur: 0294-6451094Vadodara: 0265-6533957/ 6560167Vapi: 260-6534863/ 260-6453920Varanasi: 0542-6456985Vijayawada: 0866-6459930Vishakapatnam: 0891-6452145
Contact Details
Mutual Fund investments are subject to market risks, read all scheme related documents carefully.*The rating indicates highest degree of safety regarding timely receipt of payments from the investments that the Scheme has made. The ratings should, however, not be construed as an indication of expected returns, prospective performance of the Mutual Fund Scheme, NAV or of volatility in its returns.Disclaimer on market outlooks:The outlook provided is only a subjective understanding of an uncertain market phenomena, which may or may not occur, and may also not have any effect on the performance of the scheme, clement or otherwise. This outlook should not be construed as a reason for investment into the scheme based on prospect of future performance, which may not accrue as anticipated by the statement.
RISK FACTORS
Fund ManagerAn employee of the asset management company such as mutual fund or life insurer, who manages investments of the scheme. He is usually part of larger team of fund managers and research analysts.Application amount for fresh subscriptionThis is the minimum investment amount for a new investor in a mutual fund schemeMinimum Additional AmountThis is the minimum investment amount for an existing investor in a mutual fund schemeYield to MaturityThe yield to maturity or the YTM is the rate of return anticipated on a bond if held until maturity. YTM is expressed as an annual rate. The YTM factors in the bond�s current market price, par value, couple interest rate and time to maturitySIPSIP or systematic investment plan works on the principle of making periodic investments of a fixed sum. It works similar to a recurring bank deposit. For instance, an investor may opt for an SIP that invests Rs 500 every 15th of the month in an equity fund for a period of three years.NAVThe NAV or net asset value is the total asset value per unit of the mutual fund after deducting all related and permissible expenses. The NAV is calculated at the end of every business day. It is the value at which investors enter or exit the mutual fundBenchmarkA group of securities , usually a market index, whose performance is used as a standard or benchmark to measure investment performance of mutual funds, among other investments. Some typical benchmark include the Nifty, Sensex, BSE 200, BSE 500, 10-year GsecEntry LoadA mutual fund may have a sales charge or load at the time of entry and/or exit to compensate the distributor /agent. Entry load is charged at the time an investor purchases the units of a mutual fund. The entry load is added to the prevailing NAV at the time of investment. For instance, if the NAV is Rs 100 and the entry load is 1%, the investor will enter the fund at Rs 101.Note: SEBI, vide circular dated June 30, 2009 has abolished entry load and mandated that the upfront commission to distributors will be paid by the investor directly to the distributor, based on his assessment of various factors including the service rendered by the distributor.Exit loadExit load is charged at the time an investor redeems the units of a mutual fund. The exit load is deducted from the prevailing NAV at the time of redemption. For instance, if the NAV is RS 100and an exit load is 1%, the redemption price would be Rs. 99 per unit Modified DurationModified duration is the price sensitivity and the percentage change in price for a unit change in yield.Standard deviationStandard deviation is statistical measure of the range of an investment�s performance. When a mutual fund has a high standard deviation, it means its range of performance is wide, implying greater volatility.Sharp RatioThe Sharpe Ratio, named after its founder the Noble laureate William Sharpe, is measure of risk-adjusted returns. It is calculated using standard deviation and excess return to determine reward per unit of risk.BetaBeta is a measure of an investment�s volatility vis-à-vis the market. Beta of less than 1 means that the security will be less volatile than the market. A beta of greater than 1 implies that the security�s price will be more volatile than the market.AUMAUM or assets under management refers to the recent / updated cumulative market value of investments managed by Mutual fund or any investment firm.HoldingsThe holdings or the portfolio is a mutual fund�s latest or updated reported statement of investments/securities. These are usually displayed in terms of percentage to net assets or the rupee value or both. The objective is to give investors an idea of where their money is being invested by the fund manager.Nature of SchemeThe investment objective and underlying investments determine the nature of the mutual fund scheme. For instance, a mutual fund that aims at generating capital appreciation by investing in stock markets is an equity fund or growth fund. Likewise, a mutual fund that aims at capital preservation by investing in debt markets is a debt fund or income fund. Each of these categories may have sub-categories.Rating ProfileMutual funds invest in securities after evaluating their credit worthiness as disclosed by the ratings. A depiction of the mutual fund in various investments based on their rating becomes the rating profile of the fund. Typically, this is a feature of debt funds.


