75


2009 Insights


Table of Contents
Improve Purchase Funnel Effectiveness Contextual and behavioral targeting in tandem prove more effective in impacting the purchase funnel from awareness to purchase intent
Increase Message Impact & Efficiency Behavioral and contextual targeting in tandem are effective in amplifying message impact, frequency and in driving marketer-defined metrics
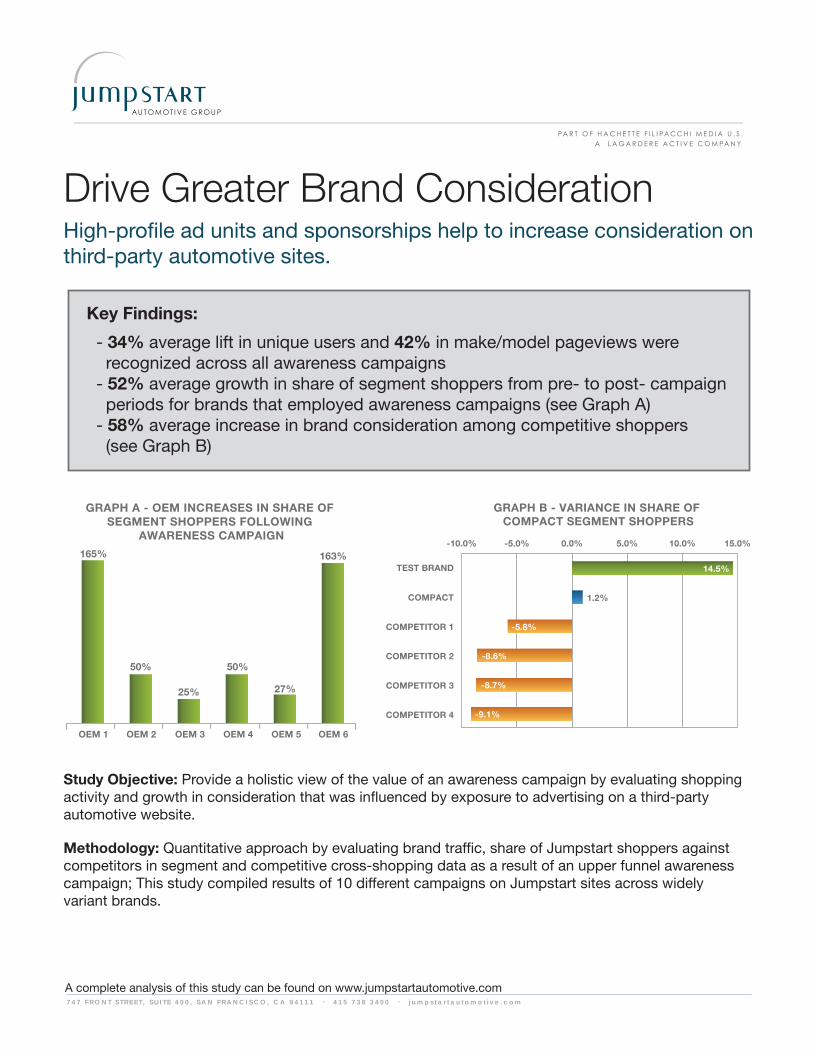
Drive Greater Brand ConsiderationHigh-profile ad units and sponsorships help to increase consideration on third-party automotive sites
Scion Drives ConsiderationScion was able to increase its presence and consideration among in-market shoppers on Jumpstart sites through high-impact awareness units and competitive conquesting
Toyota Raises Consideration LocallySouthern California Toyota dealer group influences market activity with Jumpstart’s in-market program
1
2
3
4
5

Improve Purchase Funnel Effectiveness
1
Contextual and behavioral targeting in tandem prove more effective in impacting the purchase funnel from awareness to purchase intent

GRAPH A - BRAND METRIC RESULTS - DOMESTIC - 2008
GRAPH B - BRAND PERCEPTION RESULTS - DOMESTIC - 2008
7 4 7 F R O N T S T R E E T , S U I T E 4 0 0 , S A N F R A N C I S C O , C A 9 4 1 1 1 • 4 1 5 7 3 8 3 4 0 0 • j u m p s t a r t a u t o m o t i v e . c o m
Key Findings
- 70% increase in awareness, purchase intent and brand favorability for brands who employed the targeting strategies together (see Graph A) - 130% lift in positive perceptions for brands in the same sample (see Graph B) - 17% increase in share of Jumpstart shoppers and 41% increase in share of leads submitted on Jumpstart sites for test brands
Study Objective: To demonstrate the positive value of combining behavioral and contextual display media strategies when advertising to in-market shoppers.
Methodology: Surveys deployed July and August, 2008; 1,275 surveys completed among a control group (saw a Contextual ad only) and an exposed group (saw both a Contextual and Behavioral Targeting ad). Results from both samples were compared to gauge lift in awareness, consideration and intent; Shopping and leads on publisher sites were also analyzed for quantitative results.
A complete analysis of this study can be found on www.jumpstartautomotive.com
Improve Purchase Funnel EffectivenessContextual and behavioral targeting in tandem prove more effective inimpacting the purchase funnel from awareness to purchase intent.
9%
35%
27%
19%
24%
29%
19% 19%
31%
44%
13%
6%
0%
5%
10%
15%
20%
25%
30%
35%
40%
45%
50%
Has excellent gas mileage
Is not environmentally friendly
Makes vehicles people speak highly of
Is a good value Makes vehicles that are not appealing
Sells vehicles for more than they are worth
Contextual Only BT/Contextual Combined
+114%
-47%
+18%
+129%
-47%
-79%
52%
35%32%
63% 63%
44%
0%
10%
20%
30%
40%
50%
60%
70%
Online Ad Awareness Brand Favorability Purchase Intent
Contextual Only BT/Contextual Combined
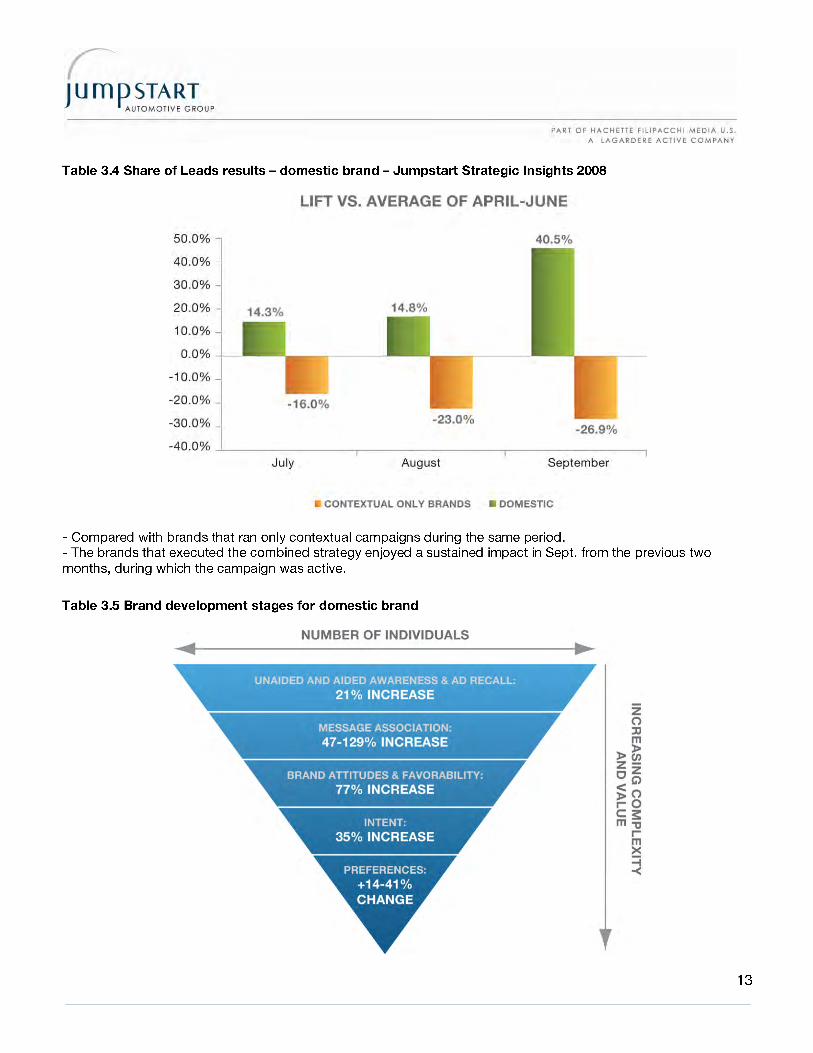
+21% +77%
+35%


-
-
-
-

- - - -

- - - -


-
- -


- -
•
•
•
•
•
•

•
•
• • • •
•
•
•
•
•
• – –

– – –
• –
–
•
• •
•

• •
•
•
•
• •
•
• • • • • • • •
•
•


Increase Message Impact & Efficiency
2
Behavioral and contextual targeting in tandem are effective in amplifying message impact, frequency and in driving
marketer-defined metrics

Key Findings
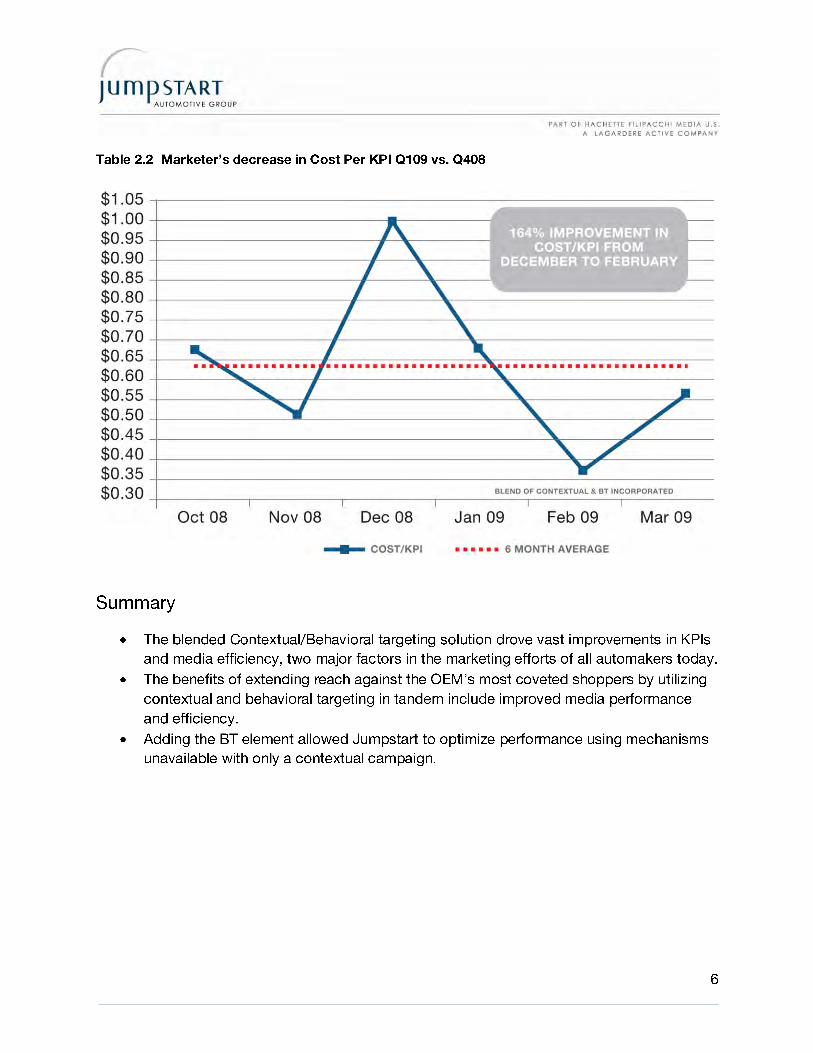
- 122% increase in Key Performance Indicators when employing both targeting strategies in tandem (see Graph A) - 26% decrease in cost per KPI and a 15% increase in KPI per impression occurred from campaign optimizations due to combined strategies (see Graph B) - Through testing campaign optimization was achieved in February (see Graph A & B)
0.80%
1.00%
1.20%
1.40%
1.60%
1.80%
2.00%
2.20%
2.40%
OCT 08 NOV 08 DEC 08 JAN 09 FEB 09 MAR 09
KPIs KPIs/Imp
JAN 09 - BLEND OF CONTEXTUALAND BT INCORPORATED
OCT 08 NOV 08 DEC 08 JAN 09 FEB 09 MAR 09
COST/KPI 6 MO. AVG
JAN 09 - BLEND OF CONTEXTUALAND BT INCORPORATED
$1.05
$1.00
$0.95
$0.90
$0.85
$0.80
$0.75
$0.70
$0.65
$0.60
$0.55
$0.50
$0.45
$0.40
$0.35
$0.30
IMPROVEMENTSPERGRAPH A - KPI GRAPH B - COST- -
7 4 7 F R O N T S T R E E T , S U I T E 4 0 0 , S A N F R A N C I S C O , C A 9 4 1 1 1 • 4 1 5 7 3 8 3 4 0 0 • j u m p s t a r t a u t o m o t i v e . c o m
Study Objective: To break down the silos that call for separate media buying strategies for contextual and behavioral targeting, and demonstrate how when employed together, they are effective in driving marketer-defined metrics.
Methodology: Optimization tests began in 2009 to help evaluate spotlight activity on OEM websites from Jumpstart shoppers and were compared to the previous three months. Also, patterns in success metricsas determined by OEM and its agency were followed.
Increase Message Impact & EfficiencyBehavioral and contextual targeting in tandem are effective in amplifying message impact, frequency and in driving marketer-defined metrics.
KPIIMPROVEMENTS
A complete analysis of this study can be found on www.jumpstartautomotive.com


- - - -

Drive Greater Brand Consideration
3
High-profile ad units and sponsorships help to increase consideration on third-party automotive sites
Key Findings:
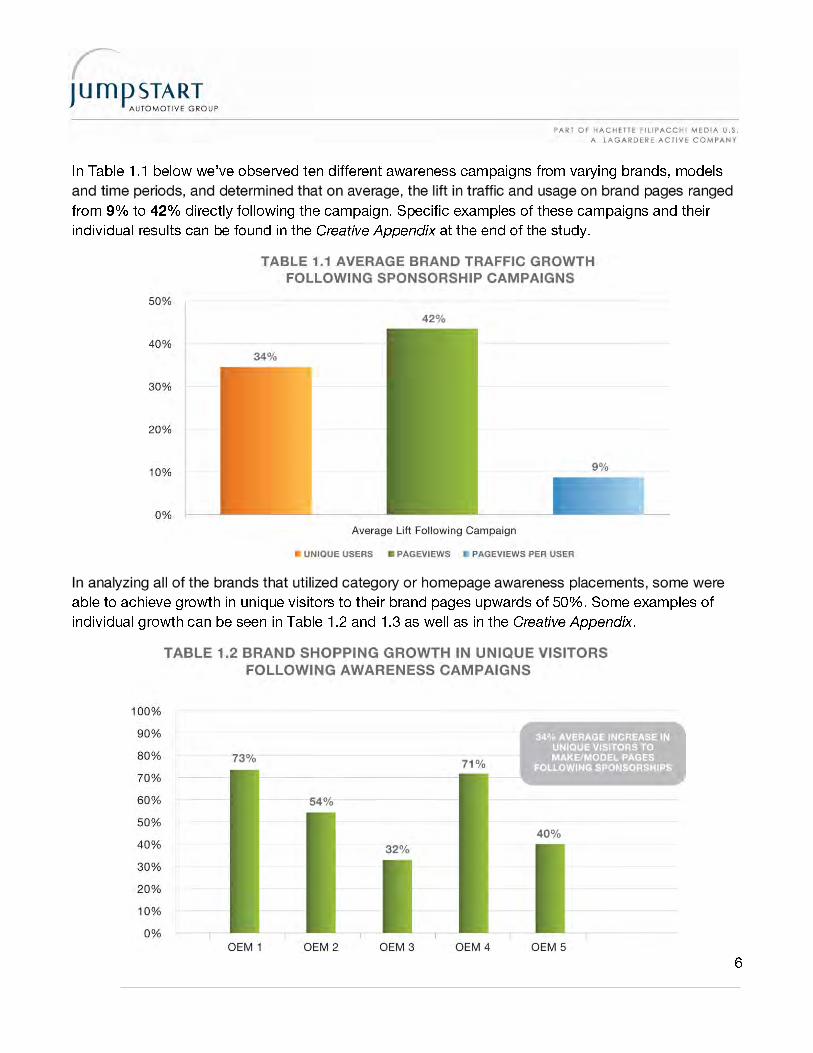
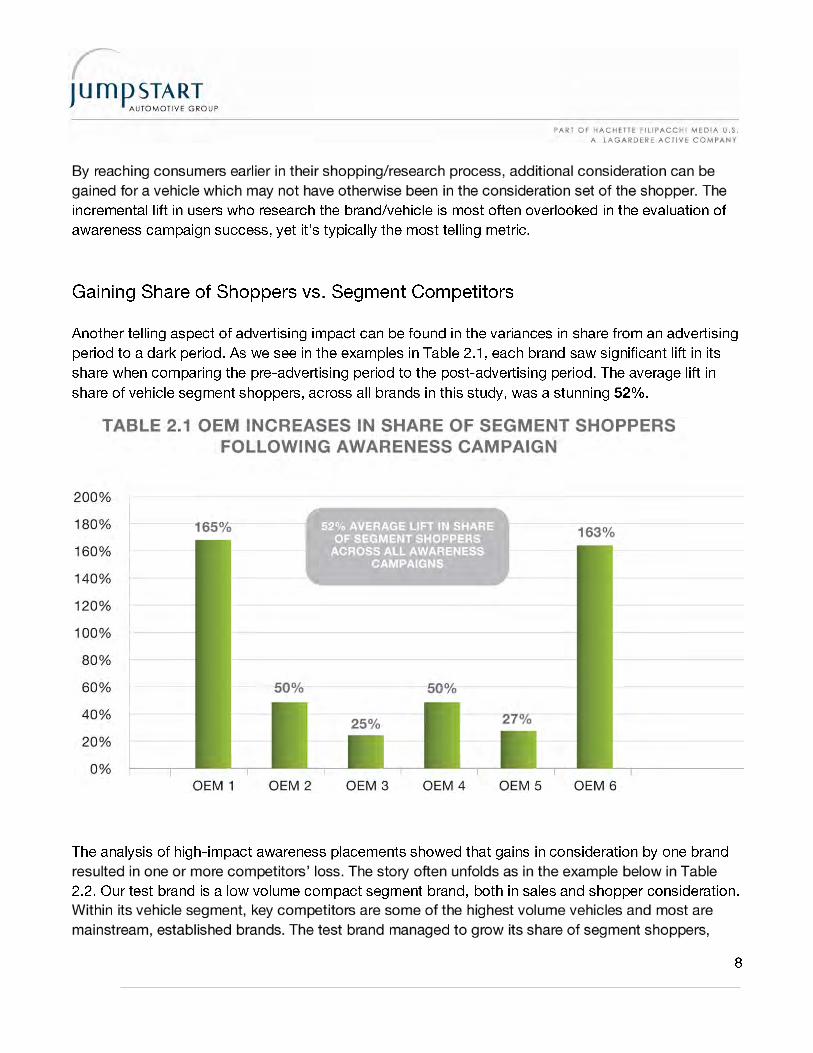
- 34% average lift in unique users and 42% in make/model pageviews were recognized across all awareness campaigns - 52% average growth in share of segment shoppers from pre- to post- campaign periods for brands that employed awareness campaigns (see Graph A) - 58% average increase in brand consideration among competitive shoppers (see Graph B)
Study Objective: Provide a holistic view of the value of an awareness campaign by evaluating shopping activity and growth in consideration that was influenced by exposure to advertising on a third-party automotive website.
Methodology: Quantitative approach by evaluating brand traffic, share of Jumpstart shoppers against competitors in segment and competitive cross-shopping data as a result of an upper funnel awareness campaign; This study compiled results of 10 different campaigns on Jumpstart sites across widely variant brands.
7 4 7 F R O N T S T R E E T , S U I T E 4 0 0 , S A N F R A N C I S C O , C A 9 4 1 1 1 • 4 1 5 7 3 8 3 4 0 0 • j u m p s t a r t a u t o m o t i v e . c o m
GRAPH B - VARIANCE IN SHARE OF COMPACT SEGMENT SHOPPERS
1.2%
COMPETITOR 4
COMPETITOR 3
COMPETITOR 2
COMPETITOR 1
COMPACT
TEST BRAND
15.0%10.0%5.0%0.0%-5.0%-10.0%
-9.1%
14.5%
-8.7%
-8.6%
-5.8%
165%
OEM 1 OEM 4OEM 3OEM 2 OEM 5
GRAPH A - OEM INCREASES IN SHARE OF SEGMENT SHOPPERS FOLLOWING
AWARENESS CAMPAIGN
OEM 6
50%
25%
50%
27%
163%
Drive Greater Brand ConsiderationHigh-profile ad units and sponsorships help to increase consideration onthird-party automotive sites.
A complete analysis of this study can be found on www.jumpstartautomotive.com


o
o
o


Scion Drives Consideration
4
Scion was able to increase its presence and consideration among in-market shoppers on Jumpstart sites through
high-impact awareness units and competitive conquesting

7 4 7 F R O N T S T R E E T , S U I T E 4 0 0 , S A N F R A N C I S C O , C A 9 4 1 1 1 • 4 1 5 7 3 8 3 4 0 0 • j u m p s t a r t a u t o m o t i v e . c o m
Key Findings
- 48% increase in unique users and 50% increase in Scion pages viewed as a result of a homepage awareness placement (see Graph A) - 158% growth in Scion consideration among key competitive shoppers through a direct competitive approach (see Graph B)
Study Objective: Evaluate the impact that the Scion contingency campaigns had on increasing awareness, consideration and purchase intent of the brand compared to competitors on Jumpstart sites.
Methodology: Review Scion brand shopping activity on Jumpstart sites prior to, during and after contingency campaigns; compare Scion activity to key competitors through traffic variance, share of shoppers and competitive cross-shopping.
0.0
1.0
2.0
3.0
4.0
5.0
6.0
7.0
0
2,000
4,000
6,000
8,000
10,000
12,000
14,000
16,000
18,000
OCT 12, 08 NOV 12, 08 DEC 12 , 08
PA
GE
VIE
WS
PE
R U
SE
R
SC
ION
UN
IQU
E U
SE
RS
& P
AG
EV
IEW
S
GRAPH A - SCION BRAND CONSIDERATION LIFT WITH HOMEPAGE AWARENESS UNIT OCTOBER - NOVEMBER, 2008
UNIQUE USERS PAGEVIEWS PV PER USER
+ 48% Pageviews + 50% Pageviews per User
CROSS-SHOPPING
MAZDA 3
TOYOTA YARIS
HONDA ELEMENT
HONDA CIVIC
DODGE CALIBER
14.5%OCT 08 DEC 08NOV 08OCT 08DEC 08NOV 08
REVERSE CROSS-SHOPPING
9%
4%
37%
2%
11%
3%
1%
12%
1%
6%
6%
3%
17%
2%
11%
8%
9%
4%
8%
6%
9%
8%
5%
20%
19%
7%
11%
5%
7%
8%
A complete analysis of this study can be found on www.jumpstartautomotive.com
Scion Drives ConsiderationScion was able to increase its presence and consideration among in-market shoppers on Jumpstart sites through high-impact awarenessunits and competitive conquesting.
GRAPH B - CROSS AND REVERSE CROSS-SHOPPING FOR SCION BRAND


Toyota Raises Consideration Locally
5
Southern California Toyota dealer group influences market activity with Jumpstart’s in-market program
7 4 7 F R O N T S T R E E T , S U I T E 4 0 0 , S A N F R A N C I S C O , C A 9 4 1 1 1 • 4 1 5 7 3 8 3 4 0 0 • j u m p s t a r t a u t o m o t i v e . c o m
Key Findings
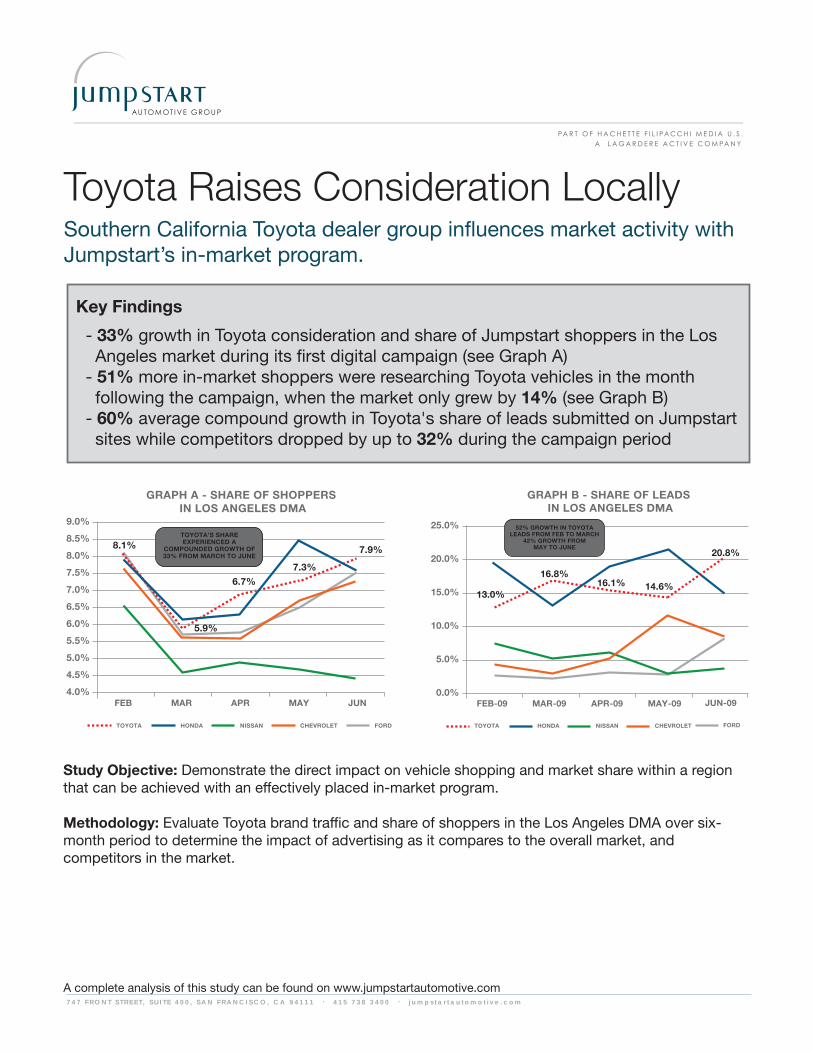
- 33% growth in Toyota consideration and share of Jumpstart shoppers in the Los Angeles market during its first digital campaign (see Graph A) - 51% more in-market shoppers were researching Toyota vehicles in the month following the campaign, when the market only grew by 14% (see Graph B) - 60% average compound growth in Toyota's share of leads submitted on Jumpstart sites while competitors dropped by up to 32% during the campaign period
Study Objective: Demonstrate the direct impact on vehicle shopping and market share within a region that can be achieved with an effectively placed in-market program.
Methodology: Evaluate Toyota brand traffic and share of shoppers in the Los Angeles DMA over six-month period to determine the impact of advertising as it compares to the overall market, and competitors in the market.
GRAPH A - SHARE OF SHOPPERS IN LOS ANGELES DMA
25.8%
39.2%
FEB
9.0%
8.5%
8.0%
7.5%
7.0%
6.5%
6.0%
5.5%
5.0%
4.5%
4.0%MAYAPRMAR JUN
TOYOTA FORDCHEVROLETNISSANHONDA
8.1%
5.9%
6.7%7.3%
7.9%
JUN-09
FORD
GRAPH B - SHARE OF LEADS IN LOS ANGELES DMA
25.8%
39.2%
FEB-09
25.0%
20.0%
15.0%
10.0%
5.0%
0.0%MAY-09APR-09MAR-09
TOYOTA CHEVROLETNISSANHONDA
13.0%
16.8%16.1% 14.6%
20.8%
Toyota Raises Consideration LocallySouthern California Toyota dealer group influences market activity withJumpstart’s in-market program.
A complete analysis of this study can be found on www.jumpstartautomotive.com
52% GROWTH IN TOYOTA LEADS FROM FEB TO MARCH
42% GROWTH FROM MAY TO JUNE
TOYOTA’S SHARE EXPERIENCED A
COMPOUNDED GROWTH OF 33% FROM MARCH TO JUNE


•
•
•
•
•


