7I--Z8S- « ' ' JUN9 1971 \ GEOCHEMICAL EVALUATION OF THE DIENG MOUNTAINS CENTRAL JAVA FOR THE PRODUCTION OF 6EOTHERMAL ENERGY by A. H. Truesdell U. S. Geological Survey II* S. Geological Survey OPEN FILE RSPORT This report is preliminary and haa not. been edited or reviewed fon oonf oraity with Geological Survey standards or nomenclature.
Transcript
7I--Z8S-
« ' '
JUN9 1971
\
GEOCHEMICAL EVALUATION OF THE DIENG MOUNTAINS
CENTRAL JAVA
FOR THE PRODUCTION OF 6EOTHERMAL ENERGY
by
A. H. Truesdell U. S. Geological Survey
II* S. Geological SurveyOPEN FILE RSPORT
This report is preliminary and haa not. been edited or reviewed fon oonf oraity with Geological Survey standards or nomenclature.
CONTENTS
Page
Summary 1
Introduction 1
Chronology 1
Acknowledgements 2
Objectives 3
Character hot-water or vapor-dominated 3
Areal extent U
Springs outside the Dieng Mountains 5
Chloride inventory of rivers 6
Depth to the geothermal reservoir 7
Subsurface temperature 8
Chemical character of the geothermal fluid 10
Possible acidity of the geothermal fluid 10
Attack of equipment by hydrogen sulfide 10
Salinity of geothermal fluid 11
Possible pollution by geothermal effluent 11
Rate of natural energy production 11
Comparison of USGS and GSI chemical analyses 12
References cited lU
SUMMARY
Insofar as can "be determined from a geochemical survey of hot springs, fumaroles, and rivers, the Dieng Mountains appear favorable for exploitation of geothermal resources. Exploratory drilling recommended "by Muffler (19TO) as step two should proceed.
Specific findings covered in this final geochemical report are:
1. The Dieng geothermal systems will probably produce a mixture of hot water and steam rather than steam alone.
2. Three or possibly four geothermal systems are found in thenear-surface (<200 meters) in the Dieng. These may be connected at much greater depths. The largest of these is the Pagerkandang system which is at least 2.5 km2 in area.
3. The top of the Pagerkandang reservoir is at about 1875 meters above sea level. Drilling between Siglagah and Pagerkandang should be at least 200 meters deep to intercept the reservoir.
U. The subsurface temperatures indicated by critical chemical constituents are 203°C (silica) and approximately 200°C (alkali ratios).
5. No problems are expected at Pagerkandang with corrosion from acidity of the geothermal fluid and few from H£S attack of electrical equipment. The geothermal fluid has about TOO mg/1 chloride if its reservoir temperature is 200°C. No pollution problems are anticipated from boron in the effluent.
6. The natural heat flow of the Dieng region is at least 5,000Kcal/sec , as calculated from production of geothermal chloride. This estimate does not take into account the heat escaping as vapor, and may be low by perhaps 100$.
INTRODUCTION
Chronology
This report contains results of a 3-week geochemical study of the Dieng geothermal systems. This is part of a cooperative program of the Indonesian Ministry of Mining, the Indonesian Directorate General for Power and Electricity and the U.S. Geological Survey under the auspices of the Government of Indonesia and the Agency for International Develop ment, U.S. Department of State. This is part of the first stage of investigation suggested by Muffler (19TO) in his appraisal of the geothermal potential of the Dieng mountains.
The 3 weeks in Indonesia was spent in this way:
August U-5
August 5-6
August 6
August 7-8
August 9-17
August 18
August 19-21
August 22
August 23
August 2h
Djakarta. Conferences with USAID and USGS personnel. Formal meeting with representatives of the Indonesian Directorate General for Power and Electricity.
Bandung. Review of available reports. Conferences with personnel of the Geological Survey of Indonesia (G.S.I.).
Drive to Wonosobo, Central Java.
Reconnaissance and sampling of fumaroles and hot springs in the Dieng and Karangkobar areas with Dr. M. R. Klepper of the U.S.G.S. and personnel of the G.S.I.
Field sampling in the Dieng and of rivers draining the Dieng. Limited field analyses of samples.
Drive to Bandung.
Review of data. Preparation of preliminary report.
All day lecture and discussion session on geology and chemistry of geothermal systems with all interested parties.
Visit Kawah Kamodjang fumarole area.
Drive to Djakarta. Presentation of report to representative: of the Indonesian Directorate General for Power and Electricity.
Leave Indonesia.
At the writer's request, Soeharto Oemar and other scientists of the G.S.I, made further collections in the Dieng. The analyses of these samples are included in this final report.
During late 1970 and early 1971 several partial analyses of critical fluid samples were completed by U.S.G.S. chemistry laboratories in Menlo Park, California. These analyses are also included in this final report.
October
Acknowledgements
The support of the Geological Survey of Indonesia (G.S.I.) and the Directorate General for Power and Electricity (D.G.P.E.) has been
superb. The work described in this report could not have been accomplished without an all-out effort from the personnel of these agencies and from the personnel of the USAID and the U.S.G.S. in Indonesia. Of his many new friends the writer particularly wants to thank Mr. Vincent Radja and Mr. Oemar Hasan Soewarho of the D.G.P.E. Mr. Muzil Alzwar of the Volcanology Division, G.S.I., and Mr. Soeharto Oemar and Mr. Wishnu Sudarsono Kartokusumo of the Chemistry Division, G.S.I. Enthusiastic support in the field was given by many others who will be well remembered. Discussions in the field and afterwards with Indonesian colleagues already mentioned and with Drs. J. R. Pritchard and J. J. Jacobson were very valuable. The presence in the background of Dr. A. Arismunandar and Mr. C. S. Hutasoit of the D.G.P.E. , Dr. M. R. Klepper of the U.S.G.S. and Mr. Bruce E. Kent of the USAID contributed greatly to the success of the mission. Chemical analyses of critical fluid samples were done in Menlo Park, California by R. B. Barnes, Water Resources Division, U.S.G.S.
Objectives
Chemical studies of geothermal systems cannot be strictly separated from geologic observations. The location, intensity and character of thermal features as well as their chemistry must be considered to present as complete an analysis of the system as possible. In this investigation I have attempted to cover the following problems related to the Dieng geothermal systems:
I Character of the geothermal systems - hot-water or vapor- dominated.
II Areal extent of the systems.Ill Depth to the geothermal reservoirs.IV Subsurface temperature.V Chemical character of the geothermal fluid.VI Rate of natural energy production.
CHARACTER HOT-WATER OR VAPOR-DOMINATED
Geothermal systems consist of a volume of porous rock containing heated water or steam and water in its central part, a source of heat at its base and cooler water at its margins which becomes heated and replenishes hot water and steam lost from the central part. Geothermal systems may produce either water and steam (a "hot-water" system) or steam alone (a "vapor-dominated" system), but recent work shows that in both cases liquid water predominates by weight in the reservoir. The important difference lies in the porosity of the reservoir rocks and the impedance o^ flow at the reservoir margins. Highly porous and permeable rocks do not usually contain vapor-dominated geothermal systems Vapor-dominated systems are pressure-deficient relative to adjacent
water saturated rocks, and vith high permeability they can neither form nor be maintained. In addition, the drying of the fluid from mostly liquid water to entirely steam depends on transfer of heat from the rock due to a pressure and temperature drop during production. With highly permeable rock this pressure drop occurs in the well and no heat is transferred from the rock.
In evaluating which type of system is likely to be found at depth, the chloride content of surface springs is the most important single index. Chlorides with few exceptions are not appreciably soluble in steam below 300°C, and, since upward transfer of water and heat occurs by movement of liquid water in hot-water systems and by movement of steam in vapor- dominated systems, these may be differentiated by the chloride contents of the surface leakages. As a general rule of thumb if chloride contents of flowing springs exceed 50 mg/1 a hot water system is indicated. There are a very few exceptions. The Beowawe, Nevada, USA hot water system has average chloride contents of UO mg/1 and the Carboli, Italy hot-water system has 1*3 mg/1.
The general principles are somewhat difficult to apply to volcanic areas where high permeability in the near-surface rocks may combine with copious flushing by ground water to prevent the formation of distinct hot-spring vents. High chloride water may be so diluted in the process that the chemical criterion discussed above for distinguishing between hot-water and vapor-dominated systems may not be applicable. The physical necessity for low porosity and permeability in vapor-dominated systems may, however, rule these out in volcanic reservoir rocks.
In the Dieng the abundance of fumaroles and the scarcity of hot springs combined with the low chloride contents of most of them would suggest the presence of a vapor-dominated system, were it not for the high chloride water from Sileri (173 mg/1 Cl), Pulosari (1*26 mg/1 Cl) and the river Tulis (l60 mg/1 Cl). These high chloride discharges strongly suggest that the Dieng systems are the hot-water type. Although the extraction of stored energy from a hot-water system is not as efficient as from a vapor-dominated system, the application of geochemistry to indicate subsurface temperature is much better established and the prediction of subsurface temperature conditions is more reliable.
AREAL EXTENT
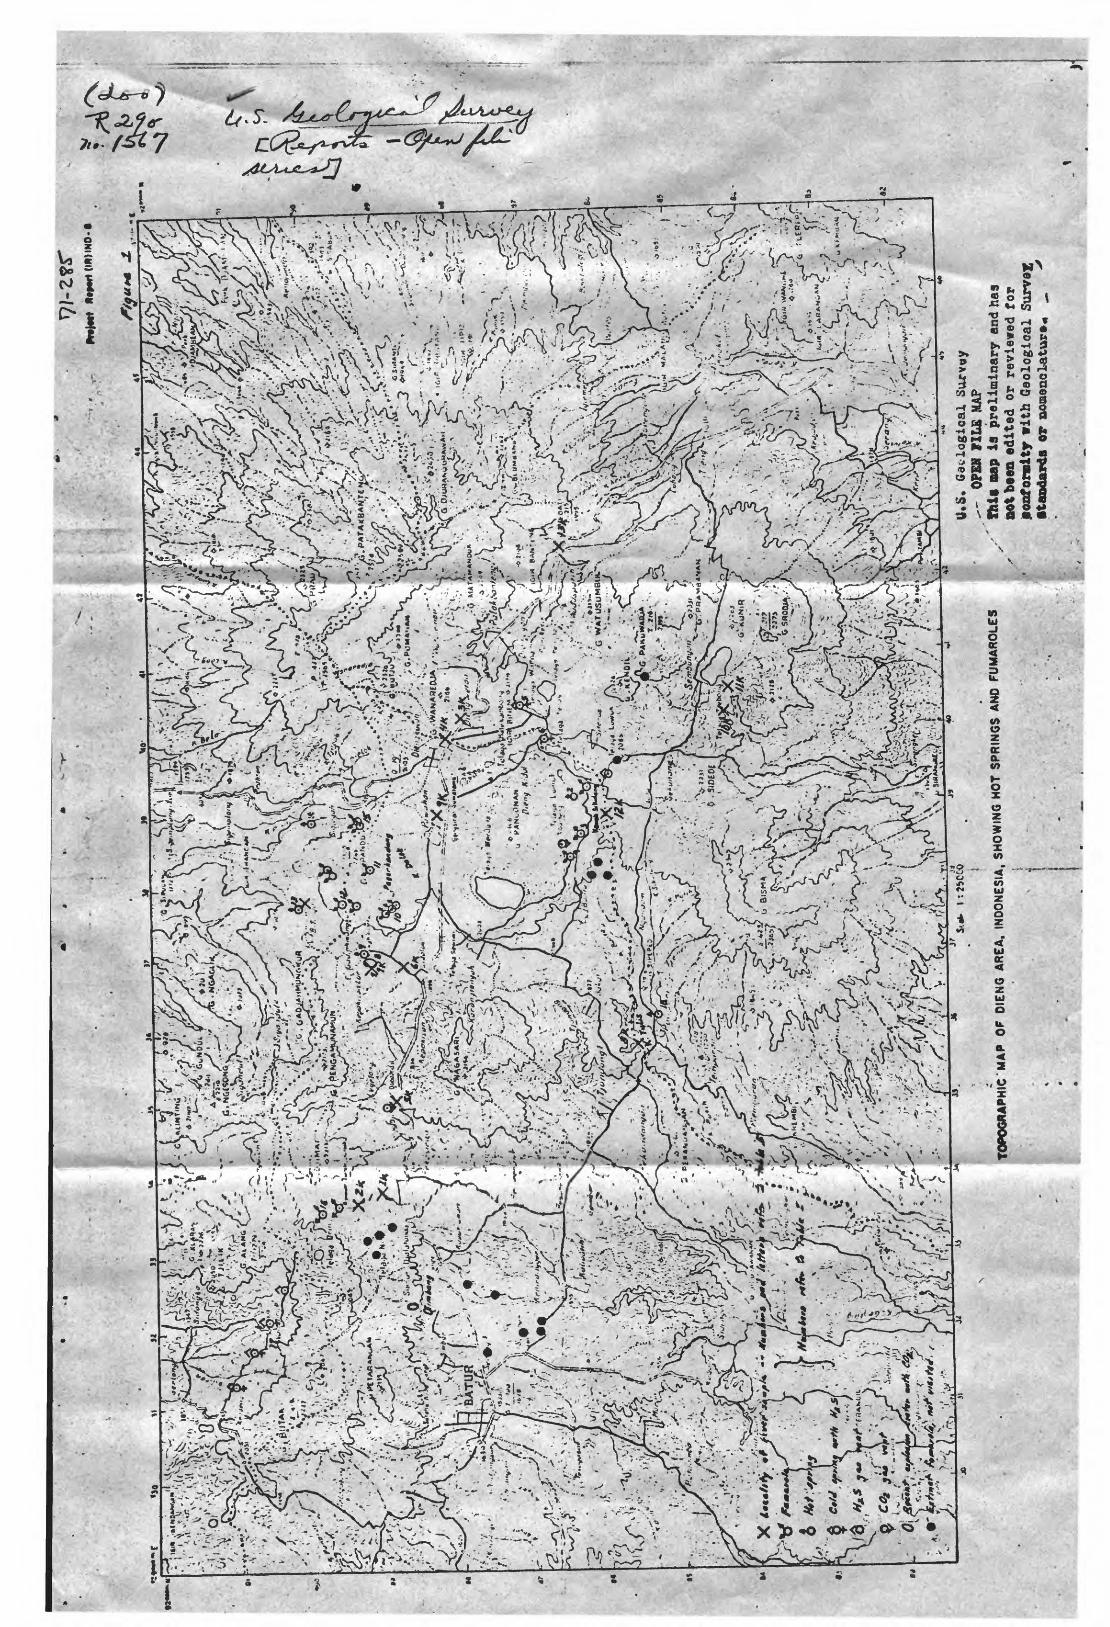
In highly permeable recent volcanic rocks the presence of boiling water at depth will be revealed by fumarolic or steam-heated hot-spring activity at the surface since little resistance to the passage of vapor can be offered by the near surface rocks. Thus high priority was given to locating, examining and sampling as many as possible of the thermal features of the Dieng and surrounding areas. The results of this survey are shown in figure 1 and table 1.
Table
1. Fumaroles, ho
t springs, and
othe
r thermal
feat
ures
of
the
Dien
g Mo
unta
ins
observed by
the
writ
er
No.
1. 2. 3. 1*. 5. 6 .
7. 8. 9. LO.
Ll.
L2.
Name
Type
*
Kawa
h Si
kida
ng
f,mp
Near
Kaw
ah
s Si
kida
ng
Kawa
lTIS
tben
dang
f
Kawah
Si gad
Jan
f
Near Telaga
gv,s
Warn
a
Near T
elaga
gv,s
Terus
Kawah
Sileri
f ,s
(out
flow
)
Kawah
Sileri
f,s,
(v
ent)
NE o
f Kawa
h s
Sile
ri
Pagerkanda
ng S
E f
Page
rkan
dang
NE
f
Pagerkandang N
E f
Temp
erature,
Flow
°C
lite
r/se
c.
91, 9U
9U - - cold
cold
55 86 56 91 95 9^.5
large
very
small
feeb
le
none or
fe
eble
not
over
flow
ing
seep
ing
50 - 8
large
large
mod. large
Elev
atio
n,
pH
mete
rs ab
ove
sea
level
2035
6.0
2035
2.0
2125
2125
2065
1.5
2065
6.0
1875
6.5
1875
7
1875
2025
5.5
2035
6.
0
2035
Chloride,
mg/l
iter
6 15.0 - -
75.0
lU.O
173 77 18 - 6 0
Note
s
19^7 vent.
evaporation
and
oxidation
of H
2S
not
collected
not
coll
ecte
d
evaporation
and
H~S
oxid
atio
n
outflow
hot
gass
y vent on
S side
prob
ably
heated
surface water
supe
rhea
ted
outs
ide
crater on
13.
Biti
ngan
82.79
351Q
OO6.7
20
NW s
lope
3 vents, heated
surface
wate
r
Table
1. Fumaroles,
hot
spri
ngs,
an
d other
ther
mal
feat
ures
of
the
Di
eng
Mountains
obse
rved
by
the
writ
er (c
ont'
d)
Map
No.
lU.
15.
16 17.
18
Name
Type*
Near
Kawah
s Si
glagah
Kawa
h Si
glag
ah
f
Kawah
f ,m
p T j a
ndradimuka
Wanaprija
s,gv
Pulosari
s
Kalibening
s
Kali
puti
h s
Tempuran
s
Pana
raba
n s
Kali
anget
s
Plantungan
s
Temperature
, Flow
°C
liter/sec.
56 96.5
99 cold
55 U3 U3 U3 33
.
UO U3
20
very
large
large
0 to 1/2
10
Springs
outside
10 15 10-20
30-UO
20 ?
20
?
Elevation,
meters ab
ove
sea le
vel
1800
2000
1900
-195
0
1950
i
1700
the
Dieng
(see
1000
1150
1115
1100 800
650
pH 6.5
6.0
7.0
*.5-5.5
6.5
figu
re
6.8
6.8
6.8
6.7
7 6.8
Chloride ,
mg/liter
15 0 6
10-2
1*
1*26
2)
98 390
61*0 72 350
11*00-2000
Note
s
heat
ed surface
water
2(3)
? vents. NH
smell
1* sp
ring
s probably H
S
into
su
rfac
e wa
ter
deposits travertine
deposits tr
aver
tine
depo
sits
iron ox
ides
and travertine (?)
oil
seeps
nearby
*Kf?
y: f,
fump.role; s,
spring;
mp,
mud
pot;
gv p^
s vent.
pH of
fu
maro
les
refers to-condetisate
The largest concentration of fumaroles and springs is in the area of the Pagerkandang crater from Kawah Sileri on the west to Kawah Siglagah on the east and north to the Kampung Bitingan. The fumaroles of Sikidang to the southeast and Tjandradimuka to the west as well as the spring at Kampung Pulosari are relatively isolated features. In the Sikidang and TJandradimuka areas cold gas vents and gassy springs also occur, but the significance of these in outlining areas of subsurface hot fluids is very doubtful.
The Pagerkandang area (including features from Sileri to Siglagah and north to Bitingan under this name) extends 2.0 kilometers east to west and 1.25 kilometers north to south, thus covering an area of about 2.5 Km2 . The Sikidang and Tjandradimuka areas are considerably smaller. From Sikidang to the feeble or extinct fumaroles of Sibanteng and Sigadjeh is 1 Km; these features are aligned (fracture control?) and thus no area can be defined. A similar situation is found at Tjandradimuka where the two (three?) Tjandradimuka fumaroles are aligned (fracture control?) and about 1/U Km apart.
The spring at Pulosari has a high chloride discharge and probably represents hot water separated from steam under one of the fumarolic areas which has been diluted by cold water. It is at a considerable distance from the nearest fumarole and it is not certain in which area it originates.
Springs outside the Dieng Mountains
Warm springs (33-^3°C) at Kalianget near Wonosobo (position shown in figure 2), Kalibening, Kaliputih, Tempuran and Panaraban in the Karangkobar area and Plantungan to the north were visited, but it is the opinion of the writer that these are not directly related to the Dieng geothennal systems, although they do indicate generally high heat flow over a broad area. The springs at Kaliputih and Kalibening are at present depositing travertine and similar springs at Tempuran and Panaraban may have done so in the recent past. Travertine deposition is significant because the solubility of CaCOs decreases with increasing temperature; accordingly water from a high temperature geothermal system that cools by boiling and dilution near the surface will not deposit travertine. A high volume warm spring that is depositing travertine most likely has the same temperature at depth as it does at the surface. These springs are at the edge of the central volcanic range (Van Bemmelen, 1937) and the source of calcite is probably the Tertiary sediments immediately underneath.
The spring at Plantungan (analysis in table 2) has the highest chloride content of any spring visited. Its position along the north flank of the volcanic belt and the presence in the immediate area of oil seeps suggests that the water is actually a connate brine whose path to the surface is the same as that of the oil.
en I
% Thermal spring or fumarol*
JX Hiver sample
Springs outside the Qieng:
High-chloride spring
Kalibeni ng Xaliputih T"5 Tip'iran Panaraban
£. Plantungan6. Kalianget7. H2S springs from Van Bemmelen (1937)
not visited
^ace 2. Sketch map showing rivers and springs sampled in t_her<".'i')n .'irotiivi 'he [)!<-p'.' Mountain';.
TABLE 2. Analyses of spring "wa
ters
of
the Dieng area (i
n mg/1 ex
cc;
i if:
labelled)
Numb
er
Location
Field No
.
Lab.
No
.
Collection
Temperature
1
Siki
dang
I
566/
69
pH
F =
field
L =
lab.
3.4L
Na
K Ca Mg Fe (total
as Fe-H
Mn Cl so4
HC03
Si09
Cations
mill
ieq.
/e
An ion
mill
ieq.
/e
na
na 42.8
102 24.5 2.2
60.7
1,84
1 0.0
390 11.8
40.1
2
Siki
dang
II
567/
69 2.2L
na
na 52.8
103 15.0 1.1
60.7
1,66
2 0.0
350 12.0
36.3
3
Sileri
(outflow?)
568/69
6.1L
na
)
na
)
68.5
40.8 2.5
0.0
130
508
1
27.8
168 2.
5
14.6
a.
Na +
K calculated by
di
ffer
ence;
given
as
b.
H4" included;
calc
ulat
ed fr
om pH
c.
pH to
o low
for
reported HC
O~ co
nten
t d.
47
2 ppm
analysed in fi
eld
e.
JT9
analysis in pp
m.
Also
16 pp
m NH
^ ,
0
4
T^andra-
dimuka
I
569/
69
6.6L
848a
j -
48.6
17.8 0.1
0.2
71.2
,774
111
116 40. 7a
40.7
Na
.06
ppm
Li,
5
Tiandra-
dimu
ka
II
570/69
4.3L
437a
9.1
15.3 2.5
0.2
17.8
977
200 20. 8a
20.8
0 . 8
ppm
6
Kalianget
571/
69
6.1L
} 273a
]
52.1
126 4.
0
0.0
412
262
827
136 30. 6a
30.6
Sr,
and
7.7
7
Temp
uran
572/
69
6.3L
f? 270a
127
181 0.
1
0.0
681 0.
0
837
122 32. 9a
31.9
ppm
B.
8
Sileri
outf
low
JT10
1827
/70
55°C
6.5F
7.5L
236
39.0
106 37.6 0.7
2.2
245
588
- 80
.9
160 19.7
20.5
9
Siki
dang
JT27
1828/70
94°C 2. OF
1.9L
14.7
11.9
36.3
55.0 6.4
0.5
29.4
1,284 0.
0
88.0
27. 6b
27.5
10
Site
rus
JT29
1830/;
cold
6. OF
3.1L
na
na 39.4
20.2 0.6
3.6
20.2
217.6
90.7
76.0 1.9
11.7
JT1.0
analysis in pp
ra.
Also 52
ppm NH,
, 0.
3 ppm Li,
0.6
ppm
Sr,
and
17 ppm B.
TABLE 2. Analyses of spring waters of th
e Dieng area (i
n mg/1 ex
cept
as
la
bell
ed)
(Con
tinu
ed)
Number
Location
Field No
.
Lab.
No.
Collection
temperature
11
Wana
prij'i
JT23?
1831/70
cold
PH
F =
field
4.5F
L =
lab.
1.
0L°
Na K Ca Mg Fe(total
as Fe
+3)
Mn Cl so4
HC03
Si02
Cations
millieq. /I
Anion
millieq. /e
na na 30.3 4.6
17.2 0.0
18.4
1367
2041 70
.0 2.9
62.5
12
Pulosari
JT31
1832/70
55°C
6.5F
8.1L
147 64.3
133 57.3 0.7
0.0
414d
196
193
132 19.6
18.9
13
Sileri
outflow
7K
1872/70
7.1L
232 56.6
121 55.0
10.4
0.0
57.0
837
149 40.0
22.6
21.5
14
Kalianget
14K
1874
/70
40°C
7. OF
7.7L
149 45.0
57.8
154 0.
2
0.0
392
201
572 92.0
23.2
24.6
15
Kali Balun
seepage
20bK
1875/70
8.0L
203 17.7
15.1
82.4 0.2
0.0
234 0.
0
572
132 16.8
16.0
1617
Plantungen Plantungen
oil
seep
hot water
23aK
23bK
1876/70
7.1L
731 16.1
215 3.
7
0.2
*
0.0
1058 89
.3
764 24 39.7
44.1
1877/70
6.7L
1066 48
.2
218 3.
7
2.1
0.0
1242 67
.0
1456 84 57
.8
60.4
18 Biti
ngan
I KK3
1900
/70
7.1L
50 ..
8
16.1
33.3 9.2
0.4
0.0
20.2
156.2
128 74 5.
0
5.9
19
Bitingan
II
KK4
1901/70
7.7L
8.4
1.9
6.1
1.8
0.2
0.0
11.0
33.5
25.6
22 0.63
1.4
O A6
L^J
Sileri
vent
JT9
2165 86°C
7. OF
7.9L
180 42 108 20 0.5 na 77
206
476
152 16.8
14.3
g.
JT31 analysis in pp
m.
Also 1.
4 ppm NH,, 0.05 ppm Li
, 0.
5 ppm
Sr,
and
4.1
ppm B.
h.
Plan
tung
an also 3.
3 mg
/1 N
H^ ,an
d 1.7
mg/1
NO
^.No
s. 1-19 an
alys
ed at
th
e laboratories of
the
Geological Survey of Indonesia, Bandung, In
done
sia.
Nos.
20
-22
anal
ysed
by R. Ba
rnes
at
th
e U.S. Ge
olog
ical
Su
rvey
, Me
nlo
Park,
California,
USA
No.
23 qu
oted
fr
om P
urbo
-Had
iwid
jojo
(1968),
Tabl
e II
, Analysis 3.
TABL
E 2. Analyses of sp
ring
wa
ters
of th
e Dieng
area
(i
n rng/1
exce
pt as labelled)
(Con
tinu
ed)
Numb
er
Location
Fiel
d No
.
Lab
. No
.
Collection
temperature
pH
F -
fiel
dL
= la
b.
Na K Ca Mg Fe(t
otal
as
Fe
+3
) '
Mn Cl so4
HC03
Si02
Cations
millieq./l
Anion
millieq. /e
21f
Sile
ri
outflow
JT10
2166
55°C
6.5F
7.8L
157 36 109 28 0.
7
na 173
592 61 95 18.7
13.2
1
228
Pulo
sari
JT31
2167
55°C 6.5F
7.6L
116 56 142 46 0.
1
na 426
169
131
177 17.4
17.7
23h
Plantungen
46°C
7.5L
944
792
176
120 1.
1
0.2
2006 140
1244 62 80
.0
79.8
Chloride water discharges from the Dieng hot water systems occur right in the Dieng (Pulosari, Sileri and those indicated "by the river survey), and it is unnecessary to assume long distance under surface transport.
Chloride inventory of rivers
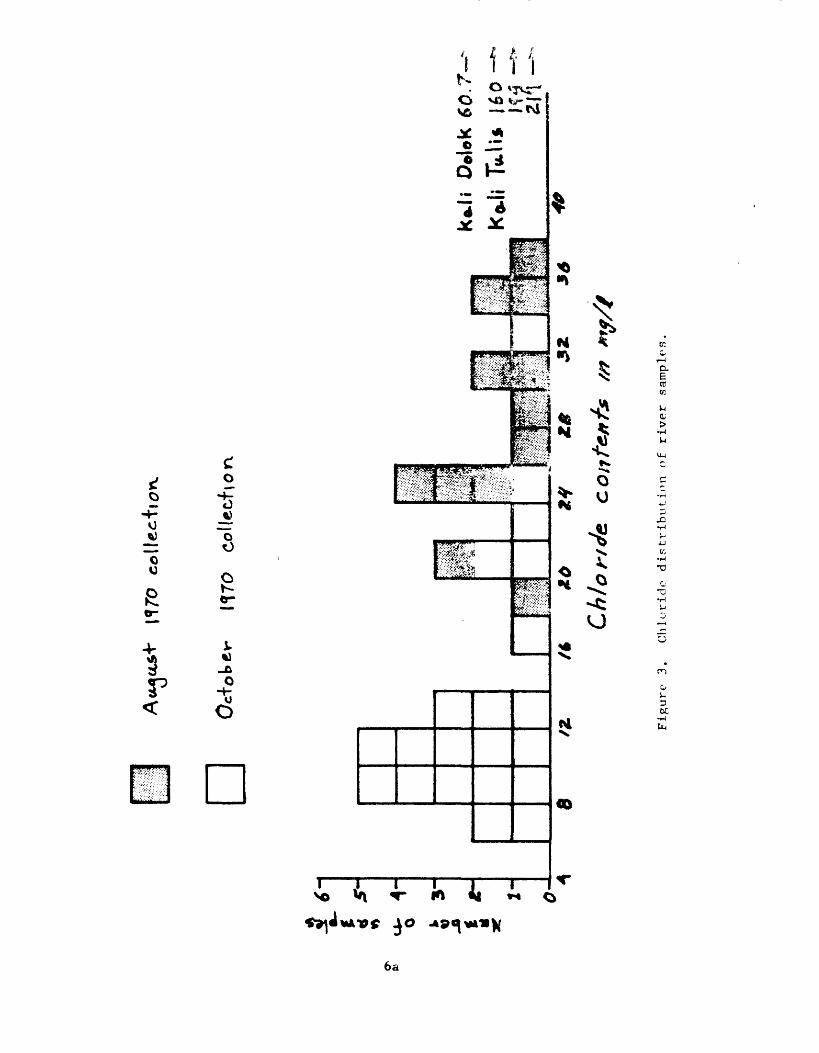
In the Dieng mountains only two springs, Sileri and Pulosari, have chloride contents greater than 20 mg/liter. Fumaroles, however, are relatively abundant. This suggests that if a hot-water system exists, the liquid water discharge from the system is diluted by abundant ground water and finds its way directly into streams and rivers. In order to test this inference and to search for possible springs in the heavily wooded and sparsely inhabited northern slopes of the Dieng, the rivers draining the Dieng were sampled and analysed for chloride and their flow estimated. The inventory was incomplete due to the limited time available and difficult access to parts of the area. The rivers draining the Dieng are shown in figure 2 and sampling points are indicated by "X". Analyses for chloride were made in the field by titration with AgN03 by Mr. W. S. Kartokusumo and his associates of the chemistry section of GSI.
In October a second collection of river samples was made by Mr. Soeharto Oemar and other scientists of the GSI. These were analysed in the GSI chemical laboratories.
Steam flows were approximated, probably with a range of +_ 50$, from visual estimates of the width, depth and velocity of each river. The results are shown in table 5« The chloride content of samples from rivers Petungangap and Putih as well as the low-chloride cold and warm springs in the Dieng (see spring data, table 2) indicate that for the August collections the chloride background of the Dieng area is about 20 mg/liter, certainly no higher than 25 mg/liter.
The October collections were made at higher elevations and from the headwaters of the rivers, principally on the south side of the drainage divide. These show a lower background near 9-11 mg/1 Cl (see fig. 3). This Cl content has been adopted for the background of rivers sampled at high elevations in the Dieng in both collections. The higher back- groi.nd has been retained for rivers sampled nearer the coast (where a greater contribution of sea salt may be expected) and on their lower reaches (where evaporation may have occurred during irrigation). The use of two background figures is considered quite unsatisfactory, but necessary.
Although both the August and October chloride contents are considerably higher than the 2 mg/1 found at Yellowstone Park, USA, in a similar study, they are reasonable considering the relative closeness of the Dieng to the ocean.
.josip ^pf
JOIMO
*£
O*
f/
-r-c
Table 5. Chloride inventory of rivers draining the Dieng Mountains.
I. Collections
River
Lutit
Terong
Lampir
Bela
Arus
Petungangap
Kitiran
Koepang
Wela
Singkarang
Tulis
Dolok
Putih
of August, 1970
Sample
location
(fig. 1 and 2 )
a
b
c
d
e
f
g
h
i
J
k
1
m
Chloride
content
mg/1
27
29-5
35
25
35
20.5
35
30
31.5
36.0
160
25
18
Flow
I/sec
150
120
300
UOO
U50
600
600
600
800
700
100
UO
25
. ~_
Excess chloride
from goothermal flu:
ing/sec *
1050
1680
U500
2000
6750
0
9000
6000
9200
11200
15000
600
200
6b
Table 5« Chloride inventory of rivers draining the Dieng Mountains (cont'd).
IL Collections
River
Dolok
Dolok
Dolok
Tulis
Tulis
Tulis
Tulis
Putih
Putih
Seraju
Kongkong
Seraju
Merawu
Urang
Panaraban
Sibanger
Gembrosan
Balun
Urangatas
Arus
Laran^an
llinVirnnp;
of October, 1970.
Sample
location
(fig. land 2 )
9k
6k
5k
i*k
8bk
8ak
12k
Ik
2k
3k
10k
13k
15k
16k
17k
18k
19k
20ak
21k
22k
?Uk
:"5k
Chloride
content
mg/1
11.0
11.0
60.7
9.2
175
219
11.0
12.9
7.U
7-U
11.0
16.6
20.2
25.8
12.9
21.9
9.2
33.1
9.2
22.1
9-2
<>.r?
Silica
content
mg/1
50
30
U2
22
128
1*8
22
38
20
28
76
60
18
21*
20
16
12
28
16
5U
10
',")
Flow
I/sec
60
300
300**
1
100**
75
7.5
30
1
15
290
lUooo
Uooo
8000
700
250
3200
280
1*00 '
50
1;2Q
Excess Chloride
from geothermal fluid
mg/sec *
0
0
15000
0
20000
0
15
0
0
0
1750
0
2^000
16000
7000
0
70000
0
1*1*00
0
0
Table 5. Chloride inventory of rivers draining the Dieng Mountains (cont'd)
* Chloride contributed from hot or cold mineral springs and by seepages.
Chloride background of rivers at high altitudes in the Dieng is assumed to
be 9-11 mg/1. Lower elevation river samples are assumed to have a chloride
background of 20 mg/1. See text.
** See text.
6d
There seems to be a discrepancy in the flow estimates of Kali Tulis near Pulosari, which was estimated in August to be 100 I/sec and in October to be 1 I/sec (even though it was estimated in October to be 75 I/sec upstream). The original figure of 100 I/sec has been adopted. The flow of Kali Dolok (600 I/sec) seems high; 300 I/sec has been adopted.
Using these background chloride values, the contribution from mineral spring inflow is calculated in the last column of table 5« The excess chloride is considered significant for the rivers Lampir, Arus, Kitiran, Koepang, Wela, Singkarang, Dolok, Urang, Panaraban, Sibanger, Balun, and Tulis. The presence of excess chloride in these rivers indicates that in addition to known chloride springs in their drainages, a considerable amount of chloride enters the rivers with ground water. Mineral springs have not been reported in the drainage areas of the Lampir and Wela rivers, but should be looked for.
The springs in the drainages of the Koepang and Singkarang rivers were not visited by the writer; they may be similar to the high chloride springs north and west of Karangkobar or may be a western extension of the Dieng activity. In either case, they should be sampled and their volume of flow determined. The high chloride in K. Sibanger suggests that the activity does extend in this direction.
The August collection of K. Dolok south of Pekasiran showed lower chloride contents and flow than would be expected. In the later collection this discrepancy does not appear and it may have been due to a mistaken location.
Chloride content of river samples, together with the high chloride outflow of Pulosari and Sileri, indicates that the Dieng geothermal systems are almost certainly of the hot water variety. This is to be expected because of the probable high permeability of the andesitic volcanic reservoir rocks.
DEPTH TO THE GEOTHERMAL RESERVOIR
The thermal activity of the Pagerkandang area, the Tjandradimuka area and to a lesser extent the Sikidang area is at high elevations relative to nearby areas and it is predominately fumarolic. These facts suggest that the top of the geothermal reservoir is below the ground surface over much of the area. This contrasts with the geyser basins of Yellowstone Park where hot springs predominate and the geothermal reservoir extends to the surface. The depth to the reservoir is obviously important in planning the depth of exploratory drilling.
The high chloride springs at Sileri, Pulosari and the chloride seepage into the river Tulis are outflows of the reservoir fluid. In highly, permeable rock without an impermeable or self-sealed cap (which would
result in artesian pressures) the elevations of these springs give an estimate of the elevation of the top of the reservoir. Sileri is at 18T5 meters and Pulosari and the river Tulis at the point sampled are close to 1700 meters. The distance of these last two chloride outflows from either the Sikidang or Pagerkandang fumarolic area is about '^.5 Km and if the elevation of Sileri (l875 m) is assumed to be the elevation of the top of the Pagerkandang reservoir, the gradient of hot-wat< r flow from Pagerkandang to Pulosari is about h%. A similar gradient assumed towards Sikidang results in an estimated elevation of about 1850 meters for the top of that reservoir.
Based on these estimates, drill holes 200 m deep in the Pagerkandang area would intercept the reservoir. More information will be gained from holes deeper than 250 meters that penetrate well into the reservoir, The Sikidang reservoir may be nearer the surface. No estimates can be made for the Tjandradimuka reservoir because the elevation of its chloride outflow, which is probably to the north into the Kitiran river, (see river survey), is unknown.
SUBSURFACE TEMPERATURE
The use of chemical analyses of surface springs to estimate subsurface temperatures has recently been reviewed by White (1970). The mo-'t useful geothermometers are the silica content (which has been shown for hot springs and geothermal wells to be related to saturation with quartz in the geothermal reservoir; Fournier and Rowe, 1966) and alkali (and alkali earth) ratios (which reflect equilibrium with various minerals in the reservoir).
The geothermal fluids that could be sampled at the surface in the Dieng Mountains probably have been greatly diluted by meteoric water, and accordingly the chemical indices of subsurface temperature are of uncertain, but probably low, reliability. Nevertheless, temperature; at depth in excess of 200°C are suggested.
In using the silica geothermometer on the Dieng hot-spring waters, the dilution with cooler low-silica surface waters must be corrected for. The Pulosari spring (analysis 22, table 2) is the highest in chloride and is considered to be the best available sample of the deep water. Its temperature of 55°C indicates that it has undergone a considerable dilution with near-surface water, assumed to be nt 20°C and to contain about 15 ppm Si02 (the calculation is not materially changed by assuming twice this). If the deep water cooled to boiling (93°C at this elevation) by steam separation, we can calculate for the fraction, x, of hot water:
93 x + 20(l-x) = 55
x = O.U8
For the silica content (177 ppm in the mixture),
O.U8y + 0.52(15) = 177
y = 352 mg/1 Si02
This gives an indicated temperature (fig. U) of 203°C (Fournier and Rove, 1966). Other samples of the deep fluid (e.g., Sileri) have undergone an unpredictable amount of evaporation and possibly have precipitated some silica near the surface. The silica content of Sileri dropped between the sampled vent (analysis 20, table 2) and the outflow (analysis 21, table 2), even though the chloride content increased.
The use of alkali ratios to estimate the underground temperature of the Dieng geothermal system is even less satisfactory. Comparison of Na/K ratios of Dieng waters with published curves (e.g., White, 1970, fig. 3) gives temperatures that are unrealistically and unreasonably high (>U50°C) The failure of this index is due to the presence of abundant Ca in the waters (and presumably in the minerals of the reservoir rocks). Curves that relate various functions of Ca, Na, and K to temperature are currently being developed by R. 0. Fournier and the writer. Comparison of the Dieng data with these preliminary curves suggests that underground temperatures are in the vicinity of 200°C.
Both silica and alkali temperatures represent the temperature at a depth at which the geothermal fluid last had a residence time sufficiently long for the rocks and water to react thoroughly. Therefore, any deeper (and possibly hotter) reservoir may well not be detectable by chemical indices.
Figure
700 -Curve B Curve A
250 0 303"ppm S102
800900
1,000 1,100 1,200
Si0 2 , Curve B 261*C 272 282 293 30A
00 - 239' 273
500
2 £ 400
. 226 252
- 211 232
300
200
100
- 193 209
- 169
100 130 2OO 230 TEMPERATURE
300
Figure 4. Si 0^ coftctntrfltlout In thermal waters versus ctemperature
9a
10
CHEMICAL CHARACTER OF THE GEOTHERMAL FLUID
Production problems that may result from the chemistry of the geothermal fluid include corrosion of the well-liner and turbine by fluids of high acidity, deposition of silica or calcite in the well and attack of electrical equipment by sulfur gases. Without direct samples of the reservoir fluid it is not possible to know whether mineral deposition will become a problem. It is, however, possible to make some preliminary remarks on acidic corrosion and attack by gases.
In high temperature gases from active volcanoes halogen acids and oxides of sulfur are present, often in considerable abundance. Some quantity of these same gases presumably enters the base of geothermal systems along with heat and is dissolved in the geothermal fluid. If the acids produced are not neutralized, they can corrode and shorten the working life for the well casing and possibly the steam separators and turbines and thus constitute an almost insuperable problem in the development of the system. In an area in Taiwan known to the writer, these acid conditions probably occur at depth. The reservoir is a clean quartz sandstone without the capacity to neutralize acid. HC1 occurs in springs and along with S02 as a component of fumarole gases. Springs of large discharge have pH values below 2 and fumarole condensates have pH values near 1 and contain up to UOO mg/1 chloride.
Possible acidity of the Dieng geothermal fluid
With this background considerable attention was paid in the preliminary geochemical survey of the Dieng to look for evidence of deep acidity. The Tertiary sediments exposed in nearby areas and assumed to underlie the Dieng volcanics at unknown depth consist of tuffaceous sandstones with plentiful feldspar, volcanic breccias and minor marl and clay (Keith Ketner, personal communication). The volcanic pile itself consists largely of andesite pyroclastics and tuffs (Van Bemmelen, 1937). These rocks are considered to have ample neutralizing capacity. Fumarole condensates were analyzed for pH and chloride with the results shown in table U. All fumarole condensates except one contained less than 6 mg/1 chloride and all had a pH above 5-5. The 20 mg/1 Cl measured at TJandradimuka is probably high due to interference by ammcnia. The flowing springs also show near neutral pH and only a few where oxidation of ^S to sulfuric acid has probably occurred show lower pH values. There is evidently no problem with deep acidity in the Dieng.
Attack of equipment by hydrogen sulfide
In the Sikidang and TJandradimuka systems ^S is relatively abundant and copper switches would show attack. In the Pagerkandang system, however, H 23 Ls noticeable only to a minor degree near Sileri and not
Table U. Analyses of fumarole condensates (ppm).
Field No.
Location
JT 13
Pagerkandang
north fumarole
JT 19
Siglagah
fumarole
JT 22
Tj andradimuka
fumarole
B
Cl
15
0.01
0.7
0.7
<0.01
0.6
256
0.25
6.2
lOa
11
at all elsewhere. The abundant iron oxide deposited by cold springs and abundant pyrite in the altered and disturbed rock in the Sileri area indicate that sulfur is being removed by reaction with iron. This process will probably continue during exploitation. Thus, attack by H2S of electrical contacts during the exploitation of the Pagerkandang should be minimal.
Salinity of geothermal fluid
The salinity of the deep fluid may be approximated from the temperature and chloride content of the Pulosari spring. This may allow an estimate of the underground temperature to be made from conductivity measurements by the geophysical team, Drs. Pritchard and Jacobson. It was calculated earlier that Pulosari spring contains O.U8 fraction of deep geothermal fluid.
Now considering the chloride,
O.U8x + 0.52(20) = U?2x = 960 mg/1 Cl
Steam separation during the adiabatic cooling from about 200°C to 93°Cv.ill have concentrated the chloride in the water by about 1.25 timesro the geothermal fluid at depth would have contained TOO mg/1 chloride,
Possible pollution by geothermal effluent
The possible effect on the growing of tobacco and rice by irrigation with diluted geothermal effluent has been briefly considered. The deep geothermal fluid may have U to 17 mg/1 Boron (see analyses 20-22, table 2). It has been found that rice needed at least O.U mg/1 B and that concentrations of more than 20 mg/1 were toxic (Tokuoka and Morooka, 1936a and b). Tobacco shows Boron deficiency below 3 mg/1 and toxicity is developed with more than 6 mg/1 (Kuijper, 1930; Meurs, 1932). Symptoms of boron poisoning become noticeable when public water supplies exceed 30 ppm.
Tt is considered on the basis of these studies that few problems will 'jccur from the Boron content of these waters in an area of as high rainfall as the Dieng because considerable dilution by rainwater will occur. When samples of deep water are available analyses for components such as arsenic (requiring large samples) may be made and their possible effects considered.
RATE OF NATURAL ENERGY PRODUCTION
The rate of natural energy production is of some importance in predicting the mo.ximum rate of sustained production of a geothermal field. Most
geothermal systems that have been thoroughly studied (Wairakei, New Zealand; Steamboat Springs, Nevada; Yellowstone Park) have maintained some rate of thermal activity over a span of tens to hundreds of thousands of years. The rate of natural energy outflow in these is thus approximately equal to the rate of the replenishment of the reservoir with heat and water. Withdrawal during production usually exceeds the rate of natural outflow by several times (e.g., 5 tiu,-*s at Wairakei, New Zealand); this of course leads to declining pressures and a finite production life.
The estimation of natural heat flow in the Dieng is complicated by the predominately fumarolic character of the activity. Measurements of fumarole flow have been made in New Zealand with specialized equip ment, but visual estimation is essentially impossible. The estimation of flow of hot water is relatively easy and an attempt will be made to estimate the ratio of heat content to chloride content in the geotheraai fluid as soon as exploratory drilling yields temperatures and samples of the fluid. Temperatures, volume of discharge, and heat flows of all the observed hot springs of the Dieng are shown in table 6, and estimates of the amount of heat escaping into rivers are given in table T. These crude estimates do not contain the heat escaping as vapor and may be low by perhaps 100/S.
COMPARISON OF USGS AND GSI CHEMICAL ANALYSES
When this project was begun I was not aware of the analytical chemistry facilities of the GSI, and arranged that ah indefinite number of analyses be done in the laboratories of the U.S. Geological Survey at Menlo Park by our best analyst, Mrs. Roberta Barnes. Because of other demands on her time, I reduced these to a bare minimum of four complete and three partial analyses and was delighted to have other analyses, particularly those of river waters, done in the GSI laboratories in Bandung. Considering the handicaps suffered by these laboratories, especially the lack of modern instruments, their results have been quite creditable. Comparisons of the two sets of analyses may serve to indicate which GSI procedures could be improved, possibly by the purchase of more modern equipment.
These comparisons are based on samples of Pulosari spring (analyses 12 and 22, table 2), Sileri outflow (analyses 8 and 21, table 2; analysis 13 is of a sample collected later), and Kali Tulis (analyses ^ a^d 8, table 3; analyses 2 and T are from different locations on the river). The two Pulosari analyses are almost identical in Cl and within about 10*-15/& in K, Ca, Mg and SOi*. The results for Na, HC03 , and Si02 , however, differ by 30/S. The Sileri outflow analyses are almost identical in K, Ca, SOi*, and Fe, but Cl, Si02 , Mg, Na, and HCOs differ by more than 30/t. The analyses of Kali Tulis are similar in Cl and K. but differ significantly in Na and
> ' - "
;
Analyses of rivi.-r
vatt
-r.:
in
:.;. /
vieii.it./
Number
Location
Field
No.
Lab.
No
.
Collection
temperature
F=field
FH L=lab
Na
~r Ca Mg
+3Fe
total
as Fe
Mn Cl S°U
HCO
Si02
Cati
on
millieq./l
An ion
millieq. /I
1 2
K. Do
lok
K. Tu
lis
ov
\4
1873
/70
1878/70
_ _
__
ATT
na
O.I L
U.5
5.1
0.8
l.U
6.1
na
9.2
na
0.0
na
0.0
na
11.0
9.
2
0.0
na
7U.6
na
50.0
22
.5
1.3
1.8
3 U
5
K. Dolok
K. Tulis
K. Ar
us
5 Pt
22k
1879
/70
1880/70
1881
/70
__
na
na
na
11.7
57.5
10.8
8.2
18.7
U.3
na
na
na
na
na
na
na
na
na
na
na
na
60.7
175
22.1
na
na
na
na
na
na
U2
128
5U
6
K. La
mpir
kkl
1898/70
8.1
L
U.I
5.5
6.1
1.8
0.3
0.0
11.0
33.5
51.1
26 O.TU
1.8
7
K. Tulis
kk2
1899
/70
7.3
L
32.0 9.8
30.3 7.3
0.8
0.2
25.8
167
lUl 66 3.
2
6.5
8*
K. Tu
lis
JT36
2168 26°C
6.0
F 7.
9 L
32 16 66 22 l.U
na
160 56 71 79 6.
9
6.8
*JT36
analysis
in
pp
m.
Also
0.
26 ppm
NH,
, 0.
01 ppm
Li,
0.2
ppm
Sr,
and
2.3
ppm
B.
Analysis (No. 8)
by R.
Barnes,
USGS
. Ot
her
analyses (1
-7)
by GS
I.
Table 6. Minimum heat flow estimates (relative to 20°C) of liquid water.
Spring
Sileri
Bitingan
near Siglagah
Pulosari
Chloride
mg/1
173
20
20
U26
Flow
I/sec
50
35
20
10
Temperature
°C
55
79,82
56
55
Heat/chloride Ker «
Kc al /mg Cl KC i»l / : - .
0.20* 17 t s
* 21 r"'
_ #
0.08U ^
* Large fumarolic contribution
12b
Table 7. Minimum heat flow estimates from chloride production
(minimum because much chloride production undoubtedly not measured)
River or spring
Seraju
Lampir
Arus
Kitiran
Tulis
Dolok
Pulosari
Bitingan
near Siglagah
TOTAL
Geothermal chloride*
mg/sec
1750*
U500*
6750*
9000*
17500*
15000*
H260**
700**
Uoo**
cr\Qfr\
Heat flow at
0.08U Kcal/mg
Kcal/sec
lU7
378
567
756
1H70
1260
357
59
3U
r» /«\ ^> O
* From Table 5
** From Table 6
13
In general the analyses for Na and Si02 are consistrntly diffferent and Mg, HC0 3 and Cl sometimes give trouble. Analyses for K, Ca, Fe, and SO^ seem quite reasonable.
Silica analyses may be improved by dilution in the field and use of the molybdate blue method with a colorimeter. New equipment, possibly a flame photometer, also may be necessary for consistent Na and Mg analyses but better technique should solve the problems with Cl and
REFERENCES CITED
Fournier, R. O.,and Rowe, J. J., 1966, Estimation of underground temperatures from the silica content of hot springs and wet steam wells: Amer. Jour. Sci., v. 26U, p. 685-697.
Kuijper, J., 1930, Boorzuur legen die Topziekte van der tabak: Deli Proefstation te Medan Sumatra Vlugschrift, no. 50.
Meurs, A., 1932, Bestridden en voorkomen van Topziekte: Deli Proefstation te Medan Sumatra Vlugschrift, no. 59.
Muffler, L. J. P., 1970, Geothermal potential of the Dieng mountains,' Central Java, Indonesia: U.S.G.S. Open file report, Indonesian investigations, (IR) IND-3, 22 p.
Purbo-HadiwidjoJo, M. M., 1968, The mineral springs of Java, Indonesia: Contrib. Dept. Geol. Ilust. Tech. Bandung No. 67, p. 53-60.
Tokuoka, M., and Morooka, H., 1936a, Uber der Einfluss des Bors auf den Wachstum der Reispflanze: I. Die Wachstum hemmende Wirkung des Bors: Jour. Sci. of Soil and Manure, Japan, v. 10, p. 189-200.
Tokuoka, M., and Morooka, H., 1936b, Die Wachstum fQrderne Wirkung des Bors: Jour. Tropical Agric., Taihoku Univ., v. 8, p. 211-220.
Van Bemelen, R. W., 1937, Geologische Karte van Java (Schall 1:100,000). Toelichting by Rlad 66 (Karangkobar): Dienst van den Mijnbouw in Nederlandsche Indie, 51 p. (in Dutch).
White, D. E., 1970, Geochemistry applied to the discovery, evaluation and exploitation of geothermal energy resources: United Nations Symposium on the Development and Utilization of Geothermal Resources, Rapporteur Report, Section V.


![(1) DISTRICTS) BILL (2) - parliament.wa.gov.au · 388[ASSEMBLY] Mr Bertranm Mr Bryce Mr B. T. Burke Mr T. J. Burke Mr Carr Mr Davies Mr H. D. Evans Ayes Mr Laurance Mr Rushton Mr](https://static.documents.pub/doc/80x56/5b407eb07f8b9aff118d53d3/1-districts-bill-2-388assembly-mr-bertranm-mr-bryce-mr-b-t-burke.jpg)


