1382859_3 June 10, 2013 Mr. James Belsky, Permit Chief MassDEP Northeast Region 205B Lowell Street Wilmington, MA 01887 Re: Second Supplement to Major Comprehensive Plan Application – Salem Harbor Redevelopment (SHR) Project (Transmittal Number X254064) Dear Mr. Belsky: This Second Supplement to the Major Comprehensive Plan Application submitted on December 21, 2012, as supplemented by the First Supplement (“First Supplement” dated April 12, 2013 (collectively, the “Plan Application”) is being submitted on behalf of Footprint Power Salem Harbor Development LP (“Footprint”). This Second Supplement updates the Plan Application: (1) to reflect Footprint’s selection of GE as the turbine vendor for the SHR Facility; and (2) to provide additional information requested by the Department as set forth in the First Supplement. Footprint has selected the GE Energy 107FA.05 Rapid Response Combined Cycle Plant for the SHR Facility. Accordingly, Footprint is now able to update the emissions profile for the Facility to more accurately reflect equipment-specific proposed conditions. That is, Footprint’s previous emissions modeling was based on a “worst case equipment envelope” which encompassed the highest emissions values for both the GE and Siemen’s equipment options. The selection of GE as equipment vendor allows Footprint to model emissions based upon data specific to the GE 107FA.05 equipment to be utilized at the SHR Facility, and based upon data that are specific to proposed operations at the SHR Facility. Highlights of key changes to the Plan Application are as follows: • Annual emissions (tons per year) are the same or less than previously proposed. Importantly, the modeling results also show that emissions from the SHR Facility now will be below the SILs for PM 10 and for annual PM 2.5 • With selection of the GE 107FA.05 combined cycle plant, the proposed GHG BACT value is reduced from 842 to 825 lb/MWhr. This is based on the projected “new and clean” full load ISO corrected heat rate for each GE-based combined cycle unit of 6,940 Btu/kWhr. This is also based on higher heating value (HHV), and net output to the grid. Using the EPA Part 75 default CO 2 emission factor of 118.9 lb/MMBtu, this corresponds to 825 lb/MWhr. This is for “new and clean” conditions, full load, and corrected to ISO conditions.
Transcript
1382859_3
June 10, 2013 Mr. James Belsky, Permit Chief MassDEP Northeast Region 205B Lowell Street Wilmington, MA 01887 Re: Second Supplement to Major Comprehensive Plan Application –
Salem Harbor Redevelopment (SHR) Project (Transmittal Number X254064) Dear Mr. Belsky: This Second Supplement to the Major Comprehensive Plan Application submitted on December 21, 2012, as supplemented by the First Supplement (“First Supplement” dated April 12, 2013 (collectively, the “Plan Application”) is being submitted on behalf of Footprint Power Salem Harbor Development LP (“Footprint”). This Second Supplement updates the Plan Application: (1) to reflect Footprint’s selection of GE as the turbine vendor for the SHR Facility; and (2) to provide additional information requested by the Department as set forth in the First Supplement. Footprint has selected the GE Energy 107FA.05 Rapid Response Combined Cycle Plant for the SHR Facility. Accordingly, Footprint is now able to update the emissions profile for the Facility to more accurately reflect equipment-specific proposed conditions. That is, Footprint’s previous emissions modeling was based on a “worst case equipment envelope” which encompassed the highest emissions values for both the GE and Siemen’s equipment options. The selection of GE as equipment vendor allows Footprint to model emissions based upon data specific to the GE 107FA.05 equipment to be utilized at the SHR Facility, and based upon data that are specific to proposed operations at the SHR Facility. Highlights of key changes to the Plan Application are as follows:
• Annual emissions (tons per year) are the same or less than previously proposed. Importantly, the modeling results also show that emissions from the SHR Facility now will be below the SILs for PM10 and for annual PM2.5
• With selection of the GE 107FA.05 combined cycle plant, the proposed GHG BACT value is reduced from 842 to 825 lb/MWhr. This is based on the projected “new and clean” full load ISO corrected heat rate for each GE-based combined cycle unit of 6,940 Btu/kWhr. This is also based on higher heating value (HHV), and net output to the grid. Using the EPA Part 75 default CO2 emission factor of 118.9 lb/MMBtu, this corresponds to 825 lb/MWhr. This is for “new and clean” conditions, full load, and corrected to ISO conditions.
Mr. James Belsky, Permit Chief Page 2
• The site layout has been modified slightly, and the auxiliary boiler flue will now be located in the main stack rather than the separate 125’ stack that was previously proposed.
In addition, this Second Supplement also provides additional information identified in the First Supplement as items 4, 5 and 7, and addresses item numbers 8, 9, 14 and 15. These items are as follows:
4. Additional information on evaluation of energy conservation improvements suggested by the Massachusetts Department of Energy Resources (DOER). 5. Additional information on start-up emissions and durations and all emissions expressed on an energy output basis (in units of lb/MW-hr).
7. Update on the required emissions offsets. 8. Final air quality impact modeling based on the selection of GE as turbine vendor with final site configuration and including GE Lynn and Wheelabrator Saugus as interacting sources for PM and NOx and Rousselot, Peabody Municipal Light, and Marblehead Municipal Light as interacting sources for 1-hour NOx. 9. A more detailed analysis of federal environmental justice (EJ) considerations in support of the PSD application. 14./15. Final acoustic documentation and modeling for the facility based on the turbine vendor selected, and the final site layout and noise mitigation plan.
Attachment 1 provides updated copies of the relevant tables of the Plan Application. Attachment 2 provides updated Application forms. Attachment 3 provides updated emission calculations. Attachment 4 provides the Environmental Justice (EJ) analysis. Attachment 5 provides an updated site layout. Attachment 6 provides noise analysis details. With respect to item 16 (more robust analysis of the costs and benefits of alternative noise mitigation techniques), this will be provided under separate cover. 4.c) Energy Efficiency Improvements Suggested by DOER
In its comments on the Draft EIR, DOER suggested several energy efficiency improvements in order to reduce the plant parasitic load. The improvements suggested are: high efficiency exterior and industrial interior lighting, variable speed electric drives and motors, piping and valve design to reduce pressure losses, and use of premium efficiency transformers. With respect to exterior and industrial interior lighting, this was evaluated in the First Supplement.
Mr. James Belsky, Permit Chief Page 3
With respect to variable speed electric drives and motors, engineering evaluations have been completed and it has been determined that variable speed drives will be used for all the ACC fan motors and the primary boiler feedwater pump and condensate pump motors. This will capture the energy efficiency of variable speed drives for this equipment. For the fuel gas compressors, the type of rotary screw compressors that will be used will be equipped with a proprietary control system that uses a combination of an inlet slide valve and “spill back” valve to adjust the flow and pressure. This variable control system enables the rotary screw compressor to substantially reduce power consumption from the level at maximum flow and pressure ratio to lesser power at reduced flows and pressure ratio. At lower than design flow and/or pressure ratio the performance adjustment is not made by throttling away the extra capacity with a simple pressure control valve. Compressor power varies essentially linearly with flow across most of the operating range down to about 25% of maximum load. The result is that variable frequency drives (VFD’s) are neither suitable nor cost beneficial for application to rotary screw type gas compressors. With respect to piping and valve design to reduce pressure losses, this will be one of the key design considerations for GE and the EPC contractor in detailed plant design. With respect to premium efficiency transformers, the project will use the highest efficiency commercially available transformers that are compatible for interconnection with the National Grid switchyard. 5. Additional information on start-up emissions and durations and express all emissions on an energy output basis (in units of lb/MW-hr) 5.a) Startup Emissions Table 5-3 of the Plan Application has been updated (see Attachment 1) to reflect GE’s latest startup/shutdown emissions performance estimates. This is expressed in pounds of emissions over 45 minutes for startup and over 27 minutes for shutdown. This is estimated performance for the project based upon best engineering estimates and we expect the installed equipment will meet these standards. However, since various site-specific equipment factors can influence the actual startup/shutdown emissions, Footprint is requesting that the limits in Table 5-3 be subject to revision based upon review of the stack test data and CEMS data for the first year of operation. The Pioneer Valley Energy Center Plan Approval contains a provision to this effect (page 35 of 54, Table 11, footnote 3). 5.b) Proposed Emission Limits – Energy Output Basis Proposed emission limits on an energy output basis are provided in Table 2 below. These proposed limits are based on the proposed heat rate for the selected GE turbine (6,940 Btu/kWhr net). These limits are proposed to apply to full load operation, “new and clean,” to be demonstrated by an initial stack test, with the turbine heat rate corrected to ISO conditions.
Mr. James Belsky, Permit Chief Page 4
Short-Term Emission Rates for Turbine and HRSG Units – Energy Output Basis
Pollutant
pounds/MWhr corrected to ISO
conditions
NOx 0.051
CO 0.031
VOC, unfired 0.009
VOC, duct-fired 0.015
SO2 0.010
PM 0.04
PM10 0.04
PM2.5 0.04
NH3 0.019
7. Update on the emissions offsets
To date, Footprint has secured 194 tons per year (tpy) of offsets. Given the efficiency of the GE equipment, the number of offsets required is now reduced to 183 tpy. Accordingly, Footprint has secured the necessary quantity of offsets. As recorded in the latest Massachusetts ERC Registry dated February 13, 2013, 59 tpy were purchased from the Newark Group on February 4, 2013 (22 tpy from a shutdown at Haverhill Paperboard and 37 tpy from a shutdown at Natick Paperboard). Footprint has entered into a contract to purchase another 135 tpy from a prior source shutdown in Rhode Island and the transfer is expected to be recorded in the ERC Registry soon.
8. Final air quality impact modeling based on the plant with the selected turbine
vendor and final site configuration and including GE Lynn and Wheelabrator Saugus as interacting sources for PM and NOx and Rousselot, Peabody Municipal Light, and Marblehead Municipal Light as interacting sources for 1-hour NOx
The final air dispersion modeling results are provided in the relevant tables in Attachment 1. In all cases, the impacts of the proposed facility decrease compared to those submitted in the Plan Application. The current modeling also includes GE Lynn and Wheelabrator Saugus as interacting sources for PM and NOx and Rousselot, Peabody Municipal Light, and Marblehead Municipal Light as interacting sources for 1-hour NOx.
Mr. James Belsky, Permit Chief Page 5
9. A more detailed analysis of federal environmental justice (EJ) considerations in support of the PSD application
The expanded EJ analysis is provided in Attachment 4.
14. Final acoustic modeling for the facility based on the turbine vendor selected, and the final site layout and noise mitigation plan
Final acoustic modeling results are provided in the revised acoustic impact Table 9-4 in Attachment 1. In all cases, the maximum predicted facility impact remains no more than 6 dBA over the ambient background. The revised site layout is provided in Attachment 5.
15. Acoustic data for key plant equipment used in the final acoustic modeling Detailed equipment acoustic data is provided in Attachment 6.
16. A more robust analysis of the costs and benefits of alternative noise mitigation techniques
The requested analysis of alternative noise mitigation techniques will be provided under separate cover. If you have any questions, please contact either me at (617) 803-7809 or George Lipka at (617) 443-7568. Sincerely,
Keith H. Kennedy Senior Consultant – Energy Programs
Attachments
ATTACHMENT 1
CPA/PSD APPLICATION AIR AND NOISE TABLE UPDATES
SECOND APPLICATION SUPPLEMENT
Table 3-1 Short-Term Emission Rates for Turbine and HRSG Units Pollutant ppmvd at 15% O2 lb/MMBtu lb/hr (per CTG+HRSG)
Table 3-5 Total CO and VOC Mass Emissions Per Combustion Turbine Startup/Shutdown
Pollutant
Cold Startup + Shutdown
(lbs) Warm Startup + Shutdown (lbs) Hot Startup +
Shutdown (lbs)
CO 436 280 272
VOC 52 42 41
Table 3-6 HAP and Massachusetts Air Toxics Potential Emissions
Pollutant HAP? AAL/TEL?
Emission Factor (lb/MMBtu) Max.
Total tpy CT1 CT2 Aux. Blr. Em. Gen. Fire
Pump
Organic Compounds
Acetaldehyde Y Y 4.0E-05 2.52E-05 7.67E-04 0.8
Acrolein Y N 6.4E-06 7.88E-06 9.25E-05 0.1
Benzene Y Y 1.2E-05 2.1E-06 7.76E-04 9.33E-04 0.2
1,3-Butadiene Y Y 4.3E-07 3.91E-05 8.2E-03
Dichlorobenzene Y Y 1.2E-06 3.1E-04
Ethylbenzene Y Y 3.2E-05 0.6
Formaldehyde Y Y 3.5E-04 7.4E-05 7.89E-05 1.18E-03 6.6
Hexane Y N 1.8E-03 0.5
Propylene oxide Y Y 2.9E-05 3.85E-03 3.56E-03 0.5
Toluene Y Y 1.3E-04 3.3E-06 2.81E-04 4.09E-04 2.5
Xylene Y Y 6.4E-05 1.93E-04 2.85E-04 1.2
PAH
Acenaphthene Y N 1.8E-09 4.68E-06 1.42E-06 6.2E-06
Acenaphthylene Y N 2.4E-09 9.23E-06 5.06E-05 3.1E-05
Anthracene Y N 1.8E-09 1.23E-06 1.87E-06 2.6E-06
Benzo(a)anthracene Y N 1.8E-09 6.22E-07 1.68E-06 1.8E-06
Benzo(a)pyrene Y N 1.2E-09 2.57E-07 1.88E-07 6.7E-07
Benzo(b)fluoranthene Y N 1.8E-09 1.11E-06 9.91E-08 1.7E-06
Benzo(g,h,i)perylene Y N 1.2E-09 5.56E-07 4.89E-07 1.1E-06
Benzo(k)fluoranthene Y N 1.8E-09 2.18E-07 1.55E-07 7.7E-07
Chrysene Y N 1.8E-09 1.53E-06 3.53E-07 2.3E-06
Dibenz(a,h)anthracene Y N 1.2E-09 3.46E-07 5.83E-07 9.3E-07
7,12-Dimethylbenz(a) anthracene Y N 1.6E-08 4.1E-06
Fluoranthene Y N 2.9E-09 4.03E-06 7.61E-06 8.3E-06
Pollutant HAP? AAL/TEL?
Emission Factor (lb/MMBtu)
Max. Total tpy CT1 CT2 Aux. Blr. Em. Gen.
Fire Pump
Fluorene Y N 2.7E-09 1.28E-05 2.92E-05 2.7E-05
Indeno(1,2,3-cd)pyrene Y N 1.8E-09 4.14E-07 3.75E-07 1.1E-06
3-Methylchloranthrene Y N 1.8E-09 4.6E-07
2-Methylnaphthalene Y Y 2.4E-08 6.2E-06
Naphthalene Y Y 1.3E-06 6.2E-07 1.30E-04 8.48E-05 2.5E-02
Phenanthrene Y N 1.7E-08 4.08E-05 2.94E-05 6.2E-05
Pyrene Y N 4.9E-09 3.71E-06 4.78E-06 7.3E-06
TOTAL PAH Y N 2.2E-06 6.8E-07 2.12E-04 1.68E-04 4.2E-02
Metals/Inorganics
Ammonia N Y 0.0027 51.0
Arsenic Y Y 2.0E-07 4.62E-08 4.62E-08 5.2E-05
Beryllium Y Y 1.2E-08 3.1E-06
Cadmium Y Y 1.1E-06 5.13E-09 5.13E-09 2.8E-04
Chromium Y Y 1.4E-06 1.24E-05 1.24E-05 3.8E-04
Chromium VI Y Y 2.5E-07 2.24E-06 2.24E-06 1.4E-09
Cobalt Y N 8.2E-08 2.2E-05
Copper N Y 8.3E-07 2.2E-04
Lead Y Y 4.9E-07 7.69E-07 7.69E-07 1.3E-04
Manganese Y N 3.7E-07 2.82E-07 2.82E-07 9.8E-05
Mercury Y Y 2.5E-07 1.03E-08 1.03E-08 6.7E-05
Nickel Y Y 2.1E-06 1.48E-06 1.48E-06 5.4E-04
Selenium Y Y 2.4E-08 2.56E-07 2.56E-07 6.6E-06
Sulfuric Acid N Y 0.001 0.00012 0.00012 0.00012 19.0
Vanadium N Y 2.3E-06 5.9E-04
Maximum single HAP, facility-wide tpy 6.6
Total for all HAP, facility-wide tpy 13.1
Notes: 1. Blank entry (shaded) indicates no emission factor reported in the reference cited. 2. Emission factors for CT1 and CT2 are from Table 3.1-3 of AP-42 except for formaldehyde which is based on
expected performance for new lean pre-mix combustion turbines. H2SO4 is based on 67% of SO2 emissions (mass basis).
3. Emission factors for the auxiliary boiler are from AP-42 Tables 1.4-3 and 1.4-4. 4. Emission factors for organics for the emergency diesel generator and fire pump are from AP-42 Tables 3.4-3
and 3.4-4 for the emergency generator and Table 3.3-2 for the fire pump. 5. Metal emissions for the emergency generator and fire pump are based on the paper “Survey of Ultra-Trace
Metals in Gas Turbine Fuels”, 11th Annual International Petroleum Conference, Oct 12-15, 2004. Where trace metals were detected in any of 13 samples, the average result is used. Where no metals were detected in any of 13 samples, the detection limit is used.
Pollutant HAP? AAL/TEL?
Emission Factor (lb/MMBtu)
Max. Total tpy CT1 CT2 Aux. Blr. Em. Gen.
Fire Pump
6. Hexavalent chrome for the aux boiler, emergency generator and fire pump are based on 18% of the total chrome emissions based on EPA 453/R-98-004a).
7. H2SO4 emissions for aux boiler, emergency generator and fire pump are based on 8% of SO2 emissions (mass basis).
Table 4-1 National and Massachusetts Ambient Air Quality Standards
Pollutant Averaging Period
NAAQS/MAAQS (µg/m3) Significant Impact Level
(µg/m3) Maximum Predicted SHR
Project impact Primary Secondary NO2 Annual1 100 Same 1 0.4 1-hour2 188 None 7.5 41.8 SO2 Annual1, 3 80 None 1 0.03 24-hour3, 4 365 None 5 0.7 3-hour4 None 1,300 25 1.1 1-hour5, 6 196 None 7.8 1.0 PM2.5 Annual7 12 Same 0.3 0.12 24-hour8 35 Same 1.2 3.2 PM10 24-hour9 150 Same 5 4.3 CO 8-hour4 10,000 None 500 112.4 1-hour4 40,000 None 2,000 313.6 O3 8-hr10 147 Same NA NA Pb 3-month1 0.15 Same NA <0.00016 1 Not to be exceeded. 2 Compliance based on 3-year average of the 98th percentile of the daily maximum 1-hour average at each monitor within an area. 3 The 24-hour and annual average primary standards for SO2 will be revoked. 4 Not to be exceeded more than once per year. 5 Compliance based on 3-hear average of 99th percentile of the daily maximum 1-hour average at each monitor within an area. 6 The 1-hour SO2 standard was effective as of August 23, 2010. 7 Compliance based on 3-year average of weighted annual mean PM2.5 concentrations at community-oriented monitors. 8 Compliance based on 3-year average of 98th percentile of 24-hour concentrations at each population-oriented monitor within an
area. 9 Not to be exceeded more than once per year on average over 3 years. 10 Compliance based on 3-year average of fourth-highest daily maximum 8-hour average ozone concentrations measured at each
monitor within an area.
Table 4-2 Prevention of Significant Deterioration Regulatory Threshold Evaluation
Pollutant Project Annual
Emissions (tons) PSD Major Source Threshold (tons)
PSD Significant Emission Rate (tons)
PSD Review Applies
CO 106.4 100 100 Yes
NOx 144.8 100 40 Yes
SO2 28.8 100 40 No
PM 109.4 100 25 Yes
PM10 109.4 100 15 Yes
PM2.5 109.2 100 10 Yes
VOC (ozone precursor) 28.0 100 40 No
Lead 0.00013 100 0.6 No
Fluorides Negligible. 100 3 No
Sulfuric Acid Mist 18.8 100 7 Yes
Hydrogen Sulfide (H2S) none expected 100 10 No
Total Reduced Sulfur (including H2S) none expected 100 10 No
Reduced Sulfur Compounds (including H2S) none expected 100 10 No
GHGs (as CO2e) 2,279,530 100,000 75,000 Yes
Table 5-1 Top Case BACT Emission Limits
Pollutant Emission Limitation BACT Determination Control Technology
NOX 2.0 ppmvd @ 15% O2
MassDEP Top Case BACT Guidelines for Combined Cycle Turbine > 10 MW (June 2011)
• Dry Low NOx Combustor
• SCR
• Oxidation Catalyst
NH3 2.0 ppmvd @ 15% O2 CO 2.0 ppmvd @ 15% O2
VOC1
1.0 ppmvd @ 15% O2 without duct firing
1.7 ppmvd @ 15% O2 with duct firing
1The Top Case VOC BACT value in the MassDEP Top Case BACT Guidelines is 1.7 ppmvdc. The vendor guaranteed VOC emission rate with duct firing is 2.0 ppmvdc. MassDEP has more recently approved a similar project (Brockton) for 2.5 ppmvdc. Therefore, Footprint Power is proposing a VOC BACT emission limit of 2.0 ppmvd @ 15% O2 with duct firing.
Table 5-3 Startup and Shutdown Emission Limits (lbs per event)
stack) 1 1 1 3 Predominant Land Use Type Rural Rural Rural Rural Rural Stack Location (in NAD83): UTM-E (m) UTM-N(m)
345,732.6 4,709,832.6
345,738.1 4,709,835.2
345,736.1 4,709,846.0
345,760.2 4,709,848.0
345,837.0 4,709,808.2
Table 6-3 Turbine Load Scenarios and Emission Rates
Turbine Manufacturer GE GE GE GE Operating Load 100% 75% 46% Startup Ambient Temperature (deg F) 90 20 20 50 Evap Cooler and Duct Firing Status ON OFF OFF OFF Combined Turbine and Duct Firing Rate (MMBtu/hr) (both turbines) 4898 3580 2720 2530
Table 6-9 Project Maximum Predicted Impact Concentrations Compared to Significant Impact
Levels (micrograms/cubic meter)
Pollutant Averaging
Period Maximum Predicted Salem Harbor
Redevelopment Project Impact SIL
PM10 24-Hour 4.3 5
PM2.5 24-Hour 3.2 1.2
Annual 0.12 0.3
NO2 1-Hour 41.8 7.5
Annual 0.4 1
SO2 1-Hour 1.0 7.8
3-Hour 1.1 25
24-Hour 0.7 5
Annual 0.03 1
CO 1-Hour 313.6 2000
8-Hour 112.4 500
Table 6-11 Salem Harbor Station Redevelopment Project NAAQS Compliance Assessment (micrograms/cubic meter)
Pollutant Averaging Period
Cumulative Impact Concentration1 Background Total Impact Plus
Background NAAQS
PM2.5 (µg/m3) 24-Hour 3.5 19.2 22.7 35
NO2 (µg/m3) 1-Hour <105.7* 82.3 <188* 188
• Note The interaction source impacts dominate the maximum total concentrations, so the results were reviewed to confirm that the proposed SHR facility does not significantly contribute to any modeled concentration at or above 105.7 ug/m3. This evaluation uses the EPA default 80% conversion of NOx to NO2.
Table 6-12 Salem Harbor Station Redevelopment Project PSD Increment Compliance Assessment (micrograms/cubic meter)
Pollutant Averaging Period Project Increment Consumption1
Maximum Allowable PSD Increment
PM2.5 (µg/m3) 24-Hour 4.2 9
1Consistent with modeling guidance for PSD increment compliance assessments, impact concentrations are based on the 5-year average of the 1st highest values occurring in each year for 24-hour and annual PM-2.5 concentrations, and the highest predicted concentration across 5 years for 24-hour PM-10 concentrations.
Table 6-13 Salem Harbor Station Redevelopment Project Maximum Project Impacts Compared to
DEP Air Toxics TELs and AALs (micrograms/cubic meter)
Annual (AAL) 0.00001 0.27 0.004% 1Most of the air pollutants that are regulated under the AAL/TEL program do not have ambient air quality standards. Lead is the one pollutant that is regulated under the AAL/TEL program and also has an AAQS.
Table 7-1 Vegetation Impact Screening Thresholds
Pollutants Averaging
Period Maximum Project Impacts (µg/m3)
NAAQS Secondary Standards (µg/m3
EPA’s 1980 Screening Concentrations (µg/m3)
SO2 1-hour 1.1 NA 917 3-hour 1.2 1300 786 Annual 0.03 NA 18
NO2 4-hour 41.81 NA 3760
1 month 41.81 NA 561 Annual 0.4 100 94
CO Week 112.41 NA 1,800,000 (weekly) PM10 24-hour 4.3 150 None
PM2.5 24-hour 3.2 35
None Annual 0.12 15
1 Conservatively based on shorter term average predicted concentration.
Table 7-2 Soils Impact Screening Assessment
Pollutant
Deposited Soil Concentration
(ppmw) Soil Screening Criteria (ppmw)
Percent of Soil Screening
Criteria
Plant Tissue Concentration
(ppmw)
Plant Screening
Criteria (ppmw)
Percent of Plant
Screening Criteria
Arsenic 3.02E-04 3 0.0 4.23E-05 0.25 0.0
Cadmium 1.63E-03 2.5 0.1 1.74E-02 3 0.6
Chromium 3.78E-03 8.4 0.0 7.56E-05 1 0.0
Copper 1.23E-03 40 0.0 5.76E-04 0.73 0.1
Lead 8.30E-04 1000 0.0 3.73E-04 126 0.0
Mercury 3.71E-04 455 0.0 1.85E-04 NA NA
Nickel 3.31E-03 500 0.0 1.49E-04 60 0.0
Selenium 7.08E-05 13 0.0 7.08E-05 100 0.0
Vanadium 3.40E-03 2.5 0.1 3.40E-05 NA NA
Note: Based in screening procedures described in Chapter 5 of the EPA guidance document for soils and vegetation, “A Screening Procedure for the Impacts of Air Pollution Sources on Plants, Soils, and Animals.”
Table 9-4. Predicted Noise Levels during Base Load Operation
Receptor Existing
Conditions Ambient L90
CCG Facility Total Increase Over
Ambient
1. 22 Fort Avenue 47 44 49 2
2. Block House Square/Derby Street 42 44 46 4
3. Bentley Elementary School 39 41 43 4
4. 36 Derby Street 39 43 44 5
5. 56 Derby Street South 39 44 45 6
6. 79 Naugus Avenue (Marblehead) 36 34 38 2
7. Winter Island Park 39 39 42 3
8. Winter Island Road 38 33 39 1
9. Blaney Street Pier on Salem Wharf 39 42 44 5
10. Mackey Building/Art Gallery 36 41 42 6
11. House of Seven Gables 39 37 41 2
12. Pickering Wharf 41 32 42 1
WITI-1 Plummer House 40 33 41 1
WITI-2 Winter Island Road Residences
34 33 38 4
ATTACHMENT 2
CPA/PSD APPLICATION CPA FORM UPDATES
SECOND APPLICATION SUPPLEMENT
Attachment 2 • 6/11 CPA-FUEL • Page 1 of 24
Massachusetts Department of Environmental Protection Bureau of Waste Prevention – Air Quality CPA-FUEL (BWP AQ 02 Non-Major, BWP AQ 03 Major) Comprehensive Plan Application for Fuel Utilization Emission Unit(s)
X254064
Transmittal Number N/A
Facility ID (if known)
Use this form for: • Boilers firing Natural Gas and having a heat input capacity of 40,000,000 British Thermal Units per hour (Btu/hr) or more. • Boilers firing Ultra Low Sulfur Distillate Fuel Oil and having a heat input capacity of 30,000,000 Btu/hr or more. • Emergency turbines with a rated power output of more than 1 Megawatt (MW) and/or in lieu of complying with 310 CMR
7.26(43) for engines or turbines as described at 310 CMR (43)2 and 3. • Other Fuel Utilization Units as specified at 310 CMR 7.02(5)(a)2. See the instructions for a complete list.
Important: When filling out forms on the computer, use only the tab key to move your cursor - do not use the return key.
Type of Application: BWP AQ 02 Non-Major CPA BWP AQ 03 Major CPA
A. Facility Information
Salem Harbor Redevelopment Project 1. Facility Name
4911 8. Standard Industrial Classification (SIC) Code
221112 9. North American Industry Classification System (NAICS) Code
10. Are you proposing a new facility? Yes No - If Yes, skip to Section B.
11. List ALL existing Air Quality Plan Approvals, Emission Cap Notifications, and 310 CMR 7.26 Compliance
Certifications and associated facility-wide emission caps, if any, for this facility in the table below. If you hold a Final Operating Permit for this facility, you may leave this table blank.
Massachusetts Department of Environmental Protection Bureau of Waste Prevention – Air Quality CPA-FUEL (BWP AQ 02 Non-Major, BWP AQ 03 Major) Comprehensive Plan Application for Fuel Utilization Emission Unit(s)
X254064
Transmittal Number N/A
Facility ID (if known)
A. Facility Information (continued)
12. Will this proposed project result in an increase in any facility-wide emission cap(s)?
Yes No
If Yes, describe:
B. Equipment Description
Note that per 310 CMR 7.02, MassDEP can issue a Plan Approval only for proposed Emission Unit(s) with air contaminant emissions that are representative of Best Available Control Technology (BACT). See Section D: Best Available Control Technology (BACT) Emissions and the MassDEP BACT Guidance.
1. Is this proposed project modifying previously approved equipment? Yes No
If Yes, list pertinent Plan Approval(s):
2. Is this proposed project replacing previously approved equipment? Yes No
If Yes, list pertinent Plan Approval(s):
3. Provide a description of the proposed project, including relevant parameters (including but not limited to operating temperature and pressure) and associated air pollution controls, if any:
Footprint Power Salem Harbor Development LP proposes to construct and operate a nominal 630 megawatt (MW) natural gas-fired, quick-start combined-cycle generating facility at the Salem Harbor power station site in Salem, Massachusetts. See attached cover document for detailed descriptions of the proposed emission units.
Netting & Offsets
4. Is netting being used to avoid 310 CMR 7.00: Appendix A? Yes* No
*If Yes, attach a description of contemporaneous increases and decreases in applicable potential (or allowable) nonattainment pollutant emissions over a period of the most recent five (5) calendar years, including the year that the proposed project will commence operating. For each emission unit, this description must include: a description of the emission unit, the year it commenced operation or was removed from service, any associated MassDEP-issued Plan Approval(s), and its potential (or allowable) nonattainment pollutant emissions. In any case, a proposed project cannot “net out” of the requirement to submit a plan application and comply with Best Available Control Technology (BACT) pursuant to 310 CMR 7.02.
5. Is the proposed project subject to 310 CMR 7.00: Appendix A
Nonattainment Review?
Yes* No – Skip to 6
*If Yes, pursuant to 310 CMR 7.00: Appendix A(6), federally enforceable emission offsets, such as Emission Reduction Credits (ERCs), must be used for this part of the application. Complete Table 2 on the next page to summarize either the facility providing the federally enforceable emission offsets, or what is being shut down, curtailed or further controlled at this facility to obtain the required emission offsets. Emission offsets must be part of a federally enforceable Plan Approval to be used for offsetting emission increases in applicable nonattainment pollutants or their precursors.
Attachment 2 • 6/11 CPA-FUEL • Page 3 of 24
Massachusetts Department of Environmental Protection Bureau of Waste Prevention – Air Quality CPA-FUEL (BWP AQ 02 Non-Major, BWP AQ 03 Major) Comprehensive Plan Application for Fuel Utilization Emission Unit(s)
X254064
Transmittal Number N/A
Facility ID (if known)
B. Equipment Description (continued)
Note: Complete this table if you answered Yes to Question 5. Otherwise, skip to Question 6.
Table 2
Source of Emission
Reduction Credits (ERCs) or
Emission Offsets
Transmittal No. of Plan
Approval Verifying Generation of ERCs, if Any
Air Contaminant
Actual Baselines Emissions (Tons per
Consecutive 12-Month
Time Period)1
New Potential Emissions2 (Tons per
Consecutive 12-Month
Time Period After Control)
ERC3 or Emission Offsets, Including
Offset Ratio & Required ERC
Set Aside (Tons per
Consecutive 12-Month
Time Period)
TBD TBD NOx 0.0 144.8 183
1 Actual Baseline Emissions means the average actual emissions for the source of emission credits or offsets in the previous two years (310 CMR 7.00: Appendix A). 2 New Potential Emissions means the potential emissions for the source of emission credits or offsets after project completion (310 CMR 7.00: Appendix A). 3 Emission Reduction Credit (ERC) means the difference between Actual Baseline and New Potential Emissions, including an offset ratio of 1.26:1 (310 CMR 7.00: Appendix B(3)).
6. Complete the table below to summarize the details of the proposed project.
Note: For additional information, see the instructions for a link to the MassDEP BACT Guidance.
Table 3
Facility-Assigned Identifying Number for Proposed Equipment (Emission Unit No.)
Description of Proposed Equipment
Including Manufacturer & Model Number or Equivalent
(e.g. Acme Boiler, Model No. AB500)
Manufacturer’s Maximum Heat Input
Rating in Btu/hr
Proposed Primary Fuel
Proposed Back-Up Fuel
(if Any)
1
New Modified
GE 107FA.05 with HRSG duct burner 2,449,000,000 Natural gas None
2
New Modified
GE 107FA.05 with HRSG duct burner 2,449,000,000 Natural gas None
3
New Modified
Cleaver Brooks CBND-80E-300D-65 Boiler or
similar 80,000,000 Natural gas None
4
New Modified
Cummins DQFAA Diesel Emergency Generator or
similar 7,400,000 Ultra-low-sulfur
diesel oil None
Attachment 2 • 6/11 CPA-FUEL • Page 4 of 24
Massachusetts Department of Environmental Protection Bureau of Waste Prevention – Air Quality CPA-FUEL (BWP AQ 02 Non-Major, BWP AQ 03 Major) Comprehensive Plan Application for Fuel Utilization Emission Unit(s)
X254064
Transmittal Number N/A
Facility ID (if known)
B. Equipment Description (continued)
Note: Complete this table if you answered Yes to Question 5. Otherwise, skip to Question 6.
Table 2
Source of Emission
Reduction Credits (ERCs) or
Emission Offsets
Transmittal No. of Plan
Approval Verifying Generation of ERCs, if Any
Air Contaminant
Actual Baselines Emissions (Tons per
Consecutive 12-Month
Time Period)1
New Potential Emissions2 (Tons per
Consecutive 12-Month
Time Period After Control)
ERC3 or Emission Offsets, Including
Offset Ratio & Required ERC
Set Aside (Tons per
Consecutive 12-Month
Time Period)
1 Actual Baseline Emissions means the average actual emissions for the source of emission credits or offsets in the previous two years (310 CMR 7.00: Appendix A). 2 New Potential Emissions means the potential emissions for the source of emission credits or offsets after project completion (310 CMR 7.00: Appendix A). 3 Emission Reduction Credit (ERC) means the difference between Actual Baseline and New Potential Emissions, including an offset ratio of 1.26:1 (310 CMR 7.00: Appendix B(3)).
1. Complete the table below to summarize the details of the proposed project.
Note: For additional information, see the instructions for a link to the MassDEP BACT Guidance.
Table 3
Facility-Assigned Identifying Number for Proposed Equipment (Emission Unit No.)
Description of Proposed Equipment
Including Manufacturer & Model Number or Equivalent
(e.g. Acme Boiler, Model No. AB500)
Manufacturer’s Maximum Heat Input
Rating in Btu/hr
Proposed Primary Fuel
Proposed Back-Up Fuel
(if Any)
5
New Modified
Cummins CFP9E-F50 Diesel Fire Pump or
similar 2,700,000 Ultra-low-sulfur
diesel oil None
New Modified
New Modified
New Modified
Attachment 2 • 6/11 CPA-FUEL • Page 5 of 24
Massachusetts Department of Environmental Protection Bureau of Waste Prevention – Air Quality CPA-FUEL (BWP AQ 02 Non-Major, BWP AQ 03 Major) Comprehensive Plan Application for Fuel Utilization Emission Unit(s)
X254064
Transmittal Number N/A
Facility ID (if known)
B. Equipment Description (continued)
2. Complete the table below to summarize the burner details if the proposed project includes boiler(s).
Note: For additional information, see the instructions for a link to the MassDEP BACT Guidance.
Table 4
Emission Unit No.
Burner Manufacturer & Model Number or Equivalent
(e.g. Acme Burner, Model No. AB300)
Manufacturer’s Maximum Firing Rate (Gallons per Hour or Cubic Feet per Hour)
Type of Burner (e.g. Ultra Low NOx Burner)
Is Emission Unit Equipped with Flue Gas Recirculation?
1 TBD (duct burner) Included below Duct burner Yes No
2 TBD (duct burner) Included below Duct burner Yes No
3 Cleaver Brooks, model unknown 81,950 cfh Ultra-low NOx Yes No TBD
Yes No
3. Complete the table below if the proposed project includes turbine(s).
Table 5
Emission Unit No.
Maximum Firing Rate (Gallons per Hour or Cubic Feet per Hour)
Maximum Output Rating (Megawatts [MW] or Kilowatts [kW];
Indicate Unit of Measure)
1 2,449,000 cfh (w/ duct burner) see Application text
2 2,449,000 cfh (w/ duct burner) see Application text
Continue to Next Page ►
Attachment 2 • 6/11 CPA-FUEL • Page 6 of 24
Massachusetts Department of Environmental Protection Bureau of Waste Prevention – Air Quality CPA-FUEL (BWP AQ 02 Non-Major, BWP AQ 03 Major) Comprehensive Plan Application for Fuel Utilization Emission Unit(s)
X254064
Transmittal Number N/A
Facility ID (if known)
B. Equipment Description (continued)
1. Are you proposing an Air Pollution Control Device (PCD)? Yes* No
*If Yes, complete the table below to summarize the details of each PCD being proposed.
Note: If you are proposing one or more Air Pollution Control Devices (PCDs), you must also submit the applicable Supplemental Form(s). See Page 6 for additional information.
Table 6a
Description of Proposed PCD
Emission Unit No(s). Served by PCD
Air Contaminant(s) Controlled
Overall Control (Percent by Weight)
HRSG SCR Catalyst
New
Existing
1, 2 VOC
CO
PM1
NOx 78% nominal
NH3
Other:
1 PM includes particulate matter having a diameter of 10 microns or less (PM10) and particulate matter having a diameter of 2.5 microns or less (PM2.5).
Note: If you are proposing more than two Air Pollution Control Devices (PCDs), complete additional copies of these tables.
Table 6b
Description of Proposed PCD
Emission Unit No(s). Served by PCD
Air Contaminant(s) Controlled
Overall Control (Percent by Weight)
Oxidation Catalyst
New
Existing
1, 2 VOC < 25% expected
CO 84% nominal
PM1
NOx
NH3
Other:
Attachment 2 • 6/11 CPA-FUEL • Page 7 of 24
Massachusetts Department of Environmental Protection Bureau of Waste Prevention – Air Quality CPA-FUEL (BWP AQ 02 Non-Major, BWP AQ 03 Major) Comprehensive Plan Application for Fuel Utilization Emission Unit(s)
X254064
Transmittal Number N/A
Facility ID (if known)
B. Equipment Description (continued)
Supplemental Forms Required
If you are proposing one or more PCDs, you will also need to submit the applicable form(s) below.
If Your Project Includes: You Must File Form(s):
Wet or Dry Scrubbers BWP AQ Scrubber
Cyclone or Inertial Separators BWP AQ Cyclone
Fabric Filter BWP AQ Baghouse/Filter
Adsorbers BWP AQ Adsorption Equipment
Afterburners or Oxidizers BWP AQ Afterburner/Oxidizer
Electrostatic Precipitators BWP AQ Electrostatic Precipitator
Selective Catalytic Reduction BWP AQ Selective Catalytic Reduction
Sorbent/Reactant Injection BWP AQ Sorbent/Reactant Injection
2. Is there any external noise generating equipment associated with the proposed project?
Yes No – Skip to 12
Note: The installation of some fuel burning equipment can cause off-site noise if proper precautions are not taken. For additional guidance, see MassDEP’s Noise Pollution Policy Interpretation.
3. Complete the table(s) below to summarize all associated noise suppression equipment, if any is being proposed, and attach a completed Form BWP AQ Sound to this application (unless MassDEP waives this requirement).
Table 7
Emission Unit No. Type of Noise Suppression
Equipment (e.g. Mufflers, Acoustical
Enclosures) Equipment Manufacturer Equipment Model No.
1, 2 See Application text TBD TBD
Attachment 2 • 6/11 CPA-FUEL • Page 8 of 24
Massachusetts Department of Environmental Protection Bureau of Waste Prevention – Air Quality CPA-FUEL (BWP AQ 02 Non-Major, BWP AQ 03 Major) Comprehensive Plan Application for Fuel Utilization Emission Unit(s)
X254064
Transmittal Number N/A
Facility ID (if known)
B. Equipment Description (continued)
4. Have you attached a completed Form BWP AQ Sound to this application? Yes No*
*If No, explain:
5. Describe the potential for visible emissions from the proposed project and how they will be controlled: The potential for visible emissions will be neglible due to the use of natural gas and ultra low-
sulfur diesel oil as the only fuels. Visible emissions will be controlled through good combustion practices. 6. Describe the potential for odor impacts from the proposed project and how they will be controlled:
The proposed project has no potential for odor impacts.
C. Stack Description
Complete the table below to summarize the details of the proposed project’s stack configuration.
Note: Discharge must meet Good Air Pollution Control Engineering Practice. When designing stacks, special consideration must be given to nearby structures and terrain to prevent emissions downwash and adverse impacts upon sensitive receptors. Stack must be vertical, must not impede vertical exhaust gas flow, and must be a minimum of 10 feet above rooftop or fresh air intake, whichever is higher. For additional guidance, refer to the MassDEP “Stack Design General Guidelines.” See the instructions for a link.
Table 8
Emission Unit No.
Stack Height Above Ground
(Feet)
Stack Height Above Roof
(Feet)
Stack Exit Diameter or Dimensions
(Feet)
Exhaust Gas Exit
Temperature Range
(Degrees Fahrenheit)
Exhaust Gas Exit
Velocity Range (Feet per Second)
Stack Liner Material
1 230 105 20 175 to 215 39.2 to 61.9 Steel
2 230 105 20 175 to 215 39.2 to 61.9 Steel
3 230 105 3 up to 530 up to 70.2 Steel
4 86 10 1 up to 620 up to 113.3 Steel
Continue to Next Page ►
Attachment 2 • 6/11 CPA-FUEL • Page 9 of 24
Massachusetts Department of Environmental Protection Bureau of Waste Prevention – Air Quality CPA-FUEL (BWP AQ 02 Non-Major, BWP AQ 03 Major) Comprehensive Plan Application for Fuel Utilization Emission Unit(s)
X254064
Transmittal Number N/A
Facility ID (if known)
B. Equipment Description (continued)
6. Have you attached a completed Form BWP AQ Sound to this application? Yes No*
*If No, explain:
7. Describe the potential for visible emissions from the proposed project and how they will be controlled:
8. Describe the potential for odor impacts from the proposed project and how they will be controlled:
C. Stack Description
Complete the table below to summarize the details of the proposed project’s stack configuration.
Note: Discharge must meet Good Air Pollution Control Engineering Practice. When designing stacks, special consideration must be given to nearby structures and terrain to prevent emissions downwash and adverse impacts upon sensitive receptors. Stack must be vertical, must not impede vertical exhaust gas flow, and must be a minimum of 10 feet above rooftop or fresh air intake, whichever is higher. For additional guidance, refer to the MassDEP “Stack Design General Guidelines.” See the instructions for a link.
Table 8
Emission Unit No.
Stack Height Above Ground
(Feet)
Stack Height Above Roof
(Feet)
Stack Exit Diameter or Dimensions
(Feet)
Exhaust Gas Exit
Temperature Range
(Degrees Fahrenheit)
Exhaust Gas Exit
Velocity Range (Feet per Second)
Stack Liner Material
5 22 10 0.667 Up to 820 Up to 80.6 Steel
Continue to Next Page ►
Attachment 2 • 6/11 CPA-FUEL • Page 10 of 24
Massachusetts Department of Environmental Protection Bureau of Waste Prevention – Air Quality CPA-FUEL (BWP AQ 02 Non-Major, BWP AQ 03 Major) Comprehensive Plan Application for Fuel Utilization Emission Unit(s)
X254064
Transmittal Number N/A
Facility ID (if known)
D. Best Available Control Technology (BACT) Emissions
1. Complete the table(s) below to summarize the proposed project’s BACT emissions. Note: Complete a separate table for each proposed fuel to be used in each Emission Unit. For example, if one Emission Unit will be capable of burning two different fuels, you will need to complete two tables.
Table 9A
Emission Unit No. & Fuel Used
Air Contaminant
Uncontrolled Emissions
(Pounds per Hour [lbs/hr],
Pounds per 1 Million British Thermal Units
[lb/MMBtu] or Parts per Million Dry Volume Corrected Basis [ppmvd@ %O2 or CO2])
Proposed BACT
Emissions (lbs/hr,
lb/MMBtu or ppmvd@
%O2 or CO2)
Proposed Consecutive
12-Month Time Period Emissions
Restrictions (Tons, if Any)5
Proposed Monthly
Time Period Emissions
Restrictions (Tons, if Any)5
Proposed Fuel Usage Limit(s)
(if Any)5
Unit No. 1, 2 (per unit) Fuel Used Natural gas
PM1 N/A N/A 53.8 N/A N/A
PM2.5 N/A N/A 53.8 N/A N/A
PM10 N/A N/A 53.8 N/A N/A
NOx2 9 ppmvd @ 15%
O2 2 ppmvd @
15% O2 69.9 N/A N/A
CO 12.5 ppmvd @ 15% O2
2 ppmvd @ 15% O2 48.0 N/A N/A
VOC 2-2.5 ppmvd @ 15% O2
1.7 ppmvd @15% O2 13.1 N/A N/A
SO2 N/A N/A 14.2 N/A N/A
Max HAP3 N/A N/A 3.3 N/A N/A
Total HAPs3 N/A N/A 6.3 N/A N/A
NH3 NA 2 ppmvd @ 15% O2 25.5 N/A N/A
CO24 825 lb/MWhr net 825 lb/MWhr
net 1,122,920 N/A N/A
1PM includes particulate matter having a diameter of 10 microns or less (PM10) and particulate matter having a diameter of 2.5 microns or less (PM2.5). 2 NOX emissions from this proposed project need to be included for the purposes of NOX emissions tracking for 310 CMR 7.00: Appendix A, if applicable. 3Operating Permit facilities are required to track emissions of Hazardous Air Pollutants. 4Pounds of CO2 per net MW is based on a “new and clean” net heat rate of 6,940 Btu per kWh delivered to the grid, at base load conditions, and corrected to ISO conditions of 59°F, 14.7 psia, and 60% humidity. 5Enter “N/A” if not requesting emissions restrictions and/or fuel usage limit.
Attachment 2 • 6/11 CPA-FUEL • Page 11 of 24
Massachusetts Department of Environmental Protection Bureau of Waste Prevention – Air Quality CPA-FUEL (BWP AQ 02 Non-Major, BWP AQ 03 Major) Comprehensive Plan Application for Fuel Utilization Emission Unit(s)
X254064
Transmittal Number N/A
Facility ID (if known)
D. Best Available Control Technology (BACT) Emissions
1. Complete the table(s) below to summarize the proposed project’s BACT emissions. Note: Complete a separate table for each proposed fuel to be used in each Emission Unit. For example, if one Emission Unit will be capable of burning two different fuels, you will need to complete two tables.
Table 9A
Emission Unit No. & Fuel Used
Air Contaminant
Uncontrolled Emissions
(Pounds per Hour [lbs/hr],
Pounds per 1 Million British Thermal Units
[lb/MMBtu] or Parts per Million Dry Volume Corrected Basis [ppmvd@ %O2 or CO2])
Proposed BACT
Emissions (lbs/hr,
lb/MMBtu or ppmvd@
%O2 or CO2)
Proposed Consecutive
12-Month Time Period Emissions
Restrictions (Tons, if Any)5
Proposed Monthly
Time Period Emissions
Restrictions (Tons, if Any)5
Proposed Fuel Usage Limit(s)
(if Any)5
Unit No. 1, 2 (per unit) Fuel Used Natural gas
PM1 <0.009 lb/MMBtu <0.009 lb/MMBtu 53.8 N/A N/A
PM12.5 <0.009 lb/MMBtu <0.009
lb/MMBtu 53.8 N/A N/A
PM110 <0.009 lb/MMBtu <0.009
lb/MMBtu 53.8 N/A N/A
NOx2 0.0332 lb/MMBtu 0.0074
lb/MMBtu 69.9 N/A N/A
CO 0.0281 lb/MMBtu 0.0045 lb/MMBtu 48.0 N/A N/A
VOC 0.0036 lb/MMBtu 0.0022 lb/MMBtu 13.1 N/A N/A
SO2 0.0015 lb/MMBtu 0.0015 lb/MMBtu 14.2 N/A N/A
Max HAP3 N/A N/A 3.3 N/A N/A
Total HAPs3 N/A N/A 6.3 N/A N/A
NH3 NA 0.0027 lb/MMBtu 25.5 N/A N/A
CO24 825 lb/MWhr net 825 lb/MWhr
net 1,122,920 N/A N/A
1PM includes particulate matter having a diameter of 10 microns or less (PM10) and particulate matter having a diameter of 2.5 microns or less (PM2.5). Note that vendor performance is given in lb/hr which varies with load. 2 NOX emissions from this proposed project need to be included for the purposes of NOX emissions tracking for 310 CMR 7.00: Appendix A, if applicable. 3Operating Permit facilities are required to track emissions of Hazardous Air Pollutants. 4Pounds of CO2 per net MW is based on a “new and clean” net heat rate of 6,940 Btu per kWh delivered to the grid, at base load conditions, and corrected to ISO weather conditions of 59°F, 14.7 psia, and 60% humidity. 5Enter “N/A” if not requesting emissions restrictions and/or fuel usage limit.
Attachment 2 • 6/11 CPA-FUEL • Page 12 of 24
Massachusetts Department of Environmental Protection Bureau of Waste Prevention – Air Quality CPA-FUEL (BWP AQ 02 Non-Major, BWP AQ 03 Major) Comprehensive Plan Application for Fuel Utilization Emission Unit(s)
X254064
Transmittal Number N/A
Facility ID (if known)
D. Best Available Control Technology (BACT) Emissions
1. Complete the table(s) below to summarize the proposed project’s BACT emissions. Note: Complete a separate table for each proposed fuel to be used in each Emission Unit. For example, if one Emission Unit will be capable of burning two different fuels, you will need to complete two tables.
Table 9A
Emission Unit No. & Fuel Used
Air Contaminant
Uncontrolled Emissions
(Pounds per Hour [lbs/hr],
Pounds per 1 Million British Thermal Units
[lb/MMBtu] or Parts per Million Dry Volume Corrected Basis [ppmvd@ %O2 or CO2])
Proposed BACT
Emissions (lbs/hr,
lb/MMBtu or ppmvd@
%O2 or CO2)
Proposed Consecutive
12-Month Time Period Emissions
Restrictions (Tons, if Any)5
Proposed Monthly
Time Period Emissions
Restrictions (Tons, if Any)5
Proposed Fuel Usage Limit(s)
(if Any)5
Unit No. 1, 2 (per unit) Fuel Used Natural gas
PM1 15.5 lb/hr 15.5 lb/hr 53.8 N/A N/A
PM2.5 15.5 lb/hr 15.5 lb/hr 53.8 N/A N/A
PM10 15.5 lb/hr 15.5 lb/hr 53.8 N/A N/A
NOx2 81.3 lb/hr 18.1 lb/hr 69.9 N/A N/A
CO 68.8 lb/hr 11.0 lb/hr 48.0 N/A N/A
VOC 8.8 lb/hr 6.4 lb/hr 13.1 N/A N/A
SO2 3.7 lb/hr 3.7 lb/hr 14.2 N/A N/A
Max HAP3 N/A N/A 3.3 N/A N/A
Total HAPs3 N/A N/A 6.3 N/A N/A
NH3 NA 6.6 lb/hr 25.5 N/A N/A
CO24 825 lb/MWhr net 825 lb/MWhr
net 1,122,920 N/A N/A
1PM includes particulate matter having a diameter of 10 microns or less (PM10) and particulate matter having a diameter of 2.5 microns or less (PM2.5). 2 NOX emissions from this proposed project need to be included for the purposes of NOX emissions tracking for 310 CMR 7.00: Appendix A, if applicable. 3Operating Permit facilities are required to track emissions of Hazardous Air Pollutants. 4Pounds of CO2 per net MW is based on a “new and clean” net heat rate of 6,940 Btu per kWh delivered to the grid, at base load conditions, and corrected to ISO weather conditions of 59°F, 14.7 psia, and 60% humidity. 5Enter “N/A” if not requesting emissions restrictions and/or fuel usage limit.
Attachment 2 • 6/11 CPA-FUEL • Page 13 of 24
Massachusetts Department of Environmental Protection Bureau of Waste Prevention – Air Quality CPA-FUEL (BWP AQ 02 Non-Major, BWP AQ 03 Major) Comprehensive Plan Application for Fuel Utilization Emission Unit(s)
X254064
Transmittal Number N/A
Facility ID (if known)
D. Best Available Control Technology (BACT) Emissions (continued)
Table 9B
Emission Unit No. & Fuel Used
Air Contaminant
Uncontrolled Emissions
(Pounds per Hour [lbs/hr],
Pounds per 1 Million British Thermal Units
[lb/MMBtu] or Parts per Million Dry Volume Corrected Basis [ppmvd@ %O2 or CO2])
CO2 118.9 lb/MMBtu 118.9 lb/MMBtu 31,247 N/A 540 MMscf/yr
Continue to Next Page ►
Attachment 2 • 6/11 CPA-FUEL • Page 14 of 24
Massachusetts Department of Environmental Protection Bureau of Waste Prevention – Air Quality CPA-FUEL (BWP AQ 02 Non-Major, BWP AQ 03 Major) Comprehensive Plan Application for Fuel Utilization Emission Unit(s)
X254064
Transmittal Number N/A
Facility ID (if known)
D. Best Available Control Technology (BACT) Emissions (continued)
Table 9B
Emission Unit No. & Fuel Used
Air Contaminant
Uncontrolled Emissions
(Pounds per Hour [lbs/hr],
Pounds per 1 Million British Thermal Units
[lb/MMBtu] or Parts per Million Dry Volume Corrected Basis [ppmvd@ %O2 or CO2])
Proposed BACT
Emissions (lbs/hr,
lb/MMBtu or ppmvd@
%O2 or CO2)
Proposed Consecutive
12-Month Time Period Emissions
Restrictions (Tons, if Any)5
Proposed Monthly
Time Period Emissions
Restrictions (Tons, if Any)5
Proposed Fuel Usage Limit(s)
(if Any)5
Unit No. 3 Fuel Used Natural gas
PM 0.40 lb/hr 0.40 lb/hr 1.3 N/A 540 MMscf/yr
PM2.5 0.40 lb/hr 0.40 lb/hr 1.3 N/A 540 MMscf/yr
PM10 0.40 lb/hr 0.40 lb/hr 1.3 N/A 540 MMscf/yr
NOx 0.88 lb/hr 0.88 lb/hr 2.9 N/A 540 MMscf/yr
CO 2.8 lb/hr 2.8 lb/hr 9.2 N/A 540 MMscf/yr
VOC 0.40 lb/hr 0.40 lb/hr 1.3 N/A 540 MMscf/yr
SO2 0.12 lb/hr 0.12 lb/hr 0.4 N/A 540 MMscf/yr
Max HAP N/A N/A 0.019 N/A 540 MMscf/yr
Total HAPs N/A N/A 0.5 N/A 540 MMscf/yr
CO2 N/A N/A 31,247 N/A 540 MMscf/yr
Continue to Next Page ►
Attachment 2 • 6/11 CPA-FUEL • Page 15 of 24
Massachusetts Department of Environmental Protection Bureau of Waste Prevention – Air Quality CPA-FUEL (BWP AQ 02 Non-Major, BWP AQ 03 Major) Comprehensive Plan Application for Fuel Utilization Emission Unit(s)
X254064
Transmittal Number N/A
Facility ID (if known)
D. Best Available Control Technology (BACT) Emissions (continued)
Table 9B
Emission Unit No. & Fuel Used
Air Contaminant
Uncontrolled Emissions
(Pounds per Hour [lbs/hr],
Pounds per 1 Million British Thermal Units
[lb/MMBtu] or Parts per Million Dry Volume Corrected Basis [ppmvd@ %O2 or CO2])
CO2 162.3 lb/MMBtu 162.3 lb/MMBtu 180 N/A 15,810 gal/yr
Continue to Next Page ►
Attachment 2 • 6/11 CPA-FUEL • Page 16 of 24
Massachusetts Department of Environmental Protection Bureau of Waste Prevention – Air Quality CPA-FUEL (BWP AQ 02 Non-Major, BWP AQ 03 Major) Comprehensive Plan Application for Fuel Utilization Emission Unit(s)
X254064
Transmittal Number N/A
Facility ID (if known)
D. Best Available Control Technology (BACT) Emissions (continued)
Table 9B
Emission Unit No. & Fuel Used
Air Contaminant
Uncontrolled Emissions
(Pounds per Hour [lbs/hr],
Pounds per 1 Million British Thermal Units
[lb/MMBtu] or Parts per Million Dry Volume Corrected Basis [ppmvd@ %O2 or CO2])
CO2 162.3 lb/MMBtu 162.3 lb/MMBtu 66 N/A 5,760 gal/yr
Continue to Next Page ►
Attachment 2 • 6/11 CPA-FUEL • Page 18 of 24
Massachusetts Department of Environmental Protection Bureau of Waste Prevention – Air Quality CPA-FUEL (BWP AQ 02 Non-Major, BWP AQ 03 Major) Comprehensive Plan Application for Fuel Utilization Emission Unit(s)
X254064
Transmittal Number N/A
Facility ID (if known)
D. Best Available Control Technology (BACT) Emissions (continued)
Table 9B
Emission Unit No. & Fuel Used
Air Contaminant
Uncontrolled Emissions
(Pounds per Hour [lbs/hr],
Pounds per 1 Million British Thermal Units
[lb/MMBtu] or Parts per Million Dry Volume Corrected Basis [ppmvd@ %O2 or CO2])
Massachusetts Department of Environmental Protection Bureau of Waste Prevention – Air Quality CPA-FUEL (BWP AQ 02 Non-Major, BWP AQ 03 Major) Comprehensive Plan Application for Fuel Utilization Emission Unit(s)
X254064
Transmittal Number N/A
Facility ID (if known)
D. Best Available Control Technology (BACT) Emissions (continued)
Note: If you are proposing more additional Emissions Units or fuels, complete additional copies of these tables.
Table 9C
Emission Unit No. & Fuel Used
Air Contaminant
Uncontrolled Emissions
(Pounds per Hour [lbs/hr],
Pounds per 1 Million British Thermal Units
[lb/MMBtu] or Parts per Million Dry Volume Corrected Basis [ppmvd@ %O2 or CO2])
Proposed BACT
Emissions (lbs/hr,
lb/MMBtu or ppmvd@
%O2 or CO2)
Proposed Consecutive
12-Month Time Period Emissions
Restrictions (Tons, if Any)5
Proposed Monthly
Time Period Emissions
Restrictions (Tons, if Any)5
Proposed Fuel Usage Limit(s)
(if Any)5
Unit No. Fuel Used
PM
PM2.5
PM10
NOx
CO
VOC
SO2
HAP
Total HAPs
CO2
Note: Top-Case BACT is the emission rate identified via the MassDEP BACT Guidance or a pre-application meeting with MassDEP.
2. Are proposed BACT emission limits in the tables above Top-Case BACT as referenced in 310 CMR 7.02(8)(a)2.a?
*If No, you must submit form BWP AQ BACT to demonstrate that this project meets BACT as provided in 310 CMR 7.02(8)(a)2 or 310 CMR 7.02(8)(a)2.c..
Yes No*
Continue to Next Page ►
Attachment 2 • 6/11 CPA-FUEL • Page 20 of 24
Massachusetts Department of Environmental Protection Bureau of Waste Prevention – Air Quality CPA-FUEL (BWP AQ 02 Non-Major, BWP AQ 03 Major) Comprehensive Plan Application for Fuel Utilization Emission Unit(s)
X254064
Transmittal Number N/A
Facility ID (if known)
E. Monitoring Procedures
Complete the table below to summarize the details of the proposed project’s monitoring procedures.
Table 10
Emission Unit No. Type or Method of Monitoring (e.g. CEMS1, Fuel Flow) Parameter/Emission Monitored Frequency of Monitoring
3 Fuel flow, hours of operation Fuel flow, hours of operation Continuous
4 Hour meter Hours of operation Continuous
5 Hour meter Hours of operation Continuous
1 CEMS = Continuous Emissions Monitoring System
F. Record Keeping Procedures
Complete the table below to summarize the details of the proposed project’s record keeping procedures. Proposed record keeping procedures need to be able to demonstrate your compliance status with regard to all limitations/restrictions proposed herein. Record keeping may include, but is not limited to, hourly or daily logs, meter charts, time logs, fuel purchase receipts, CEMS records, etc.
Table 11
Emission Unit No.
Parameter/Emission (e.g. Temperature, Material
Usage, Air Contaminant)
Record Keeping Procedures
(e.g. Data Logger or Manual) Frequency of Data Record
(e.g. Hourly, Daily)
1, 2 CEMS, Fuel Flow, SCR parameters CEMS Hourly
3 Fuel flow, hours of operation Fuel flow Daily
4 Hour meter Hours of operation Daily
5 Hour meter Hours of operation Daily
Examples of emissions calculations for record keeping purposes: NOx: {(0.085 pounds per 1,000,000 British thermal units (MMBtu)*(X cubic feet)*(1,000 Btu per cubic feet) + (0.10 pounds per
MMBtu)*(Y gallons of fuel oil)*(130,000 Btu per gallon)}* 1 ton per 2000 pounds = NOx in tons per consecutive twelve month time period CO: {(0.035 pounds per MMBtu)*(X cubic feet)*(1000 Btu per cubic feet) + (0.035 pounds per MMBtu)*(Y gallons of fuel oil)*(130,000 Btu per gallon}*1 ton per 2000 pounds = CO in tons per consecutive twelve month time period VOC: {(0.035 pounds per MMBtu)*(X cubic feet)*(1000 Btu per cubic feet) + (0.035 pounds per MMBtu)*(Y gallons of fuel oil)*(130,000 Btu per gallon}*1 ton per 2000 pounds= VOC in tons per consecutive twelve month time period SO2: {(0.0015 lb per MMBtu)*(Y gallons of fuel oil)*(130,000 Btu per gallon)}*1 ton per 2000 pounds = SO2 in tons per consecutive twelve month time period Where: X = cubic feet of natural gas burned per consecutive twelve month time period Y = gallons of ULSD oil burned per consecutive twelve month time period
Attachment 2 • 6/11 CPA-FUEL • Page 21 of 24
Massachusetts Department of Environmental Protection Bureau of Waste Prevention – Air Quality CPA-FUEL (BWP AQ 02 Non-Major, BWP AQ 03 Major) Comprehensive Plan Application for Fuel Utilization Emission Unit(s)
X254064
Transmittal Number N/A
Facility ID (if known)
G. Additional Information Checklist
Attach a specific facility description and the following required additional information that MassDEP needs to process your application. Check the box next to each item to ensure that your application is complete.
Plot Plan
Combustion Equipment Manufacturer Specifications, Including but not Limited to Emissions Data
Combustion Equipment Standard Operating Procedures
Combustion Equipment Standard Maintenance Procedures, Including Cleaning Method & Frequency
Calculations to Support This Plan Application
Air pollution control device manufacturer specifications, if applicable
Air pollution control device standard operating procedures, if applicable
Air pollution control device standard maintenance procedures, if applicable
BWP AQ BACT Form, if not proposing Top-Case BACT
Air quality dispersion modeling demonstration documenting that National Ambient Air Quality Standards (NAAQS) are not exceeded
Process flow diagram for the proposed equipment and any PCD, if applicable, including relevant parameters (e.g. flow rate, pressure and temperature)
Note: Pursuant to 310 CMR 7.02(5)(c), MassDEP may request additional information.
Continue to Next Page ►
Attachment 2 • 6/11 CPA-FUEL • Page 22 of 24
Massachusetts Department of Environmental Protection Bureau of Waste Prevention – Air Quality CPA-FUEL (BWP AQ 02 Non-Major, BWP AQ 03 Major) Comprehensive Plan Application for Fuel Utilization Emission Unit(s)
X254064
Transmittal Number N/A
Facility ID (if known)
H. Other Regulatory Considerations
Indicate below whether the proposed project is subject to any additional regulatory requirements.
310 CMR 7.00: Appendix A Nonattainment Review, or is netting used to avoid review under 310 CMR 7.00 Appendix A or 40 CFR 52.21?
Yes No
40 CFR 60: New Source Performance Standards (NSPS)? Yes No
If Yes: Which subpart? See text Applicable emission limitation(s): See text
40 CFR 61: National Emission Standards for Hazardous Air Pollutants (NESHAPS) Yes No
If Yes: Which subpart? Applicable emission limitation(s):
40 CFR 63: NESHAPS for Source Categories – Maximum Achievable (MACT) or Generally Available (GACT) Control Technology Emergency diesel generator and fire pump only
Yes No`
If Yes: Which subpart? ZZZZ Applicable emission limitation(s): NSPS IIII
301 CMR 11.00: Massachusetts Environmental Policy Act (MEPA)? Yes No
If Yes: EOEA No.: 14937
Other Applicable Requirements? Yes No
If Yes: Specify:
Facility-Wide Potential-to-Emit Hazardous Air Pollutants (HAPS): Major* Non-Major
*A Major source has a facility-wide potential-to-emit of 25 tons per year or more of the sum of all hazardous air pollutants or 10 tons per year or more of any individual hazardous air pollutant.
Continue to Next Page ►
Attachment 2 • 6/11 CPA-FUEL • Page 24 of 24
Massachusetts Department of Environmental Protection Bureau of Waste Prevention – Air Quality CPA-FUEL (BWP AQ 02 Non-Major, BWP AQ 03 Major) Comprehensive Plan Application for Fuel Utilization Emission Unit(s)
X254064
Transmittal Number N/A
Facility ID (if known)
K. Energy Efficiency Evaluation Survey
1. Do you know where your electricity and/or fuel and/or water and/or heat and/or compressed air is being used/consumed?
Yes No
2. Has your facility had an energy audit performed by your utility supplier (or other)
in the past two years?1
Yes No
a. Did the audit include evaluations for heat loss, lighting load, cooling requirements and compressor usage?
Yes No
b. Did the audit influence how this project is configured? Yes No
3. Does your facility have an energy management plan? Yes No
a. Have you identified and prioritized energy conservation opportunities? Yes No
b. Have you identified opportunities to improve operating and maintenance
procedures by employing an energy management plan?
Yes No
4. Has each emission unit proposed herein been evaluated for energy consumption including average and peak electrical use; efficiency of electric motors and suitability of alternative motors such as variable speed; added heat load and/or added cooling load as a result of the operation of the proposed process; added energy load due to building air exchange requirements as a result of exhausting heat or emissions to the ambient air; and/or use of compressors?
Yes No
5. Has your facility considered alternative energy methods such as solar, geothermal or wind power as a means of supplementing all or some of the facility’s energy demand?
Yes No
6. Does your facility comply with Leadership in Energy & Environmental Design (LEED) Green Building Rating System design recommendations?2
Yes No
1A facility wide energy audit would include an inspection of such things as lighting, air-conditioning, heating, compressors and other energy-demand equipment. It would also provide you with information on qualifying equipment rebates and incentive programs; analysis of your energy consumption patterns and written cost-savings recommendations and estimated cost savings for installing new, high-efficiency equipment.
2To understand the LEED Rating System, it is important to become familiar with its comprising facets. To be considered for LEED New Construction and Major Renovations, a building must meet specific prerequisites and additional credit areas within six categories: • Sustainable Sites • Materials and Resources • Water Efficiency • Indoor Environmental Quality • Energy and Atmosphere • Innovation and Design
pcdscr • 6/11 BWP AQ Selective Catalytic Reduction • Page 1 of 7
Massachusetts Department of Environmental Protection Bureau of Waste Prevention – Air Quality BWP AQ Selective Catalytic Reduction Submit with Form CPA-FUEL and/or CPA-PROCESS whenever construction, substantial reconstruction or alteration of a Selection Catalytic Reduction system is proposed unless exempt per 310 CMR 7.02(2)(b).
X254064
Transmittal Number N/A
Facility ID (if known) Important: When filling out forms on the computer, use only the tab key to move your cursor - do not use the return key.
A. Inlet Operating Conditions
1. Complete the table below with information on inlet gas flow(s).
2. Which metals/elements are present in gas stream?
Potassium Arsenic Lead
Zinc Sodium Phosphorus
3. Are there any other catalyst binding agents present in the gas stream?
Yes – Describe Below No
4. Complete the table below to provide the maximum oxides of nitrogen (NOx) emissions:
Table 2
Emission Unit No(s). Being Controlled
Inlet NOx (Pounds Per Hour)
Inlet NOx (Parts Per Million by Volume, Dry Basis)
1, 2 (per unit) 81.3 9 ppmvd @ 15% O2
Continue to Next Page ►
pcdscr • 6/11 BWP AQ Selective Catalytic Reduction • Page 2 of 7
Massachusetts Department of Environmental Protection Bureau of Waste Prevention – Air Quality BWP AQ Selective Catalytic Reduction Submit with Form CPA-FUEL and/or CPA-PROCESS whenever construction, substantial reconstruction or alteration of a Selection Catalytic Reduction system is proposed unless exempt per 310 CMR 7.02(2)(b).
X254064
Transmittal Number N/A
Facility ID (if known)
B. Specifications
1. Manufacturer of Selective Catalytic Reduction (SCR) system:
TBD Company
2. Model Number (or Equivalent): BASF VNX NOxCat or similar Number
3. Location of SCR unit relative to other pieces
of equipment:
High Dust Low Dust Tail End
4. Information about the catalyst used:
a. Description of catalyst: Vanadia/titania type Description b. Operating temperature range of catalyst: from 600
Degrees Fahrenheit (oF) to 760
Degrees Fahrenheit (oF) c. Pressure drop across the catalyst: 1.8
Inches of Water 5a. Number of catalyst layers the system can
accommodate: 2 Number
5b. Number of catalyst layers that will be installed: 1 Number
6. Does the SCR system employ a guard bed for catalyst protection?
Yes No*
*If No, explain:
Not necessary for natural gas combustion
7. Expected catalyst life: 3 years
Years 8. Operating hours per layer of catalyst: N/A
Hours 9. Can the catalyst be reactivated? Yes * No
11. Describe SCR system dust management technologies and strategies being used, if any (e.g. ash screens):
None.
pcdscr • 6/11 BWP AQ Selective Catalytic Reduction • Page 3 of 7
Massachusetts Department of Environmental Protection Bureau of Waste Prevention – Air Quality BWP AQ Selective Catalytic Reduction Submit with Form CPA-FUEL and/or CPA-PROCESS whenever construction, substantial reconstruction or alteration of a Selection Catalytic Reduction system is proposed unless exempt per 310 CMR 7.02(2)(b).
X254064
Transmittal Number N/A
Facility ID (if known)
B. Specifications (continued)
12. Are you proposing a by-pass stack? Yes * No
*If Yes, describe:
C. Description of Reducing Agent
1. Type and form of reducing agent proposed: Gaseous Liquid Anhydrous Ammonia
Aqueous Ammonia Urea
Other – Describe:
2. If liquid, provide weight percent in solution: 19 Weight Percent
3. Method of reducing agent injection: Direct Injection Injection Grid
4. Describe in detail how the concentration and usage rate of the reducing agent were determined. Continue on a separate attachment, if necessary.
19 percent aqueous ammonia has become accepted in the industry by precedent.
5. Describe the process controls for proper mixing of the reducing agent in the gas stream. Continue on a separate attachment, if necessary.
SCR OEM supplier provides system for metering liquid, evaporation to vapor, and injection and distribution in the gas stream by injection grid with multiple orifices vertically and horizontally distributed across duct.
6. Describe storage of the reagent, including details about any storage containment (e.g. dimension of berms, evaporative mitigation). Continue on a separate attachment, if necessary.
19% solution stored in pressure vessel provided with spill containment per attached details.
7. Is the reagent subject to 42 U.S.C. 7401, Section 112(r)?
Yes * No
*If Yes, attach a copy of the Risk Management Plan to this form.
8. You MUST attach to this form a copy of an analysis of possible impacts to off-property locations from a
catastrophic release of the reducing agent, in comparison with American Industrial Hygiene Association Emergncy Response Planning Guidelines.
pcdscr • 6/11 BWP AQ Selective Catalytic Reduction • Page 4 of 7
Massachusetts Department of Environmental Protection Bureau of Waste Prevention – Air Quality BWP AQ Selective Catalytic Reduction Submit with Form CPA-FUEL and/or CPA-PROCESS whenever construction, substantial reconstruction or alteration of a Selection Catalytic Reduction system is proposed unless exempt per 310 CMR 7.02(2)(b).
X254064
Transmittal Number N/A
Facility ID (if known)
D. Emissions Data
1. Complete the table below to provide maximum oxides of nitrogen (NOx) and ammonia (NH3) slip concentrations and emission rates:
Table 3
Air Contaminant Outlet (Pounds Per Hour)
Outlet1 (Parts Per Million By Volume, Dry Basis)
NOx 18.1 2 ppmvd at 15% O2
NH3 6.6 2 ppmvd at 15% O2
1Boilers at 3% oxygen; combustion turbines at 15% oxygen; engines at 15% oxygen.
2. Explain how the above NOx and NH3 emissions data were obtained. Attach appropriate calculations and documentation.
Emission rates are based on guaranteed outlet concentrations from turbine vendor. See Attachment 3 for vendor data and emission calculations.
E. Drawing of Selective Catalytic Reduction System
You must attach to this form a schematic drawing of the proposed Selective Catalytic Reduction system. At a minimum, it must show the location(s) of the catalyst bed(s), bypass damper(s) if applicable, bypass stack if applicable, and normal stack. Sampling ports for emissions testing must also be shown.
Note: You must notify the BWP Compliance & Enforcement Chief in the appropriate MassDEP regional office by telephone as soon as possible, within but no later than one (1) business day after you discover any upset or malfunction to facility equipment that results in excess emissions to the air and/or a condition of air pollution. You must submit written notice within seven (7) days thereafter.
F. Monitoring, Record Keeping & Failure Notification
1. Provide the manufacturer, make and model number of the proposed continuous emissions and opacity monitoring systems:
Make and model of CEMS not yet selected
2. Identify the air contaminants that will be continuously monitored and recorded (e.g. NOx, NH3, opacity)
NOx, CO, NH3, opacity, O2
3. Describe any proposed process monitors (e.g. ammonia injection, fuel combustion) and frequency of data recording:
Plant control system and data logger will record fuel flow rate, MW load, and ammonia injection rate; 1-minute data recording and 1-hour data averaging.
pcdscr • 6/11 BWP AQ Selective Catalytic Reduction • Page 5 of 7
Massachusetts Department of Environmental Protection Bureau of Waste Prevention – Air Quality BWP AQ Selective Catalytic Reduction Submit with Form CPA-FUEL and/or CPA-PROCESS whenever construction, substantial reconstruction or alteration of a Selection Catalytic Reduction system is proposed unless exempt per 310 CMR 7.02(2)(b).
X254064
Transmittal Number N/A
Facility ID (if known)
F. Monitoring, Record Keeping & Failure Notification (continued)
4. Are there any alarms associated with the monitoring equipment?
Yes – Complete Table 4 No – Explain Below
Table 4
Operating Parameter Monitored Describe Alarm Trigger Monitoring Device or
Alarm Type Does the Alarm Initiate an
Automated Response?
NOx Out of compliance detected by CEMS
Visual Auditory Automatic (Remote Monitoring) Other – Describe:
Yes No If Yes, Describe:
CO Out of compliance detected by CEMS
Visual Auditory Automatic (Remote Monitoring) Other – Describe:
Yes No If Yes, Describe:
NH3 Out of compliance detected by CEMS
Visual Auditory Automatic (Remote Monitoring) Other – Describe:
Yes No If Yes, Describe:
5. Describe the operating conditions that are monitored to determine the reducing agent injection rate:
Ammonia solution mass flow
6. How often will the catalyst be tested and by what test method (e.g. core sample)?
TBD
7. List and explain all of the operating and safety controls associated with the SCR system. Continue on a separate attachment, if necessary.
If inlet temperatures exceed allowable limits, alarm will sound. Operator will reduce load or shut down unit. Ammonia injection is maintained only when acceptable gas temperature is maintained.
8. List the SCR system emergency procedures to be used during system upsets. Continue on a separate attachment, if necessary.
TBD
pcdscr • 6/11 BWP AQ Selective Catalytic Reduction • Page 6 of 7
Massachusetts Department of Environmental Protection Bureau of Waste Prevention – Air Quality BWP AQ Selective Catalytic Reduction Submit with Form CPA-FUEL and/or CPA-PROCESS whenever construction, substantial reconstruction or alteration of a Selection Catalytic Reduction system is proposed unless exempt per 310 CMR 7.02(2)(b).
X254064
Transmittal Number N/A
Facility ID (if known)
F. Monitoring, Record Keeping & Failure Notification (continued)
9. Explain the typical fluctuations in SCR system operation, such as changes in effluent temperatures, flow rates, pollutant concentrations, etc., which may affect operation of the unit. Also explain the means by which control efficiency will be maintained throughout these fluctuations. Continue on a separate attachment, if necessary.
SCR control logic automatically meters ammonia injection to maintain stack exit concentration set points.
10. Describe the record keeping procedures to be used in identifying the cause, duration and resolution of each system failure/emission(s) exceedance. Continue on a separate attachment, if necessary.
TBD
11. How will the SCR system be designed so as to allow for emissions testing using MassDEP-sanctioned test methods?
The exhaust stack will be fitted with platforms and test ports to allow stack testing using MassDEP-sanctioned test methods.
G. Standard Operating & Maintenance Procedures
Attach to this form the standard operating and maintenance procedures for the proposed Selective Catalytic Reduction system, as well as a list of the spare parts inventory that you will maintain on site, as recommended by the equipment vendor.
Continue to Next Page ►
pcdafter • 6/11 BWP AQ Afterburner/Oxidizer • Page 1 of 7
Massachusetts Department of Environmental Protection Bureau of Waste Prevention – Air Quality BWP AQ Afterburner/Oxidizer Submit with Form CPA-PROCESS whenever construction, substantial reconstruction or alteration of an Afterburner/Oxidizer is proposed unless exempt per 310 CMR 7.02(2)(b).
X254064
Transmittal Number N/A
Facility ID (if known) Important: When filling out forms on the computer, use only the tab key to move your cursor - do not use the return key.
A. Inlet Operating Conditions
1. Complete the tables below with information on inlet gas flow(s).
2. Provide the capture efficiency of the ventilation system serving the Afterurner/Oxidizer. The presumption
is that the capture efficiency of the system meets the criteria of the Permanent Total Enclosure (PTE) detailed in EPA Method 204.
100 Weight Percent (%)
3. If the proposed system does not meet the PTE criteria, explain:
N/A
pcdafter • 6/11 BWP AQ Afterburner/Oxidizer • Page 2 of 7
Massachusetts Department of Environmental Protection Bureau of Waste Prevention – Air Quality BWP AQ Afterburner/Oxidizer Submit with Form CPA-PROCESS whenever construction, substantial reconstruction or alteration of an Afterburner/Oxidizer is proposed unless exempt per 310 CMR 7.02(2)(b).
X254064
Transmittal Number N/A
Facility ID (if known)
B. Specifications
1. Manufacturer of Afterburner/Oxidizer: TBD Company
2. Model Number (or Equivalent): BASF Camet or similar Number
3. Type of Afterburner/Oxidizer:
Recuperative Regenerative
Catalytic Direct Flame
4a. If Regenerative, will there be a “puff” chamber? Yes No
4b. If Regenerative, describe how efficiency will be maintained when switching beds:
N/A
5a. If Catalytic, describe the unit:
TBD
5b. If Catalytic, provide dimensions of the bed: TBD
Height (Inches)
TBD Width (Inches)
TBD Depth (Inches)
TBD Weight (Pounds)
5c. If Catalytic, pressure drop range across the bed: 1.4 Inches of Water
Notes: • The burner must be able to maintain this minimum operating temperature without the benefit of the heating value of contaminants in the waste stream. • Design calculations must be submitted that incorporate fuel, air and waste stream supply rates as well as heat transfer phenomena (including heat recovery systems) used to determine the minimum gas temperature and residence time in the combustion chamber.
6. Capacity of the Afterburner/Oxidizer: TBD Standard Cubic Feet Per Minute
7. Temperature at the Afterburner/Oxidizer outlet: TBD Degrees Fahrenheit (oF)
8. Outlet gas exhaust flow rate: 2,340,000 (max) Actual Cubic Feet Per Minute, Wet
9. Proposed minimum operating temperature of the Afterburner/Oxidizer, as measured at the downstream end of the combustion chamber:
550 °F Degrees Fahrenheit (oF)
10. Combustion chamber temperature control mechanism:
N/A Describe
11. Minimum residence time of gases in combustion chamber at the minimum temperature:
TBD Seconds
12. Explain the design and operation of any heat recovery system associated with this Afterburner/Oxidizer system. Continue on a separate attachment, if necessary.
Each combustion turbine (units 1 and 2) is equipped with a heat recovery steam generator, which will direct steam to a steam turbine generator.
pcdafter • 6/11 BWP AQ Afterburner/Oxidizer • Page 3 of 7
Massachusetts Department of Environmental Protection Bureau of Waste Prevention – Air Quality BWP AQ Afterburner/Oxidizer Submit with Form CPA-PROCESS whenever construction, substantial reconstruction or alteration of an Afterburner/Oxidizer is proposed unless exempt per 310 CMR 7.02(2)(b).
X254064
Transmittal Number N/A
Facility ID (if known)
C. Fuel & Burner Data
1. Provide the burner manufacturer(s) and model number(s):
N/A (no burner with this system) Manufacturer(s)
N/A Model Number(s)
2. Type of Gaseous Fuel Used:
Natural Gas Propane
Other - Specify: N/A
3a. Gas firing rate: N/A Maximum Cubic Feet Per Hour N/A Minimum Cubic Feet Per Hour 3b. Maximum heat input rate: N/A British Thermal Units (Btu) Per Hour
4. Describe burner design and explain how proper mixing of fuel and combustion air will be achieved:
N/A
5. Describe the burner modulation system (e.g. full modulating, high/low, on/off):
N/A
6. If on/off modulation will be used, describe how the minimum operating temperature will be maintained at all times:
N/A
7. Describe what portion of the contaminant stream will bypass the burner to be mixed with the flame downstream:
N/A
Continue to Next Page ►
pcdafter • 6/11 BWP AQ Afterburner/Oxidizer • Page 4 of 7
Massachusetts Department of Environmental Protection Bureau of Waste Prevention – Air Quality BWP AQ Afterburner/Oxidizer Submit with Form CPA-PROCESS whenever construction, substantial reconstruction or alteration of an Afterburner/Oxidizer is proposed unless exempt per 310 CMR 7.02(2)(b).
X254064
Transmittal Number N/A
Facility ID (if known)
D. Emissions Data
1. Describe air contaminant emissions after control by the proposed Afterburner/Oxidizer:
Table 2
Provide the Maximum Gaseous Emission Rate
Emission Unit No(s).
Being Controlled Air Contaminant Air Contaminant Emission
Range After Control (Pounds Per Hour)
Air Contaminant Emission Range After Control
(Parts Per Million by Volume, Dry Basis)
1, 2 (per unit) CO 11.0 (max) 2 ppmvd @ 15% O2
1, 2 (per unit) VOC 5.4 (max) 1.7 ppmvd @ 15% O2
2. Explain how the above air contaminant emissions data were obtained. Attach appropriate calculations and documentation.
Emission rates are based on guaranteed outlet concentrations from turbine vendor. See Appendix B of this application for detailed emission calculations and Appendix C for vendor performance data.
3a. Design destruction efficiency of organic compounds (as carbon) in the Afterburner/ Oxidizer:
84% CO; < 25% expected for VOC Weight Percent (%)
3b. Explain how this efficiency was calculated or determined:
Based on guaranteed emission rates from turbine vendor.
4a. Design destruction efficiency for inorganic hazardous air pollutants in the Afterburner/ Oxidizer:
N/A Weight Percent (%)
4b. Explain how this efficiency was calculated or determined:
N/A
pcdafter • 6/11 BWP AQ Afterburner/Oxidizer • Page 5 of 7
Massachusetts Department of Environmental Protection Bureau of Waste Prevention – Air Quality BWP AQ Afterburner/Oxidizer Submit with Form CPA-PROCESS whenever construction, substantial reconstruction or alteration of an Afterburner/Oxidizer is proposed unless exempt per 310 CMR 7.02(2)(b).
X254064
Transmittal Number N/A
Facility ID (if known)
E. Catalytic Units Only
1. Estimated useful life of the catalyst: 3 years Amount of Time (e.g. Months or Years)
2. Describe how catalyst performance will be monitored, including the test method and frequency of testing:
TBD
F. Drawing of Afterburner/Oxidizer Control System
You must attach to this form a schematic drawing of the proposed Afterburner/Oxidizer. At a minimum, it must show the location(s) of the burner(s), catalyst bed(s), bypass damper(s), bypass stack and normal stack. Clearly indicate the gas circulation pattern through preheat and burner chambers, and through heat recovery unit(s) prior to ambient discharge. Sampling ports for emissions testing, and location of each pressure and temperature indicator must also be shown.
Note: You must notify the BWP Compliance & Enforcement Chief in the appropriate MassDEP regional office by telephone as soon as possible, within but no later than one (1) business day after you discover any upset or malfunction to facility equipment that results in excess emissions to the air and/or a condition of air pollution. You must submit written notice within seven (7) days thereafter.
G. Monitoring, Record Keeping & Failure Notification
1. Describe the parameters that will be monitored as a surrogate for control device efficiency, and the frequency of monitoring. Continue on a separate attachment, if necessary.
CO concetrations will be continuously monitored by a CEMS as a direct indication of compliance.
2. Describe the monitoring methods and warning/alarm system that protect against operation when the unit is not meeting design efficiency (e.g. visual monitoring, audible alarm, flashing lights, temperature indicator, pressure indicator). Continue on a separate attachment, if necessary.
A visual alarm will be triggered by the CEMS if CO is detected to be out of compliance with emission limits.
3. Describe the record keeping procedures to be used to verify monitoring and to identify the cause, duration and resolution of each failure. Continue on a separate attachment, if necessary.
Electronic and/or manual logbook records will be kept for each incident of missing data, excess emissions, or equipment malfunction.
Continue to Next Page ►
pcdafter • 6/11 BWP AQ Afterburner/Oxidizer • Page 6 of 7
Massachusetts Department of Environmental Protection Bureau of Waste Prevention – Air Quality BWP AQ Afterburner/Oxidizer Submit with Form CPA-PROCESS whenever construction, substantial reconstruction or alteration of an Afterburner/Oxidizer is proposed unless exempt per 310 CMR 7.02(2)(b).
X254064
Transmittal Number N/A
Facility ID (if known)
G. Monitoring, Record Keeping & Failure Notification (continued)
4. Describe how failure of the Afterburner/Oxidizer will be made known to the operator during normal operations (e.g. visual monitoring, audible alarm, flashing lights, time indicator, pressure indicator). Continue on a separate attachment, if necessary.
A visual alarm will be triggered by the CEMS if CO is detected to be out of compliance with emission limits.
5. List and explain all operating and safety controls associated with this system, including interlock systems that prevent introduction of the air contaminant(s) stream until the Afterburner/Oxidizer is operating properly. Continue on a separate attachment, if necessary.
The oxidation catalyst is passive, and there is no bypass for the exhaust stream. During unit startups, heat from the exhaust will warm the catalyst to its required operating temperature range.
6. Describe the Afterburner/Oxidizer’s emergency procedures during system upsets. Continue on a separate attachment, if necessary.
The oxidation catalyst is passive, and therefore no emergency procedures are required during system upsets.
7. Describe features of the system design that will allow for emissions testing and operation using MassDEP- sanctioned test methods. Continue on a separate attachment, if necessary.
The exhaust stack will be fitted with platforms and test ports to allow stack testing using MassDEP-sanctioned test methods.
H. Standard Operating & Maintenance Procedures
Attach to this form the standard operating and maintenance procedures for the proposed Afterburner/Oxidizer, as well as a list of the spare parts inventory that you will maintain on site, as recommended by the equipment vendor(s).
Continue to Next Page ►
aqsound • 6/11 BWP AQ Sound • Page 1 of 5
Massachusetts Department of Environmental Protection Bureau of Waste Prevention – Air Quality BWP AQ Sound Submit alone and/or with Form CPA-FUEL and/or CPA-PPROCESS whenever the construction or alteration of stationary equipment (e.g. electrical generating equipment, motors, fans, process handling equipment or similar sources of sound) has the potential to cause noise, or in response to a MassDEP enforcement action citing noise as a condition of air pollution.
X254064
Transmittal Number N/A
Facility ID (if known)
Important: When filling out forms on the computer, use only the tab key to move your cursor - do not use the return key.
Introduction When proposing sound suppression/mitigation measures, similar to the traditional "top-down” BACT process, the "top case" sound suppression/mitigation measures which deliver the lowest sound level increase above background are required to be implemented, unless these measures can be eliminated based upon technological or economic infeasibility. An applicant cannot "model out” of the use of the "top case" sound suppression/ mitigation measures by simply demonstrating that predicted sound levels at the property line when employing a less stringent sound suppression/mitigation strategy will result in a sound level increase of less than or equal to the 10 dBA (decibel, A –Weighted) above background sound level increase criteria contained in the MassDEP Noise Policy. A 10 dBA increase is the maximum increase allowed by MassDEP; it is not the sound level increase upon which the design of sound suppression/mitigation strategies and techniques should be based. Also, take into consideration that the city or town that the project is located in may have a noise ordinance (or similar) that may be more stringent than the criteria in the MassDEP Noise Policy
A. Sound Emission Sources & Abatement Equipment/Mitigation Measures
1. Provide a description of the source(s) of sound emissions and associated sound abatement equipment and/or mitigation measures. Also include details of sound emission mitigation measures to be taken during construction activities.
Please refer to Section 9 of the CPA application and April12, 2013 Supplement. .
B. Manufacturer’s Sound Emission Profiles & Sound Abatement Equipment
Please attach to this form the manufacturer's sound generation data for the equipment being proposed for installation, or the existing equipment as applicable. This data must specify the sound pressure levels for a complete 360° circumference of the equipment and at given distance from the equipment. Also attach information provided by the sound abatement manufacturer detailing the expected sound suppression to be provided by the proposed sound suppression equipment. Please refer to Attachment 5.
C. Plot Plan
Provide a plot plan and aerial photo(s) (e.g. GIS) that defines: the specific location of the proposed or existing source(s) of sound emissions; the distances from the source(s) to the property lines; the location, distances and use of all inhabited buildings (residences, commercial, industrial, etc) beyond the property lines; identify any areas of possible future construction beyond the property line; and sound monitoring locations used to assess noise impact on the surrounding community. All information provided in the sound survey shall contain sufficient data and detail to adequately assess any sound impacts to the surrounding community, including elevated receptors as applicable, not necessarily receptors immediately outside the facility's property line. Please refer to Figure 9-2 and the maps and drawings in Appendix D of this CPA application.
Continue to Next Page ►
aqsound • 6/11 BWP AQ Sound • Page 2 of 5
Massachusetts Department of Environmental Protection Bureau of Waste Prevention – Air Quality BWP AQ Sound Submit alone and/or with Form CPA-FUEL and/or CPA-PPROCESS whenever the construction or alteration of stationary equipment (e.g. electrical generating equipment, motors, fans, process handling equipment or similar sources of sound) has the potential to cause noise, or in response to a MassDEP enforcement action citing noise as a condition of air pollution.
X254064
Transmittal Number N/A
Facility ID (if known)
D. Community Sound Level Criteria
Approval of the proposed new equipment or proposed corrective measures will not be granted if the installation: 1. Increases off-site broadband sound levels by more than 10 dBA.above “ambient” sound levels. Ambient is
defined as the lowest one-hour background A-weighted sound pressure level that is exceeded 90 percent of the time measured during equipment operating hours. Ambient may also be established by other means with the consent of MassDEP.
2. Produces off-site a "pure tone" condition. “Pure tone” is defined as when any octave band center frequency sound pressure level exceeds the two adjacent frequency sound pressure levels by 3 decibels or more.
3. Creates a potential condition of air pollution as defined in 310 CMR 7.01 and the MassDEP Noise Policy. Note: These criteria are measured both at the property line and at the nearest inhabited building. For equipment that operates, or will be operated intermittently, the ambient or background noise measurements shall be performed during the hours that the equipment will operate and at the quietest times of the day. The quietest time of the day is usually between 1:00 a.m. and 4:00 a.m. on weekend nights. The nighttime sound measurements must be conducted at a time that represents the lowest ambient sound level expected during all seasons of the year. For equipment that operates, or will operate, continuously and is a significant source of sound, such as a proposed power plant, background shall be established via a minimum of seven consecutive days of continuous monitoring at multiple locations with the dBA L 90 data and pure tone data reduced to one-hour averages. In any case, consult with the appropriate MassDEP Regional Office before commencing noise monitoring in order to establish a sound monitoring protocol that will be acceptable to MassDEP.
E. Full Octave Band Analysis
The following community sound profiles will require the use of sound pressure level measuring equipment in the neighborhood of the installation. An ANSI S1.4 Type 1 sound monitor or equivalent shall be use for all sound measurements. A detailed description of sound monitor calibration methodology shall be included with any sound survey.
1. Lowest ambient sound pressure levels during operating hours of the equipment.
a. At property line:
A-Weighted 31.5 63.0 125 250 500 1K 2K 4K 8K 16K
N/A N/A N/A N/A N/A N/A N/A N/A N/A N/A N/A
Closest noise sensitive areas (i.e., inhabited buildings) are located across the street from the property line. See Table 1b for lowest ambient sound pressure levels at those locations.
aqsound • 6/11 BWP AQ Sound • Page 3 of 5
Massachusetts Department of Environmental Protection Bureau of Waste Prevention – Air Quality BWP AQ Sound Submit alone and/or with Form CPA-FUEL and/or CPA-PPROCESS whenever the construction or alteration of stationary equipment (e.g. electrical generating equipment, motors, fans, process handling equipment or similar sources of sound) has the potential to cause noise, or in response to a MassDEP enforcement action citing noise as a condition of air pollution.
X254064
Transmittal Number N/A
Facility ID (if known)
E. Full Octave Band Analysis (continued)
b. At the nearest inhabited building and if applicable at buildings at higher elevation:
Receptor ID (see Sec
9 of text) A-
Weighted 31.5 63.0 125 250 500 1K 2K 4K 8K 16K
3 39 45 44 44 38 38 32 26 19 14 15
4 39 52 49 48 40 37 31 23 19 15 16
5 39 43 53 46 39 36 35 25 13 11 12
9 39 56 51 46 41 38 33 25 20 17 19
10 36 43 41 37 37 35 30 21 16 14 15 Note: You are required to complete sound profiles 2a and 2b only if you are submitting this form in response to a MassDEP enforcement action citing a noise nuisance condition. If this is an application for new equipment, Skip to 3.
2. Neighborhood sound pressure levels with source operating without sound abatement equipment.
a. At property line:
A- Weighted 31.5 63.0 125 250 500 1K 2K 4K 8K 16K
N/A N/A N/A N/A N/A N/A N/A N/A N/A N/A N/A
b. At the nearest inhabited building and if applicable at buildings at higher elevation:
A- Weighted 31.5 63.0 125 250 500 1K 2K 4K 8K 16K
N/A N/A N/A N/A N/A N/A N/A N/A N/A N/A N/A
Continue to Next Page ►
ATTACHMENT 3
CPA/PSD APPLICATION
EMISSION CALCULATION AND VENDOR DATA UPDATES
SECOND APPLICATION SUPPLEMENT
Attachment 3
Updates to Footprint Air Emissions Calculations
Potential Emissions
GE performance data is provided as Attachment 3-1 (3 sheets). This is the same as the GE data provided in Appendix C of the December 21, 2012 application except that GE Cases 11-12, 14-15, 19-20, and 22-23 are revised. These cases have been revised to include GE turbine peak firing conditions and are highlighted in yellow. Also, the 10% duct firing cases are replaced with 50% duct firing cases. The combined turbine and duct burner heat inputs for 100% duct firing are higher than the previous GE cases, but in all cases are still less than the prior Siemens maximum firing case.
The GE load cases selected in order to characterize emissions for calculating potential emissions (and also for identifying an appropriate range of cases for dispersion modeling) are discussed below.
Calculation Sheet 1 presents the potential to emit (PTE) calculations for one turbine. Two operating cases are used to calculate potential emissions (PTE) are 100% load at 50 °F for baseload operation (8,040 hours/year) and 100% load at 90 °F with the duct burners and evaporative coolers on (720 hours per year). GE Case 7 is 100% load at 50 °F, with a heat input of 2,130 MMBtu/hr. GE Case 12 is 100% load at 90 °F with the duct burners and evaporative coolers on with a heat input of 2,449 MMBtu/hr. The CPA values are based on the direct calculation with the exact lb/MMBtu values shown on Sheet 1.
For CO, Sheet 1 shows the PTE based on 8,760 hours of operation, but the worst case PTE is based on separate calculations using startup and shutdown (SUSD) emissions and an assumed operating scenario. These calculations are provided on Sheet 2 for GE and reflect a higher PTE for CO compared to those in Sheet 1. Therefore, the maximum SUSD scenario value for CO PTE is used. In the December 21, 2012 application, VOC also had higher PTE for the SUSD but this was for the Siemens turbine. Now that GE selected, the VOC PTE is no longer controlled by the SUSD scenario. Revised GE SUSD data is provided on Attachment 3-1, Sheet 3 of 3. Compared to the previous values, the pounds of CO and VOC for startup and shutdown decrease. The pounds of NOx for a cold startup increase very slightly (from 88 to 89 pounds) but the pounds of NOx for shutdown decrease more substantially (from 60 to 10 pounds). The annual NOx emissions are controlled by the full load case (8760 hours per year) and are not impacted by the startup emissions. The PM-10 SUSD emissions remain the same. Calculation Sheets 4, 5, and 6 in the December 21, 2012 application
presented emission calculations for the emergency generator, emergency diesel fire pump, and auxiliary cooling tower respectively. These have not changed and are not repeated here. Calculation Sheet 7 presents the overall summary of potential-to-emit (PTE) for the facility.
Dispersion Modeling Cases
For dispersion modeling, the combustion turbine load cases in Table 6-3 of the Application are based on selecting turbine loads to bracket the range of emissions and gas flow, now for just the GE equipment:
GE 100%: GE Case 12 (GE Max Fire)
GE 75%: GE Case 5 (Mid load conditions)
GE 46%: GE Case 6 (Low load conditions)
GE SUSD
Emissions (lb/hr) for modeling were determined the same way as described above for potential emissions. HRSG exhaust temperatures are taken directly from the vendor data.
Attachment 3-1 (Sheet 1 of 3)
GE Energy 107FA.05 Rapid Response Combined Cycle Plant - Manufacturer's Emissions Data - Natural Gas
GE Energy Performance Data - Site ConditionsOperating Point 1 2 3 4 5 6 7 8 9 10 11 12 13Case Description Unfired Unfired Unfired Unfired Unfired Unfired Unfired Unfired Unfired Unfired 50% DB firing 100% DB firing Unfired
GE Energy Performance Data - Plant StatusHRSG Duct Burner (On/Off) Unfired Unfired Unfired Unfired Unfired Unfired Unfired Unfired Unfired Unfired Fired Fired Unfired
Evaporative Cooler state (On/Off) Off Off Off Off Off Off Off Off Off On On On OffGas Turbine Load % BASE 75% 50% BASE 75% 46% BASE 75% 46% BASE PEAK PEAK BASEGas Turbines Operating 1 1 1 1 1 1 1 1 1 1 1 1 1
GE Energy 107FA.05 Rapid Response Combined Cycle Plant - Manufacturer's Emissions Data - Natural Gas
GE Energy Performance Data - Site ConditionsOperating Point 14 15 16 17 18 19 20 21 22 23 24 25Case Description 50% DB firing 100% DB firing Unfired Unfired Unfired 50% DB firing 100% DB firing Unfired 50% DB firing 100% DB firing Unfired Unfired
GE Energy Performance Data - Plant StatusHRSG Duct Burner (On/Off) Fired Fired Unfired Unfired Unfired Fired Fired Unfired Fired Fired Unfired Unfired
Evaporative Cooler state (On/Off) Off Off Off Off On On On Off Off Off Off OffGas Turbine Load % PEAK PEAK 75% 47% BASE PEAK PEAK BASE PEAK PEAK 75% 49%Gas Turbines Operating 1 1 1 1 1 1 1 1 1 1 1 1
GE Energy 107FA.05 Rapid Response Combined Cycle PlantManufacturer's Emissions Data - Natural Gas - Startup and Shutdown Conditions - Single Unit Basis
NOx (lb) CO (lb) VOC (lb) PM10 (lb) Duration (min)Cold Start (GT Fire to HRSG Stack Emissions Compliance with Base Load Hold) 89 285 23 7.3 45Warm Start (GT Fire to HRSG Stack Emissions Compliance with Base Load Hold) 54 129 13 5.0 32Hot Start (GT Fire to HRSG Stack Emissions Compliance with Base Load Hold) 28 121 12 2.6 18Shutdown (HRSG Stack EC to GT Flame Off) 10 151 29 5.8 27
Calculation Sheet 1 Potential Emissions for Combustion Turbines and Auxiliary Boiler
50 deg F 90 deg F Annual Gas Annual No DF DF, EC tpy lb/MMBtu tpy
Hours per Year 8040 720 6570 (FLE) 6570 (FLE)MMBtu/hr 2130 2449 80
NOx (lb/MMBtu) 0.0074 0.0074 69.9 0.011 2.9
CO (lb/MMBtu) 0.0045 0.0045 42.5 0.035 9.2
VOC (lb/MMBtu) (See Note 4) 0.0013 0.0022 13.1 0.005 1.3
One Combustion Turbine at 100% Load Auxiliary Boiler
Calculation Sheet 2GE Emissions for CO and VOC Including Startup Shutdown Scenario
MMBtu/hr CO (lb/hr) VOC (lb/hr)Spring/Fall Normal Load Case 7 (50 deg) 2130 9.6 2.8Summaer Case 13 except for 720 hours 1980 8.9 2.6Summer Case 12 for 720 hours (90 deg) 2449 11.0 5.4
Winter Case 4 (20 deg) 2250 10.1 2.9
days/ week
hrs/ day
hrs/ week
Weeks/ yr
hrs/yrcold warm hot cold warm hot cold warm hot cold warm hot
Combined startup/shutdown pounds of emissions per single event 436 280 272 52 42 41
Footprint Power is applying for a Prevention of Significant Deterioration (PSD) permit from MassDEP pursuant to the April 11, 2011 Delegation Agreement between US EPA and MassDEP for MassDEP to implement and enforce the PSD regulations under 40 CFR 52.21. The Delegation Agreement specifies that MassDEP identify and address, as appropriate, “disproportionality high and adverse human health or environmental effects of federal programs, policies, and activities on minority and low-income populations,” in accordance with Executive Order 12898 (February 11, 1994). Tetra Tech has considered draft federal guidance1 as well as the Massachusetts Executive Office of Environmental Affairs (EOEA) Massachusetts-specific Environmental Justice (EJ) Policy in preparing the EJ assessment for the SHR Facility, and this analysis is intended to satisfy both state and federal requirements.
The US EPA defines EJ as “the fair treatment and meaningful involvement of all people regardless of race, color, national origin or income with respect to the development, implementation, and enforcement of environmental laws, regulations and policies. Fair treatment means that no group of people, including a racial, ethnic, or socioeconomic group, should bear a disproportionate share of the negative environmental consequences resulting from industrial, municipal, and commercial operations or the execution of federal, state, local, and tribal programs and policies.”2
As demonstrated in the Air Plan Application, Supplements, and as further set forth below, no such group of people will bear a disproportionate share of negative health or environmental consequences from the issuance of a PSD permit to Footprint as (1) the SHR Facility will not be located in or abutting an EJ area; (2) nearby EJ communities have been provided with many opportunities to participate in the permitting process; and (3) the SHR Facility meets all applicable air emissions standards and would not cause or contribute to a violation of the health-based National Ambient Air Quality Standards (NAAQS). Moreover, the resulting regional emission reductions will benefit all communities, including EJ areas.
II. Identification of Environmental Justice Areas
EOEA Geographic Information System (GIS) includes EJ areas divided by block groups based on the 2010 US Census data.3 The block groups are based on the number of people generally ranging from 500 to 2500 people as opposed to physical boundaries such as streets or rivers. There are three main EJ classifications in the EOEA EJ Policy - Minority, Low Income, and English Isolation (referred to as “Lacking English Language Proficiency” in the EOEA Policy):
1 US EPA, “Draft Technical Guidance for Assessing Environmental Justice in Regulatory Analysis”, May 1, 2013 Post-Internal Agency Review Draft. 2 US EPA, Basic Information: Environmental Justice. http://www.epa.gov/environmentaljustice/basics/index.html 3 2010 census data is the latest demographic data available. http://www.mass.gov/mgis/ej_boston_metro.pdf
• “Minorities” under the EOEA Policy are individuals who refer to themselves on federal census forms as “non-white” or as “Hispanic,” which is broader than the EPA EJ definition. Any block group with 25 percent or more minority population is considered to be an EJ area.
• Income of approximately 65% of the median annual household income is considered low income. In Massachusetts median income is based on the state median household income of $62,133 per year. Thus, any block group with a median annual household income of $40,673 or less is considered to be an EJ area.
• English Isolation is any household in which members 14 years old and older speak a non-English language and also speak English less than “very well” (i.e., are not proficient in English). Any block group with 25% or more of households as English Isolated is considered to be an EJ area.
Based on EJ mapping completed by EOEA, the SHR Project does not abut any EJ areas and is not located within 1 kilometer of any EJ areas. However, the site is within approximately 10 kilometers of a number of EJ communities in Salem, Lynn, Peabody, Danvers and Beverly (see Figure 1). The closest EJ areas are classified as Minority/Low Income and Minority/Low Income/English Isolation and are located approximately 1.2 kilometers (¾ of a mile) to the southwest of the SHR Project property boundary. A portion of this area is known as the “Point Neighborhood.”
The Point was originally surrounded by water on three sides and was known as Long Point or Stage Point. There were fish shacks and mill buildings in this area originally. In the mid 1880’s the Naumkeag Steam Cotton Company built its first mill along the South River in the area of current day Shetland Park. French Canadians settled in this area and provided the labor force for the textile mills. The area was filled in to provide housing and more mill buildings. The Great Salem Fire of 1914 destroyed this area but it was quickly rebuilt. The area thrived until the 1950’s when the textile industry moved to the south. Over the past few decades, many Spanish speaking immigrants have settled in this area.
There are several additional areas in Salem located further from the SHR Project property and these are classified as containing low income and minority populations.
III. Public Participation
Footprint has conducted informational meetings, answered questions, and translated presentations in non-English languages, in response to public interest and to encourage public participation. The following is a summary of the public outreach, including outreach to EJ communities, conducted over the past year.
• Notification of Filing an Environmental Notification Form (ENF) under the Massachusetts Environmental Policy Act (MEPA) – August, 2012
A legal notice of the availability of the ENF was published in the Salem News in English, Spanish and Portuguese on August 8, 2012. It was also published in the Marblehead Reporter in English on August 9, 2012. Additional publication of the Legal Notice of Environmental Review was published in English, Spanish and Portuguese in the Boston Globe on August, 18, 2012, the Lynn Daily Item on August 21,
3
2012 and in the Danvers Herald, the Beverly Citizen and the Peabody-Lynnfield Weekly News on August 23, 2012.
• Energy Facilities Siting Board (EFSB) Public Hearing, Salem MA – September 19, 2012
The following actions were taken by Footprint for the EFSB Hearing:
--Placed Notification advertisements in both English and Spanish in the Boston Globe, Salem News, and Spanish Paper El Mundo. --Placed English and Spanish Legal Notice of the of EFSB Petition, stating Footprint Power’s Development plans and the date/location of upcoming EFSB hearings, in the following locations: Salem Public Library, City Clerk’s Office, North Shore Community Development Coalition, Salem Housing Authority, and ABE/ESOL Training Resources of America (Salem Office). English copies of the EFSB Petition were also placed in these locations. Notification of the placement of these EFSB documents in both English and Spanish was placed in the EFSB advertisements in all three papers. --Mailed EFSB Notice to abutters of existing Salem Harbor Power Plant. --Retained services of Spanish translator for EFSB hearings, to both translate information as it was presented, and to translate questions presented from the public in Spanish. --Offered to meet with interested members of the public along with Spanish translator.
• Presentation to Historic Derby Street Neighborhood Association, November 12, 2012
In addition to the presentation, Footprint offered to Linda Haley, Chairperson that representatives would meet with individual residents to answer questions if requested.
• Draft Environmental Impact Report, December 2012
Notice of the public scoping meeting and site visit was sent to Beverly, Lynn, Salem, Peabody, Marblehead, and Danvers. Notification of the availability of the Draft Environmental Impact Report was published in the Boston Globe, the Salem News, the Marblehead Reporter, the Beverly Citizen, the Danvers Herald, the Lynn Daily Item and the Peabody-Lynnfield Weekly News in English, Spanish and Portuguese. These notices appeared on December 19 and December 20, 2012 with the exception of the Marblehead Reporter notice which appeared on December 27, 2012.
• Presentation to the Salem Harbor Power Plant Stakeholders Group, January 22, 2013
Members have been appointed by Mayor Kim Driscoll. The Stakeholders are those individuals who represent abutters to the plant, city officials whose position speaks for abutters (e.g., City Councilors, state elected officials, etc.). Footprint has made a pledge to respond to all requests for information (English or Spanish), and to openly discuss Community needs and requests.
• Presentation to The Point Neighborhood Association, February 25, 2013
Lucy Corchado, Chairperson. Footprint provided a Spanish Translator. The presentation was translated to Spanish sentence for sentence by the translator. Much of the Point leadership attended the meeting and many questions were asked. The translator obtained questions from the Point membership, translated
4
those questions into English so they could be answered by Footprint representatives, and then translated back into Spanish in response to the questioner. Footprint Power offered to either meet with any members and provide a Spanish interpreter, or to respond in writing (Spanish) to questions if submitted.
• Public Presentation at the Bentley Elementary School, February 26, 2013
At Mayor Driscoll’s request, Footprint made a presentation to the general public. The public was invited to ask questions and/or request additional information.
• Final Environmental Impact Report, April 4, 2013
Notification of the availability of the Draft Environmental Impact Report was published in the Boston Globe, the Salem News, the Marblehead Reporter, the Beverly Citizen, the Danvers Herald, the Lynn Daily Item and the Peabody-Lynnfield Weekly News in English, Spanish and Portuguese on April 4, 2013.
• Salem Planning Board Meetings, May 2, 2013, May 6, 2013, and June 6, 2013
These meetings are being continued to June 20, 2013 and are held at Bentley Elementary School. They are open to the public.
• Ongoing coordination with Lucy Corchado, Chairperson of the Point Neighborhood Association
Footprint is in process of translating most recent/complete power point presentation into Spanish for distribution to the membership. Footprint has asked if there are other issues, questions or concerns about which she or her membership would like us to translate/provide information or responses.
IV. Impact Analysis
Prior to 1949 the site was used for commercial purposes related to the handling of coal and oil. The first power plant built on the site was a coal fired unit that commenced operation in 1951. A second coal-fired generation unit commenced operation in 1952, and a third coal-fired unit was added in 1958. In 1978 a fourth, oil-fired, unit was added. The existing facility has operated as a grandfathered facility (that did not have to meet emissions standards applied to new power plants) for many years and would not have been able to be built under today’s environmental regulations. However, the existing facility did provide a significant economic value to the residents of Salem in tax payments. The proposed SHR facility will result in significant decreases of emissions, not just as compared with the existing facility, but also regionally, while providing a tax benefit to the City of Salem and its residents.
Once operational, the SHR Facility will be the most efficient fossil-fueled electric generator in the Northeast Massachusetts (NEMA) zone and is expected to provide 5.1 million MWh of electricity annually. This additional supply will reduce the need for generation from other power plants with lower efficiency and higher operating costs, primarily fueled by natural gas, oil, and coal. Charles River Associates has conducted an analysis projecting the operation of the New England bulk power system over the period 2016-2025, for scenarios with and without the SHR Facility in service, and quantified the
5
expected changes in air emissions by the project directly and the associated reductions of emissions at competing plants elsewhere in New England and, in particular, Massachusetts. One of the key findings of this study is that because it displaces other, less efficient generation on the New England grid, operation of the SHR Facility reduces annual regional air emissions by 457,626 tons (1.3%) of CO2, 984 tons (10%) of NOx, and 888 tons (8%) of SO2.
Health Risk Assessment
Footprint commissioned a health risk assessment (HRA) for the EFSB process to assess the potential for human health risk associated with the SHR Project.4 Gradient Corporation prepared the human health risk assessment evaluating the likelihood of both acute non-cancer health risks and chronic non-cancer and cancer health risks that may result from people's inhalation of airborne pollutants for SHR Project stack air emissions. Gradient also collected relevant background health information for Salem and surrounding communities to determine if any types of disease (e.g., cancer and asthma) were higher than expected compared to Massachusetts as a whole.
Overall, the health risk assessment for the SHR Project indicates that maximum predicted air levels of specific substances associated with SHR Project air emissions would not be expected to contribute to adverse health effects among potentially affected populations. Several separate lines of evidence from the HRA support the conclusion that the potential air emissions from the SHR Project are not expected to have an adverse effect on public health in the Salem area. These include the following:
1. The maximum cumulative air concentrations (project impact plus existing background) of the criteria pollutants of concern, which include SO2, CO, NO2, and PM, are well below the health-protective NAAQS. NAAQS are set to protect human health with a wide margin of safety even for sensitive populations. Stack emissions of criteria air pollutants are thus not expected to lead to impacts on human health (e.g., asthma, cardiovascular and respiratory diseases) in nearby communities, even in sensitive populations.
2. The quantitative HRA showed that, for possible non-cancer effects, all hazard quotients (HQs), calculated for an off-site resident exposed to maximum modeled incremental SHR Project stack impacts, were well below unity (HQ = 1), with none being higher than HQ = 0.01. The overall summed HI for SHR Project stack emissions is also well below 1.0, i.e., HI = 0.08. These results help assure that non-cancer, adverse health effects are not to be expected from the non-criteria air-pollutant emissions.
3. The quantitative HRA showed that conservatively projected cancer risks for maximum modeled SHR Project stack impacts of possible carcinogenic chemicals were well below the 1 in 10,000 to 1 in 1,000,000 lifetime risk range, which is considered to be acceptably low by US EPA. The overall summed cancer risk from the Project was about 1 in 10,000,000 over a lifetime, which is well below the US EPA de minimis risk level. The individual pollutant cancer risks were each even lower than the de minimis level, between about 1 in 10,000,000,000 and about 4 in 100,000,000. These results support de minimis cancer risk from worst-case chronic exposures to maximum modeled SHR Project stack impacts.
4. Based on the air-modeling results, short-term SHR air emissions impacts are not expected to give rise to acute health effects. SHR Project-related maximum short-term concentrations of SO2 and
4 Gradient Corporation, “Health Risk Assessment (HRA) for the Salem Harbor Redevelopment (SHR) Project”, January 4, 2013.
6
NO2 were compared to short-term exposure guidelines and standards, including the short-term NAAQS for SO2 and NO2 which were specifically designed to protect against asthma exacerbation and respiratory irritation. The comparisons show that the cumulative impacts (maximum 1-hour + ambient background) for NO2 and SO2 are well below the 1-hour health-protective NAAQS as well as other short-term exposure guideline levels.
5. The review of community health data for Salem and nearby communities has indicated that the Salem area has overall similar rates of asthma, cardiovascular conditions, and cancer compared with the state as a whole. In combination with the results of the HRA, Gradient concluded that air emissions from operation of the proposed SHR Project are not expected to significantly alter any of these baseline health statistics.
Additional Analysis of Surrounding Areas
The maximum criteria air pollutant impacts from the Project were also compared to the EPA- and MassDEP-adopted significant impact levels (SILs). SILs are impact levels set at only a few percent of the ambient air quality standards and below which the regulatory agencies consider impacts to be insignificant.5 Impacts above the SILs are not considered significant, but rather additional modeling is required to demonstrate that the proposed project will not exceed the NAAQS. A significant impact area (SIA) is the area of a circle having the radius of the maximum distance from a source to the point at which concentrations drop below the SIL. However, in EJ analyses, the SIA is often presented on a direction specific basis and represents all receptors which projected impacts above the SIL.
The dispersion modeling completed for the SHR Project demonstrates that the predicted maximum impacts from the Facility for the majority of criteria air pollutants are below the SILs at all locations and therefore, represent no adverse human health or environmental effects to Salem and outlying communities. The predicted impacts of the SHR Facility resulted in slight to moderate execedances of SILs for only PM2.5 (24-hour average concentrations), and NO2 (1-hour concentrations). Since the SILs are set considerably lower than the NAAQS, the modeled emissions do not necessarily mean a project’s impacts would be unhealthy or would have an adverse effect on any population. Footprint evaluated these as a way to determine if an EJ area would be disproportionately subject to higher air impacts than other segments of the community at large.
Figures 2 through 4 depict maximum pollutant impact concentration contours (also called isopleths) associated with emissions from the SHR Facility. These are shown with respect to the EJ communities in Salem and surrounding communities. The corresponding SIL concentrations are shown in a striped pattern. The area between the Project and the SIL contour is above the SIL concentration and represents the SIA.
The following sections describe the maximum modeled impacts for the only two pollutants with maximum impacts exceeding their respective SIL with specific reference to the SIAs in reference to nearby EJ areas versus other nearby areas.
5 For example, the 1-hour NO2 SIL is 7.5 microgram per cubic meter versus the health based standard of 188 micrograms per cubic meter and the 24 hour PM2.5 SIL is 1.2 microgram per cubic meter versus the health based standard of 35 micrograms per cubic meter. These SIL concentrations are only 3 to 4 percent of the NAAQS.
7
NO2 Analysis
The 1-hour NO2 SIL is 7.5 µg/m3. The 1-hour NO2 isopleths are shown on Figures 2 and 3. The following summarizes the information on this figure.
• There are two small areas of isolated peak NO2 one-hour concentrations (in the range of 36 to 42 µg/m3 and well below the NAAQS of 188 µg/m3). These are located very close to the Project site to the northeast and southwest of the power plant stack. These areas are not close to any EJ areas.
• Maximum concentrations beyond approximately 1 kilometer from the SHR main stack are less than approximately 16 µg/m3 and thus are all less than 10% of the health based NAAQS. However, the SIA of 7.5 µg/m3 extends as far as 14 kilometers beyond the Footprint property line extending into Salem, Beverly, Marblehead, Middleton, Wenham, Danvers, Peabody, Lynn, and Swampscott. While this encompasses all of the EJ areas in Salem as well some in Beverly, Danvers, Middleton and Lynn, the population associated with the EJ areas within the SIA is a small percentage of the total population within the SIA.
The results of this assessment demonstrate that the SHR Facility’s NO2 impact concentrations will not have disproportionately high human health or environmental effects on EJ areas.
PM2.5 Analysis
Figure 4 shows isopleths of maximum 24-hour average predicted concentrations from the SHR Facility, respectively. The following summarizes the information on Figure 4.
• The highest 24-hour PM2.5 concentrations are only a small fraction of the health based NAAQS (3 to 4 µg/m3 compared to the 35 µg/m3 NAAQS). These areas of highest impact are very localized and generally occur either on plant property, in areas immediately adjacent to the site, or in Salem Harbor adjacent to the Salem shoreline.
• The 24-hour PM2.5 SIL is 1.2 µg/m3 and this SIA encompasses a two city block area of a low income EJ area just south of the South River. However, the vast majority of the SIA is within Salem Harbor or consists of residences and businesses in the Salem downtown area along Derby Street. It also encompasses Winter Island and a portion of the Salem Willows Park. The EJ area represents a very small percentage of the total population within the SIA.
The results of this assessment demonstrate that the SHR Facility’s PM2.5 emissions will not have disproportionately high human health or environmental effects on EJ areas.
CO2 Benefits
The EPA’s May 1, 2013 Draft EJ Guidance states, “The U.S. Climate Change Science Program stated as one of its conclusions: The United States is certainly capable of adapting to the collective impacts of climate change. However, there will still be certain individuals and locations where the adaptive capacity is less and these individuals and their communities will be disproportionally impacted by climate change. Therefore, these specific population groups may receive benefits from reductions in greenhouse gas
8
(GHG) emissions.” Operation of the proposed Project is actually projected to reduce (on a net basis) annual regional GHG emissions by 457,626 tons of CO2, even after taking into account the SHR Facility’s own CO2 emissions. This is based on the study done by Charles River Associates provided as Appendix C of the DEIR prepared for the Project. The CO2 reduction represents approximately 1.3% of the regional CO2 emissions from power plants.
V. Conclusion
The Proposed SHR Facility is not located in or adjacent to an EJ area, and Footprint has demonstrated that there will be no disproportional impact to any such community. Indeed, the proposed facility will be an improvement over emissions from the existing facility, and will reduce regional emissions of NOx, SO2 and CO2 to the benefit of all area residents. Footprint has demonstrated that emissions from the proposed SHR facility itself will be well within the NAAQS, which are designed to be health-protective of the most sensitive populations.
LYNN
ESSEX
PEABODY
BEVERLY
BOXFORD
IPSWICH
HAMILTON
DANVERS
SAUGUS
MIDDLETON
IPSWICH
SALEM
TOPSFIELD
GLOUCESTER
LYNNFIELD
WENHAM
NORTH ANDOVER
REVERE
WAKEFIELD
MALDEN
MANCHESTER
BOSTON
MELROSE
NORTH READING
EVERETT
CHELSEA
SWAMPSCOTT
ROWLEY
Figure 1
MANY
CT
NHVT
RI
Overview Map2010 Environmental Justice AreasWithin a 15-Mile Radius of the Site


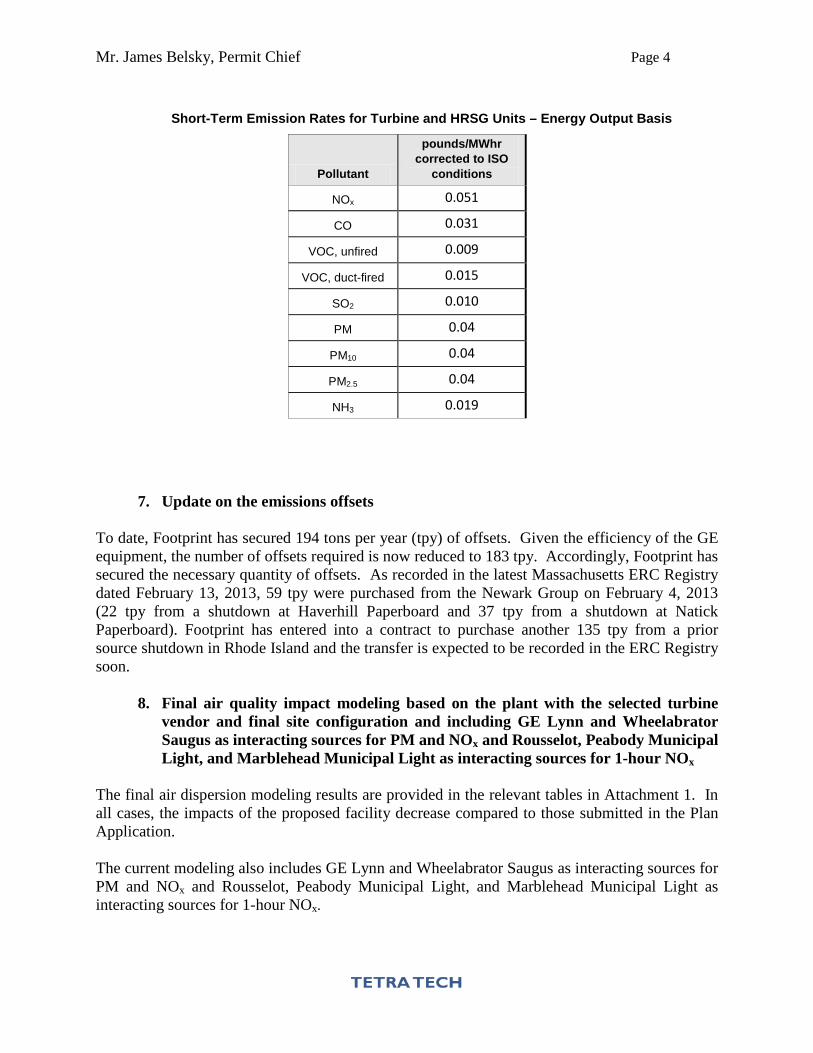


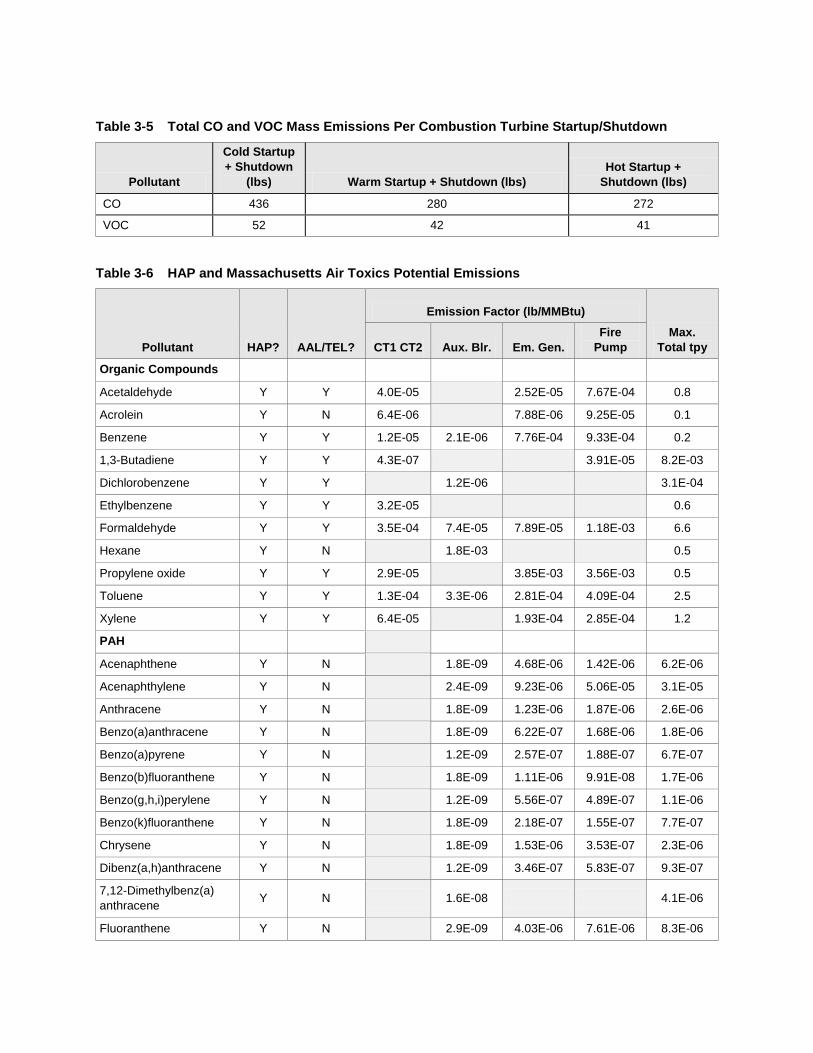

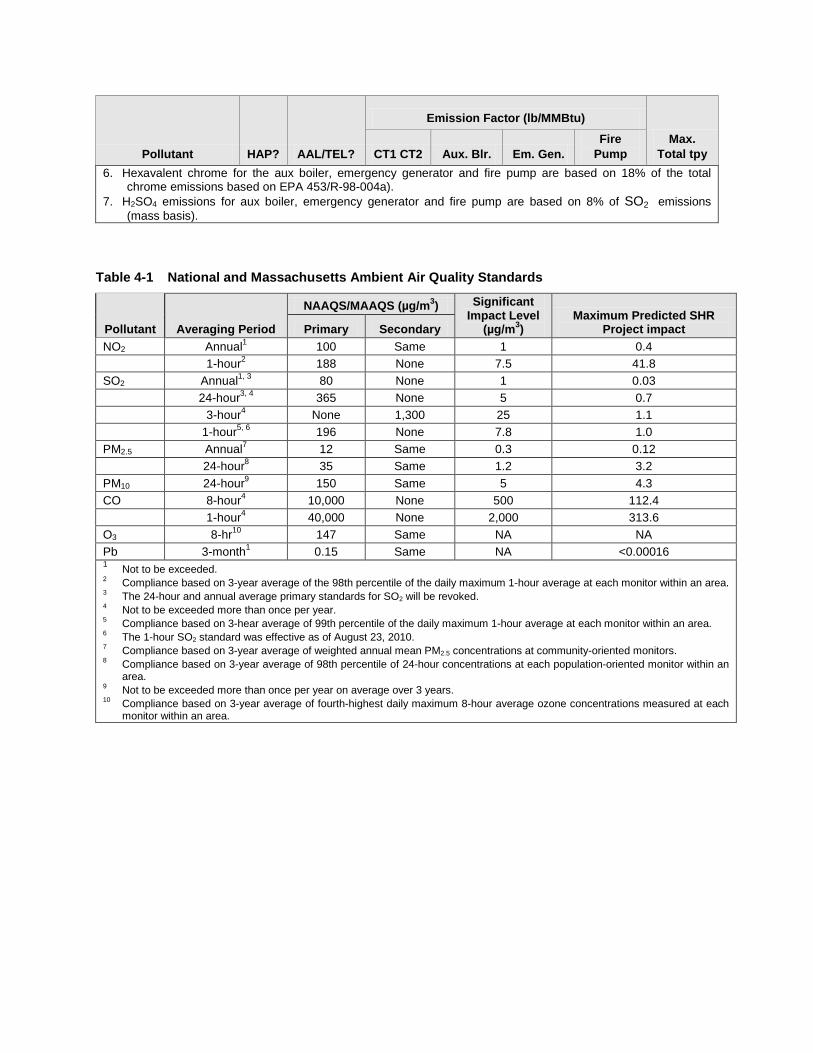

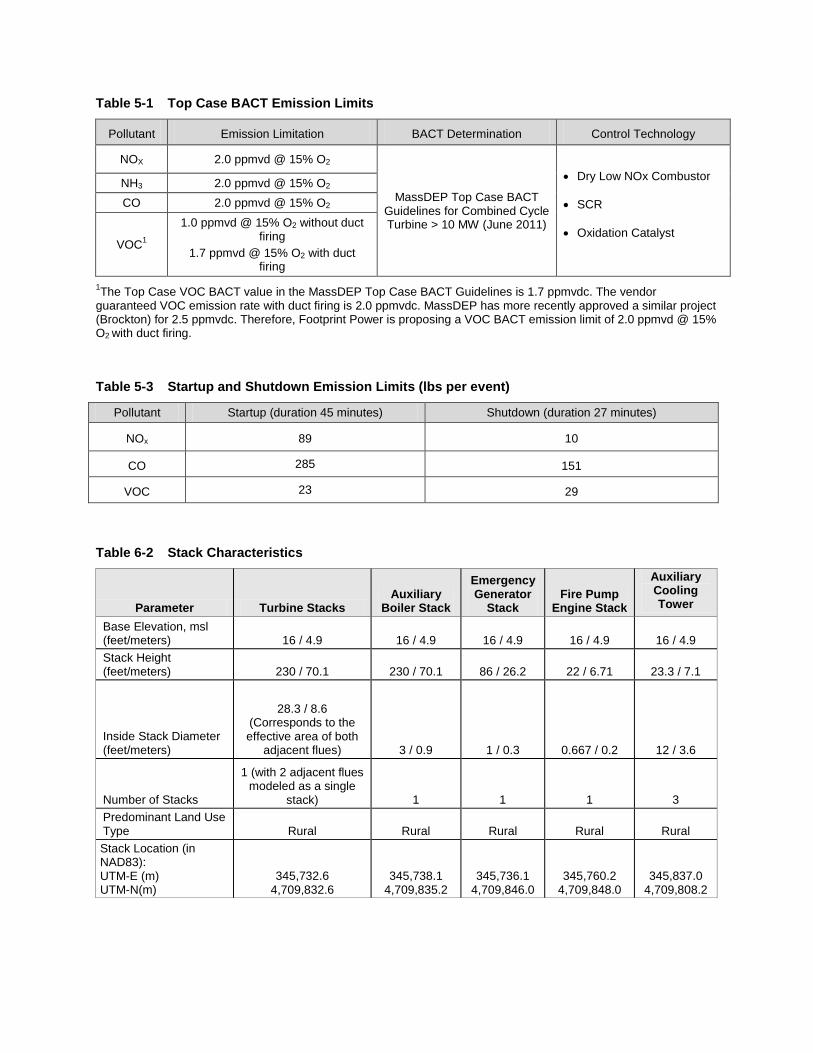
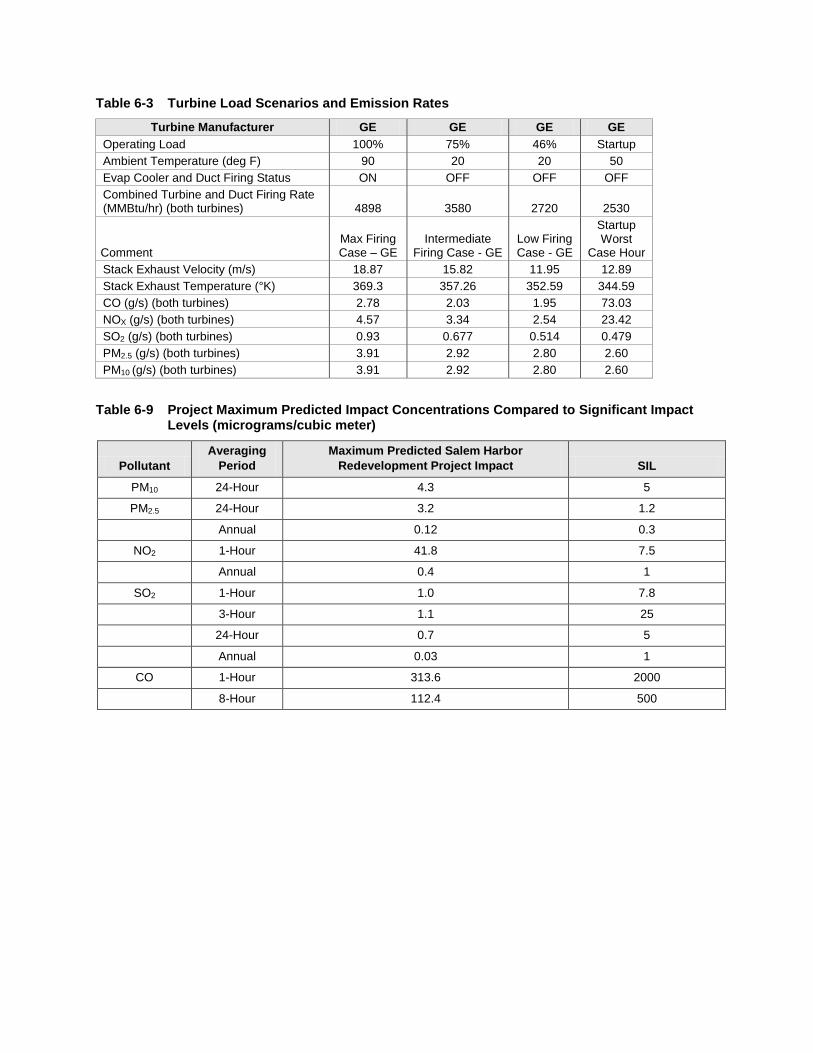

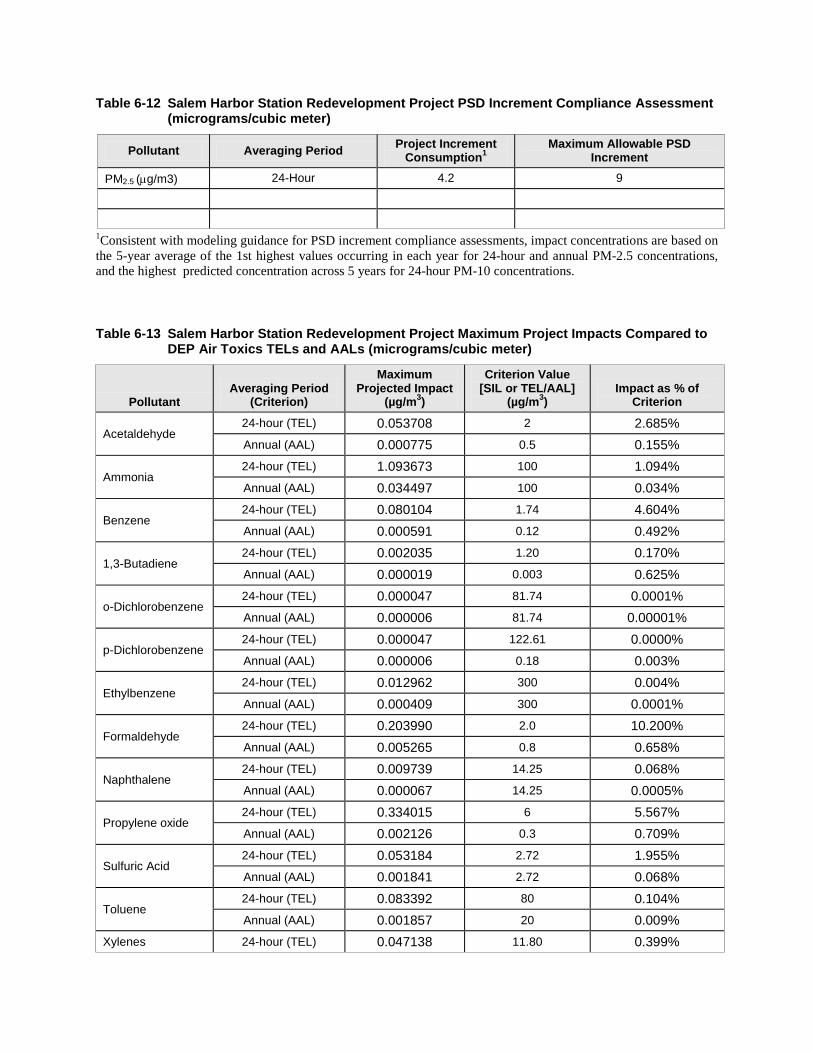
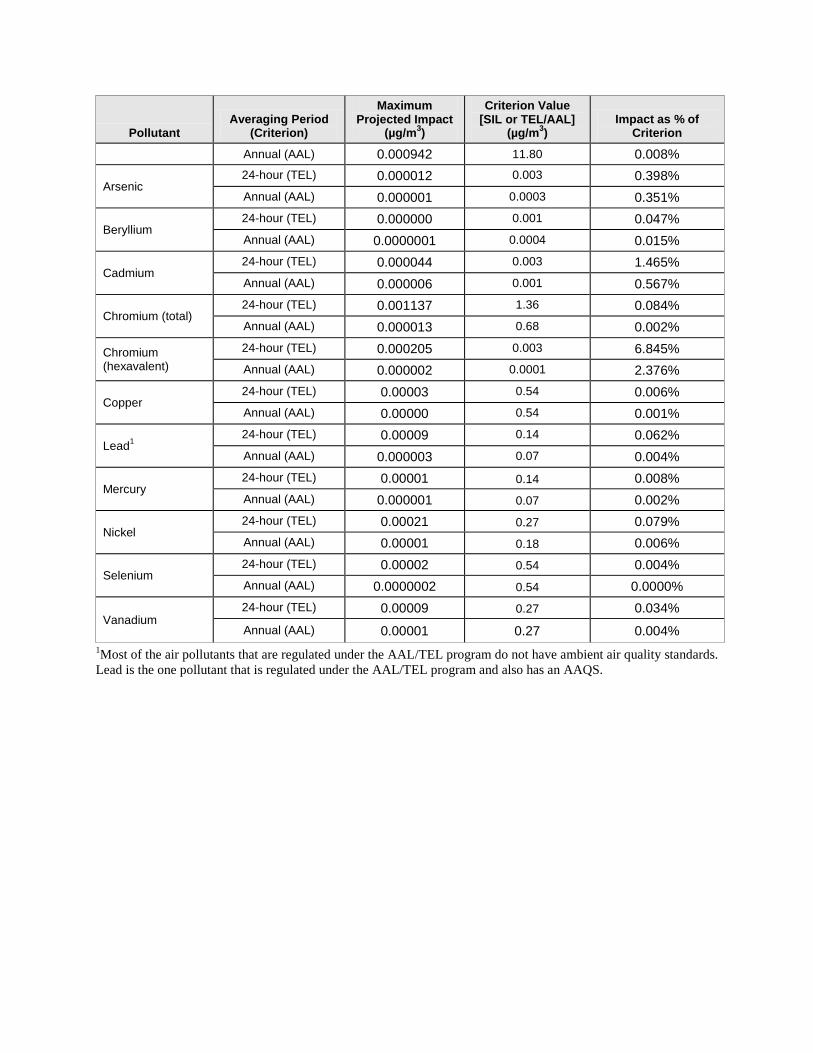


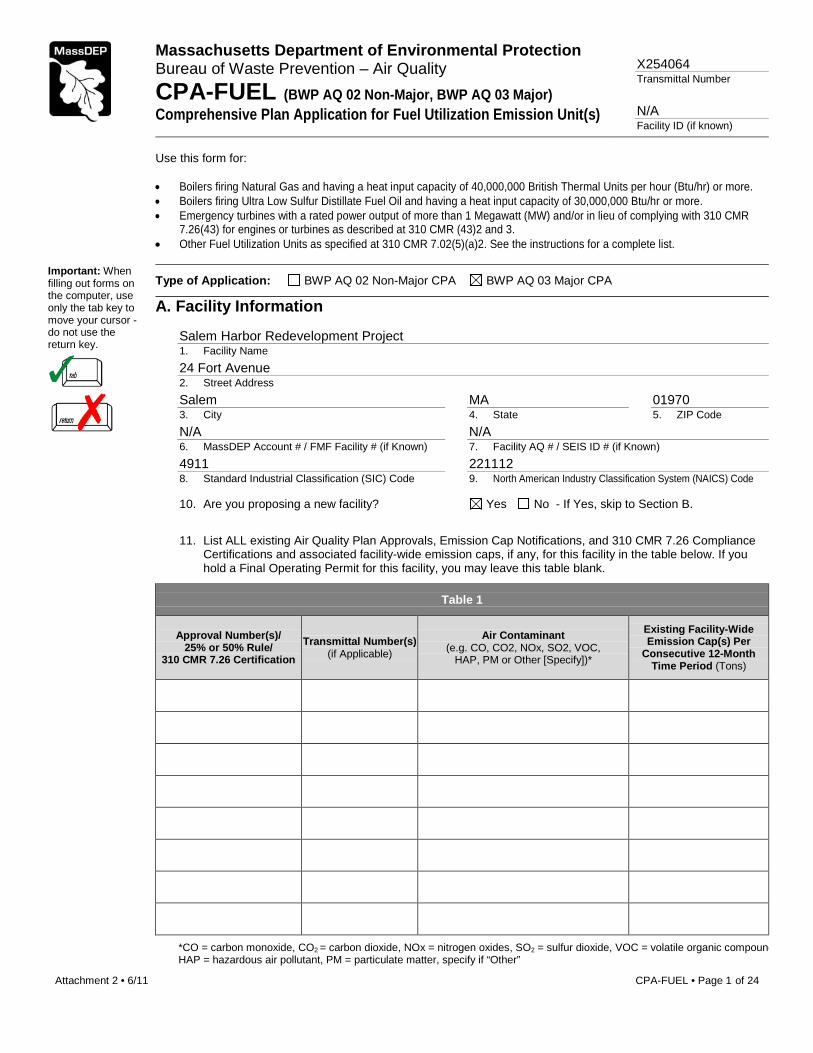


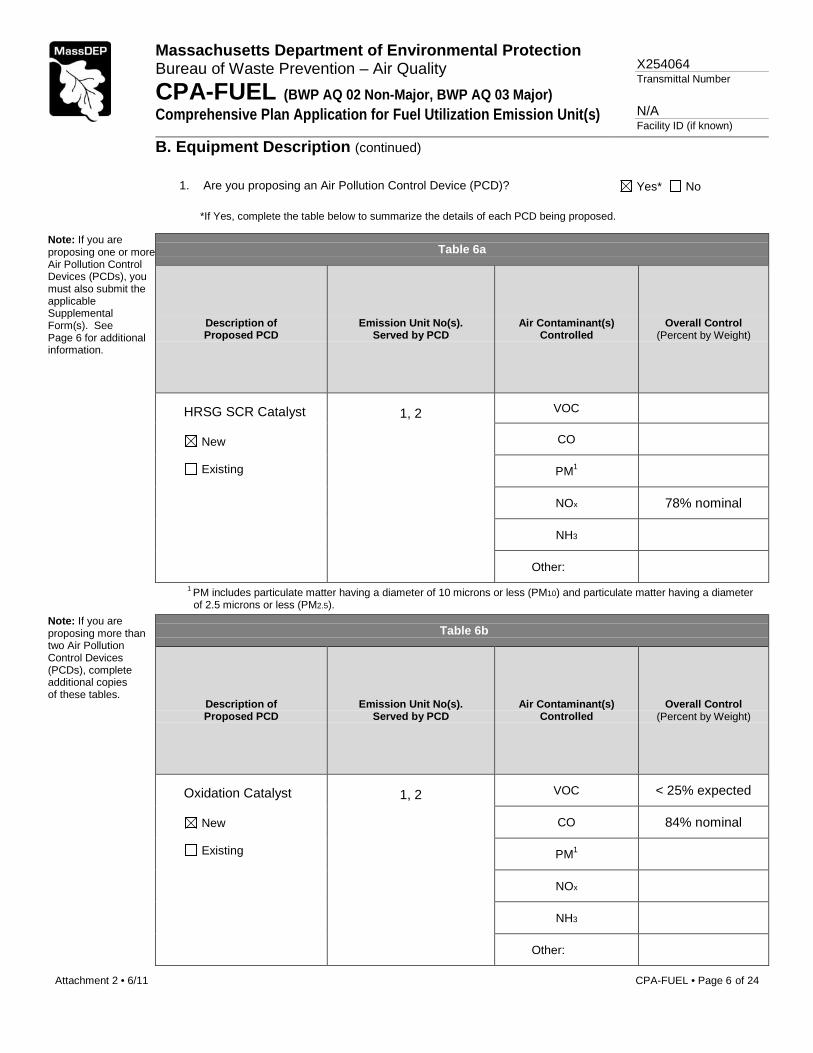

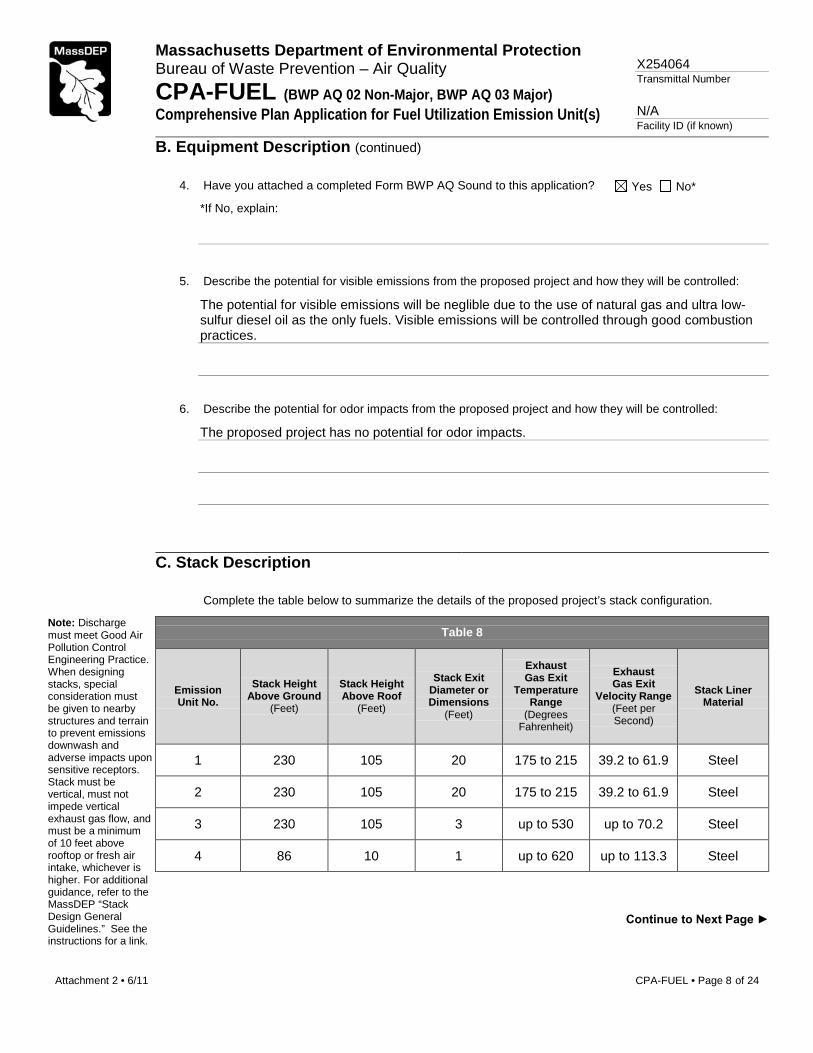
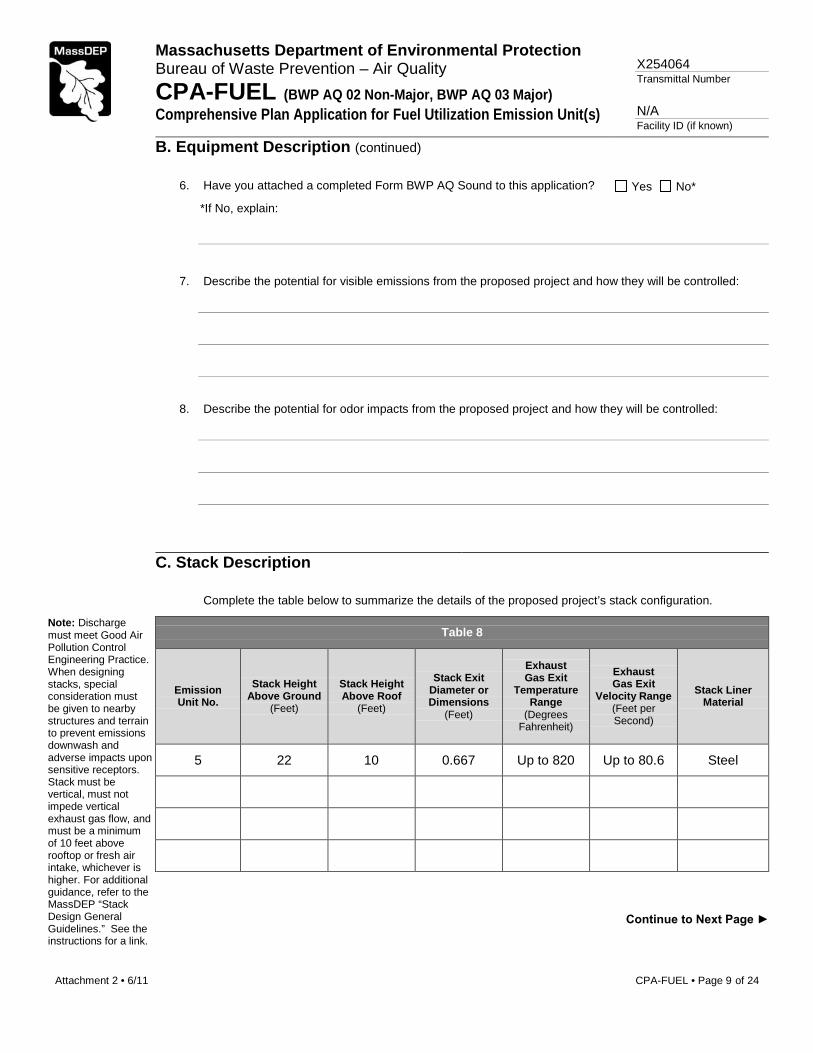


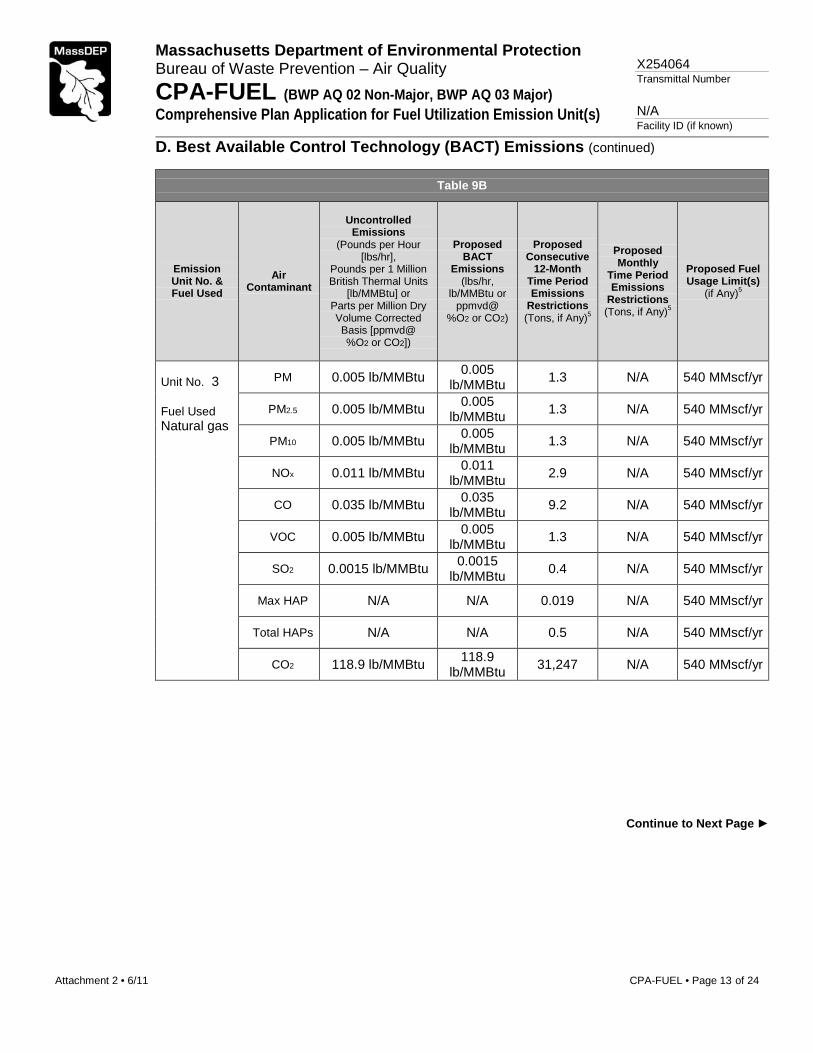


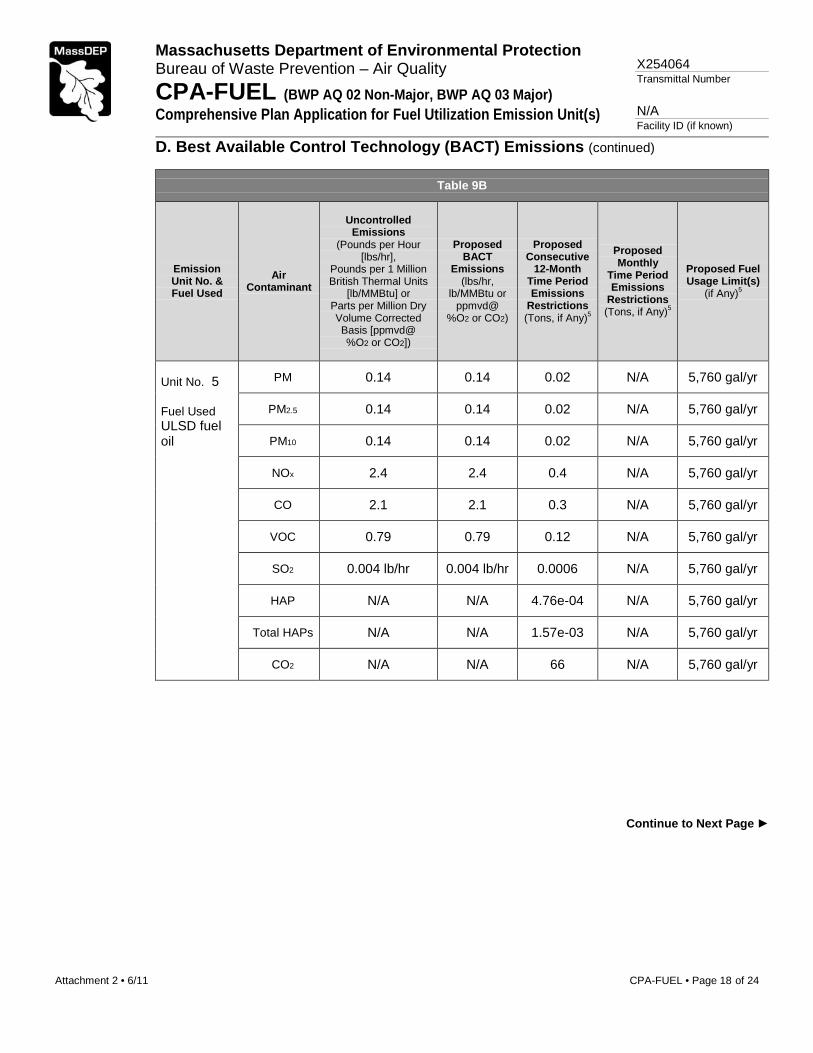


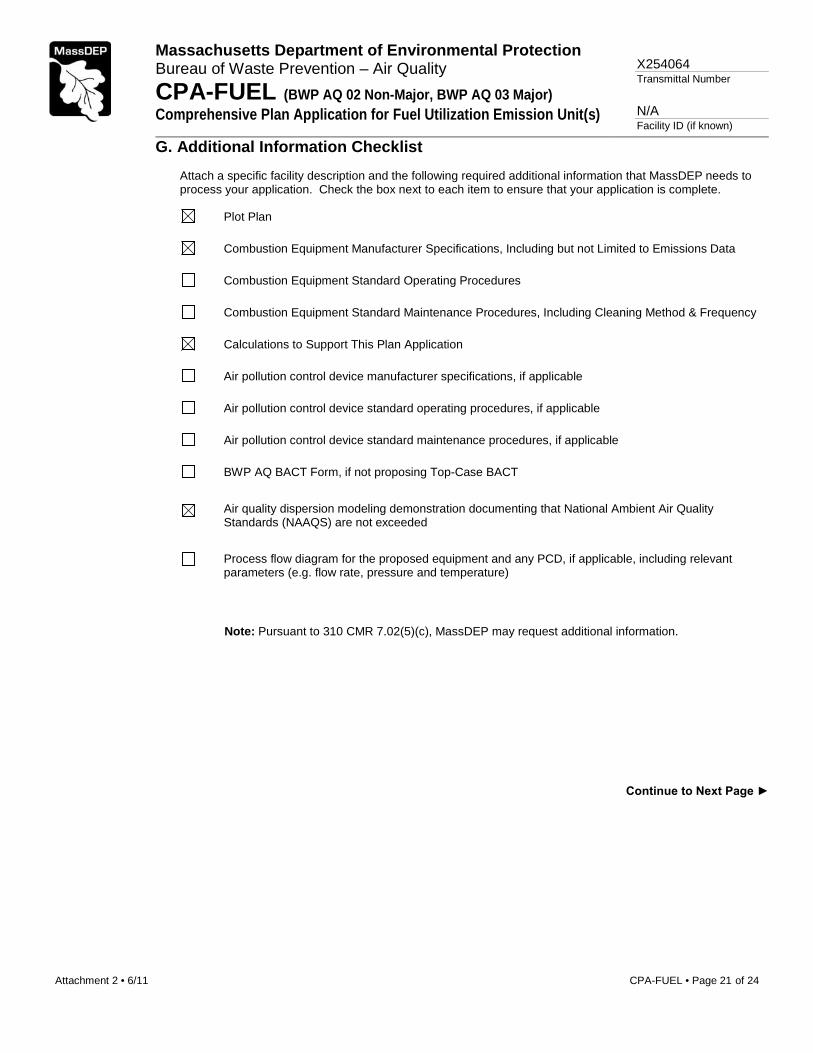

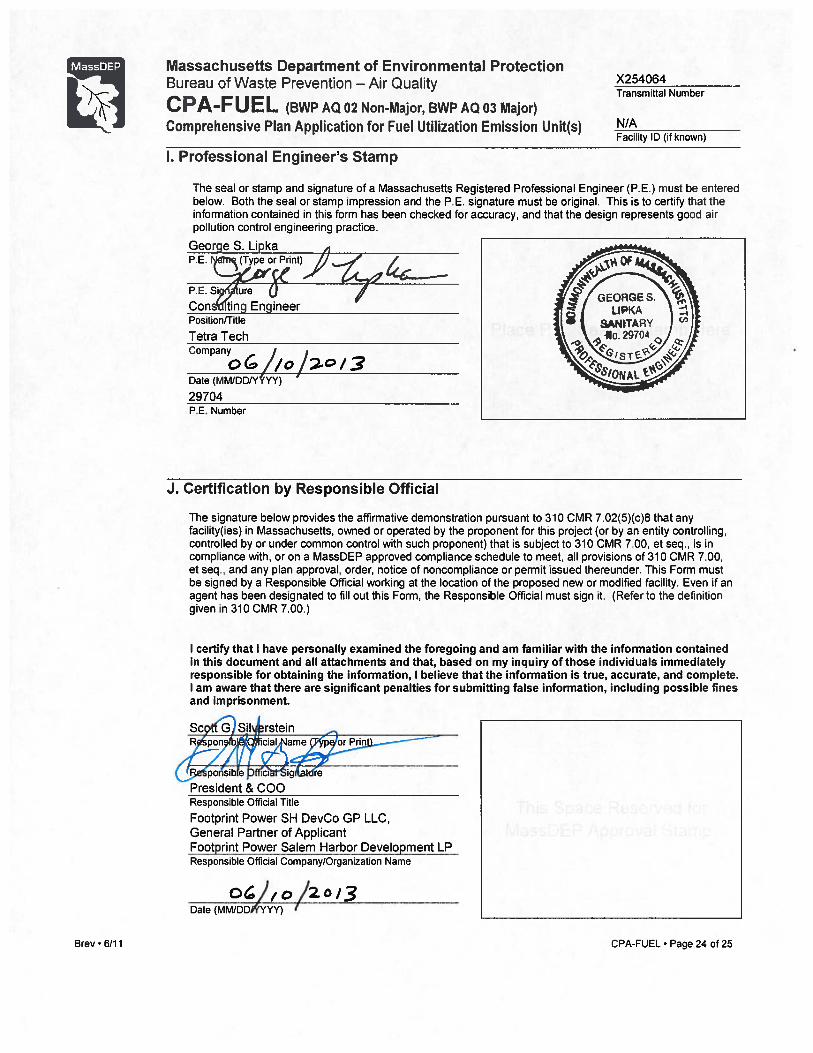
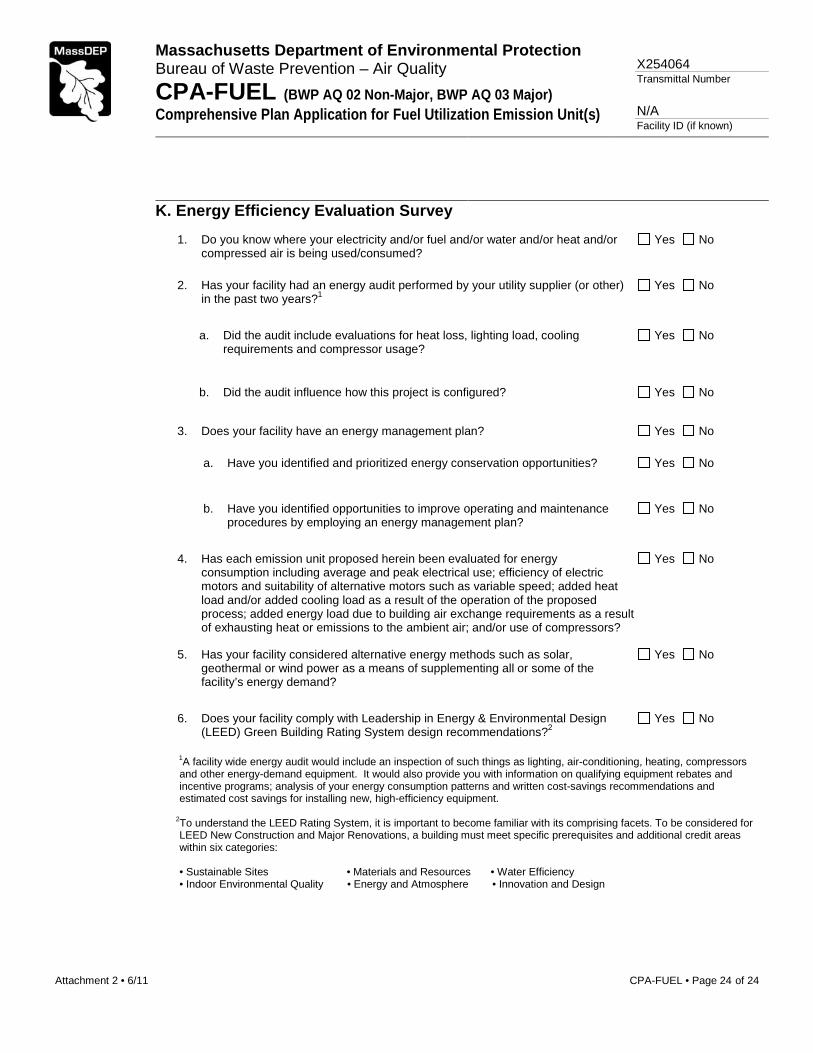
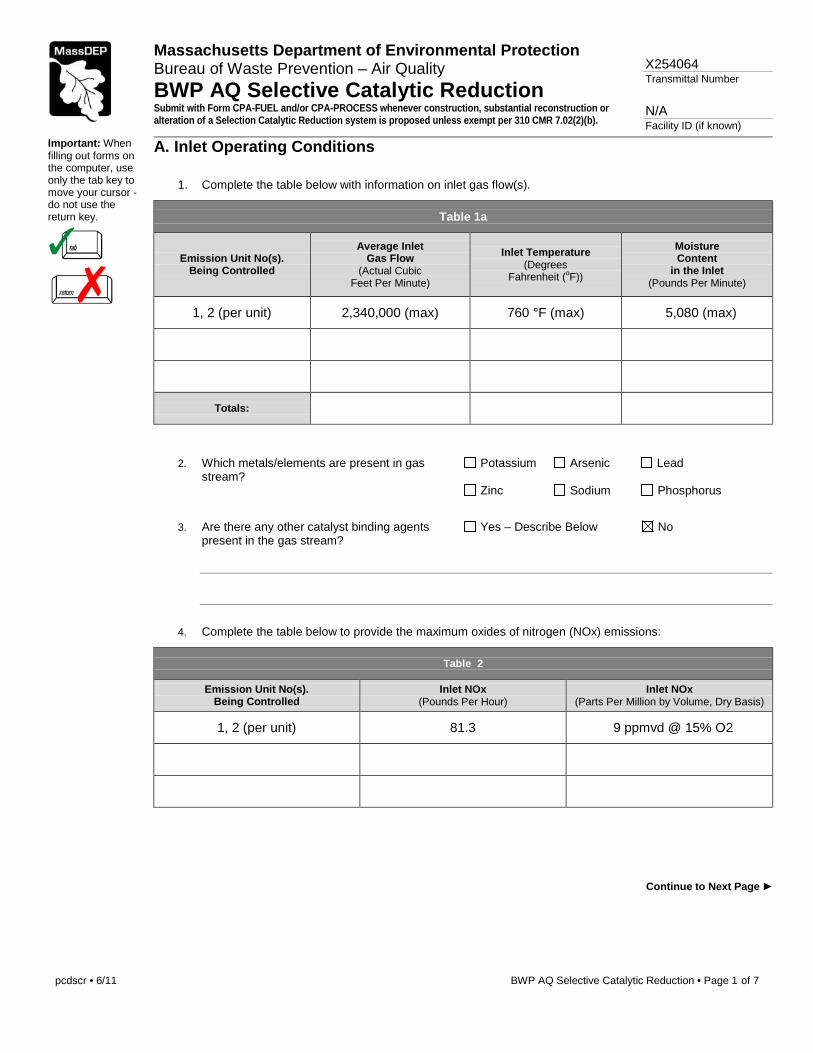


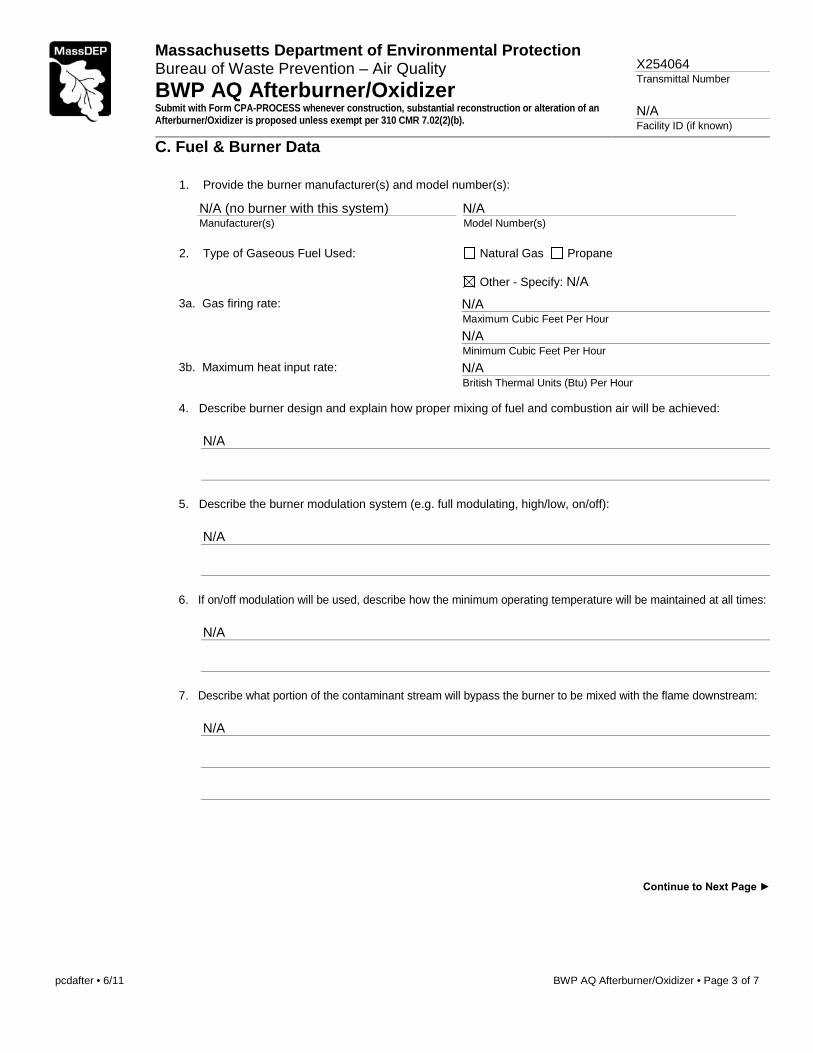
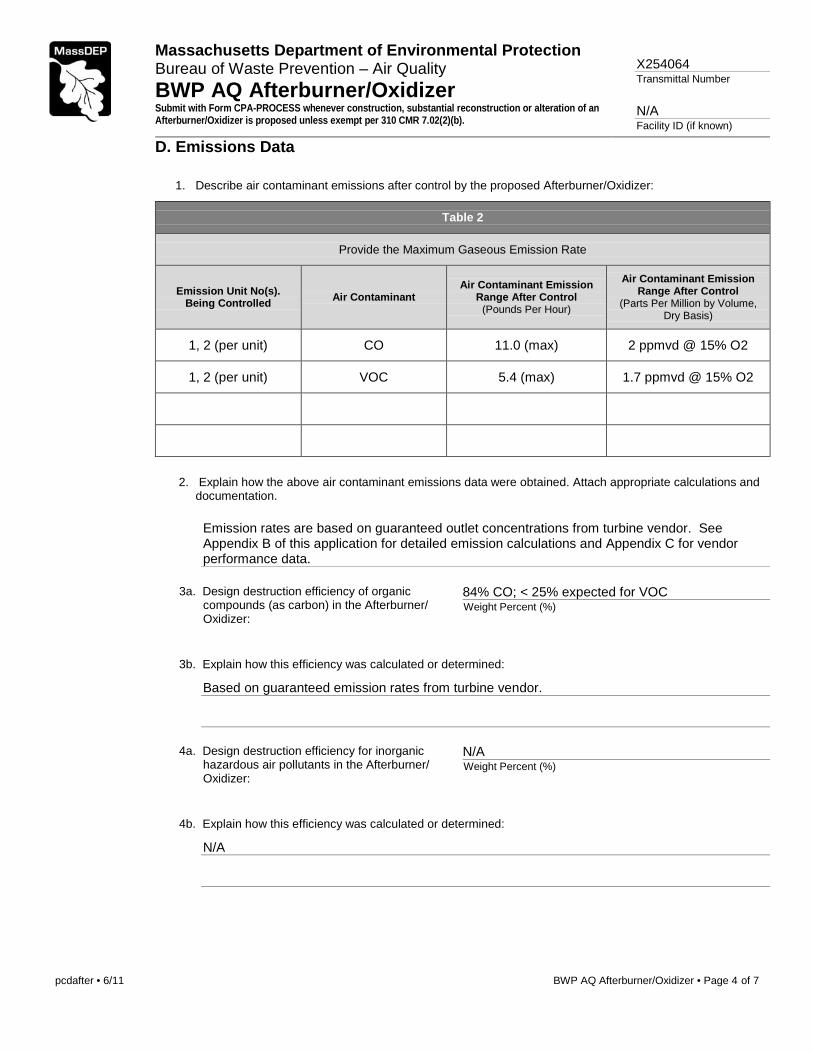


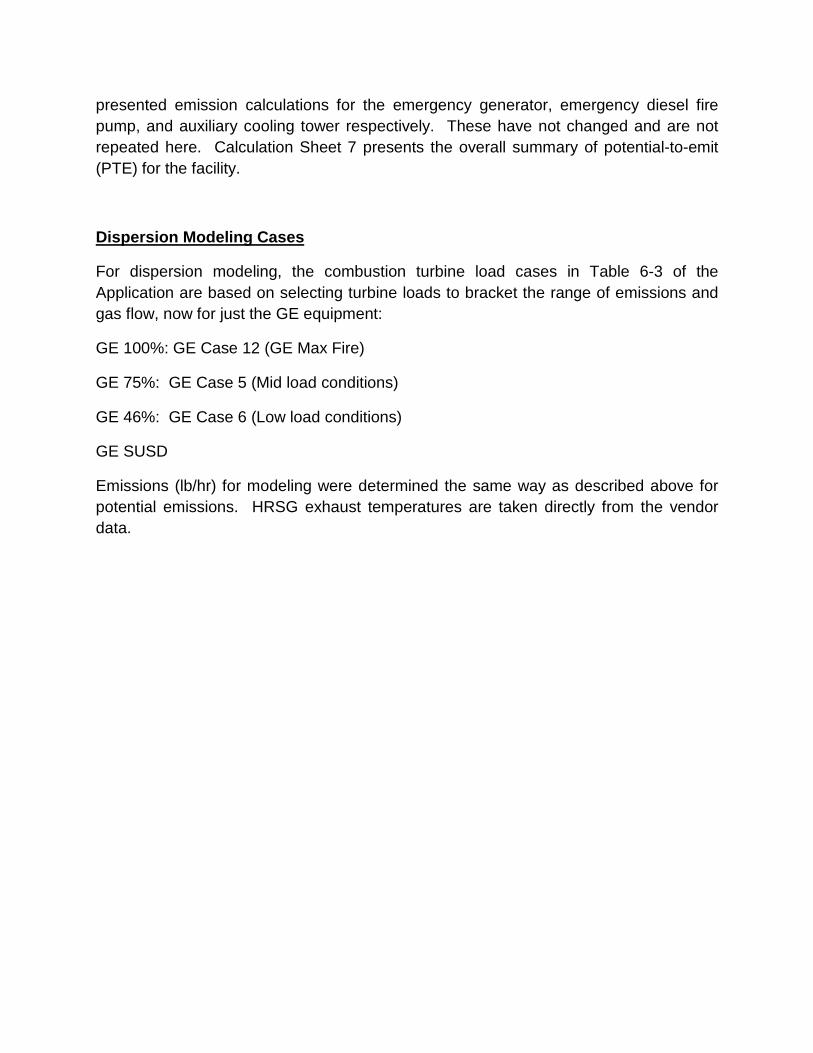


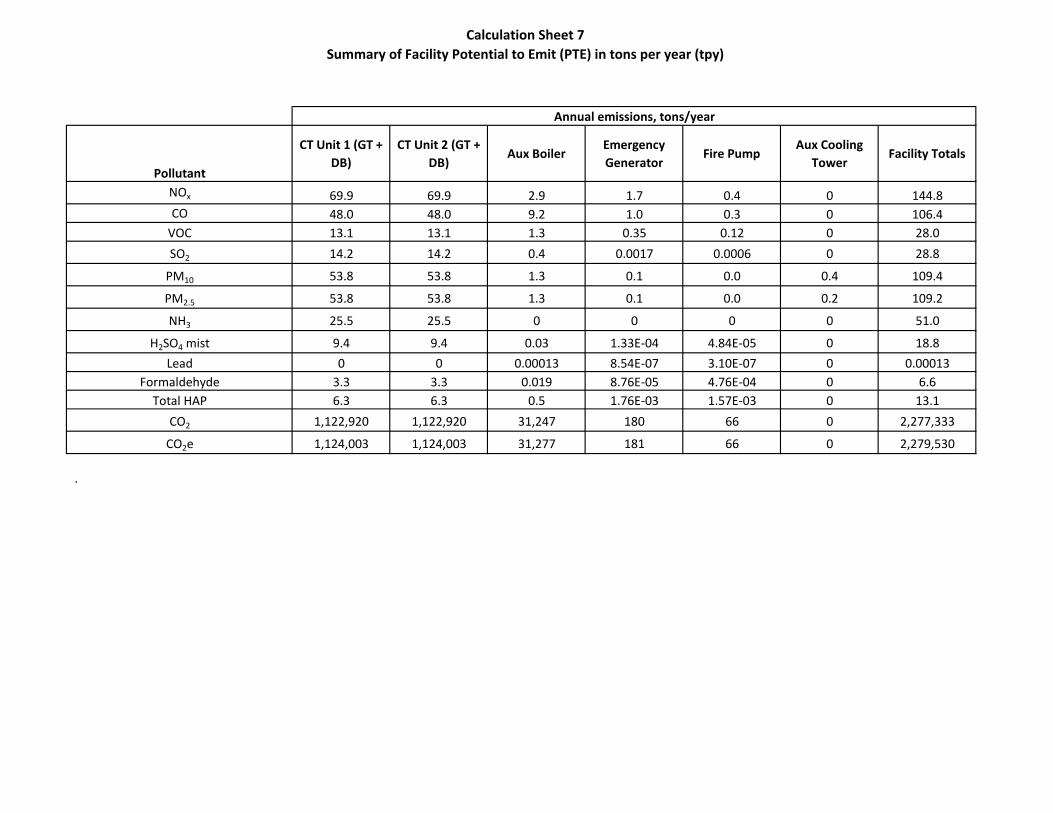


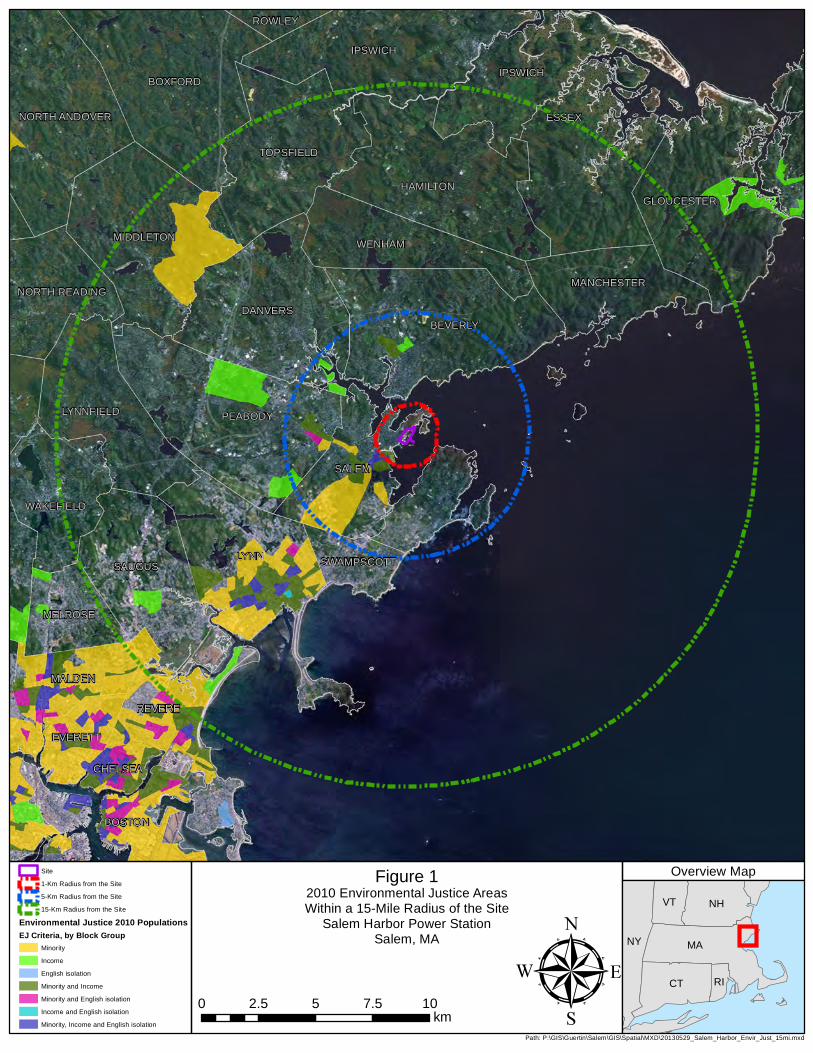
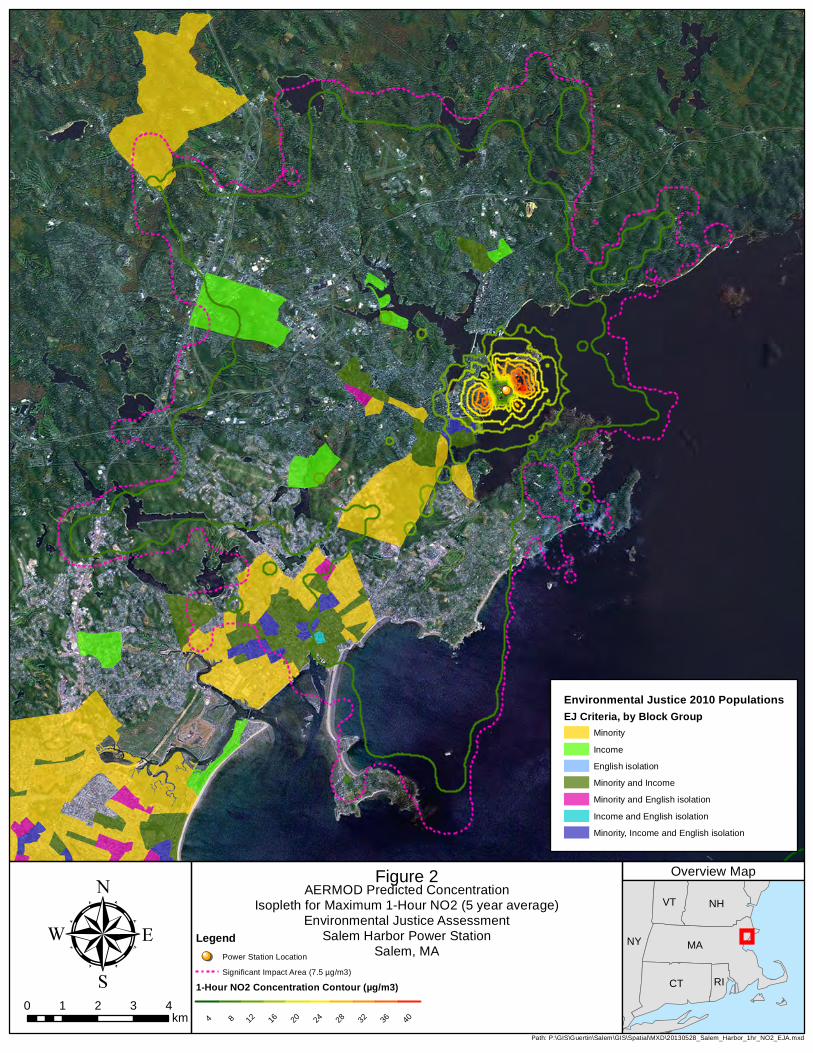
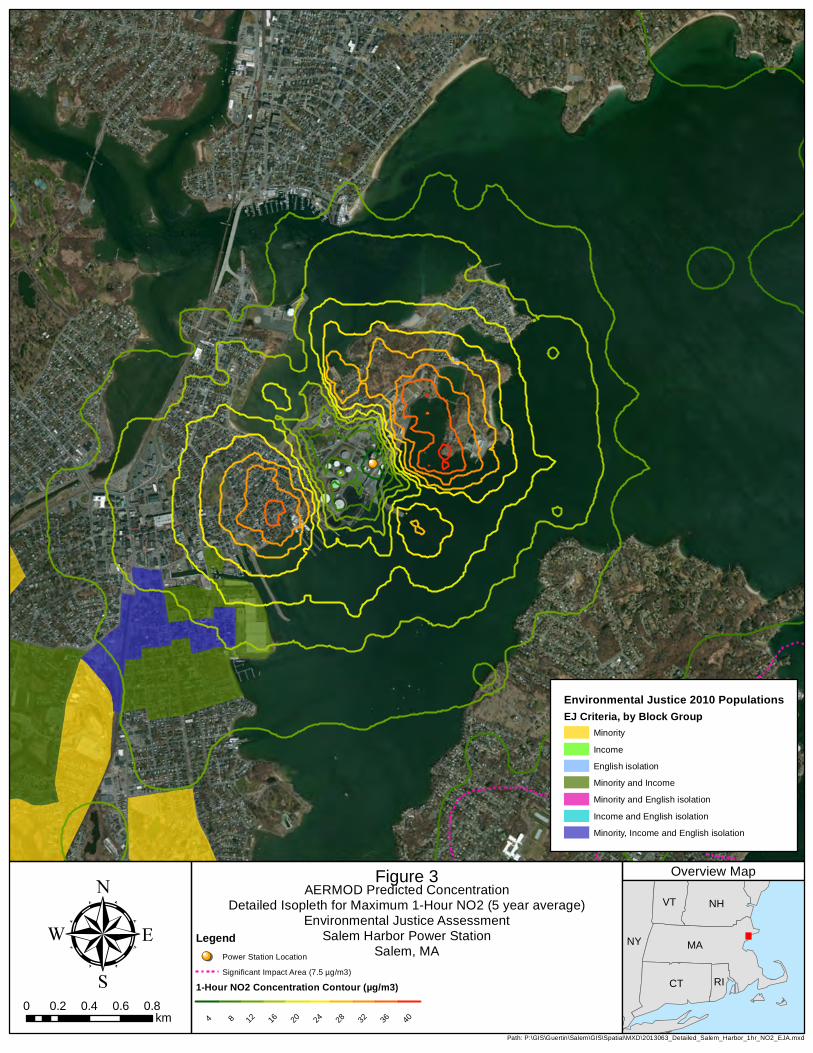


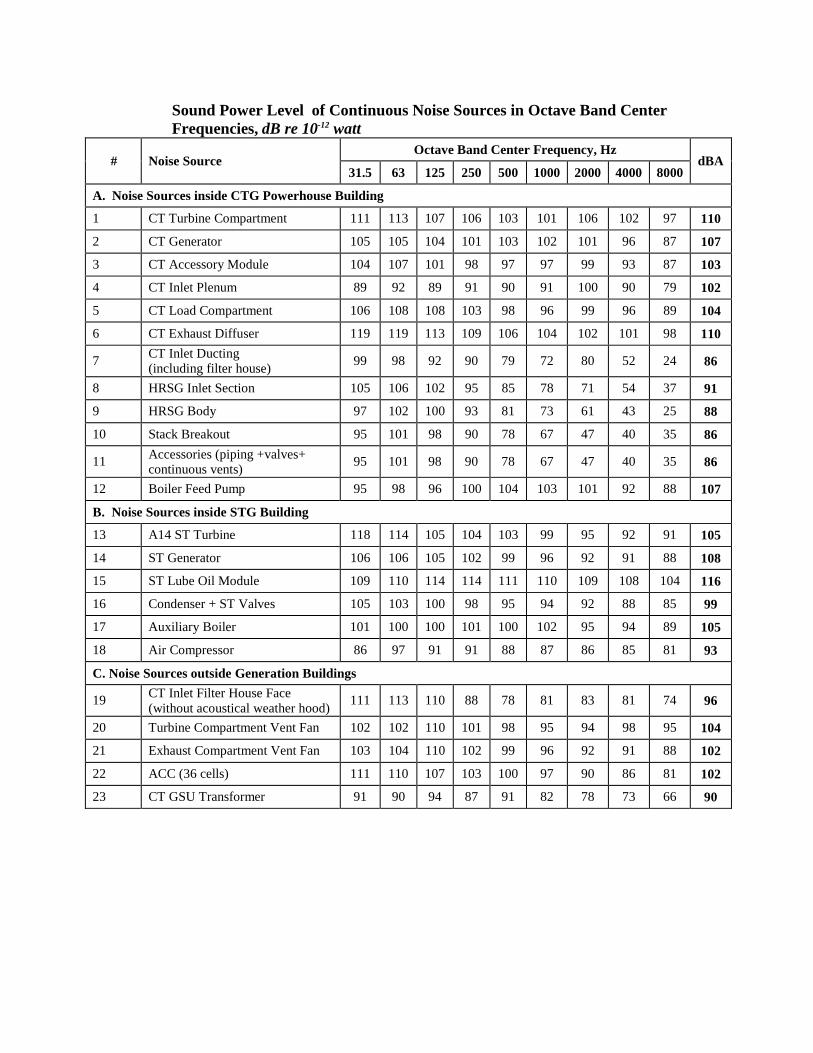


![,1 .] ^; ! >, I. , !' (i (•) I!';yosemite.epa.gov/oa/EAB_Web_Docket.nsf/Filings By Appeal Number... · Guardians ("WEG"), comments urging EPA to aggregate hundreds or thousands](https://static.documents.pub/doc/80x56/5f3a50646228d412002d100c/1-i-i-a-i-by-appeal-number-guardians-weg.jpg)


