20
June 11, 2013 DeLand Administrative Complex Board Room 9:00 A.M.

June 11, 2013DeLand Administrative Complex
Board Room9:00 A.M.

1. Overview of Workshop Dr. Margaret A. SmithSuperintendent
2. Financial Support to Improve Student Achievement Dr. Margaret A. SmithSuperintendent
3. Proposal for Preliminary 2013-2014 Operating (General Fund) Budget
Dr. Robert MollDeputy Superintendent
4. FY 14 Capital Budget and Five-Year Work Program Dr. Robert MollDeputy Superintendent
Ms. Saralee MorrisseyDirector for Planning
Goal: Protect student instructional programs, services and activities and class size requirements from further cuts by selecting other budget item reductions to balance the 2013-2014 operating budget.
Tentative Budget Adoption: July 23, 2013

• Florida Board of Education Budget Request for 2013-14August 2012
• 2013-14 FTE Projections finalized and transmitted to DOEDecember 2012
• Governor’s Budget for 2013-14January 31, 2013
• Budget Workshop February 26, 2013*
• Legislative Session BeginsMarch 5, 2013
• Budget Workshop – Department PresentationsMarch 12, 2013*
• Calculate Preliminary 2013-14 School Staffing and review with Area Superintendents and identified District staffApril 2013
• School Discretionary Budgets PreparedApril 2013
3

• Budget Workshop – Department PresentationsApril 9, 2013*
• Budget Workshop – Department PresentationsApril 23, 2013*
• Legislative Session endsMay 3, 2013
• Budget Workshop – Department PresentationsMay 7, 2013*
• Staffing Sheets Distributed to Principals May 8, 2013
• Budget Workshop - Board Direction and Florida Education Finance Program (FEFP) Final Conference Report May 14, 2013*
• Budget Workshop - Preliminary BudgetJune 11, 2013*
• Approval to Advertise the Tentative Budget and Millage Rates for 2013-14June 25, 2013
• Approval to expend between July 1 and the adoption of the tentative budget
June 25, 2013
4

• Property Appraiser Certifies the Tax RollJuly 1, 2013
• Dept. of Revenue Certifies Taxable Value to the Commissioner July 16, 2013
• DOE computes required local effort millage and certifies rate to each districtJuly 19, 2013
• First Public Hearing advertised in the local newspaper per Truth in Millage (TRIM) requirementsJuly 20, 2013
• Public Hearing and Adoption of Tentative Millage Rates and Tentative District BudgetJuly 23, 2013
•Superintendent advises Property Appraiser of the proposed millage, rolled-back rate, time, date and place of the final hearingBy August 4, 2013
• Property Appraiser prepares Notice of Proposed Property Taxes and mails TRIM notice By August 24, 2013
• Public Hearing and Adoption of Final Millage Rates and Final District BudgetSept. 10, 2013
5*Budget Workshops

Staffing Process
•Projected Enrollments sent to schools for input in March
•Preliminary Staffing calculated in April
•Principals receivedStaffing Sheets on May 8
PreliminaryBudget
•Legislative Session ends with Final FEFP Revenues on May 3, 2013
•Budget Reduction Options to be considered
•Preliminary Budget Presentation June 11, 2013
Tentative Budget
•Tax Roll Certified July 1, 2013
•Required Local Effort Certified July 19, 2013
•Public Hearing on Tentative Budget and Millage Rates July 23, 2013
Final Budget
•Approve 2012-13Annual Financial Report & 2012-13 Final Budget AmendmentSept 10, 2013
•Public Hearing and Adoption of Final Budget Sept 10, 2013
6

050
100150200250300350400450500
FY2007-08 FY2008-09 FY2009-10 FY2010-11 FY2011-12 FY2012-134th Calc.
FY2013-14Final Conf.
463.1 430.4389.9 386.5 372.4 379.8 396.4
20.6 19.58.0 7.0
6.5 5.9
FEFP Federal Funding (ARRA) Local Taxes - Critical Needs
Categorical Salary Allocation
7
$16.6 million
Volusia Cuts = $80.1 Million between July 2007 and July 2012
10.4

CountyTotal Funding Gain or
Loss FY04 ‐ FY14 CountyTotal Funding Gain or
Loss FY04 ‐ FY14Brevard (36,666,100) Miami‐Dade 340,873,807 Broward 368,224,526 Orange 26,767,928 Clay (17,216,943) Osceola (33,035,975)Collier 74,911,524 Palm Beach 301,158,515 Duval 40,872,090 Pasco (38,547,611)Escambia (90,671,395) Pinellas 22,379,532 Hillsborough 88,548,661 Polk (76,497,513)Lake (37,839,087) Sarasota (1,156,830)Lee 30,639,221 Seminole (18,218,160)Leon (45,039,441) St. Johns (18,890,660)Manatee (9,517,036) St. Lucie (25,442,247)Marion (74,689,037) Volusia (105,224,120)
(Based on the Conference Report for FY13-FY14 of Florida Education Finance Program (FEFP) dated April 29, 2013).8

(150,000,000)
(100,000,000)
(50,000,000)
0
50,000,000
100,000,000
150,000,000
200,000,000
250,000,000
300,000,000
350,000,000
400,000,000
9
Collier Gain of$74,911,524
Hillsborough Gain of$88,548,661
Palm Beach Gain of$301,158,515
Miami-Dade Gain of$340,873,807
Broward Gain of$368,224,526
Volusia Loss of$105,224,120
Polk Loss of$76,497,513Marion Loss of
$74,689,037
Escambia Loss of$90,671,395
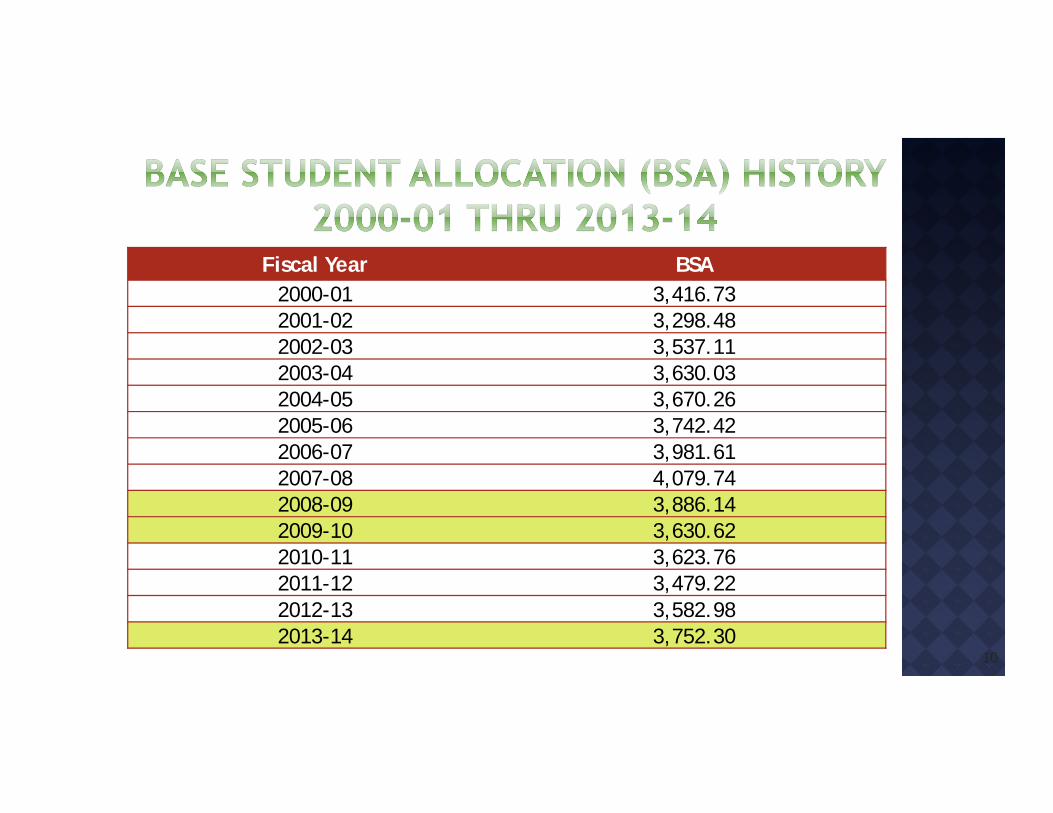
Fiscal Year BSA2000-01 3,416.732001-02 3,298.482002-03 3,537.112003-04 3,630.032004-05 3,670.262005-06 3,742.422006-07 3,981.612007-08 4,079.742008-09 3,886.142009-10 3,630.622010-11 3,623.762011-12 3,479.222012-13 3,582.982013-14 3,752.30
10

Year Rate Year Rate
FY 99 16.45 FY 07 9.85
FY 00 10.15 FY 08 9.85
FY 01 9.15 FY 09 9.85
FY 02 7.30 FY 10 9.85
FY 03 5.76 FY 11 10.77
FY 04 7.39 FY 12 4.91
FY 05 7.39 FY 13 5.18
FY 06 7.83 FY 14 6.95
11

No reduction to instructional programs, services or activities for the 2013-14 school year by not reducing instructional positions
Provide school staffing units at the level to meet class size requirements in core subjects for 2013-14
Provide intervention staffing units to support Differentiated Accountability schools
Move Advancement Via Individual Determination (AVID) program funding from federal funds to general funds
12

Florida Education Finance Program (FEFP) Funding
Class Size Compliance Challenges Expiration of 0.25 Critical Needs Ad
Valorem Assessment with defeat of 1 Mill Referendum
Health Insurance Impact of Patient Affordability
Health Care Act District Cost Differential (DCD)
Adjustment Outcome
13
Completed
TBD Completed
Completed TBD
Completed

Unfunded Pension Liability Caution regarding a Weak State
and Local Economic Forecast Outcome of Federal
Sequestration and Potential Effects on Federal Programs
Use of Non-recurring Revenues and Fund Balances for Recurring Budget Costs
14
Completed TBD
In Progress
Artifact 1

MillionsProjected Additional FEFP Revenue $ 16.6Less Instructional Personnel Salary Increase (10.4)Less Instructional Materials Increase (0.2)Less Teacher Lead Increase (0.3)
Discretionary FEFP Revenue $ 5.7*
15
* To be Applied to Retirement Rate Increases

Projected Revenue Changes Feb. 26(In Millions)
May 14(In Millions)
June 11(In Millions)
Projected Additional FEFP Revenue-TBD $ (2.7) $ 5.7 $ 5.7
Loss of 0.25 mill (6.4) (6.4) (6.4)
Reduction in Capital Transfer to General (2.0) (2.0) (2.0)
Projected Revenue Adjustments Total $ (11.1) $ (2.7) $ (2.7)
Projected Cost Increases
Class size Compliance – 103 units (123 Units from 2/26/13) 6.3 5.3 5.3
Unit Interventions – 50 Units (126 Units from 2/26/13) 6.5 2.6 2.6
Health Insurance - 5.5 % (9.5% from 2/26/13) 4.3 2.5 2.5
Retirement Rate Increase for FY 14 Revenue (Change from 2/26/13) 5.1 5.9 5.9
AVID 0.8
Dual Enrollment 1.5
Projected Cost Adjustments Total $ 22.2 $ 16.3 $ 18.6
Projected Budget Deficit Total $ (33.3) $ (19.0) $ (21.3)
16
2013-14 Projected General Fund Budget deficit

2012-13 2013-14 FTE CHANGE
Teachers* 3,668.3 3,753.10 84.80
Guidance Counselors 128.5 132 3.5
Media Specialists 65.5 66 0.5
Athletic Directors 5.5 5.5 -
TOAs (School Based Admin.) 23.0 23.0 -
Paraprofessionals 393.40 391.2 (2.20)
Campus Advisors 66.6 66.6 -
Clerical 422.50 417.20 (5.30)
Custodial 427.9 0 (427.90)
Farm Managers 2.6 2.6 -
Assistant Principals 123.0 123.0 -
Principals 64.0 64.0 -
Total FTE 5,390.8 5,043.2 (347.60)* Teacher reductions are general fund formula driven
17

Bargaining Group # FTE AmountAFSCME 7.0 $ 205,683VESA 11.5 446,789VTO 2.6 205,531Non-Bargaining 11.3 793,936
TOTAL 32.4 $1,651,939
18

Review Artifact 2
19

In Millions
BUDGET DEFICIT – 02/26/13 $ 33.3
ADJUSTED DEFICIT – 05/14/13 19.0
TOTAL ADDITIONAL COST INCREASES:
AVID 0.8
Dual Enrollment 1.5
ADJUSTED DEFICIT 06/11/13 21.3
REDUCTION MEASURES:
Custodial Contract 6.1
Central Office 5% Goal (Facilities Additional Savings of $0.3 million in Capital Funded Positions) 1.7
Utilities Savings 1.0
Retirement Savings 1.4
Salary Lapse Factor 2.0
Grounds Maintenance Contract 0.8
Boston Avenue Charter Closure 0.5
Assigned/Unassigned Fund Balances (Above 5%) 7.8
TOTAL REDUCTION MEASURES: 21.3
REMAINING DEFICIT – 06/11/13 $ 0.0 20
![DeLand News. (Deland, Florida) 1909-09-03 [p ].ufdcimages.uflib.ufl.edu/UF/00/07/58/96/00034/00288.pdfDentist DeLand Pierson Electric celery USE Voorhis reliable S Theatre people NEWS](https://static.documents.pub/doc/80x56/5ee20322ad6a402d666caca9/deland-news-deland-florida-1909-09-03-p-dentist-deland-pierson-electric.jpg)


![DeLand News. (Deland, Florida) 1909-07-23 [p ]....Dentist rigid unusual DeLand During Deland Denitist Patrons Other Klicker Volusia Howard Harry butler NEWS others DeLeon DeLand whom](https://static.documents.pub/doc/80x56/5ee20323ad6a402d666cacaa/deland-news-deland-florida-1909-07-23-p-dentist-rigid-unusual-deland.jpg)


![DeLand News. (Deland, Florida) 1909-01-29 [p ].ufdcimages.uflib.ufl.edu/UF/00/07/58/96/00003/00020.pdf · DeLand 1909 defray Dentist Now Howard Princess honest depart oppo-site rounded](https://static.documents.pub/doc/80x56/5f61ff07904d5a2ff0148d23/deland-news-deland-florida-1909-01-29-p-deland-1909-defray-dentist-now-howard.jpg)

