June 2005 1 Place of GE analysis in EC4MACS •Insights into the economic mechanisms involved in adjusting to a wide spectrum of environmental policies and measures •Fewer technological details than sectoral partial equilibrium models GE models simulate responses to environmental policies •not only through reduction of energy use and inter- fuel substitution, • but also through reductions of overall economic activity and substitution between energy intensive and less energy intensive activities. •comprehensive perspective in cost calculation, •welfare implications of different policy measures
Transcript
June 2005 1
Place of GE analysis in EC4MACS
•Insights into the economic mechanisms involved in adjusting to a wide spectrum of environmental policies and measures•Fewer technological details than sectoral partial equilibrium models GE models simulate responses to environmental policies
•not only through reduction of energy use and inter-fuel substitution,• but also through reductions of overall economic activity and substitution between energy intensive and less energy intensive activities.
•comprehensive perspective in cost calculation,•welfare implications of different policy measures
June 2005 2
GE Cost Calculation (General)
• In addition to the direct costs of abatement as estimated by GAINS, PRIMES, TREMOVE and CAPRI, GEM-E3 assesses the gains/losses:– from revenue recycling and from changes in terms of trade,
both at the national/regional level and at the international level.
– impacts of environmental legislation on industrial competitiveness and activity, either in terms of potential dislocation of activities or of new opportunities and markets for technologies.
– Potential overlapping of internationally coordinated and domestically undertaken emission control strategies.
June 2005 3
GEM-E3 Identity
• GEM-E3 is a multi-country computable general equilibrium model built to evaluate the economic impacts of structural policies and mainly the interactions between the economy, the energy system, the environment and the technological progress
• GEM-E3 is a modelling framework providing the user with many modelling options: a European model, a World model, and a series of different modelling options
• GEM-E3 runs on GAMS on a PC and uses MS-Excel for the data and the results
• A non-developer user may run GEM-E3 after a short training, example IPTS of EC/JRC
June 2005 4
GEM-E3 Data Set
• The European version of GEM-E3 is entirely based on Eurostat statistics: Input-Output tables, National Accounts, Investment Matrix, Consumption Matrix, Bilateral Trade Matrix, Employment and Capital data. Also Energy Balances and emission statistics.
• A distinguishing feature of GEM-E3 is the details in representing income distribution, taxation, subsidies, social security and other elements affecting the public budget. The European model can simulate constraints related to public budget.
• The World version of GEM-E3 is using the GTAP-5 and -6 database.
June 2005 5
GEM-E3 behavioural aspects
• The model adopts a detailed representation for the production function: KLEM with deep nesting, capital vintages, productivity and technical progress with endogenous components, explicit price formation (under Imperfect Competition)
• The model adopts a detailed representation for the consumption, savings and labour supply behaviour, which are treated simultaneously and optionally by class of consumers. The model distinguishes between durable and non durable goods and their linkages, the income expectations from imperfect labour markets, and uses a nested LES-CES formulation.
• The model adopts a separate capital investment decision function which has inter-temporal features, differentiates capital investment premium by origin and destination of investment, and uses adaptive expectations to approximate profitability considerations.
• Trade on a global scale is formulated by assuming imperfect substitution between goods and services by country or region of origin in the presence of economies of scale, a nesting scheme reflecting weak or strong differentiation of commodities by origin, imperfect competition in supply with product varieties and barriers to trade.
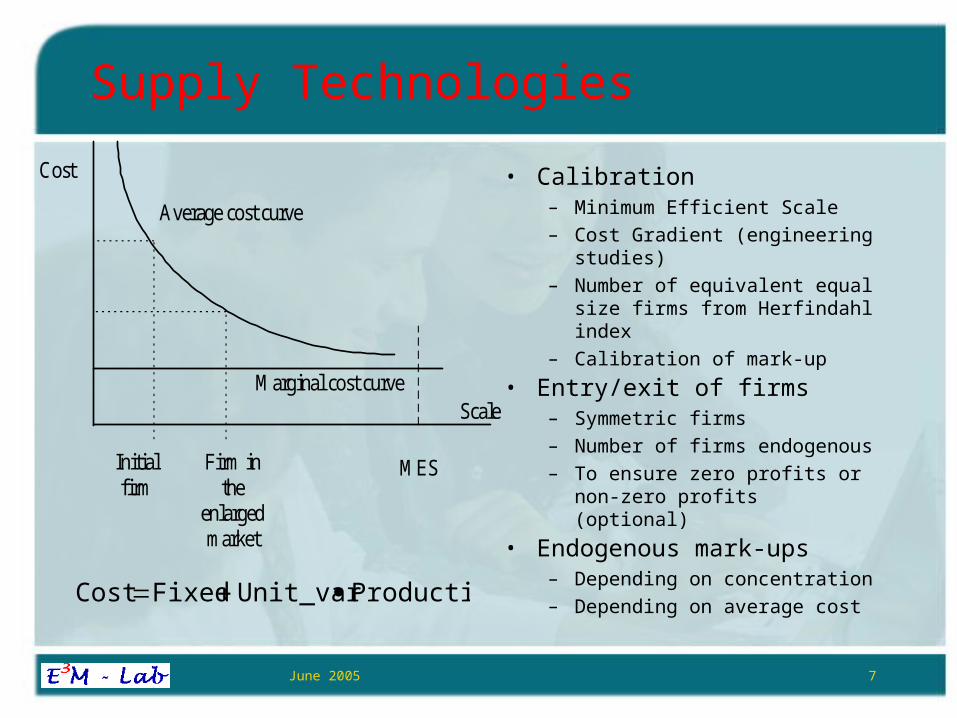
June 2005 6
Basic modelling idea
• In the multi-country model, the goods are differentiated by origin and are imperfect substitutes at the final and intermediate demand levels (Armington)
• The perception of differentiation by consumers is further reflected through the form of the demand nesting hierarchy
• The selling price of a good results from the unit cost, an endogenous mark-up (due to imperfect competition) and the eventual barriers to trade
• The mark-ups reduce when enlarging the marketwhen enlarging the market, as a result of more intensive competition, the larger variety of products and the increasing returns to scale (efficient size of company). This further induces growth.
size firms from Herfindahl index– Calibration of mark-up
• Entry/exit of firms– Symmetric firms– Number of firms endogenous– To ensure zero profits or non-
zero profits (optional)
• Endogenous mark-ups– Depending on concentration– Depending on average cost
Scale
MES
Average cost curve
Marginal cost curve
Cost
Initialfirm
Firm inthe
enlargedmarket
ProductionUnit_varFixedCost
June 2005 8
Demand nesting hierarchy
• Structural changes such as the EU Internal Market
MARKET SEGMENTATIONDomestic Consumers (final and
intermediate)
demand for goods and services
Domestically producedgoods
Imported goods fromEU or RW
Goods from EU Goods from RW
Domestic firms Other EU firms RW firms
Split in EU countries
MARKET INTEGRATIONDomestic Consumers (final and
intermediate)
demand for goods and services
Goods from EU andDomestic
Imported goods fromRW
Goods from EU
Domestic firms Other EU firms RW firms
Split in EU countries
Goods fromDomestic
June 2005 9
Basic modelling idea
• The core GEM-E3 already covers energy issues and the interactions with the environment– Separate energy supply sectors, energy-intensive industries and
equipment goods in several sub-sectors, etc.– KLEM multiple-level nesting and LES nesting with durable goods
and their linkages to non durable goods– Linkage to a detailed environmental sub-model– Calibration to energy projections by PRIMES and POLES
• However, the core model lacks – Engineering-oriented transparency regarding the energy sector (e.g.
electricity generation technologies, least cost dispatching, load curve, etc.)
– Non-linear (decreasing return to scale) mechanism for the supply of energy resources, such as the depletable fossil fuels, the sites for renewables or nuclear and the potential for energy efficiency improvement at the energy consumption side
June 2005 10
Bottom-up for power generation
• Short-term: least-cost dispatching of existing power plants under capacity constraints, for different load segments, placed at the bottom of the electricity sector CES nesting
• Long-term: investment into new power generation plants based on expected demand, unit costs (capital and fuels) and relative risks; logit or reduced Markowitz formulation
• Explicitly represents a variety of old and new technologies of power generation with possibility for semi-endogenous learning; hence, the model covers technologies such as nuclear, renewables and hydro the choice of which depends on capital rather than on fuel inputs.
• Energy investment is linked to the demand for equipment goods, technology progress incorporated through the capital vintages
• Emissions from power generation linked to the environmental sub-model and policy instruments influence power sector decisions (taxes, subsidies, emission trading, green certificates, etc.)
• Imports and exports of electricity are endogenous• Market imperfections at the national level and the multi-national power market
can be reflected; many issues related to the EU Internal Electricity Market can be studied.
June 2005 11
Bottom-up for power generation
Dispatching under capacity constraintsDispatching under capacity constraints Investment in new power plantsInvestment in new power plants
on volume dependingon accumulati
forward timea asrisk and learning
estechnologi
,,ostlifetime_c
,,ostlifetime_c
mequilibriugeneralthefromas
i
risklearningf
risklearningffraction
INV
iiii
iiii
elec
Price of electricity – optionsPrice of electricity – options• Mark-up (under IC)• Ramsey-Boiteux to recover fixed
costsInfluenced byInfluenced by• Fuel and technology costs• Environmental policies
June 2005 12
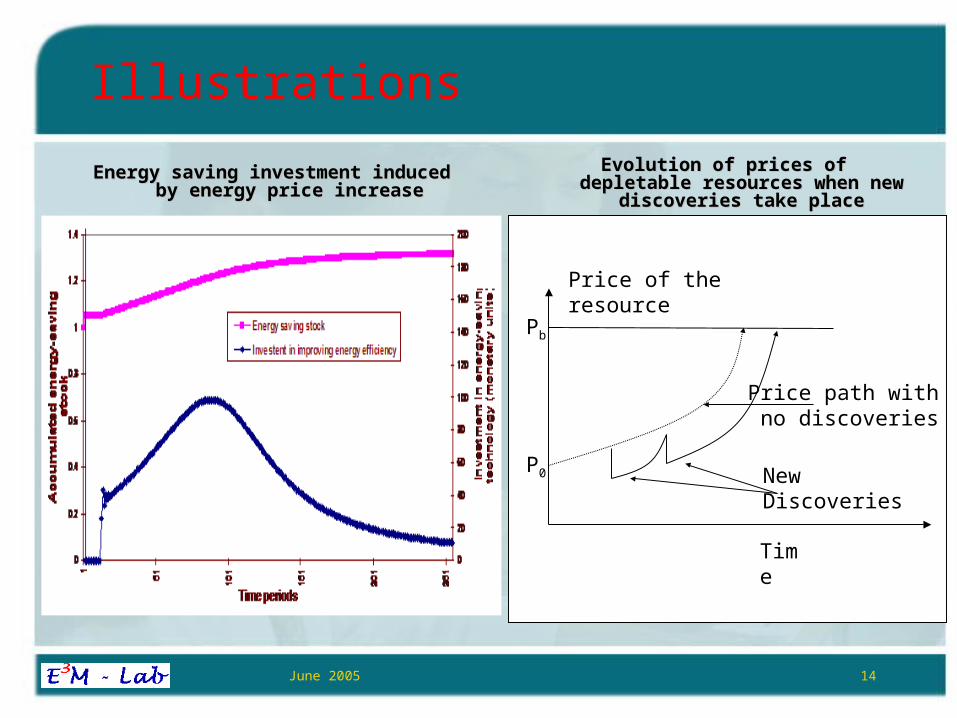
Depletable energy resources
• The price of energy resources (e.g. oil, gas) become endogenous at world or regional scales, as a function of– The rate of extraction r from proven reserves and d the rate of
discovery of new reserves which are function of d and yet-to-find-reserves
– The accumulated use of the resources• The reserves are introduced as a separate production factor
into the CES of energy producing sectors, separately from capital
• Reserves, as capital, show a decreasing return to scale pattern, however influenced by technology progress and new discoveries
• In the presence of climate change policies, abatement costs increase as a result of lower fossil fuel prices related to lower demand; opposite effects in case of dash for gas.
June 2005 13
Endogenous energy savings
• The decision to invest in energy saving equipment becomes endogenous
• Production and consumption functions are extended with the energy saving considered as an additional factor
• Energy saving draws from a limited potential for savings per sector, hence follows decreasing return to scale
• Investment in energy saving induces expenses taken into account in the least cost decision of the agent; their unit cost increases as potential is exhausted
• The purchase of goods to implement energy saving influences total demand for goods and services
• Interesting results from a study on “Energy savings and employment effects in the EU”
June 2005 14
Illustrations
Energy saving investment induced by Energy saving investment induced by energy price increaseenergy price increase
Price of the resource
Time
Pb
P0
Price path with no discoveries
New Discoveries
Evolution of prices of depletable Evolution of prices of depletable resources when new discoveries resources when new discoveries
take placetake place
June 2005 15
Studying combined objectives
Policy AgendaPolicy Agenda
1. The Knowledge
Society
2. The Internal
Market
3. The Business
Climate
4. The Labour
Market
5. Environmental
Sustainability
The model extensionsThe model extensions
1. Endogenous Technical Progress
2. Market Integration under imperfect competition and product varieties
3. Capital market and investment flows
4. Labour market under imperfect competition
5. Energy-Environment sustainability driving innovation, demand for equipment goods and exports
June 2005 16
Energy-environment driving growth?
EU is comparatively strong in Equipment Goods Industry and the Services sector
EU internal market area is sufficiently large so as the market integration to sustain competition, scale effects and technology progress
A stringent policy in terms of energy-environment can drive accelerated technical progress and investment in the Equipment Industry and Services, resulting into economies of scale, hence in comparative advantage at world level
The EU-internal demand sustains employment and activity
In the long run, the new exporting potential drives additional accelerated growth of the EU area
Such a strategy, with removal of uncertainties related to capital and investment, may push the EU to enter into a new investment cycle..