Relevant • Independent • Objective
CERI Commodity Report – Crude Oil Editorial Committee: Paul Kralovic, Dinara Millington, Megan Murphy, Allan Fogwill About CERI The Canadian Energy Research Institute is an independent, not-for-profit research establishment created through a partnership of industry, academia, and government in 1975. Our mission is to provide relevant, independent, objective economic research in energy and related environmental issues. For more information about CERI, please visit our website at www.ceri.ca or contact us at [email protected].
supply cost of and Alberta oil sands in situ project is higher than market price for bitumen. Another concern that arises from significant energy use is the accompanying emissions and their impact on the environment. The Federal Government of Canada as well as provincial governments are working to address the GHG issue. Recently, the province of Alberta implemented a new Climate Change Leadership plan that fixed total oil sands emissions at a cap of 100 megatonnes (Mt) of CO2eq per year and increased the carbon tax to $30/tonne of CO2 eq. to be applied to oil sands facilities. Those constraints add an incremental cost (carbon tax and investment to mitigate emissions) on the already costly oil sands projects. On their own accord, the oil industry has committed to reduce the use of freshwater by 50 percent by 2022 in the in situ extraction, and a reduction of 30 percent of the water take from Athabasca river by 2022 in the oil mining extraction. To address these challenges, industry is exploring other technological options in conjunction with improving the existing SAGD process. For some years now, project proponents have been testing adding solvent to the steam. This article provides an overview of what has been taking place in this technology development. The in situ solvent assisted extraction process consists of using a combination of solvent and steam or pure solvent as a replacement of steam to heat the oil deposit in the reservoir and reduce its viscosity causing heated oil to drain into the lower wellbore. Three different in situ solvent based extraction methods are discussed below: Steam solvent hybrid is characterized by co-injection of steam and solvent; the proportion of a solvent is far less than the volume of steam injected around 10-20 percent. The injection of a combination of hydrocarbon-based solvent (C4-C12) and steam will condense and evaporate at the same temperature as water and will reduce the viscosity of bitumen.
Are Solvents the New Holy Grail for Alberta’s Oil Sands? Update on the Use of Solvents in SAGD Alpha Sow The majority of Alberta oil sands reserves (approximately 80 percent) is buried too deep to be recovered by open-pit mining, and are recoverable using in situ methods. The story of in situ bitumen development began in the 1960s, when Imperial Oil Ltd. built a test project to extract bitumen from Cold Lake deposits. This involved injecting steam under high pressure into the oil sand formation. Once the bitumen was heated by steam and inclined to flow, it could be pumped to the surface. This technique became known as CSS or Cyclic Steam Stimulation. But technological development continued. One key collaboration of the Alberta government, industry and academia was the Underground Test Facility near Fort McMurray, which demonstrated the value of horizontal wells for in situ bitumen production. This research led to the development of a new technology known as SAGD or Steam Assisted Gravity Drainage, widely used by industry today. SAGD consists of a pair of horizontal wells, situated 4 to 6 meters above one another, drilled from a central well pad. In a plant nearby, water is transformed into steam by use of natural gas-fired boilers which then travels through above-ground pipelines to the wells and enters the ground via a steam injection (top) well (Alberta Energy). The SAGD process has been constantly improving since 1987 (see Figure 1). The energy-intensity factor affects the future of Alberta oil sands growth because a highly energy-intensive extraction method can be costly and limits Alberta oil sands competitiveness in the international market, especially in today’s low oil price environment. The
June 2016
CERI Commodity Report — Crude Oil
CERI Commodity Report - Crude Oil
Page 2
Pure solvent on the other hand involves injecting pure solvent vapors that diffuse through the reservoir producing less viscous bitumen that flows down to the production reservoir by gravity. That process produces a higher oil recovery factor. Steam additives process or surfactant additive process consists of injecting a small quantity of surfactant and steam to enhance the oil recovery. The process involves a molecular interfacial tension reduction and can be applied between two liquids or between a liquid and a solid.1 They are known for their detergents, wetting agents, emulsifiers, foaming and dispersant agents and are commonly used in oil sands mining. Some of these processes show promising performance by reducing energy and GHG intensity and improving oil recovery. The ES-SAGD tested by Encana Senlac showed a 50 percent improvement in oil recovery rate and a 150 percent recovery rate in Christina Lake (Gupta 2005). Cenovus, on the other hand, has developed the solvent aided process (SAP) that adds natural gas liquids to the steam resulting in a reduction of the Steam-Oil Ratio (SOR) of 30 percent. Liquid addition to steam for enhancing recovery (LASER) developed by Imperial Oil
adds a solvent (C5+ condensate) to mid-life cycle steam in existing CSS wells and showed a reduction in GHG emissions by more than 25 percent. The VAPEX process is composed of low hydrocarbons such as propane, methane and butane or a combination thereof. Testing of the technology is still ongoing as hot VAPEX looks promising. The challenge is to improve in solvent recovery. Cyclic Solvent Process (CSP) is another process developed by Imperial Oil at their Cold Lake site in 2009 and has been incorporated in the operating facilities since June 2014. Economic Analysis of In Situ Based Solvent Extraction The main challenge of hydrocarbon solvent addition is the cost of solvent and the solvent recovery factor (solvent retained in the reservoir/solvent injected). Most of the solvents used are oil derivatives (small hydrocarbons such as propane and butane, etc.), with their price linked directly or indirectly to oil price. As the oil price starts to recover, it is expected that the prices of oil derivatives will too. The recent experimentation shows major challenges of engineering solvent addition processes. Operation teams
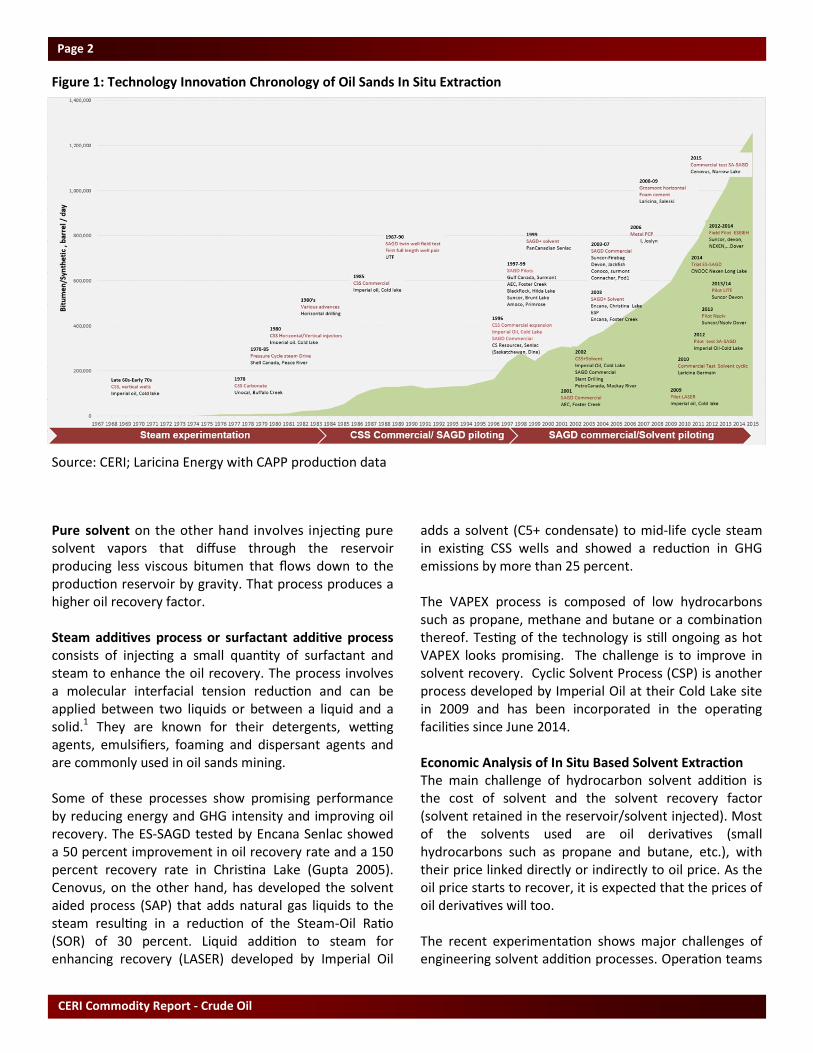
Figure 1: Technology Innovation Chronology of Oil Sands In Situ Extraction
Source: CERI; Laricina Energy with CAPP production data
CERI Commodity Report - Crude Oil
Page 3
are facing a large numbers of possible recipes, combined with the poorly understood and unpredictable nature of solvent effects. Solving this problem will be the main factor for in situ solvent-based extraction adoption and its economic viability. Numerous numeric simulations and experiments are developed by R&D divisions at oil companies and universities to improve the understanding of how solvent flows in the reservoir and how to match the reservoir characteristics variability and solvent during the life cycle of the extraction. In most cases there is no linearity and limited learning opportunity from the previous injection. Laricina Energy is working on a comprehensive method that matches the economic and chemical constraints, called Genetic Algorithm (GA). It is an eleven-step process that constantly optimizes the real time match between reservoir properties and solvent composition and volume.
Compliances and Environmental Risk The environmental aspect of in situ solvent-based extraction is not well known; there is possible contamination of underground water and how to avoid it is not scientifically established. There is no policy or specific regulation about solvent use in the industry, all solvent-based projects are in the experimental project regulation stage. If the solvent-based methods for in situ extraction are adopted on a commercial scale, the regulation will evolve and new requirements will be added to the current in situ extraction compliances. The industry will have to manage this new “underground tailing”. How long and what will be an acceptable level of the chemical components of the waste allowed will need to be studied extensively. It is also not clear who will carry the risk in the long run, as new regulations will be adopted and fall somewhere between tailings management and actual regulation and well remediation.
Table 1: Examples of In Situ Solvent Technology
Steam Solvent Hybrid Pure Solvent Steam Additives Process
Expanding Solvent SAGD ES-SAGD Vapor extraction - VAPEX Non-condensable gas co-injection
Solvent Assisted Process SAP Joint Implementation of Vapor Extraction - JIVE/SVX
Surfactant steam process
Solvent Assisted SA-SAGD N-Solv Chemical additives and foam- assisted SAGD
Solvent Cyclic C-SAGD Cyclic solvent process - CSP SAGD lite
Solvent Co-Injection SCI Enhanced Solvent Extraction Incorporating Electro-Magnetic Heating - ESEIEH
Liquid Addition to Steam to Enhance Recovery LASER
Source: CERI
Table 2: Comparison of Key Performance Factors
Technology Type Test Field Year Oil Production Im-provement
SOR Reduction Solvent Recovery
GHG Intensity
SAP Cenovus (Encana) Senlac
2002 50% 2.5 to 1.5 NA NA
SAP Cenovus Christi-na Lake
2004 150% 5 to 1.5 NA NA
LASER (C5+ con-densate)
Imperial Oil Cold Lake
2002/2009 + 30% NA 80% 25%
ES-SAGD Nexen Long Lake +50% -40% More GHG SAGD plant
N-Solv Suncor Dover Lease
2013 NA -100% 50 to 70% -80%
Additive (LITE)
Suncor Mackay River
Laboratory stage and proof of concept but no field test release publicly available data
Source: CERI
CERI Commodity Report - Crude Oil
Page 4
To conclude, Figure 1 shows improvement in bitumen production as far as technologies and processes are concerned. Since the beginning, Alberta oil sands have been a challenging area to develop, but by constant innovation and continuous improvement oil producers have been overcoming these challenges. Many solvent-based extraction technologies are under development and most of the pilot plants show interesting results. Solvent recovery is the major challenge; improvements in imaging technologies, data analytics and numeric simulation, cheap and reliable sensors, new proactive innovation, ecosystem and carbon regulations are all likely to accelerate these technologies’ maturations. The goal is to decarbonize oil sands production, use less water and extract bitumen at competitive costs. Endnote 1Subodh Chandra Gupta /Khalil Zeidani (Cenovus Energy): surfactant steam process: An innovative Enhanced Heavy Oil Recovery Method for Thermal applications. Bibliography 1. http://www.spe.org/events/sio/2014/pages/
schedule/tech_program/tuesday_techprog.php 2. https://sites.ualberta.ca/~tayfun/eogrrc/Varun/
Thesis-FINAL.pdf 3. http://www.laricinaenergy.com/uploads/saleski/
ERCB_2011/09_ERCB_Appendix_2.pdf 4. https://www.aer.ca/data-and-publications/activity-
and-data/in-situ-performance-presentations 5. http://www.energy.alberta.ca/Oil/pdfs/
BkgIETP2013.pdf 6. http://ptrc.ca/+pub/document/JIVE%
20Backgrounder%202010.pdf
7. https://www.aer.ca/documents/oilsands/insitu-presentations/2004AthabascaSuncorFirebagSAGD8870.pdf
8. http://www.alberta.ca/climate-oilsands-emissions.cfm
9. http://www.albertacanada.com/mexico/documents/p6_recoveryprocessesthermal.pdf
10. http://albertatechfutures.ca/OurTeams/HybridProcesses.aspx
11. http://www.oilsandsreview.com/index.php/oilsands-news/departments/508-8991-up-in-the-oljesands-despite-
12. http://www.spe.org/training/courses/SSS.php 13. http://www.spe.org/dl/docs/2011/Law.pdf 14. https://www.aer.ca/data-and-publications/activity-
and-data/in-situ-performance-presentations 15. https://www.aer.ca/documents/oilsands/insitu-
presentations/2004AthabascaSuncorFirebagSAGD8870.pdf
16. http://www.imperialoil.com/Canada-English/Files/imperial_review_2012_06footprint.pdf
17. http://petrowiki.org/Heavy_oil 18. http://www.cheminst.ca/magazine/feature-story/big
-oil-cleans-its-act 19. http://www.ucalgary.ca/sharp/ 20. http://www.capp.ca/publications-and-statistics/
statistics/statistical-handbook 21. http://www.laricinaenergy.com/uploads/saleski/
ERCB_2011/09_ERCB_Appendix_2.pdf 22. https://www.onepetro.org/conference-paper/SPE-
165545-MS?sort=&start=0&q=dc_creator%3A%28%22Gupta%2C+Subodh+Chandra%22%29&fromSearchResults=true&rows=10#
CERI Commodity Report - Crude Oil
Page 5
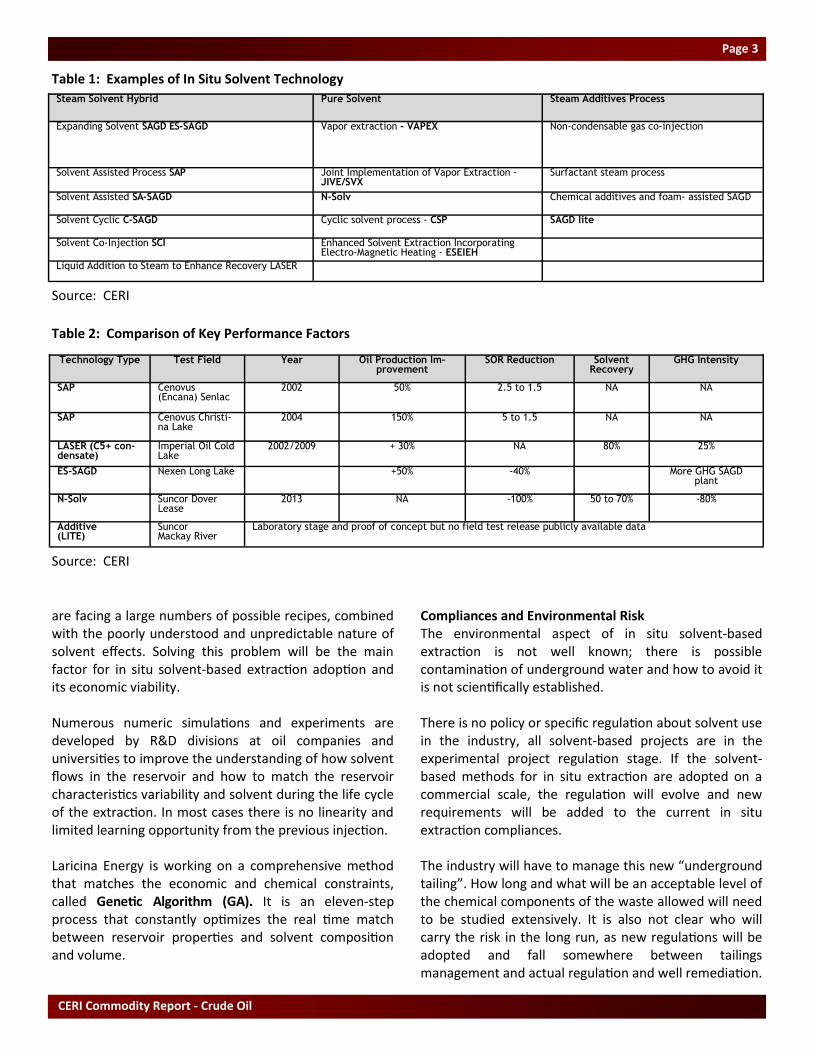
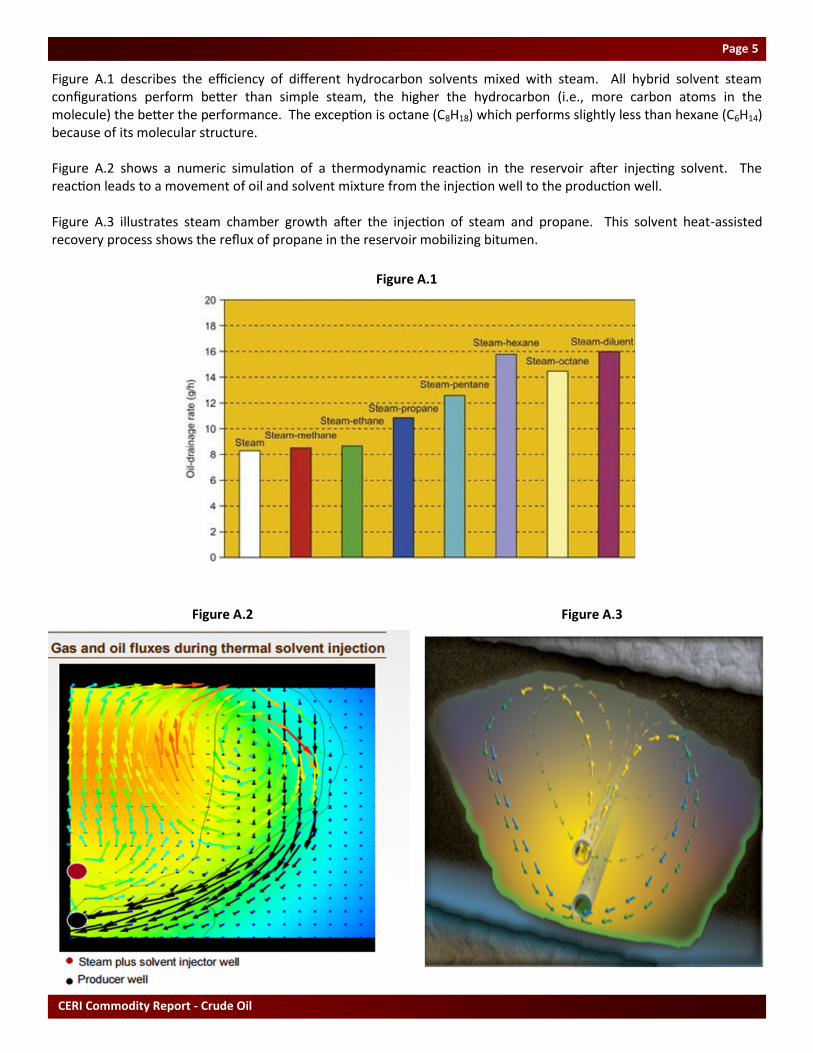
Figure A.1 describes the efficiency of different hydrocarbon solvents mixed with steam. All hybrid solvent steam configurations perform better than simple steam, the higher the hydrocarbon (i.e., more carbon atoms in the molecule) the better the performance. The exception is octane (C8H18) which performs slightly less than hexane (C6H14) because of its molecular structure. Figure A.2 shows a numeric simulation of a thermodynamic reaction in the reservoir after injecting solvent. The reaction leads to a movement of oil and solvent mixture from the injection well to the production well. Figure A.3 illustrates steam chamber growth after the injection of steam and propane. This solvent heat-assisted recovery process shows the reflux of propane in the reservoir mobilizing bitumen.
Figure A.1
Figure A.2 Figure A.3
CERI Commodity Report - Crude Oil
Page 6
SOU
RC
E: E
IA.
SOU
RC
E: E
IA.
SOU
RC
E: N
RC
an, E
IA, B
ayte
x.
SOU
RC
E: E
IA, C
ERI.
-4-20246810
0
10
20
30
40
50
60
70 Ju
n-1
5Ju
l-1
5A
ug-
15
Sep
-15
Oct
-15
No
v-1
5D
ec-
15
Jan
-16
Feb
-16
Ma
r-1
6A
pr-
16
Ma
y-1
6Ju
n-1
6Ju
l-1
6
US$
/bb
l
Bre
nt-
WT
I D
iffe
ren
tia
l
WT
I
Bre
nt
Sp
ot
Cru
de
Pri
ces
Sp
ot
Cru
de
Pri
ces
Sp
ot
Cru
de
Pri
ces
Sp
ot
Cru
de
Pri
ces
US
$/b
bl
WT
I -
Ed
mo
nto
n L
igh
tP
rice
Dif
fere
nti
als
WT
I -
Ed
mo
nto
n L
igh
tP
rice
Dif
fere
nti
als
WT
I -
Bre
nt
Pri
ce D
iffe
ren
tia
ls (U
S$
/bb
l)
Spot Price
sW
TI
Bre
nt
Cdn.L
ight*
H.H
ard
isty
Year-
to-D
ate
40.0
840.3
336.7
727.9
6
Quart
er-
to-D
ate
45.4
645.5
742.7
632.7
5
June 2
0, 2016
45.2
345.3
544.85
34.59
0
20
40
60
80
10
0
12
0
Jun
-13
Jun
-14
Jun
-15
Jun
-16
US
$/b
bl
Dif
fere
nti
al
WT
IE
dm
on
ton
Lig
ht
WT
I -
Ed
mo
nto
n L
igh
tP
rice
Dif
fere
nti
als
(US
$/b
bl)
20
25
30
35
40
45
50
55
12
34
US
$/b
bl
11
-Ma
y-1
61
3-J
un
-16
13
-Ju
l-1
6
NN
YM
EX
WT
I C
rud
e F
orw
ard
Cu
rve
4
co
ntr
act
mo
nth
s
0
20
40
60
80
10
0
12
0
Jun
-13
Jun
-14
Jun
-15
Jun
-16
US
$/b
bl
Dif
fere
nti
al
WT
IW
CS
WW
TI
-H
ard
isty
He
av
yP
rice
Dif
fere
nti
als
WT
I -
Ca
na
dia
n H
ea
vy
Be
nch
ma
rks
(US
$/b
bl)
Relevant • Independent • Objective
Page 7
SOU
RC
E: E
IA, C
ERI.
SO
UR
CE:
NR
Can
.
SOU
RC
E: I
EA O
il M
arke
t R
epo
rt.
SOU
RC
E: E
IA W
eekl
y P
etro
leu
m S
tatu
s R
epo
rt.
0.5
0
0.7
5
1.0
0
1.2
5
1.5
0
1.7
5
2.0
0
2.2
5 Jun
-15
Jul-
15
Au
g-1
5Se
p-1
5O
ct-1
5N
ov-
15
De
c-1
5Ja
n-1
6Fe
b-1
6M
ar-
16
Ap
r-1
6M
ay
-16
Jun
-16
Jul-
16
US
$/g
al
RB
OB
Ga
soli
ne
He
ati
ng
Oil
NY
ME
X P
etr
ole
um
Pro
du
cts
NYM
EX P
rice
sUnle
aded G
aso
line
Heating O
il
Year-
to-D
ate
1.3
639
1.2
555
Quart
er-
to-D
ate
1.5
405
1.3
920
June 2
0, 2016
1.3
870
1.3
780
0.6
0
0.7
0
0.8
0
0.9
0
1.0
0
1.1
0
1.2
0
1.3
0
1.4
0
1.5
0
Jun
-13
Jun
-14
Jun
-15
Jun
-16
CD
N/U
S$
CD
N/U
S$
Exc
ha
ng
e R
ate
50
.0%
50
.5%
51
.0%
51
.5%
52
.0%
52
.5%
53
.0%
0
10
20
30
40
50
60
70
80
90
10
0
11
0
4Q
15
1Q
16
2Q
16
3Q
16
4Q
16
1Q
17
2Q
17
3Q
17
4Q
17
MM
bp
d
To
tal
OE
CD
To
tal
No
n-O
EC
Dn
on
-OE
CD
De
ma
nd
sh
are
Oil
Dem
an
d in
Se
lec
ted
Co
un
trie
sG
lob
al
Oil
De
ma
nd
-10
%
0%
10
%
20
%
30
%
40
%
50
%
60
%
70
%
To
tal
Ga
soli
ne
Jet
Fu
el
Dis
till
ate
Re
sid
ua
lP
rop
an
eO
the
r
%
UU
S P
rod
uct
s D
em
an
dJu
ne
20
15
-Ju
ne
20
16
Y-o
n-Y
ch
an
ge
CERI Commodity Report - Crude Oil
Page 8
SOU
RC
E: I
EA O
il M
arke
t R
epo
rt, C
ERI.
SO
UR
CE:
IEA
Oil
Mar
ket
Rep
ort
.
SOU
RC
E: I
EA O
il M
arke
t R
epo
rt.
SOU
RC
E: I
EA O
il M
arke
t R
epo
rt.
57
.0%
57
.5%
58
.0%
58
.5%
59
.0%
59
.5%
60
.0%
0
20
40
60
80
10
0
12
0
4Q
15
1Q
16
2Q
16
3Q
16
4Q
16
1Q
17
2Q
17
3Q
17
4Q
17
MM
bp
d
no
n-O
PE
C S
up
ply
OP
EC
Su
pp
lyn
on
-OP
EC
Sh
are
of
Glo
ba
l S
up
ply
SG
lob
al
Oil
Su
pp
ly
0
2,0
00
4,0
00
6,0
00
8,0
00
10
,00
0
12
,00
0
14
,00
0
1Q
16
2Q
16
3Q
16
4Q
16
1Q
17
Mb
pd
Ala
ska
Ca
lifo
rnia
Te
xa
sF
ed
era
l G
OM
Oth
er
Low
er
48
NG
LsO
the
r
US
Oil
Pro
du
ctio
nb
y r
eg
ion
0
50
0
1,0
00
1,5
00
2,0
00
2,5
00
3,0
00
3,5
00
4,0
00
4,5
00
5,0
00
1Q
16
2Q
16
3Q
16
4Q
16
1Q
17
Mb
pd
AB
L/M
/HA
B B
itu
me
nS
KO
the
rN
GLs
Sy
nth
eti
c
Ca
na
dia
n O
il P
rod
uct
ion
by
pro
du
ct
0
50
0
1,0
00
1,5
00
2,0
00
2,5
00
3,0
00
3,5
00
Ma
y-1
3M
ay
-14
Ma
y-1
5M
ay
-16
Mb
pd
OE
CD
No
rth
Am
eri
caO
EC
D E
uro
pe
OE
CD
Pa
cifi
c
OE
CD
Co
mm
erc
ial
Sto
cks
by
re
gio
n
Relevant • Independent • Objective
Page 9
SOU
RC
E: E
IA W
eekl
y P
etro
leu
m S
tatu
s R
epo
rt.
SOU
RC
E: I
EA O
il M
arke
t R
epo
rt.
-10
.0
-8.0
-6.0
-4.0
-2.0
0.0
2.0
4.0
6.0
8.0
Cru
de
Ga
soli
ne
Dis
till
ate
Pro
du
cts
To
tal
MM
b
US
Co
mm
erc
ial
Sto
cks
Ma
y 2
7 -
Jun
e 2
4, 2
01
6 M
-on
-M C
ha
ng
e
16
7.5
17
0
17
2.5
17
5
17
7.5
18
0
18
2.5
18
5
18
7.5
19
0
1Q
15
2Q
15
3Q
15
4Q
15
1Q
16
MM
b
Ca
na
dia
n S
tock
s o
n L
an
d
CERI Commodity Report - Crude Oil
Page 10
World Supply and Demand Balance (MMbpd)
OPEC Crude Oil Production (MMbpd)
WTI Price Projections ($US/barrel)
2014 2015 2016 2017 1Q15 2Q15 3Q15 4Q15 1Q16 2Q16 3Q16 4Q16 1Q17 2Q17 3Q17 4Q17
World Demand 93.0 94.7 96.1 97.4 93.6 94.1 95.7 95.5 95.2 95.6 96.8 96.9 96.6 96.9 98.1 98.1
OECD 45.8 46.2 46.4 46.6 46.5 45.3 46.7 46.3 46.6 45.9 46.7 46.5 46.7 46.1 46.9 46.6
non-OECD 47.2 48.5 49.7 50.9 47.1 48.8 49.0 49.2 48.6 49.7 50.1 50.4 49.9 50.8 51.2 51.5
World Supply 93.7 96.4 96.3 96.8 95.1 96.3 97.0 97.1 96.6 95.8 96.4 96.6 96.0 96.7 97.2 97.2
Non-OPEC 56.0 57.4 56.5 56.8 57.1 57.2 57.6 57.8 57.0 56.0 56.5 56.7 56.3 56.6 57.1 57.0
OPEC NGLs 6.5 6.7 6.9 7.0 6.6 6.7 6.7 6.7 6.8 6.8 6.9 6.9 6.9 7.0 7.0 7.1
OPEC Crude 27.7 28.3 28.6 28.7 31.4 32.4 32.7 32.6 32.8 33.0 33.0 33.0 32.8 33.1 33.1 33.1
Supply - Demand1 0.7 1.7 0.2 -0.6 1.5 2.2 1.3 1.7 1.3 0.2 -0.4 -0.3 -0.6 -0.3 -0.9 -0.9
OECD
Stocks (MMbbls) 2712 2815 2905 2984 3015 3049 3058 3038 3024 2999 2988 2950
Days Cover 58 62 62 64 65 66 65 65 65 65 64 63
2014 2015 2016 2017 3Q15 4Q15 1Q16 2Q16 3Q16 4Q16 1Q17 2Q17 3Q17
High Price Case 52.25 56.47 51.70 52.80 55.00 56.10 58.30
Reference Case 93.28 48.71 43.48 51.33 46.47 42.03 33.41 45.52 47.00 48.00 50.00 51.00 53.00
Low Price Case 40.38 43.63 39.95 40.80 42.50 43.35 45.05
Sustainable
Capacity Apr-16 May-16 Jun-16 Apr-16 May-16 Jun-16
Saudi Arabia 12.20 10.22 10.25 10.45 1.98 1.95 1.75
Iran 3.70 3.56 3.61 3.66 0.14 0.09 0.04
UAE 2.95 2.82 2.91 2.91 0.13 0.04 0.04
Kuwait 2.87 2.73 2.85 2.87 0.14 0.02 0.00
Qatar 0.67 0.66 0.66 0.66 0.01 0.01 0.01
Angola 1.81 1.75 1.72 1.72 0.06 0.09 0.09
Nigeria 1.85 1.62 1.44 1.58 0.23 0.41 0.27
Libya 0.40 0.35 0.28 0.31 0.05 0.12 0.09
Algeria 1.12 1.09 1.09 1.11 0.03 0.03 0.01
Ecuador 0.55 0.54 0.55 0.55 0.01 0.00 0.00
Venezuela 2.35 2.30 2.22 2.18 0.05 0.13 0.17
Indonesia 0.74 0.73 0.74 0.74 0.01 0.00 0.00
Gabon 0.22 0.22 0.22 0.22 0.00 0.00 0.00
OPEC. Excl. Iraq 31.43 28.59 28.54 28.96 2.84 2.89 2.47
Iraq1 4.40 4.36 4.27 4.25 0.04 0.13 0.15
Total OPEC 35.60 32.95 32.81 33.21 2.65 2.79 2.39
Production Spare Capacity vs Production
CERI Commodity Report - Crude Oil
Page 12
A1: Historic Light Sweet Crude Futures Prices ($US per barrel)
A2: Historic Crude Product Futures Prices (¢US per gallon)
Notes (Tables A1 and A2): Prices are listed by contract month. Close: final contract close on the last day of trading. Last 3 Day Average Close: simple average con-
tract close on last three days of trading. Average When Near Month: simple average closing price on trading days when contract was near month. 12-Month Strip
Average: simple average of daily near 12-month contract closing prices in a given contract month. Spread: difference between one-month and two-month forward
prices in a given period. Source: New York Mercantile Exchange (NYMEX).
NYMEX Light Sweet Crude
Last 3 Day Avg. When 12-Month Spread
Close Average Near Mo. Strip Avg. (1-2 Mo.)
2013 96.82 97.37 97.01 97.45 -0.12
2014 96.53 96.37 96.73 87.56 0.54
2015 49.68 49.80 51.41 53.75 -0.78
2Q 2015 53.32 53.04 52.84 56.55 -1.51
3Q 2015 50.39 50.63 53.14 54.10 -0.42
4Q 2015 43.92 44.17 44.89 47.38 -0.70
1Q 2016 30.92 31.19 34.29 38.10 -1.44
2Q 2016 43.94 43.15 40.39 43.31 -1.24
Yr-on-Yr Chg. -17.6% -18.6% -23.6% -23.4%
Jul-15 59.68 59.91 59.63 61.11 -0.41
Aug-15 50.36 50.47 54.66 53.70 -0.36
Sep-15 41.14 41.52 45.12 47.50 -0.49
Oct-15 45.83 45.73 44.47 46.73 -0.57
Nov-15 45.55 46.23 46.32 48.55 -0.51
Dec-15 40.39 40.56 43.88 46.86 -1.03
Jan-16 34.74 34.81 38.61 42.22 -1.39
Feb-16 26.55 28.14 33.74 36.96 -1.10
Mar-16 31.48 30.63 30.52 35.13 -1.83
Apr-16 41.45 40.27 36.44 40.15 -1.69
May-16 42.63 41.16 39.32 42.33 -1.30
Jun-16 47.75 48.03 45.43 47.45 -0.72
Jul-16 48.85 48.73 49.03 50.88 -0.55
Yr-on-Yr Chg. -18.1% -18.7% -17.8% -16.7%
NYMEX Unleaded Gasoline NYMEX Heating Oil
Last 3 Day Avg. When 12-Month Spread Last 3 Day Avg. When 12-Month Spread
Close Average Near Mo. Strip Avg. (1-2 Mo.) Close Average Near Mo. Strip Avg. (1-2 Mo.)
2013 284.3 285.6 284.5 274.2 0.5 298.2 299.0 298.9 304.9 -0.5
2014 270.6 272.8 271.8 260.8 1.7 285.9 287.7 286.4 290.2 1.4
2015 168.8 166.0 166.4 157.8 0.5 174.8 171.9 173.2 179.6 0.5
2Q 2015 197.2 194.1 191.8 181.2 0.5 188.3 185.6 186.1 192.9 0.3
3Q 2015 185.7 180.9 186.1 156.3 8.6 171.5 167.9 170.0 179.2 -1.1
4Q 2015 138.4 137.2 135.5 127.8 1.9 145.0 144.9 148.7 159.5 -2.3
1Q 2016 114.0 112.5 111.5 125.9 -9.2 107.7 106.9 107.4 117.8 -2.0
2Q 2016 154.5 155.4 148.9 142.9 -2.1 135.4 135.1 128.8 137.4 -1.0
Yr-on-Yr Chg. -21.6% -19.9% -22.3% -21.1% -28.1% -27.2% -30.8% -28.8%
Jul-15 209.0 205.6 206.9 180.1 3.7 188.7 186.2 188.9 197.6 -0.7
Aug-15 184.1 183.0 191.1 157.2 6.0 158.4 159.3 168.2 177.8 -1.3
Sep-15 164.0 154.0 160.4 131.6 16.3 167.4 158.2 152.8 162.1 -1.4
Oct-15 138.9 136.7 138.2 127.7 1.8 151.3 149.6 153.9 164.3 -2.1
Nov-15 140.5 136.8 134.9 128.3 1.8 149.9 148.6 149.9 161.4 -2.6
Dec-15 135.9 138.2 133.5 127.3 2.1 133.7 136.4 142.4 152.6 -2.3
Jan-16 126.7 125.8 125.4 137.4 -1.0 110.1 110.3 117.9 129.9 -3.1
Feb-16 110.3 107.6 109.4 123.6 -2.6 105.5 103.7 100.1 109.8 -1.7
Mar-16 105.0 104.1 99.5 116.7 -24.1 107.6 106.6 104.3 113.9 -1.3
Apr-16 143.6 145.3 139.9 137.4 -4.3 118.5 116.7 119.3 128.5 -1.2
May-16 158.5 158.8 148.8 142.0 -1.5 137.8 138.8 124.9 133.7 -1.0
Jun-16 161.5 162.2 158.1 149.4 -0.7 149.8 149.8 142.1 150.1 -0.7
Jul-16 150.1 151.2 155.4 140.3 -0.9 148.5 149.7 150.1 158.6 -0.9
Yr-on-Yr Chg. -28.2% -26.5% -24.9% -22.1% -21.3% -19.6% -20.6% -19.8%
Relevant • Independent • Objective
Page 13
A3: World Crude Oil Contract Prices (FOB, $US per barrel)
A4: North American Posted Crude Prices (FOB, $US per barrel)
Notes: 1. ANS is Delivered price on US West Coast. 2. Edmonton Light Sweet prices are discontinued as of May 1, 2014 and replaced by the Canadian Light Crude
blend which is traded daily on the Net Energy Index. 3. Hardisty Heavy. Posted prices are based on price at the end of each month. Sources: Oil & Gas Journal;
Natural Resources Canada.
Notes: 1. Urals is Delivered price at Mediterranean. Contract prices are based on prices at the end of each month. Source: OPEC Monthly Oil Market Report.
Saudi U.A.E. Oman U.K. Norway Russia Venez. Kuwait Ecuador Mexico Nigeria Indon.
Arab Lgt Dubai Oman Brent Ekofisk Urals1 T.J. Light Blend Oriente Isthmus Bonny Lgt Minas
2013 106.60 105.51 105.57 108.69 109.89 108.05 96.71 105.10 97.77 105.16 111.41 107.32
2014 97.07 96.61 96.94 99.00 99.78 98.01 86.87 95.21 87.25 93.58 100.77 98.63
2015 49.87 50.96 51.24 52.44 53.20 51.94 41.17 48.15 44.97 51.14 52.99 49.24
2Q 2015 60.43 61.28 61.34 61.84 62.53 62.18 52.11 58.72 55.83 62.12 62.72 60.54
3Q 2015 49.01 49.80 49.92 50.29 50.93 49.75 37.94 47.70 42.85 49.96 50.62 45.46
4Q 2015 39.90 40.74 40.93 43.67 44.38 42.50 30.59 37.83 36.16 42.62 44.04 38.82
1Q 2016 29.95 30.47 31.44 33.91 34.39 32.30 22.67 27.89 26.73 31.39 33.72 31.64
2Q 2016 42.66 43.18 43.53 45.53 46.20 43.86 33.78 40.81 40.34 43.47 45.61 46.24
Yr-on-Yr Chg. -29.4% -29.5% -29.0% -26.4% -26.1% -29.5% -35.2% -30.5% -27.7% -30.0% -27.3% -23.6%
Jun-15 60.94 61.76 61.77 61.69 62.21 62.52 51.74 59.29 56.71 63.48 62.19 60.09
Jul-15 54.95 56.15 56.23 56.54 57.02 55.84 44.43 53.85 47.78 55.62 56.77 51.86
Aug-15 46.52 47.87 47.87 46.72 47.53 46.22 35.26 45.28 39.75 46.56 47.07 42.46
Sep-15 45.56 45.38 45.65 47.61 48.24 47.19 34.13 43.96 41.03 47.71 48.01 42.05
Oct-15 45.37 45.84 46.07 48.56 49.23 47.49 35.48 43.61 39.91 46.90 49.16 42.13
Nov-15 40.64 41.79 42.10 44.30 45.10 43.05 31.87 38.39 36.40 43.29 44.81 40.79
Dec-15 33.70 34.59 34.61 38.16 38.80 36.97 24.42 31.49 32.18 37.68 38.16 33.53
Jan-16 26.35 26.81 27.48 30.75 31.45 29.15 20.80 23.92 24.03 30.03 30.40 30.80
Feb-16 28.77 29.44 30.37 32.46 32.86 30.87 21.38 26.77 24.70 28.68 32.24 29.49
Mar-16 34.74 35.15 36.46 38.51 38.86 36.87 25.83 32.99 31.45 35.45 38.53 34.62
Apr-16 38.22 39.00 39.43 41.48 42.15 39.89 28.84 36.33 35.04 38.14 41.51 38.52
May-16 43.48 44.29 44.77 46.83 47.50 45.08 34.28 41.60 41.96 44.76 46.85 48.64
Jun-16 46.28 46.25 46.40 48.28 48.95 46.60 38.22 44.50 44.03 47.51 48.48 51.56
Yr-on-Yr Chg. -24.1% -25.1% -24.9% -21.7% -21.3% -25.5% -26.1% -24.9% -22.4% -25.2% -22.0% -14.2%
United States Canada Light vs. Heavy
ANS1 Lost Hills Kern R. WTI WTS GCS
Okla.
Sw.
Kans.
Sw.
Mich.
So.
Wyo.
Sw.
CDN
Sweet2 HH3
2013 100.20 106.62 99.05 94.46 89.46 87.65 94.46 93.48 86.46 90.27 90.13 76.52
2014 94.79 94.13 87.39 88.44 83.44 82.19 88.44 85.77 80.44 83.52 82.59 73.85
2015 51.64 50.91 42.28 45.63 40.63 39.38 45.63 44.40 37.63 42.34 44.83 35.71
2Q 2015 48.46 61.76 53.02 55.33 50.33 49.08 55.33 54.42 47.33 51.58 55.84 46.69
3Q 2015 57.69 47.85 40.37 42.58 37.58 36.33 42.58 41.50 34.58 39.26 41.85 33.90
4Q 2015 39.88 41.77 34.08 38.25 33.25 32.00 38.25 37.25 30.25 35.94 38.97 27.77
1Q 2016 34.14 33.54 27.08 31.67 26.67 25.42 31.67 30.75 23.67 30.20 28.28 18.11
2Q 2016 30.42 45.46 38.30 44.25 39.25 38.00 44.25 43.17 36.25 43.88 42.69 32.65
Yr-on-Yr Chg. -37.2% -26.4% -27.8% -20.0% -22.0% -22.6% -20.0% -20.7% -23.4% -14.9% -23.5% -30.1%
Jun-15 51.94 61.13 53.85 56.00 51.00 49.75 56.00 55.25 48.00 52.38 58.78 51.79
Jul-15 57.76 49.87 41.75 43.50 38.50 37.25 43.50 42.50 35.50 39.87 46.29 44.14
Aug-15 57.55 47.72 40.65 42.00 37.00 35.75 42.00 40.75 34.00 37.97 36.85 25.94
Sep-15 57.76 45.95 38.70 42.25 37.25 36.00 42.25 41.25 34.25 39.95 42.49 31.85
Oct-15 41.44 47.09 38.85 43.00 38.00 36.75 43.00 42.00 35.00 40.84 43.88 31.40
Nov-15 40.48 42.46 33.85 38.25 33.25 32.00 38.25 37.25 30.25 35.96 39.83 28.25
Dec-15 37.72 35.76 29.55 33.50 28.50 27.25 33.50 32.50 25.50 31.01 33.41 23.80
Jan-16 37.72 31.62 24.85 30.00 25.00 23.75 30.00 29.00 22.00 27.87 30.49 13.73
Feb-16 41.77 31.78 25.15 29.25 24.25 23.00 29.25 28.25 21.25 27.03 27.94 22.19
Mar-16 22.94 37.21 31.25 35.75 30.75 29.50 35.75 35.00 27.75 35.71 26.19 18.50
Apr-16 36.36 44.67 37.65 42.50 37.50 36.25 42.50 41.50 34.50 42.17 36.83 27.16
May-16 30.62 46.83 40.25 45.75 40.75 39.50 45.75 44.75 37.75 45.58 44.58 34.63
Jun-16 24.29 44.89 37.00 44.50 39.50 38.25 44.50 43.25 36.50 43.89 46.61 36.13
Yr-on-Yr Chg. -53.2% -26.6% -31.3% -20.5% -22.5% -23.1% -20.5% -21.7% -24.0% -16.2% -20.7% -30.2%
CERI Commodity Report - Crude Oil
Page 14
A5: Crude Oil Quality Differentials (FOB, $US per barrel)
A6: Crude Oil Spot Prices and Differentials (FOB, $US per barrel)
Notes: 1. OPEC-Reference Basket is average price of seven crude streams: Algeria Saharan Blend, Dubai Fateh, Indonesia Minas, Mexico Isthmus, Nigeria Bonny
Light, Saudi Arabia Light and Venezuela Tia Juana Light. Source: OPEC Monthly Oil Market Report.
Notes: 1. Edmonton Light Sweet prices are discontinued as of May 1, 2014 and replaced by the Canadian Light Crude blend which is traded daily on the Net Energy Index. 2. Hardisty Heavy. Based on contract prices at the end of each month. Sources: OPEC Monthly Oil Market Report: Oil & Gas Journal; Natural Resources Canada.
Light vs. Heavy Sweet vs. Sour
Arab Lt Arab Hv Diff. Isthmus Maya Diff.
CDN
Sweet2 HH2 Diff. GCS WTS Diff.
2013 106.60 103.96 2.64 105.16 97.74 7.42 90.13 76.52 13.61 87.65 89.46 -1.81
2014 97.07 93.57 3.50 93.58 85.88 7.69 82.59 73.85 8.74 82.19 83.44 -1.25
2015 49.87 47.02 2.85 51.14 44.02 7.12 44.83 35.71 9.13 39.38 40.63 -1.25
2Q 2015 60.43 57.23 3.20 62.12 53.77 8.35 55.84 46.69 9.15 49.08 50.33 -1.25
3Q 2015 49.01 47.25 1.76 49.96 43.53 6.44 41.85 33.90 7.95 36.33 37.58 -1.25
4Q 2015 39.90 36.72 3.18 42.62 34.41 8.21 38.97 27.77 11.21 32.00 33.25 -1.25
1Q 2016 29.95 27.14 2.82 31.39 26.08 5.31 28.28 18.11 10.17 25.42 26.67 -1.25
2Q 2016 42.66 40.27 2.39 43.47 36.01 7.46 42.69 32.65 10.04 38.00 39.25 -1.25
Yr-on-Yr Chg. -29.4% -29.6% -30.0% -33.0% -23.5% -30.1% -22.6% -22.0%
Jun-15 60.94 58.01 2.93 63.48 56.63 6.85 58.78 51.79 6.99 49.75 51.00 -1.25
Jul-15 54.95 53.55 1.40 55.62 50.53 5.09 46.29 44.14 2.15 37.25 38.50 -1.25
Aug-15 46.52 44.82 1.70 46.56 40.55 6.01 36.85 25.94 10.91 35.75 37.00 -1.25
Sep-15 45.56 43.37 2.19 47.71 39.50 8.21 42.49 31.85 10.64 36.00 37.25 -1.25
Oct-15 45.37 43.01 2.36 46.90 39.14 7.76 43.88 31.40 12.48 36.75 38.00 -1.25
Nov-15 40.64 37.00 3.64 43.29 35.36 7.93 39.83 28.25 11.58 32.00 33.25 -1.25
Dec-15 33.70 30.15 3.55 37.68 28.74 8.94 33.41 23.80 9.61 27.25 28.50 -1.25
Jan-16 26.35 22.50 3.85 30.03 24.21 5.82 30.49 13.73 16.76 23.75 25.00 -1.25
Feb-16 28.77 26.15 2.62 28.68 24.84 3.84 27.94 22.19 5.75 23.00 24.25 -1.25
Mar-16 34.74 32.76 1.98 35.45 29.18 6.27 26.19 18.50 7.69 29.50 30.75 -1.25
Apr-16 38.22 35.92 2.30 38.14 30.71 7.43 36.83 27.16 9.67 36.25 37.50 -1.25
May-16 43.48 40.94 2.54 44.76 37.63 7.13 44.58 34.63 9.95 39.50 40.75 -1.25
Jun-16 46.28 43.95 2.33 47.51 39.70 7.81 46.61 36.13 10.48 38.25 39.50 -1.25
Yr-on-Yr Chg. -24.1% -24.2% -25.2% -29.9% -20.7% -30.2% -23.1% -22.5%
Spot Prices Differentials
WTI Brent Dubai Urals Basket1 WTI-Brent WTI-Dubai WTI-Urals WTI-Basket
2013 98.03 108.68 105.44 108.39 105.94 -11.87 -8.63 -11.58 -9.12
2014 93.28 98.94 96.52 97.97 96.19 -2.41 0.01 -1.44 0.34
2015 48.71 52.37 50.84 51.50 49.52 -2.69 -1.16 -1.82 0.16
2Q 2015 57.85 61.87 61.23 61.53 59.89 -8.55 -7.91 -8.21 -6.57
3Q 2015 46.47 50.44 50.01 49.75 48.16 -0.05 0.38 0.64 2.23
4Q 2015 42.03 43.71 40.71 42.30 39.72 0.21 3.21 1.62 4.20
1Q 2016 33.41 33.95 30.59 32.34 29.96 -3.03 0.33 -1.42 0.97
2Q 2016 45.52 45.54 43.23 43.86 42.30 -1.60 0.71 0.08 1.64
Yr-on-Yr Chg. -21.3% -26.4% -29.4% -28.7% -29.4%
Jun-15 59.80 61.63 61.84 61.57 60.21 -1.95 -2.16 -1.89 -0.53
Jul-15 50.90 56.48 56.20 55.87 54.19 -6.12 -5.84 -5.51 -3.83
Aug-15 42.86 46.60 47.64 45.76 45.46 -5.46 -6.50 -4.62 -4.32
Sep-15 45.45 47.61 45.45 46.98 44.83 -1.78 0.38 -1.15 1.00
Oct-15 46.20 48.51 45.92 47.31 45.02 -2.96 -0.37 -1.76 0.53
Nov-15 42.75 44.26 41.76 42.37 40.50 -3.87 -1.37 -1.98 -0.11
Dec-15 37.24 38.13 34.55 36.98 33.64 -3.39 0.19 -2.24 1.10
Jan-16 31.57 30.75 26.81 29.15 26.50 -4.20 -0.26 -2.60 0.05
Feb-16 30.38 32.46 29.33 30.87 28.72 -0.98 2.15 0.61 2.76
Mar-16 37.76 38.49 35.12 36.85 34.65 2.96 6.33 4.60 6.80
Apr-16 40.95 41.48 39.00 39.89 37.86 1.15 3.63 2.74 4.77
May-16 46.72 46.79 44.30 45.01 43.21 0.96 3.45 2.74 4.54
Jun-16 48.74 48.28 46.25 46.60 45.84 0.57 2.60 2.25 3.01
Yr-on-Yr Chg. -18.5% -21.7% -25.2% -24.3% -23.9%
Relevant • Independent • Objective
Page 15
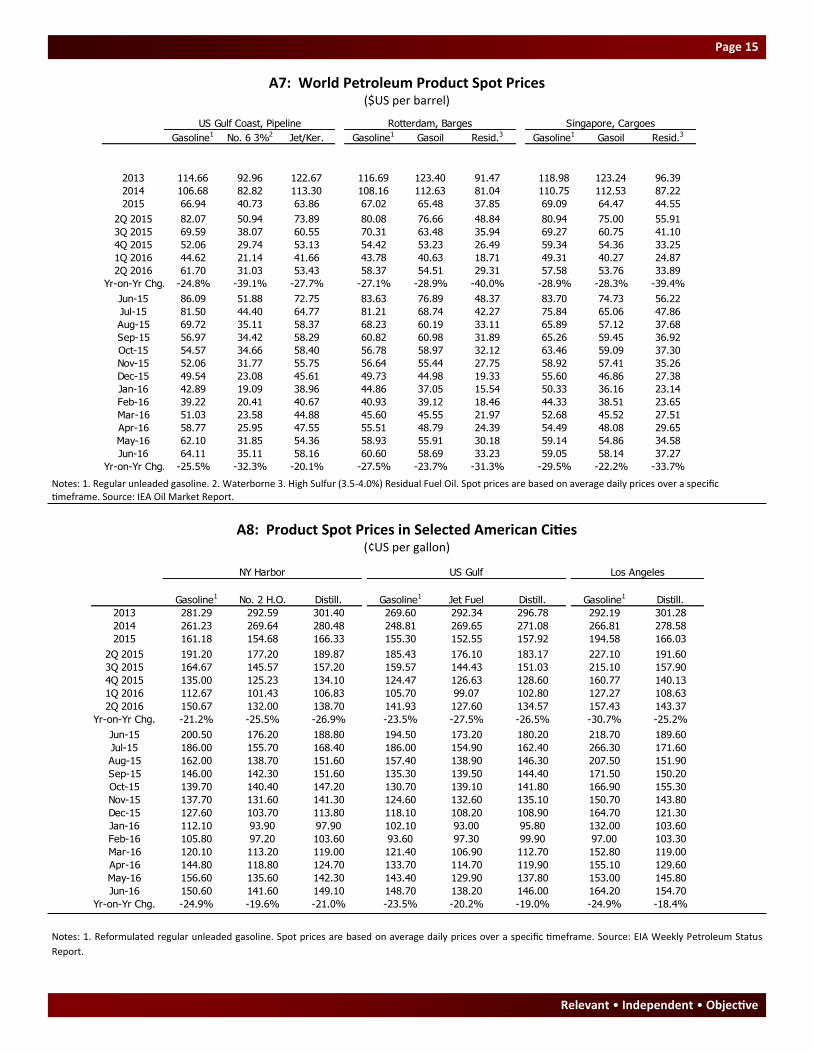
A7: World Petroleum Product Spot Prices ($US per barrel)
A8: Product Spot Prices in Selected American Cities (¢US per gallon)
Notes: 1. Reformulated regular unleaded gasoline. Spot prices are based on average daily prices over a specific timeframe. Source: EIA Weekly Petroleum Status
Report.
Notes: 1. Regular unleaded gasoline. 2. Waterborne 3. High Sulfur (3.5-4.0%) Residual Fuel Oil. Spot prices are based on average daily prices over a specific timeframe. Source: IEA Oil Market Report.
US Gulf Coast, Pipeline Rotterdam, Barges Singapore, Cargoes
Gasoline1 No. 6 3%2 Jet/Ker. Gasoline1 Gasoil Resid.3 Gasoline1 Gasoil Resid.3
2013 114.66 92.96 122.67 116.69 123.40 91.47 118.98 123.24 96.39
2014 106.68 82.82 113.30 108.16 112.63 81.04 110.75 112.53 87.22
2015 66.94 40.73 63.86 67.02 65.48 37.85 69.09 64.47 44.55
2Q 2015 82.07 50.94 73.89 80.08 76.66 48.84 80.94 75.00 55.91
3Q 2015 69.59 38.07 60.55 70.31 63.48 35.94 69.27 60.75 41.10
4Q 2015 52.06 29.74 53.13 54.42 53.23 26.49 59.34 54.36 33.25
1Q 2016 44.62 21.14 41.66 43.78 40.63 18.71 49.31 40.27 24.87
2Q 2016 61.70 31.03 53.43 58.37 54.51 29.31 57.58 53.76 33.89
Yr-on-Yr Chg. -24.8% -39.1% -27.7% -27.1% -28.9% -40.0% -28.9% -28.3% -39.4%
Jun-15 86.09 51.88 72.75 83.63 76.89 48.37 83.70 74.73 56.22
Jul-15 81.50 44.40 64.77 81.21 68.74 42.27 75.84 65.06 47.86
Aug-15 69.72 35.11 58.37 68.23 60.19 33.11 65.89 57.12 37.68
Sep-15 56.97 34.42 58.29 60.82 60.98 31.89 65.26 59.45 36.92
Oct-15 54.57 34.66 58.40 56.78 58.97 32.12 63.46 59.09 37.30
Nov-15 52.06 31.77 55.75 56.64 55.44 27.75 58.92 57.41 35.26
Dec-15 49.54 23.08 45.61 49.73 44.98 19.33 55.60 46.86 27.38
Jan-16 42.89 19.09 38.96 44.86 37.05 15.54 50.33 36.16 23.14
Feb-16 39.22 20.41 40.67 40.93 39.12 18.46 44.33 38.51 23.65
Mar-16 51.03 23.58 44.88 45.60 45.55 21.97 52.68 45.52 27.51
Apr-16 58.77 25.95 47.55 55.51 48.79 24.39 54.49 48.08 29.65
May-16 62.10 31.85 54.36 58.93 55.91 30.18 59.14 54.86 34.58
Jun-16 64.11 35.11 58.16 60.60 58.69 33.23 59.05 58.14 37.27
Yr-on-Yr Chg. -25.5% -32.3% -20.1% -27.5% -23.7% -31.3% -29.5% -22.2% -33.7%
NY Harbor US Gulf Los Angeles
Gasoline1 No. 2 H.O. Distill. Gasoline1 Jet Fuel Distill. Gasoline1 Distill.
2013 281.29 292.59 301.40 269.60 292.34 296.78 292.19 301.28
2014 261.23 269.64 280.48 248.81 269.65 271.08 266.81 278.58
2015 161.18 154.68 166.33 155.30 152.55 157.92 194.58 166.03
2Q 2015 191.20 177.20 189.87 185.43 176.10 183.17 227.10 191.60
3Q 2015 164.67 145.57 157.20 159.57 144.43 151.03 215.10 157.90
4Q 2015 135.00 125.23 134.10 124.47 126.63 128.60 160.77 140.13
1Q 2016 112.67 101.43 106.83 105.70 99.07 102.80 127.27 108.63
2Q 2016 150.67 132.00 138.70 141.93 127.60 134.57 157.43 143.37
Yr-on-Yr Chg. -21.2% -25.5% -26.9% -23.5% -27.5% -26.5% -30.7% -25.2%
Jun-15 200.50 176.20 188.80 194.50 173.20 180.20 218.70 189.60
Jul-15 186.00 155.70 168.40 186.00 154.90 162.40 266.30 171.60
Aug-15 162.00 138.70 151.60 157.40 138.90 146.30 207.50 151.90
Sep-15 146.00 142.30 151.60 135.30 139.50 144.40 171.50 150.20
Oct-15 139.70 140.40 147.20 130.70 139.10 141.80 166.90 155.30
Nov-15 137.70 131.60 141.30 124.60 132.60 135.10 150.70 143.80
Dec-15 127.60 103.70 113.80 118.10 108.20 108.90 164.70 121.30
Jan-16 112.10 93.90 97.90 102.10 93.00 95.80 132.00 103.60
Feb-16 105.80 97.20 103.60 93.60 97.30 99.90 97.00 103.30
Mar-16 120.10 113.20 119.00 121.40 106.90 112.70 152.80 119.00
Apr-16 144.80 118.80 124.70 133.70 114.70 119.90 155.10 129.60
May-16 156.60 135.60 142.30 143.40 129.90 137.80 153.00 145.80
Jun-16 150.60 141.60 149.10 148.70 138.20 146.00 164.20 154.70
Yr-on-Yr Chg. -24.9% -19.6% -21.0% -23.5% -20.2% -19.0% -24.9% -18.4%
CERI Commodity Report - Crude Oil
Page 16
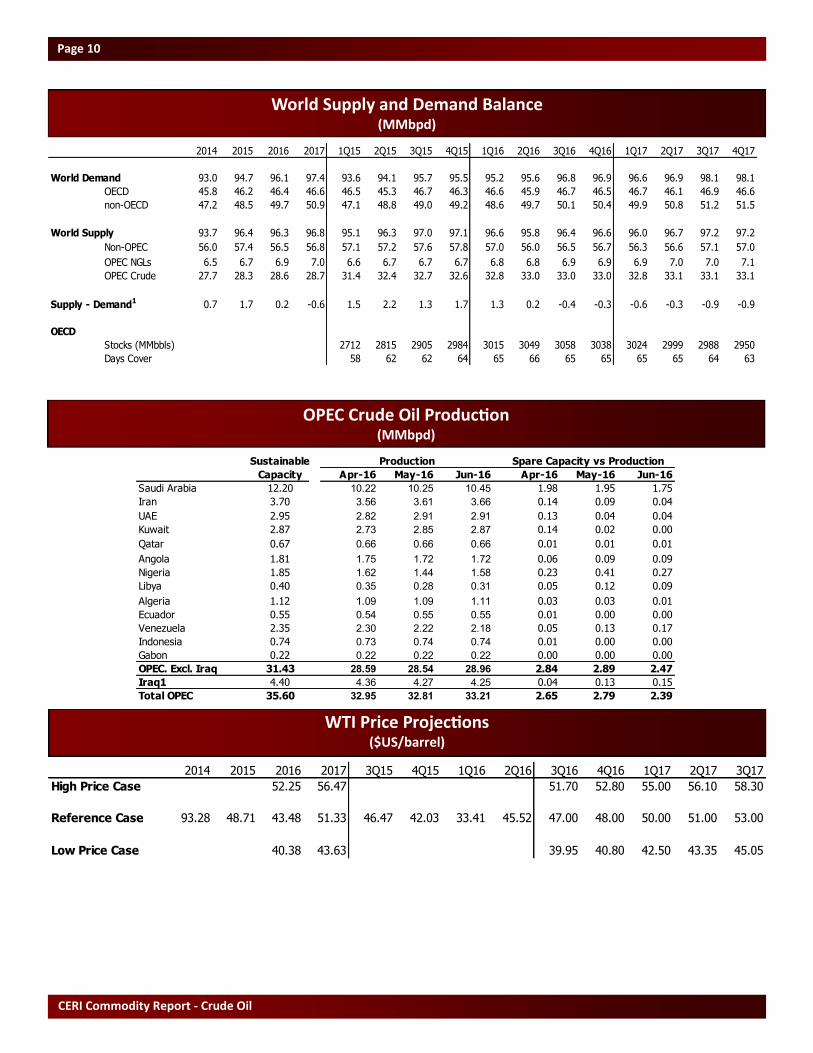
B1: World Petroleum Supply and Demand Balance (million barrels per day)
Notes: 1. Totals for OECD and non-OECD supply include net refining gains; specific regions/groupings within each do not. 2. OPEC demand is an estimate based on
historical annual data. 3. Balance for World equals global stockbuilds (+) and stockdraws (-) for crude oil and petroleum products and miscellaneous gains and loss-
es. Regional surpluses (+) and deficits (-) are balanced through net-imports and stock changes in the short-term, and net-imports in the longer term. Supply includes
crude oil, condensates, NGLs, oil from non-conventional sources and processing gains. Demand is for petroleum products.
Source: IEA Oil Market Report.
OECD Non-OECD OPEC World
Americas Europe Asia Ocean. Total1 Asia Non-Asia FSU Total1 P. Gulf Non-Gulf Total2 Total3
Demand
2011 24.0 14.3 8.2 46.4 19.3 11.4 4.6 35.3 4.9 2.9 7.9 89.5
2012 23.6 13.8 8.5 45.9 19.8 12.0 4.6 36.4 5.1 3.0 8.2 90.7
2013 24.2 13.6 8.3 46.1 20.7 12.0 4.7 37.4 5.3 3.1 8.5 92.0
2014 24.2 13.5 8.1 45.8 21.3 12.1 4.9 38.3 5.5 3.2 8.9 93.0
2015 24.5 13.7 8.0 46.2 22.4 12.1 4.9 39.4 5.8 3.4 9.2 94.7
2Q 2014 23.7 13.4 7.7 44.8 21.4 12.3 4.9 38.6 5.5 3.2 8.9 92.1
3Q 2014 24.4 13.9 7.7 45.9 20.8 12.5 5.1 38.4 5.5 3.2 8.9 93.3
4Q 2014 24.6 13.5 8.3 46.4 21.8 12.0 5.0 38.8 5.5 3.2 8.9 94.1
1Q 2015 24.3 13.5 8.7 46.5 22.0 11.3 4.6 37.9 5.8 3.4 9.2 93.6
2Q 2015 24.2 13.6 7.6 45.3 22.4 12.2 4.9 39.5 5.8 3.4 9.2 94.1
3Q 2015 24.8 14.2 7.7 46.7 22.3 12.5 5.1 39.9 5.8 3.4 9.2 95.7
4Q 2015 24.5 13.7 8.2 46.3 22.8 12.1 5.0 39.9 5.8 3.4 9.2 95.5
1Q 2016 24.5 13.6 8.5 46.6 22.9 11.2 4.9 39.0 6.0 3.5 9.6 95.2
2Q 2016 24.5 13.8 7.6 45.9 23.2 11.9 5.0 40.1 6.0 3.5 9.6 95.6
Supply
2011 14.6 3.8 0.6 20.1 7.7 8.5 13.6 30.7 25.7 9.6 35.8 88.6
2012 15.8 3.5 0.6 21.0 6.9 8.0 13.8 29.6 26.2 10.6 37.6 90.9
2013 17.2 3.3 0.5 22.2 6.8 7.6 13.9 29.3 26.2 9.8 36.7 91.3
2014 19.1 3.3 0.5 24.1 6.8 7.9 13.9 29.6 26.8 9.0 37.5 93.8
2015 19.9 3.5 0.5 25.1 7.0 8.0 14.0 30.0 28.2 8.7 39.0 96.4
2Q 2014 18.9 3.2 0.5 23.8 6.8 8.0 13.8 29.6 26.8 9.0 36.4 93.1
3Q 2014 19.3 3.1 0.5 24.1 6.8 8.2 13.8 29.8 26.9 9.3 37.0 94.3
4Q 2014 19.9 3.4 0.5 25.0 7.1 8.3 13.9 30.3 26.8 9.4 37.0 95.5
1Q 2015 20.0 3.4 0.4 25.0 7.1 8.0 14.0 30.1 27.3 8.8 36.9 95.1
2Q 2015 19.6 3.5 0.4 24.7 7.1 8.0 14.0 30.1 28.3 8.9 38.0 96.3
3Q 2015 20.1 3.4 0.5 25.1 7.0 8.0 13.9 29.9 28.7 8.6 39.1 97.0
4Q 2015 20.1 3.6 0.5 25.4 7.0 8.0 14.1 30.1 28.6 8.7 39.2 97.2
1Q 2016 19.9 3.6 0.4 25.3 6.9 7.8 14.3 30.0 28.9 8.5 39.5 96.5
2Q 2016 18.9 3.4 0.4 23.9 6.7 7.7 14.0 29.5 29.7 8.1 39.8 95.8
Balance
2011 -9.4 -10.5 -7.6 -26.3 -11.6 -2.9 9.0 -4.6 20.8 6.7 28.0 -0.9
2012 -7.8 -10.3 -7.9 -24.9 -12.9 -4.0 9.2 -6.8 21.1 7.6 29.4 0.2
2013 -7.0 -10.3 -7.8 -23.9 -13.9 -4.4 9.2 -8.1 20.9 6.7 28.2 -0.7
2014 -5.1 -10.2 -7.6 -21.7 -14.5 -4.2 9.0 -8.7 21.2 5.7 28.6 0.8
2015 -4.6 -10.2 -7.5 -21.1 -15.4 -4.1 9.1 -9.4 22.4 5.3 29.7 1.7
2Q 2014 -4.8 -10.2 -7.2 -21.0 -14.6 -4.3 8.9 -9.0 21.3 5.7 27.6 1.0
3Q 2014 -5.1 -10.8 -7.2 -21.8 -14.0 -4.3 8.7 -8.6 21.3 6.1 28.1 1.0
4Q 2014 -4.7 -10.1 -7.8 -21.4 -14.7 -3.7 8.9 -8.5 21.3 6.1 28.1 1.4
1Q 2015 -4.3 -10.1 -8.3 -21.5 -14.9 -3.3 9.4 -7.8 21.5 5.4 27.7 1.5
2Q 2015 -4.6 -10.1 -7.2 -20.6 -15.3 -4.2 9.1 -9.3 22.5 5.5 28.8 2.2
3Q 2015 -4.7 -10.8 -7.2 -21.6 -15.3 -4.5 8.8 -10.0 22.9 5.2 29.9 1.3
4Q 2015 -4.4 -10.1 -7.7 -20.9 -15.8 -4.1 9.1 -9.8 22.9 5.3 29.9 1.7
1Q 2016 -4.6 -10.0 -8.1 -21.3 -16.0 -3.4 9.4 -8.9 22.9 5.0 29.9 1.3
2Q 2016 -5.6 -10.4 -7.2 -22.0 -16.5 -4.2 9.0 -10.6 23.7 4.6 30.2 0.2
Relevant • Independent • Objective
Page 17
B2: World Petroleum Production (million barrels per day)
B3: OECD Commercial Petroleum Stocks (million barrels)
Notes: 1. Production includes crude oil, condensates and NGLs. 2. Reserve-Production ratio is based on latest month production and British Petroleum reserve
estimates. Sources: IEA Oil Market Report and BP Statistical Review of World Energy.
Notes: 1. Product includes only finished petroleum products. 2. Total stocks include NGLs, refinery feedstocks, additives/oxygenates and other hydrocarbons. All
stocks are closing levels for respective reporting period. Source: IEA Oil Market Report.
OECD Non-OECD OPEC World
Americas Europe Asia Oc. Total Asia Non-Asia FSU Total P. Gulf Non-Gulf Total Total1
2013 17.14 3.32 0.48 20.94 7.73 7.97 13.80 29.50 26.18 9.80 36.72 87.16
2014 19.08 3.32 0.51 22.91 6.88 8.16 13.87 28.90 26.77 8.96 37.48 89.29
2015 19.93 3.48 0.46 23.87 7.04 8.01 14.00 29.06 28.16 8.65 38.95 91.88
2Q 2015 19.51 3.49 0.44 23.45 7.95 8.23 13.97 30.15 28.27 8.92 38.03 91.63
3Q 2015 20.05 3.35 0.50 23.91 7.01 8.21 13.92 29.15 28.66 8.63 39.13 92.19
4Q 2015 20.08 3.60 0.47 24.15 7.08 8.16 14.06 29.30 28.62 8.67 39.15 92.60
1Q 2016 19.88 3.64 0.43 23.96 6.91 7.71 14.26 28.87 28.89 8.48 39.54 92.37
2Q 2016 18.86 3.43 0.42 22.71 6.74 7.74 14.04 28.52 29.66 8.09 39.81 91.04
Yr-on-Yr Chg. -3.3% -1.7% -4.5% -3.2% -15.2% -6.0% 0.5% -5.4% 4.9% -9.3% 4.7% -0.6%
Jun-15 19.58 3.45 0.49 23.52 8.03 8.22 13.97 30.21 28.66 8.80 38.35 92.08
Jul-15 20.01 3.44 0.49 23.94 7.90 8.16 13.93 30.00 28.67 8.81 38.36 92.30
Aug-15 20.03 3.36 0.51 23.91 7.94 8.21 13.88 30.03 28.60 8.80 38.17 92.11
Sep-15 19.65 3.31 0.48 23.44 7.95 8.17 13.92 30.04 28.66 8.84 38.37 91.85
Oct-15 19.93 3.53 0.46 23.93 7.05 8.16 13.94 29.15 28.46 8.76 39.09 92.17
Nov-15 20.06 3.60 0.49 24.15 7.18 8.15 14.07 29.40 28.71 8.70 39.23 92.78
Dec-15 20.01 3.65 0.47 24.13 7.09 8.33 14.08 29.48 28.69 8.62 39.15 92.76
Jan-16 19.83 3.55 0.44 23.83 6.96 8.00 14.19 29.15 29.02 8.59 39.47 92.45
Feb-16 19.85 3.62 0.44 23.90 6.95 7.97 14.21 29.13 28.90 8.53 39.31 92.34
Mar-16 19.86 3.59 0.43 23.88 6.86 7.78 14.20 28.84 28.85 8.44 39.20 91.92
Apr-16 19.25 3.57 0.42 23.24 6.78 7.57 14.05 28.41 29.40 8.27 39.77 91.42
May-16 18.56 3.48 0.42 22.46 6.73 7.81 14.02 28.56 29.66 7.90 39.63 90.65
Jun-16 18.77 3.24 0.42 22.42 6.70 7.84 14.06 28.60 29.90 8.07 40.03 91.05
Yr-on-Yr Chg. -4.1% -6.1% -14.3% -4.7% -16.6% -4.6% 0.6% -5.3% 4.3% -8.4% 4.4% -1.1%
R/P Ratio2 33.9 10.7 26.7 30.5 14.3 23.6 27.7 23.4 73.3 135.8 82.1 51.2
Americas Europe Asia Oceania OECD
Crude Product Total Crude Product Total Crude Product Total Crude Product1 Total2
2013 500 670 1,315 307 497 869 145 170 382 952 1,337 2,566
2014 553 727 1,443 311 505 880 157 169 389 1,020 1,401 2,712
2015 641 773 1,590 361 563 990 206 166 435 1,208 1,502 3,015
1Q 2015 625 695 1,483 344 524 939 178 153 392 1,148 1,372 2,815
2Q 2015 626 735 1,537 344 523 939 201 165 430 1,171 1,423 2,906
3Q 2015 617 763 1,572 339 559 967 202 176 445 1,158 1,498 2,984
4Q 2015 641 773 1,590 361 563 990 206 166 435 1,208 1,502 3,015
1Q 2016 689 760 1,623 351 585 1,005 196 166 421 1,236 1,512 3,049
Yr-on-Yr Chg. 10.2% 9.4% 9.4% 1.8% 11.7% 7.0% 10.1% 8.7% 7.4% 7.7% 10.2% 8.3%
May-15 629 725 1,528 344 532 947 198 168 430 1,171 1,425 2,905
Jun-15 626 735 1,537 344 523 939 201 165 430 1,171 1,423 2,906
Jul-15 617 738 1,542 339 526 933 205 170 439 1,161 1,434 2,914
Aug-15 614 759 1,564 343 553 964 205 178 449 1,162 1,490 2,976
Sep-15 617 763 1,572 339 559 967 202 176 445 1,158 1,498 2,984
Oct-15 642 745 1,576 347 556 972 205 169 439 1,194 1,469 2,987
Nov-15 647 762 1,593 346 568 980 191 170 428 1,183 1,500 3,001
Dec-15 641 773 1,590 361 563 990 206 166 435 1,208 1,502 3,015
Jan-16 661 780 1,614 358 589 1,015 192 167 425 1,210 1,536 3,054
Feb-16 676 765 1,611 354 593 1,020 196 163 422 1,225 1,522 3,052
Mar-16 689 760 1,623 351 585 1,005 196 166 421 1,236 1,512 3,049
Apr-16 691 761 1,628 357 584 1,010 200 163 422 1,248 1,508 3,060
May-16 680 770 1,623 358 589 1,016 209 169 434 1,247 1,528 3,074
Yr-on-Yr Chg. 8.2% 6.2% 6.3% 4.3% 10.7% 7.3% 5.4% 0.8% 0.9% 6.6% 7.3% 5.8%
CERI Commodity Report - Crude Oil
Page 18
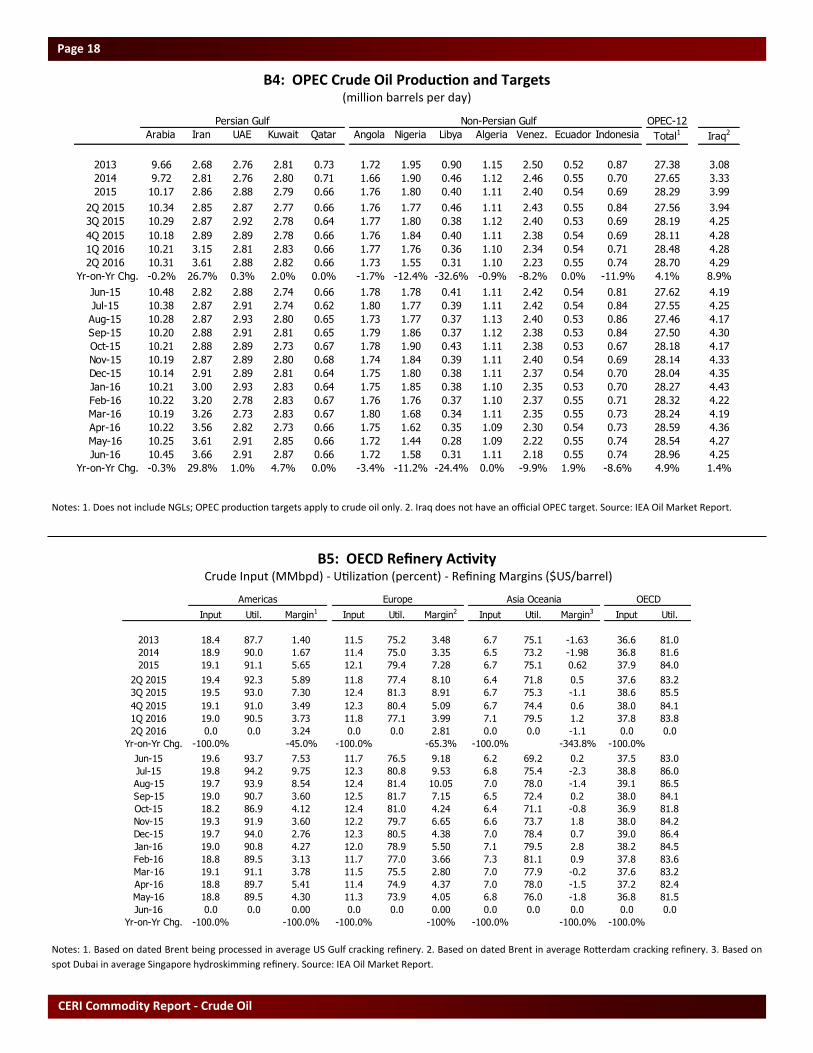
B4: OPEC Crude Oil Production and Targets (million barrels per day)
Notes: 1. Does not include NGLs; OPEC production targets apply to crude oil only. 2. Iraq does not have an official OPEC target. Source: IEA Oil Market Report.
B5: OECD Refinery Activity Crude Input (MMbpd) - Utilization (percent) - Refining Margins ($US/barrel)
Notes: 1. Based on dated Brent being processed in average US Gulf cracking refinery. 2. Based on dated Brent in average Rotterdam cracking refinery. 3. Based on
spot Dubai in average Singapore hydroskimming refinery. Source: IEA Oil Market Report.
Non-Persian Gulf OPEC-12
Arabia Iran UAE Kuwait Qatar Angola Nigeria Libya Algeria Venez. Ecuador Indonesia Total1 Iraq2
2013 9.66 2.68 2.76 2.81 0.73 1.72 1.95 0.90 1.15 2.50 0.52 0.87 27.38 3.08
2014 9.72 2.81 2.76 2.80 0.71 1.66 1.90 0.46 1.12 2.46 0.55 0.70 27.65 3.33
2015 10.17 2.86 2.88 2.79 0.66 1.76 1.80 0.40 1.11 2.40 0.54 0.69 28.29 3.99
2Q 2015 10.34 2.85 2.87 2.77 0.66 1.76 1.77 0.46 1.11 2.43 0.55 0.84 27.56 3.94
3Q 2015 10.29 2.87 2.92 2.78 0.64 1.77 1.80 0.38 1.12 2.40 0.53 0.69 28.19 4.25
4Q 2015 10.18 2.89 2.89 2.78 0.66 1.76 1.84 0.40 1.11 2.38 0.54 0.69 28.11 4.28
1Q 2016 10.21 3.15 2.81 2.83 0.66 1.77 1.76 0.36 1.10 2.34 0.54 0.71 28.48 4.28
2Q 2016 10.31 3.61 2.88 2.82 0.66 1.73 1.55 0.31 1.10 2.23 0.55 0.74 28.70 4.29
Yr-on-Yr Chg. -0.2% 26.7% 0.3% 2.0% 0.0% -1.7% -12.4% -32.6% -0.9% -8.2% 0.0% -11.9% 4.1% 8.9%
Jun-15 10.48 2.82 2.88 2.74 0.66 1.78 1.78 0.41 1.11 2.42 0.54 0.81 27.62 4.19
Jul-15 10.38 2.87 2.91 2.74 0.62 1.80 1.77 0.39 1.11 2.42 0.54 0.84 27.55 4.25
Aug-15 10.28 2.87 2.93 2.80 0.65 1.73 1.77 0.37 1.13 2.40 0.53 0.86 27.46 4.17
Sep-15 10.20 2.88 2.91 2.81 0.65 1.79 1.86 0.37 1.12 2.38 0.53 0.84 27.50 4.30
Oct-15 10.21 2.88 2.89 2.73 0.67 1.78 1.90 0.43 1.11 2.38 0.53 0.67 28.18 4.17
Nov-15 10.19 2.87 2.89 2.80 0.68 1.74 1.84 0.39 1.11 2.40 0.54 0.69 28.14 4.33
Dec-15 10.14 2.91 2.89 2.81 0.64 1.75 1.80 0.38 1.11 2.37 0.54 0.70 28.04 4.35
Jan-16 10.21 3.00 2.93 2.83 0.64 1.75 1.85 0.38 1.10 2.35 0.53 0.70 28.27 4.43
Feb-16 10.22 3.20 2.78 2.83 0.67 1.76 1.76 0.37 1.10 2.37 0.55 0.71 28.32 4.22
Mar-16 10.19 3.26 2.73 2.83 0.67 1.80 1.68 0.34 1.11 2.35 0.55 0.73 28.24 4.19
Apr-16 10.22 3.56 2.82 2.73 0.66 1.75 1.62 0.35 1.09 2.30 0.54 0.73 28.59 4.36
May-16 10.25 3.61 2.91 2.85 0.66 1.72 1.44 0.28 1.09 2.22 0.55 0.74 28.54 4.27
Jun-16 10.45 3.66 2.91 2.87 0.66 1.72 1.58 0.31 1.11 2.18 0.55 0.74 28.96 4.25
Yr-on-Yr Chg. -0.3% 29.8% 1.0% 4.7% 0.0% -3.4% -11.2% -24.4% 0.0% -9.9% 1.9% -8.6% 4.9% 1.4%
Persian Gulf
Americas Europe Asia Oceania OECD
Input Util. Margin1 Input Util. Margin2 Input Util. Margin3 Input Util.
2013 18.4 87.7 1.40 11.5 75.2 3.48 6.7 75.1 -1.63 36.6 81.0
2014 18.9 90.0 1.67 11.4 75.0 3.35 6.5 73.2 -1.98 36.8 81.6
2015 19.1 91.1 5.65 12.1 79.4 7.28 6.7 75.1 0.62 37.9 84.0
2Q 2015 19.4 92.3 5.89 11.8 77.4 8.10 6.4 71.8 0.5 37.6 83.2
3Q 2015 19.5 93.0 7.30 12.4 81.3 8.91 6.7 75.3 -1.1 38.6 85.5
4Q 2015 19.1 91.0 3.49 12.3 80.4 5.09 6.7 74.4 0.6 38.0 84.1
1Q 2016 19.0 90.5 3.73 11.8 77.1 3.99 7.1 79.5 1.2 37.8 83.8
2Q 2016 0.0 0.0 3.24 0.0 0.0 2.81 0.0 0.0 -1.1 0.0 0.0
Yr-on-Yr Chg. -100.0% -45.0% -100.0% -65.3% -100.0% -343.8% -100.0%
Jun-15 19.6 93.7 7.53 11.7 76.5 9.18 6.2 69.2 0.2 37.5 83.0
Jul-15 19.8 94.2 9.75 12.3 80.8 9.53 6.8 75.4 -2.3 38.8 86.0
Aug-15 19.7 93.9 8.54 12.4 81.4 10.05 7.0 78.0 -1.4 39.1 86.5
Sep-15 19.0 90.7 3.60 12.5 81.7 7.15 6.5 72.4 0.2 38.0 84.1
Oct-15 18.2 86.9 4.12 12.4 81.0 4.24 6.4 71.1 -0.8 36.9 81.8
Nov-15 19.3 91.9 3.60 12.2 79.7 6.65 6.6 73.7 1.8 38.0 84.2
Dec-15 19.7 94.0 2.76 12.3 80.5 4.38 7.0 78.4 0.7 39.0 86.4
Jan-16 19.0 90.8 4.27 12.0 78.9 5.50 7.1 79.5 2.8 38.2 84.5
Feb-16 18.8 89.5 3.13 11.7 77.0 3.66 7.3 81.1 0.9 37.8 83.6
Mar-16 19.1 91.1 3.78 11.5 75.5 2.80 7.0 77.9 -0.2 37.6 83.2
Apr-16 18.8 89.7 5.41 11.4 74.9 4.37 7.0 78.0 -1.5 37.2 82.4
May-16 18.8 89.5 4.30 11.3 73.9 4.05 6.8 76.0 -1.8 36.8 81.5
Jun-16 0.0 0.0 0.00 0.0 0.0 0.00 0.0 0.0 0.0 0.0 0.0
Yr-on-Yr Chg. -100.0% -100.0% -100.0% -100% -100.0% -100.0% -100.0%
Relevant • Independent • Objective
Page 19
C1: US Petroleum Supply and Demand Balance (million barrels per day)
Notes: 1. Does not balance because of unaccounted for crude oil. Regional surpluses (+) and deficits (-) are balanced through net-imports/transfers and stock chang-
es in the short-term, and net-imports/transfers in the longer term. 2. As of most recent month. Supply includes crude oil, condensates, NGLs, oil from non-
conventional sources and processing gains. Demand is for petroleum products. Source: EIA Petroleum Supply Monthly.
United States1 East Mid-West
Supply Demand Net-Imp. Stk. Chg. Supply Demand Balance Supply Demand Balance
2013 12.11 18.89 6.20 -0.13 0.19 5.23 -5.04 2.90 4.88 -1.97
2014 13.67 19.03 5.04 0.26 0.31 5.45 -5.14 3.35 4.91 -1.56
2015 14.78 19.39 4.65 0.43 0.41 5.58 -5.17 3.63 5.01 -1.38
1Q 2015 14.45 19.29 4.93 0.56 0.36 5.81 -5.45 3.56 4.99 -1.43
2Q 2015 14.91 19.25 4.61 0.69 0.43 5.49 -5.06 3.64 4.99 -1.36
3Q 2015 14.85 19.67 4.73 0.33 0.42 5.54 -5.12 3.60 5.11 -1.50
4Q 2015 14.89 19.36 4.31 0.15 0.42 5.46 -5.05 3.74 4.97 -1.24
1Q 2016 14.72 19.45 4.98 0.41 0.44 5.52 -5.08 3.69 5.03 -1.35
Yr-on-Yr Chg. 1.9% 0.8% 0.9% 22.4% -4.9% 3.7% 0.9%
Apr-15 15.12 19.04 4.36 0.90 0.42 5.49 -5.07 3.58 4.88 -1.30
May-15 14.91 19.12 4.60 0.73 0.43 5.52 -5.09 3.65 5.01 -1.37
Jun-15 14.69 19.59 4.88 0.44 0.44 5.47 -5.03 3.68 5.08 -1.40
Jul-15 14.82 19.98 4.54 -0.09 0.43 5.58 -5.15 3.65 5.18 -1.53
Aug-15 14.91 19.81 5.20 0.73 0.42 5.61 -5.20 3.60 5.07 -1.47
Sep-15 14.83 19.23 4.45 0.33 0.41 5.42 -5.01 3.56 5.06 -1.51
Oct-15 14.90 19.35 4.17 0.26 0.41 5.50 -5.10 3.70 5.15 -1.44
Nov-15 14.92 19.19 4.31 0.42 0.41 5.27 -4.86 3.74 4.80 -1.06
Dec-15 14.86 19.54 4.45 -0.22 0.43 5.62 -5.18 3.76 4.97 -1.21
Jan-16 14.69 19.06 4.86 0.83 0.44 5.31 -4.86 3.66 5.04 -1.38
Feb-16 14.64 19.68 5.07 0.14 0.44 5.74 -5.30 3.69 5.03 -1.33
Mar-16 14.82 19.62 5.00 0.26 0.44 5.52 -5.08 3.71 5.04 -1.33
Apr-16 14.59 19.26 4.68 0.36 0.46 5.38 -4.92 3.62 5.02 -1.40
Yr-on-Yr Chg. -3.5% 1.2% 7.1% 8.8% -2.1% 1.1% 2.8%
% of Total2 100.0% 100.0% 3.1% 27.9% 24.8% 26.0%
South-Central North-West West Finished Petroleum Products
Supply Demand Balance Supply Demand Balance Supply Demand Balance
2013 6.77 5.28 1.49 0.87 0.71 0.16 1.37 2.79 -1.42
2014 7.65 5.16 2.50 0.98 0.71 0.27 1.38 2.81 -1.43
2015 8.31 5.20 3.11 1.10 0.69 0.41 1.33 2.91 -1.59
1Q 2015 8.08 5.02 3.06 1.08 0.70 0.38 1.37 2.78 -1.41
2Q 2015 8.38 5.15 3.24 1.12 0.69 0.43 1.34 2.93 -1.58
3Q 2015 8.44 5.29 3.15 1.12 0.70 0.41 1.27 3.04 -1.77
4Q 2015 8.32 5.33 2.99 1.10 0.67 0.42 1.32 2.92 -1.60
1Q 2016 8.16 5.35 2.81 1.08 0.70 0.38 1.34 2.85 -1.50
Yr-on-Yr Chg. 0.9% 6.6% 0.2% -0.6% -1.6% 2.5%
Apr-15 8.59 5.05 3.54 1.14 0.69 0.46 1.39 2.93 -1.54
May-15 8.39 5.07 3.32 1.10 0.66 0.44 1.34 2.86 -1.51
Jun-15 8.17 5.32 2.85 1.10 0.72 0.38 1.30 3.00 -1.70
Jul-15 8.33 5.40 2.93 1.12 0.71 0.41 1.29 3.10 -1.82
Aug-15 8.54 5.33 3.21 1.12 0.74 0.38 1.23 3.06 -1.83
Sep-15 8.46 5.13 3.33 1.11 0.66 0.45 1.30 2.95 -1.65
Oct-15 8.39 5.05 3.34 1.10 0.69 0.42 1.31 2.96 -1.66
Nov-15 8.33 5.62 2.71 1.11 0.66 0.44 1.33 2.83 -1.50
Dec-15 8.25 5.33 2.92 1.08 0.67 0.41 1.33 2.96 -1.63
Jan-16 8.16 5.36 2.80 1.07 0.66 0.41 1.36 2.69 -1.33
Feb-16 8.09 5.27 2.82 1.08 0.73 0.35 1.34 2.91 -1.57
Mar-16 8.23 5.42 2.81 1.11 0.71 0.40 1.33 2.93 -1.61
Apr-16 8.15 5.25 2.90 1.08 0.63 0.45 1.29 2.99 -1.70
Yr-on-Yr Chg. -5.1% 4.0% -5.2% -8.4% -7.6% 1.9%
% of Total2 55.8% 27.3% 7.4% 3.3% 8.8% 15.5%
CERI Commodity Report - Crude Oil
Page 20
C2: US Petroleum Demand by Product (million barrels per day)
Notes: 1. Total includes other finished petroleum products. 2. Total petroleum demand includes refinery feedstocks, additives/oxygenates and other hydrocarbons.
Source: EIA Petroleum Supply Monthly.
C3: US Petroleum Stocks (million barrels)
Notes: 1. Petroleum stocks include crude oil, finished products, NGLs, refinery feedstocks, additives/oxygenates and other hydrocarbons. 2. Includes Strategic
Petroleum Reserves. 3. Total includes other finished petroleum products. All stocks are closing levels for respective reporting period. Source: EIA Petroleum Supply
Monthly.
Finished Petroleum Products NGLs Petroleum
Gasoline Jet Fuel Distil. Resid. Total1 Total Total2
2013 8.77 1.42 3.84 0.32 16.32 2.45 18.89
2014 8.92 1.47 4.01 0.26 16.64 2.40 19.03
2015 9.16 1.54 3.98 0.26 16.94 2.47 19.39
1Q 2015 8.81 1.45 4.27 0.24 16.62 2.72 19.29
2Q 2015 9.26 1.54 3.88 0.19 16.93 2.27 19.25
3Q 2015 9.39 1.59 3.93 0.31 17.41 2.29 19.67
4Q 2015 9.17 1.57 3.83 0.30 16.79 2.58 19.36
1Q 2016 9.09 1.50 3.91 0.31 16.70 2.73 19.45
Yr-on-Yr Chg. 3.2% 3.7% -8.6% 28.4% 0.5% 0.2% 0.8%
Apr-15 9.14 1.48 4.00 0.15 16.74 2.34 19.04
May-15 9.25 1.51 3.79 0.23 16.84 2.17 19.12
Jun-15 9.39 1.64 3.85 0.17 17.20 2.30 19.59
Jul-15 9.44 1.64 3.88 0.33 17.52 2.40 19.98
Aug-15 9.47 1.60 3.89 0.32 17.53 2.34 19.81
Sep-15 9.28 1.54 4.02 0.28 17.18 2.14 19.23
Oct-15 9.25 1.58 3.99 0.21 17.06 2.43 19.35
Nov-15 9.11 1.55 3.70 0.36 16.60 2.55 19.19
Dec-15 9.14 1.58 3.80 0.33 16.71 2.77 19.54
Jan-16 8.67 1.45 3.82 0.34 16.12 2.96 19.06
Feb-16 9.21 1.53 3.96 0.20 16.77 2.72 19.68
Mar-16 9.40 1.54 3.94 0.40 17.22 2.51 19.62
Apr-16 9.21 1.56 3.82 0.48 16.98 2.30 19.26
Yr-on-Yr Chg. 0.8% 5.2% -4.4% 218.5% 1.4% -1.8% 1.2%
Petroleum Stocks1 Crude Oil Finished Products
East Mid-West S-Cent N-West West U.S. Total2 Gasoline Jet Fuel Distil. Resid. Total3
2013 151 269 1,162 39 139 1,760 1,054 40 37 127 38 291
2014 158 289 1,227 42 140 1,856 1,085 31 38 136 34 287
2015 193 335 1,298 46 144 2,015 1,176 28 40 161 42 325
1Q 2015 152 316 1,247 44 150 1,908 1,166 27 37 128 38 288
2Q 2015 171 322 1,290 43 145 1,971 1,163 26 44 139 42 305
3Q 2015 184 318 1,311 43 145 2,001 1,156 29 40 149 41 308
4Q 2015 193 335 1,298 46 144 2,015 1,176 28 40 161 42 325
1Q 2016 190 336 1,331 47 148 2,052 1,228 26 44 161 45 334
Yr-on-Yr Chg. 25.2% 6.3% 6.8% 7.8% -1.1% 7.6% 5.3% -1.6% 17.9% 25.2% 16.8% 16.0%
Apr-15 157 323 1,267 45 144 1,935 1,174 26 38 129 39 289
May-15 164 320 1,285 44 145 1,958 1,172 27 42 134 41 301
Jun-15 171 322 1,290 43 145 1,971 1,163 26 44 139 42 305
Jul-15 173 323 1,289 43 141 1,969 1,151 24 44 142 40 302
Aug-15 179 329 1,299 42 142 1,991 1,153 26 43 152 39 310
Sep-15 184 318 1,311 43 145 2,001 1,156 29 40 149 41 308
Oct-15 185 314 1,319 43 148 2,009 1,182 28 38 143 43 299
Nov-15 188 331 1,306 44 151 2,022 1,183 28 38 157 44 316
Dec-15 193 335 1,298 46 144 2,015 1,176 28 40 161 42 325
Jan-16 200 338 1,302 46 154 2,041 1,195 27 42 161 44 330
Feb-16 202 338 1,307 46 152 2,045 1,215 27 42 163 46 335
Mar-16 190 336 1,331 47 148 2,052 1,228 26 44 161 45 334
Apr-16 197 334 1,340 47 145 2,063 1,233 25 43 155 43 325
Yr-on-Yr Chg. 25.6% 3.3% 5.8% 5.1% 0.9% 6.6% 5.0% -3.3% 13.1% 19.9% 10.8% 12.4%
Relevant • Independent • Objective
Page 21
C4: US Petroleum Net Imports by Source (million barrels per day)
Notes: 1. Total includes net-imports from Russia and Asia-Pacific region. 2. Total OPEC includes the other eight cartel members. 3. As of latest month. Source EIA
Petroleum Supply Monthly.
C5: US Regional Crude Oil Production (million barrels per day)
Notes: 1. California includes Federal Offshore crude oil production. 2. Gulf of Mexico includes Federal Offshore production adjacent to Texas and Louisiana. 3. Crude
oil Reserve-Production ratio as of latest production month. Crude oil production does not include NGLs. Source: EIA Petroleum Supply Monthly.
OPEC
Canada Mexico Lat. Am. Europe Africa M.E. Total1 Venez. S. Arabia Nigeria Total2 P. Gulf
2013 2.59 0.39 0.74 -0.08 0.37 1.99 6.20 0.71 1.32 0.24 3.47 1.99
2014 2.58 0.29 0.56 -0.12 0.17 1.85 5.04 0.71 1.16 0.04 2.98 1.86
2015 2.81 0.07 0.73 -0.18 0.17 1.49 4.65 0.75 1.05 0.06 2.65 1.50
1Q 2015 2.97 0.16 0.65 -0.12 0.13 1.39 4.93 0.68 0.93 0.04 2.49 1.40
2Q 2015 2.69 0.12 0.71 -0.14 0.15 1.61 4.61 0.74 1.16 0.02 2.67 1.61
3Q 2015 2.80 0.01 0.88 -0.15 0.22 1.32 4.73 0.79 1.01 0.08 2.58 1.33
4Q 2015 2.77 -0.01 0.70 -0.31 0.19 1.64 4.31 0.79 1.11 0.08 2.87 1.64
1Q 2016 3.21 -0.12 0.77 -0.18 0.36 1.62 4.98 0.72 1.12 0.22 3.06 1.62
Yr-on-Yr Chg. 8.0% -173.9% 17.6% 44.0% 174.3% 16.3% 0.9% 5.6% 20.3% 470.7% 23.0% 16.0%
Apr-15 2.84 0.15 0.78 -0.36 0.14 1.52 4.36 0.80 1.20 0.03 2.63 1.53
May-15 2.51 0.03 0.71 0.05 0.19 1.71 4.60 0.77 1.21 0.05 2.82 1.72
Jun-15 2.73 0.20 0.63 -0.12 0.12 1.60 4.88 0.64 1.08 -0.01 2.55 1.60
Jul-15 2.53 -0.05 0.81 -0.10 0.24 1.45 4.54 0.70 1.17 0.11 2.63 1.46
Aug-15 2.98 0.09 1.03 -0.01 0.18 1.25 5.21 0.85 1.01 0.05 2.50 1.25
Sep-15 2.88 0.00 0.79 -0.34 0.25 1.28 4.45 0.81 0.86 0.08 2.61 1.28
Oct-15 2.43 0.03 0.67 -0.27 0.14 1.54 4.17 0.73 0.98 0.04 2.68 1.54
Nov-15 2.73 0.03 0.61 -0.33 0.20 1.65 4.31 0.77 1.23 0.08 2.91 1.65
Dec-15 3.14 -0.09 0.81 -0.32 0.22 1.72 4.45 0.86 1.12 0.13 3.02 1.73
Jan-16 3.19 -0.02 0.62 -0.17 0.23 1.51 4.86 0.65 1.05 0.12 2.82 1.51
Feb-16 3.32 -0.10 0.72 -0.18 0.41 1.55 5.07 0.73 1.01 0.25 2.94 1.55
Mar-16 3.12 -0.23 0.96 -0.18 0.44 1.80 5.00 0.80 1.31 0.29 3.42 1.81
Apr-16 2.71 0.03 0.61 -0.37 0.36 1.77 4.67 0.72 1.15 0.23 3.18 1.71
Yr-on-Yr Chg. -4.4% -78.4% -21.8% 0.8% 161.2% 16.0% 7.1% -9.6% -4.2% 606.1% 21.0% 11.9%
% of Total3 58.0% 0.7% 13.1% -7.8% 7.8% 37.8% 100.0% 15.5% 24.7% 5.0% 68.0% 36.5%
Region of Origin
PAD District U.S. Major Producers
East Mid-West S-Cent N-West West Total Alaska Calif.1 Louis. Texas G. of Mex.2
2013 0.03 1.34 4.33 0.50 1.11 7.31 0.52 0.59 0.20 2.47 1.28
2014 0.04 1.62 5.00 0.58 1.11 8.35 0.50 0.60 0.19 3.04 1.35
2015 0.05 1.81 5.69 0.73 1.08 9.35 0.49 0.59 0.17 3.50 1.50
1Q 2015 0.05 1.86 5.65 0.68 1.14 9.38 0.53 0.62 0.19 3.52 1.46
2Q 2015 0.05 1.77 5.65 0.73 1.09 9.28 0.49 0.59 0.17 3.54 1.43
3Q 2015 0.06 1.82 5.71 0.76 1.05 9.39 0.47 0.58 0.17 3.52 1.48
4Q 2015 0.05 1.78 5.75 0.75 1.02 9.35 0.46 0.56 0.17 3.41 1.65
1Q 2016 0.05 1.82 5.68 0.72 1.10 9.37 0.53 0.57 0.16 3.41 1.62
Yr-on-Yr Chg. -1.2% -2.4% 0.6% 6.6% -4.1% -0.1% 0.0% -7.6% -12.1% -3.3% 11.0%
Apr-15 0.04 1.67 5.21 0.66 1.04 8.62 0.46 0.58 0.16 3.23 1.36
May-15 0.05 1.84 5.78 0.76 1.11 9.53 0.51 0.60 0.18 3.67 1.41
Jun-15 0.07 1.80 5.95 0.76 1.12 9.70 0.51 0.61 0.18 3.71 1.51
Jul-15 0.07 1.82 5.79 0.74 1.08 9.51 0.47 0.61 0.18 3.66 1.41
Aug-15 0.06 1.77 5.43 0.73 1.01 9.00 0.47 0.54 0.17 3.35 1.40
Sep-15 0.05 1.87 5.90 0.80 1.05 9.67 0.46 0.58 0.17 3.56 1.64
Oct-15 0.05 1.77 5.77 0.77 0.97 9.32 0.41 0.56 0.17 3.42 1.65
Nov-15 0.05 1.74 5.81 0.76 1.04 9.39 0.47 0.56 0.17 3.42 1.69
Dec-15 0.04 1.84 5.68 0.73 1.05 9.35 0.50 0.55 0.17 3.39 1.61
Jan-16 0.04 1.77 5.45 0.71 1.05 9.02 0.51 0.55 0.16 3.29 1.50
Feb-16 0.05 1.93 5.99 0.76 1.17 9.90 0.56 0.61 0.17 3.57 1.75
Mar-16 0.05 1.75 5.61 0.70 1.07 9.18 0.52 0.55 0.16 3.36 1.61
Apr-16 0.05 1.70 5.38 0.66 1.04 8.82 0.49 0.55 0.16 3.21 1.52
Yr-on-Yr Chg. 13.6% 1.5% 3.3% 0.6% -0.4% 2.3% 6.5% -5.8% -0.6% -0.5% 11.9%
R/P Ratio3 20.4 13.8 10.9 15.0 16.0 12.4 16.0 16.0 11.3 12.0 8.5
CERI Commodity Report - Crude Oil
Page 22
C6: US Refinery Activity Crude Input (MMbpd) - Utilization (percent)
Notes: 1) As of most recent month. Source: EIA Petroleum Supply Monthly.
C7: US Refinery Margins ($US per barrel)
Note: Based on specific crude being processed in average cracking refinery in a given area. As of February 2010, NY Harbor Arab Med. is now East Coast Composite.
Source: Oil and Gas Journal.
East Mid-West South-Central North-West West U.S.
Input Util. Input Util. Input Util. Input Util. Input Util. Input Util.
2013 1.10 85.1 3.42 90.7 8.22 90.4 0.58 92.7 2.56 84.8 15.88 89.2
2014 1.09 84.2 3.52 92.5 8.38 91.5 0.58 90.5 2.57 87.0 16.14 90.4
2015 1.15 90.7 3.59 93.1 8.70 93.4 0.60 93.2 2.58 88.2 16.61 92.3
1Q 2015 1.14 90.9 3.60 93.8 8.54 93.2 0.60 92.6 2.63 91.5 16.51 92.9
2Q 2015 1.15 91.0 3.70 96.2 8.77 94.4 0.60 93.4 2.46 84.0 16.69 92.8
3Q 2015 1.15 90.4 3.65 94.6 8.77 93.5 0.61 94.2 2.67 91.0 16.85 93.2
4Q 2015 1.15 90.6 3.41 87.7 8.71 92.4 0.60 92.5 2.54 86.5 16.40 90.3
1Q 2016 1.09 85.2 3.58 91.3 8.52 89.5 0.58 85.1 2.50 85.6 16.26 88.8
Yr-on-Yr Chg. -4.8% -0.4% -0.3% -3.6% -4.9% -1.5%
Apr-15 1.13 89.1 3.70 96.4 8.66 93.5 0.60 92.9 2.43 82.7 16.52 92.0
May-15 1.16 91.1 3.68 95.7 8.75 94.3 0.60 92.6 2.44 83.0 16.61 92.5
Jun-15 1.18 92.7 3.71 96.6 8.91 95.5 0.61 94.7 2.53 86.2 16.94 94.0
Jul-15 1.19 93.6 3.82 99.3 8.89 95.0 0.62 95.4 2.66 90.6 17.18 95.1
Aug-15 1.20 94.0 3.64 94.7 8.83 94.3 0.62 94.6 2.68 91.4 16.96 93.9
Sep-15 1.06 83.5 3.48 89.8 8.58 91.3 0.60 92.5 2.67 91.1 16.39 90.4
Oct-15 1.13 89.0 3.01 77.5 8.39 89.4 0.61 92.9 2.55 87.1 15.69 86.6
Nov-15 1.19 93.5 3.55 91.6 8.76 92.8 0.60 92.5 2.57 87.5 16.67 91.8
Dec-15 1.14 89.2 3.66 94.0 8.96 95.0 0.60 92.0 2.49 85.0 16.85 92.6
Jan-16 1.14 88.9 3.72 94.9 8.39 88.2 0.57 84.1 2.55 87.1 16.37 89.4
Feb-16 1.08 84.5 3.63 92.6 8.44 88.7 0.58 84.7 2.44 83.4 16.17 88.3
Mar-16 1.05 82.3 3.39 86.5 8.72 91.6 0.58 86.4 2.52 86.1 16.26 88.8
Apr-16 1.15 89.8 3.34 85.0 8.63 90.7 0.51 75.0 2.60 88.9 16.22 88.5
Yr-on-Yr Chg. 1.5% -9.9% -0.4% -15.1% 7.2% -1.8%
% of Total1 7.1% 20.6% 53.2% 3.1% 16.0% 100.0%
NY Harbor Chicago US Gulf Los Angeles
(East Coast Comp.) (WTI) (WTS) (ANS)
2013 9.20 21.63 12.83 10.25
2014 8.62 16.57 11.76 8.68
2015 12.86 18.05 12.96 19.50
2Q 2015 17.81 18.79 15.02 21.83
3Q 2015 12.47 24.84 13.79 23.75
4Q 2015 8.74 12.99 8.98 16.67
1Q 2016 8.14 7.55 8.65 11.05
2Q 2016 11.99 16.51 11.30 13.20
Yr-on-Yr Chg. -32.7% -12.1% -24.7% -39.5%
Jun-15 21.63 19.84 15.87 16.46
Jul-15 12.74 23.51 16.50 33.40
Aug-15 14.54 30.64 15.80 22.98
Sep-15 10.13 20.37 9.07 14.88
Oct-15 7.03 19.61 9.08 14.45
Nov-15 9.83 10.00 9.25 13.00
Dec-15 9.35 9.35 8.62 22.57
Jan-16 9.37 5.65 8.70 13.01
Feb-16 7.20 5.28 7.38 3.38
Mar-16 7.84 11.71 9.88 16.76
Apr-16 10.04 14.59 11.48 14.59
May-16 11.03 15.89 11.11 10.81
Jun-16 14.90 19.05 11.32 14.21
Yr-on-Yr Chg. -31.1% -4.0% -28.7% -13.7%
Relevant • Independent • Objective
Page 23
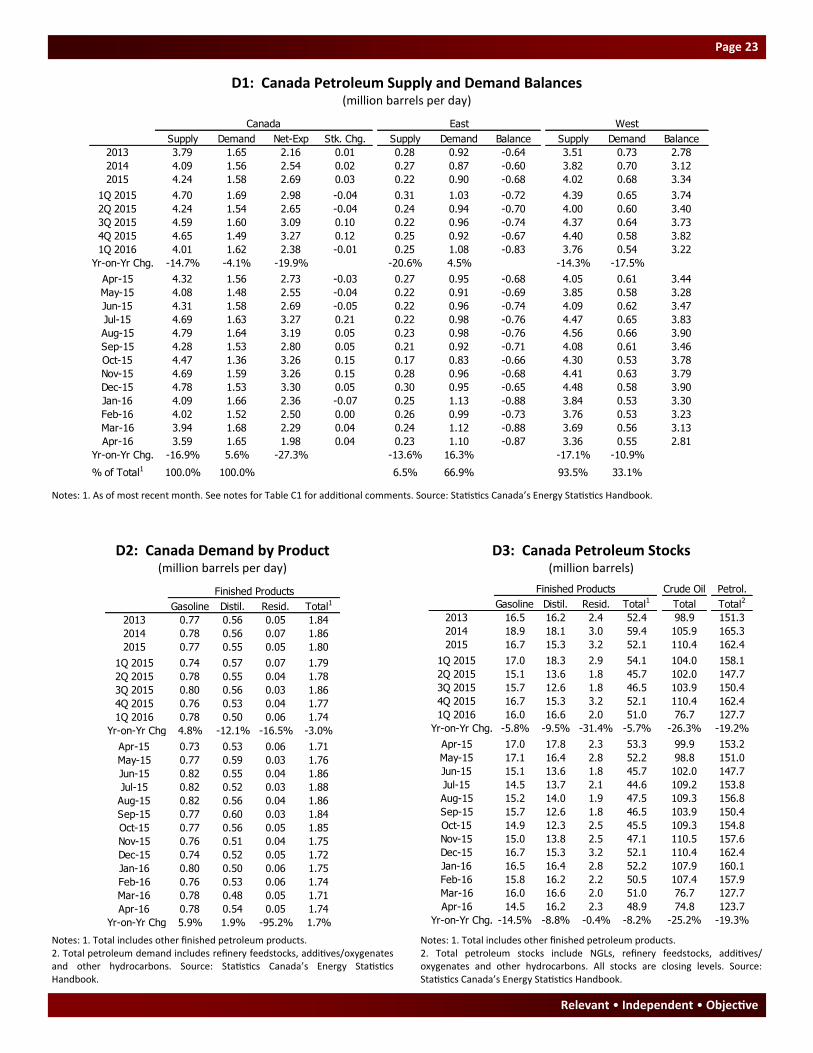
D1: Canada Petroleum Supply and Demand Balances (million barrels per day)
D2: Canada Demand by Product (million barrels per day)
Notes: 1. As of most recent month. See notes for Table C1 for additional comments. Source: Statistics Canada’s Energy Statistics Handbook.
D3: Canada Petroleum Stocks (million barrels)
Notes: 1. Total includes other finished petroleum products. 2. Total petroleum demand includes refinery feedstocks, additives/oxygenates and other hydrocarbons. Source: Statistics Canada’s Energy Statistics Handbook.
Notes: 1. Total includes other finished petroleum products. 2. Total petroleum stocks include NGLs, refinery feedstocks, additives/oxygenates and other hydrocarbons. All stocks are closing levels. Source: Statistics Canada’s Energy Statistics Handbook.
Canada East West
Supply Demand Net-Exp Stk. Chg. Supply Demand Balance Supply Demand Balance
2013 3.79 1.65 2.16 0.01 0.28 0.92 -0.64 3.51 0.73 2.78
2014 4.09 1.56 2.54 0.02 0.27 0.87 -0.60 3.82 0.70 3.12
2015 4.24 1.58 2.69 0.03 0.22 0.90 -0.68 4.02 0.68 3.34
1Q 2015 4.70 1.69 2.98 -0.04 0.31 1.03 -0.72 4.39 0.65 3.74
2Q 2015 4.24 1.54 2.65 -0.04 0.24 0.94 -0.70 4.00 0.60 3.40
3Q 2015 4.59 1.60 3.09 0.10 0.22 0.96 -0.74 4.37 0.64 3.73
4Q 2015 4.65 1.49 3.27 0.12 0.25 0.92 -0.67 4.40 0.58 3.82
1Q 2016 4.01 1.62 2.38 -0.01 0.25 1.08 -0.83 3.76 0.54 3.22
Yr-on-Yr Chg. -14.7% -4.1% -19.9% -20.6% 4.5% -14.3% -17.5%
Apr-15 4.32 1.56 2.73 -0.03 0.27 0.95 -0.68 4.05 0.61 3.44
May-15 4.08 1.48 2.55 -0.04 0.22 0.91 -0.69 3.85 0.58 3.28
Jun-15 4.31 1.58 2.69 -0.05 0.22 0.96 -0.74 4.09 0.62 3.47
Jul-15 4.69 1.63 3.27 0.21 0.22 0.98 -0.76 4.47 0.65 3.83
Aug-15 4.79 1.64 3.19 0.05 0.23 0.98 -0.76 4.56 0.66 3.90
Sep-15 4.28 1.53 2.80 0.05 0.21 0.92 -0.71 4.08 0.61 3.46
Oct-15 4.47 1.36 3.26 0.15 0.17 0.83 -0.66 4.30 0.53 3.78
Nov-15 4.69 1.59 3.26 0.15 0.28 0.96 -0.68 4.41 0.63 3.79
Dec-15 4.78 1.53 3.30 0.05 0.30 0.95 -0.65 4.48 0.58 3.90
Jan-16 4.09 1.66 2.36 -0.07 0.25 1.13 -0.88 3.84 0.53 3.30
Feb-16 4.02 1.52 2.50 0.00 0.26 0.99 -0.73 3.76 0.53 3.23
Mar-16 3.94 1.68 2.29 0.04 0.24 1.12 -0.88 3.69 0.56 3.13
Apr-16 3.59 1.65 1.98 0.04 0.23 1.10 -0.87 3.36 0.55 2.81
Yr-on-Yr Chg. -16.9% 5.6% -27.3% -13.6% 16.3% -17.1% -10.9%
% of Total1 100.0% 100.0% 6.5% 66.9% 93.5% 33.1%
Finished Products Crude Oil Petrol.
Gasoline Distil. Resid. Total1 Total Total2
2013 16.5 16.2 2.4 52.4 98.9 151.3
2014 18.9 18.1 3.0 59.4 105.9 165.3
2015 16.7 15.3 3.2 52.1 110.4 162.4
1Q 2015 17.0 18.3 2.9 54.1 104.0 158.1
2Q 2015 15.1 13.6 1.8 45.7 102.0 147.7
3Q 2015 15.7 12.6 1.8 46.5 103.9 150.4
4Q 2015 16.7 15.3 3.2 52.1 110.4 162.4
1Q 2016 16.0 16.6 2.0 51.0 76.7 127.7
Yr-on-Yr Chg. -5.8% -9.5% -31.4% -5.7% -26.3% -19.2%
Apr-15 17.0 17.8 2.3 53.3 99.9 153.2
May-15 17.1 16.4 2.8 52.2 98.8 151.0
Jun-15 15.1 13.6 1.8 45.7 102.0 147.7
Jul-15 14.5 13.7 2.1 44.6 109.2 153.8
Aug-15 15.2 14.0 1.9 47.5 109.3 156.8
Sep-15 15.7 12.6 1.8 46.5 103.9 150.4
Oct-15 14.9 12.3 2.5 45.5 109.3 154.8
Nov-15 15.0 13.8 2.5 47.1 110.5 157.6
Dec-15 16.7 15.3 3.2 52.1 110.4 162.4
Jan-16 16.5 16.4 2.8 52.2 107.9 160.1
Feb-16 15.8 16.2 2.2 50.5 107.4 157.9
Mar-16 16.0 16.6 2.0 51.0 76.7 127.7
Apr-16 14.5 16.2 2.3 48.9 74.8 123.7
Yr-on-Yr Chg. -14.5% -8.8% -0.4% -8.2% -25.2% -19.3%
Finished Products
Gasoline Distil. Resid. Total1
2013 0.77 0.56 0.05 1.84
2014 0.78 0.56 0.07 1.86
2015 0.77 0.55 0.05 1.80
1Q 2015 0.74 0.57 0.07 1.79
2Q 2015 0.78 0.55 0.04 1.78
3Q 2015 0.80 0.56 0.03 1.86
4Q 2015 0.76 0.53 0.04 1.77
1Q 2016 0.78 0.50 0.06 1.74
Yr-on-Yr Chg. 4.8% -12.1% -16.5% -3.0%
Apr-15 0.73 0.53 0.06 1.71
May-15 0.77 0.59 0.03 1.76
Jun-15 0.82 0.55 0.04 1.86
Jul-15 0.82 0.52 0.03 1.88
Aug-15 0.82 0.56 0.04 1.86
Sep-15 0.77 0.60 0.03 1.84
Oct-15 0.77 0.56 0.05 1.85
Nov-15 0.76 0.51 0.04 1.75
Dec-15 0.74 0.52 0.05 1.72
Jan-16 0.80 0.50 0.06 1.75
Feb-16 0.76 0.53 0.06 1.74
Mar-16 0.78 0.48 0.05 1.71
Apr-16 0.78 0.54 0.05 1.74
Yr-on-Yr Chg. 5.9% 1.9% -95.2% 1.7%
CERI Commodity Report - Crude Oil
Page 24
D4: Canada Crude Oil Production (million barrels per day)
Note: Total includes small amounts of production from Manitoba and Ontario. Source: Statistics Canada’s Energy Statistics Handbook.
D5: Canada Petroleum Imports by Source (thousand barrels per day)
Notes: 1. Includes all non-OPEC production. 2. Includes production by the other seven OPEC members. 3. As of most recent month. Sources: Statistics Canada’s
Energy Statistics Handbook.
Non-OPEC OPEC Imports
Mexico U.S. U.K. Norway Total1 Algeria Nigeria S. Arabia Venez. Total2 P. Gulf Total
2013 24 15 36 55 466 71 47 16 2 177 57 643
2014 17 164 3 12 453 38 27 0 1 90 23 543
2015 0 256 4 8 496 45 26 0 0 71 0 567
1Q 2015 0 303 0 7 485 61 30 0 0 91 0 576
2Q 2015 0 344 15 11 592 12 21 0 0 33 0 625
3Q 2015 0 191 0 3 461 74 42 0 0 116 0 577
4Q 2015 0 187 1 11 446 33 10 0 0 43 0 489
1Q 2016 0 103 12 7 460 34 0 0 0 34 0 493
Yr-on-Yr Chg. 0.0% -66.1% #DIV/0! 8.9% -5.2% -44.6% -100.0% 0.0% 0.0% -63.1% 0.0% -14.4%
Apr-15 0 287 0 0 643 0 0 0 0 0 0 643
May-15 0 366 44 14 573 0 29 0 0 29 0 602
Jun-15 0 378 0 21 561 36 33 0 0 70 0 631
Jul-15 0 321 0 0 481 66 61 0 0 127 0 608
Aug-15 0 254 0 0 469 87 35 0 0 122 0 590
Sep-15 0 0 0 9 434 69 29 0 0 98 0 532
Oct-15 0 332 0 10 388 33 30 0 0 63 0 451
Nov-15 0 229 3 23 507 67 0 0 0 67 0 574
Dec-15 0 0 0 0 443 0 0 0 0 0 0 443
Jan-16 0 0 0 0 452 65 0 0 0 65 0 518
Feb-16 0 207 22 22 377 36 0 0 0 36 0 413
Mar-16 0 100 14 0 550 0 0 0 0 0 0 550
Apr-16 0 257 6 30 504 133 0 0 0 133 0 637
Yr-on-Yr Chg. 0.0% 25629.7% #DIV/0! #DIV/0! -21.6% #DIV/0! 0.0% 0.0% 0.0% #DIV/0! 0.0% -1.0%
% of Total3 0.0% 40.4% 1.0% 4.8% 79.2% 20.8% 0.0% 0.0% 0.0% 20.8% 0.0% 100.0%
Major Producers Canada Petroleum Type
Alta. Sask. B.C. N.W.T. Atlantic Total1 Light SCO Heavy Bitumen NGLs
2013 2.63 0.47 0.04 0.01 0.23 3.46 0.91 0.94 0.45 0.98 0.15
2014 2.91 0.51 0.05 0.01 0.22 3.76 0.94 0.95 0.46 1.21 0.22
2015 3.09 0.53 0.05 0.01 0.17 3.91 0.85 0.98 0.45 1.39 0.22
1Q 2015 3.17 0.55 0.05 0.01 0.22 4.05 0.95 1.09 0.47 1.32 0.21
2Q 2015 2.81 0.51 0.05 0.01 0.15 3.61 0.83 0.81 0.45 1.28 0.21
3Q 2015 3.17 0.52 0.05 0.01 0.14 3.95 0.79 1.02 0.45 1.46 0.22
4Q 2015 3.19 0.52 0.06 0.01 0.17 4.00 0.82 0.98 0.44 1.51 0.25
1Q 2016 3.21 0.47 0.07 0.01 0.21 4.02 0.83 1.04 0.40 1.48 0.26
Yr-on-Yr Chg. 1.4% -14.2% 28.3% -39.3% -5.9% -0.9% -12.7% -4.9% -14.4% 11.8% 21.3%
Apr-15 2.86 0.52 0.06 0.01 0.18 3.71 0.88 0.81 0.45 1.31 0.22
May-15 2.65 0.53 0.05 0.01 0.14 3.46 0.82 0.70 0.45 1.24 0.21
Jun-15 2.92 0.50 0.05 0.01 0.14 3.67 0.79 0.93 0.44 1.30 0.21
Jul-15 3.28 0.52 0.05 0.00 0.14 4.04 0.80 1.09 0.45 1.49 0.21
Aug-15 3.35 0.54 0.05 0.01 0.15 4.16 0.81 1.16 0.46 1.50 0.21
Sep-15 2.89 0.51 0.05 0.01 0.13 3.65 0.78 0.81 0.44 1.38 0.23
Oct-15 3.08 0.53 0.06 0.01 0.09 3.83 0.75 0.87 0.45 1.51 0.24
Nov-15 3.22 0.51 0.06 0.01 0.20 4.05 0.85 1.04 0.44 1.47 0.25
Dec-15 3.28 0.53 0.05 0.01 0.21 4.13 0.87 1.02 0.44 1.54 0.26
Jan-16 3.28 0.47 0.07 0.01 0.21 4.09 0.84 1.05 0.41 1.52 0.26
Feb-16 3.20 0.47 0.07 0.01 0.21 4.02 0.84 1.08 0.40 1.43 0.26
Mar-16 3.15 0.47 0.07 0.00 0.20 3.95 0.81 0.99 0.40 1.49 0.25
Apr-16 2.84 0.46 0.06 0.00 0.19 3.61 0.78 0.61 0.39 1.55 0.26
Yr-on-Yr Chg. -0.7% -12.0% 7.2% -100.0% 7.7% -2.7% -11.4% -24.5% -12.4% 18.3% 17.3%
Relevant • Independent • Objective
Page 25
E1: World Drilling Activity (active oil and gas rigs)
Notes: 1. Does not include active rigs in the Former Soviet Union and onshore rigs in China. 2. As of latest month. Source: Baker Hughes, Inc.
E2: North American Drilling Activity (active oil and gas rigs)
Notes: 1. Excluding Mexico. 2. Includes drilling on inland waterways. 3. As of latest month. Source: Baker Hughes, Inc.
OECD Non-OECD OPEC World
N. A. Europe Asia-Pac Total Asia Non-Asia Total1 P. Gulf Non-Gulf Total Total1
2013 2,221 117 27 2,365 219 368 586 288 195 483 3,435
2014 2,323 122 26 2,472 228 371 598 318 185 503 3,573
2015 1,222 96 17 1,336 202 296 498 348 156 503 2,337
2Q 2015 1,068 96 17 1,181 203 326 529 313 155 468 2,177
3Q 2015 1,098 91 16 1,205 201 193 394 436 153 589 2,187
4Q 2015 967 90 15 1,072 191 307 498 320 143 463 2,033
1Q 2016 749 87 10 847 176 256 432 309 141 451 1,729
2Q 2016 491 81 6 578 178 229 407 293 134 427 1,412
Yr-on-Yr Chg. -54.0% -15.3% -66.7% -51.1% -12.3% -29.7% -23.0% -6.4% -13.4% -8.7% -35.2%
Jun-15 1,041 95 16 1,152 199 318 517 312 155 467 2,136
Jul-15 1,094 90 16 1,200 196 320 516 300 149 449 2,165
Aug-15 1,130 91 15 1,236 205 325 530 304 156 460 2,226
Sep-15 1,070 92 16 1,178 202 -67 135 703 155 858 2,171
Oct-15 1,013 90 16 1,119 197 311 508 311 148 459 2,086
Nov-15 976 87 14 1,077 194 310 504 325 141 466 2,047
Dec-15 913 92 16 1,021 182 299 481 325 139 464 1,966
Jan-16 887 88 14 989 179 268 447 314 139 453 1,889
Feb-16 769 90 9 868 173 256 429 311 140 451 1,748
Mar-16 592 83 8 683 175 244 419 303 145 448 1,550
Apr-16 501 79 6 586 173 229 402 293 143 436 1,424
May-16 471 84 7 562 183 232 415 294 133 427 1,404
Jun-16 500 81 4 585 178 226 404 292 126 418 1,407
Yr-on-Yr Chg. -52.0% -14.7% -75.0% -49.2% -10.6% -28.9% -21.9% -6.4% -18.7% -10.5% -34.1%
% of Total2 35.5% 5.8% 0.3% 41.6% 12.7% 16.1% 28.7% 20.8% 9.0% 29.7% 100.0%
United States Canada North America1
East Mid-West S-Cent N-West West Total Land2 Offshore Total Oil Gas Total
2013 89 420 1,049 153 50 1,761 1,705 56 351 1,728 384 2,112
2014 86 453 1,114 156 53 1,861 1,804 57 376 1,905 332 2,238
2015 64 248 395 216 65 977 941 35 193 944 226 1,170
2Q 2015 69 233 516 69 24 909 878 31 100 785 223 1,008
3Q 2015 58 214 203 310 97 866 833 32 191 849 208 1,056
4Q 2015 54 187 45 378 111 754 724 29 174 741 187 928
1Q 2016 37 132 32 279 98 546 520 27 163 600 109 709
2Q 2016 32 104 27 206 72 420 397 24 49 382 87 469
Yr-on-Yr Chg. -53.4% -55.3% -94.8% 199.0% 201.4% -53.8% -54.8% -23.8% -51.0% -51.3% -61.1% -53.5%
Jun-15 68 220 486 67 22 861 833 28 129 766 224 989
Jul-15 63 213 501 67 22 866 835 31 183 834 216 1,049
Aug-15 56 221 56 443 133 883 849 34 206 880 209 1,089
Sep-15 54 209 52 421 135 848 816 32 183 833 198 1,031
Oct-15 48 194 50 402 117 791 758 33 184 782 193 975
Nov-15 58 194 47 378 107 760 729 31 178 744 194 938
Dec-15 56 174 37 355 108 711 686 24 160 697 174 871
Jan-16 48 155 34 332 107 643 615 28 190 700 133 833
Feb-16 35 123 29 266 98 519 493 26 211 628 102 730
Mar-16 28 119 32 240 88 477 451 27 88 472 93 565
Apr-16 31 109 29 215 75 437 411 26 41 390 88 478
May-16 31 103 27 201 70 407 384 24 42 363 86 449
Jun-16 35 100 25 203 72 417 396 21 63 394 86 480
Yr-on-Yr Chg. -48.5% -54.5% -94.9% 203.0% 227.3% -51.6% -52.5% -24.3% -51.0% -48.6% -61.5% -51.5%
% of Total3 7.3% 20.8% 5.2% 42.3% 15.0% 86.9% 82.5% 4.4% 13.1% 82.1% 17.9% 100.0%
CERI Commodity Report - Crude Oil
Page 26
Geographical Specifications
1. The World: OECD is comprised of countries from three regions: North America (Canada, Mexico, US); Europe (Austria, Belgium, Czech Republ ic,
Denmark, Finland, France, Germany, Greece, Hungary, Iceland, Ireland, Italy, Luxembourg, the Netherlands, Norway, Poland, Portugal, the Slovak
Republic, Spain, Sweden, Switzerland, Turkey, UK); and Asia-Pacific (Australia, Japan, New Zealand, South Korea). OPEC is comprised of Persian Gulf (Iran,
Iraq, Kuwait, Qatar, Saudi Arabia, United Arab Emirates) and non-Persian Gulf countries (Algeria, Indonesia, Libya, Nigeria, Venezuela). Non-OECD is
comprised of countries from three regions: Former Soviet Union (Armenia, Azerbaijan, Belarus, Georgia, Kazakhstan, Kirghizstan, Moldova, Russia,
Tajikistan, Turkmenistan, Ukraine, Uzbekistan); Asia (including non-OECD
Oceania); and non-Asia (Africa, Middle East, Latin America, and non-
OECD Europe). 2. United States: East (PADD I) – New England
(Connecticut, Maine, Massachusetts, New Hampshire, Rhode Island,
Vermont); Central Atlantic (Delaware, Maryland, New Jersey, New York,
Pennsylvania, and the District of Columbia) and Lower Atlantic (Florida,
Georgia, North Carolina, South Carolina, Virginia, and West Virginia). Mid
-West (PADD II) – Illinois, Indiana, Iowa, Kansas, Kentucky, Michigan,
Minnesota, Missouri, Nebraska, North Dakota, Ohio, Oklahoma, South
Dakota, Tennessee, and Wisconsin. South-Central (PADD III) – Alabama,
Arkansas, Louisiana, Mississippi, New Mexico and Texas. North-West
(PADD IV) – Colorado, Idaho, Montana, Idaho, Montana, Wyoming. West
(PADD V) – Alaska, Arizona, California, Hawaii, Nevada, Oregon,
Washington.
3. Canada: East is comprised of Ontario, Manitoba, Quebec and the
Maritime provinces (New Brunswick, Newfoundland and Labrador, Nova
Scotia, and Prince Edward Island). West is comprised of Alberta, British
Columbia, Saskatchewan and the northern territories (NorthWest
Territories, Nunavuut, and Yukon).
Additional Notes
1. Petroleum and oil refer to crude oil and natural gas liquids (NGLs),
whereas crude oil refers to its namesake and field condensates.
Condensates derived from natural gas processing plants are classified as
NGLs. 2. The spot price is for immediate delivery of crude oil or refined
products at a specific location. Spot transactions are generally on a cargo
by cargo basis. In contrast, a futures price is for delivery of a specified
quantity of a commodity at a specified time and place in the future. 3.
Crude oil sold Free-On-Board (FOB) is made available to the buyer at the
loading port at a particular time, with transportation and insurance the
responsibility of the buyer. Crude oil sold Cost-Insurance-Freight (CIF) is
priced at a major destination point, with the seller responsible for the
transportation and insurance to that point. A “Delivered” transaction is
similar to a CIF transaction, except the buyer in the former pays based on the quantity and quality ascertained at the unloading port, whereas in a CIF
transaction, the buyer accepts the quantity and quality as determined at the loading port. 4. Processing gain is the volume of which refinery output is
greater than crude oil inputs. The difference is due to the processing of crude oil products, which in total have a lower specific gravity than crude oil. 5.
Unaccounted for crude oil reconciles the difference between crude input to refineries and the sum of domestic production, net imports/exports, stock
changes and documented losses (in the U.S.). 6. Totals may not equal the sum of their parts in the statistical tables due to rounding.
Crude Stream
Producing
Country or
Region
API
Gravity
(@60° F)
Sulfur
Content
(%)
BBLs/Metric
Tonne
Tapis Blend Malaysia 44 0.1 7.910
Ekofisk Blend Norway 43 0.2 7.773
WTI Texas 40 0.3 7.640
GCS Gulf of Mexico 40 0.3 7.640
Oklahoma Sweet Oklahoma 40 0.3 7.640
Kansas Sweet Kansas 40 0.4 7.640
Wyoming Sweet Wyoming 40 0.2 7.640
ELS Alberta 40 0.5 7.640
Brent Blend United kingdom 38 0.8 7.551
Bonny Light Nigeria 37 0.1 7.506
Oman Blend Oman 36 0.8 7.462
Arabian Light Saudi Arabia 34 1.8 7.373
Minas Indonesia 34 0.1 7.373
Isthmus Mexico 34 1.5 7.373
Michigan Sour Michigan 34 1.7 7.373
WTS Texas 33 1.7 7.328
Urals Russia 32 1.7 7.284
Tia Juana Light Venezuela 32 1.2 7.284
Dubai U.A.E. 31 1.7 7.239
Lost Hills California 30 0.6 7.194
Cano Limon Colombia 28 0.6 7.105
Arabian Heavy Saudi Arabia 27 2.8 7.061
ANS Alaska 27 1.1 7.061
Oriente Ecuador 25 1.4 6.971
Hardisty Heavy Alberta 25 2.1 6.971
Maya Mexico 22 3.3 6.838
Kern River California 13 1.0 6.436
Crude Oil Qualities
For more information, please contact Dinara Millington at [email protected]. Canadian Energy Research Institute 150, 3512 – 33 Street NW Calgary, AB T2L 2A6