32
Company Presentation June 2016

Company Presentation
June 2016

Safe Harbor
2 I
● Forward-looking statements in this presentation are subject to various risks and uncertainties that could affect the Company's future performance. Actual results could therefore differ significantly from those currently expected or anticipated.
● Readers are also invited to log onto the Group's website where they can view and download the press release of the annual results and the 2015 financial statements, which include information on the investigations launched in 2009 on anti-competitive behavior in the submarine and underground high-voltage cable sector in various countries (see Note 29a to the consolidated financial statements, “Antitrust Investigation”).
● The Group’s outlook for 2016-2017 is subject to several major uncertainties: o the economic and political environment in certain emerging countries where Nexans generates – or plans to generate
– significant sales volumes, notably Brazil, China, Lebanon, Libya, Nigeria, Russia and Turkey; o the impact of falling prices of oil and numerous metals which is triggering a sharp decline in capital expenditure
projects for oil exploration and drilling as well as in the gas and mining sectors, and is destabilizing the economies of countries and regions such as Australia and North America that are highly dependent on these commodities;
o certain markets in which Nexans plans to develop sales might not grow as rapidly as expected, which could lead to critical under capacity in some of the Group’s plants;
o risks related to the costs and implementation timeframes of the reorganization plans, as well as a risk that these plans could give rise to temporary inefficiencies or even loss of market share;
o the risk that market conditions will prevent the projected restructuring of the Group's business portfolio from being carried out at the planned pace;
o inherent risks related to carrying out major turnkey projects for submarine cables; o the risk that certain R&D and innovation programs or programs designed to improve the Group's competitiveness
experience delays or do not fully meet their objectives.
Investor relations: Michel Gédéon Julien Catel
+331 73 23 85 31 +331 73 23 85 24

1. Company overview
3 I Footer can be personalized as follow: Insert / Header and footer I Date

4 I
Nexans: a global cable maker
¹ Distribution and Installers ² Transmission, Distribution & Operators ³ Proportion of Nexans’ sales in 2015 at constant metal price
Europe 30%
High Voltage 18%
North America 13%
South America 7%
Asia Pac 14%
MERA 8%
Harnesses 10%
6.2bn€ sales in 2015
Building (D&I¹) 25%³
Energy infrastructures (TD&O²) 42%³
Specialty cables (Industry) 27%³
Construction Resources 20%³ LAN
Power distribution &
Operators Transmission Transport
65%³ Other 15%³
91 plants
~26,000 people
40 countries

5 I
Nexans is a solution provider for a more efficient & sustainable future
1 Nexans estimates
Power and data infrastructures
Fossil & renewable resources
Transport
Building
Higher voltage & deeper submarine installations Aluminum solutions Smart grids
Fire resistant cables Energy efficiency programs Data cables: higher bandwidth
Safer & more reliable cables resisting to harsher conditions of exploration/extraction
Aluminum solutions for lighter cables Lead free cables Hybrid cables for signaling Anti-theft solutions
37 bn€ 1
5 bn€ 1
8 bn€ 1
20 bn€ 1

6 I
Vision of Nexans
Given market opportunities, the company confirms its focus on 4 sectors:
Power and data infrastructures
Fossil & renewable resources
Transport
Building
Power transmission Power/data distribution Accessories
Residential Commercial Data
Mining O&G Renewables Power plants
Aerospace Railways, city rail Automotive Shipbuilding
40%
8%
17%
25%
% of sales at constant metal prices in 2015

7 I
Nexans’ select commercial successes in 2015
“HyWind” pilot floating wind farm by Statoil
Two new electricity cable systems in Central Eastern Norway supported by Nexans XLPE cables
Nexans delivered close to 3,000 km of fire resistant, HV power cables and accessories, LV power & instrumentation cables to Anthem of the Seas
NSN Link, the world’s longest subsea power link, incorporating Nexans’ HVDC cable technology

2. Key investment highlights
8 I Footer can be personalized as follow: Insert / Header and footer I Date

Nexans credit highlights
9 I
Favorable long-term dynamics in underlying markets
Leading global power cable & system producer
Diverse sales channels by customer, end-market and geography
Strong brand, product innovation and service excellence
Strong focus on profitable growth, working capital management and cash flow generation
Powerful operational levers from the “Nexans in motion” plan
Incentivized leadership team and supporting shareholders
1
2
3
4
5
6
7

Electricity consumption Energy consumption Energy from renewables Automotive Air passengers
2014 2030
Market drivers are favorable for the long term
10 I
Expectations for 2030
1
Sources: EIA, OECD, United Nation, IHS Automotive
Energy Transport
x2 +60%
x2
+50% +40%
Global population growth
+20% Global Urbanization
+40%

11 I
Cables & Systems market overview
Breakdown by Product Breakdown by Geography
2015 Market Value estimated at 113Bln€ (excluding Winding wires) Product wise, Energy cables = 88Bln€, Telecom cables = 25Bln€ Geography wise, 1/3 from developed economies (Europe, NAM), 1/2 APAC
Market expected to grow 4% per year until 2020
2015-2020 % Annual Change, excluding Winding Wire
2.2% 3.0% 3.2%
4.5% 4.6% 4.0%
Europe North America South America MERA Asia Pacific World
LV 42%
Power 35%
Telecom 23%
APAC 51%
Europe 17%
NAM 16%
SAM 4%
MERA 12%
113B€
1
113B€
Source: CRU 2015 Oct
0
1 000
2 000
3 000
4 000
5 000
6 000
7 000
8 000
9 000
Pry
smia
n G
roup
Nex
ans
Gen
eral
Cab
le
Sou
thw
ire
LS C
able
Com
mS
cope
Sum
itom
o E
lect
ric
Furu
kaw
a
Jian
gsu
Sha
ngsh
ang
Leon
i
Fujik
ura
Far E
ast S
mar
ter E
nerg
y
Riy
adh
Cab
les
Yaza
ki C
orpo
ratio
n
NK
T C
able
s
Bao
shen
g G
roup
Bel
den
Sha
ngha
i She
nghu
a
El S
ewed
y E
lect
ric
Jian
gnan
Gro
up
Enc
ore
Wire
Hita
chi C
able
Tele
-Fon
ika
Hen
gton
g O
ptic
-Ele
ctric
Taih
an E
lect
ric
Via
kabl
e
Con
dum
ex
SW
CC
Sho
wa
Low Voltage Power Telecom
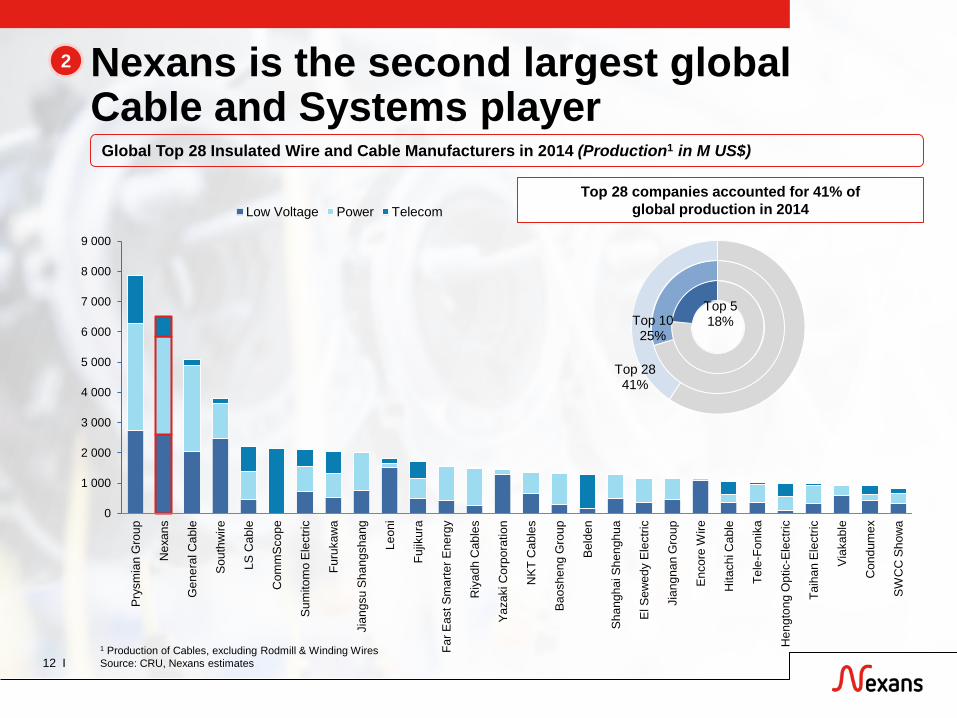
Nexans is the second largest global Cable and Systems player
12 I
2
Global Top 28 Insulated Wire and Cable Manufacturers in 2014 (Production1 in M US$)
Top 5 18% Top 10
25%
Top 28 41%
Top 28 companies accounted for 41% of global production in 2014
1 Production of Cables, excluding Rodmill & Winding Wires Source: CRU, Nexans estimates

Diverse sales channels by customer, end-market & geography
13 I
3
Business mix
Note: Split based on 2015 constant metal sales ¹ Middle East, Russia, Africa
Geography Customer mix
Transmission, Distribution &
Operators 42%
Industry 27%
Distribution & Installers
25%
Others 6%
TD&O 42%
27% emerging markets
Largest customer < 5% of total sales
Top 10 customers
21%
Others 79%
Europe 30%
High Voltage 18% Asia Pacific
14%
North America
13%
Harnesses 10%
MERA 8%
South America
7% 1

Strong brand, product innovation and service excellence
14 I
4
Global #1 or #2 position in specific segments / geographies: Submarine HV, aeronautics, automation, wind, rolling stock France, Nordics, Canada, Peru, Chile, Morocco, Lebanon, South Korea
Nexans has developed an organization to follow its customers globally R&TI (resources and transport infrastructures), LAN cable and solutions, HV, industry
(wind, aeronautics)
Nexans is recognized as a technical leader notably in: Submarine, HV accessories Industry segments (wind, O&G, aeronautics, automation)
80 M€ R&D in 2015 focused on energy transition, smart grids, security & safety
Services offered notably in Europe (engineering, supply chain, e-services) Best supplier awards by major industrial groups (Airbus, Siemens) Full turnkey offer in HV (including Installation, accessories)
Market share leadership
Technical leadership
Differentiation
Global reach
Nexans has developed key competitive advantages which gives a solid platform to leverage on for profitable growth

Strong focus on profitable growth and cash generation
15 I
5
EBITDA (M€)
¹ Recurring Cash Flow from Operations calculated as EBITDA – income tax paid – net capex 2 Restated EBITDA excluding non recurring pension effect of 30 million euros
286 288
333
2013A 2014A 2015A
91
113
126
2013A 2014A 2015A
Recurring Cash Flow from Operations¹ (M€)
2

On the way to 2017: Nexans in motion
16 I
6
Redesign the strategy:
Key challenges and opportunities: 2/3 of the growth to come from developing countries Europe to remain flat except niches US experiencing slow recovery
Improve competitiveness Strengthen market leadership
Manage portfolio to optimise ROCE
Fixed cost reduction Variable cost reduction
Move towards most profitable of growth businesses
Active drive of portfolio
Selective organic growth & CAPEX allocation
Go beyond excellence in cables to services, aftermarket and accessories
A
C
B

Strategic initiatives progressing according to plan
17 I
6
Plan Description
Target savings
2015-2017
Savings realized in
2015
Market leadership
Grow businesses Mix improvement Others
150 M€ 34 M€
Fixed cost reduction (I)
Industry: closure of 4 plants in Lyon (France), Trezzano (Italy), Breitenbach (Switzerland) and Elm City (USA)
Land High Voltage: closure of Cossonay plant (Switzerland) Support functions: Italy, France, HQ, Germany, Switzerland Other plans including APAC
35 M€1 24 M€1
Fixed cost reduction (II)
Reduction of 480 employees New European restructuring plan to reduce medium-voltage capacity
and streamline group support functions 100 M€ 38 M€
Variable cost reduction
Purchase optimisation (negotiation, supplier management, enforcement of purchasing policies)
Industrial efficiency in plants 90 M€ 10 M€
A
C
B
B
B
1 Cost reduction related to 2013 restructuring plan in addition to savings achieved by end of 2014
Portfolio optimisation
Completed divestment of Confecta (Germany), Indelqui (Argentina) Currently evaluating best-owner or business combination for 350 M€ of current capital employed

On the way to 2017: Nexans in motion
18 I
6
Operating margin evolution (M€)
2017
Fixed Cost reduction
Variable Cost reduction
Market leadership
Remaining to do Achieved 2015
2014
150
135
90
Uncertainty relies on environment in
2016/2017 2015
Price / Cost squeeze

Strong shareholder support and incentivized management team
19 I
7
Leadership team Shareholder structure
Source: Company information as of December 31, 2015
Invexans 29%
BpiFrance 8%
Financiere de l'Echiquier
5% Private investors and
employees 9%
Institutional investors
49%
Arnaud Poupart-Lafarge CEO since July 2013, Nexans since 2013 Previously, managed
for ArcelorMittal group various operations in Europe, Africa and CIS
Nicolas Badré CFO since April 2012, Nexans since 2011 Held various
Financial Directorship positions at Groupe Saint-Gobain and Owens Corning between 1995 and 2011
Pascal Portevin VP, International and Operations, Nexans since 1999 Served as Senior
Corporate Executive VP in charge of the Europe Area between 2011 and 2014
Christopher Guérin Senior Executive VP, Europe, Nexans since 2005 Between 2013 and
2014, served as the Executive Vice President, Europe Industry
Dirk Steinbrink VP HV and Underwater Cable Business, Nexans since 1998 Until June 1st, 2011
Dirk Steinbrink was responsible for the Land HV Business group
Anne-Marie Cambourieu Senior Corporate VP Human Resources since November 2012, Nexans since 2012 Served as Executive
Vice President, Global Human Resources at Accor from 2010 to 2012

3. Financial overview
20 I Footer can be personalized as follow: Insert / Header and footer I Date

Group financial performance
21 I
Figures in M€, unless otherwise specified
Sales at constant metal prices Net debt
Operating margin
4 689 4 587 4 604
Dec 31, 2013
Dec 31, 2014
Dec 31, 2015
337
460
201
Dec 31, 2013
Dec 31, 2014
Dec 31, 2015
141 148
195 3.0% 3.2% 4.2%
Dec 31, 2013
Dec 31, 2014
Dec 31, 2015
Operating profit Operating margin at constant metal prices
1 excluding non recurring pension effect of 30 million euros
1

Strategic initiatives delivered as expected to overcome volume & price pressure effects
22 I
Operating margin evolution in M€
148
195
7
106
(53) (13)
2014 FX & others Strategics initiatives Price cost squeeze Operating reserves 2015

Divisional financial performance
23 I
Strong margin recovery driven by portfolio selectivity and LAN performance
Decrease of demand in some large contributing countries (France, Brazil, Australia, NAM)
Signs of recovery in HY2 in SAM and APAC
Tran
smis
sion
, Dis
trib
utio
n &
O
pera
tors
Utilities & Operators
Industry
Distributors & Installers
Land (25% sales)
Subsea (75% sales)
2.3% 5.5%
Operating Margin: 63 M€
4.1% 4.6% Operating Margin: 57 M€
Slow ramp-up of Chinese and US new plants Plant load optimization and cost reduction programs in Europe
where market conditions remain uncertain Backlog: >1 year of sales
Optimum execution of major projects Dynamic tendering and engineering activity, including in
umbilicals (NordLink: >500 M€ and NSN + 340 M€) Backlog: 2.7 years of sales
Margins improved due to product selectivity Utilities: activity globally stable in Europe, in a context of low
volumes and price pressure. Positive momentum in MERA Operators: contrasted activity in Europe; globally stable
despite improved momentum in France and Belgium Signs of recovery in South America
Automotive harnesses recorded high sales in 2015 Strong momentum in Wind Power cables in North West
Europe and Brazil Depressed Mining and O&G activity, particularly upstream Shipbuilding penalized by order delays.
5.0% 5.6%
TD&O Operating Margin: 108 M€
2013 2014 2015
Land Hybrid Submarine
Transmission backlog: + 75%
2014 2015
2014 2015
2014 2015

Net debt evolution
24 I
Net debt evolution in M€
460
201
191
(170)
(104)
345
52
(55)
2014 OCF Capex Restructuring … Operating … Non operating … FX & other 2015
HV
Inventories & payables
Down-payments Metal price

Strong liquidity covering future debt refinancing needs
25 I
Liquidity and debt redemption¹ as of December 2015, in M€
1 012
1 213 600
213
125
350
250
275
Liquidity sources 2016 Convertible …
Local borrowings & …
2019 Convertible …
Gross debt
Notes: ¹ Bond redemption in nominal values ² 2016 Convertible Bond was redeemed on January 1st 2016 ³ Calculated as net financial debt / EBITDA
Cash & equivalents
Un-drawn facility
committed up to 2020
Leverage³ evolution as of December
0.6x
1.7x 1.1x
1.6x
0.6x
2011 2012 2013 2014 2015

Q1 2016 trading update
26 I
LAN cables and systems (c.25% of the division's business) continued their steady increase across all geographies
Sales of LV power cables remained stable compared with the Q4 2015 (down 0.9%)
Markets buoyant in South America (excluding Brazil) and in the Middle East, Russia and Africa
Tran
smis
sion
, Dis
trib
utio
n &
O
pera
tors
Distributors & Installers
Utilities & Operators
Land
Subsea
290 279
Sales at constant metal prices M€
Sales in Land HV up 3.2% YoY Order book was strengthened during the quarter Increased utilisation at Charleston plant
Submarine HV cables down 14.1% YoY Unfavorable phasing of projects in comparison with a strong
Q1 2015, weighting on the top line as expected. Invoicing levels for umbilical cables remained strong in Q1
2016 (Sales from existing backlog)
Distribution cables up 6.5% YoY with higher volumes in all geographies excluding APAC. Positive momentum confirmed in Europe, where the Group develops a selective approach.
Telecom Operators down 2.2% YoY reflecting a slow start-up of copper cable business at the beginning of the year.
Automotive harnesses continues to perform well (+3% YoY) Wind farm and aeronautical segments continue to trend
upwards from very solid order book O&G segment strongly hit over 2015 remains at very low level
(Amercables down 30% YoY although stable versus Q4 2015) Pursuing policy of reducing fixed costs and optimizing margins
by moving towards a more favorable product mix
482 449
Sales at constant metal prices M€
Q1-15 Q1-16
Industry 326 301
Sales at constant metal prices M€
Q1-15 Q1-16
Q1-15 Q1-16

Appendix
27 I Footer can be personalized as follow: Insert / Header and footer I Date

Rating : BB- Outlook stable
28 I
Long Term
BB-
Short term
B
Outlook
Stable
S&P as of April 2016: “[…] stable outlook reflects our expectation that [...] Nexans S.A. will gradually
improve its underlying profitability, strengthen free operating cash flow (FOCF) generation […] We anticipate that Nexans will improve its adjusted EBITDA margin to about 6% in 2017 as the company expects to reap the benefits of its costly restructuring program and improved order book.” “We view its liquidity as strong, based on our expectation that the company's
sources of liquidity will exceed its uses by more than 1.5x in 2016 and remain above 1.0x over the subsequent 12 months.”

Income statement (1/2)
29 I
Notes: ¹ Operating margin before depreciation ² Including net asset impairments, change in fair value of metal derivatives, net gain on asset disposal, transaction costs on external acquisitions
In M€ 2014 2015
Sales at constant metal prices 4,587 4,604
Margin on variable costs 1,390 30.3% 1,428 31.0%
Indirect costs (1,102) (1,095)
EBITDA¹ 288 6.3% 333 7.2%
Depreciation (140) (138)
Operating margin 148 3.2% 195 4.2%
Core exposure effect (4) (52)
Restructuring costs (51) (100)
Other operational income (expenses)² (129) (110)
Share in net income of associates 1 1
Operating income (35) (66)

Income statement (2/2)
30 I
In M€ 2014 2015
Operating income (35) (66)
Financial charge (103) (105)
Income before tax (138) (171)
Income tax (32) (25)
Net income from operations (170) (196)
Net income Group share (168) (194)

Balance sheet
31 I
In M€ Dec 31, 2014 Dec 31, 2015
Long-term fixed assets 1,737 1,643
of which goodwill 303 250
Deferred tax assets 153 192
Non-current assets 1,890 1,835
Working Capital 803 405
Total to finance 2,693 2,240
Net financial debt 460 201
Reserves 709 690
Deferred tax liabilities 91 84
Derivative liabilities non current - 38
Shareholders' equity and Minority interests 1,433 1,227
Total financing 2,693 2,240
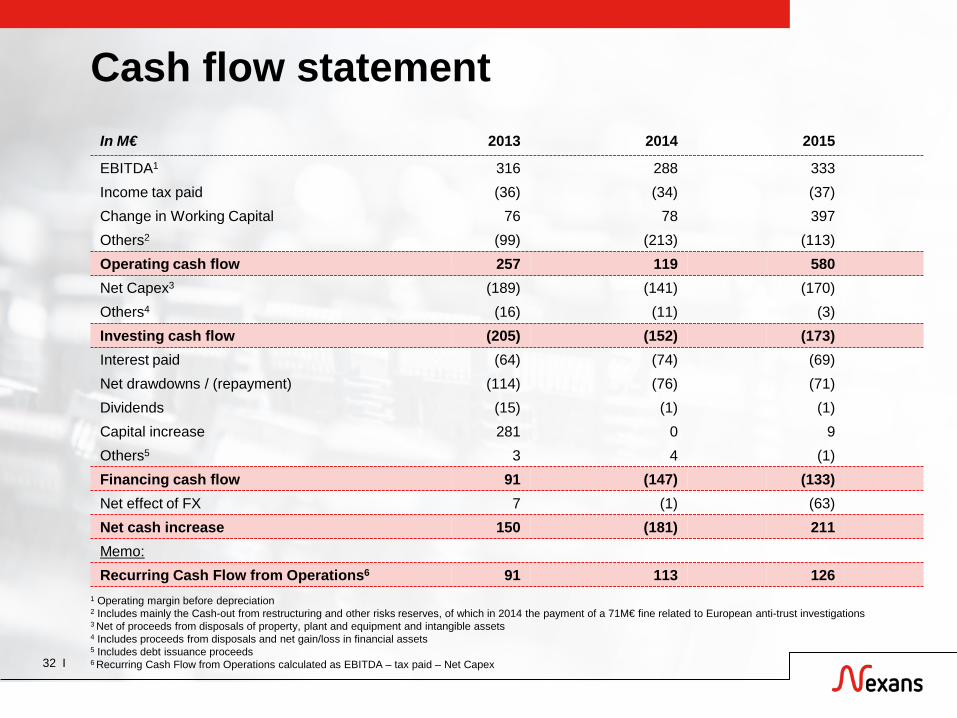
Cash flow statement
32 I
In M€ 2013 2014 2015
EBITDA1 316 288 333 Income tax paid (36) (34) (37) Change in Working Capital 76 78 397 Others2 (99) (213) (113) Operating cash flow 257 119 580 Net Capex3 (189) (141) (170) Others4 (16) (11) (3) Investing cash flow (205) (152) (173) Interest paid (64) (74) (69) Net drawdowns / (repayment) (114) (76) (71) Dividends (15) (1) (1) Capital increase 281 0 9 Others5 3 4 (1) Financing cash flow 91 (147) (133) Net effect of FX 7 (1) (63) Net cash increase 150 (181) 211 Memo: Recurring Cash Flow from Operations6 91 113 126
1 Operating margin before depreciation 2 Includes mainly the Cash-out from restructuring and other risks reserves, of which in 2014 the payment of a 71M€ fine related to European anti-trust investigations 3 Net of proceeds from disposals of property, plant and equipment and intangible assets 4 Includes proceeds from disposals and net gain/loss in financial assets 5 Includes debt issuance proceeds 6 Recurring Cash Flow from Operations calculated as EBITDA – tax paid – Net Capex


