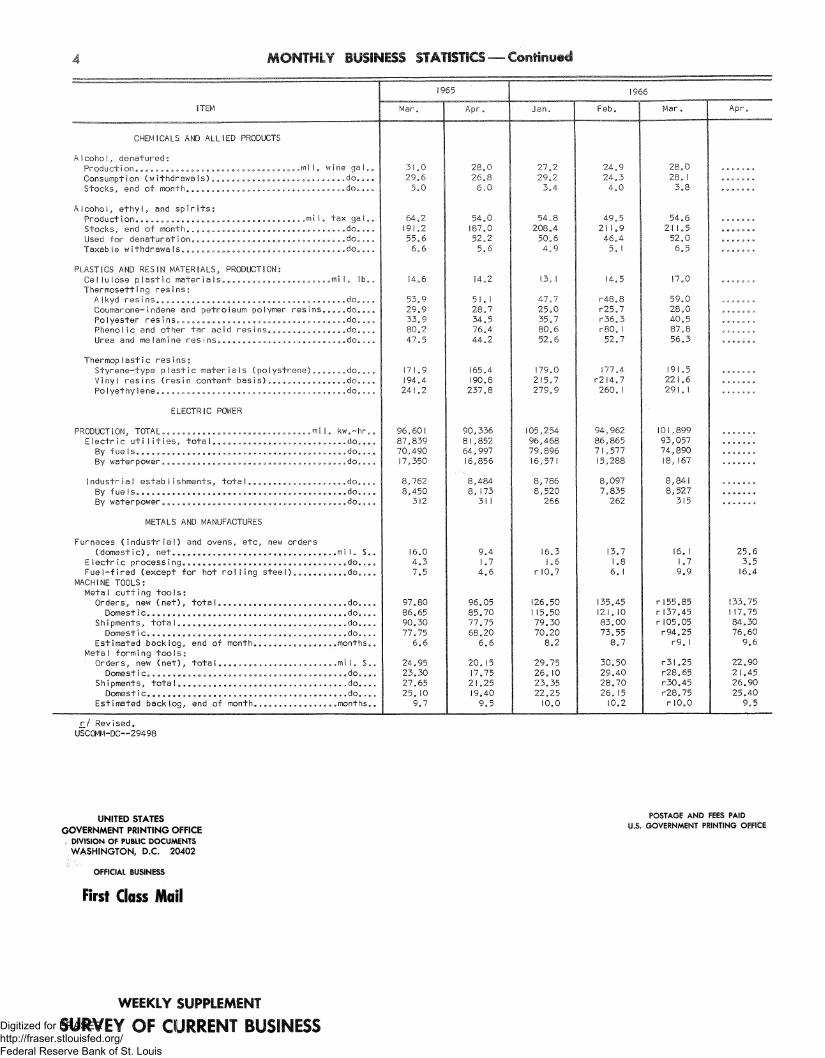
BUSINESS STATISTICS June 3, 1966 A WEEKLY SUPPLEMENT TO THE SURVEY OF CURRENT BUSINESS* U. S. DEPARTMENT OF COMMERCE / OFFICE OF BUSINESS ECONOMICS ^dgj'^M'S-3-^tt^^^oMs:, Thousands 1,400 1,200 1,000 800 600 400 200 0 MOTOR VEHICLE PRODUCTION (cars, trucks, coaches; U.S. plants) jv„ J^^L / ^^\h - \ V f i i i . i i • i i i • . \j \H V 1 1 1 !• 1 1 1 1 1 1 v^ r> \ V 1 -™L™I—1—l_J—1—I—L 1 1 1 V Monthly 1 1 1 1 1 1 1 1 1 1 1 Thousands 350 1963 Data: Automobile Mfrs. Assn. 1964 1965 1966 J FMAMJJ ASOND Billion Dollars 1963 Data: Federal Reserve Board 1964 1965 Billion Dollars 170 160 150 140 130 - TOTAL LOANS AND INVESTMENTS (Weekly Reporting Member Banks of Federal Reserve System) —I—i—i—i—i—1—i—i—i—J—i i i i i i 1 i i i i i - - - - (average of Wednesday data) •1 J J. 1, i 1 1 1 1,1 1 1966 J FMAMJJ ASOND Index, 1957-59 = 100 250 200 h 150 h ndex, 1957-59=100 250 200 150 100 100 j r/v\AMj J M. ^Available only with subscription to the SURVEY OF CURRENT BUSINESS, at $6.00 annually, this Supplement provides selected weekly and monthly data subsequent to those published in the latest monthly SURVEY Digitized for FRASER http://fraser.stlouisfed.org/ Federal Reserve Bank of St. Louis
Transcript
BUSINESS STATISTICS
June 3, 1966
A WEEKLY
SUPPLEMENT
TO THE
SURVEY OF CURRENT BUSINESS*
U. S. DEPARTMENT OF COMMERCE / OFFICE OF BUSINESS ECONOMICS
^dgj'^M'S-3-^tt^^^oMs:,
Thousands
1,400
1,200
1,000
800
600
400
200
0
MOTOR VEHICLE PRODUCTION (cars, trucks, coaches; U.S. plants)
j v „ J^^L /
^^\h - \ V f
i i i . i i • i i i • .
\j \H V 1 1 1 ! • 1 1 1 1 1 1
v ^ r> \
V 1
-™L™I—1—l_J—1—I—L 1 1 1
V
Monthly
1 1 1 1 1 1 1 1 1 1 1
Thousands
350
1963 Data: Automobile Mfrs. Assn.
1964 1965 1966 J F M A M J J A S O N D
Billion Dollars
1963 Data: Federal Reserve Board
1964 1965
Billion Dollars
170
160
150
140
130
- TOTAL LOANS AND INVESTMENTS (Weekly Reporting Member Banks of Federal Reserve System)
— I — i — i — i — i — 1 — i — i — i — J — i i i i i i 1 i i i i i
-
-
-
-
(average of Wednesday data)
•1 J J. 1, i 1 1 1 1,1 1 1966 J F M A M J J A S O N D
Index, 1957-59 = 100 250
200 h
150 h
ndex, 1957-59=100 250
200
150
100 100
j r / v \ A M j J M .
^Available only with subscription to the SURVEY OF CURRENT BUSINESS, at $6.00 annually, this Supplement provides selected weekly and monthly data subsequent to those published in the latest monthly SURVEY Digitized for FRASER
http://fraser.stlouisfed.org/ Federal Reserve Bank of St. Louis
2 WEEKLY BUSINESS STATISTICS1
ITEM
COMMODITY PRICES, WHOLESALE: A I I commod ities .. 1957-59= 100..
Farm products .. .do.... Foods, processed do.... A I I other,.... ...... « do....
22 commodities 2/ do.... ALL RETAIL STORES, SALES. .* mil. $..
Nondurable goods stores.....,., , ...do....
INITIAL UNEMPLOYMENT CLAIMS, State programs ..thous.. INSURED UNEMPLOYMENT, all programs......... do.... State programs (50 States, D.C., and Puerto Rico)...do....
FAILURES, INDUST. AND COMMERCIAL (Dun & Bradstreet).number.. FINANCE: ' .
Currency in circu lation 3/ ....mil. $.. Federal Reserve bank credit outstanding, total 3_/. . .do.... Member bank reserve balances ,3/ do....
Excess reserves, estimated 3/ do.... Reporting member banks (of F.R.System) in leading cities:^/
Demand deposits, adjusted mil. $..
Savings deposits.. do.... Loans and investments (adjusted), totaI.,.........do.,,.
U.S. Government ob I igat ions... . . do.,.. Commercial and industrial loans (gross) do.... Real estate loans (gross).. do....
Industrials, 425 stocks ............do.... PRODUCT I ON:
Bituminous coal 3/.B thous. sh. tons.. Electric power, by utilities , mil. kw.-hr.. Motor vehicles (cars, trucks, buses) number.. Petroleum (crude) and condensate V thous. bb I..
Steel....... ..thous, sh. tons.. Index of production 1957-59=100..
FREIGHT CARL0ADINGS, TOTAL.... thous. cars.. Mi see I laneous. do....
i965
May 22
105.4 5,373 3,487
179 1,293 I, 157 266
39,095 40,333
21,445 343
60,572 42,387 153, I 12 24,240
45,458 20,735
4.57 89.67 95. 15
1,755 19,343
248,355 7,730
2,701 145.0 599 333
May 29
*I02.I *98.4
*I03.3 *I02.3
105. I 5,637 3,599
176 1,226
1,095 215
39,047 40,146 2 1,368
330
62,276 42,448 153,I 17 24,034 45,223 20,804
4.58 88.30 93.66
1,769 19,759
234,316 7,709
2,727 146.4 609 334
May 7
I 10.4 5,919 4,071
164 977 917 213
4 1,600 43,560 22,743
279
65,809 43,289 166,475 2 1,739 53,084 23,046
5.16 89.39 95.75
1,717 20,443
234,062 8,384
2,765 148.4 602 328
May 14
I 10.3 5,659 3,804
151 940 882 288
4 1,834 43,831 22,603
358
65,107 43,252 166, 105 2 1,730 53,142 23,129
5.17 87.23 93.34
1,778 20,726
229,741 8,365
2,776 149.0 61 I
330
May 21
105.3 104.5 I 10.7 104.3 I 10.5 5,712 3,843
147
241
4 1,924 43,771 22,523
31 I
63,028 43,215 165,517 20,881 53,566 23,189
5. 19 85. 12 91.04
1,783 2 1,004 235,523 8,384
2,765 148.4 609 324
May 28
105. 103, I 10. 104. I 10.
4 1,859 43,827
22,235 302
521
87.07
93.22
2,744 147.3
_[/ Data do not always cover calendar weeks. 2/ Tuesday price. 3_/ Daily average. 4_/ Wednesday data. * Monthly index for May 1965.
MONTHLY BUSINESS STATISTICS
ITEM
1965
Apr.
1966
Jan. Feb. Mar. Apr.
GENERAL BUSINESS INDICATORS
MANUFACTURERS' SHIPMENTS :
NOT SEASONALLY ADJUSTED, TOTAL mi I. Durable goods industries, total J/. ..do.
Stone, clay, and glass products do. Pr imary meta Is. do. Fabricated metal products do.
Machinery, except electrical do. E lectr ica I machinery do. Transportation equipment do. Instruments and related products .do.
Nondurable goods industries, total J_/ do. Food and kindred products do. Tobacco products do. Textile mill products „ do.
Paper and allied products do. Chemicals and allied products do. Petroleum and coal products ...do. Rubber and piastic products do.
SEASONALLY.ADJUSTED, TOTAL do.
By industry group:
Durable goods industries, total !/ do.
Stone, clay, and glass products do. Pr imary meta Is „ do. Fabricated metal products do.
Machinery, except e lectr ica !, do, E lecfr ica I machinery .do. Transportation equipment , .do.... Instruments and related products .do....
41,231
2 1,928 924
3,859 2,012
3,207
2,748 6, 176
704
19,303 6,578
394 1,636
1,640 3,073 1,530 983
40,285
21,284 1,019 3,629 2,087
2,996 2,690 5,859
699
41 21
4 2
,282 ,968 967 ,074
,085
3,228 2 5
19 6
1
1 3 1 1
,718 ,866 696
,314 ,594 427 ,574
617 221 553 007
40,044
20
3 2
2 2 5
915 935 796 048
984 757 408 70 i
39 20
3 1
2 2 5
19 6
1
1 2 1
,982 ,751 856 ,379 ,908
,952 ,854 ,981 678
,231 ,861 387 ,495
632 ,998 622 986
42,665
1,092 3,499 2, 130
3,257
3, 145 5,962
764
43,570 22,878
885 3,773 2, I 10
3,312 3, 193 6,485
742
20,692 7,234
410 1,672
1,743 3, 145 1,668 1,061
42,702
1,042 643 202
179 120 049 740
r45,2l8 r23,996
r976
r3,955 r2,203
r3,526 r3,332 r6,655.
r809
r2l,222 r7,259
r430 rI,754
r1,810 r3,404 rI,597 r I, I 13
r44,121
r23,238 r1,078 r3,726 r2,288
r3,285 r3,266 r6,243 r803
45,040 23,909 1,013 4,07 1 2, 193
3,530 3,238 6,520 796
2!,131 7,220 403
1,704
1,766 3,507 1,717 I, 125
43,656
22,746 980
3,801 2, 154
249 306 959 802
rV Revised. ±/ Includes data for "other industries" not shown. 29498
Digitized for FRASER http://fraser.stlouisfed.org/ Federal Reserve Bank of St. Louis
MONTHLY BUSINESS STATISTICS — Continued 3
ITEM
GENERAL BUSINESS INDICATORS—Continued
MANUFACTURERS' SHIPMENTS (SEAS. ADJ.)—Continued By industry group—Continued
Nondurable goods industries, total J_/ mil. $. Food and kindred products do... Tobacco products do... Textile mill products ...do... Paper and allied products.... do...
Chemicals and allied products do... Petroleum and coal products.... do... Rubber -and plastics products..... do...
INVENTORIES, END OF MONTH: Book value (unadjusted), total a<sa,.0do...
Durable goods industries, total... ....do... Nondurable goods industries, total do...
Book value (.seasonally adjusted), total do... By industry group:
Durable goods industries, total J_/. do... Stone, clay, and glass products do... Pr imary meta is do... Fabricated metal products do Machinery, except electrical do... E lectr ica I mach inery do... Transportation equ ipment do... Instruments and related products do...
Nondurable goods industries, total _[/.. do... Food and kindred products do... Tobacco products do... Textile mill products do... Paper and allied products do... Chemicals and allied products ...do... Petroleum, and coal products do... Rubber and plastics products....... do...
NEW ORDERS, NET (NOT SEASONALLY ADJUSTED), TOTAL do... Durable goods industries, total do... Nondurable goods industries, total do...
NEW ORDERS, NET \SEASONALLY ADJUSTED), TOTAL do... By industry-group:
Durable goods industries, total \_l do... Pr imary meta Is do... Fabricated metal products do... Machinery, except electrical do... E lectr ica I mach i nery do... Transportat i on equ i pment do...
Nondurable goods industries, total do... Industries with unfilled orders .do... Industries without unfilled orders do...
UNFILLED ORDERS, END OF MONTH (UNADJ.), TOTAL do... Durable goods industries, total do... Nondurable goods industries with unfilled orders....do...
UNFILLED ORDERS, END OF MONTH (SEAS. ADJ.), TOTAL do... By industry groups:
Durab le-goods industries, total _l_/ do... Pr imary meta Is do... Fabricated metal products do... Machinery, except electrical do... E lectr'ical machinery do... Transportation equ ipment do...
Nondurable goods industries with unfilled orders..do...
FI NANCE
Bank debits to demand deposit accounts, except interbank and U.S. Govt, accounts, annual rates, seas, adj.:
Total (225 SMSA's) bil. $. New York SMSA do...
Total 224 SMSA's (except N.Y.) do... 6 other leading SMSA's do... 2 18 other SMSA ' s do...
FEDERAL GOVERNMENT FINANCE: Budget rece i pts, tota 1 mi I. $.
Receipts, net 2/ do... Customs do... individual i ncome taxes do... CorporatiQn income taxes do... Emp loyment taxes. do... Other internal revenue and receipts do...
Budget expenditures, total 2_/s s. „ , , . s. s do... Interest on public debt do... Veterans' services and benefits do... Nat iona I defense .do... A i I other expend i tures do.. .
_]_/ Includes data for "other industries" not shown. 2/ Excludes certain interfund transactions.'
Digitized for FRASER http://fraser.stlouisfed.org/ Federal Reserve Bank of St. Louis
4 MONTHLY BUSINESS STATISTICS — Continued
« = = » — — ^ ^
ITEM
CHEMICALS AND ALLIED PRODUCTS
Alcohol, denatured: Production,,....................>.»..».>.«>..».o=mil. Consumption (withdrawa Is)...................... Stocks, end of month,t.sl,9
Alcohol, ethyl, and spirits: Products on.................... .. •.•........omi1 Stocks, end of -month.......................'.... Used for denaturat iona........ „,..........,.. .. Taxable withdrawa Is................... „........
PLASTICS AND RESIN MATERIALS, PRODUCTION: Ce ! 1 u 1 ose p 1 ast i c mater ia!sei>1)o0.0«.«0..».»S8S. Thermosetting resins:
A Ikyd res inseo..........* „ oas... „ „ „ 0»....... • Coumarone-indene and petroleum polymer resins Polyester resins* Phenolic and other tar acid resins*...s.e..e, Urea and melamine resins.....................