66
Financing the Future Advancing Excellence Through Cost Reductions and Productivity Report to the Board of Regents President Robert H. Bruininks June 2011

Financing the Future Advancing Excellence Through
Cost Reductions and Productivity
Report to the Board of Regents President Robert H. Bruininks
June 2011


Financing the Future: Advancing Excellence Through Cost Reductions and Productivity
Page 1
Table of Contents
Executive Summary 3
The Top Four Cost Drivers 10
Cost Driver: Human Resources 11
Cost Driver: Facilities and Energy 20
Cost Driver: Information Technology 25
Cost Driver: Financial Aid 27
Academic Productivity and the Blue Ribbon Process 31
Twin Cities Campus 33
Multiple Campuses and Colleges 35
Coordinate Campuses and Statewide System 36
Other Cost Centers and Strategies 40
Long-‐Term Planning, Growth, and Leveraging of Resources 45
Key Conclusions 57
Appendix: Performance Framework Key Measures 61
List of Figures
Figure 1: Recommendations of the Future Financial Resources Task Force 3
Figure 2: Budget Planning and Budget Balancing Principles 5
Figure 3: Where Does the Money Go? 10
Figure 4: Fringe Benefit Expenditures, FY2002-‐10 16
Figure 5: HEAPR Funding Results, 1994-‐2001 vs. 2002-‐2009 22
Figure 6: Twin Cities Campus Gross Square Feet and Fuel Consumption, 2000–10 24
Figure 7: Net Price vs. Gift Aid and Cost of Attendance 27
Figure 8: Strategic Improvement Framework 45
Figure 9: Earned-‐Income Full-‐Cost Budget Model 47
Figure 10: Performance Framework University Wide Goals 48
Figure 11: Change in Key Measures, FY2001-‐10 57

Financing the Future: Advancing Excellence Through Cost Reductions and Productivity
Page 2

Financing the Future: Advancing Excellence Through Cost Reductions and Productivity
Page 3
Executive Summary
The University’s financial architecture has undergone a dramatic and permanent paradigm shift. State support, historically our largest revenue stream, has been reset: it now constitutes only about one-‐fifth of the University’s operating budget and while integral to the University’s finances, it may not increase over the years ahead. Tuition is now the University’s largest revenue stream and it will remain so for the foreseeable future. Operating costs, the cost of academic excellence, and the appetite for investments in new faculty and staff, student financial aid, research support and infrastructure, technology and facilities, are now rising faster than revenue.
– Advancing the Excellence of the University of Minnesota: Report of the Future Financial Resources Task Force (September 2009)
Following the release of the Future Financial Resources Task Force report in fall of 2009
and its presentation to the University of Minnesota’s Board of Regents, President Robert
Bruininks adopted all five task force recommendations (Figure 1) and appointed a cross-‐
functional, University-‐wide team to begin implementing them.
Figure 1: Recommendations of the Future Financial Resources Task Force

Financing the Future: Advancing Excellence Through Cost Reductions and Productivity
Page 4
The five recommendations and the work undertaken to implement them flowed not
only from the work and analysis of the Future Financial Resources Task Force, but also
from a number of earlier strategic positioning task force reports examining University
culture and the University as an enterprise. The Advancing Excellence Steering
Committee, which included senior leaders, faculty, staff, and students, met together and
within their respective areas from 2009 to 2011 to ensure continued progress on each
of the recommendations, but with particular emphasis on:
• Recommendation 3: Substantially increase administrative and academic
effectiveness, reduce costs, and boost efficiency • Recommendation 4: Narrow the scope of the University’s mission to advance a
distinctive constellation of excellence1 This report summarizes the work of the Advancing Excellence Work Group, which
flowed out of these earlier strategic planning efforts, with a similar focus on cost
reduction and productivity enhancement strategies. Specifically, it examines the
University’s integrated approach to managing its major cost drivers, additional
strategies to address other costs centers, and ongoing efforts to improve academic
quality, productivity, and revenue generation systemwide.
It also summarizes the recommendations of the Blue Ribbon process, led by senior vice
presidents Tom Sullivan and Robert Jones, in which each academic unit, college, and
campus undertook a methodical reexamination of its priorities and current and
projected resources, answering five broad questions:
• What should be strengthened or expanded? • What should be maintained at current levels? • What should be reduced or consolidated? • What should be eliminated? • How can we better leverage existing resources?
1 President Bruininks emphasized through this process that, as the state’s only research and land-‐grant university, the University of Minnesota has a unique role in Minnesota’s economy and system of higher education. As a result, “narrowing the scope of the University’s mission” must not be understood as eliminating any aspect of its three-‐part mission—teaching and learning, research and innovation, public engagement and outreach—in its entirety.

Financing the Future: Advancing Excellence Through Cost Reductions and Productivity
Page 5
This process was integrated with each unit’s compact and budgeting process and
incorporated specific future budget assumptions in order to ensure alignment of unit-‐
level and central goals, strategies, and resources. While cost savings within academic
units can take time to realize as programs are phased out and resources are reallocated
to underfunded priorities, the impact of Blue Ribbon recommendations on productivity
and emerging academic priorities should help the University sustain its positive
momentum despite expected state budget reductions in fiscal years 2012 and 2013.
It is important to note that all of the work done in these areas has been in support of
the University’s stated long-‐term financial planning goal—to advance the excellence,
quality, productivity, and impact of the University of Minnesota while ensuring the
University’s long-‐term financial vitality and integrity—guided by the University’s long-‐
term budget planning principles and implemented according to budget balancing
principles and framework (Figure 2). As a result, despite deep state budget reductions
in 2003–04 and again in 2010–11, the University has consistently balanced its budget
and improved key measures across every aspect of its mission and operations.
Figure 2: Budget Planning and Budget Balancing Principles

Financing the Future: Advancing Excellence Through Cost Reductions and Productivity
Page 6
The University’s 10-‐year strategic plan (adopted in 2005), as well as its three-‐fold
mission, also provide important context for aggressively reducing costs, improving
productivity, and growing revenues. Clearly, these efforts will require the continuous
attention and fiscal discipline of the entire University community—but the progress the
University has made in recent years is significant.
Recommendations and Strategies of the Future Financial Resources Task Force
Recommendation 1: Grow a larger and more diversified portfolio of resources
• Grow competitive sponsored research grants and contracts in targeted areas of
academic strength and opportunity
• Policy reforms and strategic investments to support interdisciplinary scholarship
and research
• Reform of the University’s intellectual property policies and technology
commercialization enterprise to enhance University and private-‐sector
partnerships
• Reinvestment of technology commercialization revenues to enhance research
infrastructure and support
• Grow private support in areas of academic opportunity and need via new
targeted fundraising strategies to sustain historically high levels of giving
• Grow tuition revenues through strategic enrollment growth in fields of academic
strength and comparative advantage
• Identification of emerging academic opportunities and programs through the
collegiate and campus Blue Ribbon processes
• Advance risk principles which inform decision-‐making in the interest of
enhancing innovation, creativity, productivity, morale, and overall performance
in support of the academic mission.

Financing the Future: Advancing Excellence Through Cost Reductions and Productivity
Page 7
• Comprehensive, long-‐term land-‐use plan for UMore Park property and
establishment of the UMore Park LLC and Legacy Fund
• Comprehensive review and strategic enhancement of e-‐learning opportunities
Recommendation 2: Grow tuition revenue while ensuring financial access for qualified
students from families with modest means
• Tuition and enrollment management strategies, including higher tuition-‐higher
aid model and reformed systemwide resident/nonresident/international tuition
policies and rates
• Strategic enrollment growth, particularly in areas of high demand, e.g., science
and engineering, business, and health
• Student financial support and incentives for timely graduation, including Promise
for Tomorrow scholarship drive, launch of University of Minnesota Promise (U
Promise) Scholarship, 13-‐credit banding policy, etc.
• Employment of as many as 8,000 students at any one time
• Moderation of the total cost of attendance by managing cost increases for room
and board and other expenses
Recommendation 3: Substantially increase administrative and academic effectiveness,
reduce costs, and boost efficiency
• Compensation planning and management of fringe benefits
• Voluntary workforce reduction strategies, including retirement incentive options
(RIOs) and strategic hiring practices
• Ongoing administrative reconfigurations, consolidations, and reductions
• Six-‐year capital, information technology, and research infrastructure plans
• Space management initiative and decommissioning of buildings
• Ongoing Higher Education Asset Preservation and Replacement (HEAPR) strategy
to reduce capital costs and improve functionality and efficiency of existing
facilities

Financing the Future: Advancing Excellence Through Cost Reductions and Productivity
Page 8
• It All Adds Up! energy conservation campaign and re-‐commissioning to save an
estimated $2M per year ($4.5M to date)
• U Services continuous improvement efforts, including the facilities management
transformation, construction management reforms, and the public safety
strategic plan
• Advancing Excellence in Information Technology initiative to improve service and
security and reduce IT costs through strategies including enterprise technology
solutions and server virtualization and centralization
• Reforms to the U Promise scholarship to ensure guaranteed aid for four years to
eligible students while making the cost of the program more predictable and
sustainable for students, academic units, and the University
• Strategic purchasing and procurement initiative: $6.4M in annual savings
realized to date across a broad range of categories: IT, office and lab, financial
services, travel, benefits, and facilities
• Restructuring of and cost reductions in University of Minnesota Extension, the
Academic Health Center, the Graduate School, colleges, and campuses
• Targeted differential budget reductions and investments for all units systemwide
• Initiatives to improve system integration and reduce costs, such as U Bookstores,
systemwide food and beverage contracts, sustainability initiatives, and the
establishment of the new University of Minnesota System Council
• Unit-‐level efficiencies, including the University’s award-‐winning fleet of vehicles,
the Office of Equity and Diversity’s reallocation of capacity effort,
discontinuation of print publications, etc.
Recommendation 4: Narrow the scope of the University’s mission to advance a
distinctive constellation of excellence
• Identification of academic programs and initiatives and programs to be scaled
back or eliminated through the collegiate and campus Blue Ribbon processes

Financing the Future: Advancing Excellence Through Cost Reductions and Productivity
Page 9
• Targeted, differential budget reductions and investments for all academic units
systemwide
• Restructuring of and cost reductions in University of Minnesota Extension, the
Academic Health Center, the Graduate School, colleges, and campuses
• Ongoing administrative reconfigurations, consolidations, and reductions
Recommendation 5: Develop and execute long-‐term financial plans, along with budget
and planning processes that advance the vision and discipline the setting of priorities
• 10-‐year strategic plan, including consistent budget planning and budget
balancing principles and criteria for decision-‐making
• Disciplined annual budget framework and compact process
• Budget modeling and contingency planning
• Six-‐year capital, information technology, and research infrastructure plans
• Metrics framework and accountability reports
• Additional long-‐term financial planning tools
Since the University’s efforts to address and implement the five Future Financial
Resources Task Force recommendations overlap in many cases, this report will detail
these efforts in the following four sections:
• The Top Four Cost Drivers • Academic Productivity and the Blue Ribbon Process • Other Cost Centers and Strategies • Long-‐Term Planning, Growth, and Leveraging of Resources
Finally, this report is intended to supplement previous Transforming the U reports,
including Transforming the U for the 21st Century (September 2007), Transforming the
U: Progress and Impact (Winter 2011), and Achieving Excellence: Academic Strategic
Positioning 2005-‐2011 (March 2011), all of which are available online at umn.edu.
Financing the Future: Advancing Excellence Through Cost Reductions and Productivity
Page 10
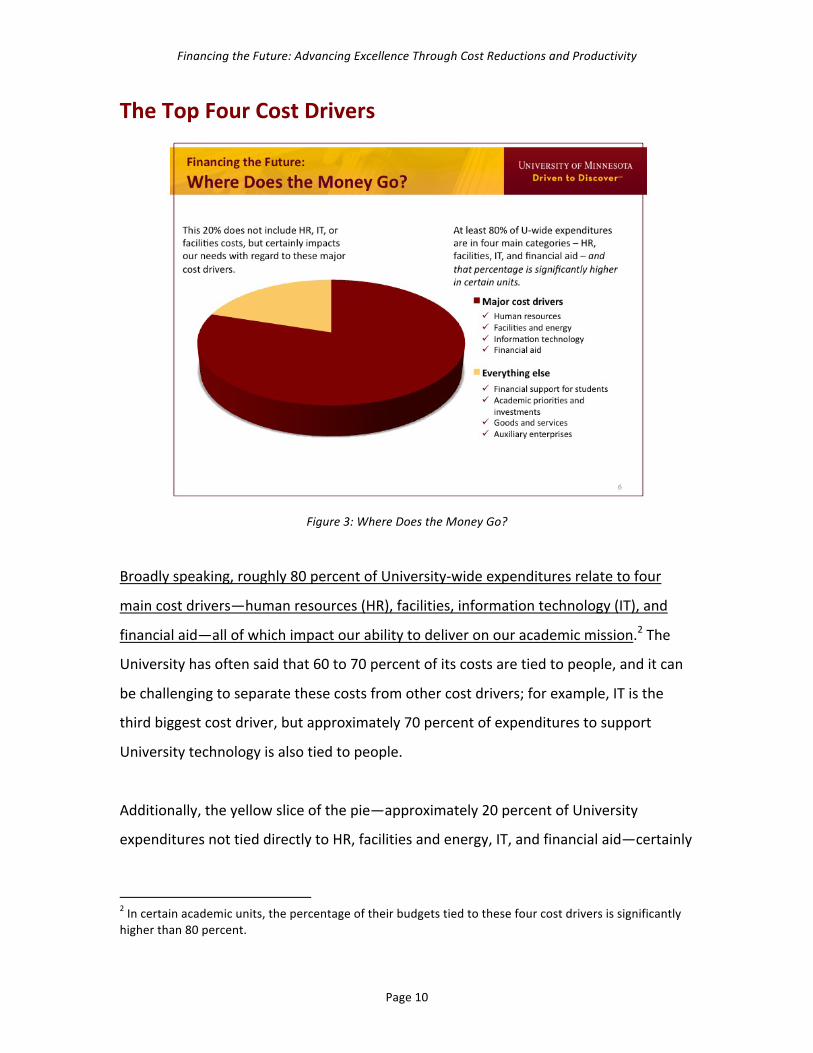
The Top Four Cost Drivers
Figure 3: Where Does the Money Go?
Broadly speaking, roughly 80 percent of University-‐wide expenditures relate to four
main cost drivers—human resources (HR), facilities, information technology (IT), and
financial aid—all of which impact our ability to deliver on our academic mission.2 The
University has often said that 60 to 70 percent of its costs are tied to people, and it can
be challenging to separate these costs from other cost drivers; for example, IT is the
third biggest cost driver, but approximately 70 percent of expenditures to support
University technology is also tied to people.
Additionally, the yellow slice of the pie—approximately 20 percent of University
expenditures not tied directly to HR, facilities and energy, IT, and financial aid—certainly
2 In certain academic units, the percentage of their budgets tied to these four cost drivers is significantly higher than 80 percent.
Financing the Future: Advancing Excellence Through Cost Reductions and Productivity
Page 11
impacts these top four cost drivers; for example, differential investment in academic
priorities influences faculty hiring, facilities and technology needs, and more.
Student financial aid is a relatively new addition to our top cost drivers, primarily
because it has grown rapidly in response to declining state resources and the
University’s strong commitment to growing scholarship and fellowship support in order
to moderate tuition increases, especially for Minnesota students with financial need.
The goal of University leadership has been to proactively manage the entire pie, but
when faced with sudden and severe reductions in state support in 2003–04 and 2010–
11, and now in 2012–13, it makes sense to focus on the 80 percent represented by
these four drivers, which are not only readily identifiable but also require long-‐term
strategic planning to be managed effectively over time. This summary provides a
representative overview of the long-‐term strategies the University has employed to
reduce costs and enhance productivity throughout the University of Minnesota system.
Cost Driver: Human Resources
A university of this size and scope does not function without smart, creative, and hardworking people who believe in its mission and are rewarded for the great work they do every day. Approximately 60 to 70 percent of every dollar spent at the University supports the talented faculty and staff who work here. As a result, our success in recruiting and retaining the best and brightest; supporting their work and productivity; and managing costs related to compensation, health care, and other benefits has big implications for the University, our employees, and their families.
– Transforming the U: Progress and Impact (Winter 2011)
Voluntary Workforce Reduction Initiatives
Consistent with its HR guiding principles, the University of Minnesota has implemented
a number of programs and policies to help faculty and staff transition out of the
workplace in a respectful but predictable manner. The value of voluntary versus

Financing the Future: Advancing Excellence Through Cost Reductions and Productivity
Page 12
involuntary termination of employment is well known, including on the overall sense of
well being experienced by the former employee, the emotions experienced by peer
employees who remain working, and the way in which the former employee portrays
the end of employment (and their former employer) to family, friends and neighbors.
Phased retirement for tenured faculty
This program encourages tenured faculty to phase down their employment over a
period of up to five years. During the phase-‐down program, faculty reduce their work
effort as low as 25 percent and never exceeding 75 percent. The actual workload during
the phased agreement is negotiated with the home department and memorialized in a
letter of agreement. During the phased years, before termination, faculty members
receive the University’s retirement contribution to their defined contribution plan as if
they were continuing to work 100 percent. They also continue to receive the
University’s subsidy to their health insurance program as if they were working 100
percent. Upon the end of the phased agreement, when faculty members actually retire,
they receive up to 48 months of continued university subsidy to their health insurance
plan.3 Most agreements are negotiated for less than five years.
For the department and college, securing a time-‐certain retirement date helps the
department plan for budget or workforce reductions, alternative programmatic uses of
the funds, or the replacement of the individual. Individuals report that the phased
period facilitates an easier and more productive transition into retirement. They can
begin to engage in other activities, have more flexibility to spend time with family or on
avocations, and can begin to experience the positive aspects of more personal time
without a total withdrawal from work.
3 Note that this maximum of 48 months would occur for anyone who is 61 years or less when the phase is completed and termination has occurred. Older faculty would receive a minimum of 24 months, even if they have already begun to receive Medicare.

Financing the Future: Advancing Excellence Through Cost Reductions and Productivity
Page 13
The RECESS Program for faculty and staff
Implemented for the first time in 2009, the Reduce Employment Costs through
Employee Salary Savings (RECESS) Program helps units reduce staffing costs through a
voluntary approach that allows employees to request a reduction in their appointment
down to as low as 50 percent and still receive the University’s subsidy on health care
benefits. Since the funding of health care premiums is a major concern for all faculty
and staff, this program provides a mechanism to reduce work effort but not lose this
important benefit. The program, which must be initiated by the employee and signed
off by her supervisor, must be renewed annually:
• If the employee chooses to go back to the original appointment, he or she has
the right to do so.
• If the supervisor determines that the reduced appointment makes the unit
unable to meet its obligations, he or she can request that the appointment
return to its original percentage.
The obvious benefit for the employee is the ability to voluntarily initiate reduced hours
for personal reasons. The savings that accrue to the department can be used to offset
workforce reductions or other expenditures that would be otherwise needed. In its first
year, this program saved $1.4 million for units throughout the University.
The Retirement Incentive Option (RIO) program
All three of the University’s RIO programs were designed to provide an incentive for
retirement-‐eligible faculty and staff to voluntarily leave University employment. The
program provides a continued University subsidy to retirement-‐eligible participants for a
period of time post-‐retirement. All three programs featured a window of opportunity of
several months in which faculty and staff sign up, with a flexible termination date within
a nine-‐month period by the end of which everyone on the program must retire.

Financing the Future: Advancing Excellence Through Cost Reductions and Productivity
Page 14
In the first two offerings of this program, subsidies were continued for three years post-‐
retirement. In the third and most recent offering of the program (Spring 2011),
retirement-‐eligible faculty and staff were offered a two-‐year contribution to a special
health care savings plan, where funds are invested tax-‐free going in and tax-‐free coming
out, as long as they are used for eligible health care expenses under IRS regulations.
Employing units fund the lump sum payment and keep the savings realized by reducing
the workforce. The advantage of this approach is that individuals can move and enter
new plans and use the savings plan to fund a variety of expenses. Those who are
Medicare-‐eligible have a modest fund to put against their supplemental plan should
they choose to do so.
This type of program enables the University to reduce its workforce while moderating
the need for involuntary reductions such as layoffs; it provides participating employees
with funding to assist with healthcare expenses after they leave University employment;
and it enables the unit to restructure work processes and redirect savings to higher
priority needs. Approximately 60 percent of vacated positions are not refilled; the other
40 percent are generally refilled at significantly less expense than the original position.
For the first two RIO offerings, participation rates of eligible faculty and staff were 6
percent and 7 percent, respectively. Preliminary numbers for the third RIO indicate
more than 380 faculty and staff electing to participate, with projected long-‐term savings
(salary, wages, and fringe benefits) of more than $30M.
Compensation and Fringe Benefit Planning
In recent years, President Bruininks has repeatedly stressed to the University
community that the entire workforce must participate in solving the budget challenges
posed by deep cuts in state funding in order to sustain the University’s quality and
productivity. A primary goal in reexamining the University’s compensation and fringe
benefit programs is to continue to provide competitive total compensation while

Financing the Future: Advancing Excellence Through Cost Reductions and Productivity
Page 15
proactively managing human resource costs, preserving employment, and moderating
involuntary job losses. To that end:
• University faculty and staff have unfortunately experienced wage and salary
freezes in both fiscal years 2003 and 2010 (corresponding to previous deep state
budget cuts).
• In fiscal year 2011, employees received a modest base pay increase of 2 percent
or less on average; however, in order to balance the fiscal year 2011 budget, the
University implemented a temporary reduction in pay of 1.15 percent for faculty
and academic staff, 2.3 percent for senior administrators, and an equivalent
three days of unpaid furlough for civil service and bargaining unit employees.4
• In 2008 the University also implemented a hiring pause and strategic review of
open positions to shrink our workforce through normal attrition and refocus our
activities around priority activities and emerging opportunities.
As a result of these and other efforts, compensation costs have remained flat to slightly
reduced over the past three years. The University is planning another salary and wage
freeze for fiscal 2012 (subject to collective bargaining).
4 This plan was approved by the University Senate with an overwhelming majority vote.

Financing the Future: Advancing Excellence Through Cost Reductions and Productivity
Page 16
Figure 4: Fringe Benefit Expenditures, FY2002-‐10
Fringe benefits are a key component of offering competitive compensation for our
faculty and staff. Nationally, healthcare costs have increased by 7.7 percent per year
over the past five years, while the increase for the UPlan has been 7.2 percent. Beating
the national average by 0.5 percent with an employee population that is both older than
average and ranks among the highest users of healthcare services is a significant
accomplishment—but with healthcare costs outpacing all other HR costs (Figure 4),
reexamining fringe benefits to reduce costs is absolutely necessary. To that end, the
University’s budget plans for fiscal 2012 include:
• Increased medical premiums and co-‐pays for employees; • Restructured administration of healthcare benefits to reduce costs; • Higher retirement contributions from new faculty and academic staff; and • Moving to a single administrator.

Financing the Future: Advancing Excellence Through Cost Reductions and Productivity
Page 17
If these changes are adopted, they are projected to save the University tens of millions
of dollars over the next few years.5 It is important, however, that University leaders
proceed with caution. With regard to faculty salaries, the University of Minnesota does
not rank in the top half of comparison schools; however, when total compensation is
considered, the University ranks higher, primarily due to the Faculty Retirement
Program. This is a generous fringe benefit, but it is also an important tool for recruiting
and retaining faculty and academic professionals in a highly competitive and
increasingly global talent market.
Administrative Consolidations and Reductions
In the past decade, the University has also reexamined its leadership structure, shifting
and consolidating positions and functions to address evolving needs and priorities, and
discontinuing positions that are no longer needed, including:
• combining the positions of Medical School dean and senior vice president for
health sciences, eliminating one senior administrative position;
• eliminating the positions of vice president and assistant vice president of
statewide strategic resource development;
• consolidating systemwide planning functions under a single executive director,
eliminating the position of associate vice president for planning as well as other
offices and functions;
• eliminating two associate vice president positions from the Office of System
Academic Administration;
• eliminating the position of vice chancellor for finance at the University of
Minnesota Crookston;
• eliminating the position of vice president for scholarly and cultural affairs; and
• reassigning government relations to the Office of the President and eliminating
5 These measures were detailed in the Board of Regents Budget Preview on May 13, 2011, but have not yet been adopted.

Financing the Future: Advancing Excellence Through Cost Reductions and Productivity
Page 18
the position of vice president for University Relations.
As of the 2010-‐11 academic year, the University of Minnesota system employed 76
senior administrators, representing 0.4 percent of the University’s total employee
headcount.6 That number will drop to 74 at the end of 2010-‐11, as the two vacant vice
president positions mentioned above are discontinued. With these reductions, the
number of senior administrators is the same as it was in 2002-‐03, despite nearly 50
percent growth in the University’s overall budget, thousands more full-‐year equivalent
(FYE) students, hundreds more degrees per year, the addition of a fifth campus in
Rochester (which added two senior administrators, without whom the University’s total
senior administration has actually decreased since 2002), and additional requirements
for accountability and regulatory compliance.
Administrative Productivity
From 2002-‐03 to 2010-‐11, the University’s overall budget has grown approximately 43
percent, from roughly $2.1B to just above $3B. The overall size of the University’s
workforce, based on a comparison of total headcount data, has grown less than 2
percent, or 20 times less than the University’s budget. Certain subsets of our workforce
have necessarily increased during this time—particularly the academic professional and
administrative employee class. In December 1980, the Board of Regents created, as part
of the Academic Personnel System, a category of employment called “academic staff,
professional and administrative” (P&A). The professional personnel portion of the P&A
category is defined to include those subgroups of employees who, due to requisite
preparation and specialized knowledge in an academic discipline or field, most closely
parallel faculty, while the academic administrator part of the P&A category is defined as
6 For reporting purposes and compensation planning, “senior administrators” include the president, senior vice presidents, vice presidents, deans, chancellors, associate/assistant vice presidents, vice chancellors, vice provosts, the University librarian, executive director of the Board of Regents, and the general counsel.

Financing the Future: Advancing Excellence Through Cost Reductions and Productivity
Page 19
those subgroups of employees who engage in policy development and execution and in
the directing, coordinating, or supervising University activities.
Members of this latter group comprise what is generally regarded as University
administration. The total group of University employees holding appointments in the
academic administrative subgroup (arguably the broadest possible definition of
administrator) in the University’s classification system numbered 2,247 as of October
2010, the annual deadline for analyzing employee headcount data systemwide. This
number represents 11.7 percent of the total employee headcount systemwide at that
same point in time. These employees, all of whom have at least a baccalaureate degree,
and many of whom have advanced degrees, bring significant professional level skills and
abilities to positions with responsibility for a variety of important mission support
activities in the University, including enterprise infrastructure functions (compliance,
finance, research, legal, IT, human resources, development, student services), and are
found in central system offices as well as within campuses, collegiate units, centers,
institutes, and laboratories.
Today the University is managing a significantly larger and more diverse enterprise with
the same number of senior administrators and relatively low growth in P&A employees.
Many of these employees perform mission-‐critical, academic work, including directing
and conducting the research and outreach activities of the University. In addition, a
growing percentage of the employees in this classification have their salaries and
benefits paid from funds other than state-‐appropriated dollars; the talented faculty and
staff who work in the University’s Cancer Center, for example, are paid from the grants
and contracts awarded to fund their essential work. It is also important to note that the
P&A category is currently under review, the result of which will yield more functional
definitions that better reflect the duties and responsibilities understood to be
commensurate with academic administrative or other activities.

Financing the Future: Advancing Excellence Through Cost Reductions and Productivity
Page 20
Cost Driver: Facilities and Energy7
The University of Minnesota maintains more than 28M square feet of space across
Minnesota, including some of the most historically (and technologically) significant and
iconic buildings in the state, such as Northrop Memorial Auditorium, the Weisman Art
Museum, and the facilities of the Biomedical Discovery District. Therefore, improving
the functionality, efficiency, and productivity of University buildings and infrastructure is
a critical long-‐term priority.
Construction Management Reform
State-‐of-‐the-‐art new facilities such as those in the Biomedical Discovery District, the
Science Teaching and Student Services building, science classroom buildings and student
support facilities on other campuses, and TCF Bank Stadium garner a great deal of
attention, since not only are they highly visible public buildings, but they also receive
strong public and private support. In order to be better stewards of these public and
private resources, in the past eight years, the University has made a concerted effort to
reform its construction management processes. These efforts have yielded tremendous
cost savings and productivity gains, including:
• $1.5B in construction projects completed on time, within budget and scope, with
zero claims;
• $15M in project cost savings in the past five years versus the previous five years;
• a hundredfold reduction in project-‐related claims as compared to the previous
five-‐year period;
• cost savings realized through auditing of large capital projects that are 10 times
higher than audit expenses;
• contract negotiation savings of $300,000 to $400,000 per project through
auditing of large capital projects; and
• a 60 percent improvement in schedule compliance.
7 Content and figures in this section is revised, updated, and expanded from Transforming the U: Progress and Impact (Winter 2011).

Financing the Future: Advancing Excellence Through Cost Reductions and Productivity
Page 21
Today the University of Minnesota is building modern, flexible-‐use, and sustainable
facilities—in fact, the innovative STSS building just earned LEED Gold Certification (May
2011)—and work on these facilities is being completed more efficiently and cost-‐
effectively than any time in recent history. At the same time, in recognition of the need
to better manage the University’s long-‐term financial commitments to new facilities, in
the past year, roughly $200M in planned capital projects have been canceled or
deferred.
Space Management and Decommissioning of Buildings
The cost of construction, operations, maintenance and renewal of University facilities represents a significant portion of the University’s operating budget. The University, particularly in tough economic times, has a responsibility to ensure that its facilities are used efficiently. The current budget crisis provides an opportunity to make operational and cultural changes necessary to achieve that goal. … The space utilization effort is about changing the perception on campus that space is a free good; reducing the demand for space through incentives; taking advantage of new workplace technologies; and shrinking the inventory by removing high-‐cost, obsolete buildings and off campus-‐leases.
– Board of Regents Facilities Committee docket materials (May 2011)
Even as the University builds needed new facilities, it must also make better use of
existing space and reduce costs of inefficient or outmoded space. In May of 2011, the
Board of Regents heard a report on a space utilization initiative to decommission 1M
gross square feet of supported space to generate $10M of recurring, annual, operational
savings and significant additional maintenance costs over the next several years. This
process will happen in stages, with an initial plan to take 10 buildings off-‐line, including
these facilities slated for demolition (subject to action of the Board of Regents):
• 1701 University Avenue SE, • Klaeber Court, • Norris Gymnasium and Field House, • Wesbrook Hall,
• the Veterinary Anatomy Building, and
• four former residential properties.

Financing the Future: Advancing Excellence Through Cost Reductions and Productivity
Page 22
Eddy Hall, the oldest building on the Twin Cities campus, will not be demolished but will
be decommissioned and “mothballed” for future use, pending funding to rehabilitate
the building. These 10 buildings total 220,000 square feet—removing them from the
University’s inventory will save approximately $974,000 per year in operating costs and
will remove $27.6M from the University’s facility condition assessment 10-‐year needs
total. In addition, in the past year the University demolished three buildings (Eddy Hall
Annex, the Music Education Building, and Tandem Accelerator Lab) to avoid at least
$4M in renewal costs, plus annual operating expenses.
Focused Higher Education Asset Preservation and Replacement (HEAPR) Strategy
Beginning in 2002, University leadership made a conscious, strategic decision to place
more of the emphasis of the University’s state capital funding requests on HEAPR funds,
which can be used for projects that fall into the categories of health and safety, utility
infrastructure, building systems, and energy efficiency, in order to maximize and extend
the life of existing facilities. This new approach anticipated declining state funding,
increased competition, and greater calls for accountability and stewardship of public
resources by demonstrating the University’s desire to maintain and optimize existing
buildings. Since this strategic shift, the University has tripled its average biennial HEAPR
request from the state and quadrupled its average award (Figure 5).
Year Request Result Year Request Result
1994-‐95 $40M $18M 2002-‐03 $80M $38M
1996-‐97 $58M $10M 2004-‐05 $90M $50M
1998-‐99 $10M $5M 2006-‐07 $80M $30M
2000-‐01 $18M $10M 2008-‐09 $135M $60M
TOTAL $126M $43M TOTAL $385M $178M
AVERAGE $31.5M $10.75M AVERAGE $96.25M $44.5M
Figure 5: HEAPR Funding Results, 1994-‐2001 vs. 2002-‐2009

Financing the Future: Advancing Excellence Through Cost Reductions and Productivity
Page 23
This increased focus on improving existing facilities enables the University to reduce or
avoid costs in two key ways:
• first, unlike state-‐supported new construction, HEAPR projects require no
matching funds from the University; and
• second, renovated facilities generally cost less to operate after completion.
Take the St. Paul Chiller Plant, for example. Over four funding cycles, the University used
HEAPR funds to eliminate stand-‐alone air conditioning units and rehabilitate an old
building to a new purpose. The new chiller plant now provides central air to 18
buildings, saving water, energy, and $1M to $2M a year in operating costs.
Energy Savings and Conservation
Over the past several years, the University of Minnesota has also undertaken initiatives
to control energy costs and use less energy overall. For example, natural gas purchasing
strategies and the use of flexible-‐fuel boilers alone have helped the University avoid
$42M in projected energy costs over five years.
Finally, the Facilities Management department has also launched a voluntary energy
conservation program called It All Adds Up, as well as a building recommissioning
program on the Twin Cities campus, which assesses heating, ventilation, and air
conditioning and other systems to ensure all building systems are working at peak
efficiency.
It All Adds Up established a 5 percent energy reduction goal for fiscal year 2010, which
would save the University significant dollars and release 25,000 fewer tons of CO2 into
the atmosphere. That goal was reached three months early, at the end of March 2010.
Additionally, It All Adds Up collected 10,000 energy conservation pledges from students,

Financing the Future: Advancing Excellence Through Cost Reductions and Productivity
Page 24
faculty, and staff in its first year alone. This pledge is designed to increase awareness
about how each person can help save energy by asking them to commit to energy saving
behaviors, like turning off the lights when leaving a room or using the stairs instead of
an elevator.
The building recommissioning effort identified $5M in potential savings through system
optimization. Implementation of the necessary changes began immediately; the
program will continue on a four-‐year cycle, with similar efforts under way at the
coordinate campuses. Total savings realized by these two programs is estimated at
$4.5M, with a reduction in CO2 emissions of more than 40,000 tons.
Taken together, these initiatives are important reasons why the University’s fuel
consumption has decreased in recent years, even as space has increased (Figure 6).
MMBTU=millions of metric British Thermal Units, a common unit across all fuel sources Source: University of Minnesota Energy Management
Figure 6: Twin Cities Campus Gross Square Feet and Fuel Consumption, 2000–10
3.7M
3.8M
3.9M
4.0M
4.1M
4.2M
4.3M
4.4M
4.5M
17M
18M
19M
20M
21M
22M
23M
24M
25M
2000 2001 2002 2003 2004 2005 2006 2007 2008 2009 2010 2011
Gross Square Footage, Twin Cioes Campus
Total Fuel Consumed in MMBTUs, Twin Cioes Campus

Financing the Future: Advancing Excellence Through Cost Reductions and Productivity
Page 25
As a result of these and related efforts and policies, in 2010 the University of Minnesota
was one of just three universities nationally (and the only university in the Big Ten) to
receive all A’s from the Sustainable Endowments Institute on the 2011 College
Sustainability Report Card.
Cost Driver: Information Technology8
In the area of information technology, we continue to rethink the service-‐delivery model in an effort to substantially reduce costs. Each year, we spend approximately $200M systemwide to support the information technology needs of the University. Managing the costs of hardware, software, and licensing is important, but strategies that focus on effective management of technology and support services not only reduce technology, facilities, and energy costs, but help reduce labor costs, as well. By continuing to implement best practices for technology use and performance, such a improving server management, implementing desktop automation, and using viable commercial solutions wherever possible, I believe we can achieve savings as high as 10 percent (or $20M) in the next five years. – President Bruininks, 2010 State of the University Address, “Chartering
the Future: Community Leadership During Transition” (April 2010)
The University of Minnesota system spends approximately $200M per year on
information technology and support, making IT the University’s third largest cost driver.9
For the past 30 years, the University has consistently found creative ways to finance the
technology needs of its faculty, staff, and students, and today, through its six-‐year
technology plan and ongoing internal transformation, the Office of Information
Technology (OIT) continues to rethink its service-‐delivery model in order to better
manage the support services and costs associated with essential equipment and
services.
8 Content in this section is revised from Transforming the U: Progress and Impact (Winter 2011). 9As with the rest of the University, the Office of Information Technology’s biggest cost is human resources: the skilled workers who maintain networks and equipment, manage and protect data, and support users of all types and abilities.

Financing the Future: Advancing Excellence Through Cost Reductions and Productivity
Page 26
Server Consolidation and Virtualization
OIT has identified nearly 4,000 servers in 125 buildings (and approximately 220 different
rooms) throughout the University, and has since begun to consolidate and “virtualize”
the server infrastructure—eliminating the need for each user or group to have a
separate physical server by masking and securing users’ resources and data on a single
server “box.” The initial goal is to consolidate servers into three locations and virtualize
approximately 75 percent of them. In addition to saving space and energy (used to both
power the servers and to keep them cool), a significant amount of operations and
maintenance effort will be refocused to key academic and research technology
initiatives. Based on general, industry-‐standard analysis, the University could potentially
realize savings of $3M to $11M annually through this effort.
Google Apps Rollout
In Fall 2009, the University of Minnesota began to roll out a suite of Google-‐powered
communication and collaboration tools, including email, calendar, document creation
and sharing, instant messaging, and web publishing applications. Since the partnership
with Google was first announced, interest in the initiative has continued to grow.
According to OIT, the move to Google enables the University to use Google’s application
and data storage servers, saving an estimated $1.5M per year in annual operations and
maintenance costs, as well as significant support at the unit level.
Leveraging IT Resources
Finally, the University has also undertaken a number of local, systemwide, statewide,
and national partnerships and initiatives in order to better coordinate and share
resources. This is essential, because while hardware, software, and licensing costs must
be monitored, the effective management of administrative support services not only
reduces technology costs, but also the costs of facilities, energy, and human resources.
Investments in common-‐good services have already helped collegiate units avoid more
than $25M in projected IT cost increases since fiscal year 2005.

Financing the Future: Advancing Excellence Through Cost Reductions and Productivity
Page 27
Cost Driver: Financial Aid
While tuition rates have increased dramatically over the last few decades, the
University’s efforts to moderate the total cost of education (including room and board,
books, etc.), coupled with historic investment in student financial support, means the
net price undergraduate students actually pay has grown less than 3.5 percent per year
on average over the past decade—and in some years, has actually decreased (Figure 7).
2000 2001 2002 2003 2004 2005 2006 2007 2008 2009 2010
Figure 7: Net Price Vs. Gift Aid and Cost of Attendance
Since it was launched in 2004, the Promise of Tomorrow Scholarship Drive raised $342M
to support need-‐ and merit-‐based scholarships and fellowships, including $260M in
undergraduate and professional student scholarships and $82M for graduate
fellowships. The University has also invested more than $37M in fellowships, grants, and
other assistance for graduate and professional students since 2007. Finally, the
University of Minnesota Promise (U Promise) scholarship program—the University’s
innovative need-‐based financial aid commitment for Minnesota undergraduates—today
provides substantial scholarship support to approximately 13,000 students from low-‐
and middle-‐income Minnesota families earning up to $100,000 per year. This program is
combined with federal Pell grants, state grants, and private sources of student support

Financing the Future: Advancing Excellence Through Cost Reductions and Productivity
Page 28
(based on student eligibility and Expected Family Contribution) to provide extraordinary
financial support for Minnesota students with the greatest need.
The success of these efforts is tied tightly to the University’s commitment of internal
resources in the form of student and matching funds to encourage private support.
The Promise of Tomorrow scholarship drive leveraged a Presidential Match program
that drove unprecedented levels of giving for student support of seven to 10 times
higher than previous levels. In 2010, nearly 13,500 students throughout U system were
helped by private gifts to support student financial aid—approximately 22 percent of all
students receiving financial support.
That number is expected to continue growing—and in recent years, student financial aid
has become another rapidly growing cost driver for the University. In order to help
predict and manage the growth of University-‐based financial aid expenditures, several
changes were made to the U Promise program:
• Beginning in the 2011-‐2012 academic year, new incoming Minnesota resident
undergraduates (first-‐year students) on any campus with a family income of up
to $100,000 will receive a guaranteed four-‐year U Promise scholarship from
$500 to $3,500 based on their Expected Family Contribution as determined by
their FAFSA.
• New transfer students on any campus with a family income of up to $100,000
will receive a guaranteed two-‐year U Promise scholarship, ranging from $500 to
$1,500 each year based on their Expected Family Contribution as determined by
their FAFSA.
• As in the past, this University scholarship is awarded in addition to all other
forms of financial aid for which these students are eligible in order to help
address their remaining unmet financial need.
Financing the Future: Advancing Excellence Through Cost Reductions and Productivity
Page 29
• Current/continuing students who qualify for the U Promise also will receive a
fixed and consistent award amount from the University for the 2011-‐2012
academic year and the same amount for the remaining years of their eligibility.
• For current/continuing students, the fixed and consistent University award
amount for 2011-‐12 and beyond will be as much or more than they received in
the 2010-‐11 academic year.
• All eligible students will continue to be served by the U Promise program – the U
does not and will not cap the number of students served.
These changes enable the University to ensure strong and predictable financial support
to all low-‐ and middle-‐income Minnesota students despite rapid changes in state and
federal aid programs. The University of Minnesota is moving from a model in which the
annual cost increases are highly variable to a model in which increases are predictable
and sustainable. The program remains one of the strongest commitments to guaranteed
need-‐based aid in the country.
• The percentage of Minnesota students who receive the U Promise scholarship
has tripled, from 8 percent in 2007 to 24 percent in 2011.
• The total amount of money awarded for the U Promise scholarships has
increased 450 percent, from $4.07M in 2007 to $18.7M in 2011.
• In 2010-‐11, 35 percent of all Minnesota resident, degree-‐seeking, full-‐time
undergraduates received financial aid from University sources.
• In 2010-‐11, 26 percent of all Minnesota resident, degree-‐seeking, full-‐time
undergraduates received scholarship and grant aid that covered an amount
equal to or greater than the cost of full tuition.10
10 This includes federal and state aid, as well as University sources.

Financing the Future: Advancing Excellence Through Cost Reductions and Productivity
Page 30
The University would like to see private support replace internal support for
scholarships—and in fact, private scholarship support has doubled since 2000-‐01. The
University has also worked hard to control the portion of students’ total cost of
attendance outside of tuition and fees. For 2011-‐12, the Twin Cities campus is estimated
to have the second lowest cost of room and board in the Big Ten (based on double
occupancy and standard meal plan). The average increase in the cost of room and board
over the most recent five years (2007-‐08 through 2011-‐12), is approximately 2.5 percent
per year. The average increase over the past 10 years, (2001-‐02 through 2011-‐12) is less
than 4 percent.

Financing the Future: Advancing Excellence Through Cost Reductions and Productivity
Page 31
Academic Productivity and the Blue Ribbon Process
Every unit has difficult decisions to make regarding what should be strengthened, maintained, reduced or consolidated, or eliminated—and academic units, in particular, face not only hard choices, but also the hard work of phasing out multiyear programs and initiatives and wringing out savings once these decisions are made. These efforts are made still more difficult by the fact that we are growing: full-‐year equivalent enrollment systemwide is up 12,422 students since 1999–2000, with nearly 3,500 more degrees produced per year than in 2000. The good news is that we have experience with such choices, and the results have transformed the academic quality, productivity, and impact of the University.
– Transforming the U: Progress and Impact (Winter 2011)
In the months preceding the launch of Transforming the U, the University of Minnesota
made two significant decisions that garnered statewide, and even national, attention:
• It closed General College, which was fulfilling its goal of admitting students of
diverse backgrounds and abilities, but was not succeeding in transitioning those
students to degree programs and graduating them at sufficiently high levels.
• It transitioned from a county-‐by-‐county model for delivering Extension service to
a consolidated regional model, moving from offices in all 87 Minnesota counties
to just 16 regional offices today.
Both of these initiatives have yielded impressive results. Today the University’s
academic support services for students of all backgrounds are much improved and four-‐
year graduation rates have doubled. University of Minnesota Extension, meanwhile, has
the most visited web site of any state Extension service in the country, and
administrative costs for Extension are less than 10 percent of its annual budget.
Similarly, the closing and consolidation of six Twin Cities colleges in the summer of 2006
as part of Transforming the U yielded three new more streamlined and interdisciplinary
colleges—the College of Design, the College of Education and Human Development, and

Financing the Future: Advancing Excellence Through Cost Reductions and Productivity
Page 32
the College of Food, Agricultural and Natural Resource Sciences. These new colleges not
only better meet the needs of students and the challenges of scholarship across
academic fields, but also strengthened University leadership in these areas and saved an
estimated $3M through administrative personnel reductions and efficiencies in
information technology, finance, and communications.
More recently, the University has turned its attention toward post-‐baccalaureate
education and the health sciences, areas in which it is unique among universities in the
state. In 2009, the University undertook the restructuring the Graduate School in order
to improve student experiences, increase efficiencies, and streamline current processes.
The restructuring has resulted in $1M in cost savings, captured by reducing
administrative overhead and eliminating redundancies. Currently, the new Graduate
School and the Academic Support Resources team are reviewing existing procedures as
part of a process to develop an online, streamlined tool to track graduate students’
degree progress. This project and others are all a part of a bigger goal to transfer
primary responsibility and accountability for graduate programs from the Graduate
School to the individual colleges, resulting in increased savings and efficiencies.
In 2010, the University announced that Aaron Friedman, vice president for health
sciences, and Tim Mulcahy, vice president for research, would lead a steering
committee in a review of the Academic Health Center (AHC) and make
recommendations regarding the best organizational model to support the mission and
progress of the health science schools. The steering committee’s review focuses on
enhancing enterprise-‐wide systems, increasing potential synergies, reducing
redundancies in administrative services, and boosting alignment of enterprise and unit-‐
specific roles and responsibilities. In addition, all existing centers and programs in the
AHC are being reviewed to define the most appropriate academic and administrative
reporting relationships. A final report with recommendations will be delivered to the
president and provost on June 30, 2011. The University continues to examine each of

Financing the Future: Advancing Excellence Through Cost Reductions and Productivity
Page 33
these essential areas with the goal of improving academic quality and results, while
meeting significant cost-‐reduction objectives.
Finally, the academic units on the Twin Cities campus and the University’s coordinate
campuses completed a Blue Ribbon process to identify and address short-‐ and long-‐
term academic priorities and opportunities for reconfiguration, cost reduction, and
investment. Just as in the University’s budget planning process and the unit-‐level
compact process, each academic unit, college, and campus, undertook a methodical
reexamination of its current activities and current and projected resources, answering
five broad questions:
• What should be strengthened or expanded? • What should be maintained at current levels? • What should be reduced or consolidated? • What should be eliminated? • How can we better leverage existing resources?
At the May 2011 Board of Regents meeting, University leaders shared an overview of
the recommendations put forth by the Blue Ribbon committees. A more complete list of
programmatic reductions and cost-‐containment recommendations, both for the Twin
Cities campus and systemwide, is included on subsequent pages. Projected cost savings
are still in development.
Twin Cities Campus
Completed Programmatic Reductions
• Carlson School of Management: Closed the Global Executive MBA Program–
Warsaw
• School of Dentistry: Closed the Geriatric Dentistry graduate program and
suspended operation of the Center for Contemporary Dentistry
• School of Nursing: Phasing out the Master of Science in Nursing program and
incorporating content into the Doctor of Nursing Practice program

Financing the Future: Advancing Excellence Through Cost Reductions and Productivity
Page 34
• College of Veterinary Medicine: Streamlined the Veterinary Medical Center and
Diagnostic Laboratory
• College of Biological Sciences: Merged the Microbial and Plant Genomics
Institute with the Biotechnology Institute
• College of Continuing Education: Consolidated and discontinued academic
programs
• College of Liberal Arts: Reduced course sections
• College of Pharmacy: Reduced Professional Education Division budget
Suggested Programmatic Reductions
• School of Public Health: Cut the Global Health program and close the Health
Survey Research Center
• College of Food, Agricultural and Natural Resource Sciences: Merge the
Experiment Station within the college
• College of Liberal Arts:
– Discontinue the requirement of a senior project and restructure into
capstone experience
– Reduce and/or consolidate certain graduate programs
– Reduce the total number of graduate students, with improved support
for those who remain
– Reexamine the number of undergraduate degree programs
• College of Design: Eliminate continuing education programs
• College of Veterinary Medicine: Delay residency positions
Further Academic Cost Reductions
• College of Liberal Arts: Discontinue the major in Archaeology, the major in
Ancient Mediterranean Studies, and the minor in Humanities of the West

Financing the Future: Advancing Excellence Through Cost Reductions and Productivity
Page 35
• Medical School:
– Transfer certain aspects of Emergency Medicine program to Hennepin
County Medical Center (research stays here) and reduce budget
– Reduce and curtail of investments in anesthesiology research program
– Reduce funding for two programs that recruit for and support rural
medicine (MWCEP-‐recruit college students for rural practice) and scale
back support for rural practitioners
– Closed or merged numerous research labs with others to reduce costs
• College of Continuing Education:
– Suspend the popular “Great Conversations” series
– Close Program for Individualized Learning
– Eliminate six post-‐baccalaureate certificate programs
• College of Food, Agricultural and Natural Resource Sciences: Convert 12-‐month
faculty appointments to nine-‐month appointments
Multiple Colleges and Campuses:
• Extensive promotion and strategic use of RIO
• Create enterprise areas of support/eliminate individual service centers
• Discontinue use of print material
• Better balance of tenured/tenure-‐track faculty, adjunct/contract faculty, and
teaching assistants
• Increase number of student credit hours taught
• Reduce degree requirements when not essential
• Reduce support unit costs relative to academic expenditures
• Reduce square footage and number of facilities used
The process of evaluating and disinvesting or reinvesting in academic programs and
departments necessarily takes time—particularly where students are involved—but
long-‐term efforts like these will produce significant savings over the next few years.

Financing the Future: Advancing Excellence Through Cost Reductions and Productivity
Page 36
Coordinate Campuses and Statewide System
• University of Minnesota Crookston:
– Combining administrative and student service offices, co-‐sponsoring
student activities with neighboring higher education institutions, and
providing some services online rather than in-‐person
– Curtailing or consolidating undersubscribed programs, including changing
major programs to minors where indicated
• University of Minnesota Duluth:
– Reducing facilities and operations costs, including postponing
maintenance projects, instituting energy saving measures such as
reducing the heat during breaks, and using more central University
business resources such as Purchasing.
• University of Minnesota Morris:
– Reducing long-‐term energy costs by adding a second wind turbine, a
series of solar panels to heat the warm water swimming pool, and several
photovoltaic panels used primarily for educational purposes
– Restricting discretionary travel expenditures
– Reviewing all open positions to identify possible cutbacks
– Promoting the retirement incentive option for eligible employees and
offering voluntary layoffs
• University of Minnesota Rochester:
– Considering delaying selected new degree programs if necessary11
• University of Minnesota Extension:
– Redeploying its facilities and staff to better align capacity with demand
– Using more and better evaluation and assessment techniques to ensure
that programs are cost-‐effective, reach the intended audience, and serve
enough participants to be viable
11 UMR is a new and growing campus that needs to expand in nearly every area to meet student demand and enrollment goals.

Financing the Future: Advancing Excellence Through Cost Reductions and Productivity
Page 37
– Identifying sustainable funding sources for every program
– Carefully defining its role in collaborative projects with internal and
external partners to avoid duplicating services and to ensure an
appropriate, mission-‐driven role
– Experimenting with flexible work arrangements that enable Extension
educators to work from home, increasing efficiency, decreasing travel
needs and costs, reducing space needed in regional offices, and
increasing employee satisfaction
– Assuming administration of the Children, Youth, and Family Consortium
to achieve administrative cost savings and leverage resources
• Global Programs and Strategy Alliance:12
– Streamlining the study abroad application process with a new online
application and profile system
– Reducing the cost of travel and travel insurance for students with a new
online travel booking system and a new travel insurance contract
• Center for Urban and Regional Affairs (CURA):
– Reducing support for CURA’s Child Welfare initiative
– Reducing the Faculty Interactive Research Program by one or two grants
each year
– Merging the Metropolitan Consortium with CURA
University of Minnesota System Council
The senior vice president for system academic administration has also launched the
University of Minnesota System Council, comprised of the chancellors, senior vice
presidents, selected deans, and vice presidents with system responsibilities, to address
challenges and opportunities that face the University of Minnesota statewide system.
This council will plan and implement short-‐ and long-‐term projects in areas including
12 Global Programs and Strategy Alliance (GPS Alliance) was previously the Office of International Programs.

Financing the Future: Advancing Excellence Through Cost Reductions and Productivity
Page 38
facilities, technology, business processes, online education, course and credit transfer
among campuses, and others that provide opportunities for expense reduction,
resource sharing, enhanced service and productivity, and growth of new resources.
Current and completed initiatives include:
• a joint admissions process that enables students to complete just one
application for admission to any of our campuses;
• a help-‐desk call center at UMC that serves the entire system for students and
prospective students with questions about registering for any online course;
• consolidated University Bookstore operations for the Twin Cities, Crookston,
Morris and Rochester campuses to leverage buying power and improve
efficiency;
• installation of video conferencing rooms and other technology innovations on all
campuses so faculty and staff can work more effectively across the state without
investing time and money traveling from campus to campus;
• systemwide technological tools to support students, including:
– the Grad Planner interactive web-‐based tool, which helps students plan
their coursework;
– the APlus program, which gives academic advisers more information
about each student’s records; and
– the Scholarship Administration Database to track all financial aid
transactions;
• central HR services for all systemwide offices, including new employee
orientation, a wide array of professional development and training programs,
employee background checks, market salary surveys, and more; and
• a tool developed for each campus by the Office of Planning and Analysis that
predicts the financial and programmatic implications and impacts of actions
under consideration to enhance informed decision-‐making.

Financing the Future: Advancing Excellence Through Cost Reductions and Productivity
Page 39
All of the University’s statewide campuses and programs have conducted rigorous
planning processes to identify future priorities and sustainable strategies that align
with the vision, goals, and strategies of Transforming the U. The System Council will
continue to work across the state to improve the efficiency and effective use of system
resources and assets, reduce costs, and improve service and accountability.

Financing the Future: Advancing Excellence Through Cost Reductions and Productivity
Page 40
Other Cost Centers and Strategies13
Our historic three-‐fold mission provides important context for aggressively reducing costs and growing revenues. We must remain consciously committed to the principle that we will not abandon any of our core responsibilities. Cost-‐reduction efforts mentioned throughout this report—including retirement incentives and targeted hiring strategies, the demolition and renovation of existing buildings, server virtualization and the reorganization of IT services—are yielding impressive savings. Future efforts will necessarily be deeper and more systemic—this will require us all to be disciplined and entrepreneurial within our own units and departments, colleges, and campuses, in order to refine and focus our endeavors so that we deliver on our mission strategically, where and when we are most needed.
– Transforming the U: Progress and Impact (Winter 2011)
Strategic Purchasing and Procurement Initiative
In 2009, the cross-‐functional Strategic Procurement Advisory Committee undertook an
effort to substantially reduce the amount the University of Minnesota spends on goods
and services. The committee initially focused on five major procurement areas in which
the potential for significant savings existed: office supplies, lab supplies, air travel,
courier expenses, and IT equipment. The effort was expected to save the University
more than $2.7M per year initially, with a long-‐term goal of $25M per year—and it has
already exceeded expectations: in 2010-‐11, the University saved more than $6M.
Facilities Management Transformation
In 2006, as part of Transforming the U, Facilities Management began a two-‐year
process of in-‐depth analysis of its business processes, goals, metrics, and culture. The
result was a transformational change in both organization and culture, built on a
foundation of “3 Cs”: customer focused, culture of accountability, and cost effective.
13 Content and figures in this section are revised, updated, and expanded from Transforming the U: Progress and Impact (Winter 2011).

Financing the Future: Advancing Excellence Through Cost Reductions and Productivity
Page 41
Facilities Management successfully implemented a new team-‐based approach to best
serve units with a focus on solving problems and addressing needs in a timely and
efficient manner. Further, internal business processes, including financial and activity-‐
based reports, are used so that performance benchmarks can be improved upon and
monitored. Units were also given the opportunity to develop service-‐level agreements
with facilities management in order to establish key process indicators. Service
agreements are reviewed annually as a part of the budget process. All of these
changes, large and small, add up to increased savings, more efficient processes, better
services, and ultimately, an outstanding organization. Examples of specific changes and
resulting savings are detailed on subsequent pages.
Office for Equity and Diversity (OED) Reallocation of Capacity
In 2009-‐10, OED undertook a “reallocation of capacity plan,” in which the staff was
asked to identify 10 percent of existing activities that should be “furloughed” (either
temporarily or permanently) for the year. The criteria for decision-‐making included how
closely the purpose of the activities were linked to missions and strategic goals of the
University, OED, and the individual unit, and how much impact these initiatives had in
achieving these strategic goals. Suspending selected activities resulted in 10 percent of
the OED’s capacity being available for new initiatives judged to be of greater strategic
importance or potential impact. The value of the staff capacity reallocated this year was
approximately $1M, resulting in more than 50 new or strategically redirected initiatives.
Office of the General Counsel (OGC) Reductions
For fiscal years 2010, 2011, and 2012 (this coming year), OGC’s operating budget has
been reduced by $447,000 or 14 percent. This has occurred without any reduction in the
legal service needs that must be met by OGC for the University. In the past two fiscal
years (2010 and 2011), OGC’s operating budget has been reduced by $281,000, or 8.8
percent. The reductions have had a significant effect on OGC’s operations and service
capabilities, including reductions to secretarial support staff, reductions in the law clerk

Financing the Future: Advancing Excellence Through Cost Reductions and Productivity
Page 42
program, reductions in information technology support, reductions in the employee
development program, and reductions in legal research materials and professional
publications. In order to reach the additional $166,000 cut in fiscal year 2012, OGC is
eliminating another support position and a supervisory position, further reducing the
law clerk program, and beginning to reduce service levels for attorney and paralegals.
Additional Examples of Unit-‐Level Strategies:
• Printed Communications. From fiscal year 2006 to 2010, the University has
reduced its internal and external printing expenditures by $3.9M, from $15.5M
to S11.6M. This reduction reflects a significant shift from producing printed
annual reports to presenting information online and discontinuing reports that
are not required. Print directories and course catalogs have been discontinued
(all information is available online), and interactive campus maps now enable
visitors to locate and print relevant map information from home, reducing the
need for printed maps. In addition, the University of Minnesota Alumni
Association now produces an online version of Minnesota Magazine as an
alternative to the print version, increasing circulation while reducing printing and
distribution costs.
• Employee Driver Training Program. In February 2005, Parking and
Transportation Services (PTS) introduced the Employee Driver Training Program,
which resulted in dramatically fewer accidents and lowered excess-‐liability
insurance premiums by 75 percent, resulting in annual recurring cost savings
totaling $190,000.
• Consolidated Deliveries. That same year, PTS implemented a Consolidated
Deliveries plan, leveraging campus mail drivers, who were busy in the morning
but had availability in the afternoon, and University Stores drivers, who were
already visiting some of the same buildings as the mail vans, but with larger
vehicles that often were not full. Combining the operations resulted in fewer
trucks and less people hours for the same routes; enabled Delivery Services to

Financing the Future: Advancing Excellence Through Cost Reductions and Productivity
Page 43
absorb an additional 5,000 deliveries (a 6 percent increase) without adding
additional vehicles or staff, and resulted in $13,000 in annual cost avoidance.
• Campus Mail. Campus Mail operations have been merged into Addressing &
Mailing and University Stores operations, and staff was cross-‐trained to work in
several locations, enabling the University to close two campus copy centers and
reduce personnel costs.
• Group Relamping. In 2006, staff in U Services and Classroom Management
launched a pilot project to change light bulbs in batches on a rotating schedule,
instead of one at a time as needed—and to replace them with more efficient
bulbs—for a projected savings of $1.5M over the first five years.
• Custodial Supplies Replenishment. In 2007, Facilities Management and
University Stores piloted a project to streamline the replenishment of custodial
supplies. Under the old system, custodial staff spent more than an hour a week
reordering and restocking supplies, using a process that took up to four days.
The new approach replenished supplies proactively on a next-‐day cycle—a 75
percent shorter timeframe with 80 percent savings in direct labor.
• Automated Clocks. Each of 300 general-‐purpose classrooms contained a clock
that needed to be adjusted twice a year for the changes in daylight savings, as
well as batteries that were switched out at least annually. Facilities Management
partnered with the Office of Classroom Management to invest in new clocks that
are automatically updated via satellite, saving the labor time and reducing injury
risk. FM expanded the project into some of the departmental classrooms
bringing the total up to 560 clocks with an annual savings of $30,000.
• Exit Sign LEDs. More than 900 exit signs around campus have been retrofitted
with LED lamps, which reduce the electrical load to 4 Watts per sign, compared
to a typical 14 to 36 Watt configuration. The annual savings of this small change
adds up to $11,000 per year.
• Anti-‐Icing Program. Facilities Management’s Landcare division adopted a new
anti-‐icing procedure that is better for both the environment and the bottom line.
Financing the Future: Advancing Excellence Through Cost Reductions and Productivity
Page 44
Prior to a storm’s arrival, the University now pre-‐treats roads and sidewalks with
an agent that prevents snow and ice from bonding with a surface. The new
system requires less labor time to clear snow and ice as well as reduced
restorative labor in the spring. This initiative generates an annual savings of
$110,000.
• U Services IT Infrastructure Consolidation. IT servers, data centers, and staff
supporting hundreds of U Services employees are being reconfigured to create a
more efficient operation that yields higher levels of service and significant
operating cost savings projected at more than $1M.
• Printing Services. In a continuing effort that began in 2003, Printing and General
Services consolidated, realigned business areas, and right-‐sized staff and services
resulting in recurring annual savings of more than $775,000.
These are only representative examples of the creative, unit-‐level initiatives underway
to save local academic and support units millions of dollars. University faculty and staff
continue to be disciplined and entrepreneurial stewards of their limited resources, and
the entire University benefits from the results.

Financing the Future: Advancing Excellence Through Cost Reductions and Productivity
Page 45
Long-‐Term Planning, Growth, and Leveraging of Resources
Twice in the past decade alone, we have experienced deep state budget reductions, the most recent of which has set our state appropriations back more than 10 years. In that time, we have consistently found creative ways to reduce costs and reinvest savings into our academic priorities. In order to improve the quality and vitality of the University into the future, we must continue to set clear priorities; to invest in core strengths and emerging opportunities; and to improve productivity and return on investment across all of our activities statewide.
– Transforming the U: Progress and Impact (Winter 2011)
Long-‐term strategic planning and improvement is necessarily cyclical (Figure 9). The
cycle begins (and re-‐starts) with careful short-‐ and long-‐term strategic planning; without
clearly articulated objectives and a plan for achieving them in place, those units or
priorities that compete best for resources become the priority, regardless of the long-‐
term best interests of the organization.
Figure 8: Strategic Improvement Framework

Financing the Future: Advancing Excellence Through Cost Reductions and Productivity
Page 46
The circular graphic encompasses the policy and governance responsibilities of the
Board of Regents and leadership team (broadly speaking) on the left-‐hand side and the
leadership and management responsibilities of the executive team, faculty, and staff,
primarily on the right side of the diagram.
In this context, planning encompasses the University’s overarching long-‐term strategic
plan and goal; coordinate campus strategic plans; and related task force, collegiate, and
unit-‐level reports and plans; and six-‐year capital, information technology, and research
infrastructure plans. These plans inform resource allocation through the biennial budget
request planning process, the annual budget planning process, the compact process
with all academic and support units, and our long-‐term financial planning and modeling
efforts. Resource allocation helps set the parameters for operational management
through investments in strategic priorities, comparative strengths, and emerging
opportunities, as well as targeted, differential budget reductions and disinvestment in
non-‐core or non-‐essential programs, services, and initiatives. Performance assessment
and improvement occurs at all levels of the University, and key measures and supporting
metrics are communicated to the Board of Regents, the University community, and the
public through numerous reports each year—ensuring a level of public scrutiny and
accountability that is second to none. These reports also serve to inform each
subsequent round of planning, restarting the cycle.
Earned Income and Full Cost Budget Model
The University of Minnesota’s incorporation of this more decentralized, yet integrated,
model of planning and performance assessment has its roots in the late 1990s and early
2000s with a major change in the University’s overarching budget model. The University
began moving towards a substantially more decentralized budget model in July 1997
with introduction of Incentives for Managed Growth, which allocated tuition and
indirect cost recovery (ICR) revenues directly to collegiate and campus units. Then,
beginning with discussions in 2004 in a joint academic and administrative task force, the

Financing the Future: Advancing Excellence Through Cost Reductions and Productivity
Page 47
University moved to an “earned income and full cost” budget model that decentralized
all revenues and all facility, technology, and administrative costs to the collegiate and
campus units.
Figure 9: Earned-‐Income Full-‐Cost Budget Model
The current budget model was implemented in July 2006. The table above outlines the
attribution of revenues and the allocation of costs to academic units in the current
budget model (Figure 10). The University chose this direction in order to provide greater
accountability for revenue and costs, enable the examination of an all-‐funds view of
each academic and administrative unit, and reduce the reliance on internal
assessments. The model was built on the principles of supporting the mission and goals
of the University, providing increased transparency and an information-‐rich
environment for budget decisions, and encouraging revenue enhancements, cost
controls, and increased accountability throughout the system.

Financing the Future: Advancing Excellence Through Cost Reductions and Productivity
Page 48
Compact Process14
University leaders developed the current compact process in the late 1990s in an effort
to coordinate planning and accountability within academic and administrative units. The
process provides a framework for discussing past and future strategic goals, fiscal issues,
and responsibilities. To better align planning with strategic positioning efforts and to
emphasize data-‐informed decision-‐making, the University continues to strengthen the
compact process by asking critical planning questions of all academic and support units,
as well as by creating a performance framework to assess academic and administrative
functions, providing a consistent means of measuring progress and reinforcing the goal
of improved accountability and transparency across the University system.
Performance Framework Goals, Strategies, and Key Measures
The University continuously works to establish and refine measures of its progress
toward its strategic goals, in comparison to peer institutions and internal benchmarks.
Figure 10: Performance Framework University-‐Wide Goals
14 This content revised from Transforming the U for the 21st Century (September 2007). The compact process was introduced by the Yudof administration.
Financing the Future: Advancing Excellence Through Cost Reductions and Productivity
Page 49
The Board of Regents endorsed the University of Minnesota’s performance framework
and goals in November 2009 (Figure 11). The framework identifies the strategies that
the University has defined to advance the mission and numerous key measures tracked
on a regular basis with respect to those strategies. (See Appendix for more information.)
Key measures identified in the University’s performance framework must:
• reflect the University’s aspirational goal; • be transparent regarding the methodology used for creating metrics; • rely on measures that are relevant, reliable, and valid; • measure outcomes rather than inputs whenever possible; • contain benchmarks against which progress can be measured; • measure progress against an identified comparison group; • provide meaningful policy direction for improvement; and • be able to be developed, revised, and updated regularly at reasonable cost.
In spring of 2011, the University released an economic impact study conducted by
national external consulting firm Tripp Umbach, an overview of which is presented on
subsequent pages of this report. The University’s systemwide Office of Planning and
Analysis worked closely with Tripp Umbach on this study and now has both the
methodology and tools in place to duplicate this study in the future. As a result, aspects
of the economic impact study will be incorporated into the University’s performance
framework, key measures, and regular reports to internal and external constituencies.
Growing New Revenues
Of a $3.4B budget today, only about 20 percent comes from state support (overshadowed by both tuition revenue and sponsored research funding). In fact, state support for the University has been essentially flat for 30 years—all real growth in the University’s budget has come from other funding sources.
– Transforming the U: Progress and Impact (Winter 2011)
Although state support—which is a major and essential part of the University’s
operating budget—has been flat to declining in recent years, the University of

Financing the Future: Advancing Excellence Through Cost Reductions and Productivity
Page 50
Minnesota ‘s overall budget has increased in size, primarily through strategic efforts to
increase the productive capacity of the University and grow non-‐state revenues. With
the exception of tuition, these non-‐state revenues are generally dedicated to specified
purposes and cannot be used for the day-‐to-‐day operations of the University. But
although state funding and tuition revenue still comprise the bulk of the University of
Minnesota’s fungible budget, these additional revenues are essential to the University’s
unique role and historical mission as Minnesota’s only comprehensive research
university and its only land-‐grant university.
• Research Growth. In 2010, the University of Minnesota garnered a record
$823M in competitive research funding—in fact, since 2004, the University’s
research portfolio has grown by 41 percent, the second-‐highest growth rate
among U.S. public research universities. In addition, University-‐based
technologies figured prominently in the launch of at least 14 new companies in
the past two years, and gross annual revenues from patent and licensing activity
were nearly $84M in 2010. The University also made a conscious commitment to
encouraging interdisciplinary collaboration, resulting in tens of millions of dollars
to support new research in fields including food safety, public health, the
environment, and neuroscience. Finally, in fall 2010, the Office of the Vice
President for Research announced the Research Infrastructure Investment
Initiative, or I3, which reinvests $20M in technology commercialization revenues
to support for essential equipment and technical personnel across a broad range
of academic disciplines, including the arts and humanities, social sciences, and
natural sciences.
• Growth of Private Support. On Dec. 31, 2010, the Presidential Match Program,
which was the cornerstone of the Promise of Tomorrow scholarship drive
launched in 2004, came to an end. This matching strategy for student financial
support drove unprecedented levels of giving for student support and yielded
more than $342M in total commitments of private support for students,

Financing the Future: Advancing Excellence Through Cost Reductions and Productivity
Page 51
including $260M in undergraduate and professional school scholarships and
$82M for graduate fellowships. In 2010, nearly 13,500 students throughout the
University system were helped by private gifts to support student financial aid—
approximately 22 percent of all students receiving financial support. In fact, over
the past 10 years (FY00 through FY10), new gift and commitments to the
University totaled $1.1B cumulatively. During this same time the value of all the
endowments (combined) grew from $1.8B to $2.3B, and annual disbursements
to the University from the University of Minnesota Foundation and the
Minnesota Medical Foundation have grown from $91M to $143M. This number
represents the annual impact of private giving going directly to students, faculty,
programs and facilities across the University. Both foundations are now
embarking upon new private fundraising strategies to better align resources with
the University’s overarching needs and strategic priorities, as well as goals at the
collegiate and campus level.
• Strategic Enrollment Growth to Increase Tuition Revenue. For several decades
the practice of enrollment management has been applied to undergraduate
education at the University of Minnesota. A highly controlled admissions process
has resulted in a better-‐qualified student body and higher retention and
graduation rates. Controlling admission has enabled colleges to offer the courses
students need in patterns that are both cost effective and consistent with the
goal of four-‐year graduation. In the past decade, national attention has shifted to
graduate and professional education. A cross-‐functional committee has been
working during the past year to evaluate enrollment management at both the
undergraduate and graduate/professional levels. At the undergraduate level, the
committee’s recommendations include the following:
– The Twin Cities campus should slightly increase the undergraduate
student body to approximate 33,000 students.
– The University of Minnesota has a very high number of transfer students,
which poses both advantages and disadvantages. Central administration

Financing the Future: Advancing Excellence Through Cost Reductions and Productivity
Page 52
should play a stronger role in the admission of transfer students, and the
University should maintain a ratio of 2:1 freshman/transfer ratio.
– The number of students in the STEM (science, technology, engineering,
and mathematics) fields should be increased, especially in the College of
Science and Engineering and in the College of Biological Sciences. The
number of applications in these areas has rapidly grown.
– The achievement gap for students of color needs to be significantly
reduced. Both retention and graduation rates for students of color need
to be increased.
– The proportion of undergraduate students from Minnesota should be at
least 60 percent, while the proportion from outside Minnesota and the
reciprocity states should be increased.
– The University should continue to improve the academic profile of
incoming students.
– There should be a careful assessment of the Post-‐Secondary Education
Options (PSEO) program, and more students should be recruited from
PSEO to the Twin Cities campus.
– Additional undergraduate housing should be developed to accommodate
more first-‐ and second-‐year students, as well as an increasing number of
transfers who wish to live on campus.
Graduate and professional recommendations are still in development and
pending approval. It is important to note that the University has already
increased its productivity in terms of enrollment and degree production in recent
years. Undergraduate enrollment has increased 8 percent, from 39,626 in 2002-‐
03 to 43,471 in 2010-‐11, while total enrollment has increased 7.5 percent, from
62,789 to 67,932 during the same period. Bachelor’s degrees granted have
increased 19 percent, from increased from 7,457 in 2002-‐03 to 9,246 in 2009-‐10,
and total degrees awarded have increased 20.5 percent, from 11,497 in 2002-‐03
to 14,478 in 2009-‐10.

Financing the Future: Advancing Excellence Through Cost Reductions and Productivity
Page 53
• Enhancement of E-‐Learning Opportunities. In 2010, an external peer-‐review
group delivered a report on the status of web-‐based learning at the University of
Minnesota—the culmination of efforts to assess the University’s online
education strengths, weaknesses, and capacity over the past year and a half. In
May 2011, the Provost’s Advisory Online Education Committee was formed to
advise the provost on the University’s goal of increasing collaboration,
communication, and strategic planning for the advancement of online learning
throughout the University. There are important signs of progress, including:
– The total number of enrollments in online course sections increased 20
percent, and the total number of online course sections offered
increased 8 percent, from 2009-‐10 to 2010-‐11.
– Learn Mostly Online (LMOL), a faculty development program offered
during 2010-‐11, provided hands-‐on experience for educators in the
systematic design, development, evaluation, and continuous
improvement of hybrid or online courses.
– The “Clear Path” process partners with collegiate units to develop
templates and document procedures to make it easier for faculty to
design, develop, and market online offerings.
– The College of Continuing Education is developing “low residency
programs,” which cater to students who seek a masters or professional
masters and involve one to two weeks of classes on-‐campus during the
summer with the rest of the classes taking place on-‐line. These programs
appeal to working professionals who seek additional degrees or
credentials.
– New initiatives under development include a mobile device platform,
professional master’s degree offerings, non-‐credit certificates, and
continuing education programs in the health professions, e.g., clinical
research modules.
The University clearly has a strong platform and substantial experience in the

Financing the Future: Advancing Excellence Through Cost Reductions and Productivity
Page 54
area of online education; however, the decentralized and distributed nature of
the University means that there is a substantial need to improve communication,
collaboration, and understanding across the University with regard to
competencies, capacities, and aspirations.
• UMore Park. The University of Minnesota Outreach, Research and Education
(UMore) Park is the University’s 5,000-‐acre property located 25 miles southeast
of the Twin Cities in Dakota County. A vision to build a unique, sustainable
community—a 25-‐ to 30-‐year endeavor—was affirmed by the Board of Regents
in December 2006, and includes the preservation of 2,800 acres called Vermillion
Highlands for conservation and recreation purposes; the development of
aggregate gravel deposits to generate support for our academic mission and
meet the long-‐term needs of the state for this essential construction resource;
ongoing U research in a wide variety of fields; and community development. The
adoption of a comprehensive, long-‐term, land-‐use plan for the UMore Park
property by the Board of Regents, followed in 2009 by the establishment of the
UMore Park LLC and Legacy Fund, set the stage for the University to bring this
vision to reality and leverage UMore resources for decades to come.
Strategic Risk Management15
Over the past 15 to 20 years, the University of Minnesota has actively cultivated a
“culture of compliance” through development of effective policies and procedures,
establishment of compliance and oversight structures, and creation of programs to raise
the awareness of the campus community as to ethical standards, responsibility, and
accountability that must govern daily activities. These efforts were intentionally
conservative, designed to minimize risks across the expanse of the University’s activities.
At the time, a conservative approach to risk was appropriate—and today, the
University’s compliance culture represents one of its greatest strengths.
15 This content edited from docket material for the regular Board of Regents meeting on Feb. 11, 2011.

Financing the Future: Advancing Excellence Through Cost Reductions and Productivity
Page 55
However, as greater and increasingly complex challenges have confronted all aspects of
the University’s mission, many additional risk-‐averse policies, procedures, and practices
have been layered on those already in place, creating highly regulated environments. In
2009, a Risk Tolerance Work Group was charged with the development of a framework
to guide the University community toward a more strategic approach to the
management of risks across all aspects of its operations. A strategic approach to risk
management acknowledges the positive as well as the negative aspects of individual risk
situations and involves a deliberate risk-‐versus-‐benefit analysis approach to inform
decision-‐making in the interest of enhancing innovation, creativity, productivity, morale,
and overall performance. This transformation to a strategic risk management culture
will require a series of iterative steps over multiple years; however, such efforts should
provide relief from some of the financial, personnel, and systems costs associated with
the current risk-‐adverse culture and should enable the University to be appropriately
responsive to new and emerging opportunities to increase capacity, productivity, and
revenue.
Economic Impact and Return on Minnesota’s Investment
Due to careful planning and responsible management, the University of Minnesota has
consistently balanced its budget and improved academic quality, services, and
productivity. In fact, today the University ranks among the best and most productive
universities in America, as a 2011 economic impact study by Tripp Umbach reveals:
• $8.6B in statewide economic impact;
• A return of more than $13 to the economy for every $1 of state investment;
• $525M in state tax revenue generated by University operations; and
• More than 79,000 jobs supported by the University’s operations, including
approximately 42,000 direct jobs and 37,000 indirect or induced jobs.16
16 “Direct jobs” include 19,157 faculty and staff; 8,866 fellows and student employees; 6,279 graduate assistants, post-‐docs, and residents; and 8,017 employees of University of Minnesota Medical Center– Fairview/University of Minnesota Physicians.

Financing the Future: Advancing Excellence Through Cost Reductions and Productivity
Page 56
In fact, the University’s research enterprise alone, with $823M in competitive sponsored
research funding, generates $1.5B in economic impact and 16,193 jobs in Minnesota.
And none of this impact take into account the University’s most important mission
outcome: its graduates. The University of Minnesota generates approximately 14,000
degrees per year, and most of its alumni go on to be productive workers, leaders, and
employers in Minnesota. In fact, according to Tripp Umbach’s projections and analysis,
the University’s graduating class of 2010 will have an $8.9B impact in future increased
earnings in Minnesota. More detailed information and analysis is available online at
impact.umn.edu.

Financing the Future: Advancing Excellence Through Cost Reductions and Productivity
Page 57
Key Conclusions
The stated goal of strategic positioning is to become one of the top three public research universities in the world while achieving an equivalent standard of excellence for our coordinate campuses. The four pillars of strategic positioning support the weight of this mission, so that if any one pillar crumbles, the entire structure is diminished. Nor can we strengthen any one pillar at the expense of the others. Our 35 task forces were not formed and charged in isolation; all of the parts work together to move the entire University system forward. We must continue to set aggressive goals in critical areas of responsibility and to measure what we value.
– Transforming the U for the 21st Century (September 2007)
Over the past decade, the University of Minnesota has shown steady improvement
across a wide range of key measures, despite a minimal increase in non-‐capital state
investment during that time (Figure 10).17
Figure 10: Change in Key Measures, FY2001-‐10
17 None of the dollar amounts in this figure are adjusted for inflation.

Financing the Future: Advancing Excellence Through Cost Reductions and Productivity
Page 58
Since fiscal year 2001 (July 2000 through June 2001), our state funding has increased
just 3.2 percent (red bar) or 0.3 percent per year. During that same time:
• full-‐year equivalent (FYE) student enrollment has increased 19.6 percent, or
nearly 2 percent per year;
• degrees granted have increased by 34.4 percent or 3.4 percent;
• sponsored research funding has grown by 60.5 percent, or more than 6 percent
per year; and
• the average net price undergraduates pay to attend the Twin Cities campus has
increased just 3.4 percent per year (34.4 percent total).
Clearly, the University of Minnesota has been extraordinarily productive in delivering on
its mission during a time of essentially flat state funding. Furthermore, it has achieved
this productivity with minimal growth in the University’s workforce.
“Per Capita” Productivity
According to the Office of Planning and Analysis, from FY01 through FY10, the
University’s total employee headcount is up 6.9 percent, or just 0.7 percent per year.18
During that same period, the level of state appropriation per employee has decreased
0.9 percent, and state dollars per full-‐year equivalent (FYE) student are down 11.5
percent. Meanwhile:
• FYE students per employee are up 11.9 percent;
• Degrees produced per employee are up 31.8 percent; and
• Sponsored research funding per employee is up 50.2 percent.
18 These numbers do not include the full impact of the University’s state funding reductions through the current year (FY11). Using the decade FY02 through FY11, employee headcount increased just 3.6%, or 0.4% per year.

Financing the Future: Advancing Excellence Through Cost Reductions and Productivity
Page 59
Again, all of this has been achieved on an additional 0.3 percent per year in state
appropriations for the past decade. The University of Minnesota has done an
extraordinary job of controlling costs, increasing productivity, growing revenue, and
improving results for students and the state—and it is making steady progress with
regard to the recommendations of the Future Financial Resources Task Force:
• The University is growing tuition revenue. Tuition rates have increased, but in
addition:
– FYE system enrollment is up 12,422 since FY00 (greater than the total
enrollment at UMD); and
– The University is producing nearly 3,500 more degrees per year
compared to FY00.
• The University is maintaining affordable access for students:
– Net price for Twin Cities undergraduates has increased an average of 3.4
percent per year over 10 years, and some years, has actually decreased;
and
– In FY10, more than $1B in aid was provided to students, residents, and
postdocs in the form of scholarships, fellowships, loans, employment,
etc. (from all funding sources).
• The University is growing sponsored research funding, successfully competing
for $823M last year. Total research expenditures have increased 41 percent
since 2004.
• The University is growing private support, raising 1.1B in the past 10 years, with
record annual totals, transformational gifts, and unprecedented giving levels—
and targeted plans in place to maintain this momentum.
• The University is creatively leveraging existing resources, working on multiple
other strategies to grow revenue, including expanding e-‐learning and developing
important long-‐term assets at UMore Park.
Financing the Future: Advancing Excellence Through Cost Reductions and Productivity
Page 60
But perhaps most significantly for the purposes of this report:
• The University is addressing costs and efficiency, driving hundreds of millions of
dollars of cost out of the University in the past several years by targeting major
cost drivers and encouraging strategic prioritization and creative cost
management at the unit level.
• The University is approaching the mission strategically by investing where
appropriate and cutting where necessary, and undertaking a case-‐by-‐case review
and analysis of priorities and impact with no across-‐the-‐board reductions.
Concluding Comments
The University of Minnesota has a multi-‐faceted and strategic approach to short-‐
and long-‐term financial planning that has resulted in a balanced budget for the past
eight years despite deep cuts in state support; that has minimized involuntary job
losses; that has enabled us to open a new, highly acclaimed campus in Rochester at
the state’s request; and that has resulted in most if not all key indicators trending
upward. The University’s responsibility to be a good steward of its resources
continues, and as an organization, it can always do more. The long-‐term benefits of
these strategies and initiatives will continue to be realized in the coming months and
years, and longer-‐term strategies will continue to develop and expand. With strong
support from the Board of Regents; the University’s senior leadership, faculty, staff,
and students; alumni, donors, and advocates; and Minnesota and its citizens, the
University will continue to improve academic quality and productivity and deliver on
its unique mission as the state’s only comprehensive research and land-‐grant
university system.

Financing the Future: Advancing Excellence Through Cost Reductions and Productivity
Page 61
Appendix: Performance Framework Key Measures19
19 These key measures were presented to the Board of Regents as part of the University’s performance framework in November 2010.

Financing the Future: Advancing Excellence Through Cost Reductions and Productivity
Page 62

Financing the Future: Advancing Excellence Through Cost Reductions and Productivity
Page 63

Financing the Future: Advancing Excellence Through Cost Reductions and Productivity
Page 64


