37
JUNTA GENERAL ACCIONISTAS 2016 Madrid, 6 de abril de 2016

JUNTA GENERALACCIONISTAS 2016
Madrid, 6 de abril de 2016
This presentation has been prepared by MERLIN Properties SOCIMI, S.A. (the “Company”) for informational use only.
The information contained in this presentation does not purport to be comprehensive or to contain all the information that a prospective purchaser of securities of the Company may desire or require in deciding whether or not to purchase such securities. The information contained in this document is subject to change, verification and completion without notice. Neither the Company nor any of affiliates, advisors or agents makes any representation or warranty, express or implied, as to the accuracy or completeness of any information contained or referred to in this document. Each of the Company and its affiliates, advisors or agents expressly disclaims any and all liabilities which may be based on this document, the information contained or referred to therein, any errors therein or omissions therefrom. Neither the Company, nor any of its affiliates, advisors or agents undertakes any obligation to provide the recipients with access to additional information or to update this document or to correct any inaccuracies in the information contained or referred to therein.
Certain statements in this document regarding the market and competitive position data may be based on the internal analyses of the Company, which involve
certain assumptions and estimates. These internal analyses may have not been verified by any independent sources and there can be no assurance that the assumptions or estimates are accurate. Accordingly, undue reliance should not be placed on any of the industry, market or competitive position data contained in this presentation. Additionally, certain information contained herein may be based on management accounts and estimates of the Company and may have not been audited or reviewed by the Company’s auditors. Recipients should not place undue reliance on this information. The financial information included herein may have not been reviewed for accuracy or completeness and, as such, should not be relied upon.
This information is provided to the recipients for informational purposes only and recipients must undertake their own investigation of the Company. The information providing herein is not to be relied upon in substitution for the recipient’s own exercise of independent judgment with regard to the operations, financial condition and prospects of the Company.
The distribution of this presentation in some jurisdictions may also be restricted by law and persons into whose possession this presentation comes should inform themselves about and observe any such restrictions. The securities of the Company have not been
and, should there be an offering, will not be registered under the U.S. Securities Act of 1933, as amended (the “Securities Act”), or the U.S. Investment Company Act of 1940, as amended (the “Investment Company Act”). Such securities may not be offered or sold in the United States except on a limited basis, if at all, to Qualified Institutional Buyers (as defined in Rule 144A under the Securities Act) in reliance on Rule 144A or another exemption from, or transaction not subject to, the registration requirements of the Securities Act. The securities of the Company have not been and, should there be an offering, will not be registered under the applicable securities laws of any state or jurisdiction of Canada or Japan and, subject to certain exceptions, may not be offered or sold within Canada or Japan or to or for the benefit of any national, resident or citizen of Canada or Japan.
THIS PRESENTATION DOES NOT CONSTITUTE OR FORM PART OF ANY OFFER FOR SALE OR SOLICITATION OF ANY OFFER TO BUY ANY SECURITIES NOR SHALL IT OR ANY PART OF IT FORM THE BASIS OF OR BE RELIED ON IN CONNECTION WITH ANY CONTRACT OR COMMITMENT TO PURCHASE SHARES. ANY DECISION TO PURCHASE SHARES IN ANY OFFERING SHOULD BE MADE SOLELY ON THE BASIS OF PUBLICLY AVAILABLE INFORMATION ON THE COMPANY.
This presentation may include forward-looking statements. All statements other than statements of historical facts included in this presentation, including, without limitation, those regarding the financial position, business strategy, management plans and objectives for future operations of the Company are forward-looking statements. These forward-looking statements involve known and unknown risks, uncertainties and other factors, which may cause such actual results, performance or achievements, or industry results, to be materially different from those expressed or implied by these forward-looking statements. These forward-looking statements are based on numerous assumptions regarding the present and future business strategies of the Company and the environment in which they expect to operate in the future.
Forward-looking statements speak only as of the date of this presentation and the Company expressly disclaim any obligation or undertaking to release any update of, or revisions to, any forward-looking statements in this presentation, any change in their expectations or any change in events, conditions or circumstances on which these forward-looking statements are based.
In reviewing this presentation, the recipient is agreeing to, and accepting, the foregoing restrictions and limitations.
DISCLAIMER
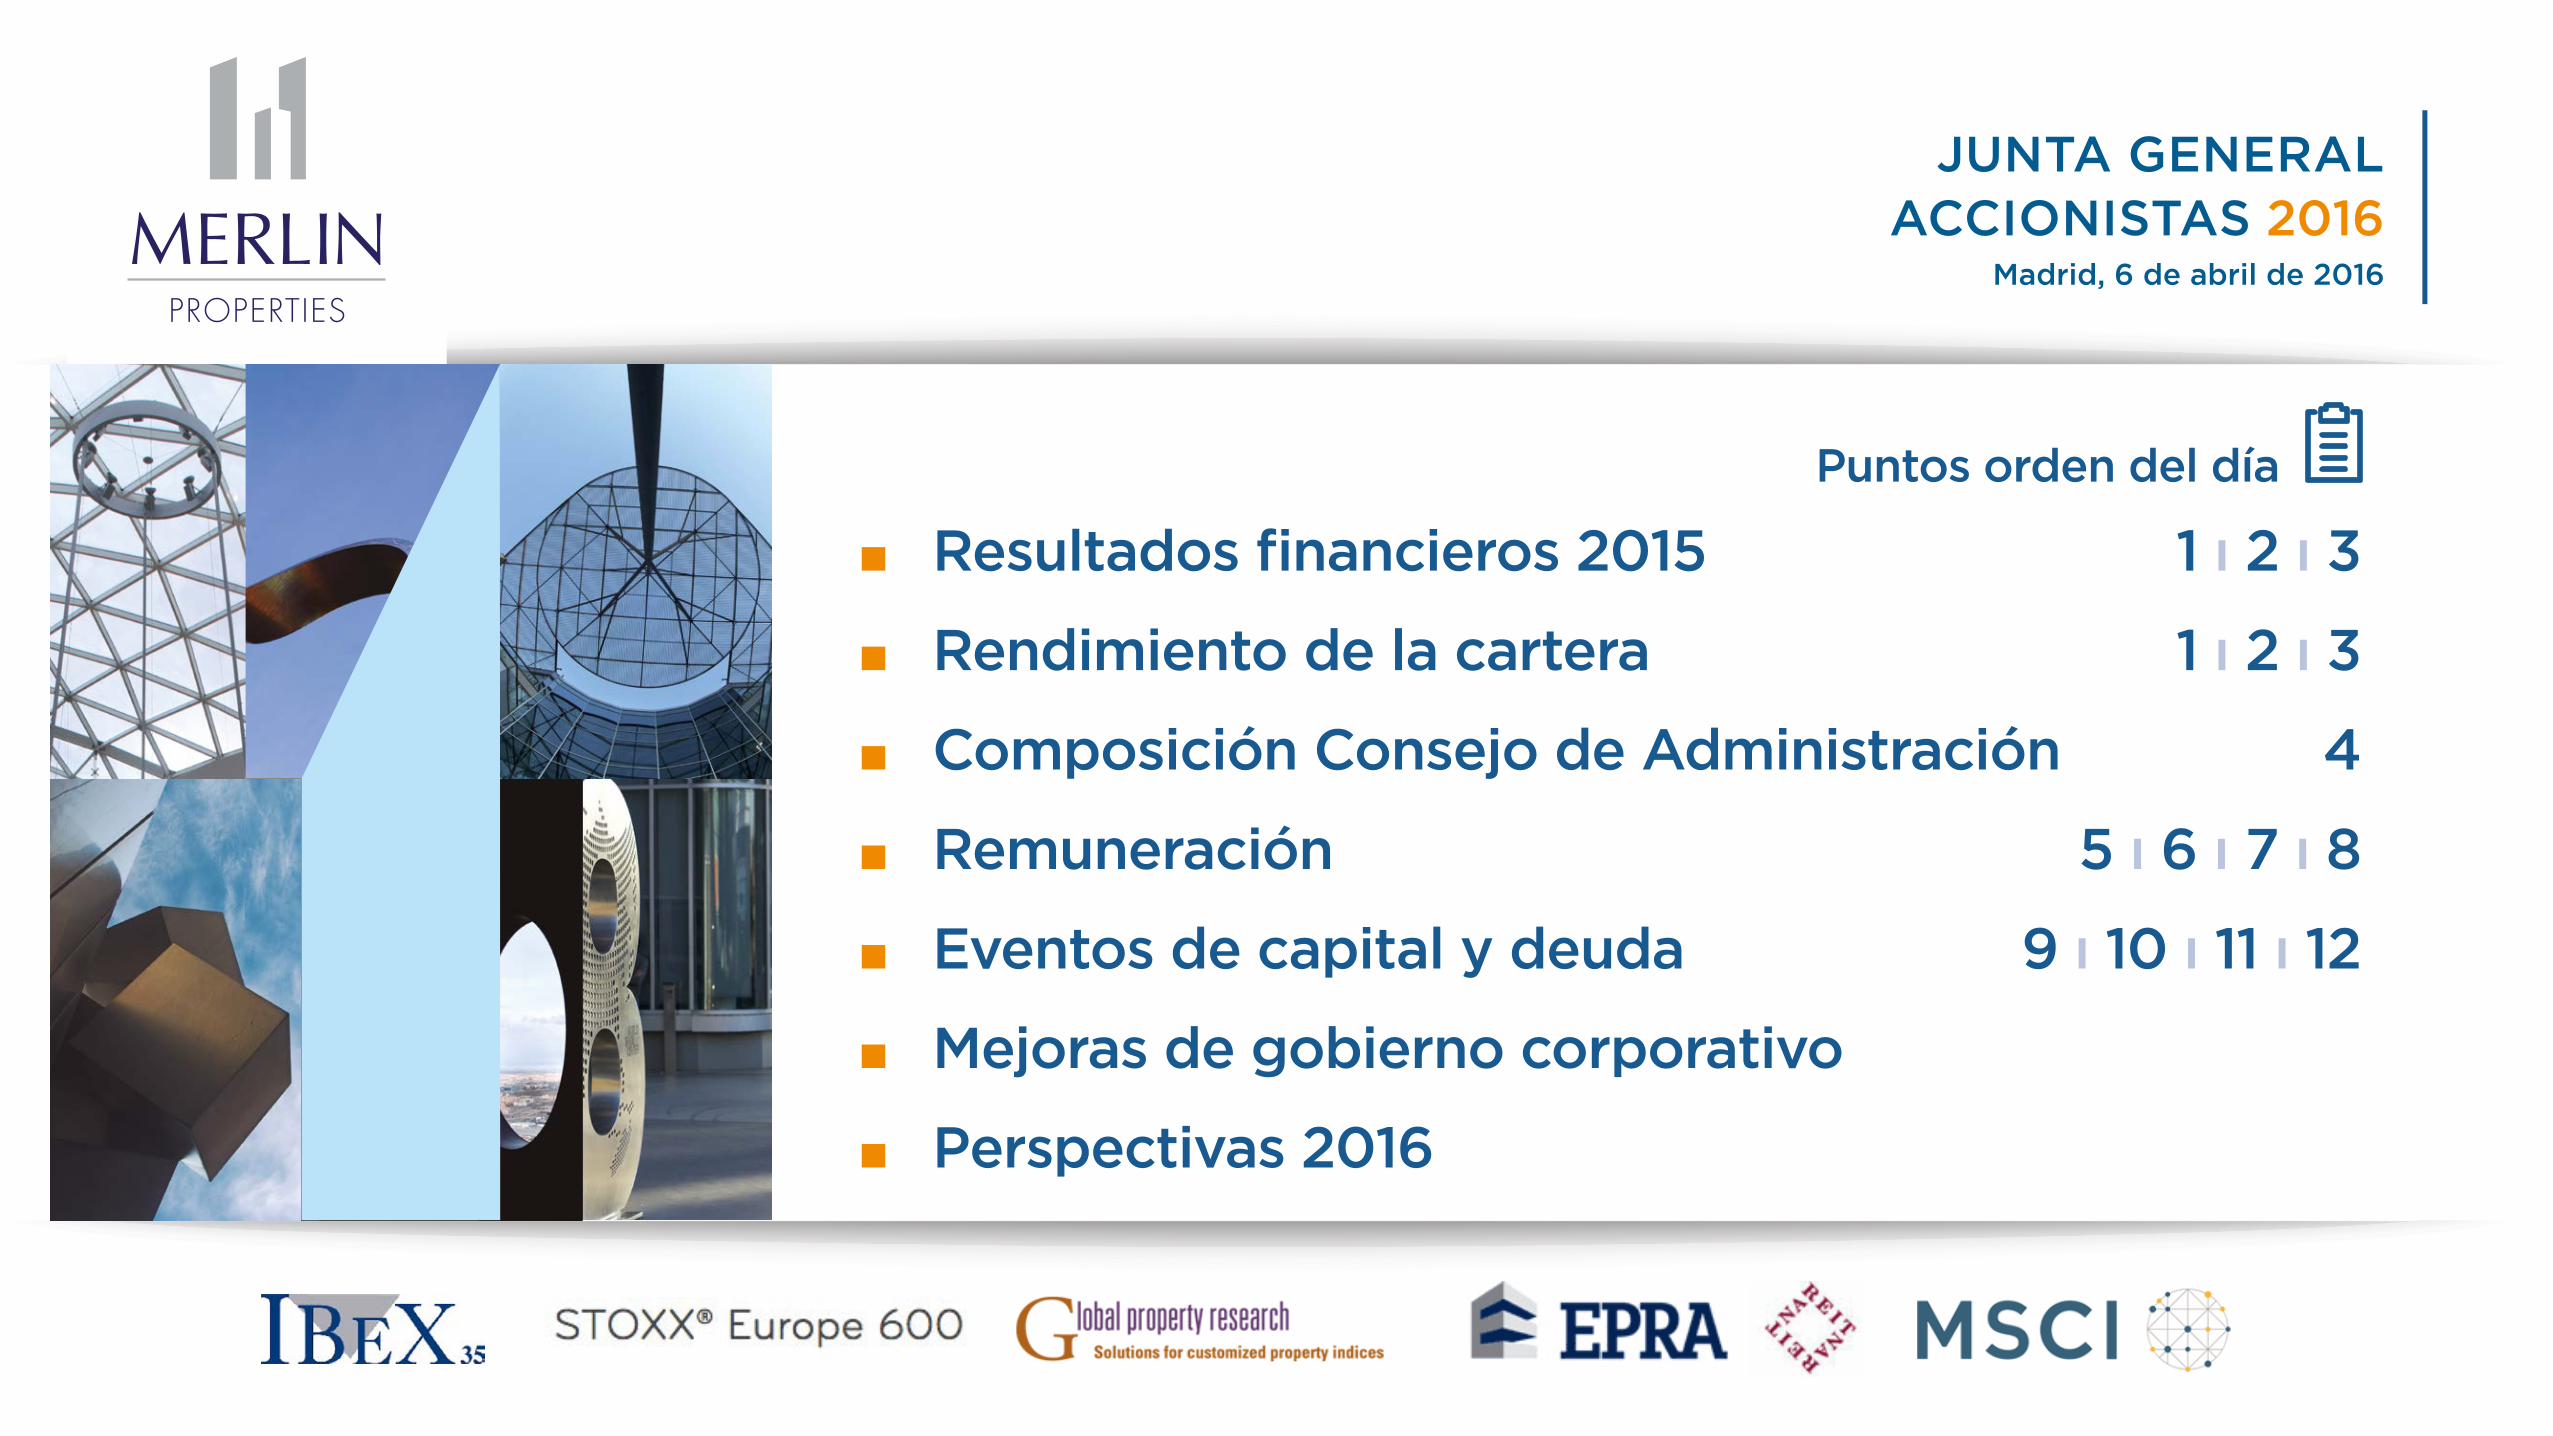
Resultados financieros 2015 1 ı 2 ı 3
Rendimiento de la cartera 1 ı 2 ı 3
Composición Consejo de Administración 4
Remuneración 5 ı 6 ı 7 ı 8
Eventos de capital y deuda 9 ı 10 ı 11 ı 12
Mejoras de gobierno corporativo
Perspectivas 2016
Puntos orden del día
JUNTA GENERALACCIONISTAS 2016
Madrid, 6 de abril de 2016
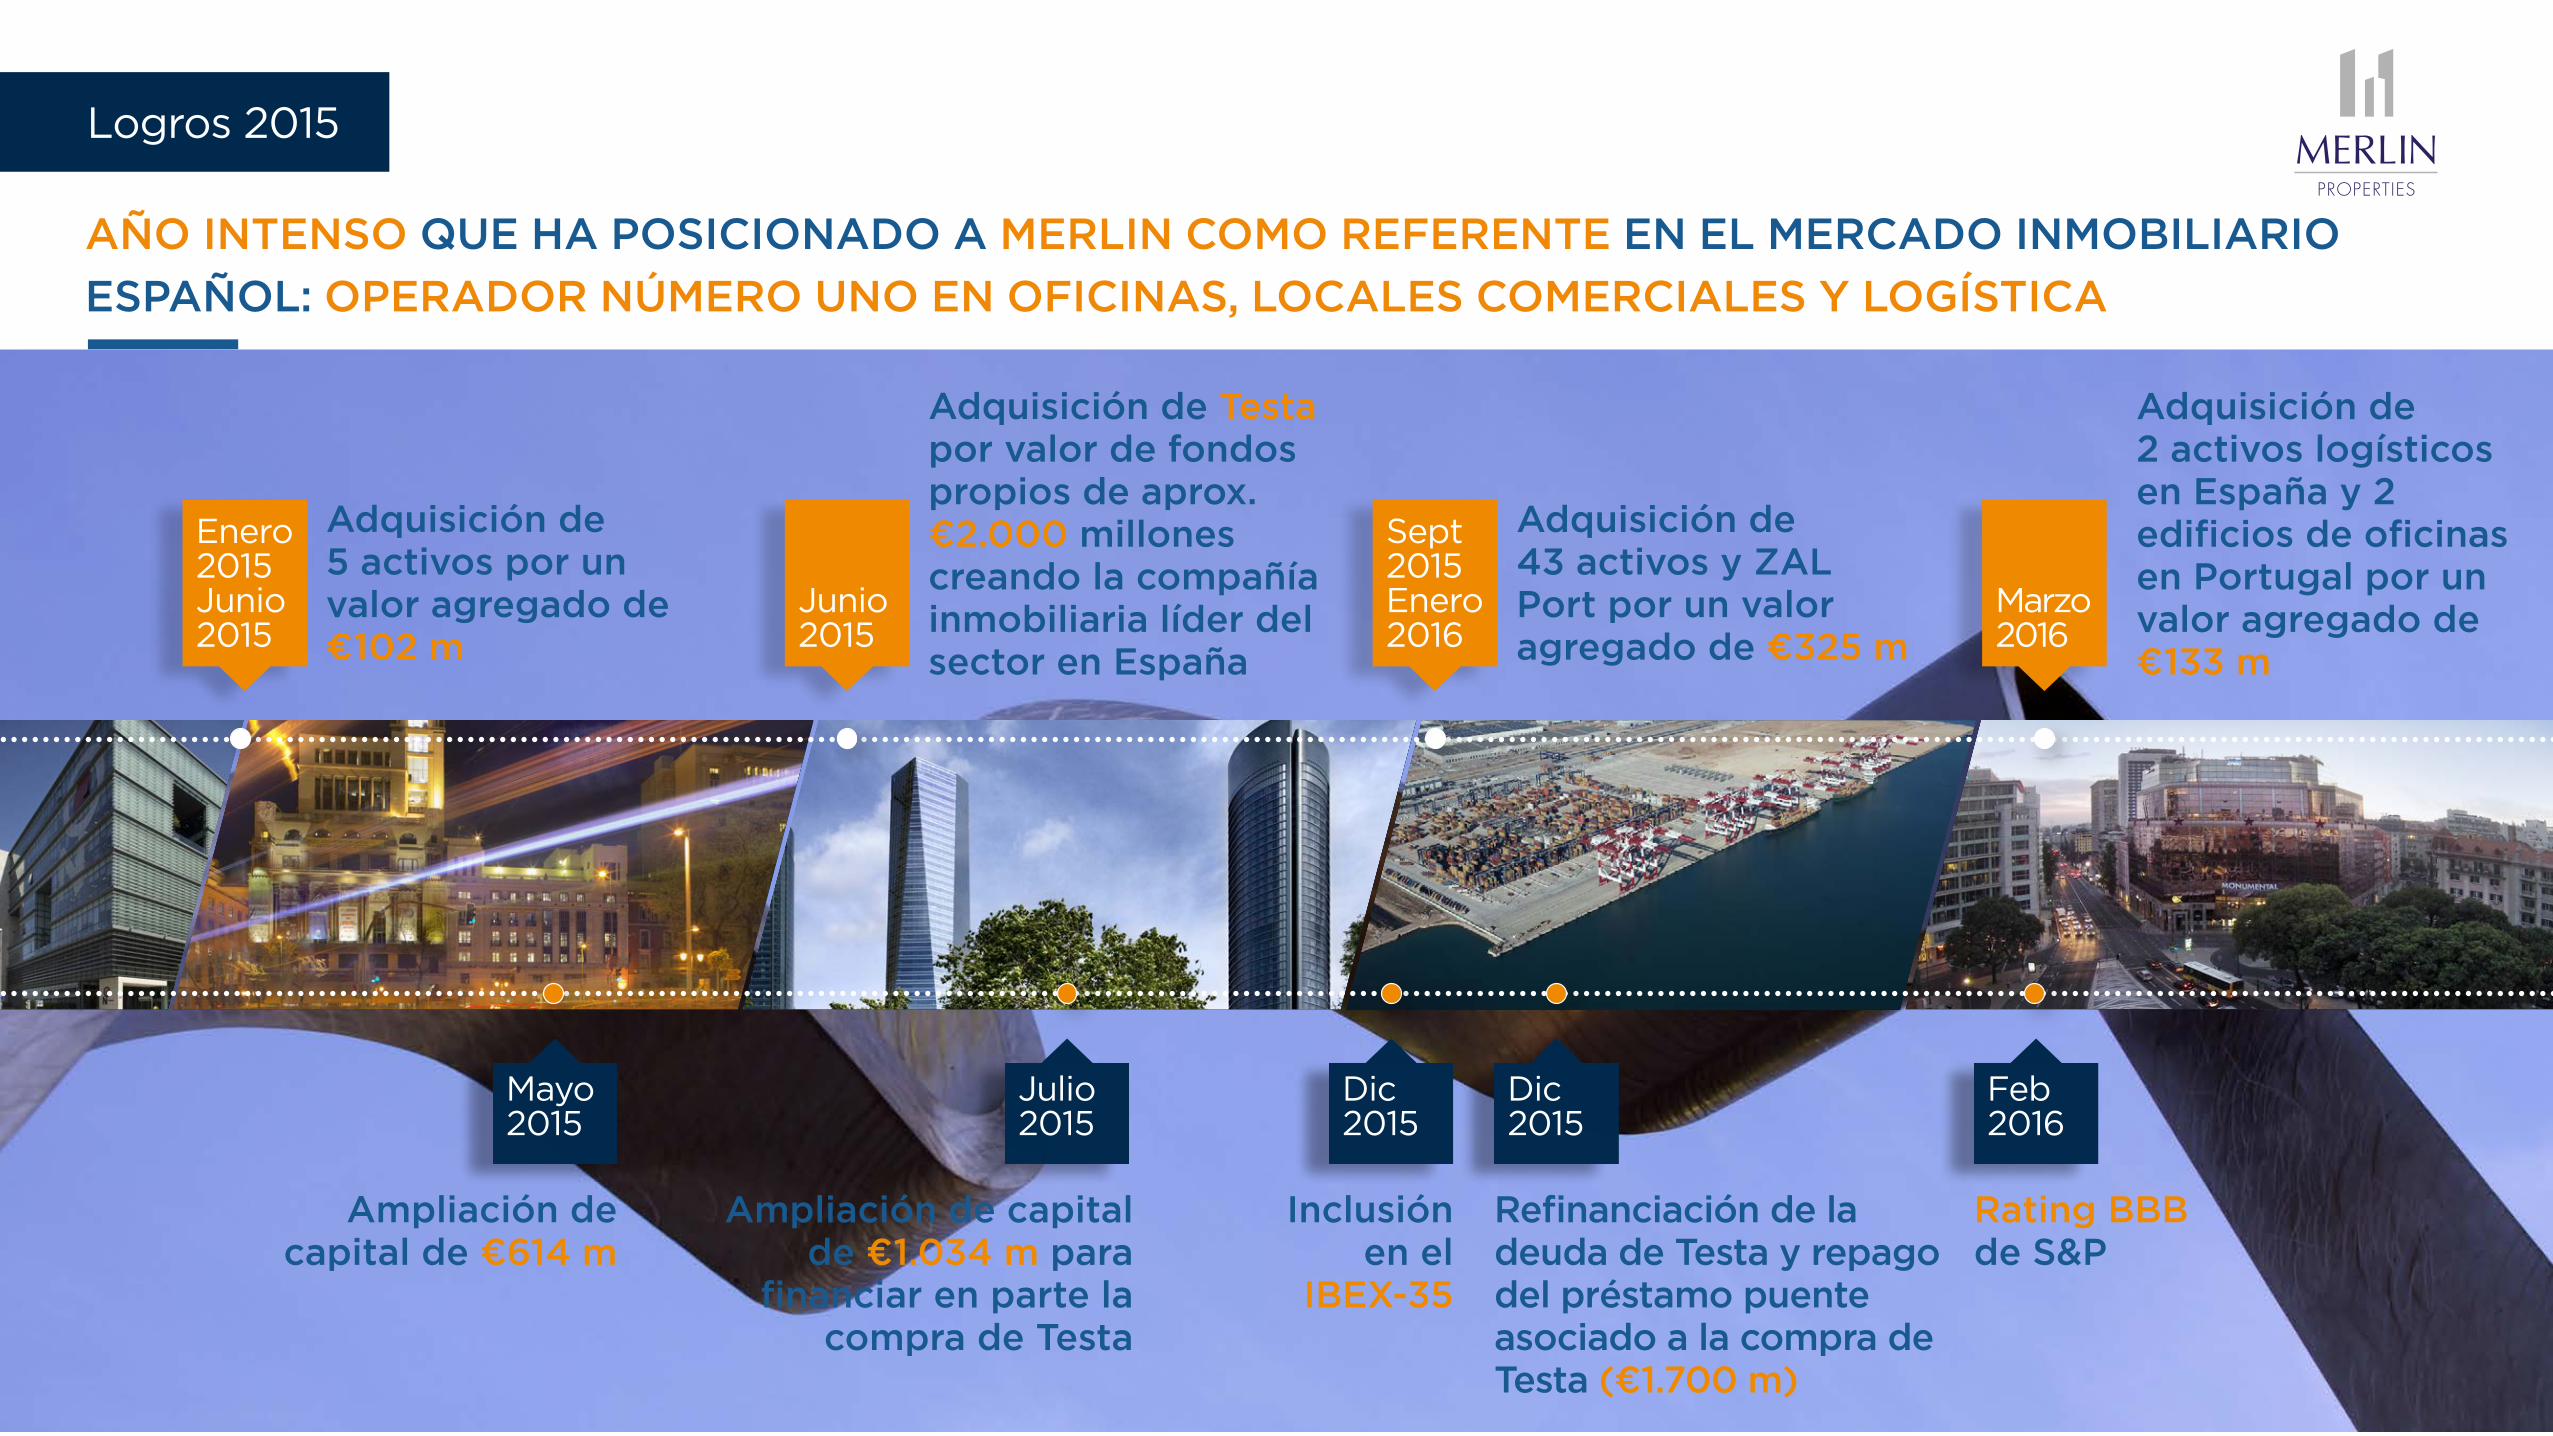
Logros 2015
AÑO INTENSO QUE HA POSICIONADO A MERLIN COMO REFERENTE EN EL MERCADO INMOBILIARIO
ESPAÑOL: OPERADOR NÚMERO UNO EN OFICINAS, LOCALES COMERCIALES Y LOGÍSTICA
Adquisición de 5 activos por un valor agregado de €102 m
Adquisición de Testa por valor de fondos propios de aprox. €2.000 millones creando la compañía inmobiliaria líder del sector en España
Adquisición de 43 activos y ZAL Port por un valor agregado de €325 m
Adquisición de 2 activos logísticos en España y 2 edificios de oficinas en Portugal por un valor agregado de €133 m
Enero 2015 Junio 2015
Junio 2015
Sept 2015 Enero 2016
Marzo 2016
Mayo 2015
Julio 2015
Dic2015
Dic2015
Feb2016
Ampliación de capital de €614 m
Inclusión en el
IBEX-35
Rating BBB de S&P
Refinanciación de la deuda de Testa y repago del préstamo puente asociado a la compra de Testa (€1.700 m)
Ampliación de capital de €1.034 m para
financiar en parte la compra de Testa
GAV “VALOR BRUTO ACTIVOS”
€ 6.053 m
RENTABILIDAD BRUTA
EPRA
5,3%
RENTAS BRUTAS
2015
€ 214,5 m
EN STOCK
SBA
1.865.487
DEUDA NETA
DIC 15
€ 3.013 m
RENTABILIDAD NETA
EPRA
5,0%
EBITDA RECURRENTE
2015
€ 186,7 m
EN DESARROLLO
SBA
223.024
COSTE DEUDA
SPOT
2,0%
NAV / ACCIÓN
EPRA
9.85
RESULTADOS EPRA
2015
€ 99,3 m
ANUALIZADAS
R. B. ATRIBUIDAS (2)
€ 316,2 m
LTV
DIC 15
49,8%
NAV “VALOR NETO ACTIVOS”
EPRA
€ 3.181 m
FFO RECURRENTE
2015
€ 133,1 m
ANUALIZADAS
RENTAS BRUTAS(1)
€ 301,7 m
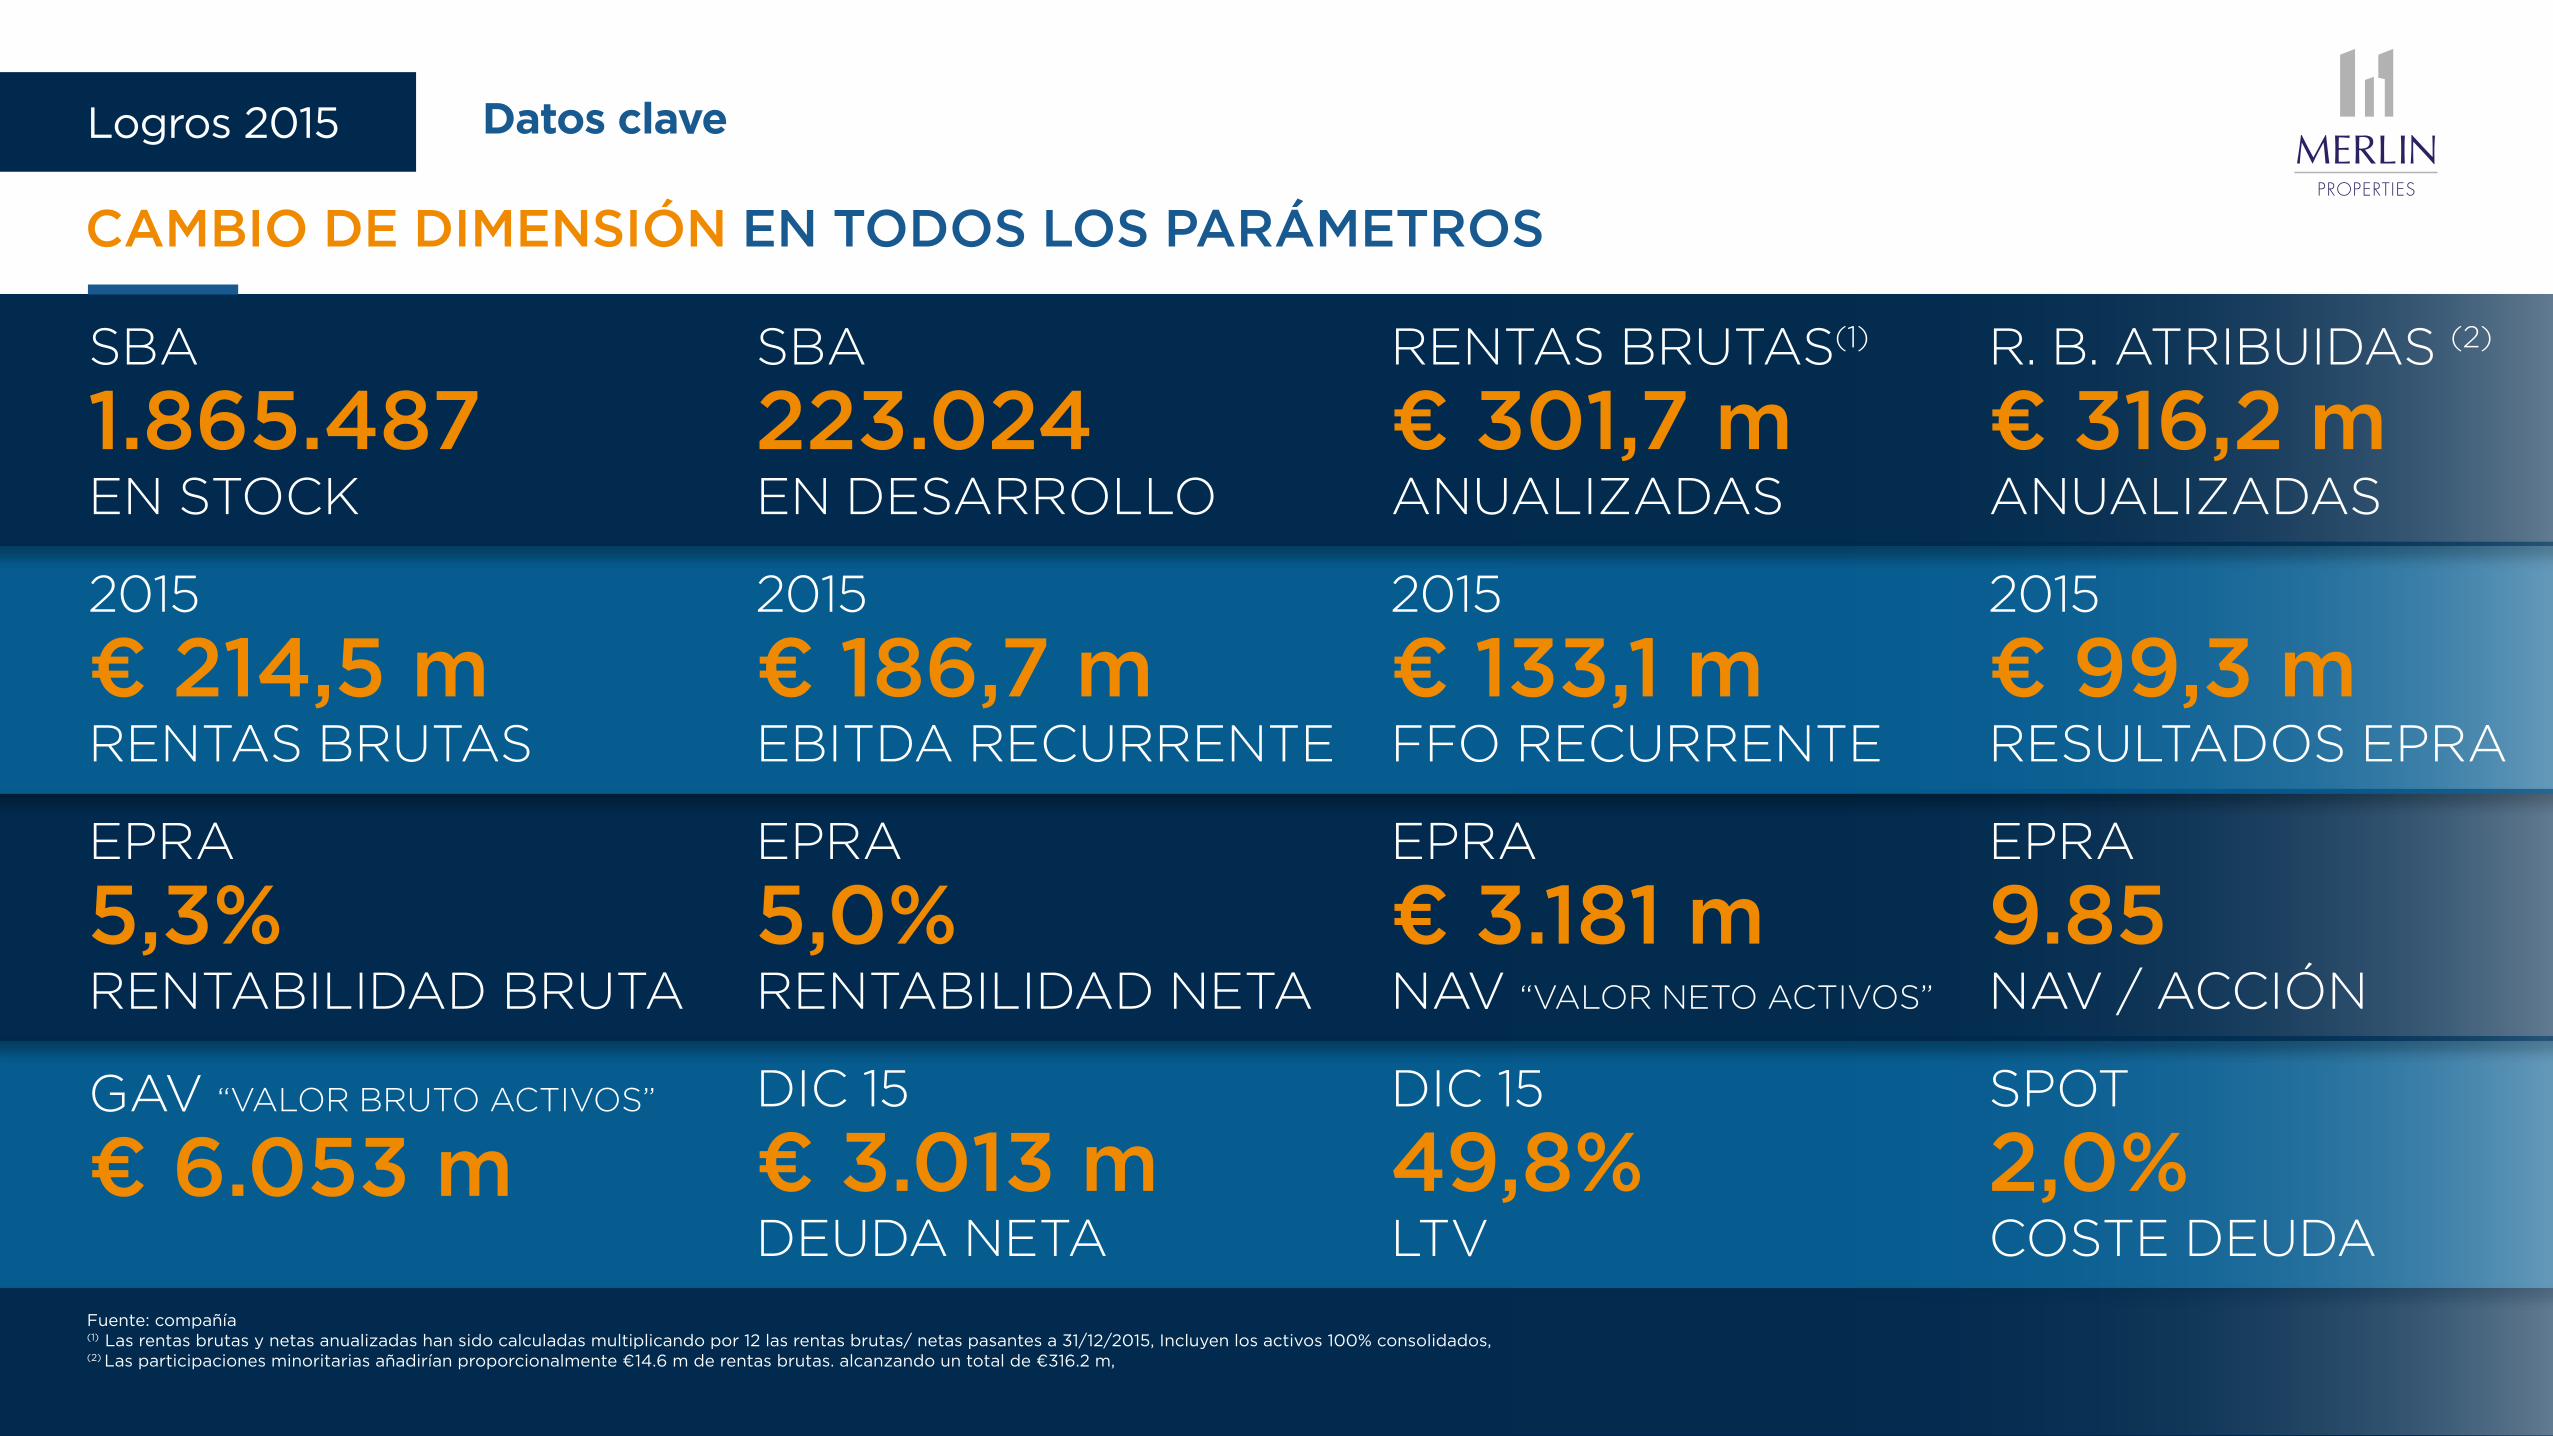
Logros 2015
Fuente: compañía (1) Las rentas brutas y netas anualizadas han sido calculadas multiplicando por 12 las rentas brutas/ netas pasantes a 31/12/2015, Incluyen los activos 100% consolidados, (2) Las participaciones minoritarias añadirían proporcionalmente €14.6 m de rentas brutas. alcanzando un total de €316.2 m,
CAMBIO DE DIMENSIÓN EN TODOS LOS PARÁMETROS
Datos clave

SOLIDEZ EN UN AÑO TRANSFORMACIONAL
RESULTADOS FINANCIEROS 2015
1 ı 2 ı 3Puntos orden del día
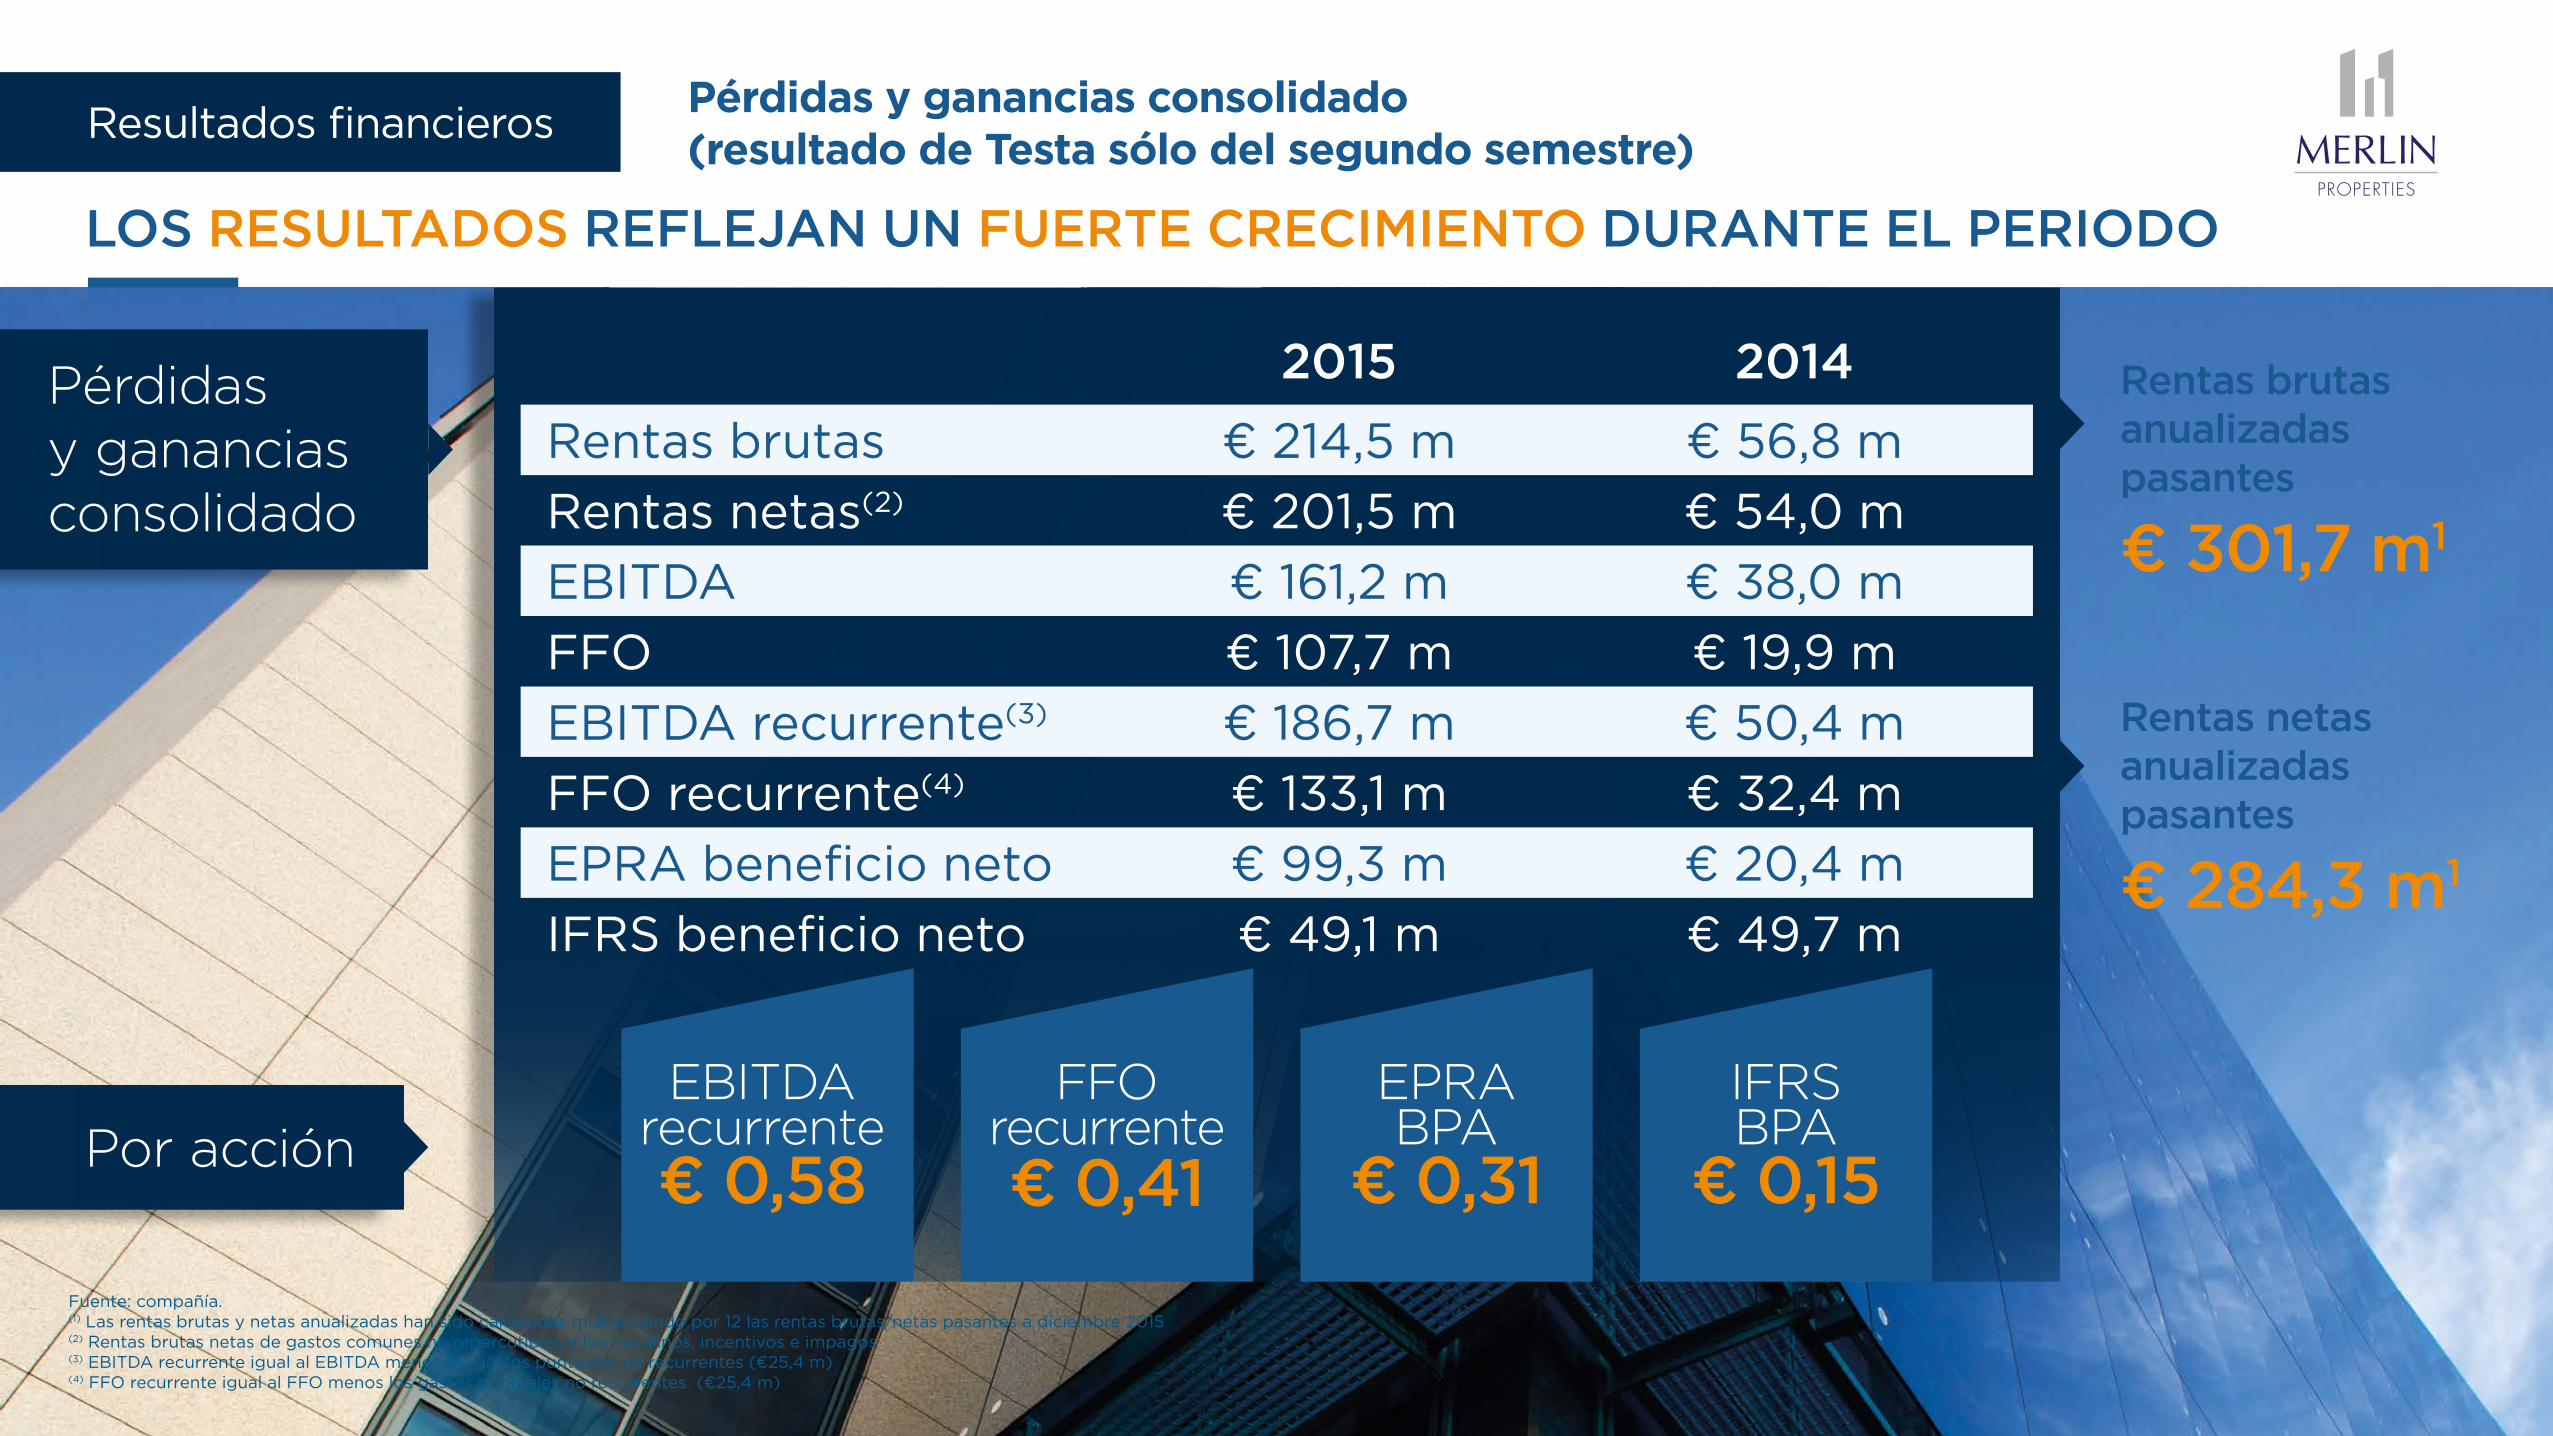
Resultados financierosPérdidas y ganancias consolidado (resultado de Testa sólo del segundo semestre)
LOS RESULTADOS REFLEJAN UN FUERTE CRECIMIENTO DURANTE EL PERIODO
EBITDA recurrente€ 0,58
FFO recurrente€ 0,41
EPRA BPA
€ 0,31
IFRS BPA
€ 0,15
Pérdidas y ganancias consolidado
Rentas brutas anualizadas pasantes
€ 301,7 m1
Rentas netas anualizadas pasantes
€ 284,3 m1
2015 2014
Rentas brutas € 214,5 m € 56,8 m
Rentas netas(2) € 201,5 m € 54,0 m
EBITDA € 161,2 m € 38,0 m
FFO € 107,7 m € 19,9 m
EBITDA recurrente(3) € 186,7 m € 50,4 m
FFO recurrente(4) € 133,1 m € 32,4 m
EPRA beneficio neto € 99,3 m € 20,4 m
IFRS beneficio neto € 49,1 m € 49,7 m
Fuente: compañía. (1) Las rentas brutas y netas anualizadas han sido calculadas multiplicando por 12 las rentas brutas/netas pasantes a diciembre 2015(2) Rentas brutas netas de gastos comunes no repercutibles a los inquilinos, incentivos e impagos(3) EBITDA recurrente igual al EBITDA menos los gastos puntuales no recurrentes (€25,4 m)(4) FFO recurrente igual al FFO menos los gastos puntuales no recurrentes (€25,4 m)
Source: Company. (1) Annualized gross rents and net rents have been calculated as passing gross / net rent as of December 31st, multiplied by 12.(2) Gross rents net of property expenses not recharged to tenants, incentives and collection loss.(3) Recurring EBITDA equals EBITDA less non-recurrent one-off expenses (€ 25.4 m).(4) Recurring FFO equals FFO less non-recurrent one-off expenses (€ 25.4 m).
Por acción
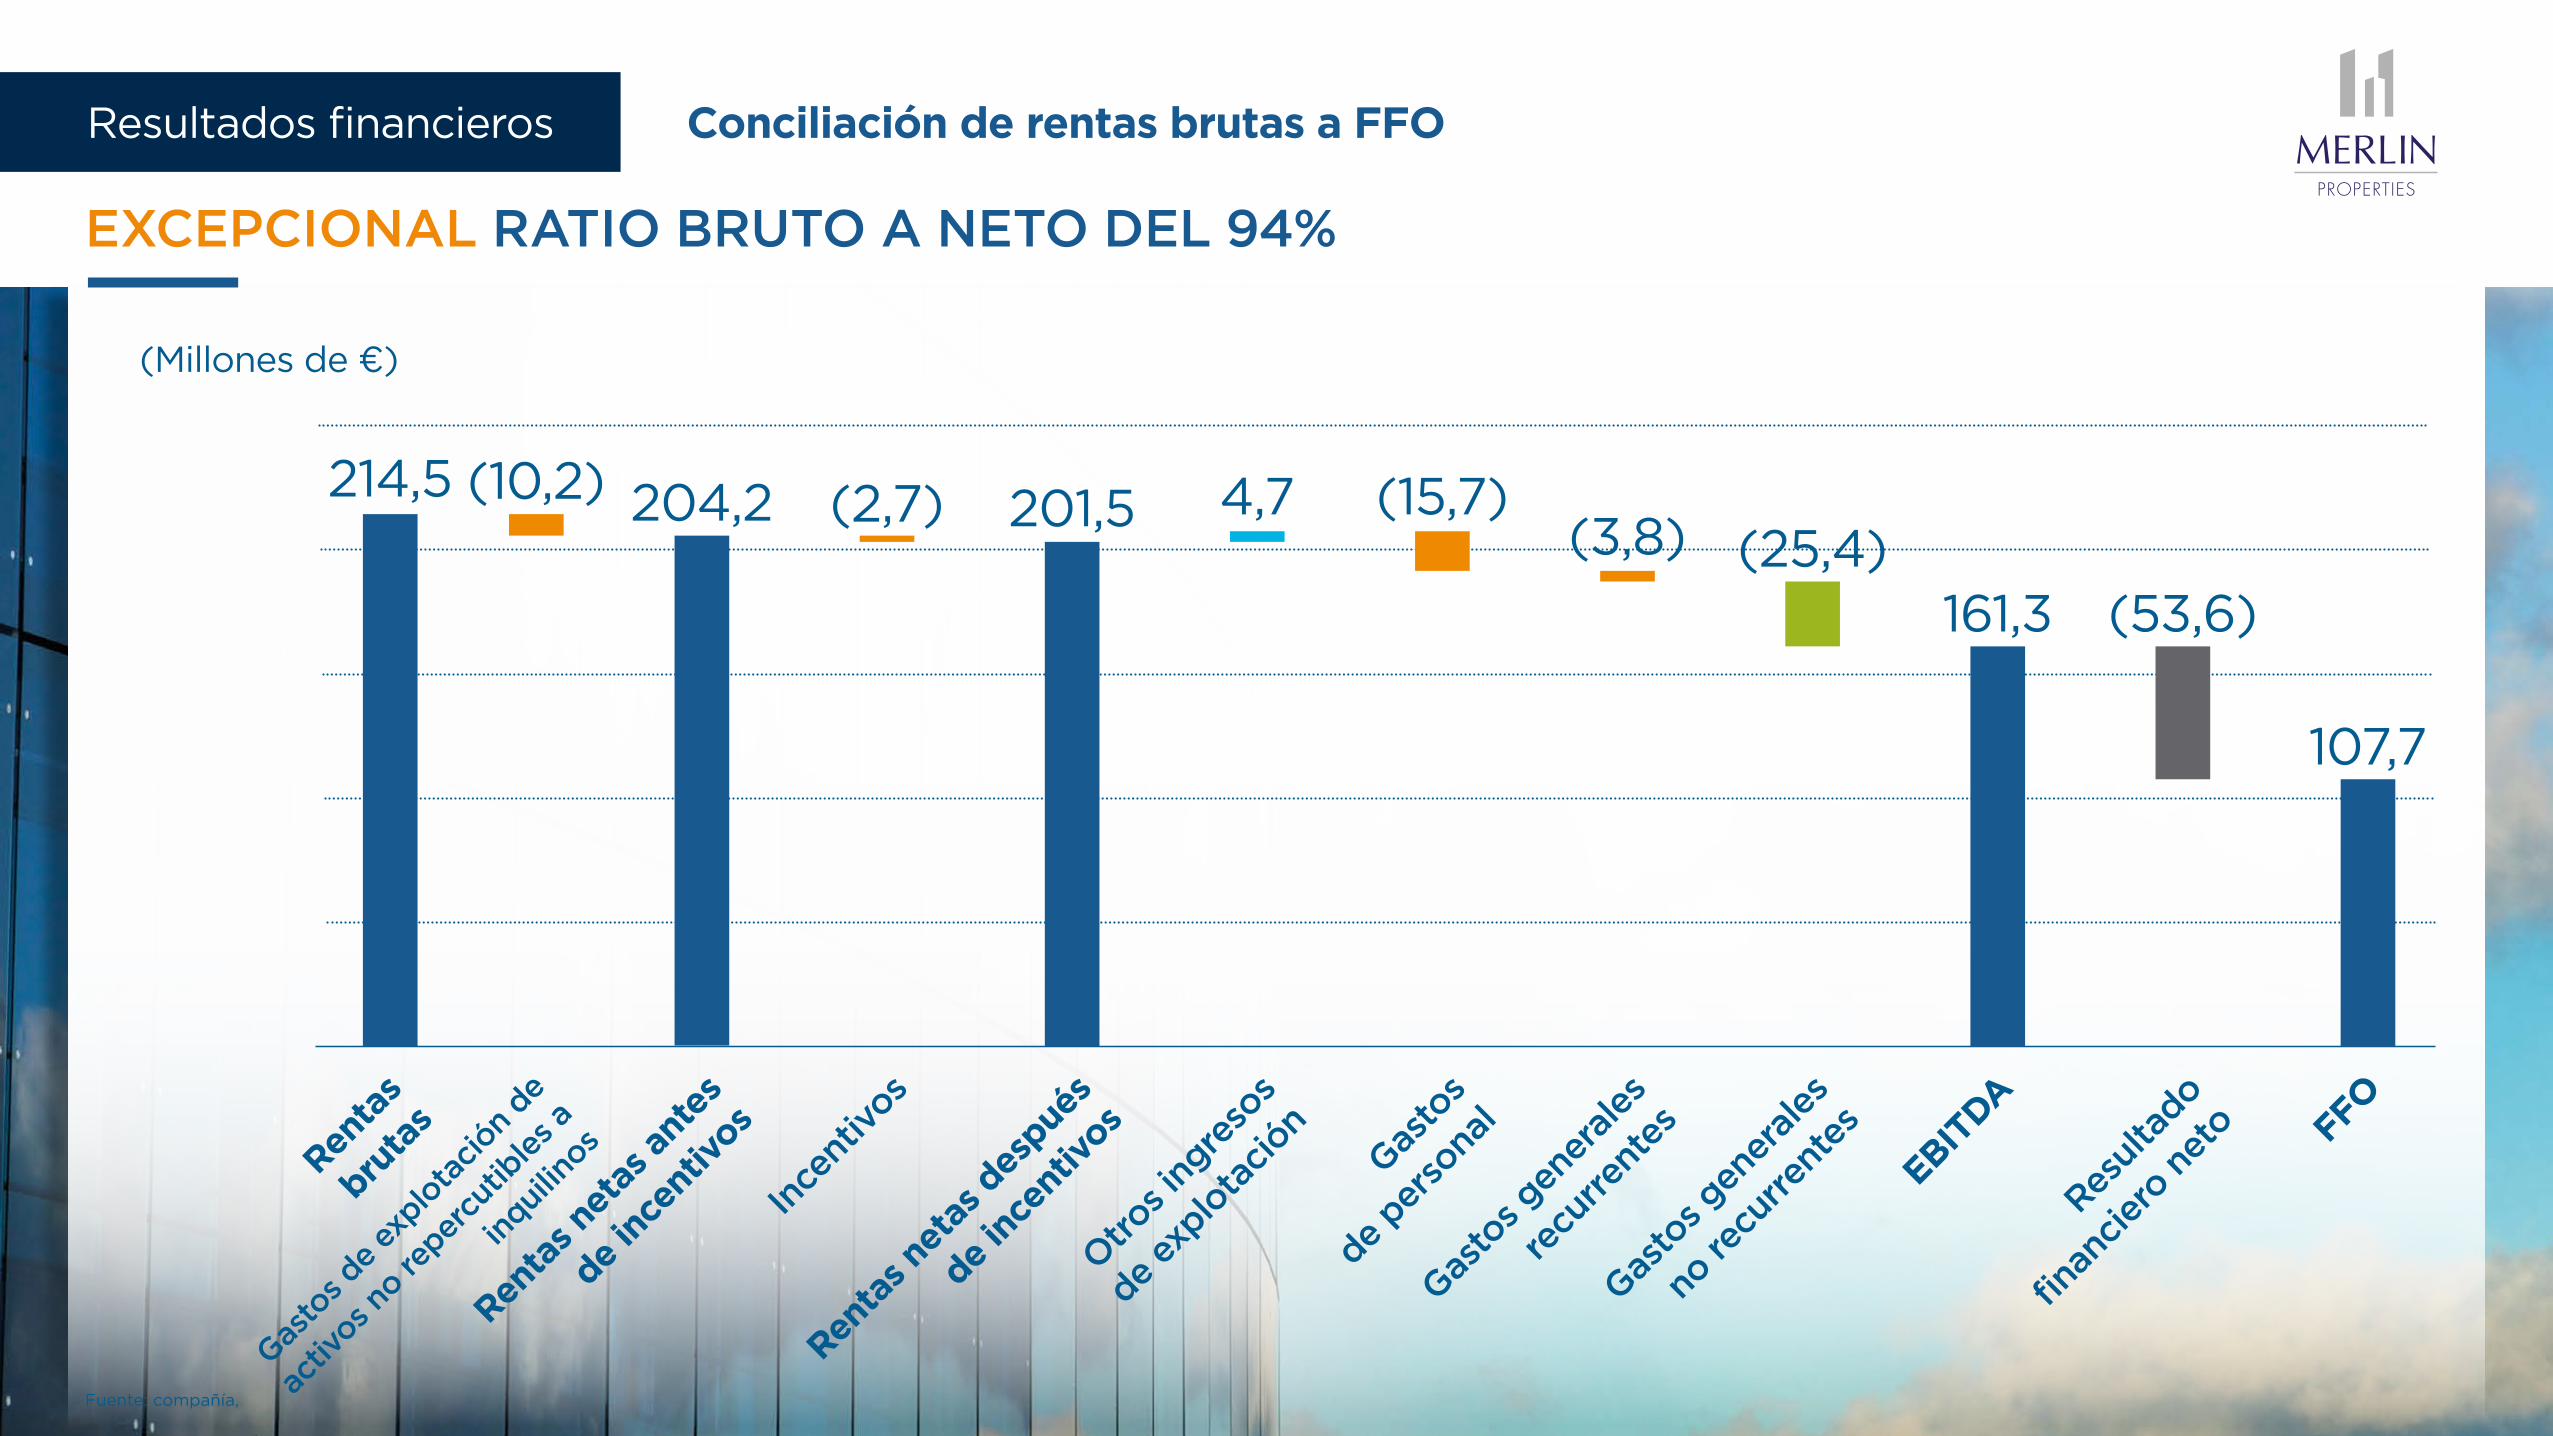
Conciliación de rentas brutas a FFO
EXCEPCIONAL RATIO BRUTO A NETO DEL 94%
Fuente: compañía,
Renta
s
bruta
s
Gas
tos d
e ex
plota
ción
de
activ
os no re
percu
tible
s a
inqui
linos
Renta
s net
as a
ntes
de in
cent
ivos
Ince
ntivos
Gas
tos g
ener
ales
recu
rrent
es
Gas
tos g
ener
ales
no re
curre
ntes
EBITDA
Resul
tado
financ
iero
net
o FFO
Gas
tos
de per
sona
l
Otro
s ing
reso
s
de ex
plota
ción
Renta
s net
as d
espué
s
de in
cent
ivos
(Millones de €)
214,5 (10,2) 204,2 (2,7) 4,7 (15,7)(3,8) (25,4)
161,3 (53,6)
107,7
201,5
Resultados financieros
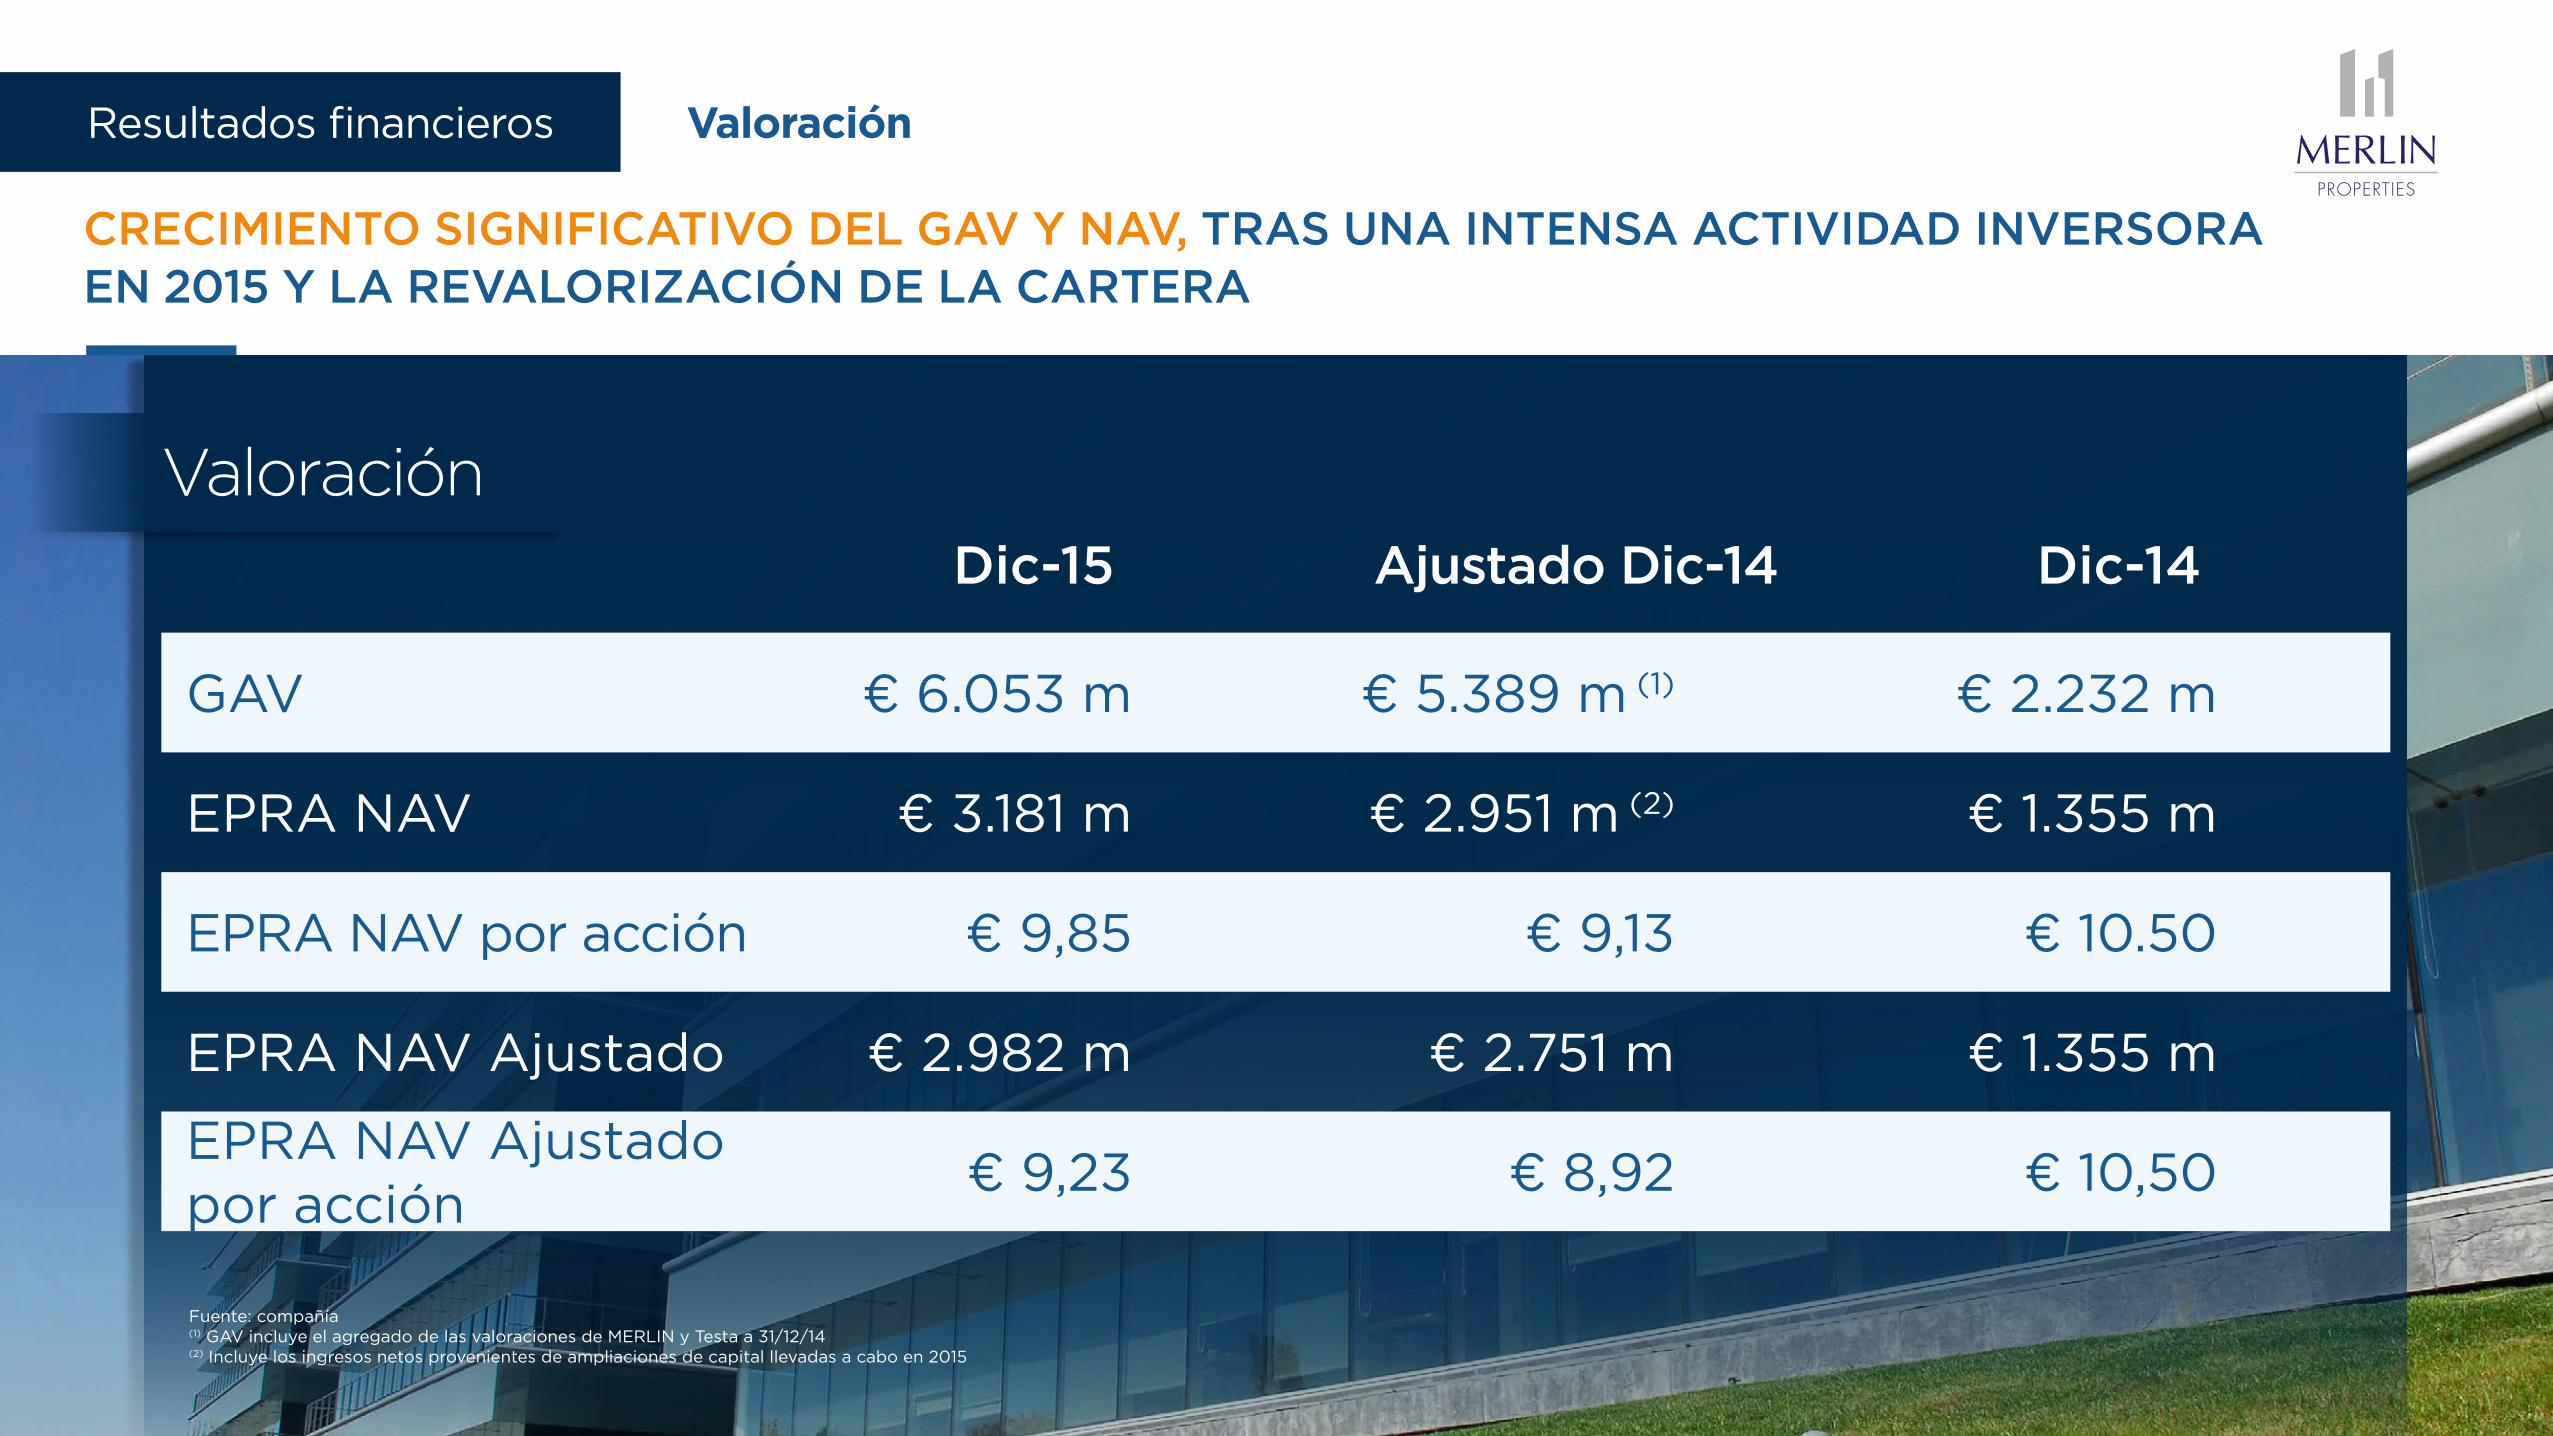
CRECIMIENTO SIGNIFICATIVO DEL GAV Y NAV, TRAS UNA INTENSA ACTIVIDAD INVERSORA EN 2015 Y LA REVALORIZACIÓN DE LA CARTERA
Dic-15 Ajustado Dic-14 Dic-14
GAV € 6.053 m € 5.389 m (1) € 2.232 m
EPRA NAV € 3.181 m € 2.951 m (2) € 1.355 m
EPRA NAV por acción € 9,85 € 9,13 € 10.50
EPRA NAV Ajustado € 2.982 m € 2.751 m € 1.355 m
EPRA NAV Ajustado por acción
€ 9,23 € 8,92 € 10,50
Valoración
Fuente: compañía(1) GAV incluye el agregado de las valoraciones de MERLIN y Testa a 31/12/14(2) Incluye los ingresos netos provenientes de ampliaciones de capital llevadas a cabo en 2015
ValoraciónResultados financieros
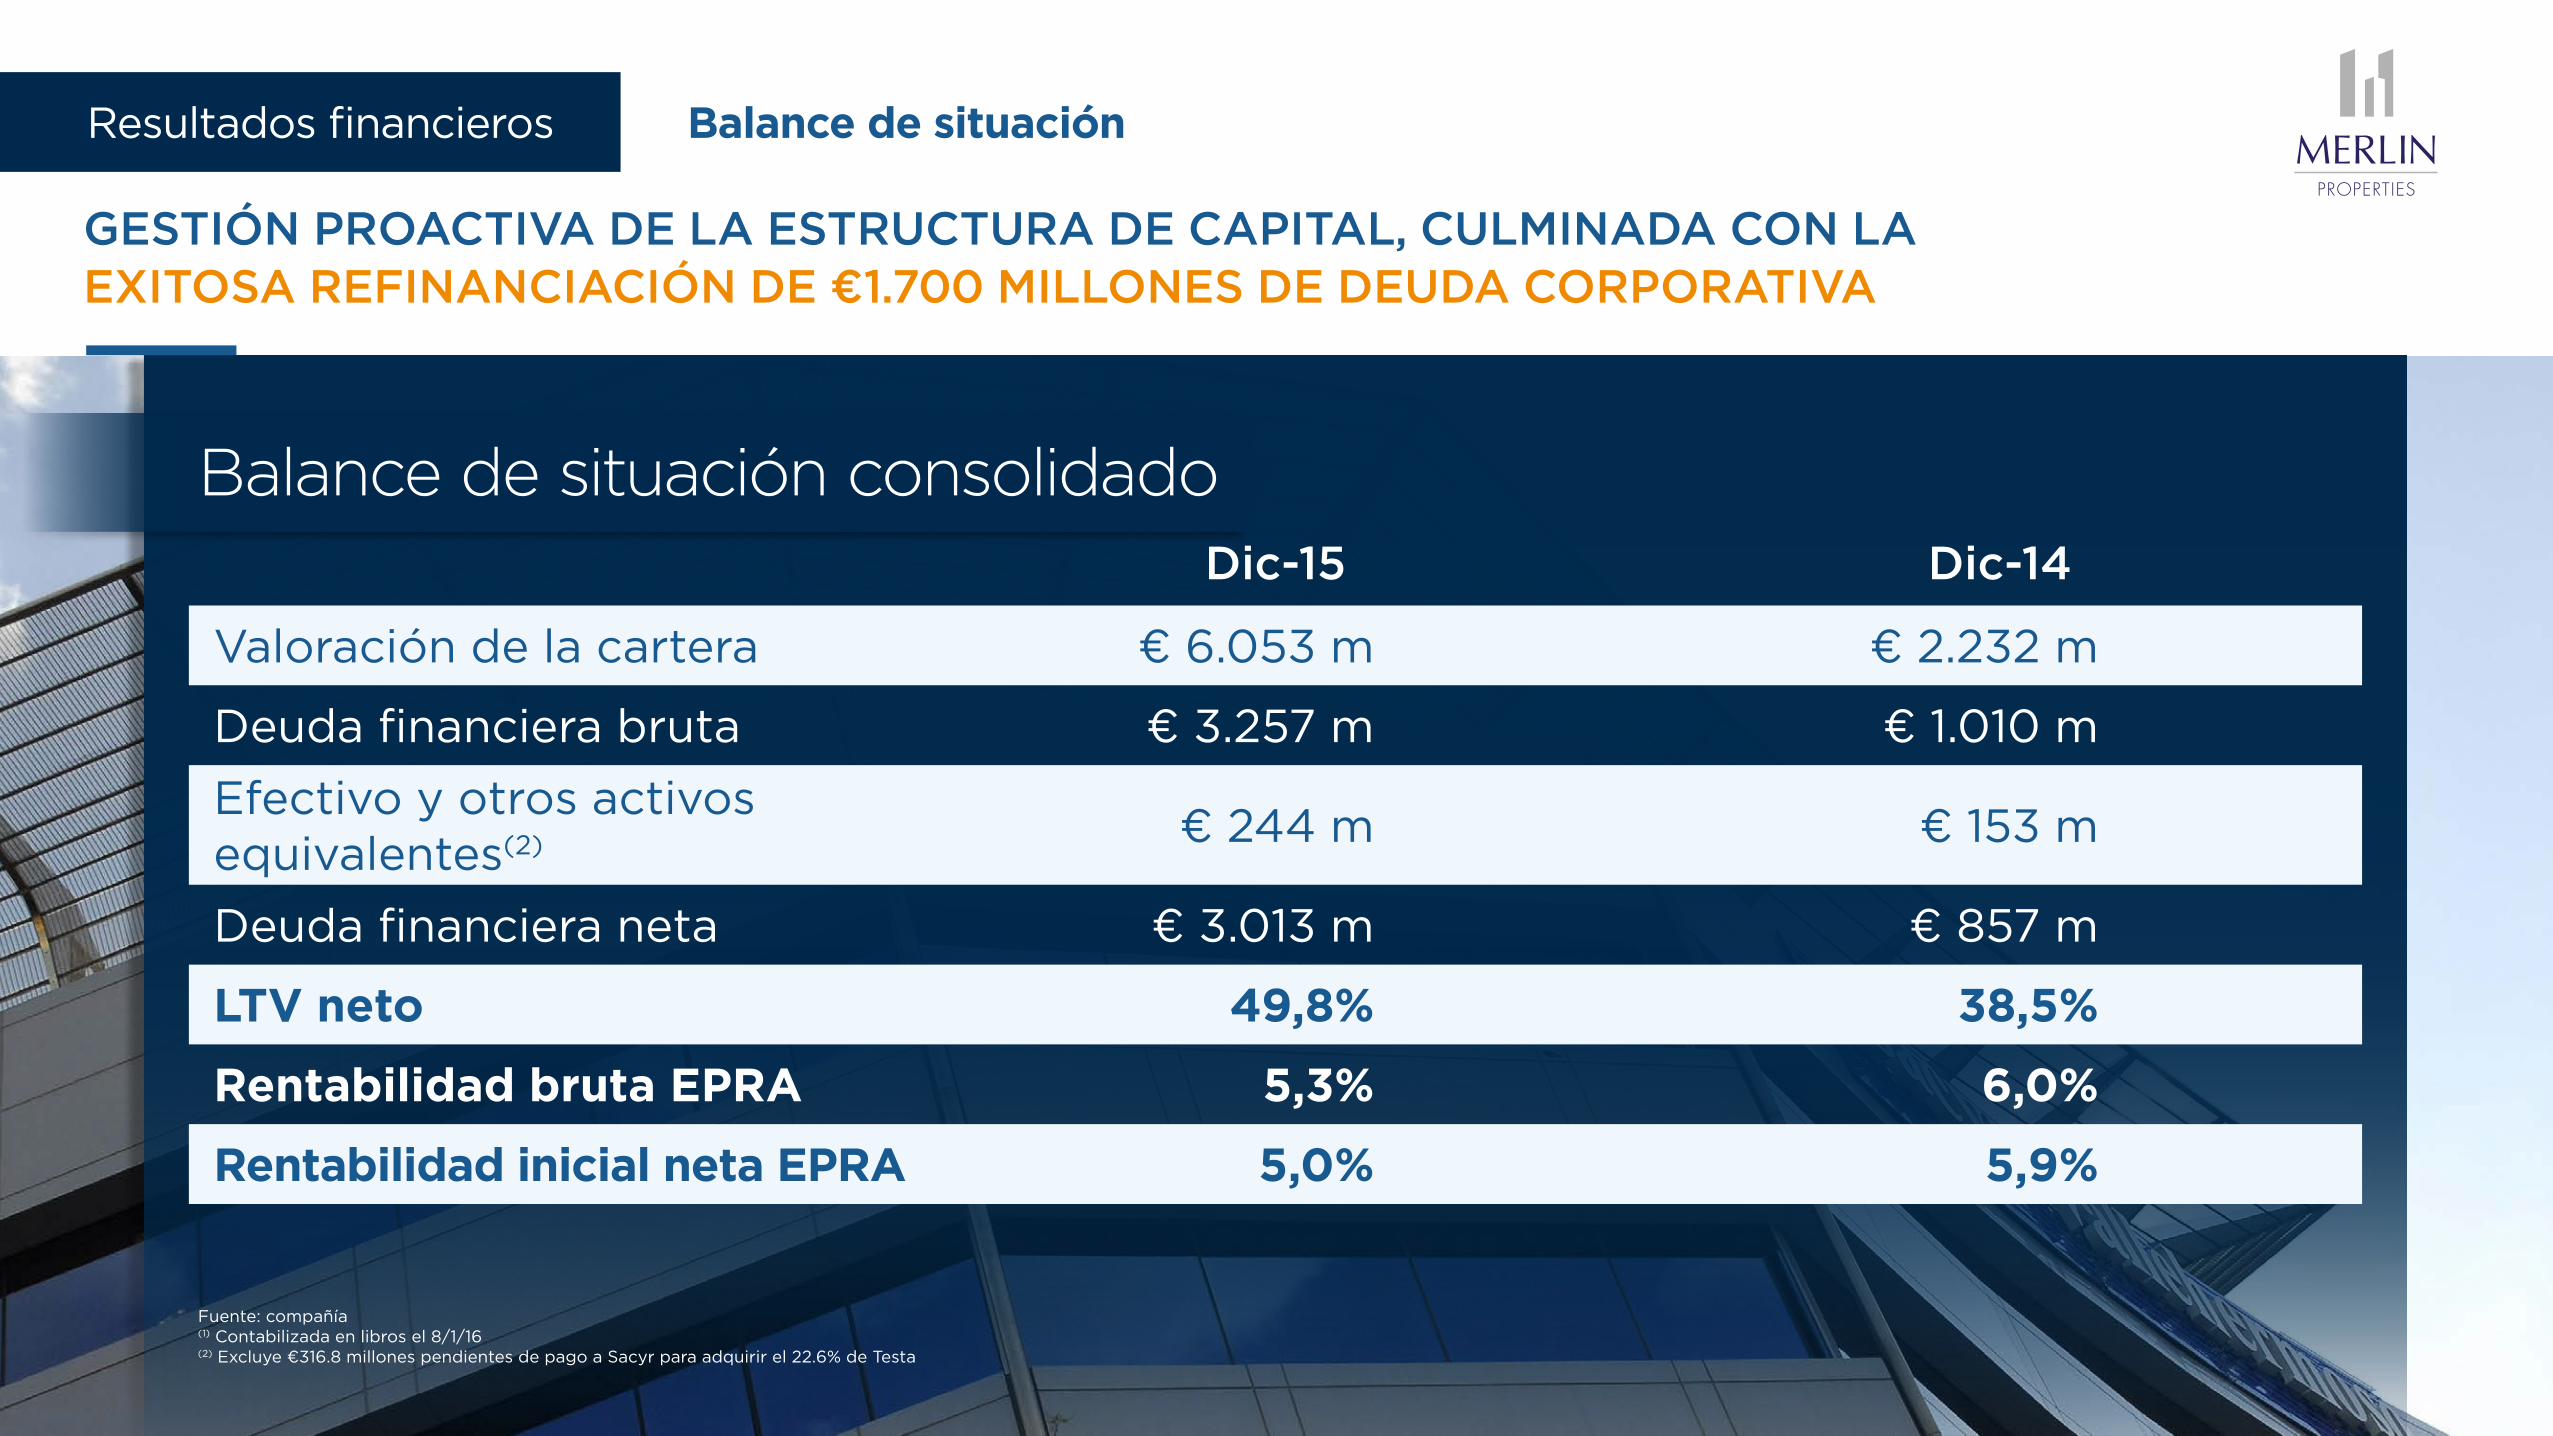
GESTIÓN PROACTIVA DE LA ESTRUCTURA DE CAPITAL, CULMINADA CON LA EXITOSA REFINANCIACIÓN DE €1.700 MILLONES DE DEUDA CORPORATIVA
Dic-15 Dic-14
Valoración de la cartera € 6.053 m € 2.232 m
Deuda financiera bruta € 3.257 m € 1.010 m
Efectivo y otros activos equivalentes(2) € 244 m € 153 m
Deuda financiera neta € 3.013 m € 857 m
LTV neto 49,8% 38,5%
Rentabilidad bruta EPRA 5,3% 6,0%
Rentabilidad inicial neta EPRA 5,0% 5,9%
Fuente: compañía(1) Contabilizada en libros el 8/1/16(2) Excluye €316.8 millones pendientes de pago a Sacyr para adquirir el 22.6% de Testa
Balance de situación consolidado
Balance de situaciónResultados financieros
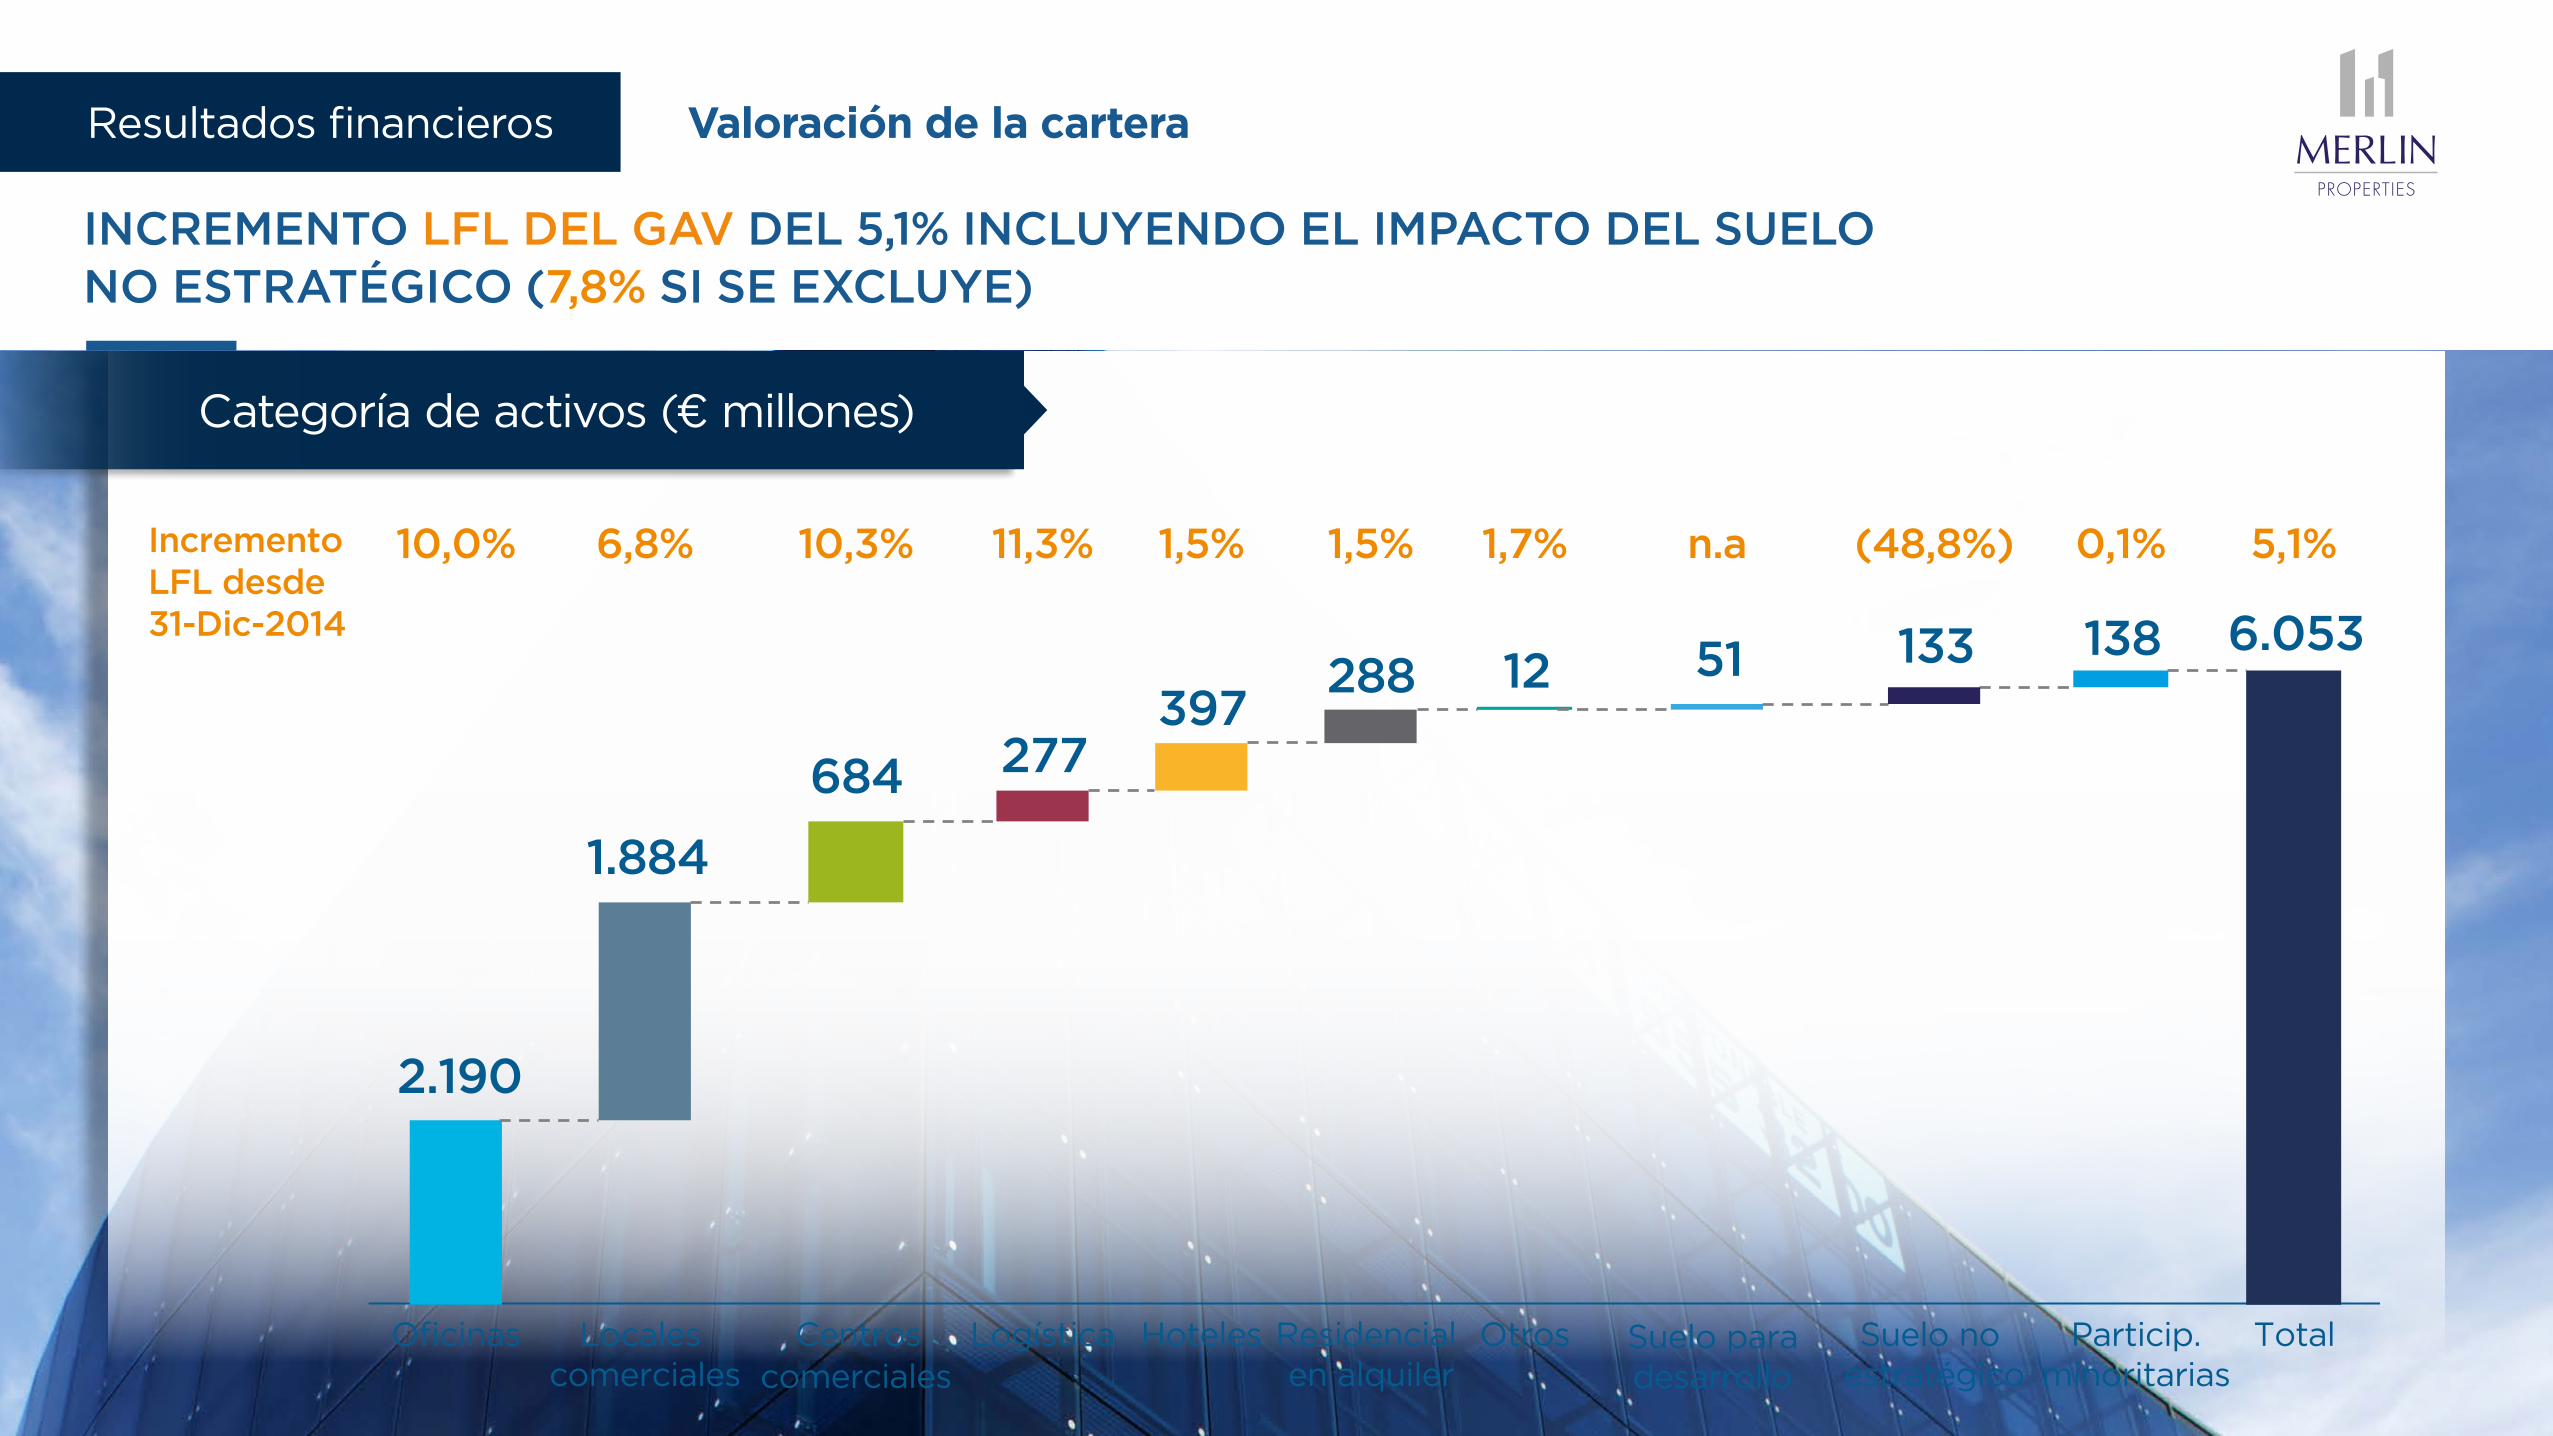
INCREMENTO LFL DEL GAV DEL 5,1% INCLUYENDO EL IMPACTO DEL SUELO NO ESTRATÉGICO (7,8% SI SE EXCLUYE)
Incremento LFL desde 31-Dic-2014
10,0%
2.190
Oficinas
6,8%
1.884
10,3%
684
Centroscomerciales
11,3%
277
Logística
1,5%
397
Hoteles
1,7%
12
Otros
n.a
51
1,5%
288
0,1%
138
Particip. minoritarias
5,1%
6.053
Total
(48,8%)
133
Suelo no estratégico
Locales comerciales
Residencial en alquiler
Suelo para desarrollo
Categoría de activos (€ millones)
Valoración de la carteraResultados financieros
Fuente: compañía
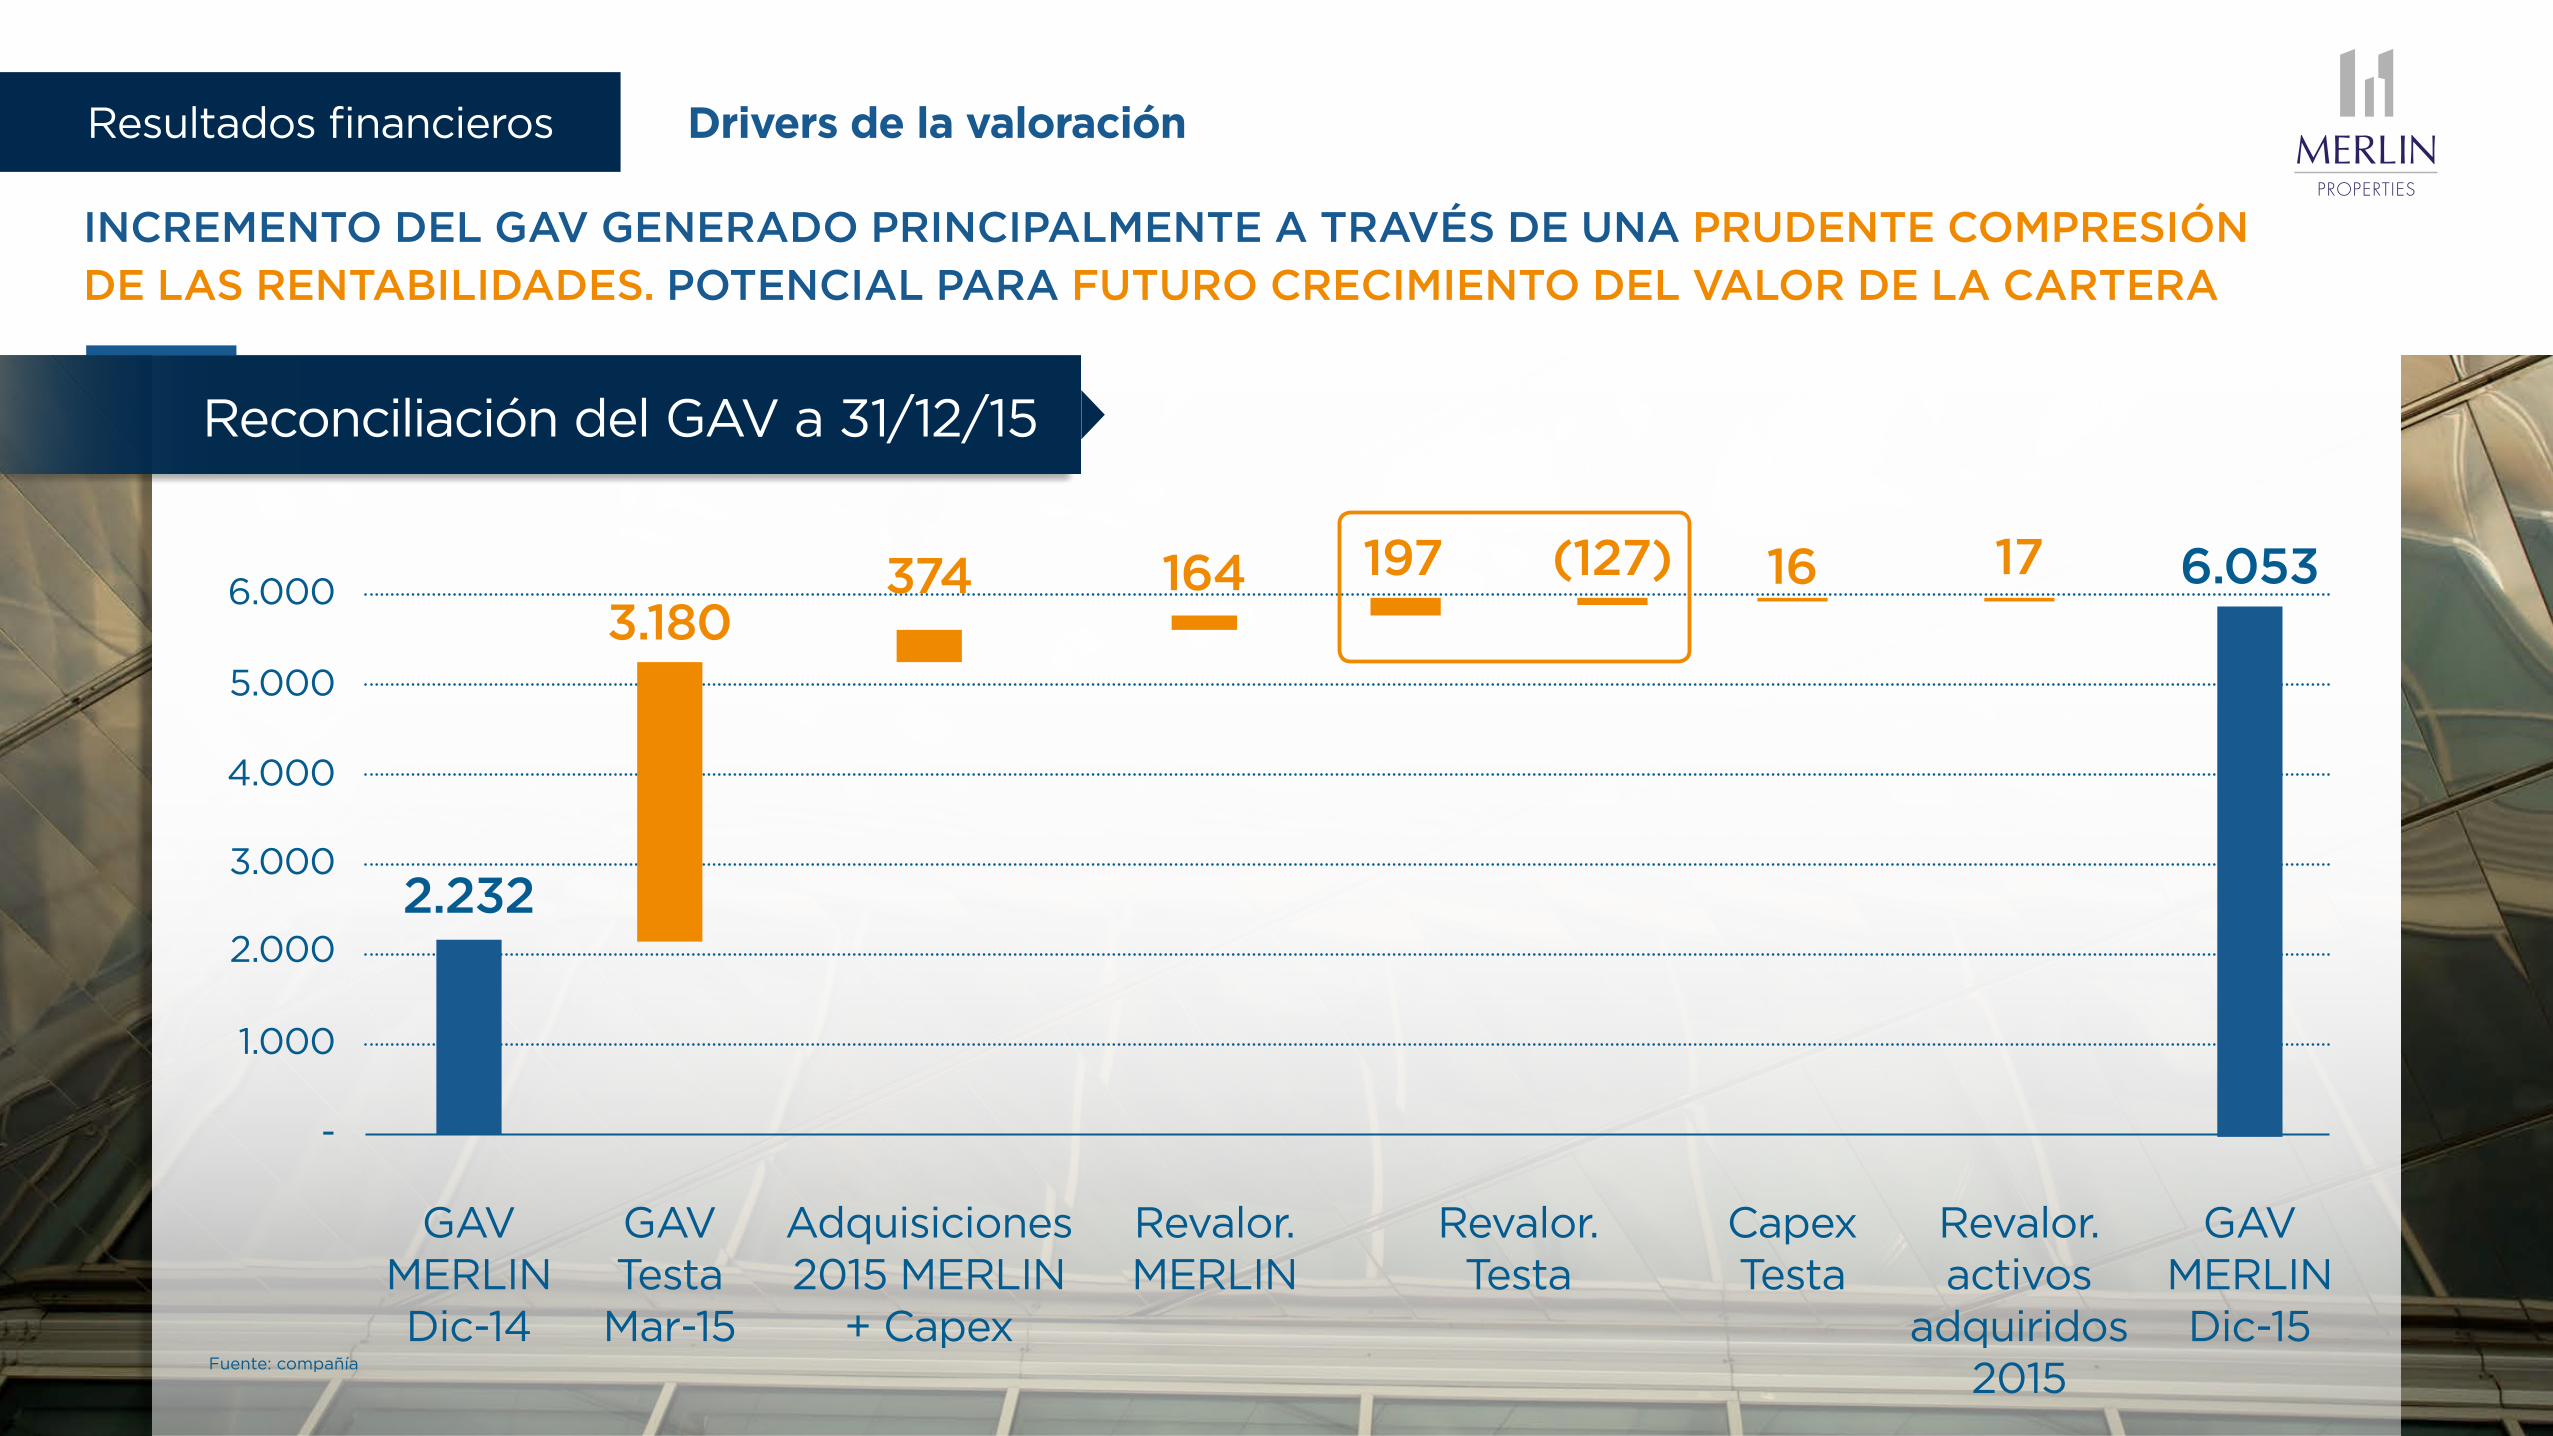
INCREMENTO DEL GAV GENERADO PRINCIPALMENTE A TRAVÉS DE UNA PRUDENTE COMPRESIÓN
DE LAS RENTABILIDADES. POTENCIAL PARA FUTURO CRECIMIENTO DEL VALOR DE LA CARTERA
-
1.000
2.000
3.000
4.000
5.000
6.000
GAV MERLIN Dic-14
2.232
GAV MERLIN Dic-15
6.053
Revalor. MERLIN
164
Revalor. activos
adquiridos 2015
17
Capex Testa
16
Adquisiciones 2015 MERLIN
+ Capex
374
GAV Testa Mar-15
3.180
Revalor. Testa
197 (127)
Reconciliación del GAV a 31/12/15
Drivers de la valoraciónResultados financieros
EndeudamientoResultados financieros
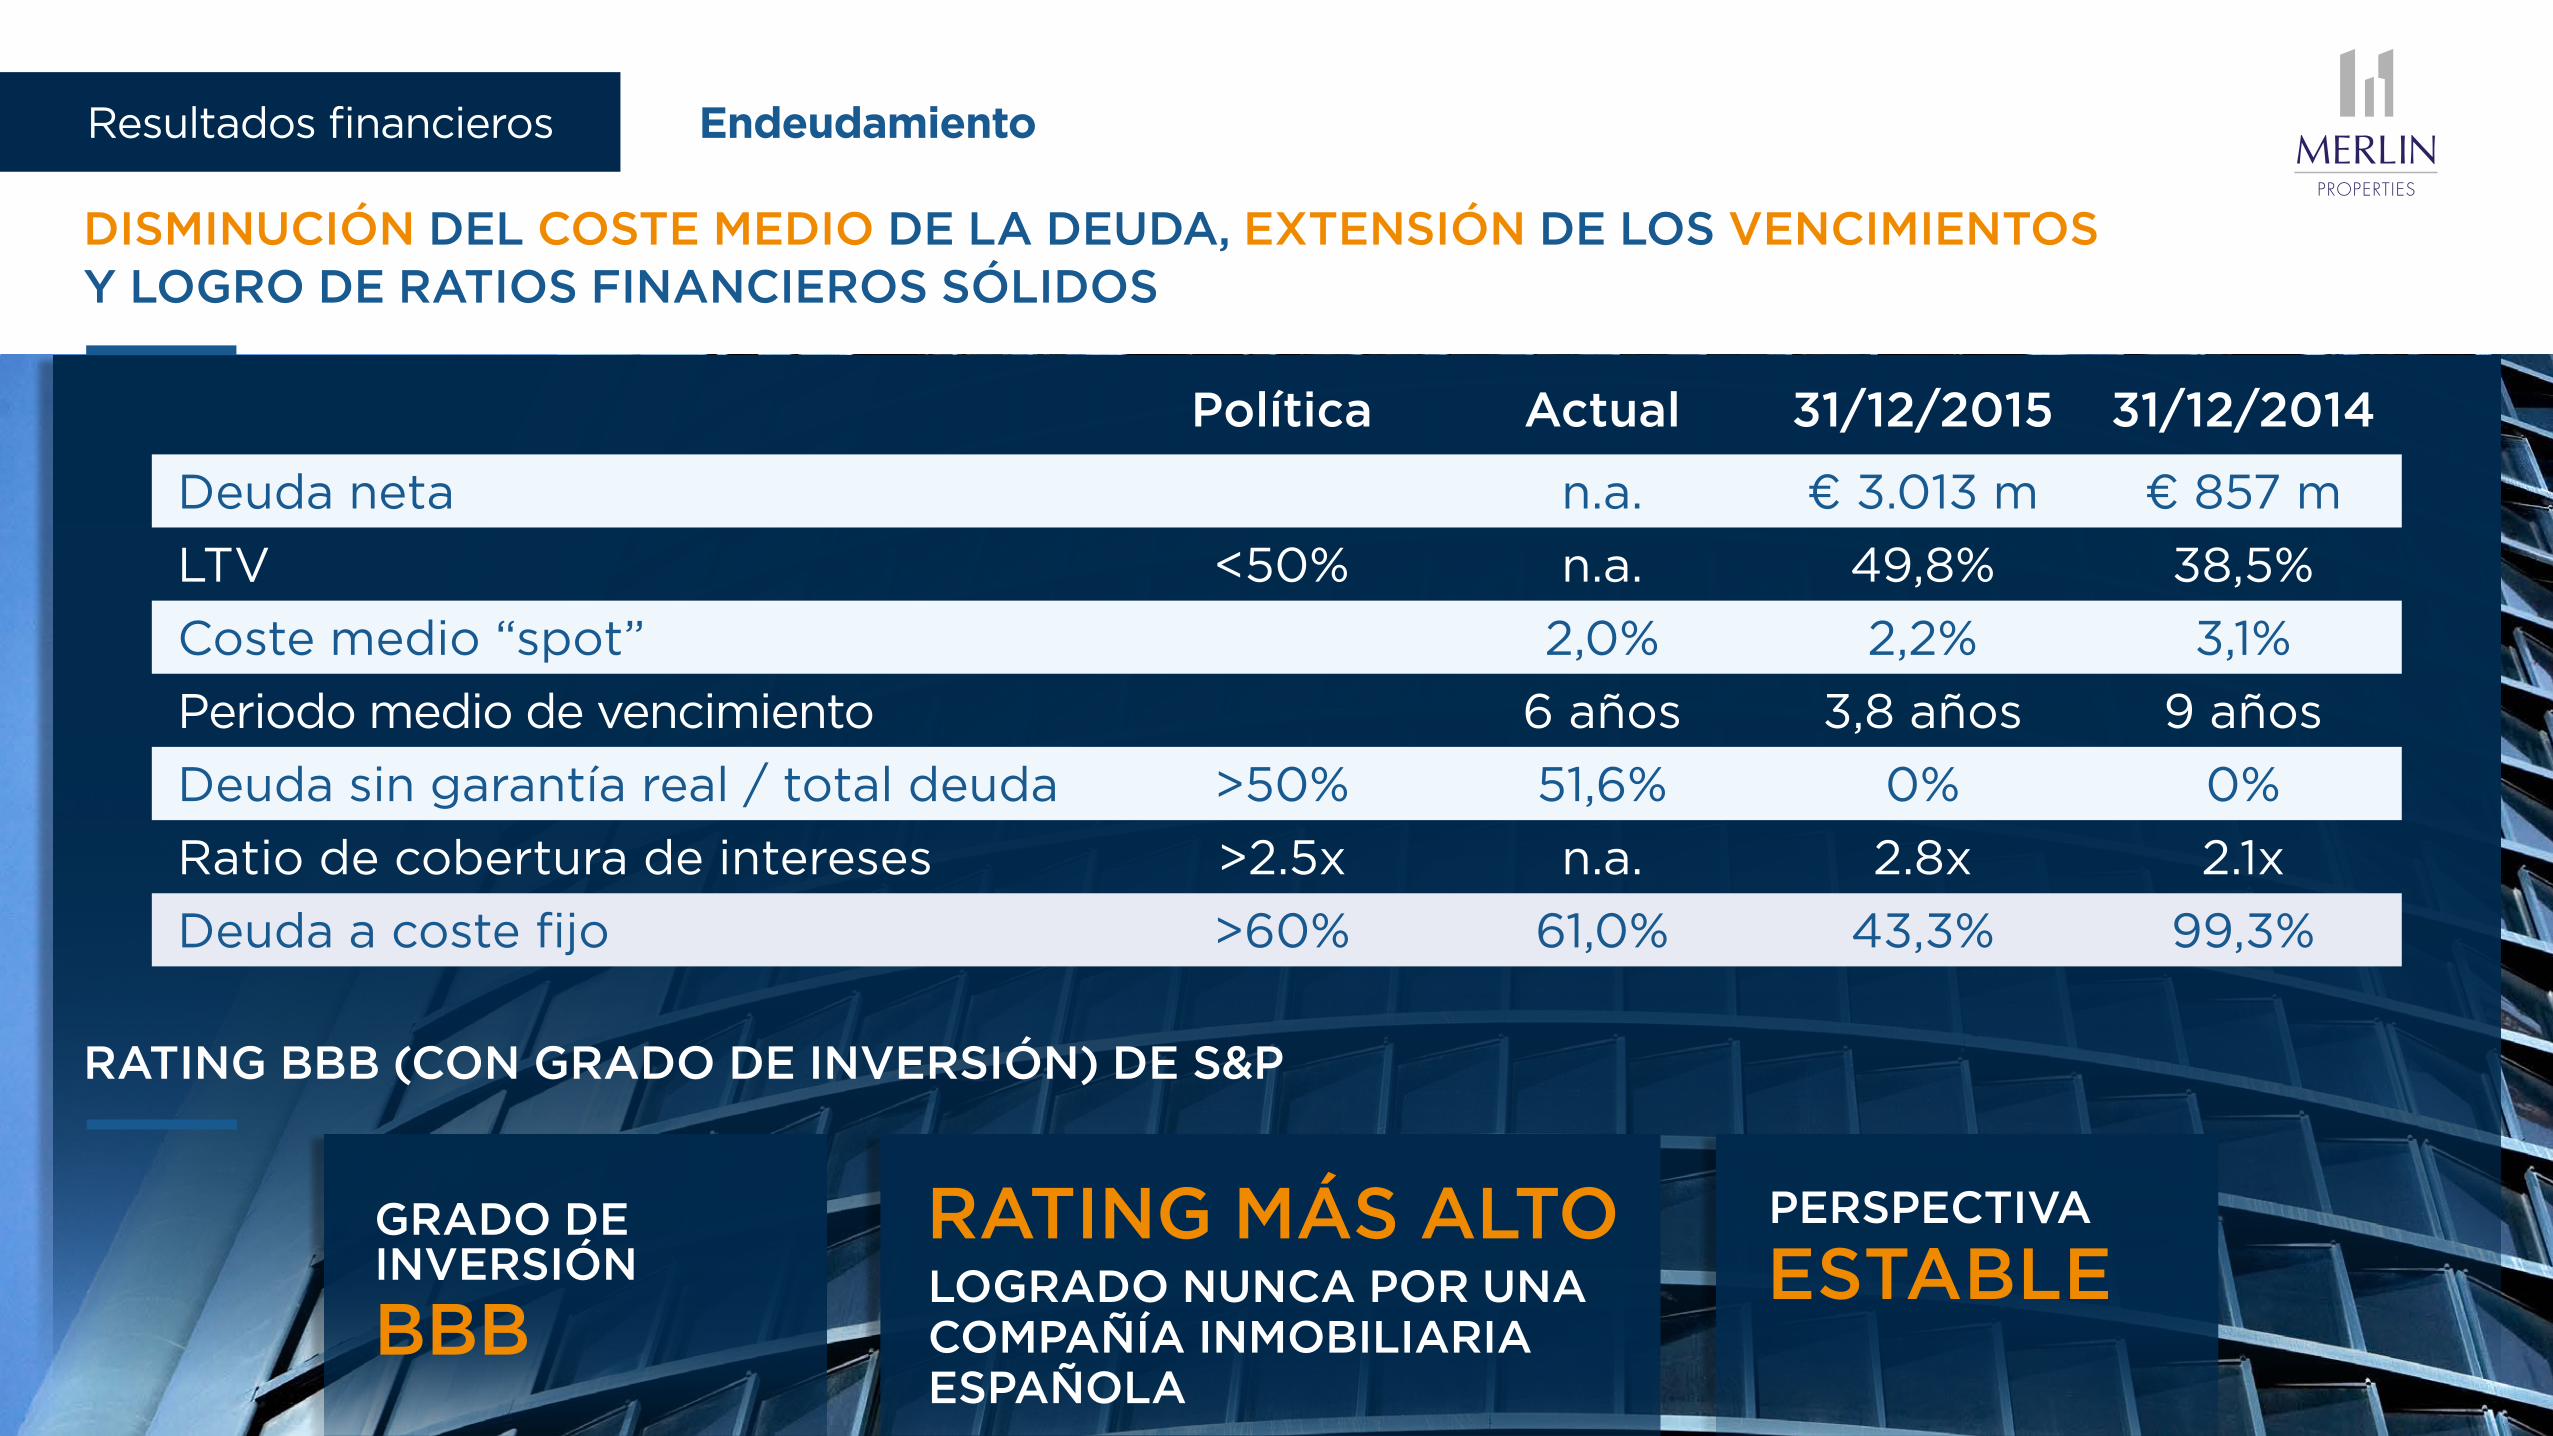
DISMINUCIÓN DEL COSTE MEDIO DE LA DEUDA, EXTENSIÓN DE LOS VENCIMIENTOS Y LOGRO DE RATIOS FINANCIEROS SÓLIDOS
Política Actual 31/12/2015 31/12/2014
Deuda neta n.a. € 3.013 m € 857 m
LTV <50% n.a. 49,8% 38,5%
Coste medio “spot” 2,0% 2,2% 3,1%
Periodo medio de vencimiento 6 años 3,8 años 9 años
Deuda sin garantía real / total deuda >50% 51,6% 0% 0%
Ratio de cobertura de intereses >2.5x n.a. 2.8x 2.1x
Deuda a coste fijo >60% 61,0% 43,3% 99,3%
GRADO DE INVERSIÓN
BBBLOGRADO NUNCA POR UNA COMPAÑÍA INMOBILIARIA ESPAÑOLA
RATING MÁS ALTO PERSPECTIVA
ESTABLE
RATING BBB (CON GRADO DE INVERSIÓN) DE S&P
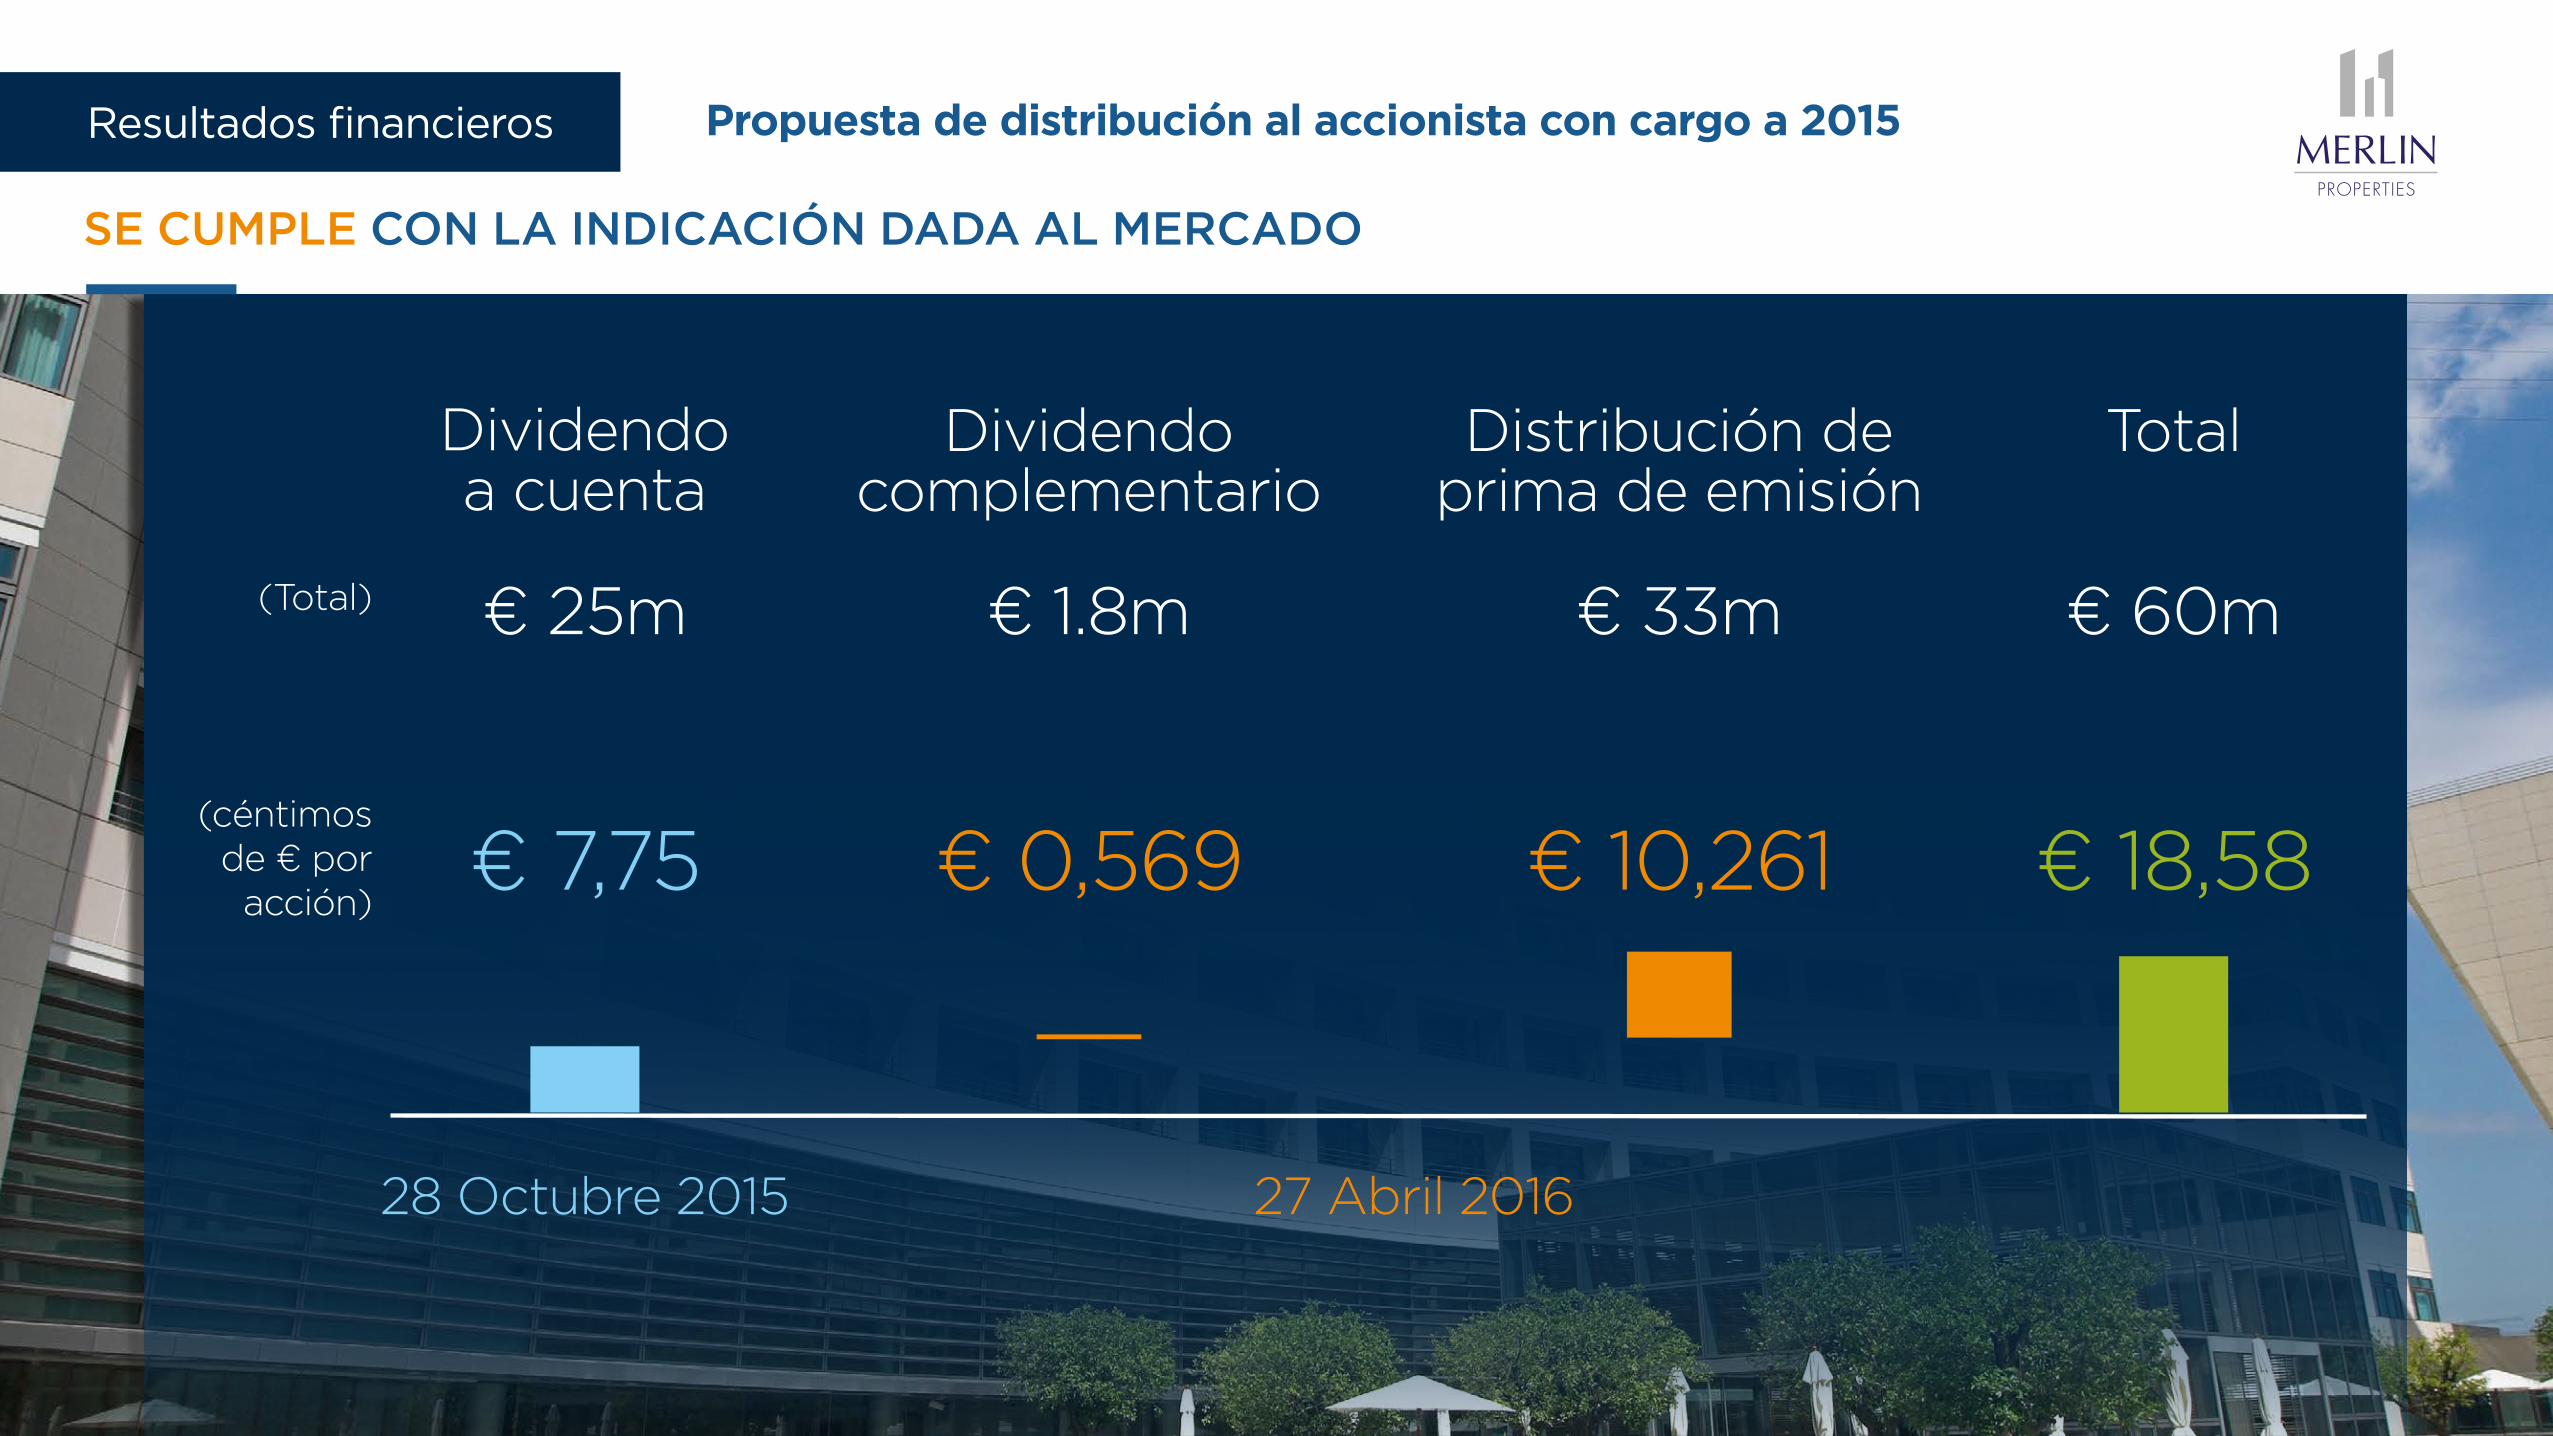
(Total)
(céntimos de € por
acción)€ 7,75
€ 25m € 1.8m € 33m € 60m
Dividendo a cuenta
28 Octubre 2015 27 Abril 2016
€ 0,569
Dividendo complementario
€ 10,261
Distribución de prima de emisión
€ 18,58
Total
SE CUMPLE CON LA INDICACIÓN DADA AL MERCADO
Propuesta de distribución al accionista con cargo a 2015Resultados financieros
CARTERA DE ACTIVOS DIVERSIFICADA CON ALTA RENTABILIDAD, ABSORCIÓN POSITIVA
RENDIMIENTO DE LA CARTERA
1 ı 2 ı 3Puntos orden del día
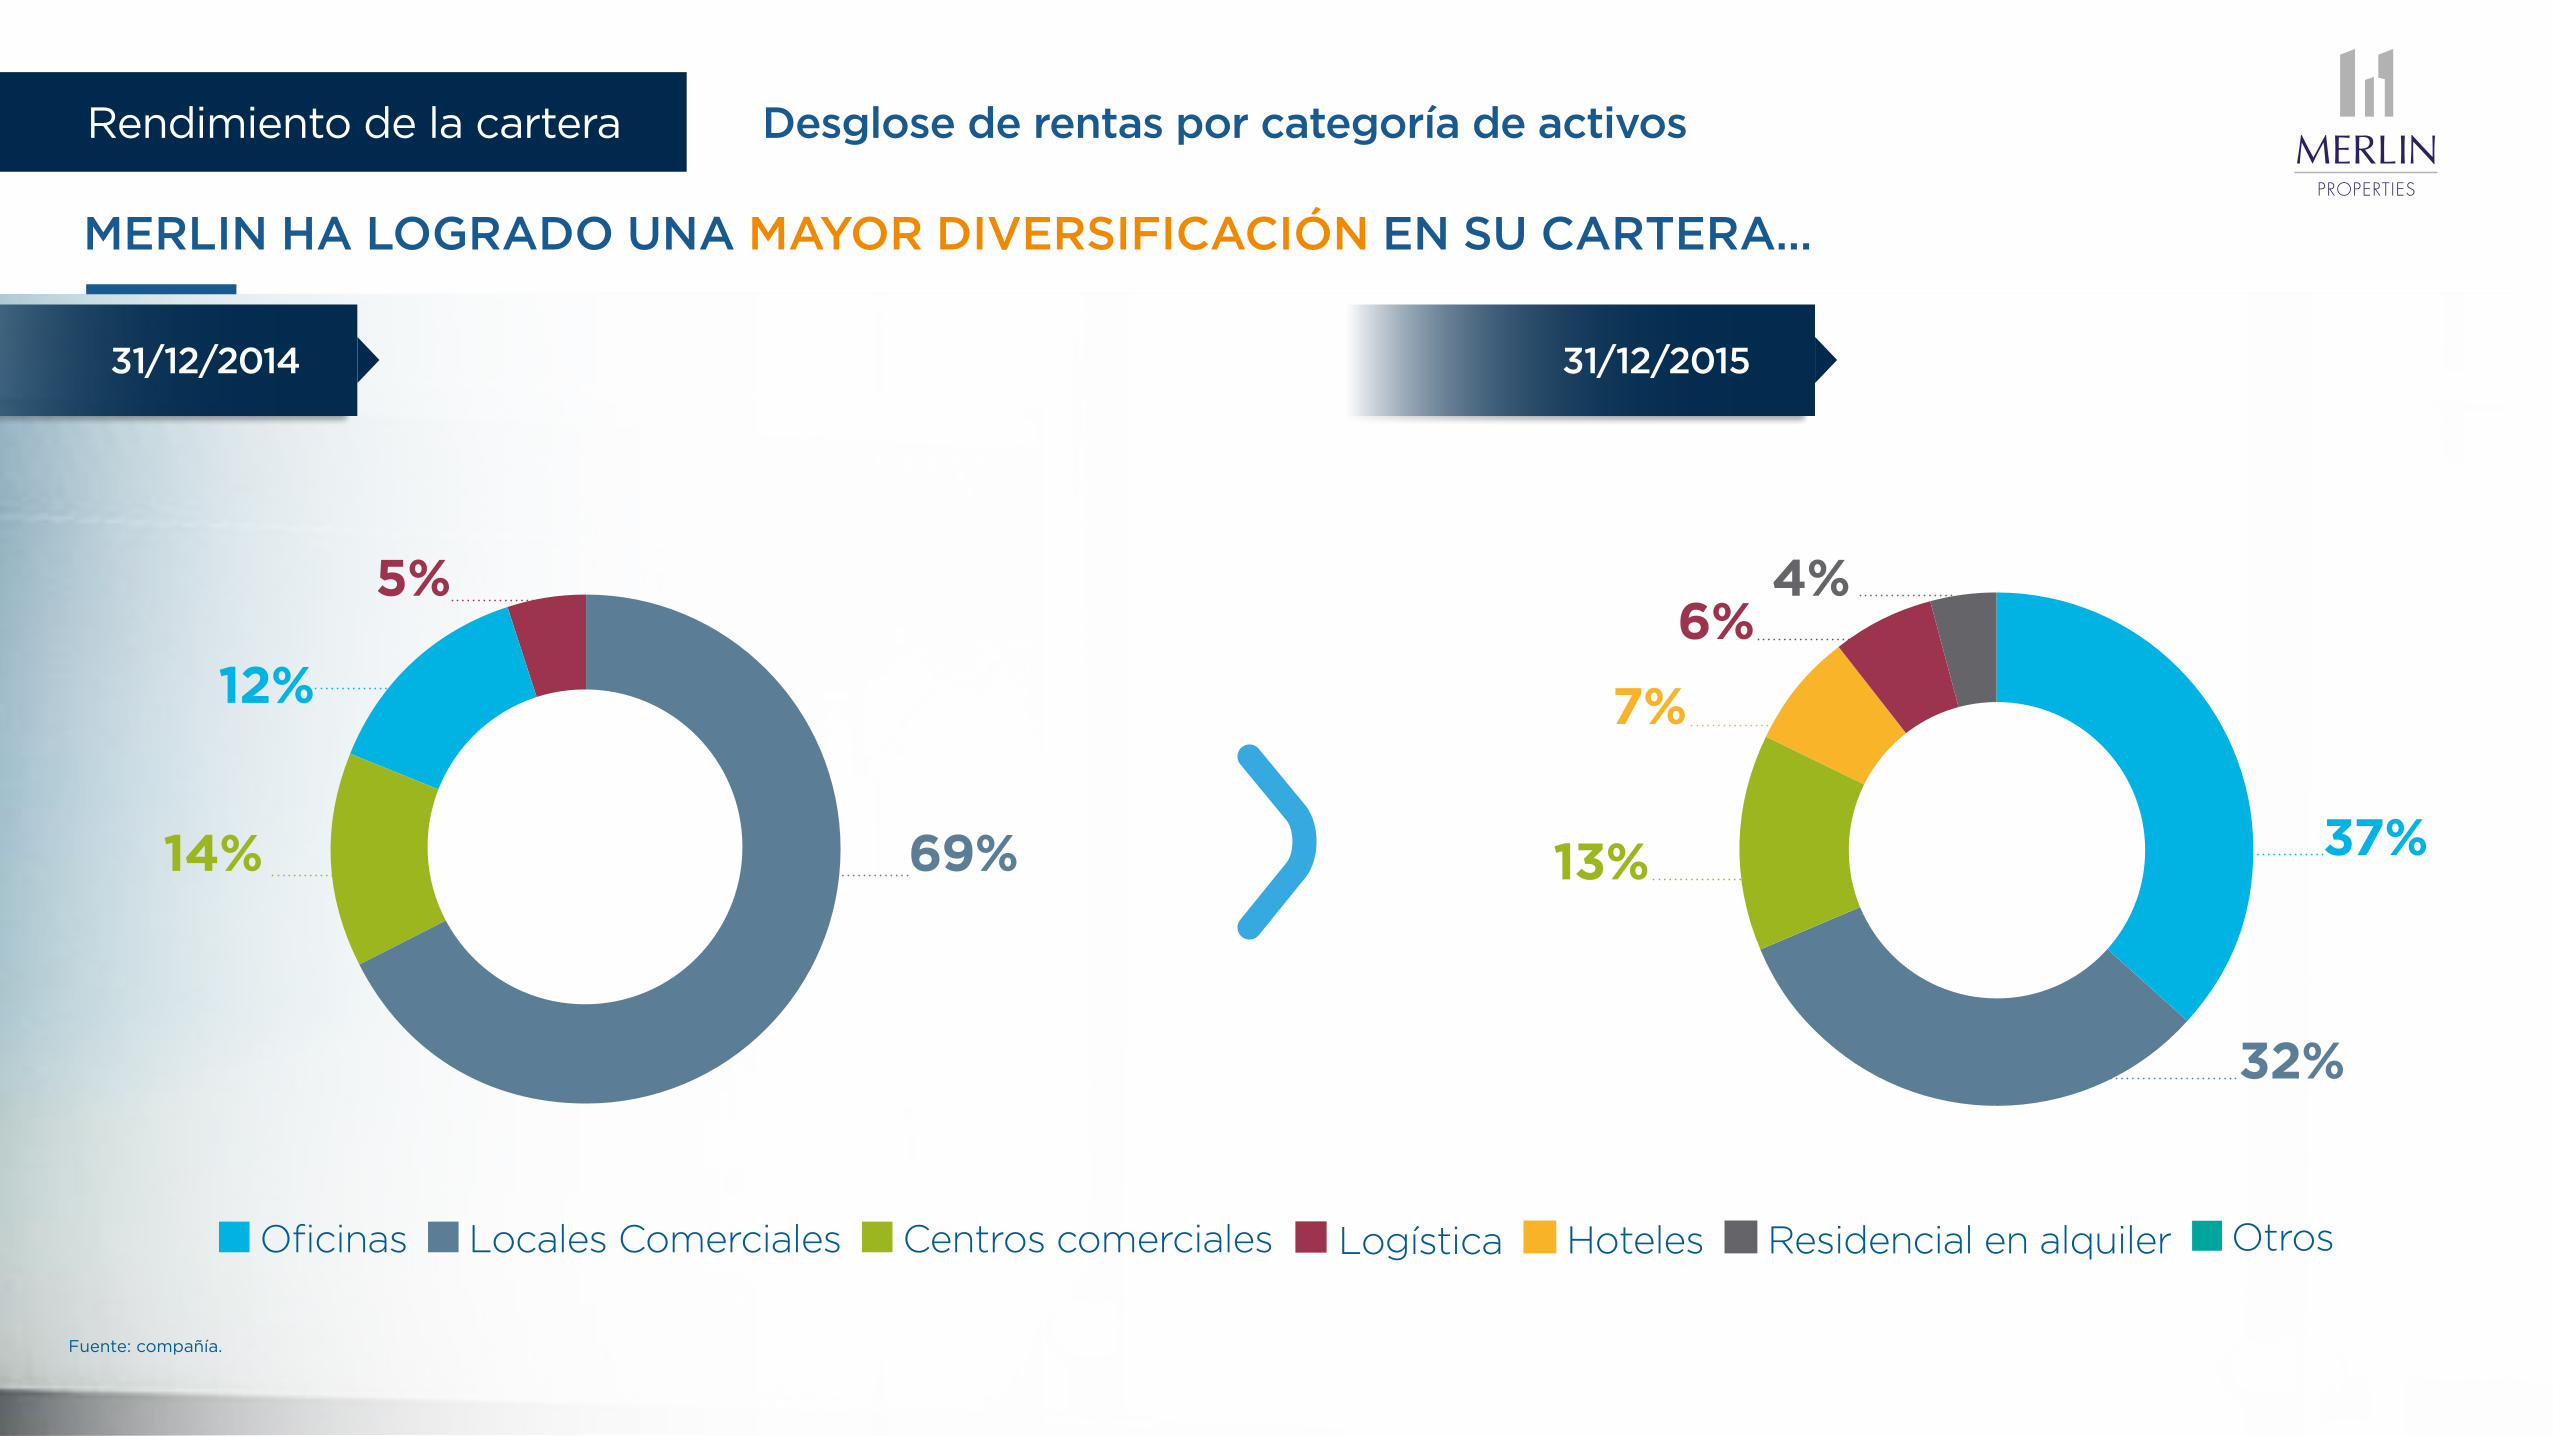
MERLIN HA LOGRADO UNA MAYOR DIVERSIFICACIÓN EN SU CARTERA…
Fuente: compañía.
Oficinas Locales Comerciales Centros comerciales Logística Hoteles Residencial en alquiler Otros
Logistics
O�ce
Shopping Centers
High Street Retail
12%
14%
5%
69%
31/12/2014 31/12/2015
13%
7%
Other
Rented residential
Hotels
High Street Retail
Logistics
Shopping centers
O�ce32%
6%
37%
4%
Desglose de rentas por categoría de activosRendimiento de la cartera
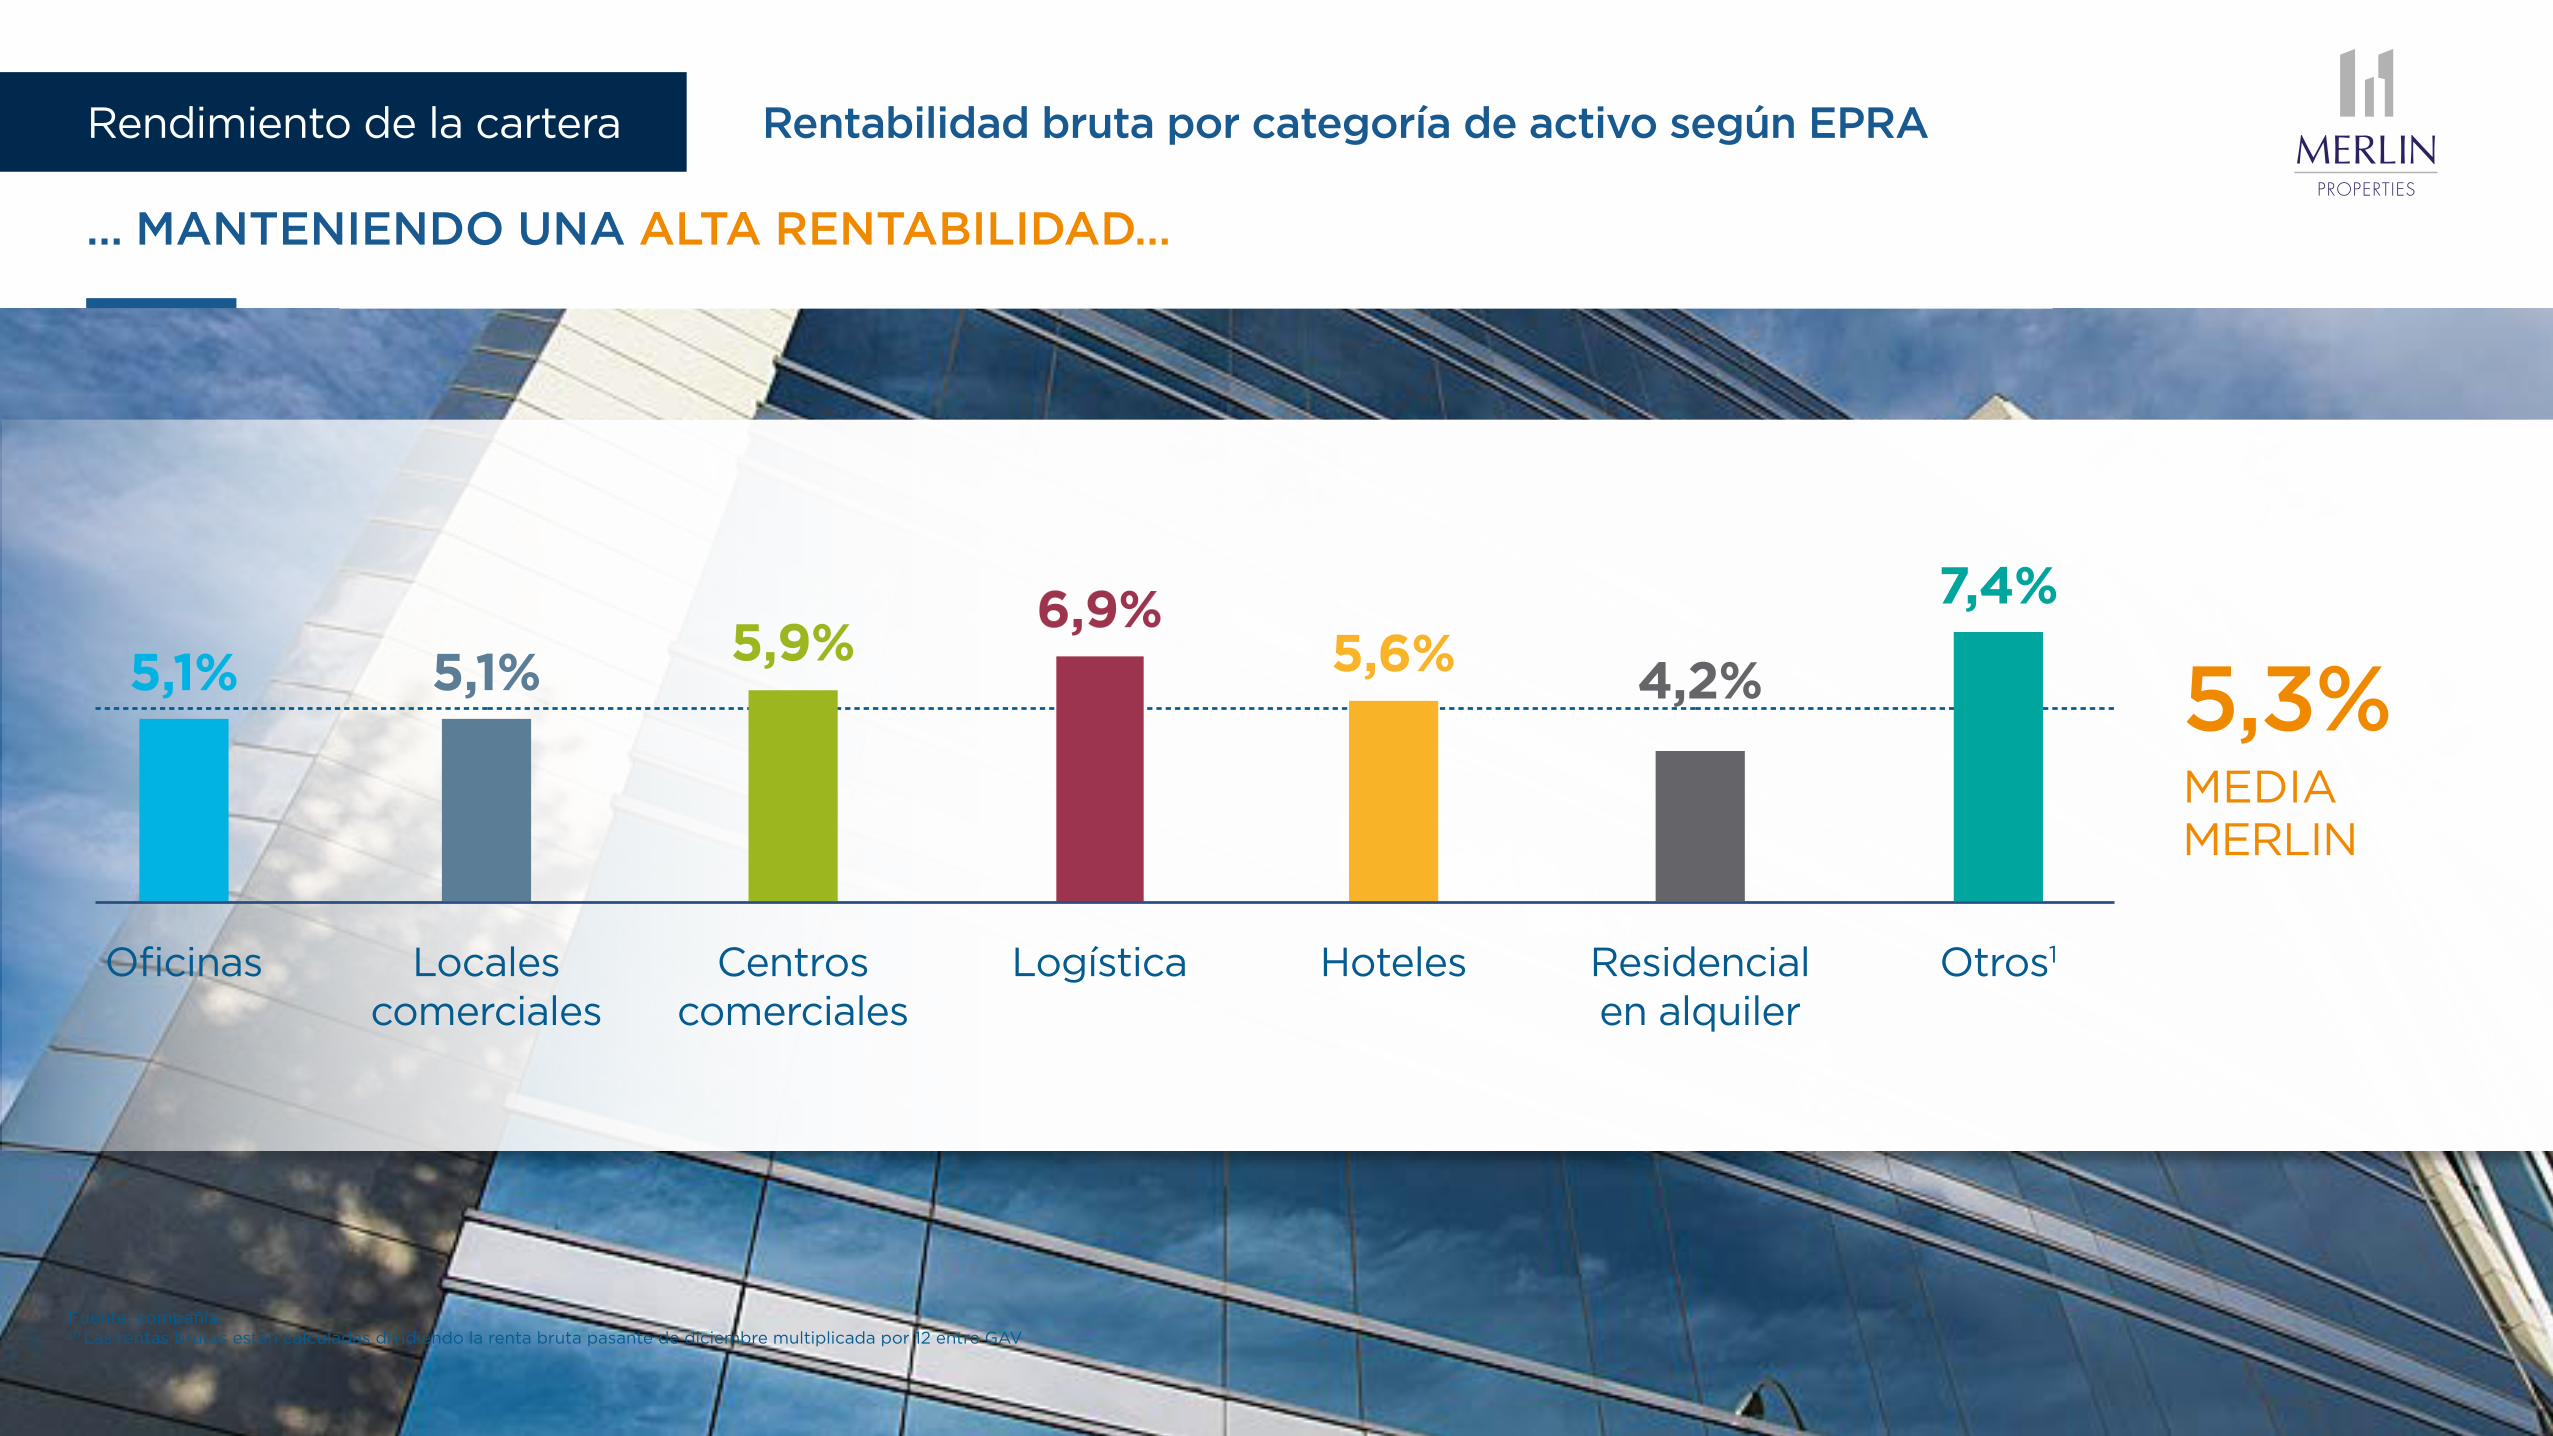
Fuente: compañía. (1) Las rentas brutas están calculadas dividiendo la renta bruta pasante de diciembre multiplicada por 12 entre GAV
… MANTENIENDO UNA ALTA RENTABILIDAD…
5,1%
Oficinas
5,1%
Locales comerciales
5,9%
Centros comerciales
6,9%
Logística
5,6%
Hoteles
4,2%
Residencial en alquiler
7,4%
Otros1
5,3%MEDIA MERLIN
Rentabilidad bruta por categoría de activo según EPRARendimiento de la cartera
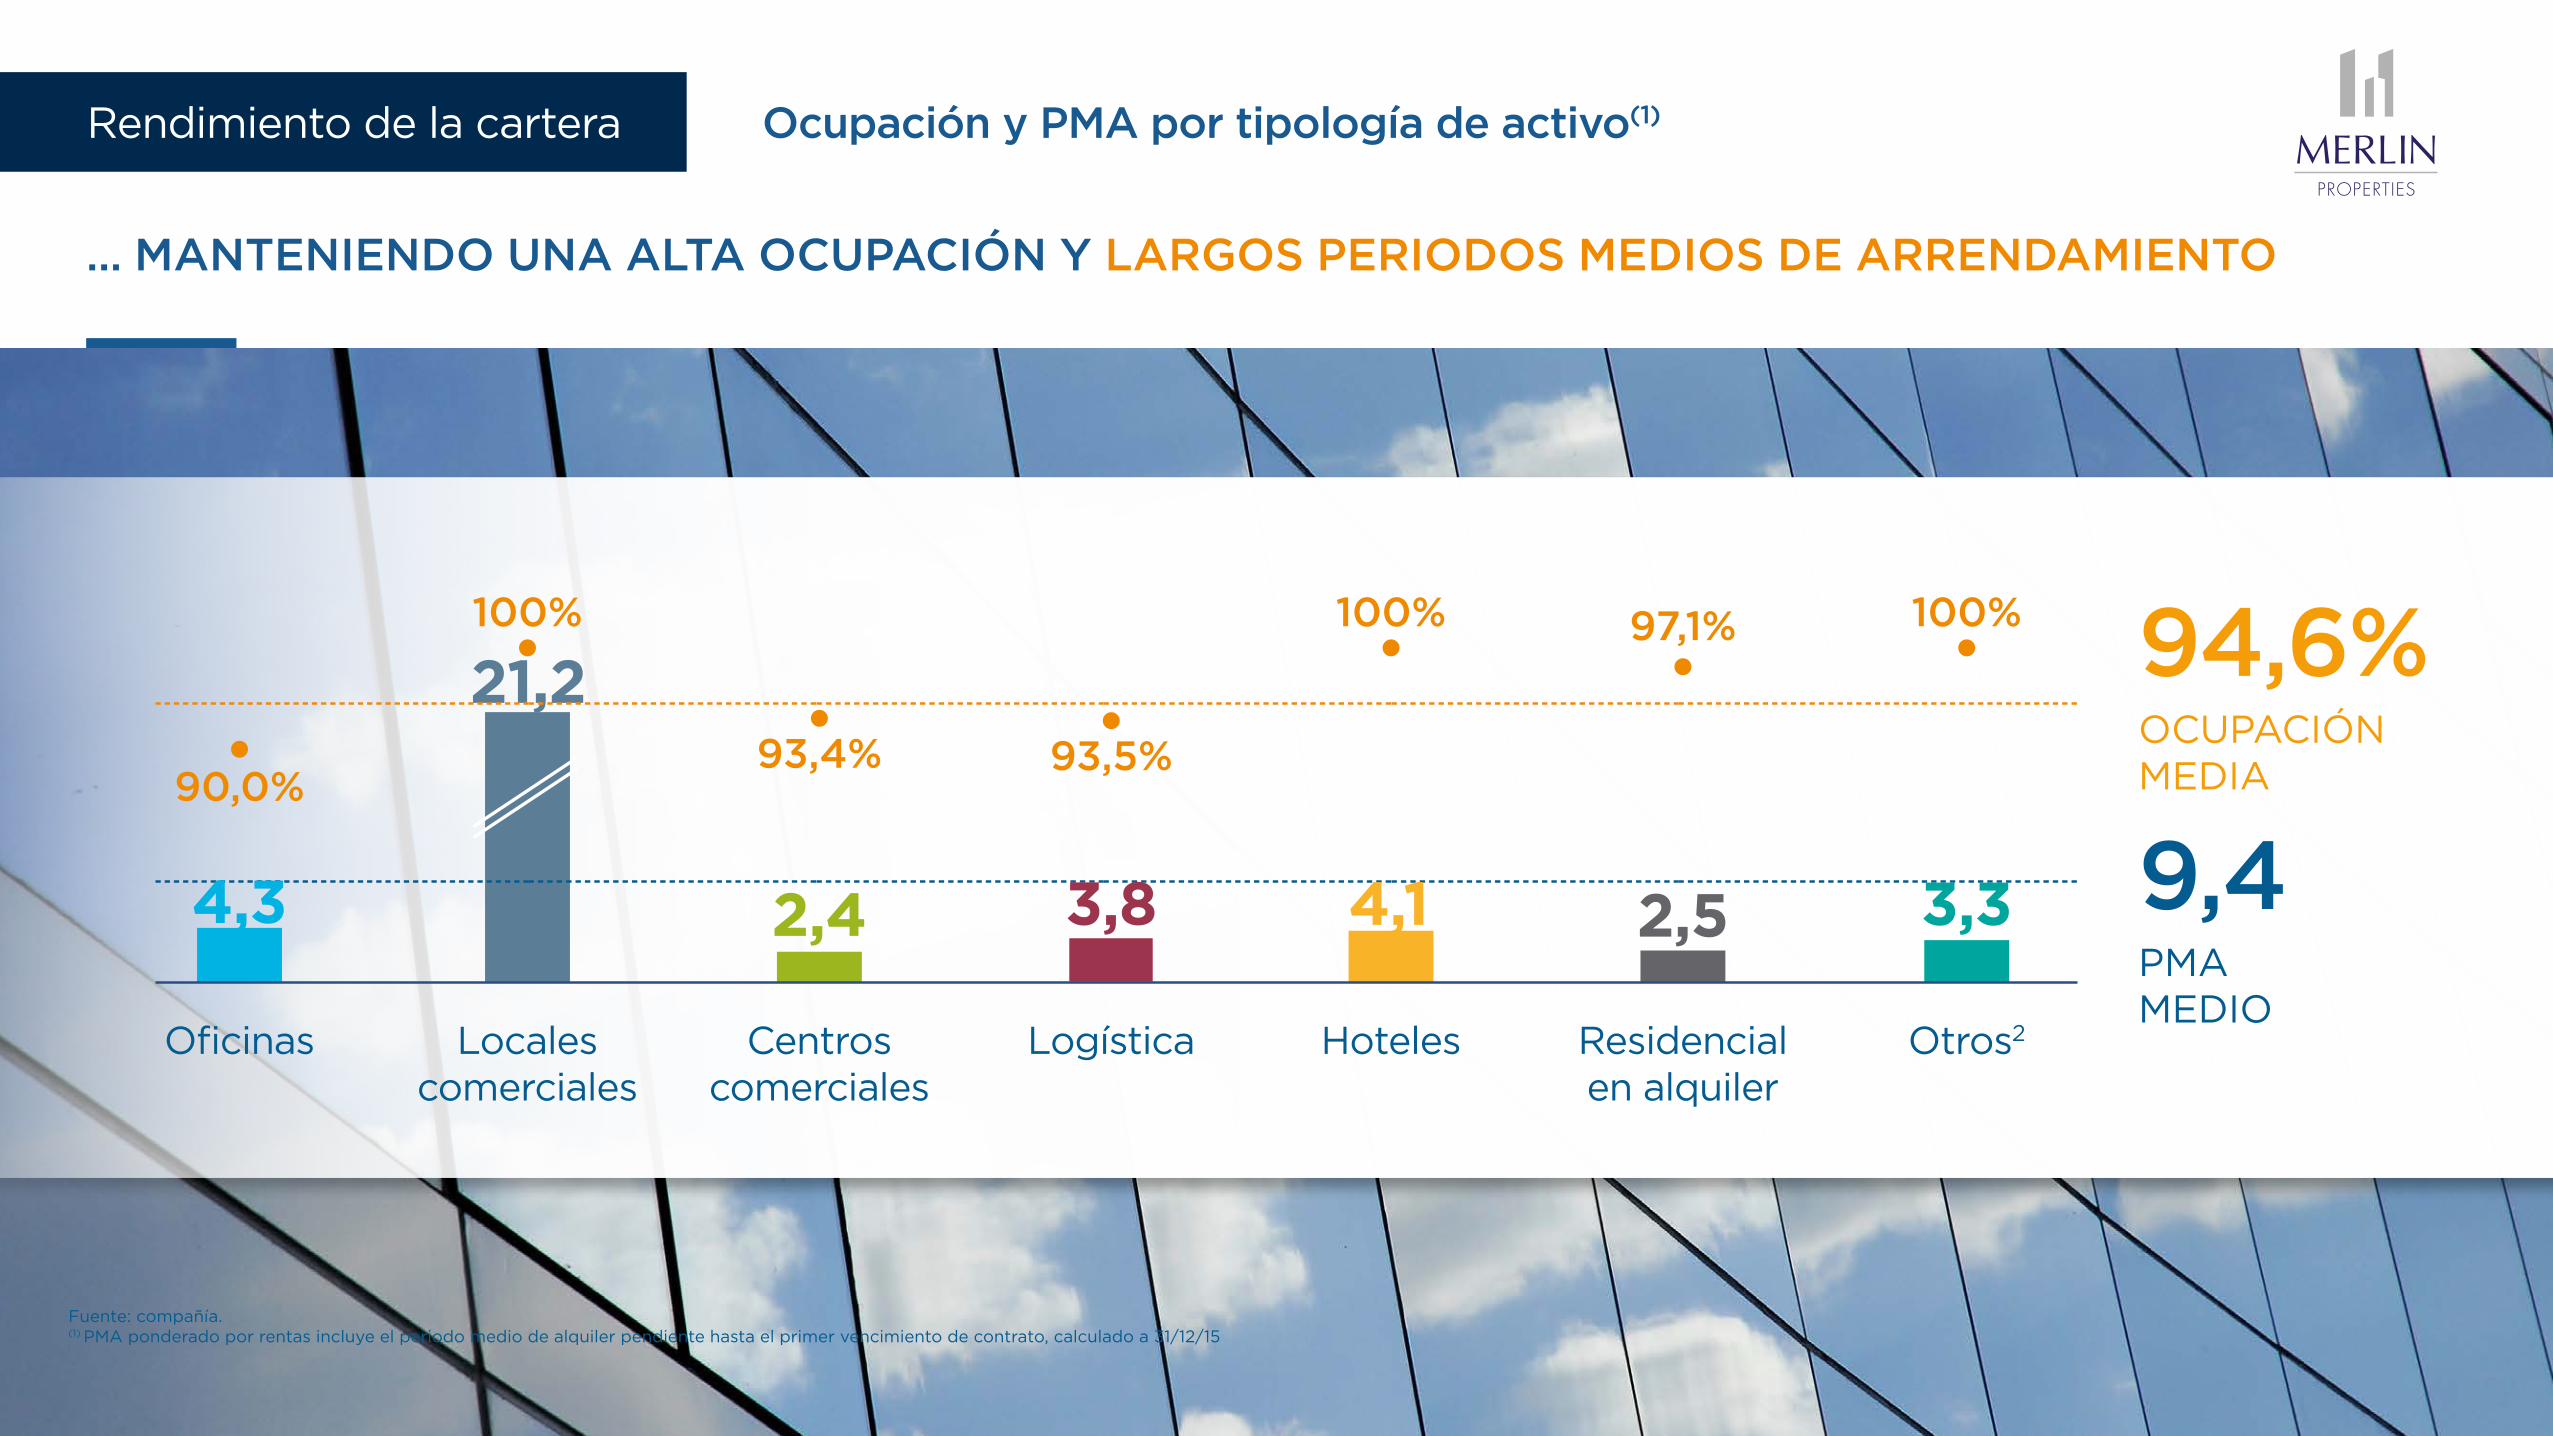
Fuente: compañía. (1) PMA ponderado por rentas incluye el periodo medio de alquiler pendiente hasta el primer vencimiento de contrato, calculado a 31/12/15
… MANTENIENDO UNA ALTA OCUPACIÓN Y LARGOS PERIODOS MEDIOS DE ARRENDAMIENTO
2,4
21,2
Oficinas Locales comerciales
Centros comerciales
Logística Hoteles Residencial en alquiler
Otros2
94,6%OCUPACIÓN MEDIA
9,4PMA MEDIO
90,0%93,5%93,4%
100% 100% 100%97,1%
4,3 3,8 4,1 2,5 3,3
Ocupación y PMA por tipología de activo(1)Rendimiento de la cartera
Alquileres
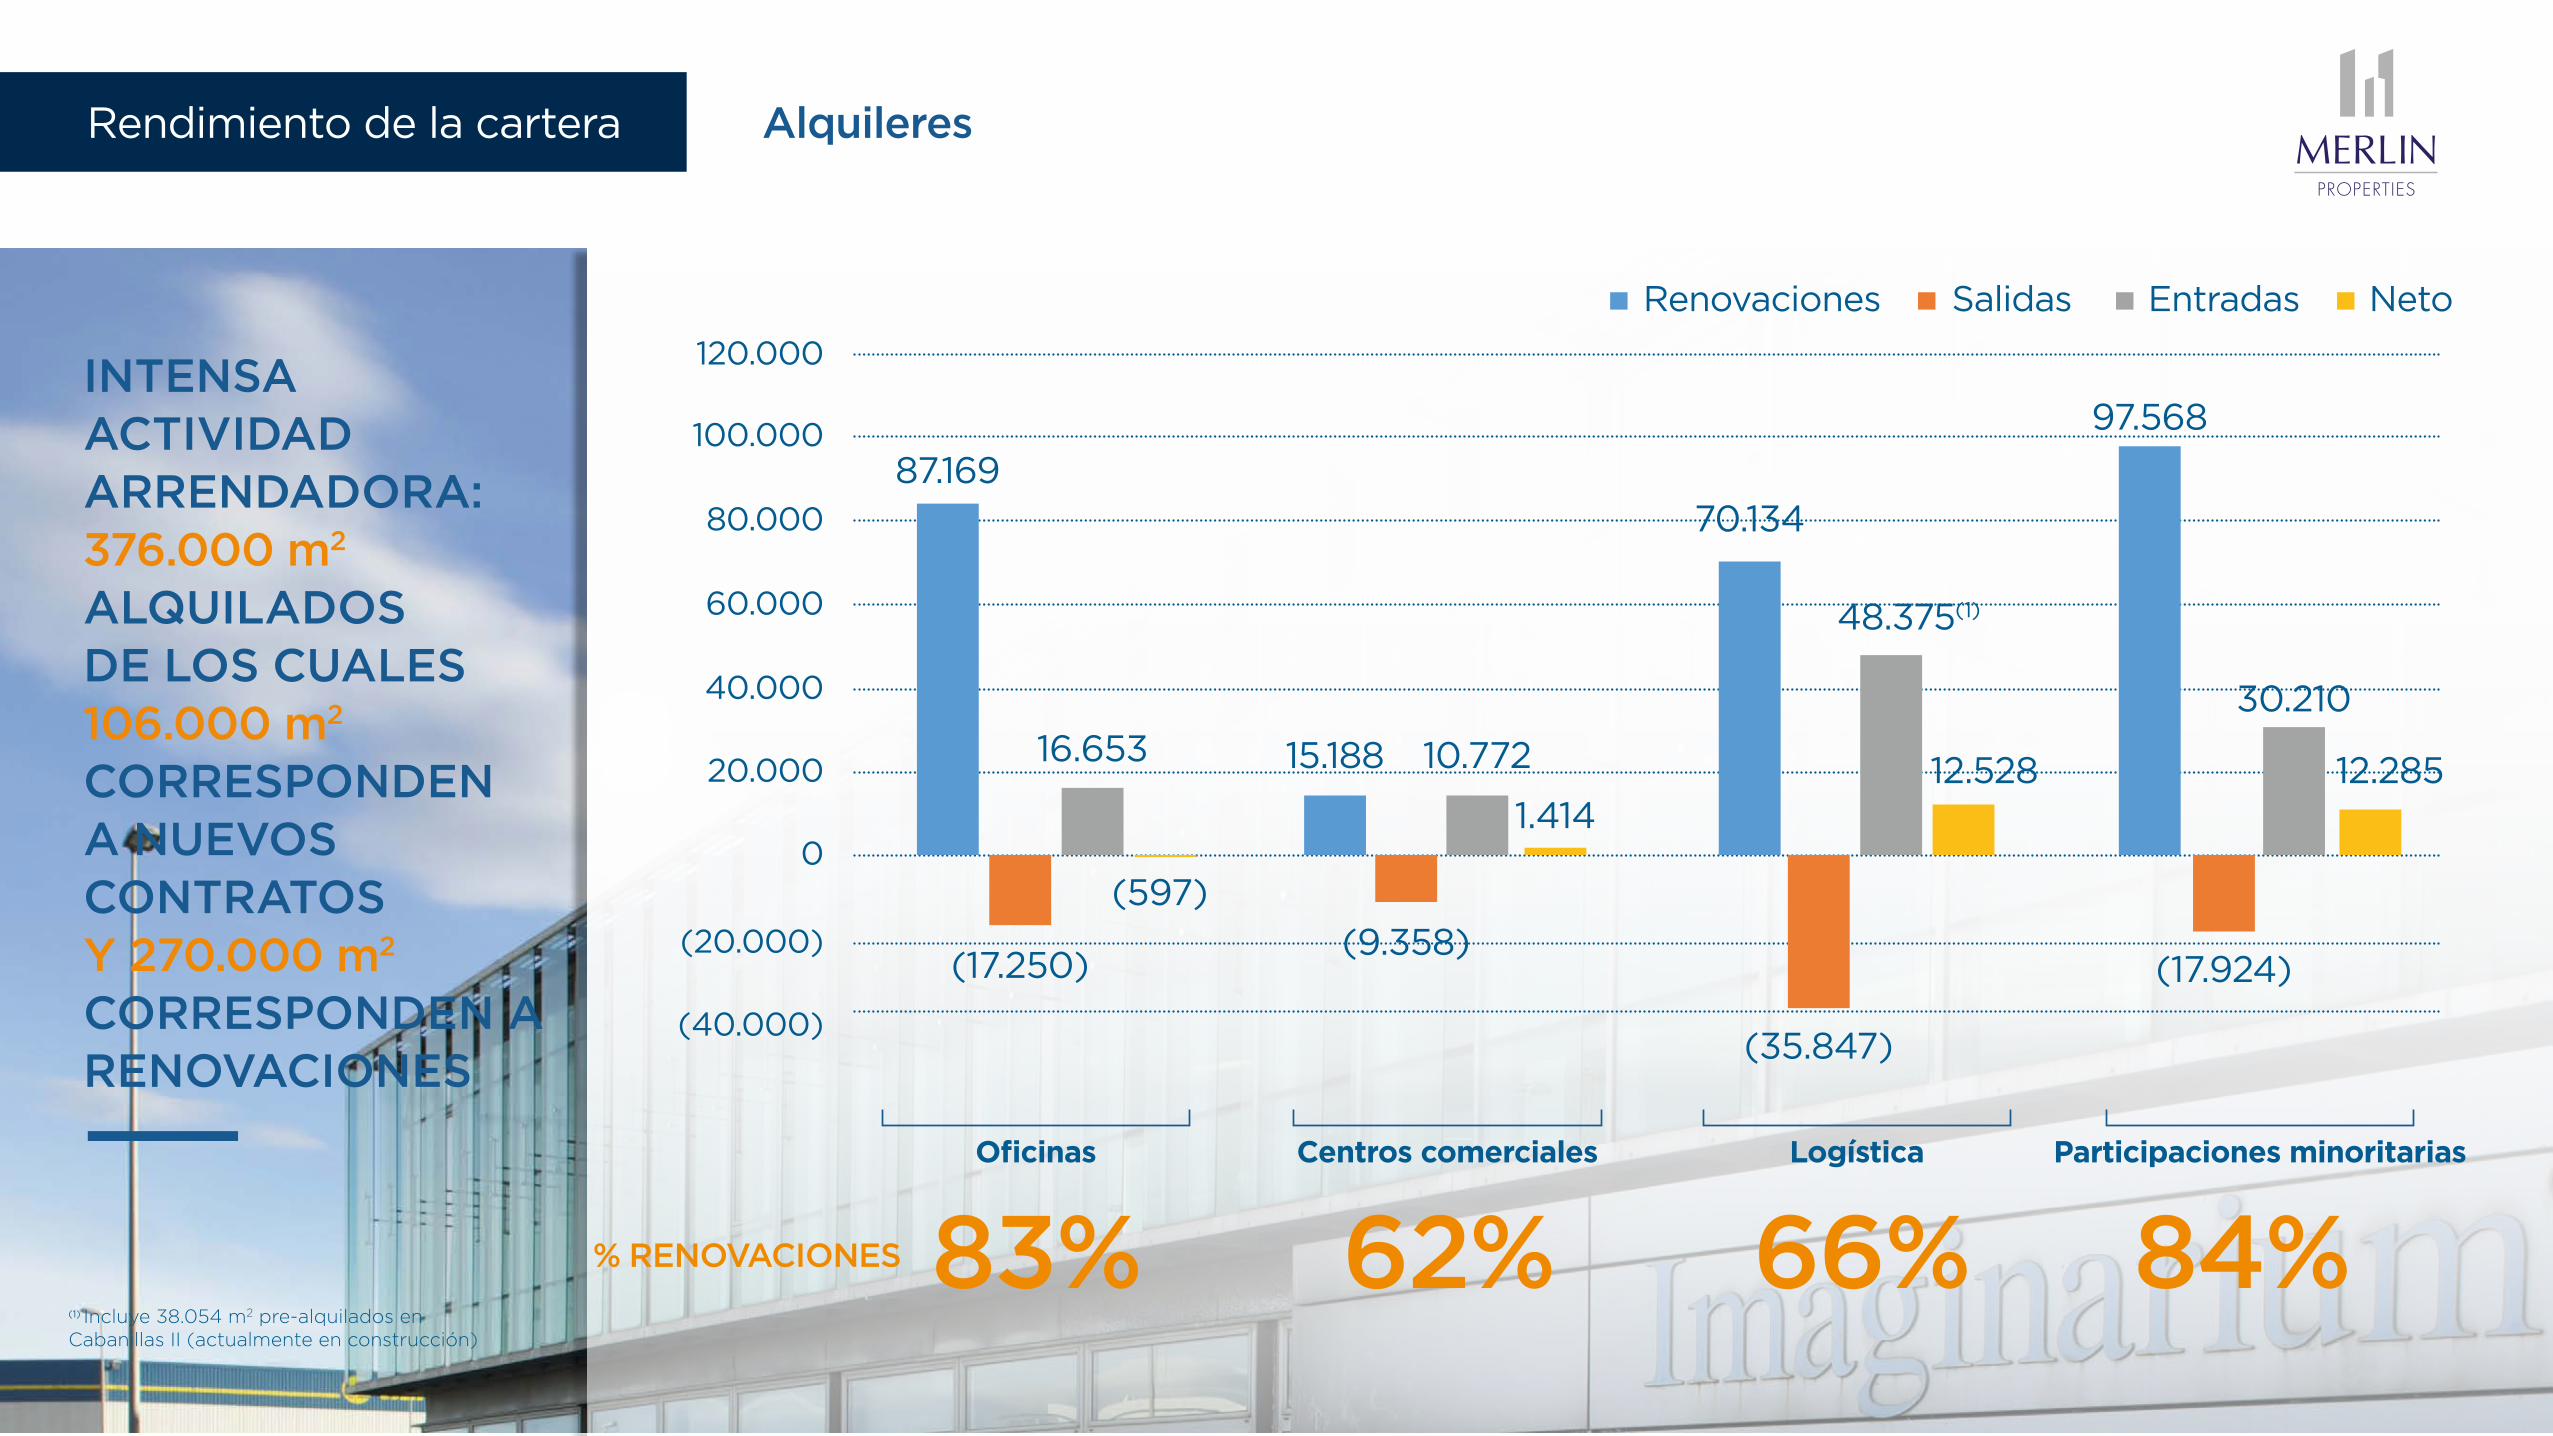
INTENSA ACTIVIDAD ARRENDADORA: 376.000 m2 ALQUILADOS DE LOS CUALES 106.000 m2 CORRESPONDEN A NUEVOS CONTRATOS Y 270.000 m2 CORRESPONDEN A RENOVACIONES
Rendimiento de la cartera
(1) Incluye 38.054 m2 pre-alquilados en Cabanillas II (actualmente en construcción)
% RENOVACIONES 83% 62% 66% 84%
SalidasRenovaciones Entradas Neto
120.000
100.000
80.000
60.000
40.000
20.000
0
(20.000)
(40.000)
(597)
87.169
16.653
(17.250)
Oficinas
70.134
48.375(1)
12.528
(35.847)
Logística
97.568
(17.924)
30.210
12.285
Participaciones minoritarias
15.188 10.772
1.414
(9.358)
Centros comerciales
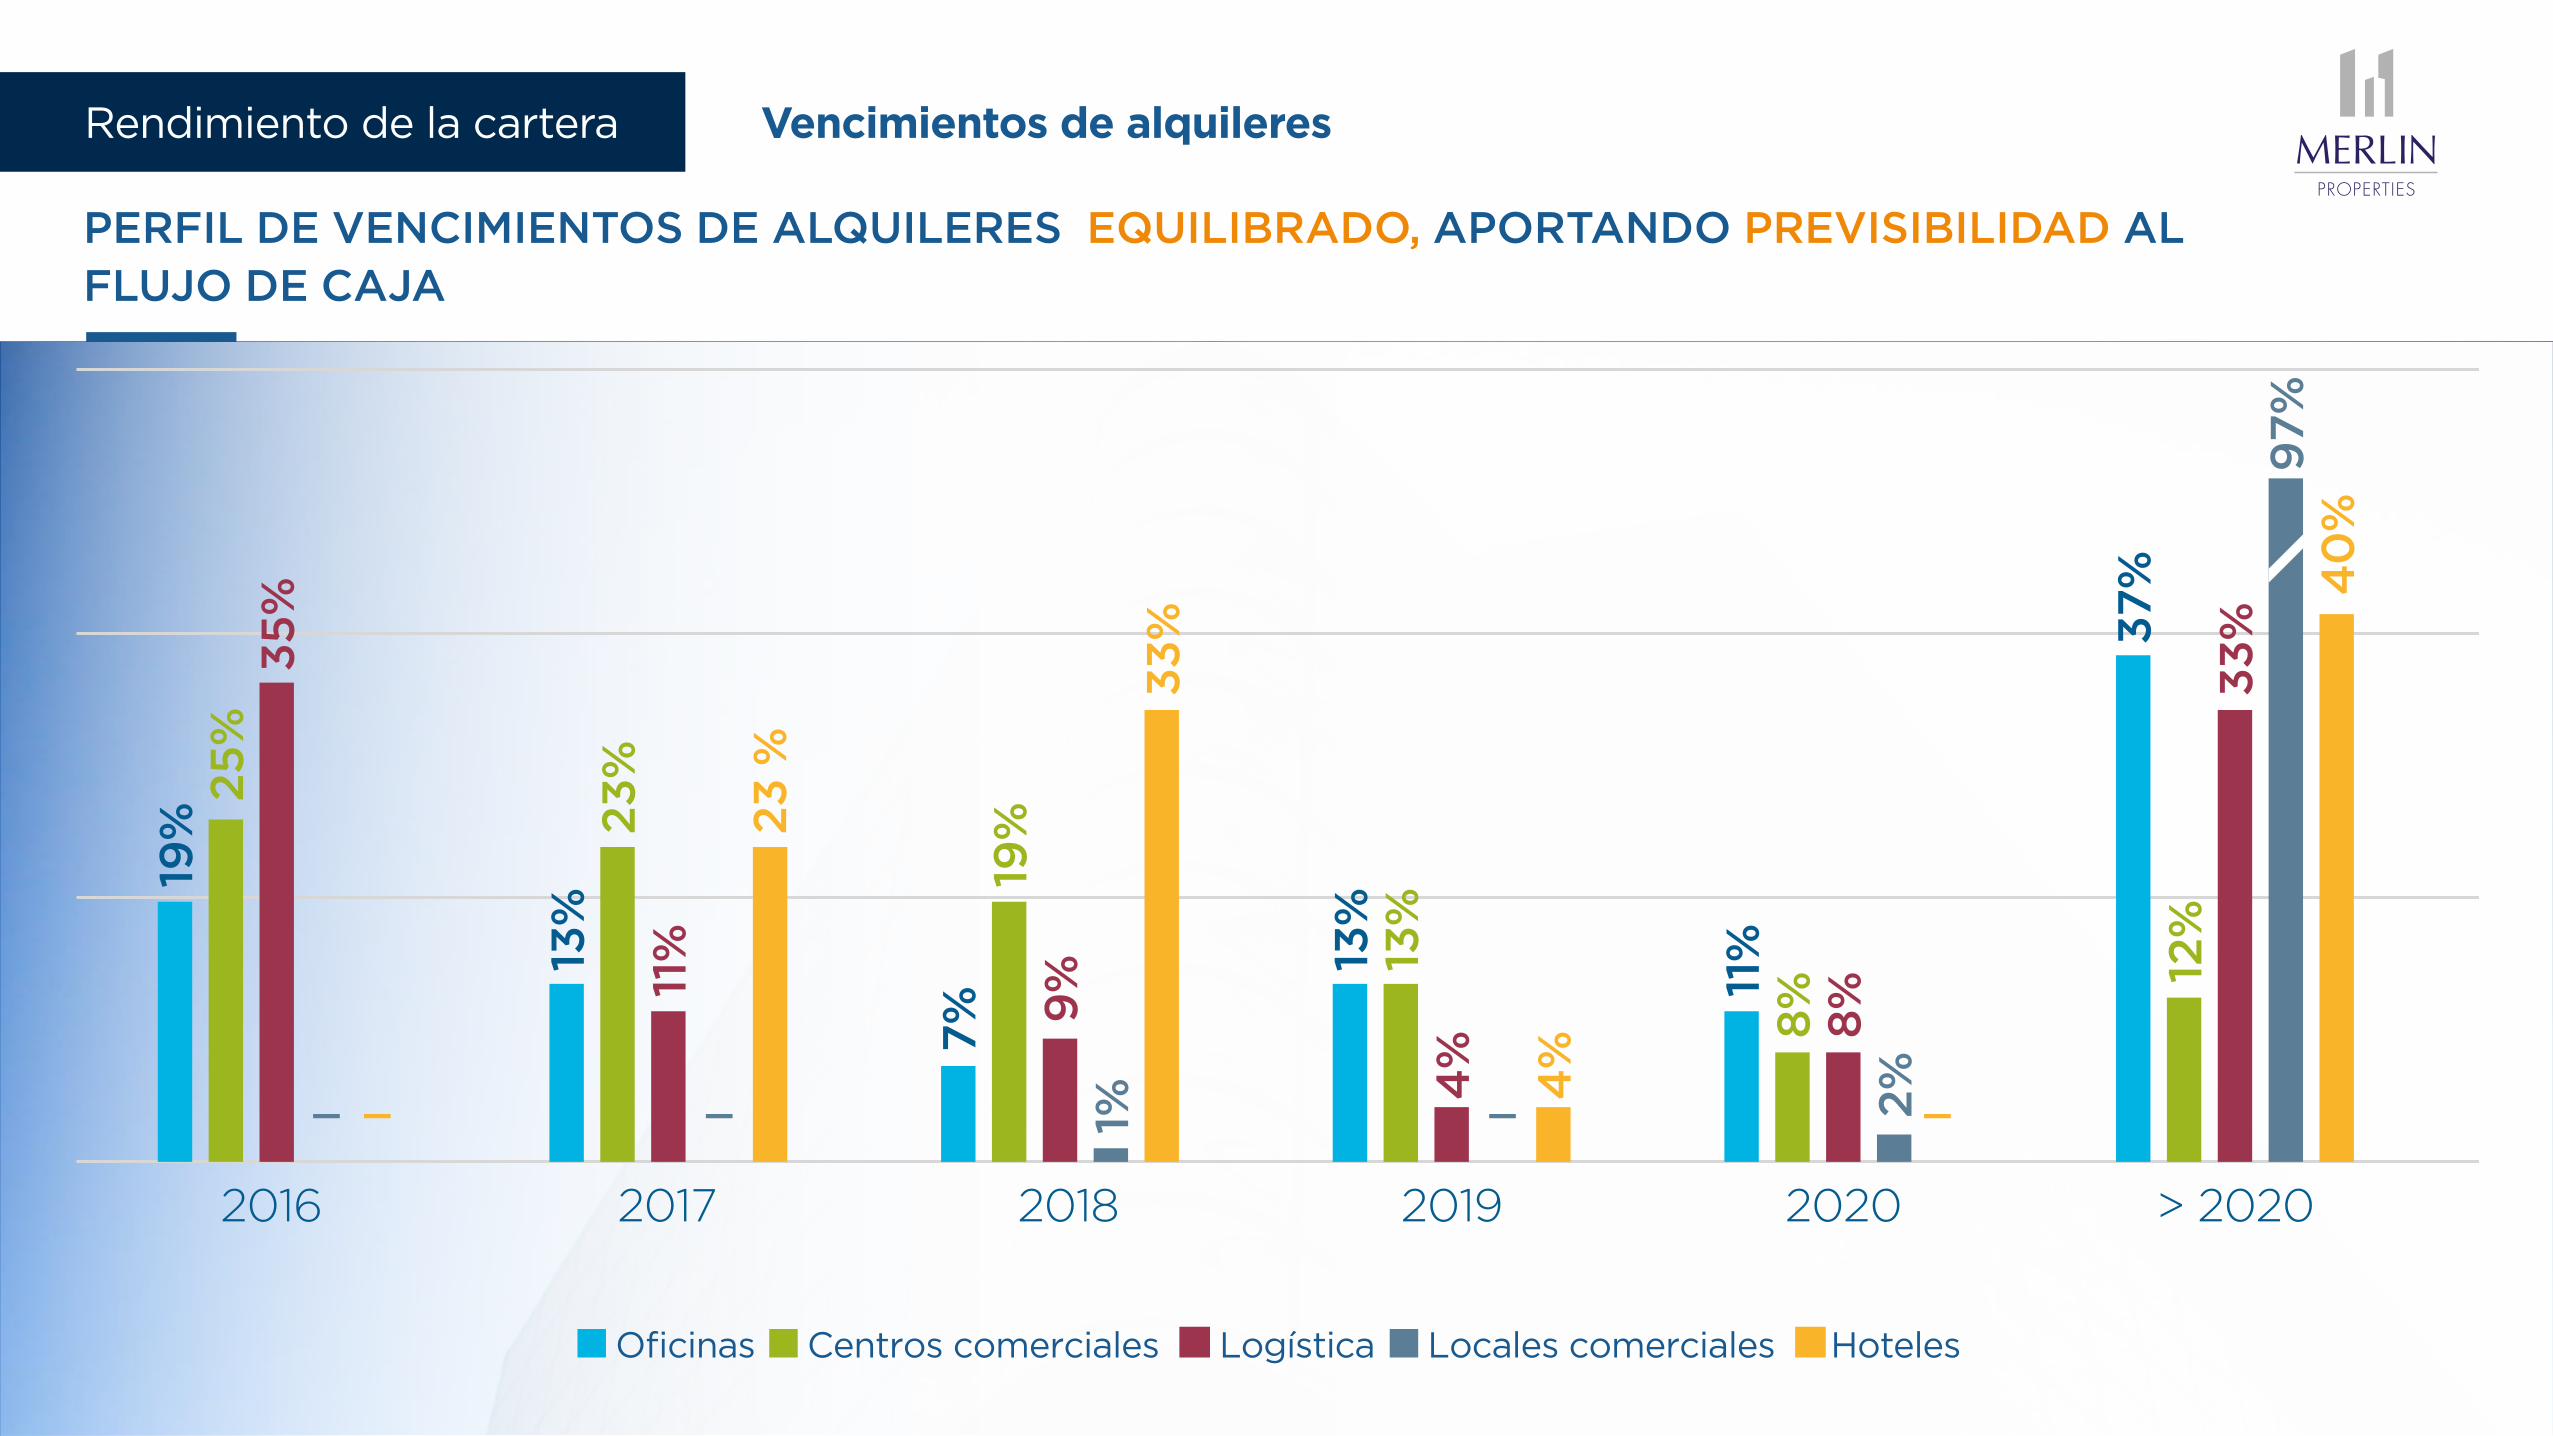
Vencimientos de alquileresRendimiento de la cartera
PERFIL DE VENCIMIENTOS DE ALQUILERES EQUILIBRADO, APORTANDO PREVISIBILIDAD AL FLUJO DE CAJA
2016 2017
19%
35
%
2018 2019 2020 > 2020
Office High Street retail Shopping centers Logistics Hotels
25
%
13%
11%
23 %
23%
7% 9
%1%
33%
19%
13%
4%
4%
13%
11%
8%
8%
2%
37%
33%
97%
40
%
12%
0,0%
10,0%
20,0%
30,0%
40,0%
50,0%
2016 2017
55% 47% 30% 68%
24%
4%
4%
65%
17%
8%
10%
63%
37%
24%
0%
4%
66%
6%
30%7%29%
7%
17%
27%
18%
2018 2019 2020 2021 > 2021
Office High Street retail Shopping centers Logistics Hotels
3%
30%
2016 2017
19%
35
%
2018 2019 2020 > 2020
Oficinas Locales comerciales Centros comerciales Logística Hoteles
25
%
13%
11%
23 %
23%
7% 9
%1%
33%
19%
13%
4%
4%
13%
11%
8%
8%
2%
37%
33%
97%
40
%
12%
0,0%
10,0%
20,0%
30,0%
40,0%
50,0%
2016 2017
55% 47% 30% 68%
24%
4%
4%
65%
17%
8%
10%
63%
37%
24%
0%
4%
66%
6%
30%7%29%
7%
17%
27%
18%
2018 2019 2020 2021 > 2021
Office High Street retail Shopping centers Logistics Hotels
3%
30%

COMPOSICIÓN DEL CONSEJO DE ADMINISTRACIÓN
4Punto orden del día
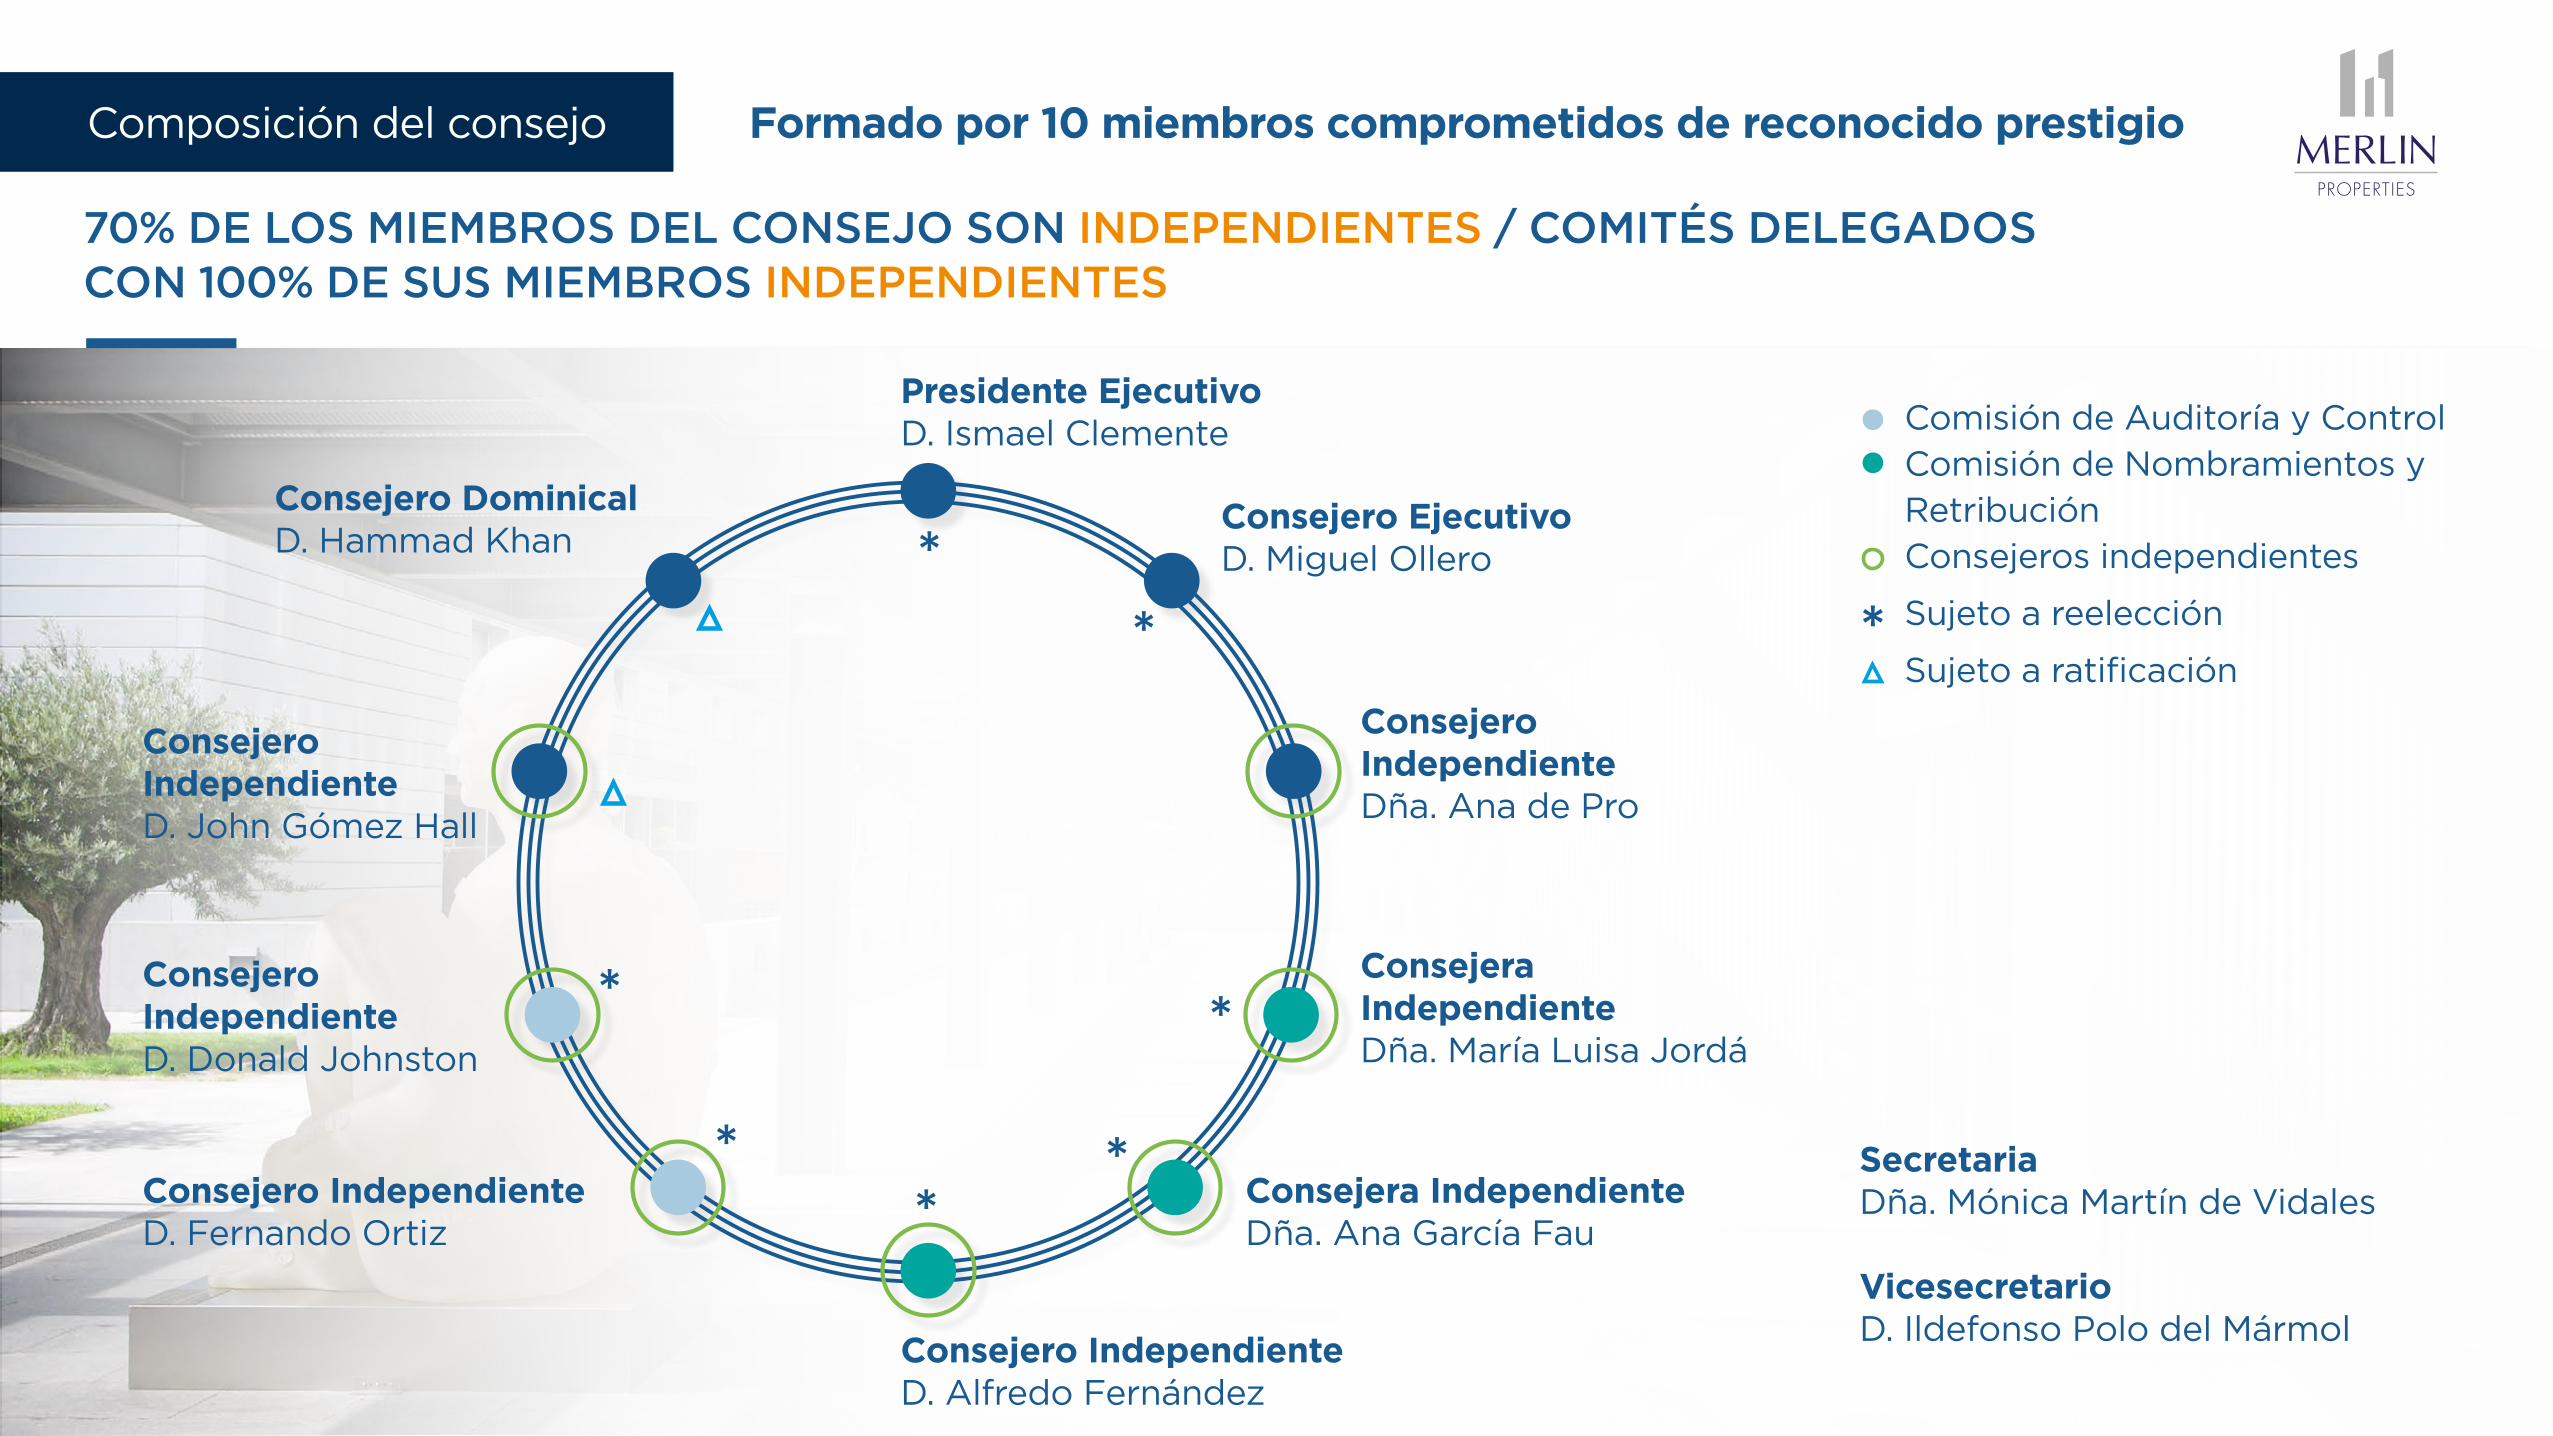
Formado por 10 miembros comprometidos de reconocido prestigioComposición del consejo
70% DE LOS MIEMBROS DEL CONSEJO SON INDEPENDIENTES / COMITÉS DELEGADOS CON 100% DE SUS MIEMBROS INDEPENDIENTES
Secretaria Dña. Mónica Martín de Vidales Vicesecretario D. Ildefonso Polo del Mármol
Comisión de Auditoría y Control Comisión de Nombramientos y Retribución Consejeros independientes
Sujeto a reelección
Sujeto a ratificación
Presidente Ejecutivo D. Ismael Clemente
Consejero Ejecutivo D. Miguel Ollero
Consejero Dominical D. Hammad Khan
Consejero Independiente Dña. Ana de Pro
Consejera Independiente Dña. María Luisa Jordá
Consejera Independiente Dña. Ana García Fau
Consejero Independiente D. Alfredo Fernández
Consejero Independiente D. Fernando Ortiz
Consejero Independiente D. Donald Johnston
Consejero Independiente D. John Gómez Hall

REMUNERACIÓN
5 ı 6 ı 7 ı 8Puntos orden del día
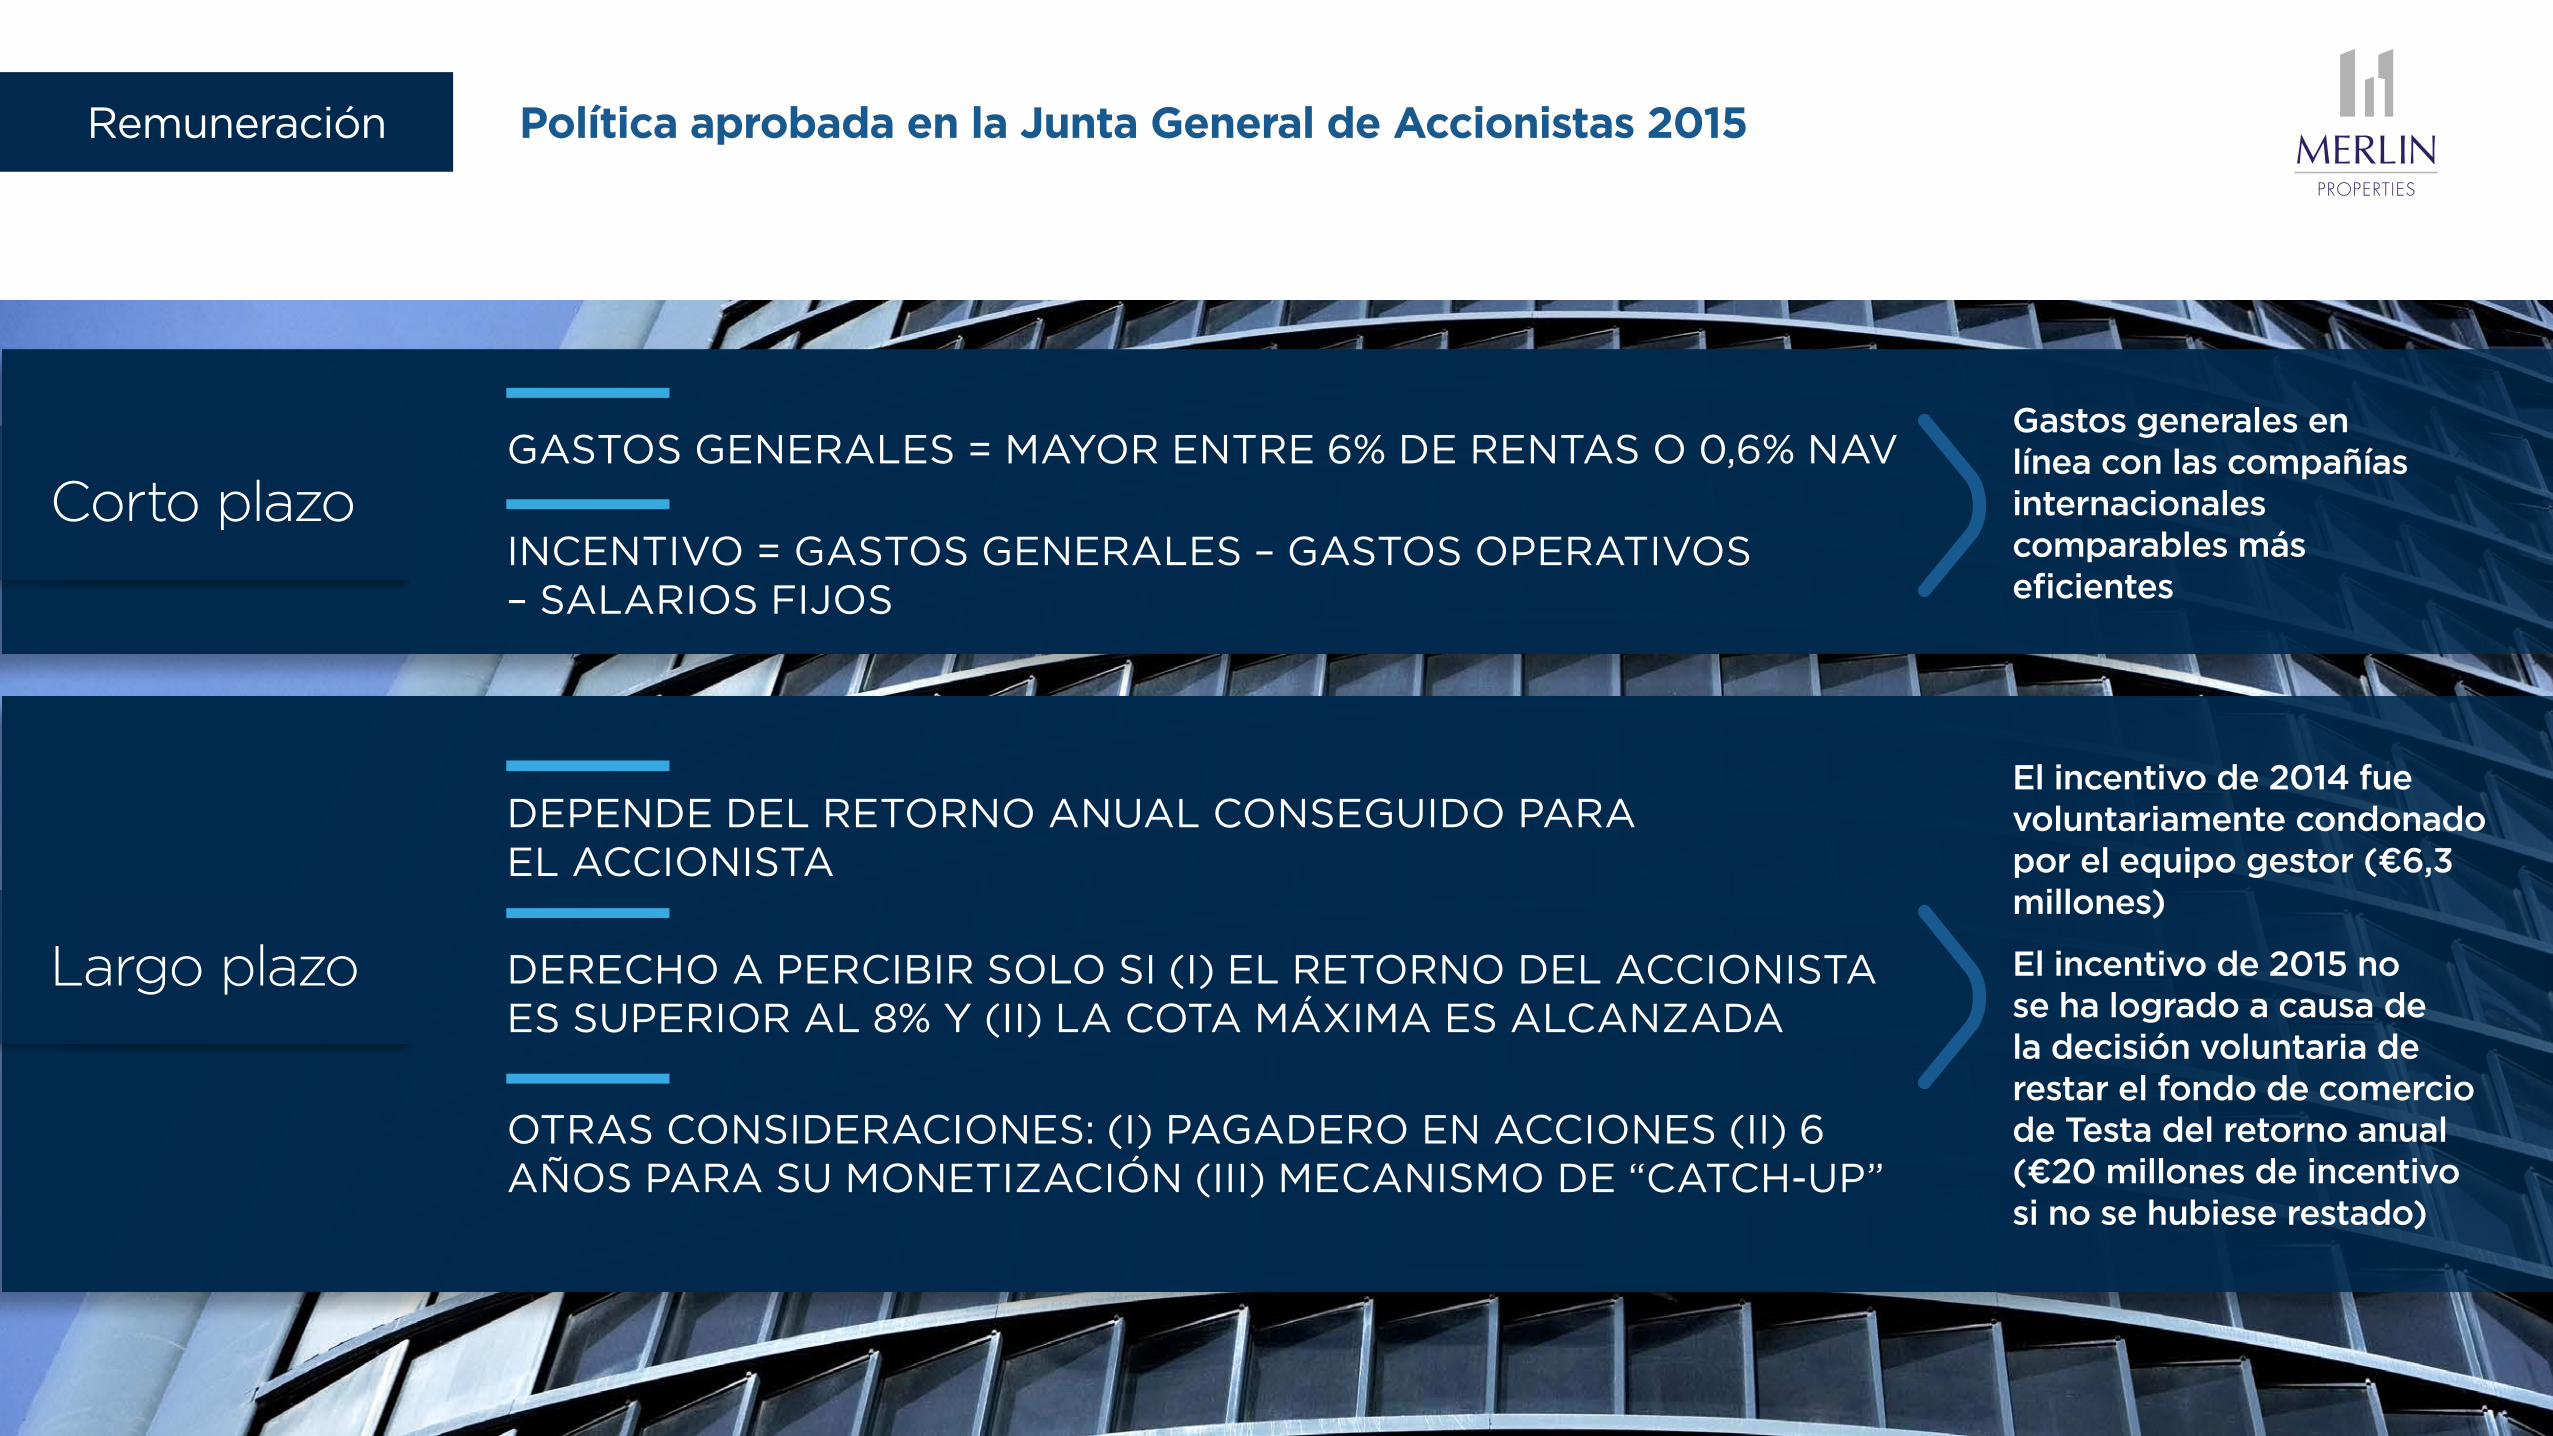
Política aprobada en la Junta General de Accionistas 2015Remuneración
GASTOS GENERALES = MAYOR ENTRE 6% DE RENTAS O 0,6% NAV
INCENTIVO = GASTOS GENERALES – GASTOS OPERATIVOS – SALARIOS FIJOS
Corto plazo
DEPENDE DEL RETORNO ANUAL CONSEGUIDO PARA EL ACCIONISTA
DERECHO A PERCIBIR SOLO SI (I) EL RETORNO DEL ACCIONISTA ES SUPERIOR AL 8% Y (II) LA COTA MÁXIMA ES ALCANZADA
OTRAS CONSIDERACIONES: (I) PAGADERO EN ACCIONES (II) 6 AÑOS PARA SU MONETIZACIÓN (III) MECANISMO DE “CATCH-UP”
Largo plazo
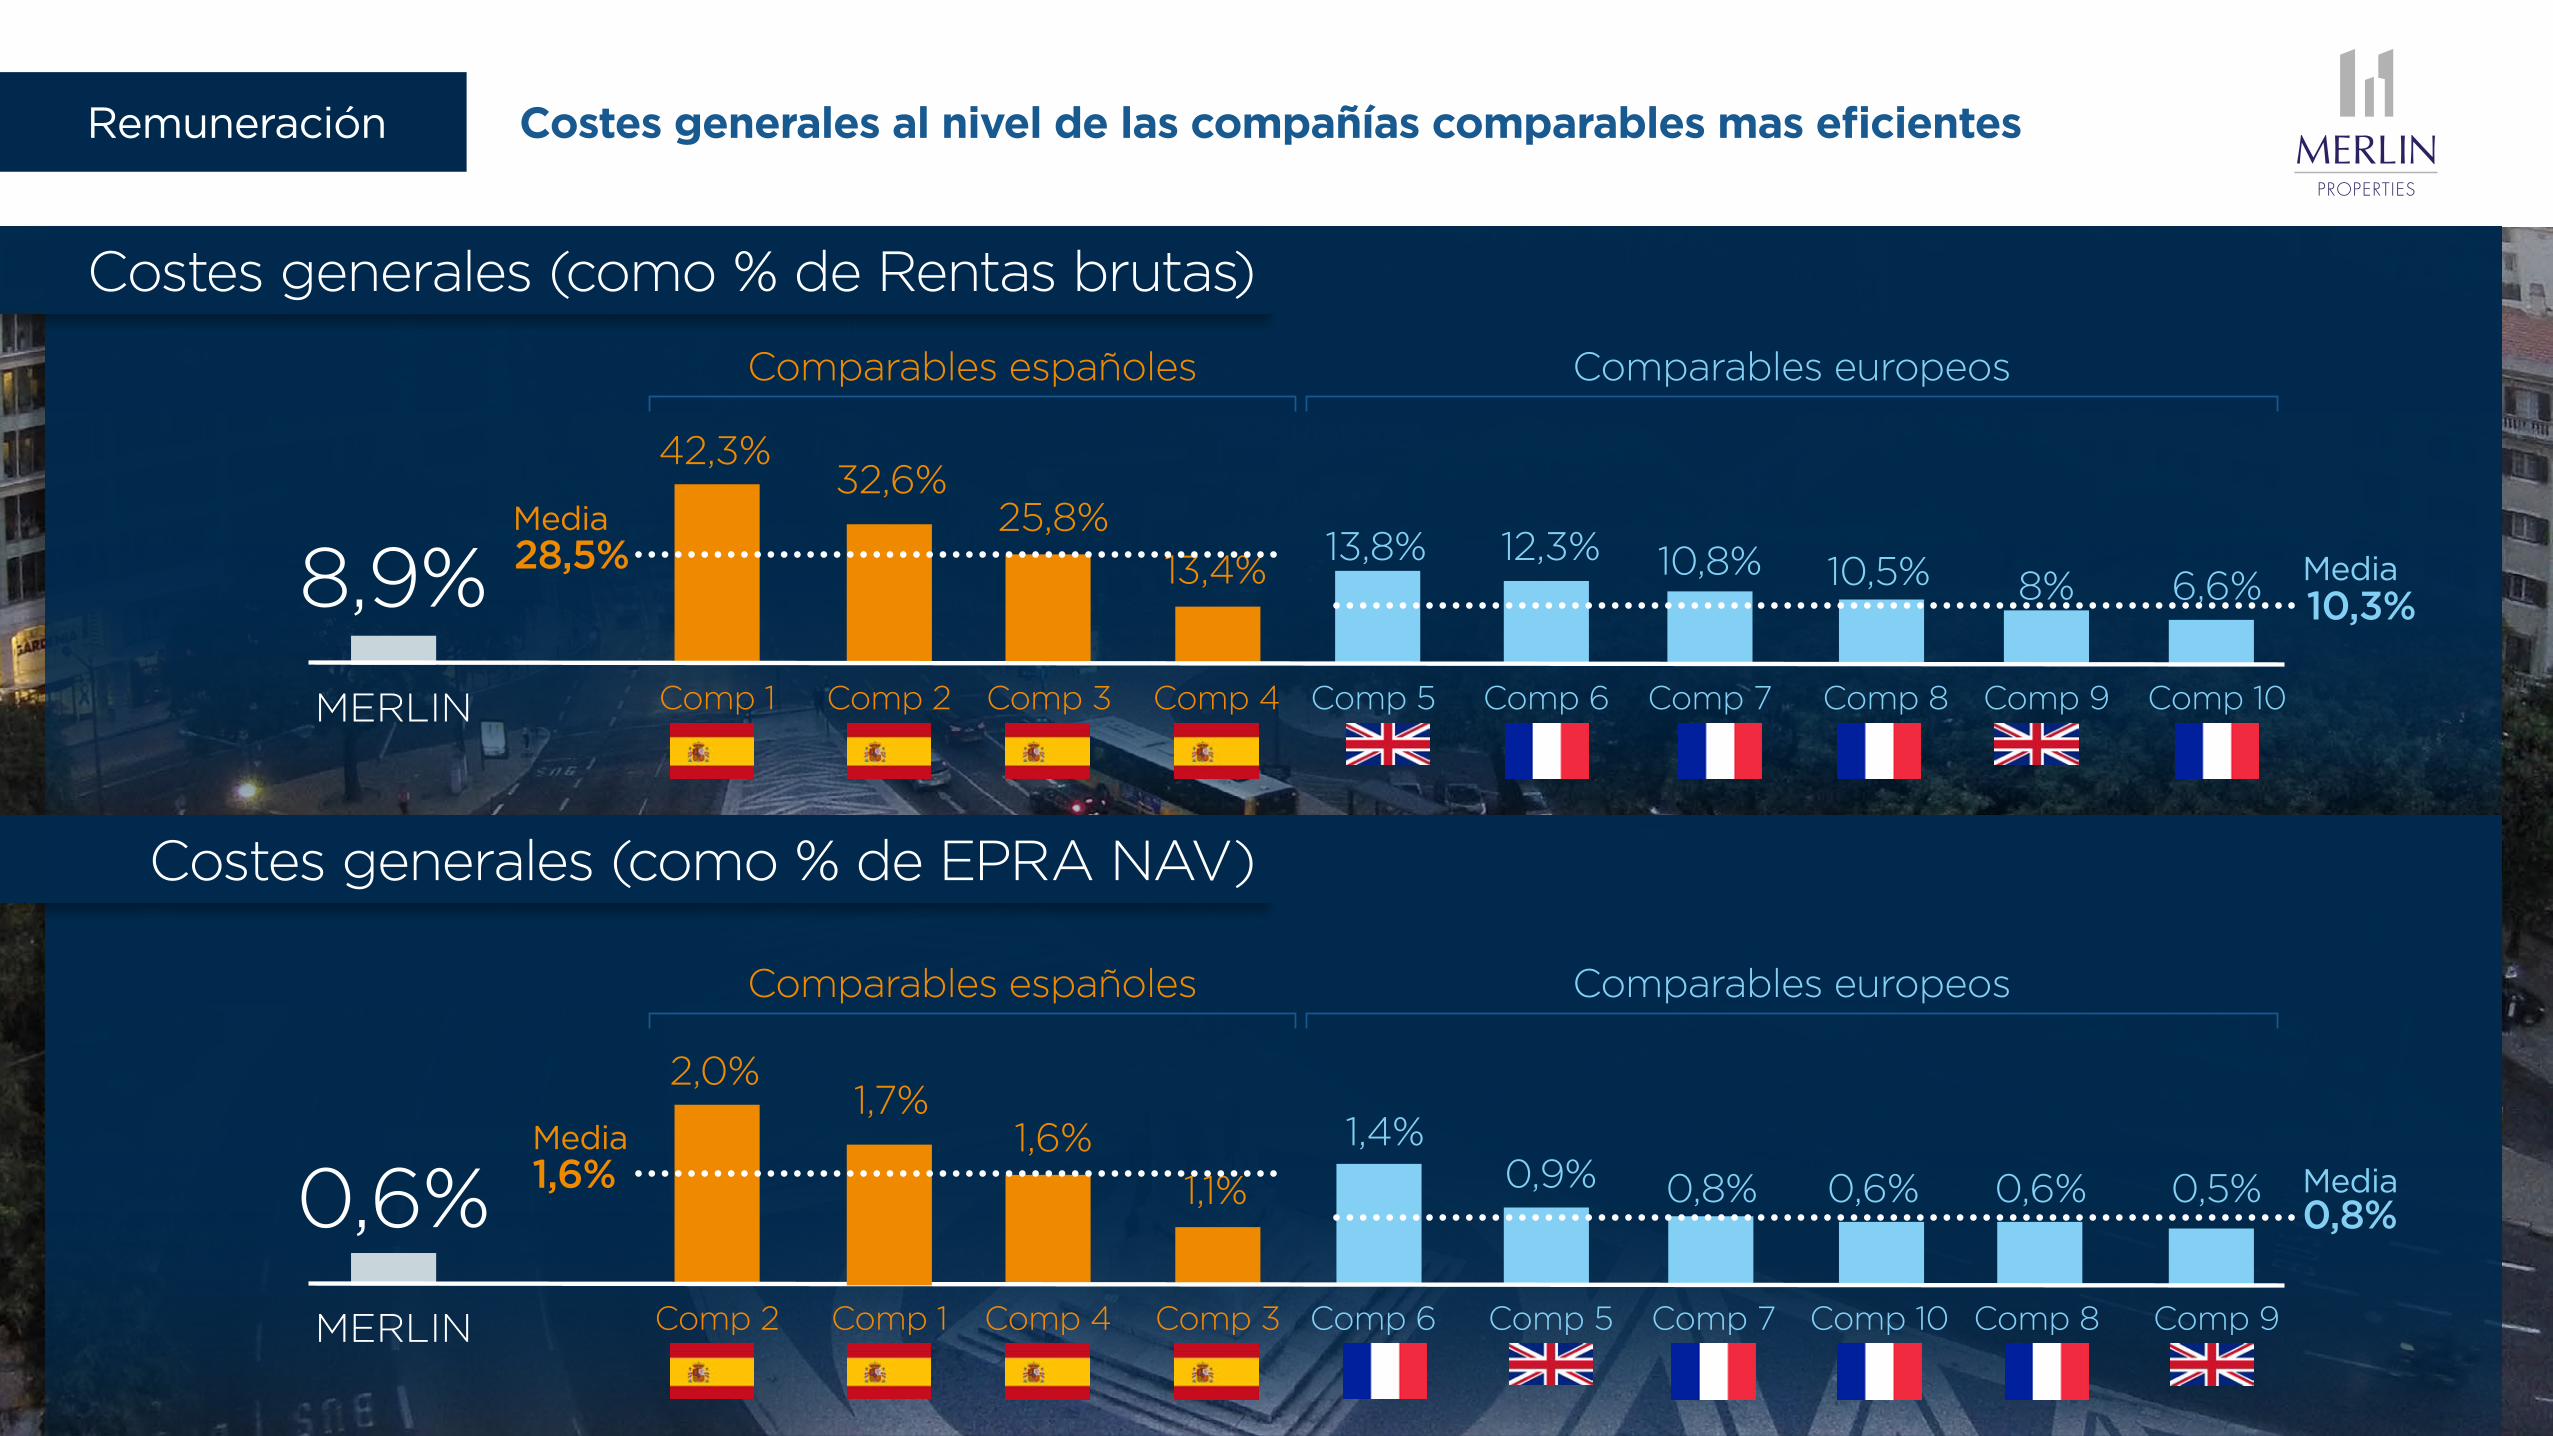
Gastos generales en línea con las compañías internacionales comparables más eficientes
El incentivo de 2014 fue voluntariamente condonado por el equipo gestor (€6,3 millones)
El incentivo de 2015 no se ha logrado a causa de la decisión voluntaria de restar el fondo de comercio de Testa del retorno anual (€20 millones de incentivo si no se hubiese restado)
Remuneración
Costes generales (como % de Rentas brutas)
Costes generales (como % de EPRA NAV)
Comparables españoles Comparables europeos
Comparables españoles Comparables europeos
Costes generales al nivel de las compañías comparables mas eficientes
Comp 1 Comp 2 Comp 3 Comp 4 Comp 5
Comp 6 Comp 5 Comp 7 Comp 10 Comp 8 Comp 9
Comp 6 Comp 7 Comp 8 Comp 9 Comp 10
6,6%8%10,5%10,8%12,3%13,4%
25,8%32,6%
42,3%
8,9%MERLIN
28,5%10,3%
13,8%
Comp 2 Comp 4 Comp 3
0,5%0,6%0,6%0,8%0,9%1,4%
1,1%1,6%
Comp 1
1,7%2,0%
0,6%MERLIN
1,6%0,8%
Media
Media
Media
Media
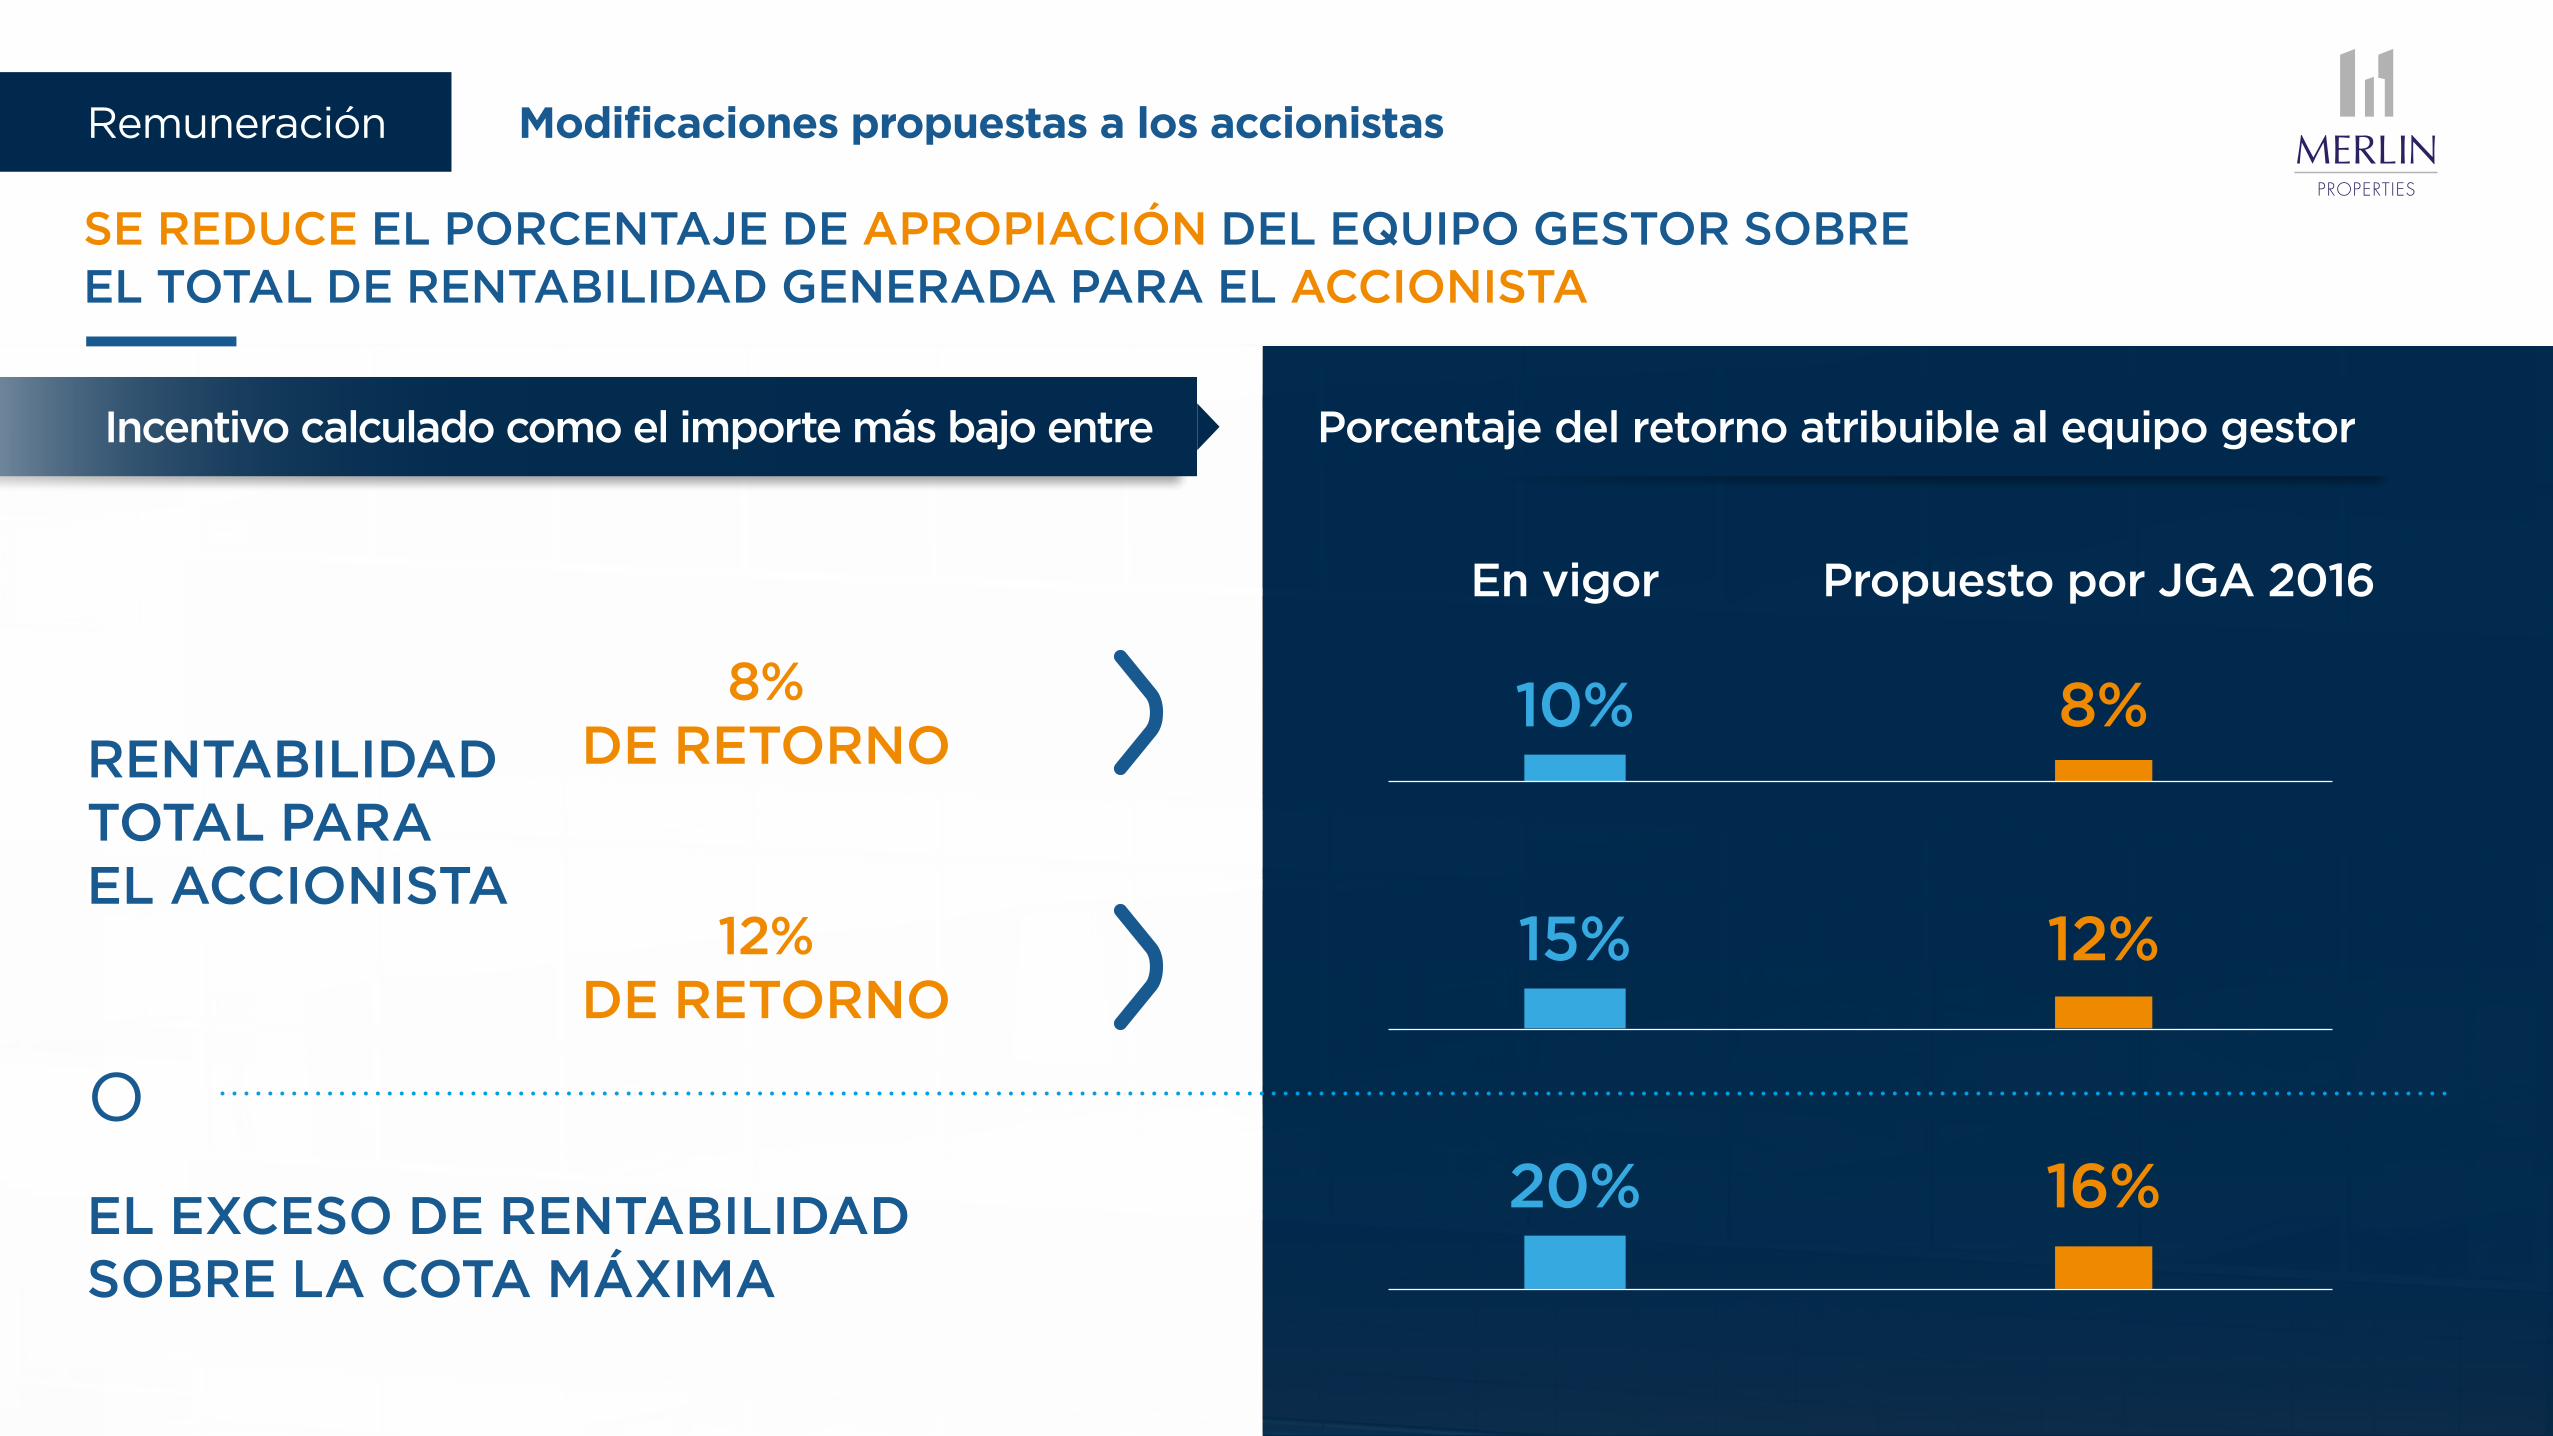
10% 8%
15% 12%
20% 16%
En vigor Propuesto por JGA 2016
O
RENTABILIDAD TOTAL PARA EL ACCIONISTA
8% DE RETORNO
12% DE RETORNO
EL EXCESO DE RENTABILIDAD SOBRE LA COTA MÁXIMA
Incentivo calculado como el importe más bajo entre Porcentaje del retorno atribuible al equipo gestor
SE REDUCE EL PORCENTAJE DE APROPIACIÓN DEL EQUIPO GESTOR SOBRE EL TOTAL DE RENTABILIDAD GENERADA PARA EL ACCIONISTA
Modificaciones propuestas a los accionistasRemuneración
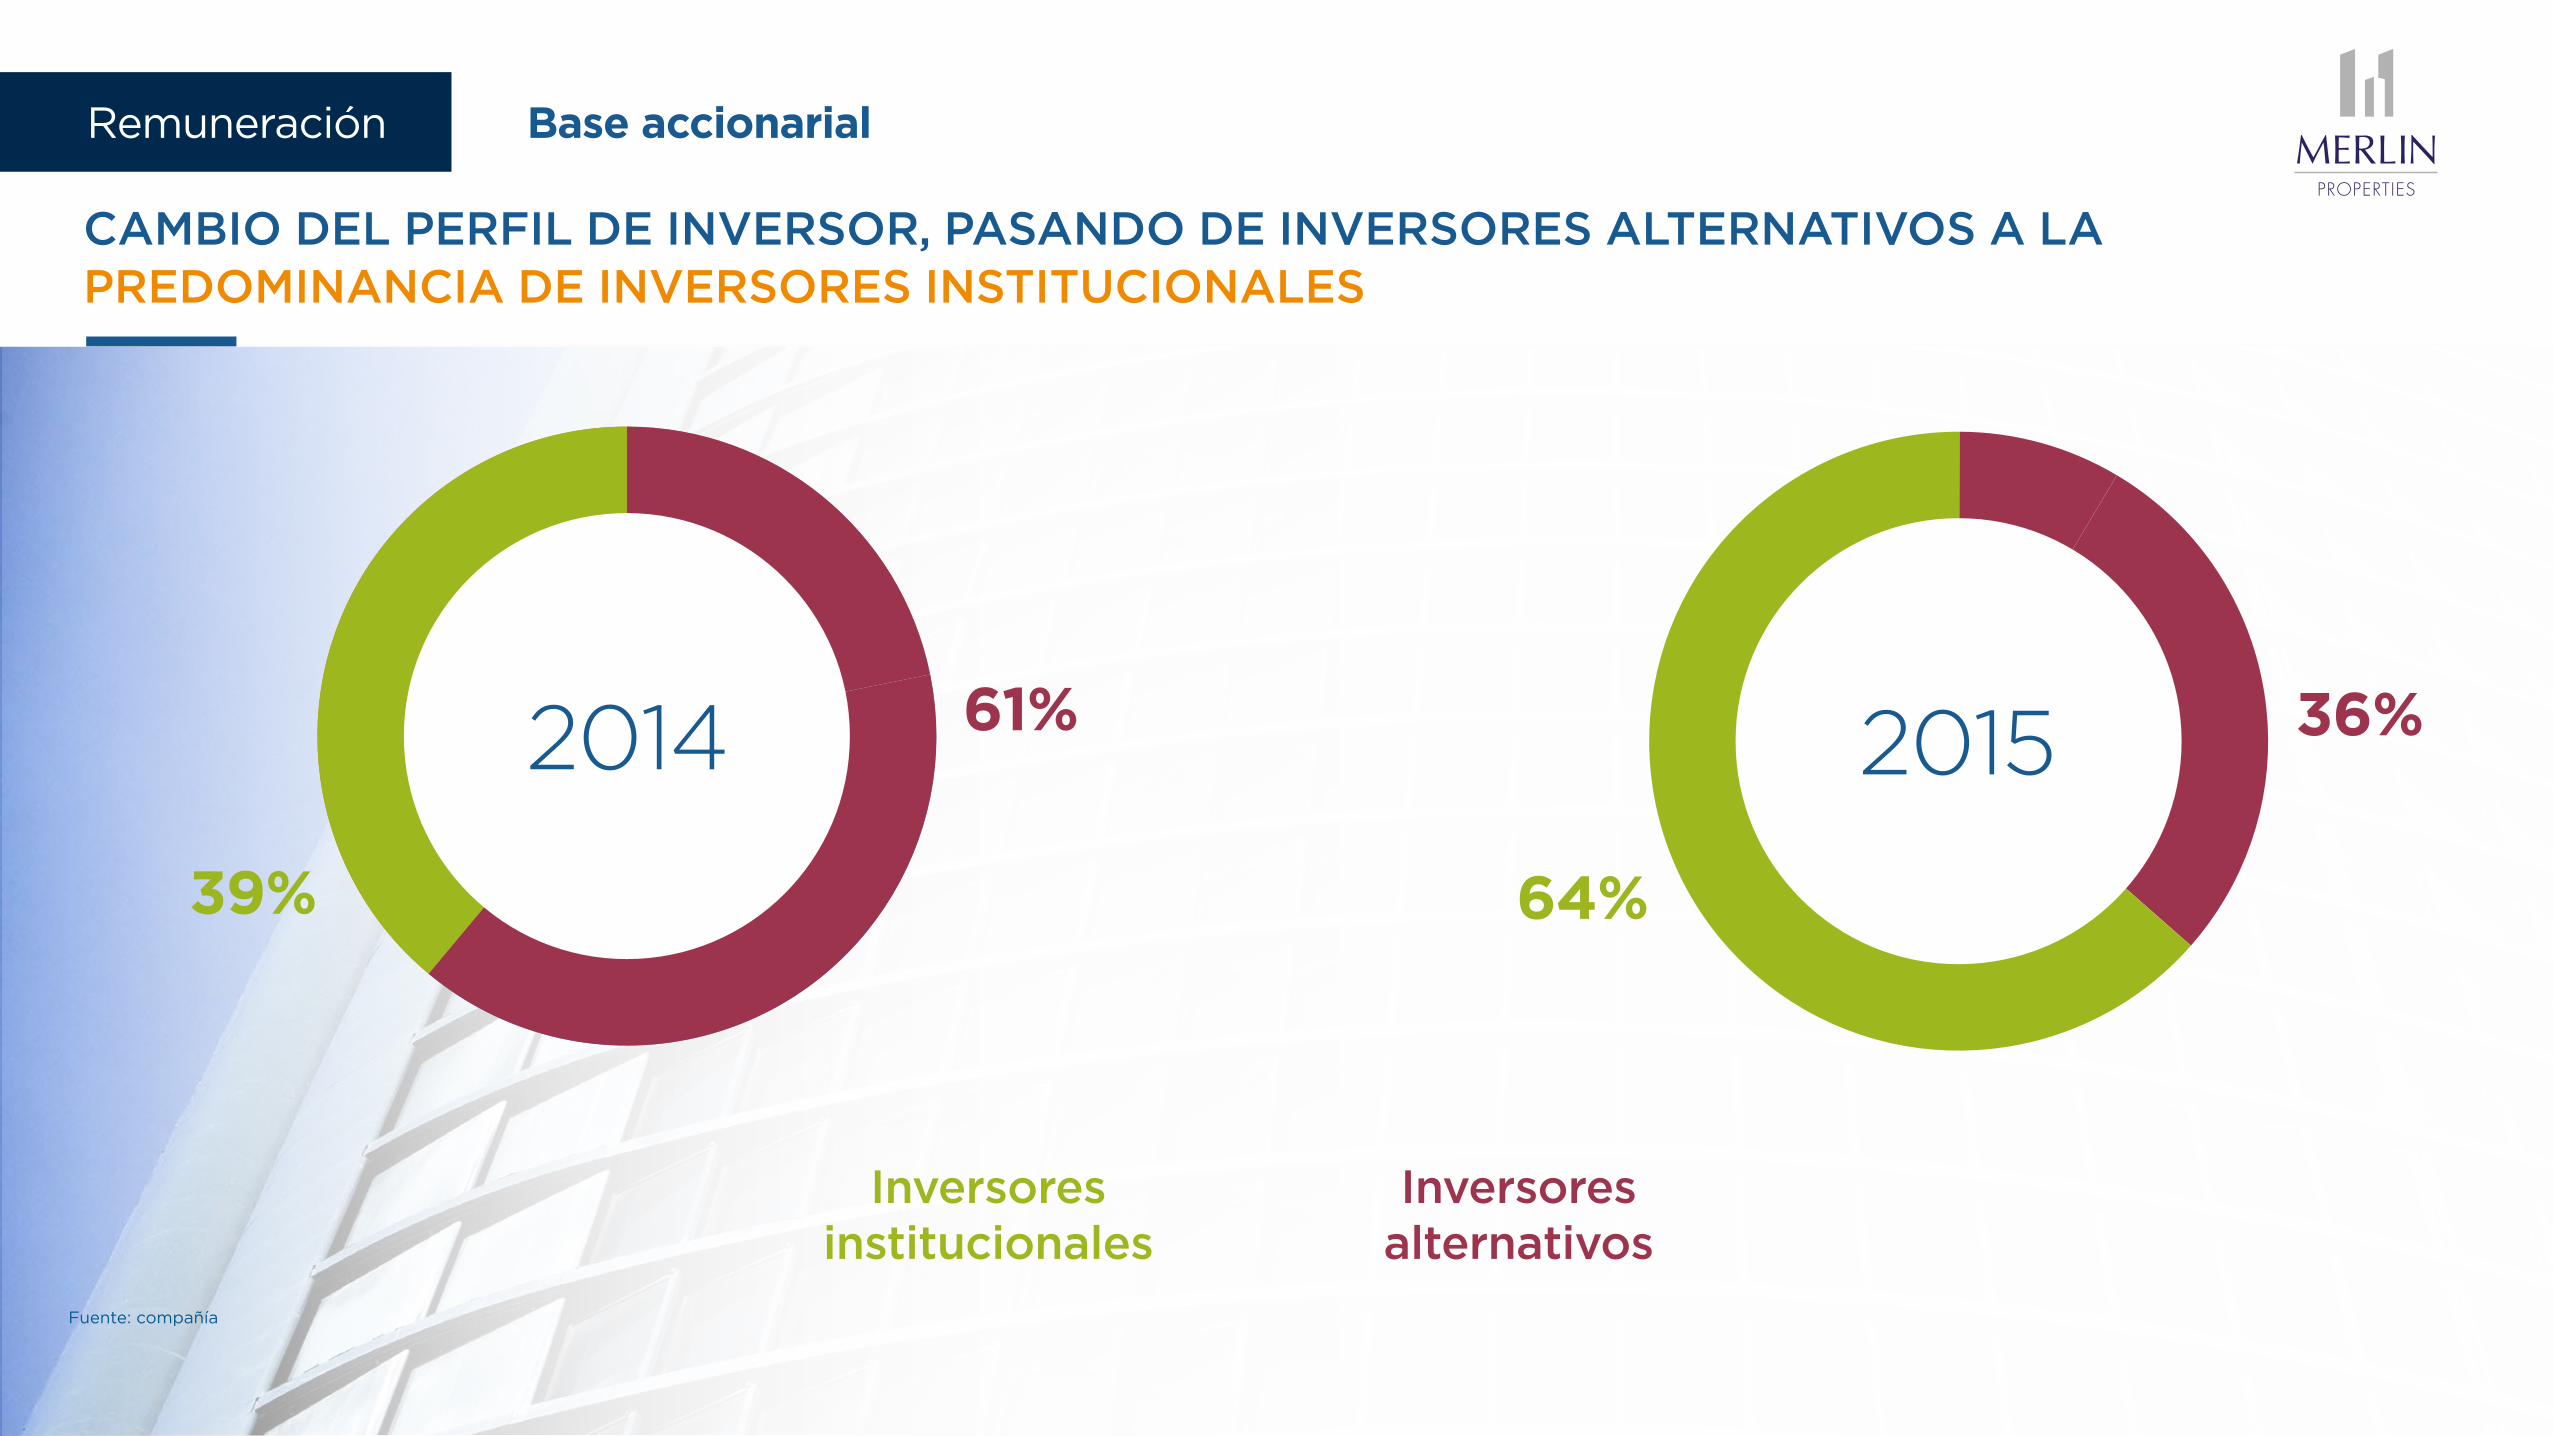
Inversores institucionales
Inversores alternativos
39%
61%2014
64%
36%2015
CAMBIO DEL PERFIL DE INVERSOR, PASANDO DE INVERSORES ALTERNATIVOS A LA PREDOMINANCIA DE INVERSORES INSTITUCIONALES
Fuente: compañía
Base accionarialRemuneración
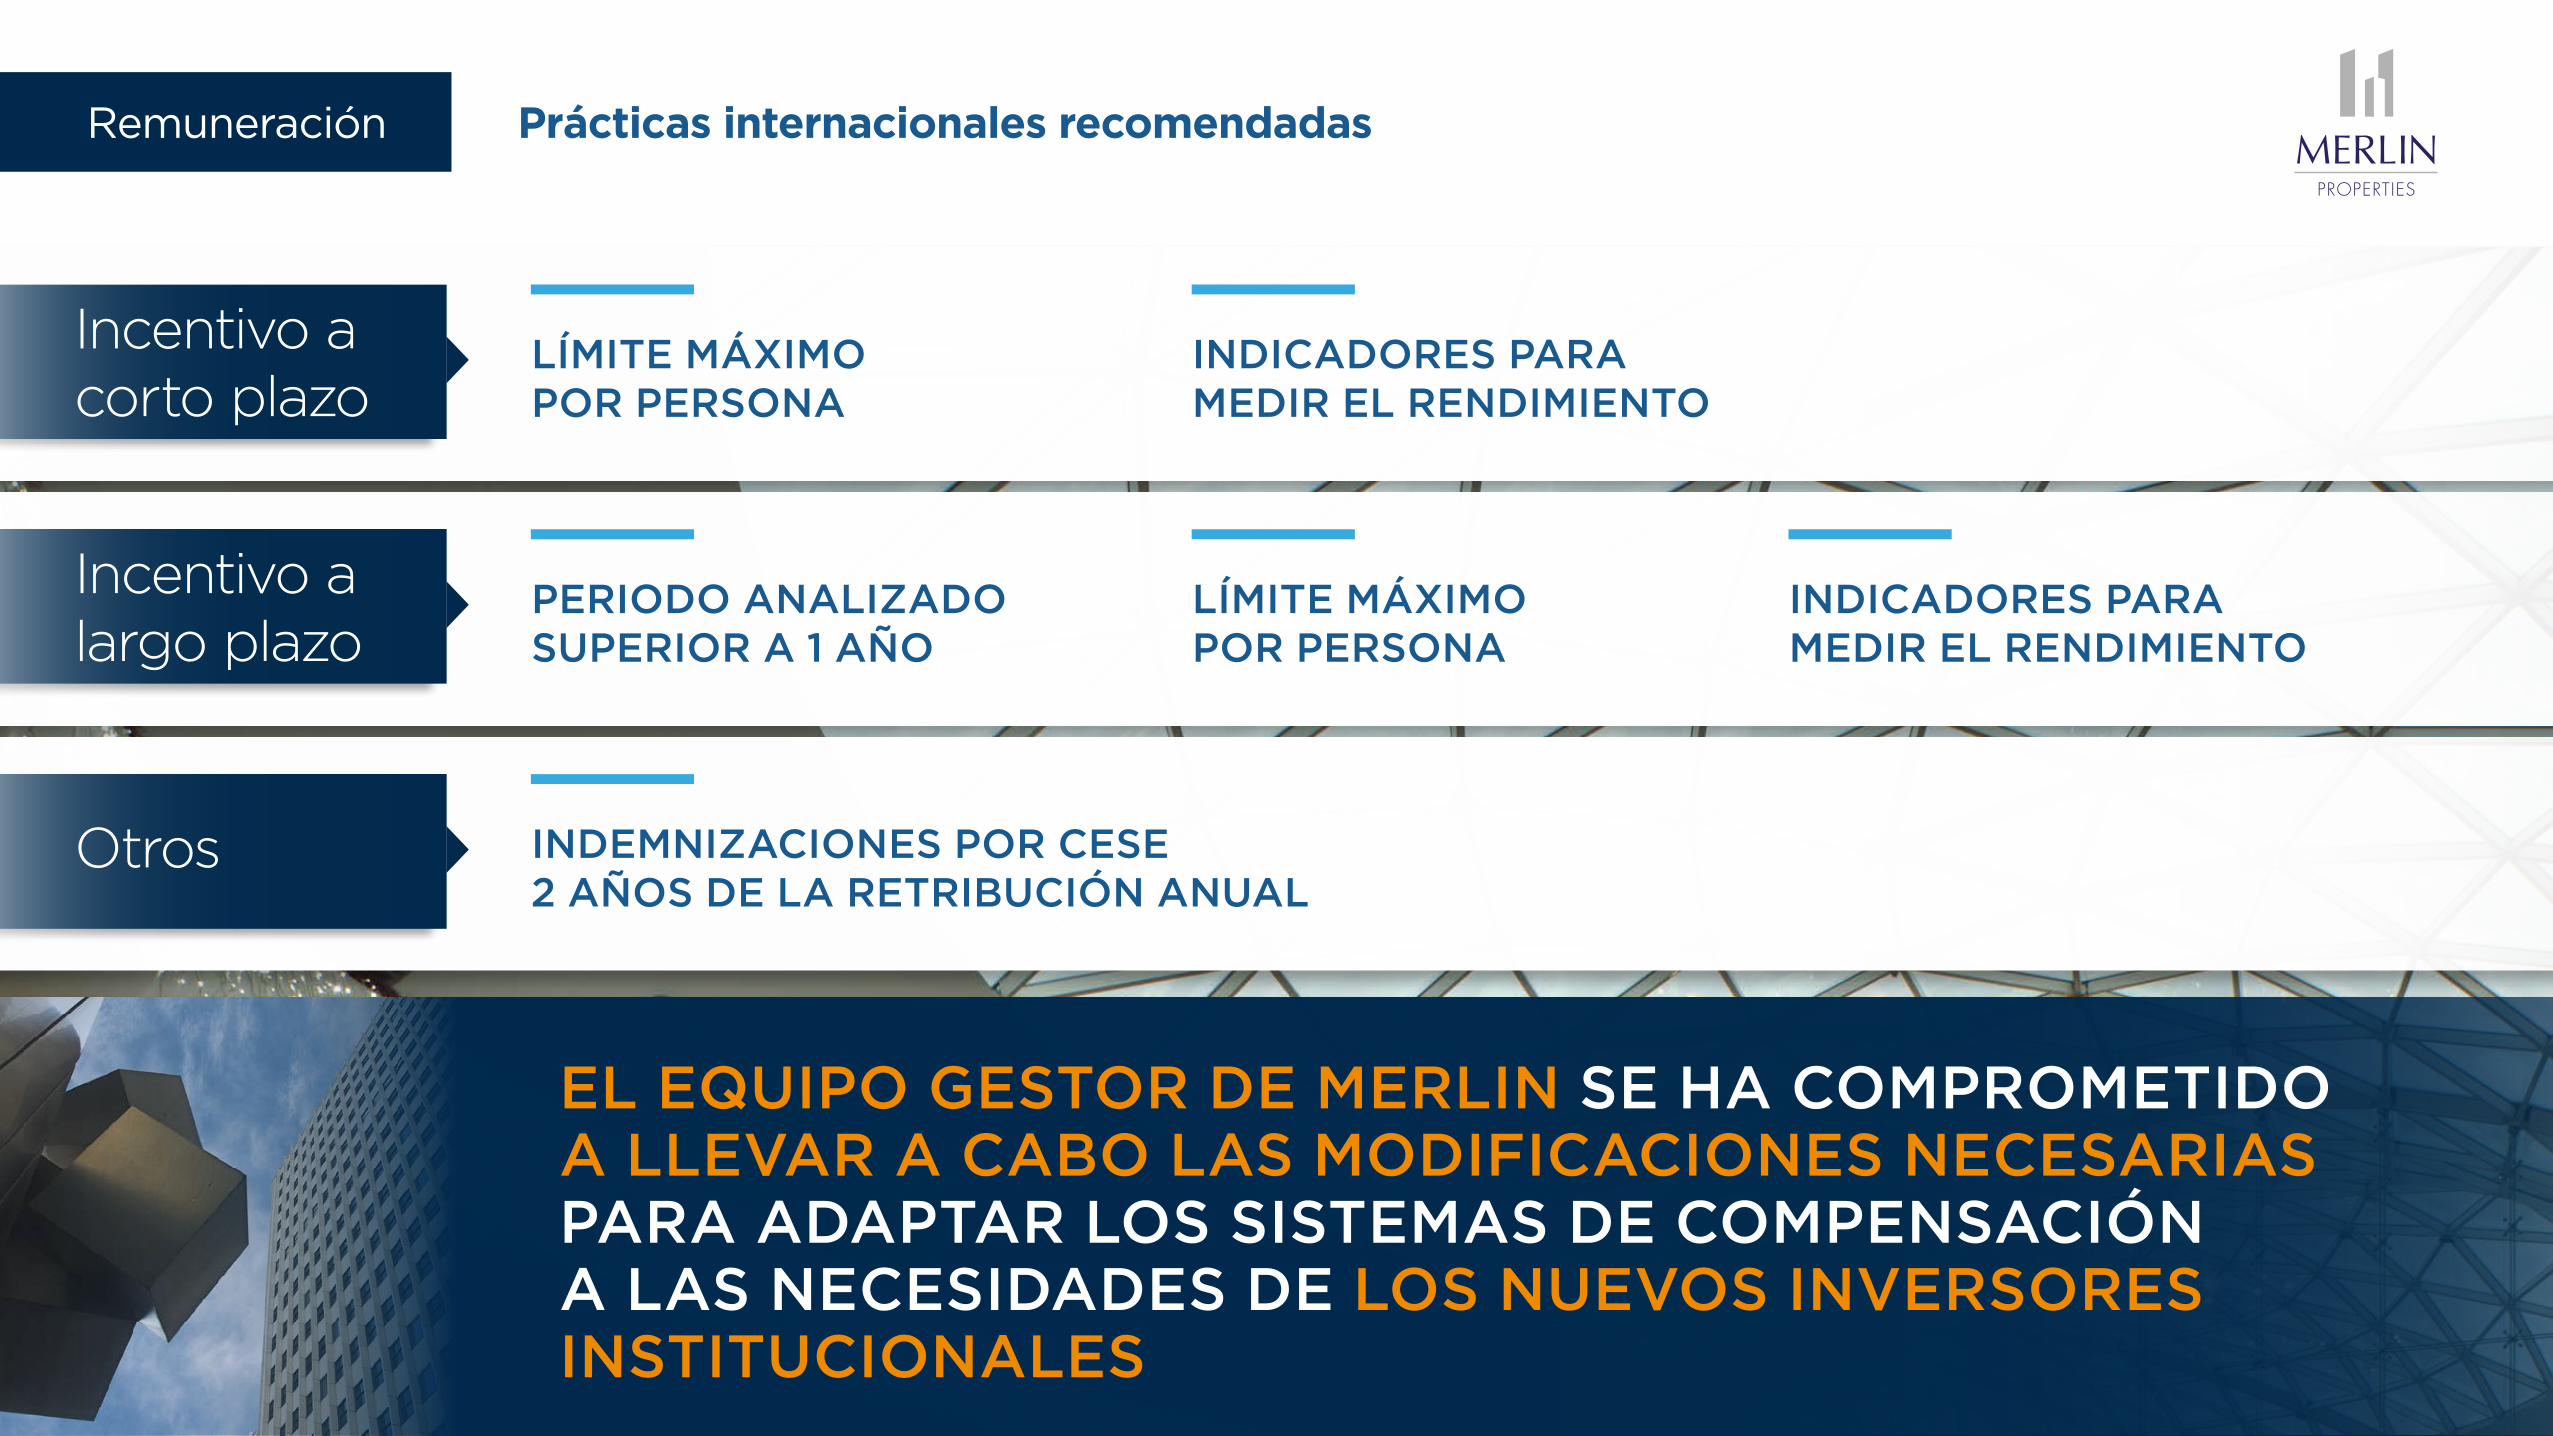
Prácticas internacionales recomendadas
LÍMITE MÁXIMO POR PERSONA
INDICADORES PARA MEDIR EL RENDIMIENTO
Incentivo a corto plazo
LÍMITE MÁXIMO POR PERSONA
INDICADORES PARA MEDIR EL RENDIMIENTO
PERIODO ANALIZADO SUPERIOR A 1 AÑO
Incentivo a largo plazo
INDEMNIZACIONES POR CESE 2 AÑOS DE LA RETRIBUCIÓN ANUAL
Otros
EL EQUIPO GESTOR DE MERLIN SE HA COMPROMETIDO A LLEVAR A CABO LAS MODIFICACIONES NECESARIAS PARA ADAPTAR LOS SISTEMAS DE COMPENSACIÓN A LAS NECESIDADES DE LOS NUEVOS INVERSORES INSTITUCIONALES
Remuneración

EVENTOS DE CAPITAL Y DEUDADELEGACIÓN EN EL CONSEJO DE ADMINISTRACIÓN
9 ı 10 ı 11 ı 12Puntos orden del día
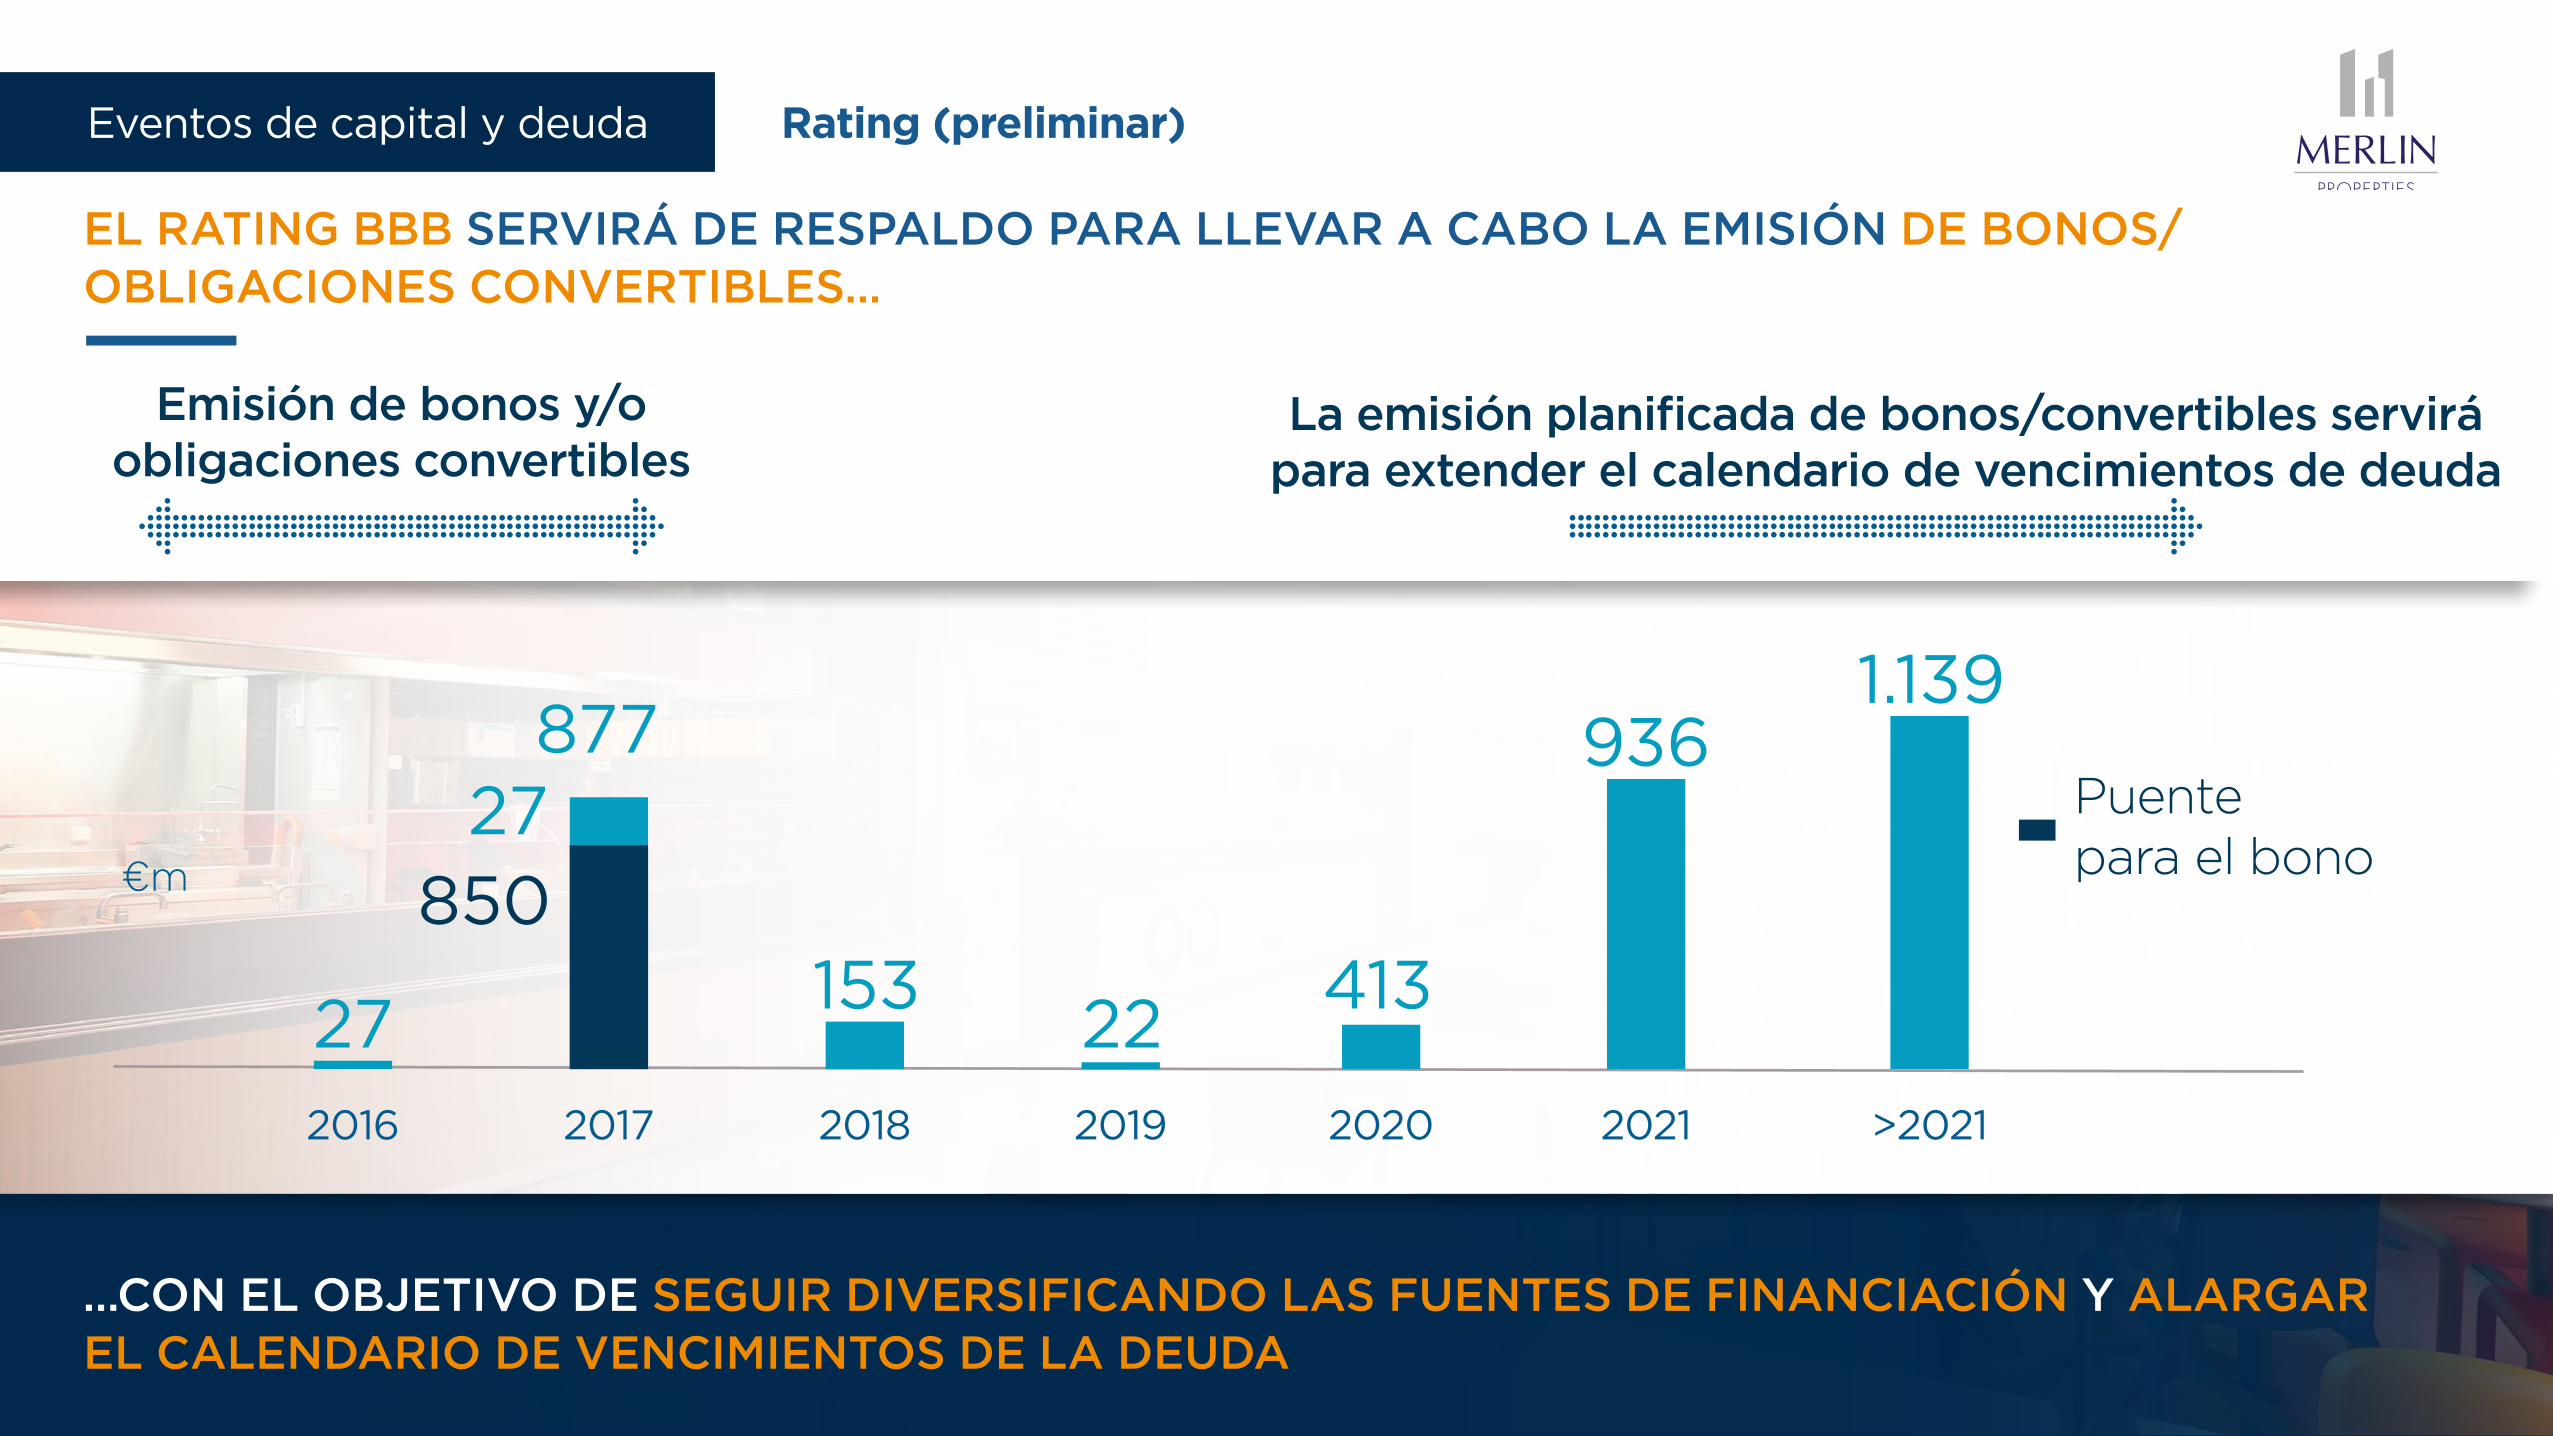
Puente para el bono€m
27153
22413
9361.139
850
87727
2016 2017 2018 2019 2020 2021 >2021
Emisión de bonos y/o obligaciones convertibles
La emisión planificada de bonos/convertibles servirá para extender el calendario de vencimientos de deuda
…CON EL OBJETIVO DE SEGUIR DIVERSIFICANDO LAS FUENTES DE FINANCIACIÓN Y ALARGAR EL CALENDARIO DE VENCIMIENTOS DE LA DEUDA
EL RATING BBB SERVIRÁ DE RESPALDO PARA LLEVAR A CABO LA EMISIÓN DE BONOS/OBLIGACIONES CONVERTIBLES…
Rating (preliminar)Eventos de capital y deuda
Propuestas de acuerdos a los accionistasEventos de capital y deuda
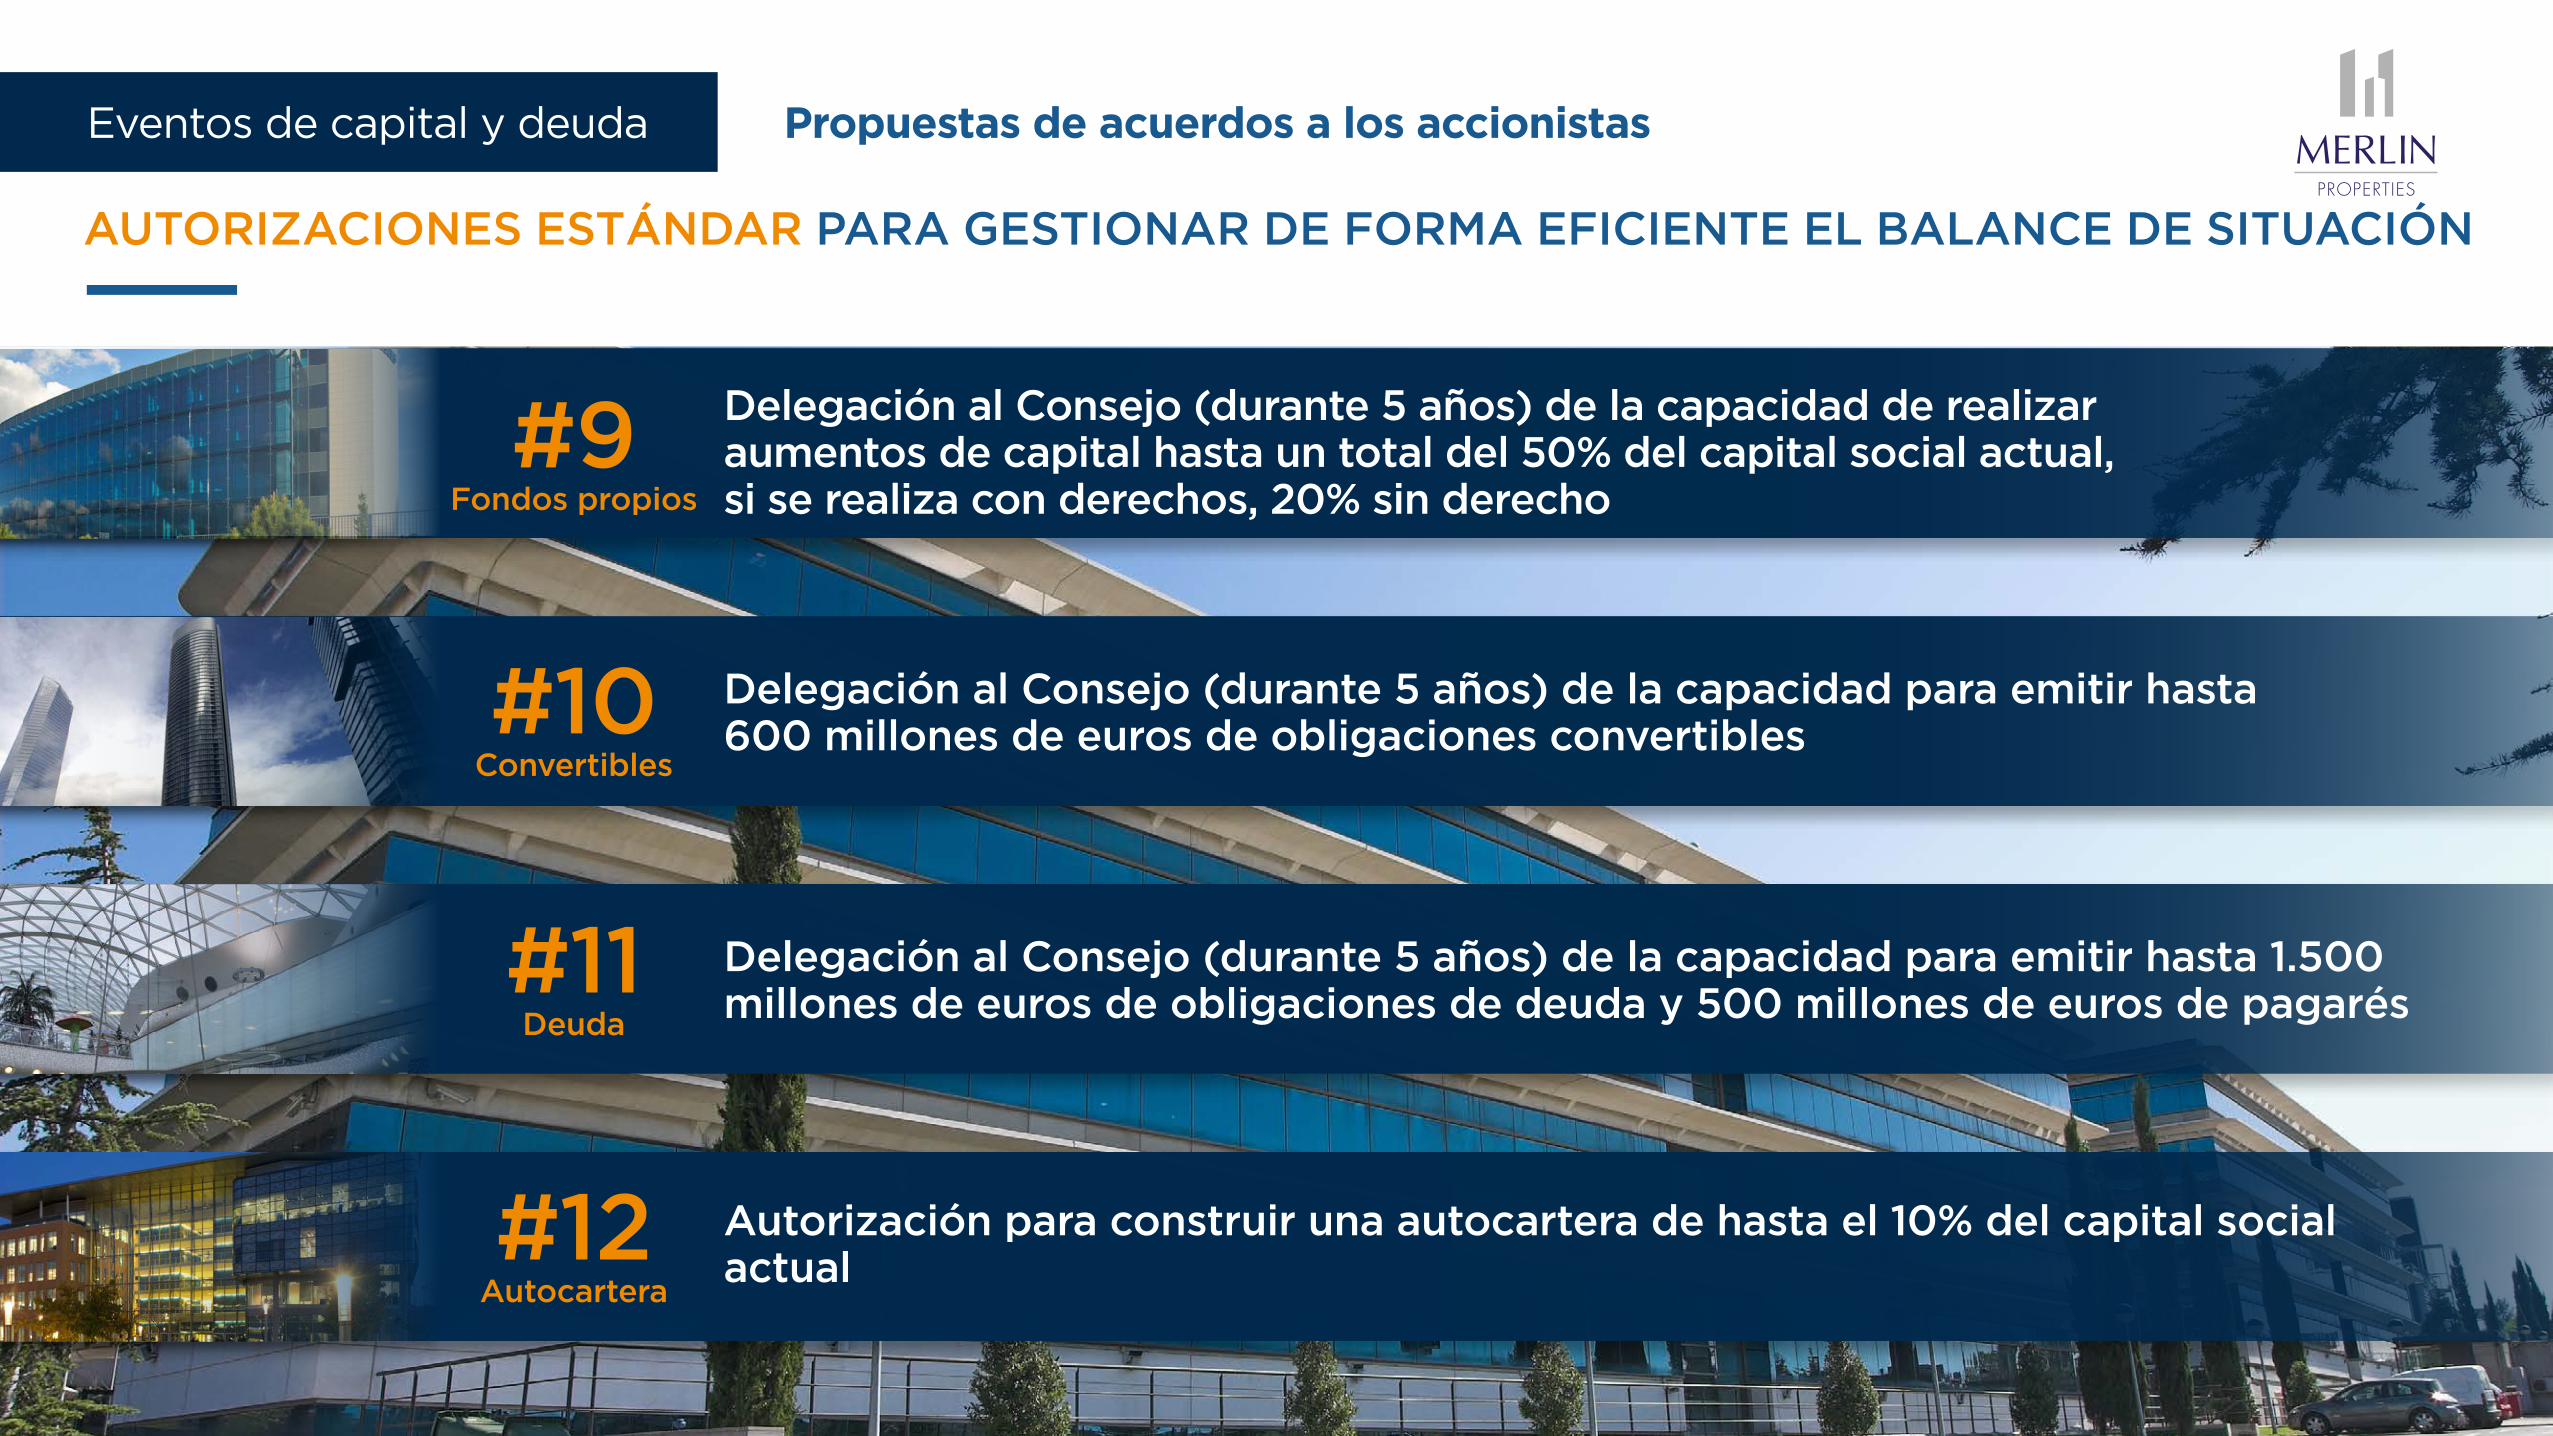
AUTORIZACIONES ESTÁNDAR PARA GESTIONAR DE FORMA EFICIENTE EL BALANCE DE SITUACIÓN
#9 Fondos propios
Delegación al Consejo (durante 5 años) de la capacidad de realizar aumentos de capital hasta un total del 50% del capital social actual, si se realiza con derechos, 20% sin derecho
Delegación al Consejo (durante 5 años) de la capacidad para emitir hasta 600 millones de euros de obligaciones convertibles#10
Convertibles
Delegación al Consejo (durante 5 años) de la capacidad para emitir hasta 1.500 millones de euros de obligaciones de deuda y 500 millones de euros de pagarés
#11 Deuda
Autorización para construir una autocartera de hasta el 10% del capital social actual#12
Autocartera

MEJORAS DE GOBIERNO CORPORATIVO

Mejoras de gobierno corporativo
Actualización de textos normativos a las últimas novedades legislativas y recomendaciones de gobierno corporativo
Aprobación y publicación de políticas
Refuerzo de las facultades del Consejero Coordinador
Incremento de competencias de las Comisiones
Regulación relacionada con filiales cotizadas
Accesibilidad audiovisual a las Juntas
Adaptación de la política de retribuciones
Ya implementadas:
Actuaciones en curso:

PROPUESTA DE DIVIDENDOS ATRACTIVA
PERSPECTIVAS PARA EL 2016
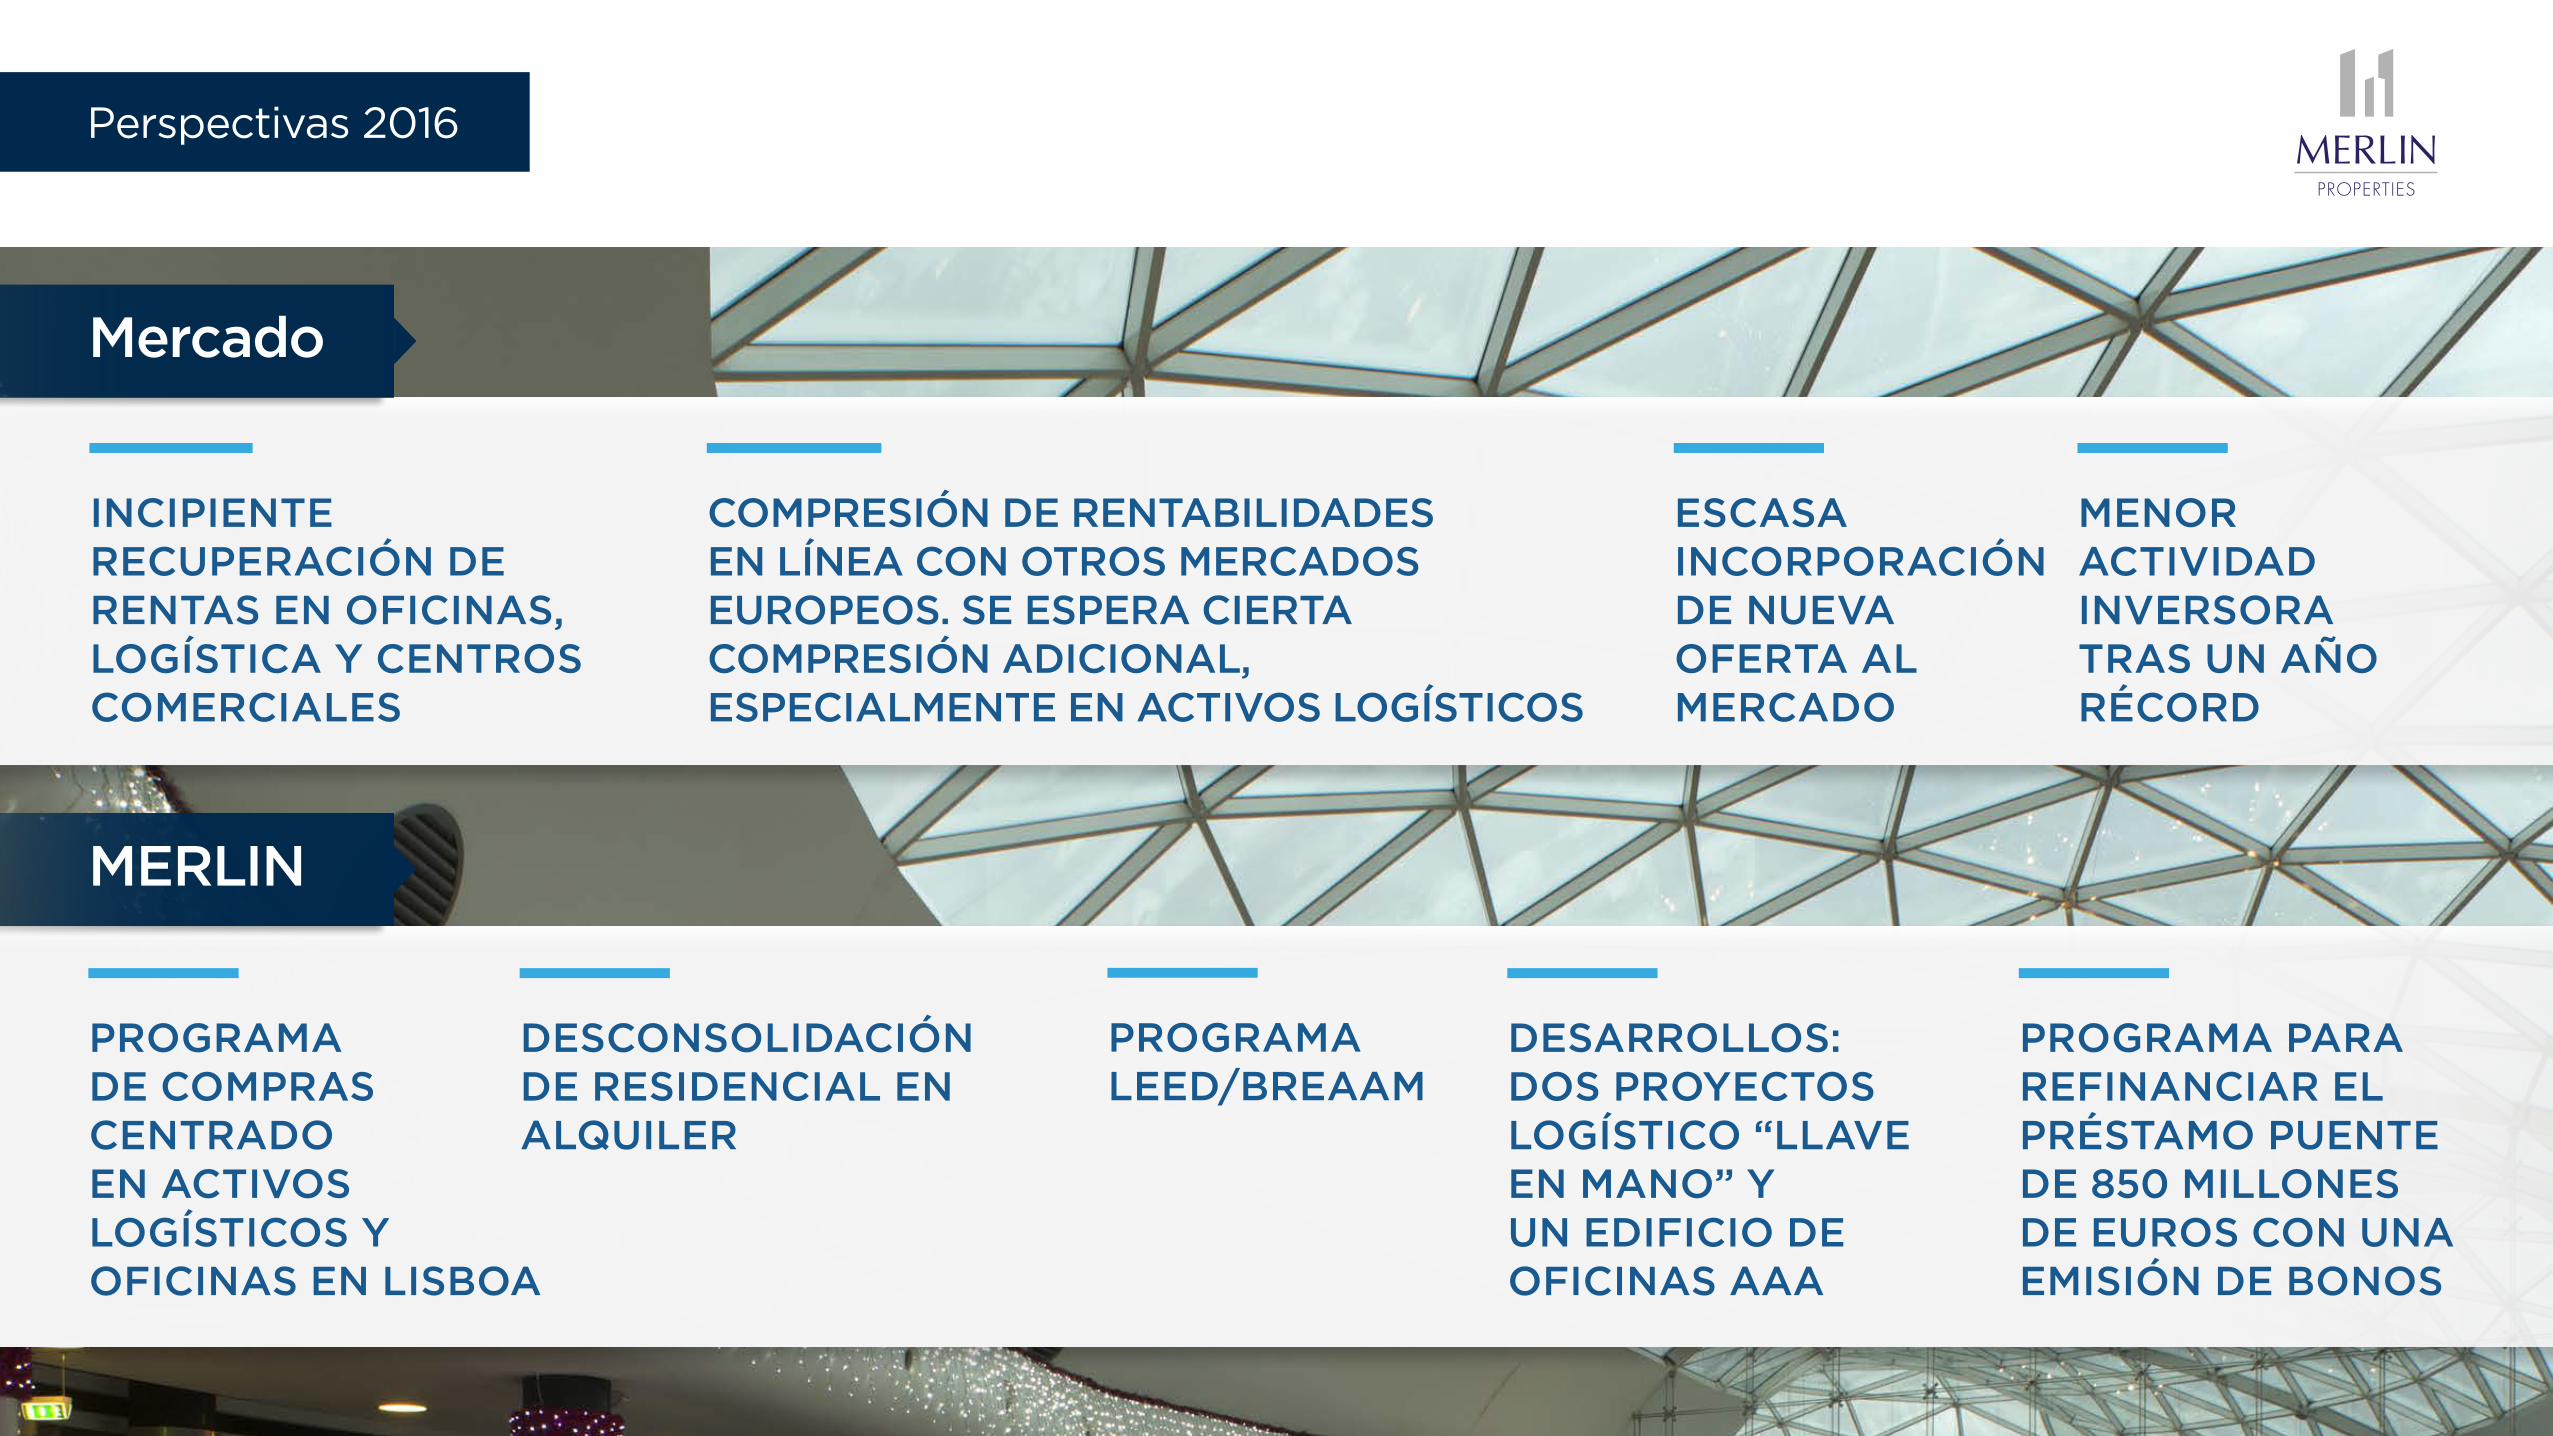
INCIPIENTE RECUPERACIÓN DE RENTAS EN OFICINAS, LOGÍSTICA Y CENTROS COMERCIALES
PROGRAMA DE COMPRAS CENTRADO EN ACTIVOS LOGÍSTICOS Y OFICINAS EN LISBOA
COMPRESIÓN DE RENTABILIDADES EN LÍNEA CON OTROS MERCADOS EUROPEOS. SE ESPERA CIERTA COMPRESIÓN ADICIONAL, ESPECIALMENTE EN ACTIVOS LOGÍSTICOS
ESCASA INCORPORACIÓN DE NUEVA OFERTA AL MERCADO
DESCONSOLIDACIÓN DE RESIDENCIAL EN ALQUILER
PROGRAMA LEED/BREAAM
MENOR ACTIVIDAD INVERSORA TRAS UN AÑO RÉCORD
DESARROLLOS: DOS PROYECTOS LOGÍSTICO “LLAVE EN MANO” Y UN EDIFICIO DE OFICINAS AAA
PROGRAMA PARA REFINANCIAR EL PRÉSTAMO PUENTE DE 850 MILLONES DE EUROS CON UNA EMISIÓN DE BONOS
MERLIN
Mercado
Perspectivas 2016
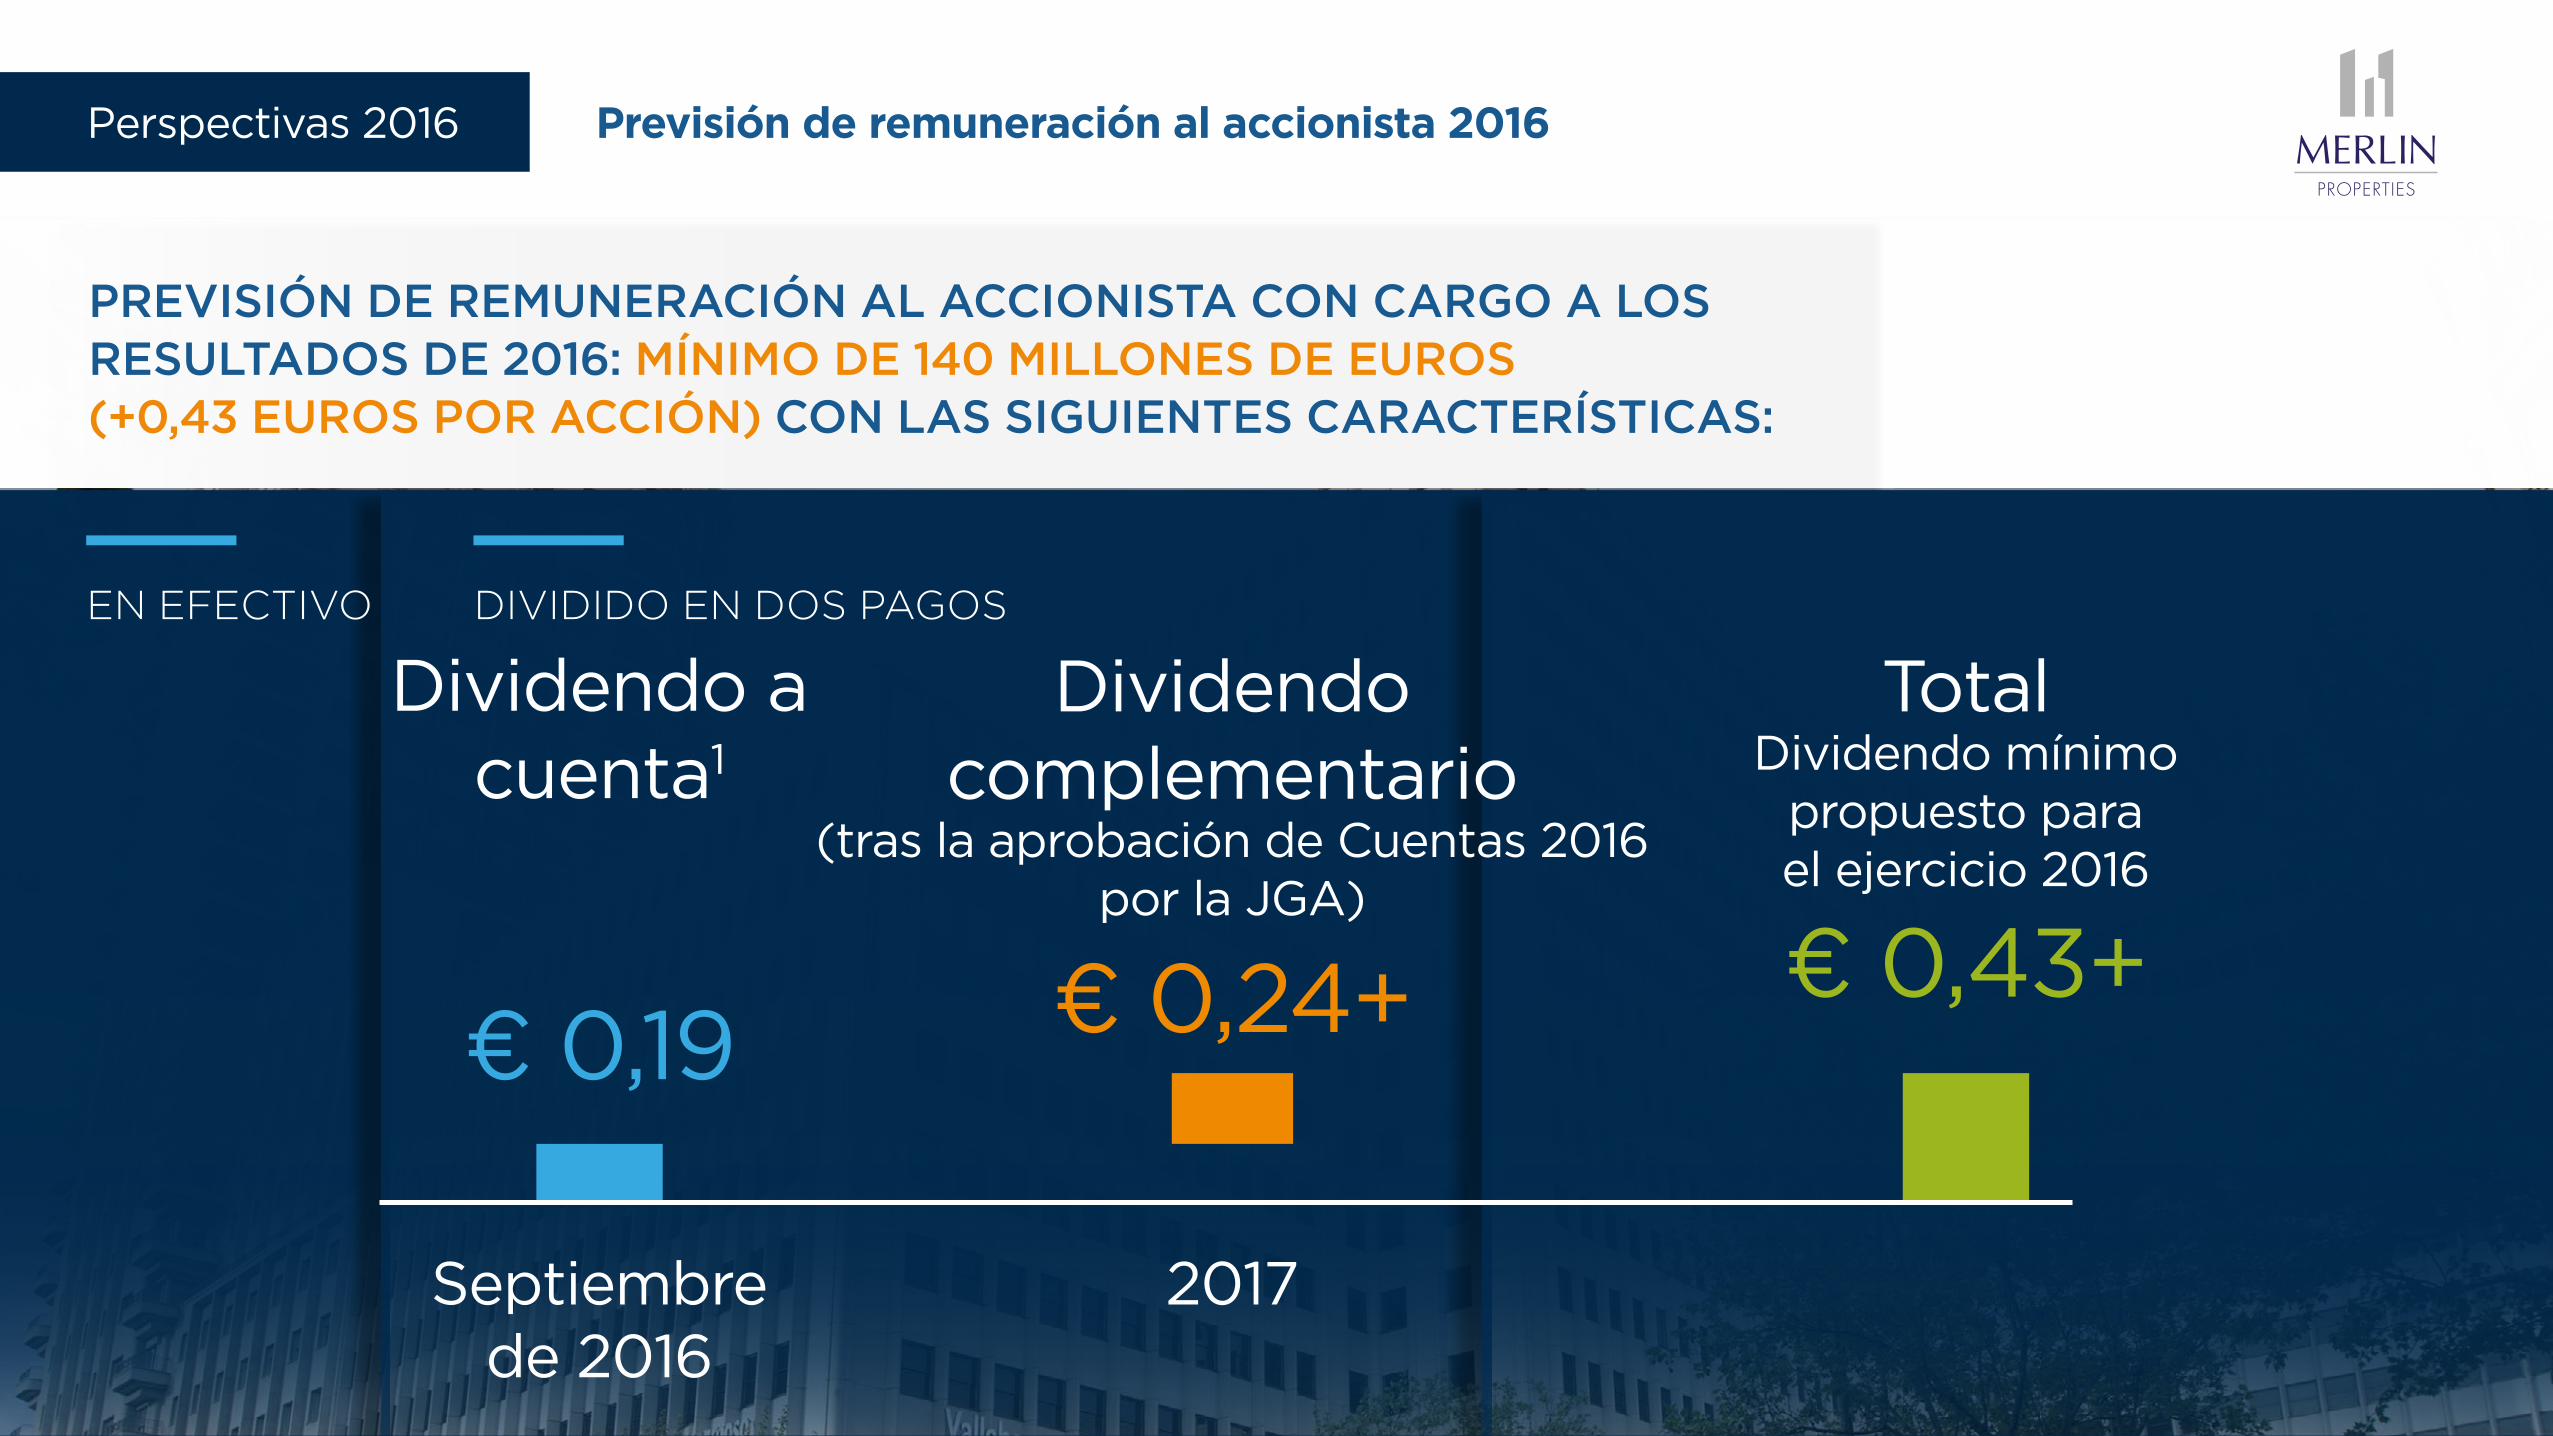
EN EFECTIVO DIVIDIDO EN DOS PAGOS
€ 0,19€ 0,43+
Dividendo a cuenta1
Septiembre de 2016
2017
Dividendo complementario
(tras la aprobación de Cuentas 2016 por la JGA)
Total Dividendo mínimo
propuesto para el ejercicio 2016
PREVISIÓN DE REMUNERACIÓN AL ACCIONISTA CON CARGO A LOS RESULTADOS DE 2016: MÍNIMO DE 140 MILLONES DE EUROS (+0,43 EUROS POR ACCIÓN) CON LAS SIGUIENTES CARACTERÍSTICAS:
Perspectivas 2016 Previsión de remuneración al accionista 2016
€ 0,24+
JUNTA GENERALACCIONISTAS 2016
Madrid, 6 de abril de 2016


