U.S. Depar tment of Justice Office of Justice Programs Office of Juvenile Justice and Delinquency Prevention National Report Series December 2013 Juvenile Arrests 2011 Charles Puzzanchera A Message From OJJDP The measurement of juvenile arrest data provides critical insights into the performance and functioning of the juvenile justice system. Practitioners use arrest data to evaluate the effec- tiveness of delinquency prevention and intervention programs and reentry programs. Arrest data can provide key indicators of changing juvenile offending patterns. Analysis of national data can highlight disparities in the system’s treatment of youth of different races. Because the field seeks a barometer of how well the system is working, these annual bulletins are among the most frequently requested in OJJDP’s publications catalog. As has been the case in general for the past decade, juvenile arrest data for 2011 provide rea- sons for encouragement. Overall, arrests in 2011 were down 11 percent from 2010 and down 31 percent since 2002. Although juvenile arrest rates for many crimes are at their lowest levels in more than 30 years, many states and communities are instituting legislative, policy, and practice changes to reduce juvenile arrests even further. As a growing body of evidence underscores the corro- sive effects that system involvement and confinement can have on healthy adolescent emo- tional, mental, behavioral, and social development, many jurisdictions are examining and developing ways to divert nonserious offenders from entering the system. With time, the cu- mulative effects of these and other reform efforts, such as trauma, mental health, and sub- stance abuse screening and assessment for youth upon intake, should result in a system where arrests are rare, all youth are treated fairly, and when a youth enters the system, he or she receives much-needed treatment and services. Such changes would undoubtedly provide positive and healthy outcomes for youth, families, and communities. Robert L. Listenbee Administrator This bulletin is part of the Juvenile Offenders and Victims National Report Series. The National Report offers a comprehensive statistical overview of the problems of juvenile crime, violence, and victimization and the response of the juvenile justice system. During each interim year, the bulletins in the National Report Series provide access to the latest information on juvenile arrests, court cases, juveniles in custody, and other topics of interest. Each bul- letin in the series highlights selected topics at the forefront of juvenile justice policymak- ing, giving readers focused access to statistics on some of the most critical issues. Together, the National Report and this series provide a baseline of facts for juvenile justice professionals, policy- makers, the media, and con- cerned citizens. Access OJJDP publications online at ojjdp.gov
Transcript
U.S. Depar tment of Justice
Office of Justice Programs
Office of Juvenile Justice and Delinquency Prevention
National Report Series
December 2013
Juvenile Arrests 2011Charles Puzzanchera
A Message From OJJDP
The measurement of juvenile arrest data provides critical insights into the performance and functioning of the juvenile justice system. Practitioners use arrest data to evaluate the effectiveness of delinquency prevention and intervention programs and reentry programs. Arrest data can provide key indicators of changing juvenile offending patterns. Analysis of national data can highlight disparities in the system’s treatment of youth of different races. Because the field seeks a barometer of how well the system is working, these annual bulletins are among the most frequently requested in OJJDP’s publications catalog.
As has been the case in general for the past decade, juvenile arrest data for 2011 provide reasons for encouragement. Overall, arrests in 2011 were down 11 percent from 2010 and down 31 percent since 2002.
Although juvenile arrest rates for many crimes are at their lowest levels in more than 30 years, many states and communities are instituting legislative, policy, and practice changes to reduce juvenile arrests even further. As a growing body of evidence underscores the corrosive effects that system involvement and confinement can have on healthy adolescent emotional, mental, behavioral, and social development, many jurisdictions are examining and developing ways to divert nonserious offenders from entering the system. With time, the cumulative effects of these and other reform efforts, such as trauma, mental health, and substance abuse screening and assessment for youth upon intake, should result in a system where arrests are rare, all youth are treated fairly, and when a youth enters the system, he or she receives much-needed treatment and services. Such changes would undoubtedly provide positive and healthy outcomes for youth, families, and communities.
Robert L. Listenbee Administrator
This bulletin is part of the Juvenile Offenders and Victims National Report Series. The National Report offers a comprehensive statistical overview of the problems of juvenile crime, violence, and victimization and the response of the juvenile justice system. During each interim year, the bulletins in the National Report Series provide access to the latest information on juvenile arrests, court cases, juveniles in custody, and other topics of interest. Each bulletin in the series highlights selected topics at the forefront of juvenile justice policymaking, giving readers focused access to statistics on some of the most critical issues. Together, the National Report and this series provide a baseline of facts for juvenile justice professionals, policy-makers, the media, and concerned citizens.
Access OJJDP publications online at ojjdp.gov
Most information about law enforcement’s response to juvenile crime comes from the FBI’s UCR Program What do arrest statistics count?
Findings in this bulletin are drawn from data that local law enforcement agencies across the country report to the Federal Bureau of Investigation’s (FBI’s) Uniform Crime Reporting (UCR) Program. To properly interpret the material presented, the reader needs a clear understanding of what arrest statistics count. Arrest statistics report the number of arrests that law enforcement agencies made in a given year—not the number of individuals arrested nor the number of crimes committed. The number of arrests is not the same as the number of people arrested because an unknown number of individuals are arrested more than once during the year. Nor do arrest statistics represent the number of crimes that arrested individuals commit because a series of crimes that one person commits may culminate in a single arrest, and a single crime may result in the arrest of more than one person. This latter situation, where many arrests result from one crime, is relatively common in juvenile law-violating behavior because juveniles* are more likely than adults to commit crimes in groups. For this reason, one should not use arrest statistics to indicate the relative proportions of crime that juveniles and adults commit. Arrest statistics are most appropriately a measure of entry into the justice system.
Arrest statistics also have limitations in measuring the volume of arrests for a particular offense. Under the UCR Program, the FBI requires law enforcement
* In this bulletin, “juvenile” refers to persons younger than age 18. In 2011, this definition was at odds with the legal definition of juveniles in 13 states—11 states where all 17-year-olds are defined as adults, and 2 states where all 16- and 17-year-olds are defined as adults.
agencies to classify an arrest by the most serious offense charged in that arrest. For example, the arrest of a youth charged with aggravated assault and possession of a weapon would be reported to the FBI as an arrest for aggravated assault. Therefore, when arrest statistics show that law enforcement agencies made an estimated 28,200 arrests of young people for weapons law violations in 2011, it means that a weapons law violation was the most serious charge in these 28,200 arrests. An unknown number of additional arrests in 2011 included a weapons charge as a lesser offense.
How do arrest statistics differ from clearance statistics?
Clearance statistics measure the proportion of reported crimes that were cleared (or “closed”) by either arrest or other, exceptional means (such as the death of the offender or unwillingness of the victim to cooperate). A single arrest may result in many clearances. For example, 1 arrest could clear 10 burglaries if the person was charged with committing all 10 crimes, or multiple arrests may result in a single clearance if a group of offenders committed the crime. The FBI’s reporting guidelines require that clearances involving both juvenile and adult offenders be classified as clearances for crimes that adults commit. Because the juvenile clearance proportions include only those clearances in which no adults were involved, they underestimate juvenile involvement in crime. Although these data do not present a definitive picture of juvenile involvement in crime, they are the closest measure generally available of the proportion of crime known to law enforcement that is attributed to persons younger than age 18.
Crime in the United States reports data on murder victims
Each Crime in the United States report presents estimates of the number of crimes reported to law enforcement agencies. Although many crimes are never reported to law enforcement, murder is one crime that is nearly always reported.
An estimated 14,610 murders were reported to law enforcement agencies in 2011, or 4.7 murders for every 100,000 U.S. residents. The murder rate was essentially constant between 1999 and 2006 and then fell 18% through 2011, reaching its lowest level since at least 1980.
Of all murder victims in 2011, 91% (or 13,230 victims) were 18 years old or older. The other 1,380 murder victims were younger than age 18 (i.e., juveniles). The number of juvenile murder victims declined annually since 2007, falling 23% during that 5-year period. By 2011, the number of juvenile murder victims was 52% less than the peak year of 1993, when an estimated 2,880 juveniles were murdered. During the same 2007–2011 period, the estimated number of adult murder victims fell 13%.
Of all juveniles murdered in 2011, 42% were younger than age 5, 69% were male, and 49% were white. Of all juveniles murdered in 2011, 35% of male victims, 58% of female victims, 49% of white victims, and 36% of black victims were younger than age 5.
In 2011, 68% of all murder victims were killed with a firearm. Adults were more likely to be killed with a firearm (70%) than were juveniles (48%). However, the involvement of a firearm depended greatly on the age of the juvenile victim. In 2011, 18% of murdered juveniles younger than age 13 were killed with a firearm, compared with 82% of murdered juveniles age 13 or older. The most common method of murdering children younger than age 5 was by physical assault.
National Report Series Bulletin 2
In 2011, law enforcement agencies in the U.S. made nearly 1.5 million arrests of persons under age 18
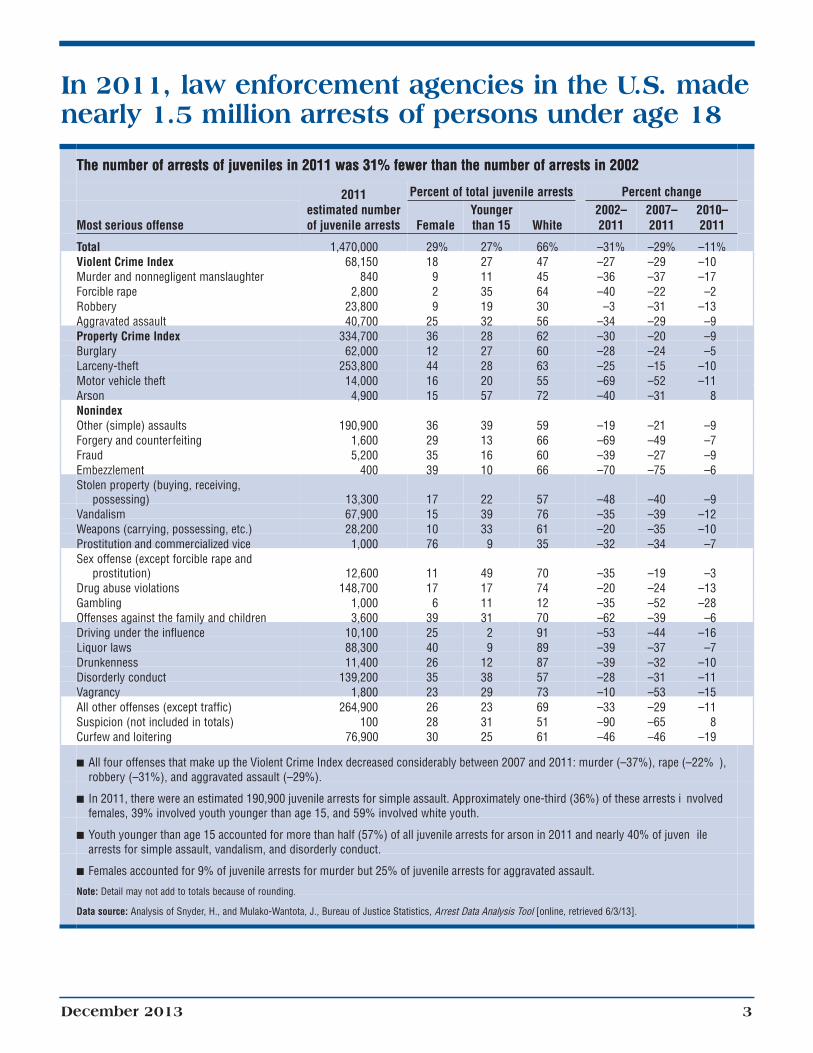
The number of arrests of juveniles in 2011 was 31% fewer than the number of arrests in 2002 The number of arrests of juveniles in 2011 was 31% fewer than the number of arrests in 2002
2011 Percent of total juvenile arrests Percent change estimated number Younger 2002– 2007– 2010–
Most serious offense of juvenile arrests Female than 15 White 2011 2011 2011
prostitution) 12,600 11 49 70 –35 –19 –3Drug abuse violations 148,700 17 17 74 –20 –24 –13Gambling 1,000 6 11 12 –35 –52 –28Offenses against the family and children 3,600 39 31 70 –62 –39 –6Driving under the influence 10,100 25 2 91 –53 –44 –16Liquor laws 88,300 40 9 89 –39 –37 –7Drunkenness 11,400 26 12 87 –39 –32 –10Disorderly conduct 139,200 35 38 57 –28 –31 –11Vagrancy 1,800 23 29 73 –10 –53 –15All other offenses (except traffic) 264,900 26 23 69 –33 –29 –11Suspicion (not included in totals) 100 28 31 51 –90 –65 8Curfew and loitering 76,900 30 25 61 –46 –46 –19
All four offenses that make up the Violent Crime Index decreased considerably between 2007 and 2011: murder (–37%), rape (–22% ),robbery (–31%), and aggravated assault (–29%).
In 2011, there were an estimated 190,900 juvenile arrests for simple assault. Approximately one-third (36%) of these arrests i nvolvedfemales, 39% involved youth younger than age 15, and 59% involved white youth.
Youth younger than age 15 accounted for more than half (57%) of all juvenile arrests for arson in 2011 and nearly 40% of juven ilearrests for simple assault, vandalism, and disorderly conduct.
Females accounted for 9% of juvenile arrests for murder but 25% of juvenile arrests for aggravated assault.
Note: Detail may not add to totals because of rounding.
Data source: Analysis of Snyder, H., and Mulako-Wantota, J., Bureau of Justice Statistics, Arrest Data Analysis Tool [online, retrieved 6/3/13].
December 2013 3
Juvenile arrests for violent crime declined for the fifth consecutive year Juvenile arrests for violent crimes fell 29% in the past 5 years
The FBI assesses trends in violent crimes by monitoring four offenses that law enforcement agencies nationwide consistently report. These four crimes—murder and nonnegligent manslaughter, forcible rape, robbery, and aggravated assault— form the Violent Crime Index.
Following 10 years of declines between 1994 and 2004, juvenile arrests for Violent Crime Index offenses increased from 2004 to 2006 and then declined each year through 2011. As a result, the number of juvenile violent crime arrests in 2011 was less than any of the previous 32 years and 15% less than the previous low point in 1984.
In fact, with the exception of aggravated assault, juvenile arrests for violent crimes reached historically low levels in 2011. Following a 33% decline since 2008, the number of juvenile robbery arrests in 2011 was at its lowest level since 1980. Similarly, the number of juvenile arrests for forcible rape fell 33% since 2004 to reach its lowest level of the 1980–2011 period. After falling to a relatively low level in 2004, juvenile arrests for murder increased through 2007 and then declined 37% by 2011 to reach the lowest level in three decades. The number of juvenile arrests for aggravated assault was cut in half between 1994 and 2011, resting at a level 8% above the 1983 low point.
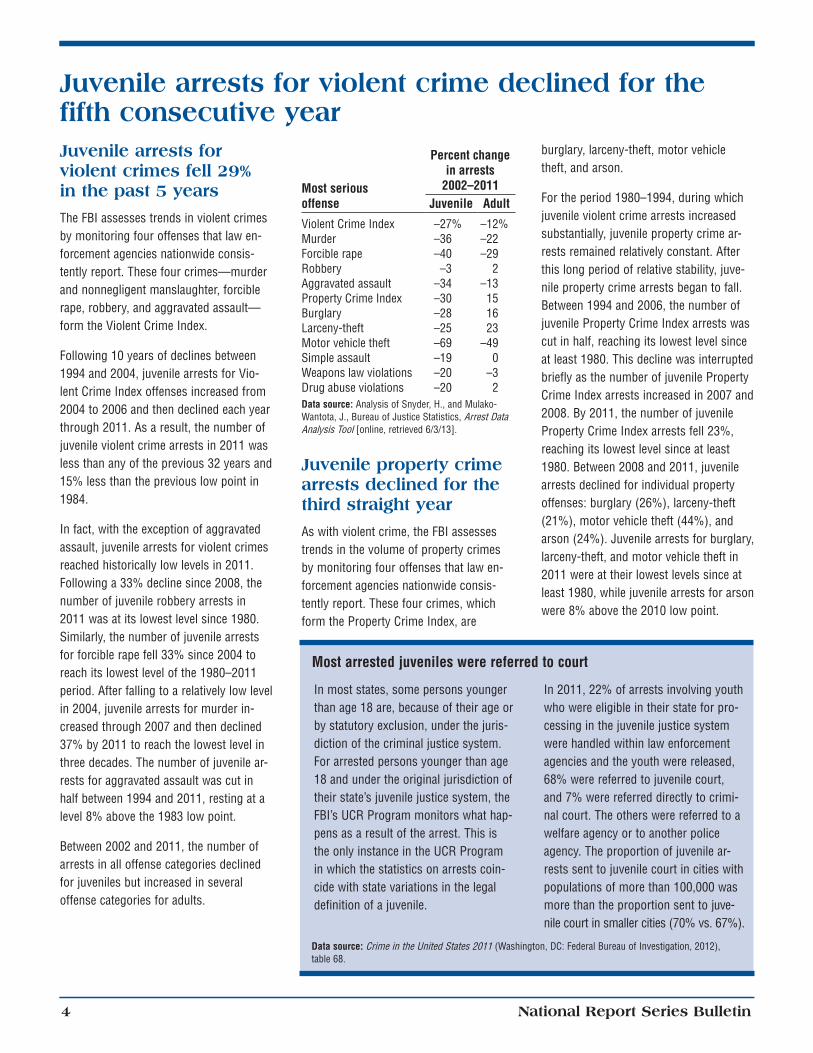
Between 2002 and 2011, the number of arrests in all offense categories declined for juveniles but increased in several offense categories for adults.
Most serious
Percent change in arrests
2002–2011Juvenile Adultoffense
Violent Crime Index –27% –12%Murder –36 –22Forcible rape –40 –29Robbery –3 2Aggravated assault –34 –13Property Crime Index –30 15Burglary –28 16Larceny-theft –25 23Motor vehicle theft –69 –49Simple assault –19 0Weapons law violations –20 –3Drug abuse violations –20 2Data source: Analysis of Snyder, H., and Mulako-Wantota, J., Bureau of Justice Statistics, Arrest Data Analysis Tool [online, retrieved 6/3/13].
Juvenile property crime arrests declined for the third straight year
As with violent crime, the FBI assesses trends in the volume of property crimes by monitoring four offenses that law enforcement agencies nationwide consistently report. These four crimes, which form the Property Crime Index, are
burglary, larceny-theft, motor vehicle theft, and arson.
For the period 1980–1994, during which juvenile violent crime arrests increased substantially, juvenile property crime arrests remained relatively constant. After this long period of relative stability, juvenile property crime arrests began to fall. Between 1994 and 2006, the number of juvenile Property Crime Index arrests was cut in half, reaching its lowest level since at least 1980. This decline was interrupted briefly as the number of juvenile Property Crime Index arrests increased in 2007 and 2008. By 2011, the number of juvenile Property Crime Index arrests fell 23%, reaching its lowest level since at least 1980. Between 2008 and 2011, juvenile arrests declined for individual property offenses: burglary (26%), larceny-theft (21%), motor vehicle theft (44%), and arson (24%). Juvenile arrests for burglary, larceny-theft, and motor vehicle theft in 2011 were at their lowest levels since at least 1980, while juvenile arrests for arson were 8% above the 2010 low point.
Most arrested juveniles were referred to court
In most states, some persons younger than age 18 are, because of their age or by statutory exclusion, under the jurisdiction of the criminal justice system. For arrested persons younger than age 18 and under the original jurisdiction of their state’s juvenile justice system, the FBI’s UCR Program monitors what happens as a result of the arrest. This is the only instance in the UCR Program in which the statistics on arrests coincide with state variations in the legal definition of a juvenile.
In 2011, 22% of arrests involving youth who were eligible in their state for processing in the juvenile justice system were handled within law enforcement agencies and the youth were released, 68% were referred to juvenile court, and 7% were referred directly to criminal court. The others were referred to a welfare agency or to another police agency. The proportion of juvenile arrests sent to juvenile court in cities with populations of more than 100,000 was more than the proportion sent to juvenile court in smaller cities (70% vs. 67%).
Data source: Crime in the United States 2011 (Washington, DC: Federal Bureau of Investigation, 2012), table 68.
National Report Series Bulletin 4
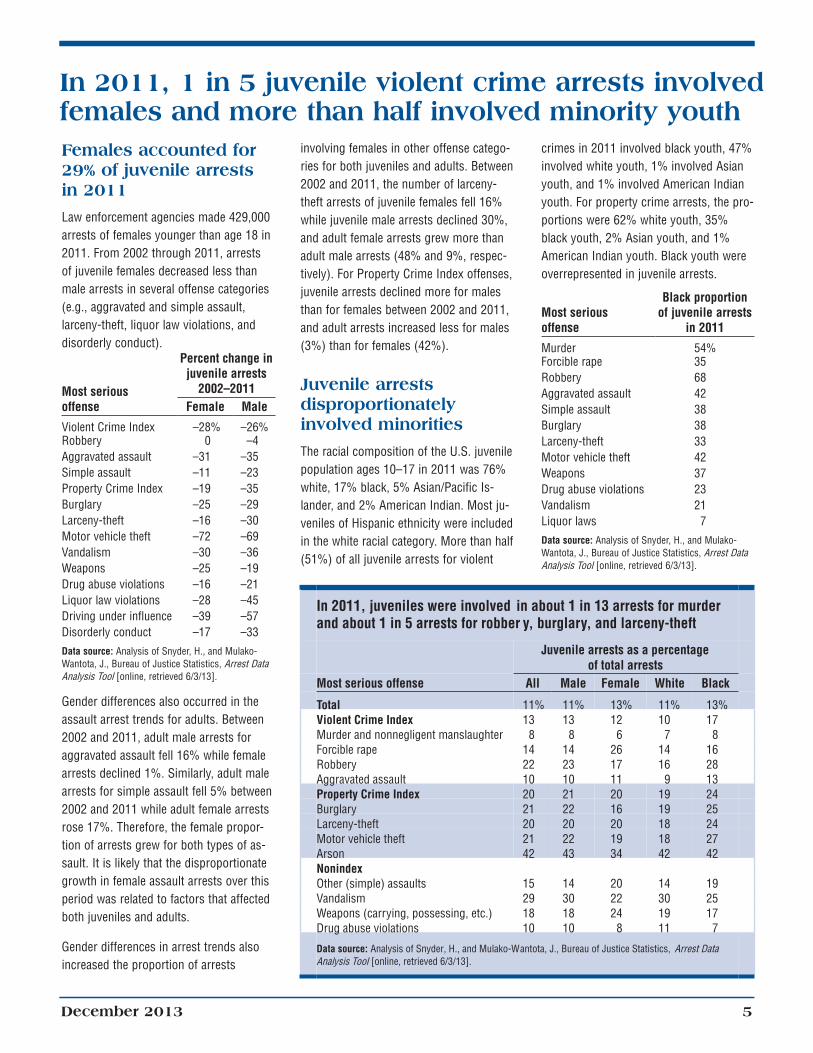
In 2011, 1 in 5 juvenile violent crime arrests involved females and more than half involved minority youth Females accounted for 29% of juvenile arrests in 2011
Law enforcement agencies made 429,000 arrests of females younger than age 18 in 2011. From 2002 through 2011, arrests of juvenile females decreased less than male arrests in several offense categories (e.g., aggravated and simple assault, larceny-theft, liquor law violations, and disorderly conduct).
Most serious
Percent change in juvenile arrests
2002–2011Female Maleoffense
Violent Crime Index –28% –26% Robbery 0 –4 Aggravated assault –31 –35 Simple assault –11 –23 Property Crime Index –19 –35 Burglary –25 –29 Larceny-theft –16 –30 Motor vehicle theft –72 –69 Vandalism –30 –36 Weapons –25 –19 Drug abuse violations –16 –21 Liquor law violations –28 –45 Driving under influence –39 –57 Disorderly conduct –17 –33 Data source: Analysis of Snyder, H., and Mulako-Wantota, J., Bureau of Justice Statistics, Arrest Data Analysis Tool [online, retrieved 6/3/13].
Gender differences also occurred in the assault arrest trends for adults. Between 2002 and 2011, adult male arrests for aggravated assault fell 16% while female arrests declined 1%. Similarly, adult male arrests for simple assault fell 5% between 2002 and 2011 while adult female arrests rose 17%. Therefore, the female proportion of arrests grew for both types of assault. It is likely that the disproportionate growth in female assault arrests over this period was related to factors that affected both juveniles and adults.
Gender differences in arrest trends also increased the proportion of arrests
involving females in other offense categories for both juveniles and adults. Between 2002 and 2011, the number of larceny-theft arrests of juvenile females fell 16% while juvenile male arrests declined 30%, and adult female arrests grew more than adult male arrests (48% and 9%, respectively). For Property Crime Index offenses, juvenile arrests declined more for males than for females between 2002 and 2011, and adult arrests increased less for males (3%) than for females (42%).
The racial composition of the U.S. juvenile population ages 10–17 in 2011 was 76% white, 17% black, 5% Asian/Pacific Islander, and 2% American Indian. Most juveniles of Hispanic ethnicity were included in the white racial category. More than half (51%) of all juvenile arrests for violent
crimes in 2011 involved black youth, 47% involved white youth, 1% involved Asian youth, and 1% involved American Indian youth. For property crime arrests, the proportions were 62% white youth, 35% black youth, 2% Asian youth, and 1% American Indian youth. Black youth were overrepresented in juvenile arrests.
Black proportion Most serious of juvenile arrests offense in 2011
Murder 54% Forcible rape 35 Robbery 68 Aggravated assault 42 Simple assault 38 Burglary 38 Larceny-theft 33 Motor vehicle theft 42 Weapons 37 Drug abuse violations 23 Vandalism 21 Liquor laws 7 Data source: Analysis of Snyder, H., and Mulako-Wantota, J., Bureau of Justice Statistics, Arrest Data Analysis Tool [online, retrieved 6/3/13].
In 2011, juveniles were involved and about 1 in 5 arrests for robber y,
Most serious offense
in about 1 in 13 arrests for murder burglary, and larceny-theft
Data source: Analysis of Snyder, H., and Mulako-Wantota, J., Bureau of Justice Statistics, Arrest DataAnalysis Tool [online, retrieved 6/3/13].
December 2013 5
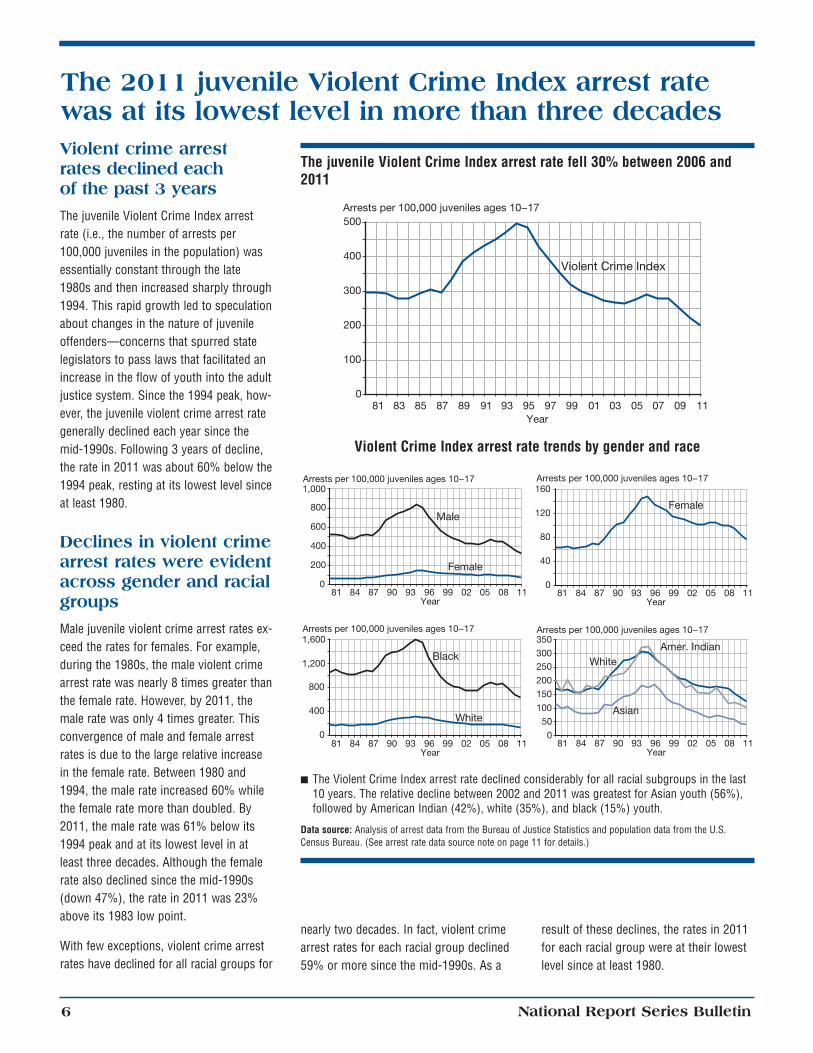
The 2011 juvenile Violent Crime Index arrest rate was at its lowest level in more than three decades Violent crime arrest rates declined each of the past 3 years
The juvenile Violent Crime Index arrest rate (i.e., the number of arrests per 100,000 juveniles in the population) was essentially constant through the late 1980s and then increased sharply through 1994. This rapid growth led to speculation about changes in the nature of juvenile offenders—concerns that spurred state legislators to pass laws that facilitated an increase in the flow of youth into the adult justice system. Since the 1994 peak, however, the juvenile violent crime arrest rate generally declined each year since the mid-1990s. Following 3 years of decline, the rate in 2011 was about 60% below the 1994 peak, resting at its lowest level since at least 1980.
Declines in violent crime arrest rates were evident across gender and racial groups
Male juvenile violent crime arrest rates exceed the rates for females. For example, during the 1980s, the male violent crime arrest rate was nearly 8 times greater than the female rate. However, by 2011, the male rate was only 4 times greater. This convergence of male and female arrest rates is due to the large relative increase in the female rate. Between 1980 and 1994, the male rate increased 60% while the female rate more than doubled. By 2011, the male rate was 61% below its 1994 peak and at its lowest level in at least three decades. Although the female rate also declined since the mid-1990s (down 47%), the rate in 2011 was 23% above its 1983 low point.
With few exceptions, violent crime arrest rates have declined for all racial groups for
nearly two decades. In fact, violent crime result of these declines, the rates in 2011 arrest rates for each racial group declined for each racial group were at their lowest 59% or more since the mid-1990s. As a level since at least 1980.
The juvenile Violent Crime Index arrest rate fell 30% between 2006 and 2011
The Violent Crime Index arrest rate declined considerably for all racial subgroups in the last 10 years. The relative decline between 2002 and 2011 was greatest for Asian youth (56%), followed by American Indian (42%), white (35%), and black (15%) youth.
Data source: Analysis of arrest data from the Bureau of Justice Statistics and population data from the U.S. Census Bureau. (See arrest rate data source note on page 11 for details.)
National Report Series Bulletin 6
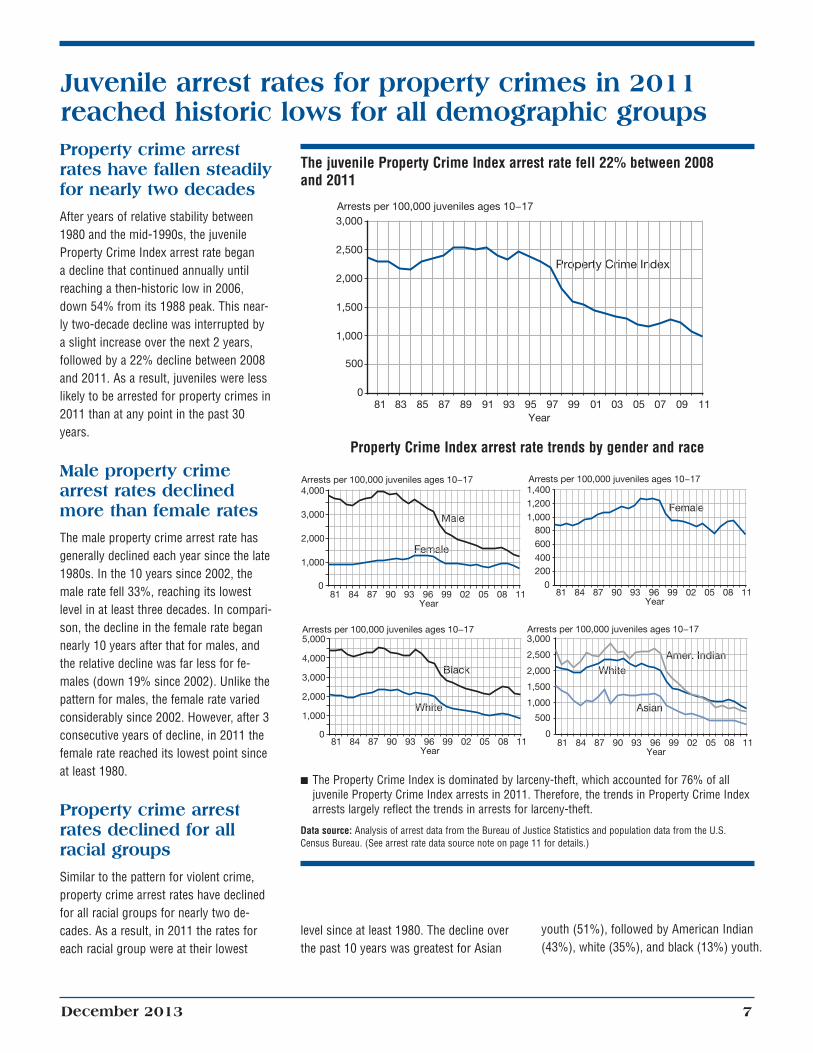
Juvenile arrest rates for property crimes in 2011 reached historic lows for all demographic groups Property crime arrest rates have fallen steadily for nearly two decades
After years of relative stability between 1980 and the mid-1990s, the juvenile Property Crime Index arrest rate began a decline that continued annually until reaching a then-historic low in 2006, down 54% from its 1988 peak. This nearly two-decade decline was interrupted by a slight increase over the next 2 years, followed by a 22% decline between 2008 and 2011. As a result, juveniles were less likely to be arrested for property crimes in 2011 than at any point in the past 30 years.
2,500
1,500
500
0
The juvenile Property Crime Index arrest rate fell 22% between 2008 and 2011
The Property Crime Index is dominated by larceny-theft, which accounted for 76% of all juvenile Property Crime Index arrests in 2011. Therefore, the trends in Property Crime Index arrests largely reflect the trends in arrests for larceny-theft.
Data source: Analysis of arrest data from the Bureau of Justice Statistics and population data from the U.S. Census Bureau. (See arrest rate data source note on page 11 for details.)
Male property crime arrest rates declined more than female rates
The male property crime arrest rate has generally declined each year since the late 1980s. In the 10 years since 2002, the male rate fell 33%, reaching its lowest level in at least three decades. In comparison, the decline in the female rate began nearly 10 years after that for males, and the relative decline was far less for females (down 19% since 2002). Unlike the pattern for males, the female rate varied considerably since 2002. However, after 3 consecutive years of decline, in 2011 the female rate reached its lowest point since at least 1980.
Property crime arrest rates declined for all racial groups
Similar to the pattern for violent crime, property crime arrest rates have declined for all racial groups for nearly two decades. As a result, in 2011 the rates for level since at least 1980. The decline over youth (51%), followed by American Indian
each racial group were at their lowest the past 10 years was greatest for Asian (43%), white (35%), and black (13%) youth.
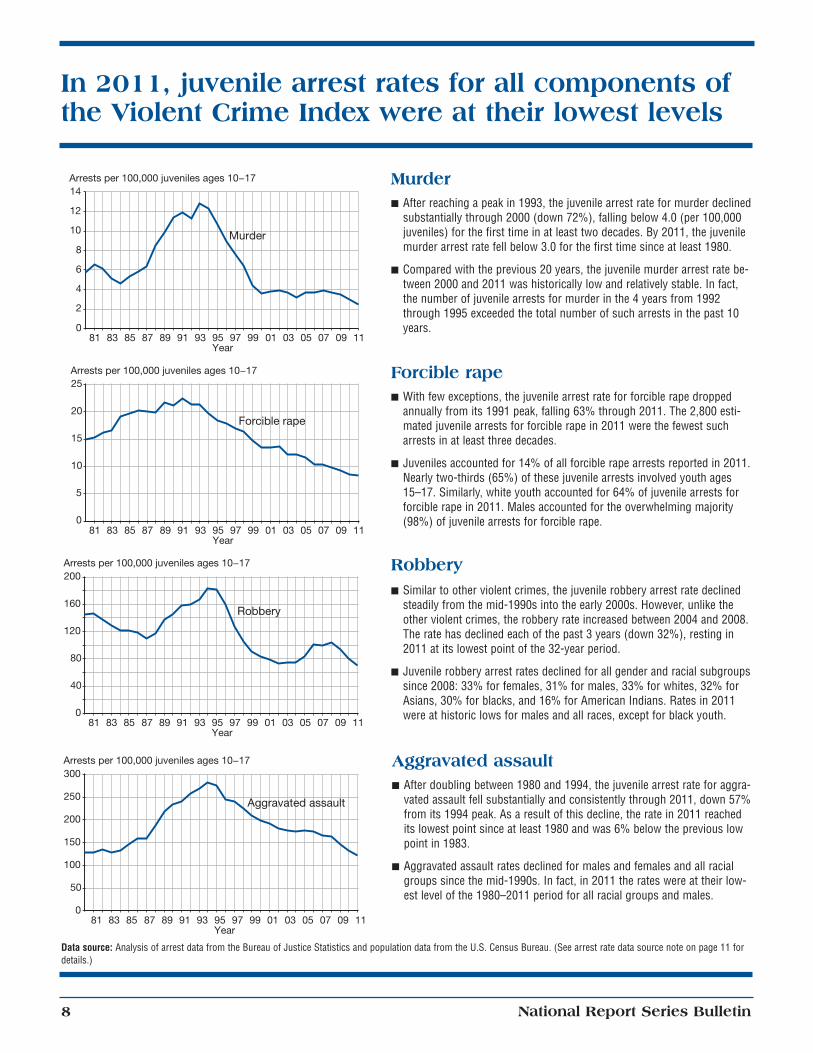
In 2011, juvenile arrest rates for all components of the Violent Crime Index were at their lowest levels
Murder After reaching a peak in 1993, the juvenile arrest rate for murder declined
substantially through 2000 (down 72%), falling below 4.0 (per 100,000 juveniles) for the first time in at least two decades. By 2011, the juvenile murder arrest rate fell below 3.0 for the first time since at least 1980.
Compared with the previous 20 years, the juvenile murder arrest rate between 2000 and 2011 was historically low and relatively stable. In fact, the number of juvenile arrests for murder in the 4 years from 1992 through 1995 exceeded the total number of such arrests in the past 10 years.
Forcible rape With few exceptions, the juvenile arrest rate for forcible rape dropped
annually from its 1991 peak, falling 63% through 2011. The 2,800 estimated juvenile arrests for forcible rape in 2011 were the fewest such arrests in at least three decades.
Juveniles accounted for 14% of all forcible rape arrests reported in 2011. Nearly two-thirds (65%) of these juvenile arrests involved youth ages 15–17. Similarly, white youth accounted for 64% of juvenile arrests for forcible rape in 2011. Males accounted for the overwhelming majority (98%) of juvenile arrests for forcible rape.
Robbery Similar to other violent crimes, the juvenile robbery arrest rate declined
steadily from the mid-1990s into the early 2000s. However, unlike the other violent crimes, the robbery rate increased between 2004 and 2008. The rate has declined each of the past 3 years (down 32%), resting in 2011 at its lowest point of the 32-year period.
Juvenile robbery arrest rates declined for all gender and racial subgroups since 2008: 33% for females, 31% for males, 33% for whites, 32% for Asians, 30% for blacks, and 16% for American Indians. Rates in 2011 were at historic lows for males and all races, except for black youth.
Aggravated assault After doubling between 1980 and 1994, the juvenile arrest rate for aggra
vated assault fell substantially and consistently through 2011, down 57% from its 1994 peak. As a result of this decline, the rate in 2011 reached its lowest point since at least 1980 and was 6% below the previous low point in 1983.
Aggravated assault rates declined for males and females and all racial groups since the mid-1990s. In fact, in 2011 the rates were at their lowest level of the 1980–2011 period for all racial groups and males.
Data source: Analysis of arrest data from the Bureau of Justice Statistics and population data from the U.S. Census Bureau. (See arrest rate data source note on page 11 for details.)
National Report Series Bulletin 8
In 2011, juvenile arrest rates for burglary, larceny-theft, and motor vehicle theft reached historical lows
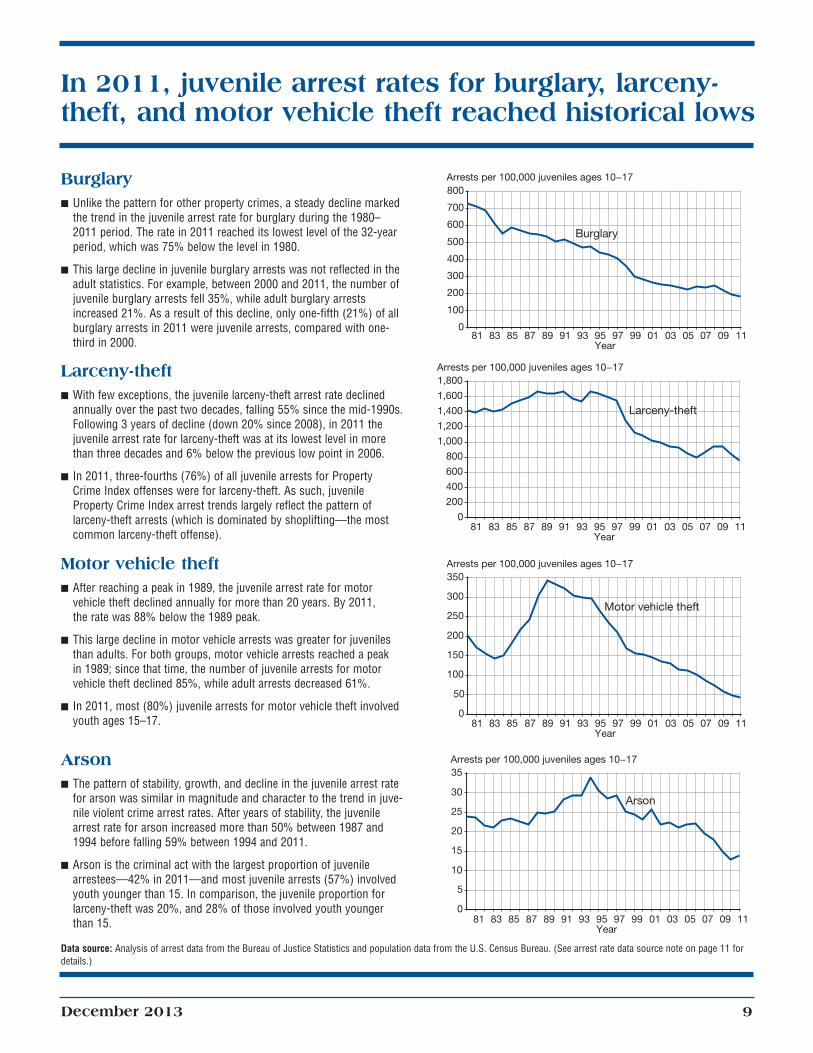
Burglary Unlike the pattern for other property crimes, a steady decline marked
the trend in the juvenile arrest rate for burglary during the 1980– 2011 period. The rate in 2011 reached its lowest level of the 32-year period, which was 75% below the level in 1980.
This large decline in juvenile burglary arrests was not reflected in the adult statistics. For example, between 2000 and 2011, the number of juvenile burglary arrests fell 35%, while adult burglary arrests increased 21%. As a result of this decline, only one-fifth (21%) of all burglary arrests in 2011 were juvenile arrests, compared with one-third in 2000.
Larceny-theft With few exceptions, the juvenile larceny-theft arrest rate declined
annually over the past two decades, falling 55% since the mid-1990s. Following 3 years of decline (down 20% since 2008), in 2011 the juvenile arrest rate for larceny-theft was at its lowest level in more than three decades and 6% below the previous low point in 2006.
In 2011, three-fourths (76%) of all juvenile arrests for Property Crime Index offenses were for larceny-theft. As such, juvenile Property Crime Index arrest trends largely reflect the pattern of larceny-theft arrests (which is dominated by shoplifting—the most common larceny-theft offense).
Motor vehicle theft After reaching a peak in 1989, the juvenile arrest rate for motor
vehicle theft declined annually for more than 20 years. By 2011, the rate was 88% below the 1989 peak.
This large decline in motor vehicle arrests was greater for juveniles than adults. For both groups, motor vehicle arrests reached a peak in 1989; since that time, the number of juvenile arrests for motor vehicle theft declined 85%, while adult arrests decreased 61%.
In 2011, most (80%) juvenile arrests for motor vehicle theft involved youth ages 15–17.
Arson The pattern of stability, growth, and decline in the juvenile arrest rate
for arson was similar in magnitude and character to the trend in juve-nile violent crime arrest rates. After years of stability, the juvenile arrest rate for arson increased more than 50% between 1987 and 1994 before falling 59% between 1994 and 2011.
Arson is the criminal act with the largest proportion of juvenile arrestees—42% in 2011—and most juvenile arrests (57%) involved youth younger than 15. In comparison, the juvenile proportion for larceny-theft was 20%, and 28% of those involved youth younger than 15.
Data source: Analysis of arrest data from the Bureau of Justice Statistics and population data from the U.S. Census Bureau. (See arrest rate data source note on page 11 for details.)
NA = Arrest counts were not available for the District of Columbia or Hawaii in the FBI’ s Crime in the United States 2011 .
Notes: Arrest rates for jurisdictions with less than complete reporting may not be representative of the entire state. Although juvenile arrest rates may largelyreflect juvenile behavior, many other factors can affect the magnitude of these rates. Arrest rates are calculated by dividing the number of youth arrests made in the yearby the number of youth living in the jurisdiction. Therefore, jurisdictions that arrest a relatively large number of nonresiden t juveniles would have a higher arrest rate thanjurisdictions where resident youth behave similarly. Jurisdictions (especially small ones) that are vacation destinations or that are centers for economic activity in aregion may have arrest rates that reflect the behavior of nonresident youth more than that of resident youth. Other factors tha t influence arrest rates in a given areainclude the attitudes of citizens toward crime, the policies of local law enfor cement agencies, and the policies of other compo nents of the justice system. In many areas,not all law enforcement agencies report their arrest data to the FBI. Rates for such areas are necessarily based on partial inf ormation and may not be accurate.Comparisons of juvenile arrest rates across jurisdictions can be informative. Because of factors noted, however , comparisons should be made with caution.
Data source: Analysis of arrest data from Crime in the United States 2011 (Washington, DC: Federal Bureau of Investigation, 2012) tables 5 and 69, and population datafrom the National Center for Health Statistics’ Postcensal Estimates of the Resident Population of the United States for July 1, 2010–July 1, 2012, by Y ear, County,Single-Year of Age (0, 1, 2, . . . , 85 Y ears and Over), Bridged Race, Hispanic Origin, and Sex (Vintage 2012) [machine-readable data files available online at www .cdc.gov/nchs/nvss/bridged_race.htm, as of 6/13/13].
National Report Series Bulletin 10
Notes
Arrest rate data source
Analysis of arrest data from Snyder, H., and Mulako-Wantota, J., Bureau of Justice Statistics, Arrest Data Analysis Tool [available online at www.bjs.gov/index. cfm?ty=datool&surl=/arrests/index.cfm, retrieved 6/3/13]; population data for 1980–1989 from the U.S. Census Bureau, U.S. Pop u la tion Es ti mates by Age, Sex, Race, and His pan ic Origin: 1980 to 1999 [machine-readable data files available online, re leased 4/11/00]; population data for 1990–1999 from the National Center for Health Statistics (prepared by the U.S. Census Bureau with support from the National Cancer Institute), Bridged-Race Intercensal Estimates of the July 1, 1990– July 1, 1999, United States Resident Population by County, Single-Year of Age, Sex, Race, and Hispanic Origin [machinereadable data files available online at www.cdc.gov/nchs/nvss/bridged_race. htm, released 7/26/04]; population data for 2000–2009 from the National Center for Health Statistics (prepared under a collaborative arrangement with the U.S. Census Bureau), Intercensal Estimates of the Resident Population of the United States for July 1, 2000–July 1, 2009, by Year, County, Single-Year of Age (0, 1, 2, . . . , 85 Years and Over), Bridged Race, Hispanic Origin, and Sex [machinereadable data files available online at www.cdc.gov/nchs/nvss/bridged_race. htm, as of 10/26/12, following release by
the U.S. Census Bureau of the revised unbridged intercensal estimates by 5-year age group on 10/9/12]; and population data for 2010–2011 from the National Center for Health Statistics (prepared under a collaborative arrangement with the U.S. Census Bureau), Postcensal Estimates of the Resident Population of the United States for July 1, 2010–July 1, 2012, by Year, County, Single-Year of Age (0, 1, 2, . . . , 85 Years and Over), Bridged Race, Hispanic Origin, and Sex (Vintage 2012) [machine-readable data files available online at www.cdc.gov/nchs/nvss/ bridged_race.htm, as of 6/13/13, following release by the U.S. Census Bureau of the unbridged vintage 2011 postcensal estimates by 5-year age group on 6/13/13].
Data coverage
FBI arrest data in this bulletin are counts of arrests detailed by age of arrestee and offense categories from all law enforcement agencies that reported complete data for the calendar year. (See Crime in the United States 2011 for offense definitions.) The proportion of the U.S. population covered by these reporting agencies ranged from 72% to 86% between 1980 and 2011, with 2011 coverage of 80%.
Estimates of the number of persons in each age group in the reporting agencies’ resident populations assume that the resident population age profiles are like the nation’s. Reporting agencies’ total
Visit OJJDP’s Statistical Briefing Book for more information on juvenile arrests
OJJDP’s online Statistical Briefing Book (SBB) offers access to a wealth of information about juvenile crime and victimization and about youth involved in the juvenile justice system. Visit the “Law Enforcement and Juvenile Crime” section of the SBB at ojjdp.gov/ojstatbb/crime/faqs.asp for more information about juvenile arrest rate trends detailed by offense, gender, and race, including a spreadsheet of all juvenile arrest rates used in this bulletin.
populations were multiplied by the U.S. Census Bureau’s most current estimate of the proportion of the U.S. population for each age group.
The reporting coverage for the total United States (83%) in the table on page 10 includes all states reporting arrests of persons younger than age 18. This is greater than the coverage in the rest of the bulletin (80%) for various reasons. For example, a state may provide arrest counts of persons younger than age 18 but not provide the age detail required to support other subpopulation estimates.
This bulletin was written by Charles Puzzanchera, Senior Research Associate, with assistance from Melissa Sickmund, Ph.D., Director, at the National Center for Juvenile Justice, with funds provided by OJJDP to support the National Juvenile Justice Data Analysis Project.
This bulletin was prepared under cooperative agreement number 2010–MU–FX–K058 from the Office of Juvenile Justice and Delinquency Prevention (OJJDP), U.S. Department of Justice.
Points of view or opinions expressed in this document are those of the author and do not necessarily represent the official position or policies of OJJDP or the U.S. Department of Justice.
The Office of Juvenile Justice and Delinquency Prevention is a component of the Office of Justice Pro grams, which also includes the Bu reau of Jus tice As sis tance; the Bu reau of Jus tice Sta tis tics; the National In sti tute of Justice; the Office for Victims of Crime; and the Office of Sex Offender Sentencing, Monitoring, Apprehending, Registering, and Tracking.
U.S. Department of Justice
Office of Justice Programs
Office of Juvenile Justice and Delinquency Prevention
Washington, DC 20531
Official Business Penalty for Private Use $300
*NCJ~244476*PRESORTED STANDARD POSTAGE & FEES PAID