K?.~~ NDC-77052-50 p®,, O DEVLOPMENT OF VTOL FLYING QUALITIES CRITERIA FOR LOW SPEED AND HOVER by ROGER H. HOH and IRVING L. ASHKENAS SYSTEMS TECHNOLOGY, INC. HAWTHORNE, CALIFORNIA 90250 BEST DD C AVAILABLE COPY , . DECEMBER 1979 JAN 2I A APPROVE.D FOR PUBLIC RELEASE; DISTRIBUTION UNLIMITED '-I-iPREIPARED MOR NAVAL AIR DEVELOI1Th&NT CENTER WARMINSTER, PENNSYLVANIA 189714 801 01
Transcript
K?.~~ NDC-77052-50
p®,,
O DEVLOPMENT OF VTOL FLYING QUALITIES CRITERIA
FOR LOW SPEED AND HOVER
by
ROGER H. HOH and IRVING L. ASHKENAS
SYSTEMS TECHNOLOGY, INC.
HAWTHORNE, CALIFORNIA 90250
BEST DD CAVAILABLE COPY , .
DECEMBER 1979 JAN 2I
AAPPROVE.D FOR PUBLIC RELEASE; DISTRIBUTION UNLIMITED
'-I-iPREIPARED MOR
NAVAL AIR DEVELOI1Th&NT CENTER
WARMINSTER, PENNSYLVANIA 189714
801 01
NAflC-77 052-30
flEPORT NUNIBER!N SYSTEM - The numbgrilg of technical projact reports issuad b~y Ilit, rI vi Air nav ,!opm~ntCtris mrrtged for spacific idenickton purposes. Eacha numb2r consists of tlie Centev vcrsnym., the raIendar
yvrh wlhch the ntumbpr was zssigned, the SeqUanCe nu~mber of the report within th specific c--'w-dar year, ia'; idth - offietcl 2-digit" correspondence cod2 of the Command Office or th Functional Direc-tX3,2 ri~spcslble for thereporL For example: Report Nlo. NADC-78015-20 indicates the fifteonh Center report for the yper 1973, and Fpreep:r~d117t the Syst~ms Directorat. Ilha numeric2 cocles ae as follows:
Mi Camrwtaff, D~IvA A~r [Iacprnent Cant-.G1 Teducal 0ir--Ct± Nzv2I Air Ovlp n Cmztr
UNCLASSIFIEDSfECURITY CLASSIFICATION OF THIS PAGE Mhen DO& EAtm0
20. ABSTRACT (concluded)
for partial IMC conditions but that a translational rate command systemis required for low speed and hover in zero visibility. In general, mostexperiments indicate that advanced displays are not a substitute foraugmentation. Tentative limiting conditions are defined for rate andattitude systems, but more data are required to define handling qualitiesfor translational rate command systems. Since the existing data base isprimarily oriented toward command/response characteristics, definition ofthe limiting conditions for turbulence and large discrete wind shears alsorequires more data.y
UNCLASSIFIED
SECUkITV CLA0IIIAiIION OP THIS PAGEfmO DaW 3nfea0
NADC-77052-30
FOSVORD
This study was conducted under "ontract No. N6229-77-C-0278 to theNaval Air Development Center, and was monitored by Mr. John W. Clark, Jr.,Flight Dynamics Branch (Code 60531). A significant portion of the studyinvolved obtaining unpublished data, as well as advice and consultationfrom a nunmber of researchers involved in VTOL experiments over the past15 years. While space does not allow us to acknowledge all of the peoplewho have given their time to assist us, we would like to offer specialthanks to Mr. Richard Grief of NASA/Ames, Mr. James Kelly of NASA/Langley,and Dr. Victor Lebacqz of NASA/Ames.
NTI5 £:D T B""
Un.announceod
Justification
By
74 rtributic,'
TR-1116-1 ili ,,,. _ __" v d
A5;ai I a1d.or
NADC-77052-30
TABL1Z OF' C000S
I. INTRODUCTION.... ... .... ... ..... I
II. USE OF EQUIVAIENT SYSTEM FORMS AS A SPECIFICATION FORMAT 2
A. Generic Considerations.... ... .... ... 3
B. Classification of Primar~y and Second ary Responses5
C. Equivalent System Form for Attitude Control.... .... 6
III. CLASSIFICATION OF HANDLING QUALITY CRITEIA INTERMS OF OUTSIDE VISUAL CUES.... ... ... ... 10
A. Development of Outside Visual Cue (OVC) Scale . ii. 1
B. Control/Display Tradeoffs.... ... ...... 14
C. Pilot Workload.... ....... ... ... 18
D. Results and Supporting Rationale..... ... ... 2?
E. Effect of Turbulence.... .... ... ..... 25
F. Swuary Comments.... ... . ... ..... 27
IV. DATA CORRELATION FOR LATERAL AND LONGITUDINAL AXES . . . . 28
A. Data Selection for Low Speed and Hover..... ..... 28
B. Pure Rate Systems..... ... ... ..... 29
C. Gust Sensitivity.... ... ... ... ... 39
D. Attitude Systems.... ... ... . ..... 42
E. Translational Rate Command.... .... ..... 56
V. EVALUATION OF EXISTING DATA BASE AND SUGIGESTED CRITERIADEVELOPMENIT PROGRAMS FOR LONGITUINAL ANDLATERAL AXES.... .... ... ... ..... 68
A. Control-Display Tradeoff... .... ... ... 68
B. Effect of Large X on Attitude Systems.... ...... 71
C. Effect of Wind Disturbances and Gust Sensitivity ... 71
D. Stick Force Gradients.... ... ... .... 72
E. Equivalent System Mismatch.... .... ..... 72
F. Effect of Time Delay.... ... .... ..... 73G. Classification of Attitude and Rate Syrstems.......75
H. Additional Data for Model Following Systems.........75
I. Additional Data for Translational Rate Systems .... 75
TR_1- 6- v
NADC-77052-30
* Page
VI. CONTRL POWER ................. 78
A. Requirements..... ... ... ... . ... 78B. Discussion of Potential Criteria ......... 79C. Analysis and Discussion of Exsting Control
This report contains data correlations and background material required
to develop updated handling quality criteria for VTOLs in the low speed
and hover flight rtgime.
The data correlations have been accomplished in terms of lower order
equivalent system (LOES) forms. These forms are presented in Section II.
It is felt that a primary deficiency of the current MIL-F-83300 speci-
fication is that it does not account for the combined effects of pilot out-
side visual cues, levels of augmentation, and cockpit displays. A first
cut attempt to account for these variables is presented in Section III.
A primary objective of this study has been to collect, evaluate and,
where appropriate, to correlate all available data obtained for low speed
and hover. These results are presented in Section IV, VI, and VII.
In the process of collecting, evaluating and correlating the above data,
deficiencies in the current data base have become arparent. These deficien-
cies are discussed in Section V and at the end of Sections VI and VII. A
discussion of the experiments required to resolve these deficiencies is also
included in each case.
The work is summarized in Section VIII through presentation of proposed
modifications to each of the affected paragraphs in MIL-F-83300.
TR-1116-1 1
/
NADC-77052-30
SECTIDN II
USE OF EQUIVALENT SYSTEM YOF60 AS A SPECIFICATON FORMAT
There are a number of ways to specify handling qualities criteria,
each having certain advantages and disadvantages. For flight vehicles
which are characteristically nonclassical in terms of their dynamic modes,
and which tend to be heavily augmented, the use of lower order equivalent
systems (LOES) has certain advantages and disadvantages, both summarized
below.
1. Advantages of IWES Specifications.
* Higher order modes due to augmentation are accountedfor implicitly.
* The physical connection between the requirements andthe response to control inputs is direct.
* Unifies and reduces the nmuber of (response) parametersneeded to define the system properties.
* It is intuitively satisfying in that it reflects thedesire of the pilot to have lower order responsesto control inputs (see Ref. i).
2. Disadvantages of IDES Specification
• A method for relating the degradation in pilot opinionwith the degree of mismatch between the HOS and IDESis not yet well defined. Ongoing work to fonmilatesuch a method is currently being accomplished byHodgkinson, et al.(see Ref. 2).
* It is a relatively new concept and has not receivedacceptance in some segments of the handling qualitiescommunnity.
In our opinion, the advantages of using IDES to specify handling quality
criteria outweighs the disadvantages. Hence, the data analysis and handling
requirements discussed in this report are presented in terms of LOES. It
should be noted that many of the requirements which specify modes in the
current MIL-F-83300 could easily be reinterpreted as the specification of
an equivalent system.
TR- 1116-1 2
NADC-77052-30
A. GENERIC CONSIDERATIONS
Some basic considerations which govern the use of LOES forms in the
specification of handling quality criteria are sumarized in Fig. 1. A
generalized stability augmentation scheme is shown at the top of the figure.
It illustrates that the equalization to achieve a desired set of control and
disturbance response characteristics can be allocated to the forward loop,
Ga, the feedback path, Gf, or at the input Gi. Several key concepts are
illustrated. First the command response (Fig. la) can be made essentially
independent of the basic vehicle dynamics (shown heavily outlined). The
disturbance response (Fig. Ib) can be made arbitrarily small by increasing
the overall loop gain GaGf. Even after consideration of the practical
limits imposed by actuator dynamics, control system lags, gain limits, etc,
the disturbance response can be highly attenuated and the command response
tailored nearly independently of the basic vehicle dynamics. The effect of
allocating the equalization to the feedback path (response feedback) or to
the forward loop (command augmentation) can be an important consideration
in the specification of handling qualities criteria. This is discussed in
detail in the Vertical Axis section of the report (Section VII). Along this
line, the separation of command from disturbance response is an important
consideration for attitude control systems. Systems which utilize a large
GaGf for disturbance suppression and a stick filter Gi to avoid overly
abrupt command response characteristics are referred to as "model following
attitude systems" in this report.
Secondary responses (Figs. ic and id) are defined by variables which
are not fed back to a control. In the example shown in Fig. ic, the second-
ary response, k, to a command input Fs can be tailored somewhat by the
attitude augmentation
E) Gi
Fs Gf
The heavily outlined ratio of transfer functions is indicative of the air-
craft response to commands with attitude constrained, i.e., */e -" g/s.
T-i i6- 1 3
...h"kU . ... . .. . .* I r ]I . . .. II -" . . . . . . . . . .. . .
An example of the importance of properly classifying the primary and
secondary responses to command inputs when using tDES as a criterion
specification is illustrated in Ref. 3. Here is was noted that an appro-
priate LOES form for attitude control is the short period approximation
defined in Ref. ., e.g.,
K (s + L,)e (1)
T Fs s+ 2tsp.wspS + Wsp2
In matching some of the configurations with the Eq. 1 form, it was necessary
to free L to get a good fit. In some cases "unreasonably large" values
of L, were obtained. That is when taken in the context of the classical
definition as obtained from a rigorous derivation of the equations of motion,
L. appears not only as a zero in the primary (attitude) command response
transfer function (Fig. 1 a) but also as the dominant mode of the secondary
(path command response (Fig. Ib) e.g.,
A U (2)e (1/La)s + 1
If Eqs. 1 and 2 are classified as primary and secondary responses to a
command input, then limits on "La" in Eq. 1 should be set purely on the
basis of attitude control. There is no need to make La in Eq. 1 consistent
with La, in Eq. 2. In fact, it would be best to relabel La, in Eq. 1 as a
general first order time constant to avoid confusion. Handling quality
boundaries for path control, in this case, are properly set by defining
limits on the LOES form which defines the secondary response to commands.
Again, using L. may lead to confusion and another general first order time
constant should be used.
TR-1116-1 5
NADC-77052-30
C. EQMIVALIM SYSTEM PORM FOR ATTITDE COMTOL
Consideration of available handling quality data for low speed andhover reveals that the lowest order system which adequately represents
all realizable forms of VTOL attitude control is given as:
(s + X)(s 2 + 2 gs + a);"-
Practical combinations of t, a and X which represent both augmented and
unaugmented systems are categorized in Fig. 2 according to their response
characteristics at and below the region of crossover.
Attitude systems are inherently more satisfactory than rate systems
for the low speed and hover tasks, especially in low visibility conditions.
Analytical and experimental evidence supporting this contention is pre-
sented in Section III. We shall confine the present discussion, however,
to dealing with the establishment of a classification scheme which can
be used to quantitatively identify attitude systems. This is best accom-
plished by identifying the key features of attitude systems that make them
desirable for low speed and hover. Based on the closed-loop pilot/vehicle
analysis in Section III these are:
I. Attitude systems allow longer periods of unattended opera-tion than rate systems because the pilot is not requiredto perform mid to high frequency attitude regulation.
2. There is one additional integration between stick deflec-tion and aircraft velocity (or position) with a ratesystem when compared to an attitude system.
The first of these considerations arises from the natural tendency for
an attitude system to return to trim when upset by a gust or an inadvertent
pilot input. It follows that a straightforward way to identify an attitude
system would be in terms of its tendency to return to trim when disturbed.
This is somewhat analogous to the classical stick fbrce per knot gradient
used to define static stability in conventional airplanes. In fact, the
use of stick force per attitude change from trim AFs/Ae was considered as
a criterion. &Fs/he was rejected as a viable approach because of problems
TR-i116-i 6MOMMM swmk 1
NADC-77O52-30
-sn Region ofPiloted Crossover
a) Pure Rot System
eUnaugmented Helicopters( Rol. No. 6 nd7
b e Rate Damter ih O
*Rt Nos. and 6
III Cb) atiue System With LowJA Frequency Atie Characteristics
Tof e Ref. Nos. Sa~nd 60
c) Attitude System With DLoop
Figure ~ ~ ~ ~ ~ ~ ~ ~ d 2.Ar~i~) ce~ om f~ ttitude Syposem
for Low Speed anid Hovr
TR-1 i6.-1 7
~/
NDC-77052-30
relative to the appropriate frequency at which it should be measured, and
the complicating effects of stick force characteristics for sidearm con-
trollers vs. center sticks. It was finally decided to use a time responsecriterion. The basis of the criterion is that the attitude should return
to trim within some tolerance and within some time (TA )after a stick
pulse. It must also be specified that the attitude stay within some over-
* shoot tolerance level for TB - TA seconds to eliminate the possibility of
* compliance via a highly oscillatory system. A sketch of the proposed
* criterion form is given in Fig. 3. It should be emphasized that the Fig. 3
criterion simply classifies the response as to whether or not it can be
considered an attitude system.
Tentative values of Kel, ,e2, and TA can be derived from considerations
of the data correlations in Fig. 21 (Section IV-D). As noted in Section IV-D,
a classical attitude system (Fig. 2d) becomes a rate system with low fre-
quency attitude characteristics (Fig. 2b) as the damping ratio in Eq. 1
increases above unity (see Fig. 23, Section IV-D). Utilizing the boundary
O9 peak
Unacceptable JAttitude
Response toStick Pulse Kpeok
0 TA% Time To
Overshoot "._. oundory Sim
Unacceptable
Figure 3. Form of Criterion for Specificationof an Attitude System
TR-111,- 1 8
NADC-77052-30
between rate and attitude systems defined in Fig. 21 as TI = 1 sec we can
estimate a value of TA by noting where the l/T = i .0 line passes through
the specification bounddary. This point represents the most sluggish atti-
tude system within the Level 1 boundaries and is approximated by:
0 K(4S (s + .64)7
Based on past experience with evaluations of attitude systems, a
reasonable classification of such systems can be based on their ability
to return to within 20 percent of the peak value induced by a stick pulse;
i.e., set the tentative value of Ke1 at 0.20. The time required for the
above system to return within 20 percent of peak following a unit pulse is
approximately six seconds, and represents an initial estimate of TA. The
overshoot boundary would be properly set by an equivalent second order sys-
tem damping ratio of 0.3 based on Fig. 21. In order to account for an
effective decrease in damping due to a third order response an equivalent
tn of 0.2 has been tentatively selected resulting in a K@2 = 05. While
these numbers are supported by the data and seem reasonable intuitively
(based on simulator and flight evaluation of rate and attitude systems) it
would be desirable to conduct an experiment specifically oriented toward
validating or refining these estimates. Such an experiment should be
designed to insure that the final criterion serves its intended purpose,
i.e., to identify attitude systems in terms of their ability to minimize
pilot workload by allowing increased periods of unattended operation.
TR-1116-1 9
NADC-77052-30
SECT3ON I
LASSICATION OF IAZLInG QUALIT CRITW.ATNSOF OUTSDE VISUAL CUES
Most of the available data for low speed and hover handling criteria
has been obtained with good visual outside references and with no require-
ment for unattended operation. The real-life existence of secondary tasks,
and intermittent to total loss of visual references, places increased demands
on the pilot - an effect which is not discernible from such data. For
example, pilot ratings for an unaugmented helicopter (Ref. 11) and a highly
augmented translational rate command (TRC) system (Ref. 12) all fall within
the satisfactory region (pilot rating better than 3.5). This result is a
consequence of experimental scenarios which tend to be tailored toward the
systems being investigated. That is, with pure rate systems the scenario
is usually benign, thereby usually allowing intense, null-time pilot atten-
tion; whereas with a translational rate command (TRC) system the task tends
to be more demanding. The most critical contributor to the total pilot
workload appears to be the quality of out-the-window cues for detecting
aircraft attitudes, and, to a lesser extent, position and velocity. Cur-
rently, these cues are categorized in a very gross way be designating the
environment as either visual meteorological conditions (VMC) or instrument
meteorological conditions (IMC). A more discriminating approach is to clas-
sify visibility in terms of the detailed attitude and position cues available
during the experiment (or proposed mission); and to associate handling quali-
ties requirements with these finer-grained classifications.
In the remainder of this section, existing data are utilized to make
preliminary estimates of the equivalent low-order system hover dynamics
required to cope with various classifications or levels of the operating
environment. These estimates are based on a combination of closed-loop
analysis and pilot commentary from flight and simulator experiments. The
results are presented in terms of the specific levels of the maximum accept-
able outside visual cues rating, OVC, (worst visibility) for each type of
equivalent system response and display sophistication.
TR-1116-I 10
NADC-77052-30
A. DEVEIOPHM OF OMSIDE VISUAL CUE(OVC) SCALE
The longitudinal pilot/vehicle closure characteristics for different
levels of augmentation for hover position control and for speed control
are shown in Fig. 4. The comments below each root locus sketch indicate
the required pilot workload function and OVCs to maintain adequate stability
margins and path mode bandwidth (performance).
In the case of the rate augmented systems it can be seen that the pilot
must close the attitude loop with a reasonably high gain to stabilize the
phugoid mode, and to drive w' into a favorable region as necessary for a
good outer path loop closure. The requirement for a high-gain closure
implies a need for high pilot scanning activity (Ref. 13). In addition to
a high-gain attitude closure, the pilot must also develop lead on his posi-
tion error to maintain path stability. Figure 4 indicates that a reduction
in workload would be expected with attitude augmentation due to the elimina-
tion of the need for the pilot to perceive, stabilize, and constrain the
pitch and roll attitudes. The degree of workload reduction will of course
depend on the attitude SAS bandwidth and damping. Finally, with a trans-
lational rate command (TRC) system, the pilot simply has to perceive and feed
back the aircraft position without equalization, i.e., the requirements
for attitude stabilization and velocity feedback have been eliminated. The
need for certain specific outside visual cues (OVC) has been inferred from
such closed loop considerations; further, these OVC levels have been logi-
cally quantified in terms of a scale as shown in Fig. 5. Certain specific
closed loop considerations which went into formulating the scale are
summarized below and by the generic closed loop structure in Fig. 5.
0 A requirement for closure of the attitude loop impliesVMC conditions must prevail for adequate control.Two categories have been established for this condi-tion: OVO = 1 and OVC 2.
* If the equivalent system dynamics require closureof position and position rate, but not attitude, aminimum set of operating conditions quantified asOVC = 3 is defined.
TR-1116-i 11
"6-L k .. .. _ . ... alr ' . ... "" ..
NADC- 77052-30
I.RATE MATTITUDE M. TRANSLATIONALRATE
Attitude i~ ,#wx
Control
X ?~ Xl ITel yet
Pilot must close attitude Pilot does not have to Pilot does not haveloop with moderate gain close attitude loop to close attitude loop(implies high scan rate) with high gain
WO WO o
Position W, ilControl f
K, K, XX
Path mode bandwidth depends on ability of pilot Pilot does not have toto generate velocity feedback (position lead K ) generate position lead
(Ki =0)
w" wn
Control IO
Pilot must trade off tightnoss of speed control Adequate speed mode(magnitude of X") with stability to bandwidth at low or zero
pilot gain. Na tradeoffI between X"and II
*VMC only as primary -IMC for low speed and -iMC for low speed*IMC emergency backup intermittent IMC in and hoverfor brief IMC hover
FigLqre 4. Pilot Loop Closure Characteristics
TR-1 11 6-1 12
NADC-77052-30
Position and OVC
Attitude Cues Velocity Cues Level
Easily obtained. Easily obtained.
Somewhat obscured. Easily obtainedRequires fullconcentration toobtain continuousattitude information
Inadequate in some Adequate position.sectors of the visual Marginal rate cues.field.
Inadequate over most Position and rateof visual field, cues are marginal.
Rate cues are inter-mittently unavailable.
< IC Not -available. Not available.
o) Ouantificatlon of Outside Visual Cues (OVC)
PilotPerceived PositionPosition Pilot Cues,. _ Attitude ot
K x ~~Control AgetdRt+ YAirframe CusX
Ki pe Dynamics AttitudeCues, 8r
Pilot
GeneratedLead Requires OVC S 2 (VMC)
Requires OVC :S 3
Requires OVC S 4
b) Required Outside Visual Cues for Control
Figure .5. Development of Outside Visual Cue Scale
TR-1 i 16-i 13
NADC-77052-30
0 OVC = 4 quantifies the operating condition wherevelocity and attitude cues are not available. Thatis, only the outer loop in Fig. 5b can be closedby the pilot.
* OVC = 5 indicates that no outside visual cues areavailable.
B. COTW1 L/DISPIAY TRADBOFFS
Pilot workload can also be reduced via improved displays. Recent
work in the control/display tradeoff area includes the Calspan X-22 flight
tests (Ref. 14) and the CH-46/47 variable stability helicopter (Ref. 15).
Results of the X-22 experiment are summarized in Fig. 6 (Ref. 14). These
data represent an ILS approach including deceleration to hover in IDC condi-
tions (OVC = 5 in Fig. 5). The ratings reported were made by one pilot,
although other pilots flew and rated some of the configurations. Perhaps
the most significant result of these data is that increased augmentation is
con' iderably more beneficial than improved displays. This conclusion is
so. %t compromised by the pilot rating of 7 for the mechanical flight
director (Configuration ED-1/FD). However, it should be noted that the very
poor rating given to ED-1/FD in Fig. 6 is not consistent with the satisfac-
tory rating (PR= 3) given to SCAS No. 3 in Fig. 7. Comments by the X-22
subject pilot indicated that he felt that reliance on the mechanical flight
director was in itself a deficiency and that explicit velocity information
is an absolute necessity for IC hover. These comments along with the
consideration that the experiment was primarily oriented toward integrated
electronic displays could explain the surprisingly poor rating for ED-I/FD
in Fig. 6. The improved rating from Ref. 15, when plotted on Fig. 6, tends
to support the contention that displays have a significantly less dominant
effect than augmentation on pilot workload reduction. It should be noted
that the experiment described by Lebacqz and Aiken in Ref. 8 included the
ED-I/FD data point specifically for comparison with the CH-47 helicopter
experiments in Ref. 15.
Pilot rating data from Ref. 16 are also plotted on Fig. 7. The Ref. 16
experiment was specifically oriented toward the Navy mission and was con-
ducted on the NASA Ames Flight Simulator for Advanced Aircraft (PSAA). It
consisted of approaches and landings to a moving ship with various levels
TR-1116-I 14
NADC 77052-30
43* 3C 3D
Position, Velocity and 4C 30 2A 23 2C$Flight Director( (EADI )** ED-3 - S. N O 3E 3
Figure 7. Results of CH-47 Variable Stability HelicopterControl/Display Experiment (Taken from Ref.15
TR-111i6-1 16
NADC-77052-30
of sea state and wind over the deck (WOD). The flight visibility was set
to 700 ft. A head up display consisting of flight director and status
information was available to each of the two subject pilots. The results
shown in Fig. 7 indicate that reasonable agreement exists between Ref. 16
and Ref. 15 in that the pilots were able to hover the model following atti-
tude system using primarily flight director information. However, it should
be noted that some limited status information* was available to the Ref. 16
pilots since the visual range was set to 700 ft. The surprisingly good
rating given to the rate system without a flight director in the Ref. 16
experiment was probably a consequence of the available outside visual cues.
A dramatic improvement in pilot opinion is shown in Fig. 6 (for IM
tasks) when upgrading from a rate system to an attitude system. This is
supported by the results of the variable stability CH-47 helicopter (Ref. 15
(as shown in Fig. 7). The task on this latter experiment was an ILS approach
to hover with an electromechanical flight director.
Unfortunately, the rate SAS had a divergent mode above 40 kt (Ref. 15
(X = -0.25) and no pilot rating data were taken for low speed and hover
per se. However, there was evidence from the pilot commentary that the
rate SAS was unacceptable even below 40 kt (where the pitch divergence dis-
appears). It was noted that "even though decelerations to hover could be
consistently achieved with the rate SAS and flight director configuration,
the pilot workload was considered to be unacceptably high." Thus, there is
strong evidence that even with a good rate SAS and a flight director, the
low speed and hover handling qualities are unacceptable for IME flight.
Additional evidence that rate-like attitude response characteristics
are unacceptable for low speed flight in IMC conditions may be found in the
results of an instrument flight evaluation of the OH-6A helicopter. The
following quote is taken from Ref. 17.
"Associated with instrument flight are additional tasks oftuning radios, examining flight charts and approach plates, andvarious other required tasks. Accomplishment of these tasksrequires the removal of the pilot's hands from at least one ofthe flight controls. Flight in instrument conditions requirestotal concentration with constant corrective control inputs justto maintain a trim condition. A copilot would therefore berequired to aid the pilot in performing IFR operations if IFRflight were attempted."
*The status information was limited by the poor field of view of the FSAAvisual display plus other deficiencies of the simulator visual system whenused for low speed and hover (see Section IV).
TR-1116-1 17
NADC-77052-30
The pilot/vehicle closure characteristics of the OH-6A are given in Fig. 8
(taken from Ref. 17) for speeds from hover to 40 kt. Utilizing the pilot
model rules as stated in Ref. 13, the required compensation is seen to be
a lead at 0.5 sec in order to equalize to a K/s. Such compensation is
expected to produce only moderate penalties in pilot opinion, yet the pilot
comments indicated 100 percent workload was required simply to maintain
control in INC conditions (pilot ratings of 6 to 7).
Based on the above evidence, it seems reasonable to conclude that rate-
like attitude systems are acceptable for low speed and hover only in VWE
conditions.
Figure 6 indicates that a rate SAS combined with an electromechanical
flight director results in Level 3 flying qualities (PR = 7). However,
the data indicate that rate augmentation may be suitable for backup systems
(Level 2) in an electronic display which integrates position, velocity,
and flight director commands (ED-3 in Fig. 6).
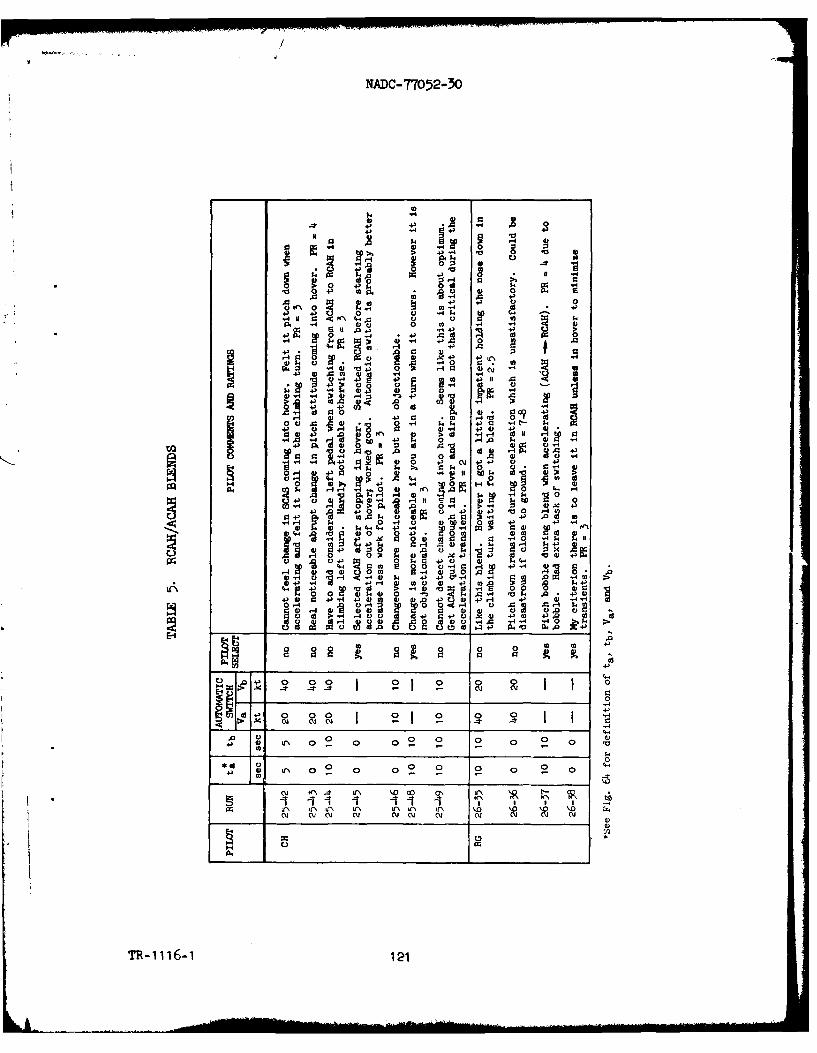
Rate comtand/attitude hold (RCAH) systems result in considerably improved
pilot ratings over pure rate systems, a fact which stems from the distur-
bance regulation characteristics inherent to this type of system. There
are very little data on RCAH systems for low speed and hover. One excep-
tion is a fixed-base simulation which was run to evaluate a system design
to allow ILS (full IM) approaches to hover and vertical letdown for the
Army/NASA/Bell XV-15 Tilt Rotor (Ref. 18). The final manual system included
a mechanical flight director plus moving map display and a fully automatic
collective axis to keep pilot workload at a reasonable level. A constant
attitude deceleration law was incorporated in the flight director - also
to keep pilot workload at a reasonably level. A fully automatic system
was also configured. The pilot ratings and commentary are summarized in
Table 1. These data indicate that an RCAH system with a mechanical flight
director is not satisfactory for low speed and hover in IE conditions.
C. PILT WOEKLOAD
There is some evidence that the highest pilot workload occurs not during
hover, but during the final phase of deceleration. Unfortunately, the pilot
ratings for the control/display tradeoff experiments (Refs. 14 and 15) included
TR-I 116-I 18
NADC-77052-30
Pilot O1-6A8c 81 Dynamics -0-40 kt
,9
Yp =Kp (s +2) e-253
.. 74(s +.016)'-(s +2)(s?-+.16)
60
Expected Region
40 - -T of Piloted
K/s beyond
-300 t L ii
(deg) ii-i
NADC-77o52-30
TABLE 1. PILOT RATINGS AND COMMENTARY FOR RATE COMMUAD/ATTITUDEHOLD SYSTEM IN IC (VISUAL LEVEL = 5) CONDITIONS
PILOT PILOT COMNENTS
TASK RATING
Constant Speed Glide 2 FD Longitudinal and lateral flightSlope Tracking 2 AP directors easy to track. Work-
load is low.
Deceleration to 4-1/2 FD Constant attention required tohover (INC) 2 AP keep flight director centered.
Kind of wanders during decelera-tion cannot set and forget.
Hover (IMC) and 4-1/2 to 5 FD I) Very little change in attitudevertical descent 2 AP results in pitch bar movement.
Requires light touch on stickto keep from overcontrolling.
FD=) Pilot flying via longitudinal Not unsafe.
and lateral flight directorbars. Collective is automatic 2) Requires constant attention.
Need time to scan otherAP .Fully automatic to touchdown N strments s ide ih t
instruments (besides flight
director) this close toground.
the entire mission from constant speed glide slope tracking to a stabilized
hover. A mission phase dependency of pilot workload is specifically indi-
cated in NASA TN D-8480 (Ref. 19), where an approximate variation in pilot
rating with approach phase was shown (see Fig. 9). This plot was formu-
lated on the basis of data obtained from the collective experience gained
in the CH-46/47 experiments conducted at NASA/Langley from 1962 through
1977 (Refs. 15 and 20). The comments on the plot reflect informal discus-
sions with the authors.
Additional support to the hypothesis that the deceleration phase is
critical stems from the apparent discrepancy in the two X-22 experiment
reports described in Refs. 14 and 21. These data are compared directly
in Fig. 10, where it is shown that a drastic improvement occurred in the
later experiment as shown in Ref. 21. Comparison between the experiments
TR-i116-1 20
NADC-77052-30
Unacceptable '/
.-......:...:, E ge oPilot rating in ". Edge of
Relativelo 5-6 region go-around
Workload
CP /-"TouchdownApproaches in idealconditions -no winds
Pilot ratings or turbulenceabout 3
Constant Deceleration Hover LetdownSpeed
Approach Phase
Figure 9. Relative Pilot Workload as Function of Approach Phase
O Ref. 4 X-22 experiment - continuousclosed loop duct control requiredfor deceleration (see Fig.6)
o Ref. 10 X-22 experiment -single discreteduct angle change required for deceleration
Figure 6 indicates that a fully integrated display results in a pilotrating of 4 for an approach in OVC Level 5 conditions (ftll IMC). Again,
because of the high scanning workload associated with rate systems, we
have elected to tentatively restrict the allowable OVC to 3 even with the
addition of a fully integrated display. This is increased to an OVC level
TR-1116-I 23
NADC-77052-30
of 5 when utilized as a backup system (Level 2 flying qualities), primarily
based on the pilot rating of 4 in Fig. 6 (ED-3/Rate).
2. Attitude Sytem
Figure 7 indicates that response feedback and model-following attitude
systems are unacceptable if only raw data displays are available. There-
fore, an OVC level of 2 is specified in Table 2. There is considerable
discrepancy between the X-22 results stated in Ref. 14 and the CH-46 results
described in Ref. 15 regarding attitude systems with a mechanical flight
director (PR = 7 vs. PR = 3, respectively). Until further data are avail-
able we have elected to compromise by allowing OVC Level 3 conditions for
response feedback systems and OVC Level 4 conditions for model followers
when the display consists of a mechanical flight director. The increase
to OVC Level 4 for model following is based on the improvement indicated
in Fig. 6 (pilot rating improves from 4 to 3) and on the obvious benefitswhich accrue from the gust regulation characteristics of a model-following
system. Both the response feedback and model-following attitude systems
should be adequate as a backup mode for full IM conditions, and therefore
an OVC level of 5 is indicated in Table 2 (for a mechanical flight director).
The only reservation is the pilot rating of 7 (ED-I/FD) in Fig. 6. However,
the pilot ratings of 3 and 4 in Fig. 7 are felt to carry enough weight to
allow these systems for full IC conditions, at least for Level 2 flying
qualities.
The X-22 data in Fig. 6 indicate that a model-following attitude system
with a fully integrated display results in pilot ratings in the satisfactory
range (PR = 2-3). However, there are some unpublished data from visiting
V/STOL pilots (from NASA/Langley and Ames) who gave ratings from 4 to 7 for
even the best configurations in Fig. 6. These pilots were probably not up
on the learning curve and did not have the benefit of the primary X-22
evaluation pilot in terms of comparing the best systems with the less
desirable rate systems. However, because of the critical nature of hover-
ing in IC, a conservative approach seems warranted. Therefore, until more
experience is gained (e.g., more pilots with adequate evaluation time),
it was decided to restrict the response feedback system to OVC Level 3 and
TR-1116-1 24
NADC-77052-30
the model follower to OVC Level 4. This may be unduly restrictive and
should be subjected to flight testing for validation.
3. TRC Systems
The translational rate command (TRC) systems represent a significant
decrease in pilot workload according to the analysis in Fig. 4. There
are some experimental results (Refs. 22 and 23 which support the analysis,
but neither reference specifically addresses the INC hover task. Addi-
tionally, there are some fixed-base simulation results which indicate that
a TRC system will be satisfactory for INC hover as shown in Refs. 13 and 23
Based on these results, it seems reasonable to allow light IM (OVC Level = 3)
even with raw data. Considering the minimal pilot workload to hold speed or
position (see Fig. 4) with a TRC system, an OVC level of 5 (full IMC) is
allowed for the mechanical flight director or the integrated display.
E. "WZT OF TUILE
The data utilized to obtain the results shown in Table 2 were obtained
with very little or no turbulence. The effect of atmospheric disturbances
was studied in Ref. 16 in terms of increasing WOD with the results shown in
Fig. 11. When *WOD = -30 deg, an area of low pressure occurred on the lee
side of the hanger tending to pull the aircraft into the structure. Figure 11
shows that this effect was quite pronounced for rate and attitude systems
but had little effect on the TRC SAS with position hold. Pilot commentary
indicated that the turbulence and wind shears generated by increasing WOD
completely dominated the task and that ship motion (up to sea state 5) and
low visibility were, by comparison, secondary effects. The effect of the
data in Fig. 11 on the interpretation of Table 2 may be summarized as
follows:
o If the OVC level is such that a rate system is indicatedin Table 2 the maximum allowable WOD would be as follows:
WOD -deg MAXIMUM WOD - kt
LEVEL 1 LEVEL 2
0 10 20
-30 15 25
TR-116-125
NADC-77052-30
Z P
ft 60 1..- oI~ 0
if4-*0
00
fn0
)Io
4- 04o -% P.4
44 a
~M'W IOCH
TR-1116-1 26
NADC-77052-30
0 If an attitude system is indicated, the maximum allow-able WOD would be as follows:
MAXIMUM WOD - kt
WOD -deg LEVEL 1 LEVEL 2
0 40 45
-30 20 4o
A tight attitude system (5 rad/sec bandwidth) was usedin Ref. 16. The effect of decreasing the attitude band-width is not currently known.
0 If a TRC system with position hold is utilized, the Fig. 11data indicates that Level 1 flying qualities can be achievedup to the maximum tested WOD of 45 kts. The system testedhad a 1 rad/sec bandwidth in the x and y position loops.The effect of lower bandwidth position or velocity loopsand of removing the position hold feature are currentlybeing analyzed.
P. SIUWR Y COMMTS
Based on existing data, a firstcut attempt at establishing minimum
acceptable systems for operations in specified levels of visibility has
been accomplished (Table 2). It indicates that rate augmentation is accept-
able for VMI only and that a TRC system will probably be required for hover-
ing in full IMC conditions.
There is evidence that the final phase of deceleration constitutes the
most critical flight condition for certain deceleration schemes. Further
experiments should concentrate on this area.
There is a substantial amount of disagreement within and among the
experiments regarding the minimum acceptable controls and displays. These
disagreements result in specific requirements for further experiments.
Finally, most of the existing data indicate that advanced displays are
not a substitute for augmentation.
TR- 116-1 27
NADC-77052-30
SECTION IV
DA!A FOOLIOS JR LATERAL AMDlONGI=DINAL AXES
A. DATA SELECTION FOR IOW SPED AND HOVER
Pilot ratings and performance in this flight regime are extremely sensi-
tive to the available visual and motion cues. This fact eliminates from
consideration all VNZ or partial VMC data taken without an adequate visual
display. For example, experienced VTOL and helicopter pilots were unable
to hover with any precision with even the best attitude augmentation sys-
tems using the Redifon display on the FSAA simulator. The reasons for
this are not entirely clear. However, there is evidence that the lack of
peripheral cues was not the answer. This result is in the form of an
unpublished experiment at NASA Ames where a research pilot hovered a UH-lH
helicopter with increasingly reduced field of view with little or no reduc-
tion in performance or increase in workload. The same pilot indicated that
the Redifon hover cues were inadequate to hover the FSAA simulator with
UH-lH dynamics. Possible explanations are lack of resolution and/or dead-
bands in the camera drive. Because of these problems, all data taken using
the Redifon display require special interpretation (see Section IV-E-I)
are primarily useful for determining possible trends. A similar situation
exists with the UARL (Ref. 24) data which utilized a contact a.alog display.
Experienced VTOL pilots were unable to give valid ratings on that simulator
because of problems with the display. It was, therefore, decided to use
the Ref. 24 data to establish trends rather than specific boundaries. Two
simulators appear to have adequate visual and motion cues, the NASA Ames
Sol and the NORAIR three axis flight similator. The S01 is a six degree
of freedom moving base simulator which utilizes one to one motion (no
washouts) and outside, real-world visual cues. Its drawback is a limited
maneuvering area (a cube 18 ft on a side). The NORAIR simulator utilized
a visual scene generated by a point light source on a 12 ft radius hemis-
pherical screen. Pilot comments indicate that adequate hover cues were
available. This included a NASA research pilot who compared actual X-14A
hover with an X-14A simulation at NORAIR.
TR-1116-1 28
NADC-77052-30
SECTION IV
DATA FO R rATEAL AIWNGITUDINAL AXES
A. DATA SELMMIDN FOR lOW SPEED AID HOVER
Pilot ratings and performance in this flight regime are extremely sensi-
tive to the available visual and motion cues. This fact eliminates from
consideration all VMC or partial VMN data taken without an adequate visual
display. For example, experienced VTOL and helicopter pilots were unable
to hover with any precision with even the best attitude augmentation sys-
tems using the Redifon display on the FSAA simulator. The reasons for
this are not entirely clear. However, there is evidence that the lack of
peripheral cues was not the answer. This result is in the form of an
unpublished experiment at NASA Ames where a research pilot hovered a UH-1H
helicopter with increasingly reduced field of view with little or no reduc-
tion in performance or increase in workload. The same pilot indicated that
the Redifon hover cues were inadequate to hover the FSAA simulator with
UH-1H dynamics. Possible explanations are lack of resolution and/or dead-
bands in the camera drive. Because of these problems, all data taken using
the Redifon display require special interpretation (see Section IV-E-I)
are primarily useful for determining possible trends. A similar situation
exists with the UARL (Ref. 24) data which utilized a contact analog display.
Experienced VTOL pilots were unable to give valid ratings on that sirmlator
because of problems with the display. It was, therefore, decided to use
the Ref. 24 data to establish trends rather than specific boundaries. Two
simulators appear to have adequate visual and motion cues, the NASA Ames
801 and the NORAIR three axis flight simulator. The SO1 is a six degree
of freedom moving base simulator which utilizes one to one motion (no
washouts) and outside, real-world visual cues. Its drawback is a limited
maneuvering area (a cube 18 ft on a side). The NORAIR simulator utilized
a visual scene generated by a point light source on a 12 ft radius hemis-
pherical screen. Pilot comments indicate that adequate hover cues were
available. This included a NASA research pilot who compared actual X-i4A
hover with an X-14A simulation at NORAIR.
TR-1 116-1 28
NADC-77052-30
Flight data is available in two categories. Category one consists of
a series of experimental VTOL aircraft, which includes the XV-5, CL-84,
XC-142, TAGS helicopter and VAK-191B etc. The second category consists
of variable stability research vehicles such as the X-22A, the NASA
Langley CH-I6/47, the NRC Bell helicopter, and the NASA Ames X-14. Data
correlations in this report have concentrated on Category 2 flight experi-
ments and simulation results from the NASA Ames S01 and the NORAIR sima-
lation reported in Ref. 6. This is a result of the fact that most of
the problems in the category one experiments were vehicle-dependent, and,
in most cases the pilots did not give ratings nor were they assigned
specific tasks.
Two meetings were conducted at NASA Ames to review results obtained dur-
ing the past 12 years using the S01 simulator and X-14A test aircraft. A
synopsis of these results has been published in a recent AIAA Journal of
Guidance and Control article (Ref. 25). The detailed pilot ratings and
commentary from these experiments have been made available to STI by
Mr. Richard Greif of NASA Ames. This data base includes 440 runs on the
S01 simulator where two experienced VTOL pilots evaluated parametric varia-
tions in rate and attitude augmentation as well as control power. These
data combined with the NORAIR data of Ref. 6, the X-14A data (Ref. 26), as
well as the variable stability helicopter data from Refs. 11, 27 and 28
result in a reasonably good data base from which to establish flying quali-
ties boundaries for rate and attitude equivalent system parameters.
B. PURE RATE SYSTEMS (See Fig. 2a)
The variable stability helicopter experiments conducted at Princeton
University (see Ref. 11) as well as the simulator experiments of Refs. 6
and 24 include a reasonably wide range of rate system parameters [%, n
and X (see Fig. 2a)]. The results of Ref. 11 are presented in terms of
pilot rating boundaries on a grid of Mq vs. Mug in Fig. 12 (taken directly
from Ref. 11). However, further light can be shed on these results as well
as the results of Refs. 6 and 24 by plotting the pilot ratings vs.
As shown in Fig. 13, the correlation with an~ tends to be grouped into
low and high values Of gri* Within each group the pilot ratings are seen
to be relatively independent of damping ratio. While not shown on the plot,.
it also turns out that the ratings are independent of X. (X varies from 1 to
6 1/sec). Based on these results we would surmise that satisfactory pilot
ratings (less than 3-1/2) are reasonably assured if ci 5. 0.5 rad/sec for
tn i 0 and %~ .0.9 rad/sec if Cn > 0. The requirement for %~ < 0.5 (for
tn 1 0) is in agreement with Ref. 29. However, the lack of sensitivity
of the pilot ratings to 6n and X was somewhat surprising until considered
in the light of the closed-loop pilot/vehicle system. System surveys for
TR-1116-1 30
NADC-77052-30
0 Ref. I I
9 - Ref. 6 (low Mu ,Mugx33)
0 Ref.6 (high Mu , Muga=40)
8&£ Ref. 24 (high Mu , Mug =I.0)8- 0
*K9 K(s +I/TO)7 8 (s-+X)(s2 I 2Cnwns +Wn)
X varies from I to 6K9 separately optimized .6 J9-CL?6-0 -%29
a: 2S -.12 0o .35
.-16* .02
.0
-.1303- 2
2- 4
1 1 1
0 .2 .A .6 .8 1.0 1.2 1.4wn (rod /sec)
Figure 13. Pilot Rating vs. Frequency for aVariety of tnsand X's (longitudinal axis)
TE- 1116-i 31
NADC-77052-30
piloted loop closures of two of the Ref. 11 configurations are shown in
Fig. 14. Configuration 1 has large negative damping (tn = -. 22) and a
marginally low value of X whereas Configuration 12 has nearly zero damp-
* I ing (n = -.06) and a large value of X. Without pilot equalization (leaAl),
both configurations are non K/s-like in the region of piloted crossover
(approximately 1 to 3 rad/sec). Addition of pilot lead (to cancel X)
results in a considerable improvement in Configuration 1, i.e., the sys-
tem is equalized to K/s at all frequencies above about o.8 rad/sec. How-
ever, lead equalization has little effect on Configuration 12 in the region
of piloted crossover. Thus we may surmise that the physical interpretation
* of poor pilot ratings for large (W~ > 0.5 rad/sec) is that the pilot is
unable to equalize these dynamics to a suitable set of response character-
istics (e.g., K/s in the region of crossover which is approximately 1 to 3
rad/sec). The data in Fig. 13 indicate that this effect is less critical
when Ca > 0, thereby allowing the minimum level of wn to be increased to
0.9 rad/sec.
The implications of the results shown in Fig. 13 and explained in Fig. 14
are that acceptable rate systems are defined as follows:
% :E 0.5 rad/sec -0.22 < tn < 0
% . 0.9 rad/sec tn Z 0
2. Effect of IThe basis for specifying X is found in Ref. 13 where it is shown that
excessive degradation in pilot opinion occurs when lead time constants (TL)
greater than one second are required. This is supported by the results of
several flight and simulator experiments which employed rate augmentation
with 0n < 0.5. These results are plotted in Fig. 15.
3. Maximum Allowable Instabilities
Specification of a minimum value of tn is somewhat confounded by the
fact that there is little data for negative tn where %n < 0.5 and X > 1.0.
The data in Fig. 13 include cases which the pilots rated as satisfactory
(PR 1 3-1/) where the damping ratio varied from -0.07 to -0.22. Until more
data is obtained, a minimum tn of -0.2 represents a conservative estimate
TR-1116-i 32
NADC 77052-30
0 020
- bff
00
-= &
8, c:k ,.
T- 11&l3
NADC-77052-30
& Ref. 8
7 0 Ref. 26O Ref. 27G Ref. 28
6 vRef. 6
:1 C4-
-
.2
0 2 3 4 5
Figure 15. Pilot Ratings vs. X for Rate AugmentedConfigurations Where %n 5- 0.5
of the acceptable boundary. For a frequency of 0.5 rad/sec this represents
a time to double amplitude of 7 see which seems reasonable for fully attended
operation (consistent with the basic characteristics of a rate system).
The current IL-F -83300 does not allow unstable real roots. However,
there is operational and flight test data which indicate that for some
piloting tasks, such first order divergences are acceptable. For example,
the AV-8A is acceptable for VbC operations in relatively low sea states even
though it has a rather severe first order divergence below 85 kt (first
order root at about -0.5). This pitch divergence was found to be unaccept-
able for DC flight (see Ref. 30).
The CH-47 variable stability helicopter control display experiment (Ref. 15)
included a rate SAS configuration with a first order divergence at and above
TR-1 11..1 3
NADC-77052-30
40 kt (1/T 1 = -0.26) the pilot rating for the approach task was 5 with
a flight director and 7 without. Finally the MIL 8785B specification allows
times to double amplitude in roll (spiral mode) of 12 sec (I/T1 = -0.06).Based on the above noted results it seems unduly restrictive to disallow
low magnitude real roots in the right half plane for rate systems, e.g.,
systems where the mission requirements assume a piloting task without
unattended operation.
For the low permissible values of (negative) X indicated above, the
system will look like Fig. 2b. Accordingly tenable values of unstable X
will depend heavily on the corresponding I/Tel and 1/T1. That is, to drive
X stable the loop must be closed at a dc gain greater than unity as sketched
below. If that gain closure is outside the desired crossover bandwidth
TC
i T2
Zero dS
(1-3 rad/sec) the system will probably be unacceptable. Taking 1 rad/sec
as a desirable minimum wc means then that
-x 1 T,
TR= 116-1 Tel
TR-1116-1 35
NADC-77052-30
is the maximum permissible unstable X. Experimental data to support this
analytic conclusion are needed.
Up to this point all the data correlations have involved the longitudinal
axis. It would be expected that for very low speeds and hover, the lateral
and longitudinal requirements should be identical. The only lateral data
available for correlating Cn, n and I are from Ref. 6. These data are
plotted in Fig. 16 where it is shown that the straight line correlations
which fit the longitudinal data tend to fit the lateral data as well.
4. Effect of Gain
Development of a criterion boundary for the magnitude of the response
to control inputs requires some assumption on the frequency range which
dominates pilot opinion. Specification of control sensitivity as a cri-
terion parameter implies that the high frequency or initial response is most
important. The current version of the MIL-F-83300 weights the initial
response heavily by placing requirements on the attitude in the first second
(Para. 3.2.3.2). From a closed loop pilot/vehicle analysis viewpoint we
would suspect that the frequency range of piloted crossover would dominate
the pilot opinion. For a rate system this would imply that we should specify
a value for K in the region where the equivalent system is K/s. This hypothe-
sis is consistent with earlier correlations (e.g., Ref. 31) and is further
tested in Fig. 17 where Kj is plotted vs. pilot rating for a number of data
points from moving base simulator and flight experiments. With the exception
of a few points, good correlation is seen to result. The very dramatic knee
in the data at Kj = 5 deg/sec/in is strong evidence that a limiting value
has been reached. Hence we may conclude that for the lateral axis, Level 1
flying qualities are represented by K Z 5 deg/sec/in. For classical rate
systems this is equivalent to specifying a minimum level of the ratio of
control sensitivity to damping. This is illustrated by the Bode asymptotes
in Fig. 18. From Fig. 1 an approximate upper bound on would be 18 deg/
sec/in.
The configurations used to generate the majority of the available data
on rate systems are well represented by the form shown in Fig. 2a (for example
Refs. 8, 26, 27, and 32). The results of these experiments are frequently
TR-1116-1 36
*1 NADC-77052-30
- 1 ~Ref. 6 (low Mu Mug= -33)
0 Ref. 6 (high Mu, Mug:1.0)
-o K(s+ I/To)8(s+X\)(s + 2~C, nS +o.4)
X varies from I to 6-~ I 8 K# separately optimized
Yv 5S.1 (l/T86 5.1 -3
7 - -.41
Plottedfrom Fig. 13
E -.17
5-1
4- I
3.44
0 .2 .4 .6 .8 1.0 12 1.4W .~ (rod /sec)
Figure 16. Pilot Rating vs. Frequency for a Variety ofX's and t Is (Lateral Axis)
TR- 1116-1 3
NADC-77052-30
z P N
0 0
'Z 7/
OD NN
to Ha / 0/ 0
NW ' -o0
OD V, cm
TR-1 16-1 3
NADC-77052-30
Lps s s(s-Lp)
L p
Figure 18. Literal Factors for SimplifiedClassical Rate System
plotted on a grid of control sensitivity vs. damping such as shown in
Fig. 19. Also plotted in Fig. 19 are the lines which represent the boundary
at K = 5 (degisec)/in. and the MIL-F-83300 requirement for attaining 4 degrees
in one second. The two boundaries are seen to be equivalent for all practical
purposes. Inasmuch as the attitude in one second is easily measured it should
be retained* as the flight testable part of the proposed specification.
C. GUST SENSITIVITY - RATE SYSTEMS
The simulator experiments of Ref. contain a systematic variation of
vehicle dynamics (X, tn, wn) and gust sensitivity (XU and Mu). Reference
to Fig. 13 reveals that the low and high Mu cases tend to plot along the
same straight line indicating that the increased value of Mu was not a
dominant factor in the pilot opinion (this conclusion was also reached in
Ref. 6. The large Xu cases from Ref. 6 are plotted in Fig. 20 and are seen
to result in a significant deterioration in pilot rating. A review of the
associated pilot comments reveals that the primary complaint with the large
Xu cases was the large pitch attitudes required to regulate against steady
winds and gusts. Several cases were run without winds or gusts to investi-
gate the effect of a large value of Xu on the basic dynamics. Two of these
*Also a conclusion of Ref. 31.
TR-1116-I 39
_,A k j
1 NADC-77052-30
.5o
U-J
N1 N4 -
foe .,4
pas/wI d-1 uiduo(3 lioN -3
0
ot 0
C! 4t
in C)
C-,
OSto
U)
*R11& 40
NADC-77052-30
9X >1 in all cases o.o- .n °78
/
S&00 .67
RemoveWinds &
6 -. 12 Low Xu Correlation(replotted from fig.13)
a.=5 .24.38 .64.2 5 - 6 8 8 Remove
.29 , Winds
20 .2 .4 .6 .8 1.0 1.2 1.4
"In
Figure 20. Pilot Rating vs. Frequency forLarge Xu (Xu = -0.2)
cases are connected in Fig. 20 indicating that without steady winds or gusts
the large Xu cases were entirely satisfactory.
Up to this point we have assumed that speed and position (in hover) are
being controlled with attitude. It is very probable that future generation
NAVY V/STOLs will utilize direct force control (DFC) which can have two
possible effects on the above results. The DFC can be used as a secondary
trim control, thereby eliminating the need for large trim attitudes when X.
TR-1116-I
NADC-77052-30
is large; or the DFC can be utilized as the primary speed/position controller.
In the latter case, attitude is relegated to the role of a secondary con-
troller.
The current MIL-F-83300 specifies Xu (and Yv) in terms of the local slope
of the equilibrium attitude-speed curve. The results of Ref. 6 tend to support
this format. That is, the Ref. 6 pilot ratings and commentary indicate that
the primary deficiencies associated with large Xu and Yv are the large atti-
tudes required to regulate against winds and to initiate or stop motion.
Paragraph 3.2.1.1 of MIL-F-83300 specifies a maximum of 0.6 degrees per knotwhich is approximately equivalent to Xu (or Yv) = -0.2. The data in Fig. 20
indicate this value is generally unsatisfactory (pilot ratings a 5). The
value of Xu for the points in Fig. 13 was 0.05 and Yv was 0.1. It would
therefore seem that the limiting value of Xu or Yv lies somewhere between
0.1 and 0.2.
D. ATTITUDE SYSTEMS
A system is classified as an attitude system when it meets the criterion
established in Section IIC.
The system in Fig. 2b is basically a rate system (because it is K/s in
the region of crossover). However, it usually results from a SCAS with
attitude feedback; i.e., the ratio of rate and attitude gains is such that
an overdamped system results. Analytically such systems derive naturally
from parametric variations of classical attitude systems (Fig. 2d). Data
correlations with these types of systems are therefore handled in this sec-
tion. It is important to note, however, that the generic characteristics of
this type system are consistent with the analytically derived pilot workload
requirements of a rate system.
The series of experiments reported in Ref. 25 (S01 simulator) and Ref. 6
(Norair simulation) provide a significant data base for attitude systems
(Fig. 2d) and rate systems with low frequency attitude (Fig. 2b). For
VTOLs where I/T 8 l is near zero (all practical configurations without speed
feedback), the feedback gains are usually high enough to drive x to values
TR-1116-1 42
NADC-77052-30
approaching 1/Tel. Hence there is a large class of attitude augmented
VTOLs for which Eq. 3 becomes:
e Kec e
s2 + 2 n s + a~n2 (5)
Data for these types of systems are plotted on a grid of wn vs. 2 nwn in
Fig. 21 for the lateral axis. These data represent cases which have been
separately optimized in terms of control power and gain (Kec). The bounda-
ries in Fig. 21 represent approximate fairings through the data corresponding
to a pilot rating of 3.5. Data for the longitudinal axis are plotted in
Fig. 22. The boundaries which faired the 3.5 pilot ratings in Fig. 21 are
seen to be equally applicable to the longitudinal axis. This is not surpris-
ing considering the basic symmetry of the low speed and hover situation.
The response characteristics in the region of piloted crossover change
from attitude to rate as the damping ratio increases beyond 1.0. This point
is illustrated in Fig. 23. From Fig. 23 it can be seen that I/TI and 1/T2
separate quite rapidly as tn becomes only slightly greater than unity. As
can be seen from Fig. 21 there is no discernable change in pilot rating
between the attitude and rate response regions. This could be misinterpreted
as evidence that there is no need to distinguish between a rate response with
low frequency attitude (Fig. 2b) or a "pure" attitude response (Fig. 2d). It
must be remembered, however, that all the data in Figs. 21 and 22 are for low
speed and hover maneuvering in VMC conditions. Based on the analytical work-
load estimates in Fig. 4 and the unsatisfactory experimental results for IMC
low speed flight with rate systems (discussed earlier) it would be somewhat
unconservative to allow rate systems with low frequency attitude as a primary
system when IMC operation is a requirement. We have selected to classify
systems where I/T1 < 1.0 as a rate system based on pilot commentary associated
with points located on either side of this line. Some of these pilot comments
are located next to their associated data points in Fig. 21. The practical
implication of this is that all points falling below the I/TI = 1.0 line in
Fig. 21 are subject to the visibility limitations association with rate sys-
tems in Table 2.
TR-M116-1 43
NADC-77O52-30
#ss- (rod/in.)
4 _ K eT3 .18 + s + 2C.a s +wne
RefE 0 .10.1 .815
,J.0444
& - L .5, 0/8 in Favorable Region
Noroir Simulation No. 3 (Without pilot F), X<.15or =ww , low Mu , low Xu (Ref.6)
* XI4A,TND2701 (Ref.26)
Sensitivity Separately Optimized
PILOT 0
B 6 5-.5 3-3.5 a.5 L. 3-3.5 L5-&i 333 _/" 5 32.0 3. 2. 2 I 'T
Figure 22. Pilot Rating Correlations With Ideal SecondOrder System Responses - Longitudinal Axis
TR-1116-1 45
r
NADC-77052-30
41I
wn
/ - ,
/ T2
00 I 2 3
CI'
Figure 23. Transition From Attitude to Rate Responseas gn is Increased Beyond Unity
Such a limitation is consistent with the results obtained for pure rate
systems (without low frequency attitude) in Section IVB-1. There it was
noted that for Cn a 0, the maximum value of % must be limited to 0.9.
This is equivalent to saying that the lower end of the -20 dB/decade slope
(K/s) of the equivalent system must extend down to 0.9 rad/sec (see Fig. 2a).
Specifying systems where 1/Ti < 1 .0 as rate system in Fig. 21 implies a K/s
slope down to 1.0 rad/sec. Hence the region below, 1/TI = 1.0 in Figs. 21
and 22 are properly accounted for in the rate system criterion summarized
at the end of Section IVB-1 and should be removed from the attitude. criterion.
This is accomplished via the modified attitude criterion plotted in Fig. 24.
A lower boundary defined by 1/T I = 0.9 is used (approximated by a straight
line in Fig. 24) to be consistent with the wn < 0.9 criterion utilized for
rate systems. This lower boundary is somewhat redundant since rate systems
should be culled out via the time response criterion in Fig. 3. It is
included, however, to remove ambiguities which could arise from including
rate systems in the attitude system criterion boundaries.
TR-1116-1 46
1-1 --- .- - -
NADC 77052-30
" Fig. 20,21 Boundary
r 0] 3
T Z.9
0 2-0 I 2 3 4 5 6
2 wn(sec")
Figure 24. Tentative Criterion Boundary For AttitudeSystems For Low Speed and Hover
It should be noted that the Fig. 21 and 22 boundaries are nearly identi-
cal to the low speed boundaries in the current MIL-F-83300 (Para. 5.3.2).
One interpretation of these results is that pilots require equally good
dynamics for hover as they do for forward flight. The current specification
allows considerably degraded dynamics for hover. This is probably due to the
lack of acceptance of augmentation systems at the time the specification was
written. It is also a reflection of the fact that the specification is based
on data taken primarily in VNC conditions.
1. Effect of Gain
The region of acceptable values for the gain, K,;c is obtained from the
data plotted in Fig. 25. The majority of the data in Fig. 21 and all of
the data in Fig. 25 were obtained from the raw simulation results of
the Ref. 8 experiment. These data were made available to STI by Mr. Richard
Greif of NASA Ames. The following observations apply to the data plotted
in Fig. 25.
TR-1116-1 47
NADC-77052- 0
(81atmax5in. Pilot 8 Pilot A (rodsec) Ca
8 0 1.0 .5ID 1.5 .5
1.5 wn < 3 0 2.0 .5
6 3.0 .7
4 -
O.. I I I
0 .I .2 .3 4KOc Oss/8o (rod/in.)
Figure 25. Pilot Ratings vs. Roll Attitude Gain
0 For can > 1 .5 rad/sec the approximate region for satis-factory flying qualities (PR < 3-1/2) is defined by0.03.S kc 0.33 rad/in. The pilot ratings are rela-tively insensitive to K4c in this region.
* There appears to be a requirement for higher values ofKc when %n is low. For f = 1 satisfactory flyingqualities are defined by 0.25 - kc 0.42 rad/in.
The requirements on KXc for low and high % overlap slightly; and with-
out additional data it is not clear how to set the Kqc boundaries for values
of c% between 1.0 and 1.5. There does, however, seem to be an adequate
number of data points to substantiate the requirement for increased K9c
when %n = 1.0. Further experimental data are needed to determine the equiva-
lent system gain requirements at values of %zn above and below unity. Until
such data are available it seems reasonable to assume a straight line varia-
tion as shown in Fig. 26. Note that according to these data a constant value
of 0.25 < Kc < 0.33 would be satisfactory for the range of ft tested.
TR-1116-i 48
NADC-77052-30
7 , SATISFACTORYREGION
O0 I 2 3 4
wn(rad/sec)
Figure 26. Limits on Kpc For SatisfactoryHandling Qualities
2. Effect of
Increasing the value of X has the effect of attenuating the low frequency
response to control inputs (for example see Figs. 2b, d and e). This would
be expected to cause problems relative to low frequency trimming and increased
pilot workload due to a tendency for the aircraft attitude to wander. Large
values of X can be achieved in combination with moderate values of wn via
augmentation or through very large values of Mu . None of the low speed and
hover experiments run to date have considered the generic effects of augmen-
tation and hence the only data for large X is also for large Mu (see Ref. 6).
These data are plotted on the tentative damping vs. frequency criterion
boundaries in Fig. 27. Both the effect of increased Mu and increased X on
the boundary are seen to be negligible; i.e., the points correlate well with
the low Mu, low X boundary.
Considering that this conclusion is based on only two data points (Cases
101 and 1c4) it must be considered tentative at best. In fact, the accept-
able pilot ratings for the two configurations which plot inside the criterion
boundaries are somewhat unexpected considering the shapes of the frequency
TR- 1116-1 49
RADC-77052-30
4-
Norair Simulation (Ref.5)(large Mu low Xu )
0 z-.5 PRA
i1X=I.O 0U _PR B
0I-0
I 2 3 4 5
Case 1 (sec')
Figure 27. Comparison of Configurations With LargeWith the Attitude System Criterion Boundaries
and time responses for these cases shown in Fig. 28. The extreme non-
attitude-like shape of these responses sterns from values of 1 which are
near on. Because of the significance of these configurations, the pilot
counentary is included as Table 3. Pilot A seemed to be completely satis-
fied with both configurations whereas Pilot B noted some problems with
precision hover (underlined in Table 3). The key question, of course, is
whether these problems would become more dramatic in low visibility condi-
tions and with increased winds and turbulence (the Ref. 6 simulation included
steady winds of 10 kt with gusts having an rus value of 3J. f't/sec).
Finall large Values of 1 arise from large M.u or feedback of speed to
a longitudinal control. Both of these effects start looking like a trans-
lational rate coimmand (TEC) system. Perhaps configurations where 1 approaches
TR-111 "
NADC- 7705,2-50
:to
3 in
:S Mr- ~
too do
aQ.
0o 4 .. j
-~ ILII
60 60
I .. Cc
0E
00
110'L
0 0 o 0
(b 0 Co 'sCal#*
TR-1116-S 51
NADC-77o52-3o
TABLE 3. PILOT COMMENTARY FOR CONFIGURATIONS WITH LARGE X
a. Case 104 (X 1.0; wn = 1.05)
PILOT A: PR = A3 M8 = 1.99
Control sensitivity was good.
No problem on square or hovering turn.
Qgick stop was good.
Lateral-directional and height dynamics did not affectevaluation.
PILOT B: PR = A4 M = 0.71
Compromise in control sensitivity because of abrupt longitudinalpitch response. Probably this response was due to Mu. Almostconstant hunting in pitch.
Air taxi was pretty good. Hover was fair.
Turn over a spot, fairly good. Probably had low Xu .
360-degree turns and stopping on heading were not problems.
Crosswind turns were not too bad.
Precision of hover was not as good as it should be.Took too long but fairly good hover could be achieved.Lack of real precision in hover.
Qaick stop was okay. Didn't achieve much speed. Fair topoor stop.
Attitudes seemed moderate and acceptable.
(Concluded on next page)
TR-1i16-1 52
NADC-77052-30
TABLE 3. (CONCLUDED)
b. Case 101 ( = 0.5, a)" = 1.51)
PILOT A: PR = A3 M6 = 1.24
Smooth control. No worry about overcontrolling. Quick stopeasy; no feeling of slowing down. A certain pitch attituderesulted in the airplane going along as desired.
PILOT B: PR = A4 M6 = 0.87
Control sensitivity was a compromise between what was desiredand what could be stood because of abruptness in response.May have been better off with a lower sensitivity because ofsmall abrupt kicks.
Attitude slightly nose-down, but pretty level. Probablysmall Xu.
Able to achieve fairly stable velocity and stop fairlywell.
Precision of hover not great but adequate for a landing.Sometimes hover seemed pretty good. Could manage hover allright. Not really solid, but fair.
Turn over a spot was pretty good. Crosswind turn not toobad; pretty fair performance.
Attitude changes fairly mild in quick-stop maneuver. Collec-tive requirements also fairly mild.
Felt sort of loose laterally (lateral axis was a good ratesystem, e.g., X = 5.0, .= O.18, tn = 0.26)
TR-1 116-I 53
NADC-77052-30
u1n should be classified as TRC systems and correlated via the criterion in
Figs. 35 and 36. More data is required to pursue this hypothesis.
More experimental data are clearly required to resolve the effect of
large ), on attitude systems. It should be noted that the basic character-
istics of these systems is a large initial response with respect to the
steady state which looks like low damping in the time domain. This is
well illustrated by the impulse responses in Fig. 28. Attitude systems
with large values of 1/T9 (see Eq. 3 and Fig. 2e) also have this basic
deficiency and should be included in the experimental matrix of systems
with large X.
If systems with values of X near %n are ultimately found to be accept-
able, some method for accounting for their apparent low damping will have
to be included in the attitude system identification criterion developed
in Section IIC. The systems in Fig. 28 would not meet the criterion since
their overshoot exceeds that which would be equivalent to a damping ratio
of 0.2 (equivalent second order system damping ratio is less than 0.1 for
Cases 101 and I04 based on measuring peaks of the impulse responses).
3. Model Following Attitude Systems
A model following attitude system is defined here as a system where the
command/response dynamics are different from the responses due to external
(disturbance) inputs. The basic concept is to utilize a high bandwidth
closed loop system for gust suppression while avoiding the concomitant abrupt
responses to control inputs via stick shaping. An example model following
attitude system was discussed in Section IIA. A good deal of the existing
data for model following attitude systems comes from the NASA Langley CH-46
variable stability helicopter, e.g., see Refs. 15, 33, and 34.
Based on the Ref. 8 results, on was initially set to 2 rad/sec. However,
when mechanized on the CH-46 helicopter, the pilots complained of excessive
abruptness and n was reduced to 1 .43 rad/sec except for the yaw mode where
it was left at 2.0 rad/sec. Analysis of pilot comments from the Grief data
(plotted in Fig. 21). taken on the S01 simulator (one-to-one motion and real
world visual) did not reveal any problems with abruptness for W out to
4 red/sec. Furthermore, the X-22 model following attitude system was set
at %n = 2 red/sec (Ref. 14) which supports the simulator results from both
programs. It, therefore, appears that the command/response abruptness
TR-116-i 5
NADC-77052-30
problem is somehow unique to the CH-46 helicopter. Discussions with per-
sonnel at NASA Ames indicated that rotor mode problems were encountered
when mechanizing a UH-1H helicopter with an attitude SCAS. The experience
is consistent with some recent flight tests involving the optimization of
helicopter autopilot gains. Increasing the gains to provide attitude stiff-
ness resulted in very abrupt large amplitude motions of the rotor tip path
plane. It is possible that the "abruptness" referred to is a rotor mode
in the CH-46 and does not represent a basic limitation for attitude control.
Finally, the pilot sits 20 ft ahead of the center of gravity in the CH-46,
which may account for the abruptness comments.
It appears that there is currently no published data from which the
upper boundary on n can be derived.
The majority of the pilot ratings in Fig. 21 are dominated by command
response piloting tasks with little emphasis on turbulence regulation. Hence,
this data is felt to be appropriate to defining specification boundaries for
the lower limits of frequency and damping of the model portion of the model
following system (Gi in Fig. 1).
4. Rate Command Attitude Hold (RCAH)
Rate command/attitude hold (RCAH) systems represent a special case of a
model following attitude system where the stick shaping is simply an inte-
grator. It would, therefore, seem logical to utilize experimental data
involving command response tracking with rate systems to correlate RCAH
systems as well. It follows that the criterion boundaries developed in
Section IV-B-1 should apply for the command response characteristics of the
RCAH system.
The fixed base simulation results of Ref. 18 showed that the use of RCAH
for both axes was less than satisfactory for low speed and hover in full IMC
conditions (see Table 2). Turbulence was not a factor in the evaluations.
The displays consisted of a 3 cue mechanical flight director and a moving
map display.
The X-22 control display experiments (Ref. 14) indicated that RCAH could
be acceptable for hover if used only in the lateral axis and with a sophisti-
cated integrated display (position plus velocity plus flight director), e.g.,
TR- 1116-I 55
NADC-77052-30
Config. ED3, ATT/RATE) in Fig. 6. The pilot commentary indicates that
control problems in the lateral axis were the primary reason why less
sophisticated displays (no flight director bars) were not acceptable for
this configuration. Even with the satisfactory display, the pilots com-
mented that the lateral control seemed "very light" and "a bit more atten-
tion to bank angle control is required than I would like." One of the runs
rated as a 3 included a 22 kt headwind, a 13 kt crosswind, and moderate
turbulence. It therefore seems reasonable to tentatively allow RCAH in
the lateral axis as long as the longitudinal axis is at least a model
following attitude system; and an integrated display including position,
velocity and flight director command bars is employed. Inasmuch as the
above conclusion is based on a single run with one pilot, further substanti-
ating data are required. Until more data becomes available, the minimum
allowable frequency and damping for the attitude hold equivalent system
should be tentatively set to the values used in the X-22 experiment, e.g.,
= 2.1 rad/sec and td = 0.5.
Based on the Ref. 18 results (Table 1) RCAH would be acceptable as a
backup system for full IMC, e.g., Level 2 flying qualities. The required
displays should include a flight director command bars as a minimum and
preferably a moving map display. More data is required to determine the
necessity of the latter for level 2 flying qualities.
E. TRANSLATIONAL RATE COMMAND
The nature of translational rate command (TRC) systems is such that
they are easily identified and do not require a separate classification
criterion.
A simplified block diagram which illustrates the key features of a
generic TRC SCAS is given in Fig. 29. Lower order equivalent systems
(LOES) forms derive from considerations of the various combinations of
feedback and feedforward gains as follows:
* TRC with attitude only (KDFC = 0).
* TRC with direct force control independent of atti-tude (roc = 0).
* TRC with a combination of direct force control andattitude.
TR-1116-I 56
NADC-77052-30
Airframe8 st kDynamics
TE s+I
iK
Figure 29. Generic Block Diagram For TRC Systems
In addition to the above, it is expected that a split axis concept which
utilizes any one of the above in combination with an attitude system will
be appropriate in many cases.
1. Translational Rate Control (TRC) WithAttitude Only (KDFWC = 0)
The generic root locus characteristics of TRC systems which utilize pitch
or roll attitude to provide the force required to translate are presented in
Fig. 30. The attitude-augmented airframe characteristics are designated by
the single prime notation in Fig. 30 and represent the starting point for this
example which utilizes XV-15 characteristics. The root locus shown in Fig. 30
shows the effect of Kk on the dominant system modes. The effect of the values
of Kk shown in Fig. 30 on the path and attitude time responses to a I in.
step longitudinal control input is shown in Figs. 31a and 31b, respectively.
It can be seen from Figs. 30 and 31 that the generic effect of increasing
Kk is to improve the path response at the expense of larger attitude excur-
sions. An experiment was conducted on the NASA Ames FSAA simulator to investi-
gate the effect of increasing path mode bandwidth on pilot opinion (Ref. 44).
TR-1116-1 57
NADC-770,52-30
* Single prime denotes attitude loop has been closedeDouble prime denotes * loop has been closed
W~Wu
- KOKx 8.15 442u
k~.
KKx,; ..3
,1 V1K_'-N., W 0p
.6 1.0
Ke 3 • LO .8 .6 .3 J5" 4 L M B • I nW
-4 -3 -2-I0
Figure 30. Effect of Kj on Dominant System Modes
Preliminary pilot ratings are given in Fig. 32 where path mode bandwidth
is quantified as the -3 dB point on a IX/bstkl frequency response plot. The
task was to fly as rapidly as possible to various points on a terrain board
and hover at each point. These results indicate that a path mode bandwidth
of 0.6 rad/sec is about optilmm. It should be noted that due to the visual
display problems discussed in Section IV-A, precision hovering was very diffi-
cult. A loose interpretation of these results is that they represent hover-
ing over the deck in poor visibility at night where the visual cues are
minimal.
As would be expected, pilot comments on the lower bandwidth systems in
Fig. 32 centered on poor hover position control. This was most critical
when decelerating to hover since it was possible to drift into a fixed
TR-1116-1 58
NADC- 770 52-30
Note: Tx, is obtained by ossurning o first order form equation.T4,q t when X is 63%S of steady state
* I Note that //Txgq I/T,' when /Ti « . 'sp
~Tieqz-B (Kj Kq 1.0)
1. 0 -
Y t/ss) 35
2.i1576C( i1)
-20
a) Pit h iueReonse
16- 1O 2645
NADC-T052-30
0
• i 4-
-- .. . .T
A 0 LEVEL I2 0
010 .5 1.0 1.5
)(/SkaBondwidth (rod/sec)
Figure 32. Preliminary Pilot Ratings vs. Path Mode Bandwidth
object. On the other hand, the pilots found the higher bandwidth systems
to be too abrupt and complained of extreme pitch attitudes.
Figure 31a reflects the fact that 1/TI dominates the path response
(see Fig. 30) as long as I/TD1 < w.p. This leads to more general defini-
tions of competing lower-order equivalent system path responses for TRC
systems using attitude, e.g., Eqs. 6-8 (T has been generalized to Tk and
w.p to n in these equations):
j Kj8stk = (6)-t k Ts + 1 6
TR- 1116-1 60
NADC-77052-30
or
"/s2 u s +
5sk (Tks + 1) _ _- S + I
n
or
k K= 2(8)
(Tis + 1) + s + I
Equation 7 is the most general equivalent system but suffers from undue
complexity since six variables exist (KR, Tk, 6n, %n' u, and %1 ). Refer-
ence 35 suggests that the form of Eq. 8 is an adequate representation of
the TRC system path response. However, from Figs. 30 and 31 it can be
surmised that an appropriate equivalent system form is simply a first order
response when the first order pole 1/TBI is less than dip. In fact, good
pilot rating correlations result by assuming a first order form and using
the equivalent time constant Tieq defined in Fig. 31a. These correlations
are shown in Fig. 33. The data in Fig. 33 indicate that the responses for
cases where TX:q < 1 sec are rated very poorly (because of overly abrupt
attitude motions). Figure 31 indicates that the responses look reasonably
first order for configurations with acceptable pilot ratings, e.g.,
T*eq > 1 sec. The implication of these data is that if a third order
equivalent system is required to match the response, the system is
probably unacceptable due to abrupt pitch and roll attitude responses
to pilot comands. On this basis it seems reasonable to assume a first
order equivalent system form for the path response of TRC systems of this
type (i.e., attitude to translate). The data in Fig. 33 was obtained from
the FSAA simlator tests on the XV-15 in addition to flight test points
corresponding to the TAGS (Ref. 12) and the HLH (Ref. 23) helicopters.
TR-1116-1 61
NADC-77052-30
* Path response well approximated by
*1 - -Z~Bstk TjeqS +I
C ) Ref. 44 (long axis)*Flight Data
6
TAGS
-0 HLH LEE-
0
0 2 4 6 8 10Lower Order Equivalent System Path Mode Time ConstantT%.q(sec)
Figure 33. Translational Rate System Parameters
a. Stick Sensitivity
A general complaint on all the TRC systems tested on the FSAA was that
the maximum velocity was too low (approximately 24 kt). This would indi-
cate the need for a controller with significantly increased travel or blend-
ing to a different SCAS for high-speed flight. Problems with the former
approach have been documented in the TAGS program (Ref. 22). Possible cri-
teria for SCAS blending are discussed in Section VIII.
Forward loop nonlinear stick shaping was attempted in the heavy lift
helicopter (HIO) program to allow low sensitivities for small deflections.
However, problems associated with mechanizing this nonlinearity in the
TR-1116-1 62
NADC- 77052-30
presence of a parallel trim system made it impractical because the stick
sensitivity became a function of trim stick position (functions of wind
and CG) see Ref. 23, Fig. 22. Nonlinear shaping was used for the HIH
load controlling crewman controller (LCCC) where trim was not a factor,
i.e., zero groundspeed always represented zero controller position. The
*lateral and longitudinal stick shaping functions used for the LCC (Ref. 23)
are presented in Fig. 34. These functions were developed during the HLH
flight tests (using a modified CH-47) primarily to eliminate undesirable
load excitation and may not be applicable to tasks where a sling load is
not a factor. A maximum velocity of 15 ft/sec was felt to be too low
during the HIM evaluations.
b. Tentative Criterion Format For TRCwith Attitude
Based on the above discussions, it appears that the Eq. 6 equivalent
system form will be adequate for specifying criterion boundaries for TRC
systems, e.g., it may be assumed that,
•KL Xc
8stk Tq s + 1Xeq
The pilot rating data of Fig. 33 are plotted on a grid of Kjc vs. Txeq in
Fig. 35 for center stick controllers and in Fig. 36 for sidearm controllers.
Approximate lines of constant peak attitude to a step control input are also
plotted on these figures. This was done to account for pilot comments which
indicated that the upper limits on system bandwidth (lower limit on T'q) are
strongly influenced by the secondary attitude responses to translational rate
commands. Although the data base is very limited, some trends may be identi-
fied in Figs. 35 and 36.
* Larger steady state velocities per unit control input areacceptable as the system response becomes more sluggish(increased KXc at increased TXeq). This is implied bythe data in Fig. 36 and suggested by the lines of con-stant peak attitude.
Figure 37. Response of HLH to 100 Percent LCCInput (from Ref. 20)
TR-I 116-1 67
NADC-77 52-30
am=~O V
EVAWMION OF EXISTING DATA BASE AND SUO GT CRITUADEVEIOPMT PROGRAMS FOR .ONGITUDMnAL
AID LATRAL AXES
A primary objective of the work reported in sections III and IV has
been to gather, evaluate, and correlate all the available data for the
lateral-directional and longitudinal axes in low speed and hover. A
natural byproduct of this effort has been the identification of gaps in
the data base requiring further piloted similator and flight experiments.
Each of the areas identified are summarized below.
A. CORTROL-DISPLAY TRADEOFF
The data in Table 2 is primarily based on the results of the control-
display experiments performed on the X-22 at Calspan and the CH-46 at NASALangley (Refs. 14y 15, and 20 respectively). The X-22 results consist of
only one pilot who flew one or two runs per configuration and, therefore,
must be considered as tentative. The CH-46 results of Ref. 20 indicated
that full IC approaches to hover in IMC conditions (Visual Level 5) were
unreasonably demanding. This is in conflict with later results with apparently
the same system (Ref. 15) which indicate satisfactory pilot opinion. Dis-
cussions with the authors of these reports indicate that they are uncertain
as to why the pilot opinion was more favorable for the later control display
experiment. It is strongly suspected, however, that the constant attitude
deceleration profile used in the later experiment (Ref. 15) had a major
positive influence on the ratings.
There is a serious discrepancy between Ref. 14 and Ref. 15, e.g., the
pilot rating of 3 vs. 7 discussed for configuration ED-I/FD in Section III-B.
Another discrepancy which needs to be resolved is the recent X-22 data pub-
lished in Ref. 21. These data (shown in Fig. 38) are at significant odds
with all the results reviewed and correlated in Section IV. The primary
discrepancies noted are summarized below.
0 Rate systems were found to be acceptable for approachand hover in IMC conditions in Ref. 21 and were unaccept-able in all the data discussed in Section IV.
wP-1116-2 68
NADC-77052-30
Position +Velocity ED-3 OIA 02LC+ FlightDirector (48)
Notes: 1) Numbers in parenthesis on abcissa indicate systembandwidth, e.g., RCAH (1) implies a rate commandattitude hold system with bandwidth of 1 rad/sec.
2) Pilot ratings in parenthesis indicate data fromprevious X-22 experiment (Ref. 14, also Fig. 6).
3) Pilot ratings with a star indicate 100 percentauthority SCAS. All other ratings have a 20 per-cent authority SCAS.
Figure 38. Recent X22A Control Display Results (Ref. 14)
TR-1116-1 69
NADC-77052-30
0 Improving the augmentation from a rate system to a2 rad/sec bandwidth attitude system had a negligibleeffect on the ratings. Reference 14 and 15 indicatethat progressing from a rate system to an attitudesystem should result in a dramatic improvement inpilot rating.
These data were taken from an experiment where the X-22A was configured to
simulate the AV-8B. The data shown in Fig. 38 utilized the same cockpit
display (with minor improvements) as the earlier X-22 experiment except it
was presented on a headup display (HUD). Discussions with the author of
Ref. 21 indicated that the reason for the discrepancies noted above are
not apparent to the investigators at this time. However, it should be
noted that the dat are stil? being analyzed by Calspan.
The above noted discrepancies between the Calspan and Langley results
as well as between the two Calspan experiments need to be explained before a
handling quality criterion can be defined. While no definitive explanation
can be made at this time, we can offer the following insights and possible
solutions.
The simpler deceleration profile used in Ref. 21 certainly has some
impact as discussed in Section IIIC (Fig. 10). Howevr, this does not explain
the drastic improvement for the entire task including hover in OVC 5 (IMC)
conditions. It is possible that the discrepancies noted are a result of
too few runs with not enough pilot subjects. This is compounded by the
lack of control of environmental conditions inherent to in-flight testing.
Inasmuch as the extremely high cost of running variable stability flight
tests precludes a more intensive test program, it appears that simulation
is the logical solution. Of course, the visual display problems discussed
in Section IV-A will have to be resolved on any simulation used to gather data
for low speed and hover. Assuming that this can be accomplished (e.g., use
NASA/Ames S01 or resolve Redifon problems) each control/display configuration
should be run a sufficient number of times to allow the pilots to get up on
the leerning curve as well as to investigate the more subtle points such
bs pilot abuses and the effect of discrete wind shears and gusts. At least
* r-- pilots should be utilized to minimize the unavoidable effect of per-
* *, preferences dominating the results. The role of flight test
to concentrate on a few key configurations defined in the
70
NADC-77052-30
simulation to validate or expose problems with the simulator data; and 2)
to expose the evaluation pilots to the real world situation. This last
point implies that the same pilots should participate in the flight test
and in the simulation.
The pilot tasks for which ratings are to be given should be better
defined, e.g., one rating for constant speed ILS tracking, deceleration,
hover and vertical descent tells very little about the problems encountered.
Each of these phases should be considered as a separate task and rated
accordingly.
Finally, the outside visual cues can be quantitatively varied in the
simulator to make it possible to obtain data for Table 2 directly instead
of by inference as was done in the current study. NASA/Ames has been
successfully using a variable runway visual range (RVR) on the Redifon
display for a number of years. This feature would be of significant value
for obtaining data for Table 2.
B. EFCT OF IAE ), ON ATTITE SYStEMS
All the data (6 points in Fig. 2r) for large X also involves large M..
The negligible effect of large X on pilot rating shown in Fig. 27 is unex-
pected and should be further investigated.
C. EFFECT OF WIND DISTURBANCES ANDGUST SENSITIVITY
There is very little comprehensive data of the effect of gusts and/or
discrete windshears as a function of gust sensitivity. The simulation experi-
ments reported in Ref. 6 varied the primary gust derivatives (Xu, Mu, YvI
and L.) but held the turbulence level constant. These results are discussed
in Section IV (see Fig. 20). Further work along these lines is required
with emphasis on the following areas:
* Investigate the effect of providing a secondary controllerto alleviate the large aircraft attitudes required whenXu or Yv are large. Determine acceptability of specificmechanizations, e.g., additional manipulators, automatictrim followup with a direct force control, etc.
* Investigate the effect of large discrete shears.
TR-1116-1 71
NADC- 77052-30
0 Investigate the effect of disturbances when direct forceis used as a primary control either alone or in combina-tion with attitude.
0 Investigate, systematically, the effect of increasingsystem bandwidth in the presence of turbulence anddiscrete shears. Do for all systems listed in Table 1.Measure hands off rms attitude disturbances for variousturbulence levels and attempt to correlate with pilotratings.
* Use ship wake model from Ref. 39 as a discrete turbu-lence input.
* Using points which represent the minimum acceptableconfiguration/turbulence combinations, determine theeffect of decreased visibility. Use the Fig. 5 visi-bility scale as a guide.
D. STICK FORCE GRADIENTS
It seems to be well established that pilots desire very low stick force
gradients for low speed and hover. Stick force gradients were used in
several of the experiments cited in Section IV. However, there is no
record of why these gradients were picked or of any parametric variation
of the gradients which would allow us to establish boundaries. Reference 6notes that if large trim attitude changes are required (due to large Xu or
Yv) even moderately low fo- ,e gradients become objectionable.
Experimental data is required to establish upper and lower bounds for
stick force gradients for each of the systems in Table 2.
1. NIVALIT SYSTD MISHATCH
If the flying quality criteria are to be couched in terms of lower order
equivalent systems (LOEs), the degree of allowable mismatch must be estab-
lished. The frequency range of interest must also be defined. Finally, an
experiment is required to test the hypothesis that VTOL pilots in the low
speed and hover flight condition require lower order responses in attitude
velocity and position to control inputs and will reject more complicated
higher order responses. Evidence that this is indeed the case has been
published by Hodgkinson, et al (Ref. 3) for fighter aircraft, e.g., the
Neal Smith data (Ref. 4o). Such an experiment would involve a series ofgeneric configurations for each equivalent system type in Table 2. These
configurations should range from a "pure" lower order system to higher
TE-1116-i 72
NADC-77052-30
order systems which depart significantly from the LOES. These departures
should be made to occur at various frequencies to determine the frequency
range of interest.
A large majority of the data generated to date (and correlated in
Section IV) represents more or less pure lower order system forms. This
is either a consequence of using very simplified equations in a ground
based simulator (for example, Refs. 6, 8 and 35) or of using high gain
model following systems which suppress all higher order dynamics (e.g.,
Refs. 14, 15 and 20).
F. EFFECT OF TIME DELAY
There is evidence that pure time delays (e- Tes) have a considerably
larger effect on pilot opinion than would be predicted from the phase
contribution (A = Tecoc) at the crossover frequency 3c . Some idea of
the effect of Te on longitudinal attitude control can be obtained from
work by Hodgkinson, et al. (Ref. 3) where a regression analysis showed a
degradation of one pilot rating for every 50 ms of -e- As an extension
of the Ref. 3 work, an attempt was made to predict pilot ratings as a
function of the mismatch between the controlled element and a pure rate
response in attitude, e.g., 0/5 = Ke- TeS/s. The results of this analysis
for the Ref. 40 data gave the following function.
Pilot Rating = 3.4 + 0.0966 M + 11.21 'e (9)
The coefficient variable, M, is the mismatch function which is obtained by
calculating the sum of the squares of the differences in magnitude and phase
between the lower order system (LOS) and the higher order system (HOS) at
a number of frequencies between 0.1 and 10 rad/sec, i.e.,
M = {(gainHoS - gainLos)2 + (PhaseHoS - PhaseLOS)2} (10)
Where gain is in decibels, phase is in radians and LOS refers to (K/s)e - Tes.
This function was found to account for 85 percent of the variance in the data.
The standard deviation in the error estimate was one pilot rating point. A
plot of estimated vs. actual pilot rating is given in Fig. 39.
TR-1116-1 73
-I / "
NADC-77o2-3o
:1 10/
J S 91 9 .
/. /
0/00
0 500
Actual Pilot Rating
Figure 39. Actual vs. Estimated Pilot Rating
Using Equation 9
The predicted degradation in pilot rating due to e is seen to be one
pilot rating pr 89 ms of e (froma Eq. 9) which is unexpectedly large on
the basis of phase lag, eg., a e of 0.089 is equivalent to only 10 degrees
of phase lag for a 2 rad/sec crossover frequency. These data were taken for
a precision pitch tracking task (Ref. 40) for fighter aircraft configurations
in up and away flight using the variable stability T-33 aircraft. Conventional
attitude systems for such configurations are rate systems in the region of
crossover. However, the extreme difference in task and environment preclude
uAng the data as a criterion boundary for rate systems in low speed and
TR-1116-1 74
- ... . ,,II I'[III1 .. ../ll I I
/
NADC-77052-30
hover. Nonetheless, the data indicate a need for separately specify-ing boundaries on Te- Whether this need is real or an artifact of the data
base used in Ref. 3 needs to be determined. In fact, data correlated in
Ref. 41 indicates that the effects of time delay and phase lag are equivalent
(see Fig. 40). A carefully contrived experiment which would reveal differ-
ences, if any, between time delays and phase lags is required to resolve
the issue.
G. CLASSIFICATION OF ATTITUDE AND
4 RATE SYSTEMS
As noted in Section III and in Ref. 42, a key issue with the use of
equivalent systems for handling quality criteria is the ability to quantify
the distinction between rate systems and attitude systems. The scheme pro-
posed in Section II is felt to have considerable merit but is in need of
experimental verification. Such an experiment should occur in two phases.
I) Ask the pilots to classify a series of systems as attitudeor rate and see if their opinions correlate with the Fig. 3criterion.
2) Establish a hover task that can only be satisfied with anattitude system via an appropriate combination of visibility,displays, and turbulence.
The proposed experiment would involve testing a large number of configura-
tions in the first phase. Selected configurations would then be subjected
to the second evaluation technique to insure that the basic intent of classi-
fying these systems is satisfied.
H. ADDITIONAL DATA FOR MODELFOLLOWING SYSTEMS
The model following systems tested in Refs. 14 and 15 were developed by
setting the feedback loop gains at their maximum value without exciting a
limit cycle or instability (based on informal discussions with the investi-
gators in these experiments). There is a need to parametrically vary the
feedback loop gains to determine maximum and minimum values of disturbance
bandwidth for acceptable flying qualities.
TR-1116-1 75
NADC- 77052-30
p 0
0-
JIIn E d
NN 0
w .
N 0 +'
* 63
cq N
0 r-
0id ul$4.. 0 '
0. 0 0
*A!0614 09 CD wSq
TR-1116-1 76
- NADC-77052-30
There is some discrepancy between Refs. 14 and 15 regarding the model
break frequency. Reference 14 (X-22) used 2 rad/sec which is in agreement
with the Ref. 8 results, whereas Ref. 15 (CH-46) tried 2 rad/sec and found
it to be too abrupt. Reference 15 ultimately used 1.43 rad/sec, which seems
low.
It is clear that a parametric vr'ation of the disturbance and model
bandwidths is required to establish yin qualities boundaries for model
following systems.
I. ADDITIONAL DATA IOR TRAE8IATIALPATE SYSTEM
The data base for parametric variation of translational rate system
variables is limited to Refs. 35 snd 44. Both of these involve systems
without direct force control capability. The Ref. 35 data was taken on
the NASA/Ames S01 simulator which has six degrees of freedom with one to
one motion and real world outside visual cues. The pilot subjects were
highly qualified. It follows that the confidence level in the data is
high. It is the primary source for the data correlations shown in Fig. 35.
As can be seen in Fig. 35, more data is required to better define the boun-
daries between acceptable and unacceptable handling. The primary source of
data for sidearm controllers (Fig. 36) was the FSAA simulator experiments
of Ref. 44. Because of the limitations in the visual display (see Section IV-A
for discussion) these data must be considered as trend information only.
Finally there is no data for vehicles with direct force control (DFC). Such
data is required and should include the spectrum from pure DFC to pure atti-
tude (e.g., vary KDFC and KeC in Fig. 29). The experiments should include
using DFC for closed loop tracking as well as for low frequency trimming.
If taken on a simulator, the fore/aft and lateral motion cues should be
accurate.
TR-1116-I 77
MADC-77052-30
SECTION VI
CONTROL POWER
A comprehensive solution to the control power problem is beyond the
scope of the present study. What we have done is to systematically review
alternative approaches to a criterion development as well as to summarize
and analyze existing data. Based on this work recommendations for further
research are made.
A. IM f
It is convenient to establish gross qualitative requirements for con-
trol power as a basis for evaluation of different criterion formats. Such
requirements may be summarized as follows. There mast be adequate control
power to:
1) maintain vehicle attitudes, velocities and/or posi-tion in the presence of steady winds, random gusts,and discrete shears.
2) maneuver as required by the mission
3) avoid cockpit control or actuator limiting in eitherof the above situations which would be objectionableto the pilot.
In order to satisfy the first of these requirements it will be necessary
to define the gust/shear environment. Examples would include specific
airwake models for shipboard landings, atmospheric turbulence spectra as
a function of altitude, wind, terrain character, etc., and design wind-
shear conditions.
The maneuver requirement is difficult to generalize and may have to
become part of the type specification for each individual case. Nearly
all available VTOL control power data are based on maneuvering tasks;
quick stops being the most critical one. The qualitative nature of these
maneuvers makes it imposs-'ble to compare different sets of experiments.
This is evidenced by a wide variation in required control power in the
experimental data (see Section VI-D).
TR-1116-1 78
/
NADC-77052-30
The third requirement depends on qualitative pilot opinion. Available
data needs to be analyzed to define what is acceptable and what is not.
The data generated during the simulation experiment conducted by STI and
Vought (see Ref. 16) on the FSAA should be analyzed in this context. These
data include approaches to a moving ship with three different augmentation
systems and a head up display. Incidentally, the problems with the visual
system on the FSAA (noted in Section IV) are not felt to be a primary factor
in the Ref. 16 experiment inasmch as the pilots utilized the HUD for track-
ing. The visual scene was mainly utilized for status iuformation.
B. DISCUSSION OF POTENTIAL CRITERIA
The pros and cons of potential control power criteria are discussed
in this subsection. The objective is to summarize existing experience to
provide a starting point for the development of a comprehensive control
power criterion.
1. Current MIL-F-83300 Criterion
The current MIL-F-83300 criterion specifies control power in terms of
the ability to change attitude by a specified amount in one second. Para-
graph 3.2.3.1 is repeated below for convenience.
3.2.3.1 Control power. With the wind from the most criticaldirections relative to the aircraft, control remaining shall besuch that simultaneous abrupt application of pitch, roll andyaw controls in the most critical combination produces at leastthe attitude changes specified in Table IV within one secondfrom the initiation of control force application.
TABLE IV. ATTITUDE CHANGE IN ONE SECOND OR LESS (DEGREES)
LEVEL PITCH ROLL YAW
1 ±3.0 ±4.0 ±6.0
2 ±2.0 ±2.5 ±3.0
3 ±2.0 ±2.0 ±2.0
TR-1116-1 79
NADC-770 52-30
One reason why the achievable attitude in a given time interval is felt
to be a poor candidate is that it does not account for the presence of
direct force control. Another equally important reason is that it is
independent of the vehicle gust sensitivity. These deficiencies are felt
to be severe enough to eliminate aircraft attitude in a given time interval
as a viable approach to specifying a control power criterion. It is, how-
ever, a valuable design guide for vehicles without direct force control or
that use direct force control for trim only. As such, it may have potential
as a part of a more general criterion.
2. )bxilmt= Control Moment (M85=1)
This is certainly the most direct method of specifying control power.
In fact, many researchers take for granted that maximm installed mment
is synonymous with control power (for example, see Refs. 8, 26-28, and 45
through 47). In addition to the above noted deficiencies related to the
attitude in one second requirement, control moment has the deficiency of not
being uniquely related to the ability to make large rapid controlled attitude
charges. Such changes depend on damping or stiffness as well as maximum
control moment. This is illustrated in Fig. 41 where it is shown that theachievable attitude in one second can vary over a large range for a fixed
value of maximum moment.
While not suitable as a comprehensive criterion for control power, the
installed moment is a valuable design guide. This is especially true regard-
ing the effect of random horizontal gusts on pitching activity (MU). For
example, Ref. 48 showed that for a conventional hovering helicopter in the
presence of Gaussian random turbulence, the required rms control deflection
is approximately related to the rms gust input as follows:
r~ 2~"~(%52 1 + a~ TO- - (!V2 _,g11
2" 01 + 2C" + 01
TR-1116-I 80
NADC-77O,52-3O
4
() .3-
LLm[
2)rrd/sec2 / .2
00 I23 4
w(rad/sSc) or X (i/sec)
Figure 41. Illustration of How the Attitude In One Second Require-ment Varies With Aircraft Dynamics
where double primes indicate the attitude and position loops have been
Figure 47. Control Power Required for PrecisionHover (from Ref. 8 data base)
TR-1116-1 90
NADC-77052-30
I actuator) are utilized., e.g., not fly by wire. This is shown schematically
in Fig. 48.
If the aircraft in Fig. 48 is neutrally stable or less (as most VTOL's
are), the primary requirement on the series actuator is to cancel the con-
stant bp which occurs when the pilot commands a step attitude change.
Hence the control power is dictated by the series actuator authority in
this example. An example of series actuator limiting was cited in Ref. 18.
There it was shown that a large windshear required very little surface
deflection, but that the series actuator requirements were significantly
greater than the available travel. This is illustrated in Fig. 49 (taken
from Ref. 18) for the XV-15 Tilt Rotor aircraft with attitude augmentation.
Because of the limited authority series actuator, the SCAS was remechanized
as a rate command attitude hold system with the results shown in Fig. 50.
The block diagram for the rate command attitude hold system is identical
to Fig. 48 except that there is an integrator at the output of 8stk .Figure 50 shows that the series servo travel is well within its travellimits for this type SCAS for the same large windshear input. The point
ParallelActuator
Mechanical Path a
SeriesActuator beElectrical j Surface
8stk Patas Def lection
Feedback
Equalization
Figure 48. Typical System With Paralleland Series Servos
TR-1116-I 91
DADC-77052-30
1 4-
4,
Cl)
00 0000
0 0-
in 0 -0
In 0
TR-i 16-1 9
NADC-77052-30
40
Cd
16, CO I~0
r4
TR-1 16-149
tA
NADC-77052-30
is that the available "control power" may depend on the detailed charac-
teristics of the augmentation such as the signal split between the series
and parallel servos. It is also interesting to note that the critical
disturbance input sometimes depends on the details of the augmentation
system mechanization. For example, the XV-15 time response shown in
Fig. 49 exhibits no saturation to large random gust inputs. The windshear
used in Fig. 49 was selected based on the knowledge that a long term step-
like stick input was required to saturate the series servo.
The authors of Ref. 50 noted that larger steady state aircraft attitudes
could be achieved without increasing control power by saturating the avail-
able control. This concept takes advantage of the fact that the e/5 response
of unaugmented VTOLS tends to be rate or acceleration-like and hence have
essentially infinite values of low frequency gain (e.g., the open loop atti-
tude response to a step control is unbounded or at least very large). Con-
trol system saturation rates were defined as shown in Fig. 51. The fixed
base sirmlation results of that study strongly supported their original
hypothesis as shown in Fig. 52. These results are augmented by the moving
base SO1 simulator results presented in Ref. 8 . Figure 53 (taken from
Ref. 51) shows that increasing SR is beneficial for attitude systems with
VehicleL i L2 Dynamics
Pilot Command ControlL imiter Limiter
Saturation Ratio SR= FeedbackCompensution
Figure 51. Definition of Saturation Ratio
TR-1116-1 94
NADC-77052--30
SATTITUOE SYSTEN
STIEAMY STATE :IT RO MT HOU ASIA
SRE GUST ACCELERATION
f..A 4 S EC) $1 1V
A. OP IE I
2.
S 1.-
In +01
1.5
0CL 1.0 -
02
0 I 2 34FREQUENCY~ w.,rdsc
Figure 53. Effect of Saturation Ratio on Required ControlPower as a Function of Equivalent System
Frequency (Ref. 51)
TR-111i6-1 95
NADC-77052-30
> 2 rad/sec. It is suspected that these results are primarily due to
the response feedback mechanization used wherein the maximum attitude
decreases with increasing frequency, i.e.,
L55may max command moment(Cpss) max w2
If so, the advantages of increasing saturation ratio shown in Fig. 52
may well be realized by simply moving the feedback compensation to theforward loop.
The effect of in creasing saturation ratio at constant frequency(c=
2 rad/sec) was investigated using the basic data from Ref. 8 (Sol 6 DOF
simulation). A configuration with marginal control power was picked to
see if increasing saturation ratio would move it into the satisfactory
range. As shown in Fig. 54, increasing values of the saturation ratio
increases the maximum steady state bank angle (pss) as expected. However,
6 PILOT COMMENTS:
Qu/te Sluggish Some phaseoar Urn/ted. effect 0 0 LIPh 2.2 2.6 s L2
001.0 1.4 1.8 By use of tim/ng it
"etters the control1.0---
o . L2 Wn : 2 rod/sec4
S.6U L = :.5 rod/sec2
(I)L.2 = .09 rod 5.2 deg
3 ' I I I I
0 .I .2 .3 4
('SS) max (rod)
Figure 54. Effect of Saturation Ratio on an AttitudeSystem With Marginal Control Power
TR- 1116-I 96
NADC-77052-30
the pilot ratings actually degrade slightly. Pilot comments indicate that
phase effects are responsible. Comments made by the authors of Ref. 8
indicate that the general consensus of the subject pilots was that the
adverse phase effects caused by increased saturation ratio more than offset
any advantages of increased achievable attitudes.
The drastic reduction in required control power with increasing satura-
tion ratio shown in Fig. 52 probably is influenced by the high natural
frequency used (aon = 4 rad/sec) and may be an artifact of the lack of
motion and non real world visual scene in the simulator.
D. SUM 4R
Of all the methods discussed for setting control power limits, it appears
that establishing the actual required surface or control-effector limiting
characteristics is the only approach that is general enough to insure ade-
quate control authority without overdesigning the system. The steps which
must be taken to set the maximum levels of surface and actuator travel (or
maximum control thrust) are given below.
i. Steps to Develop Control Power
a. Establish operating environment
" steady winds
" random turbulence
* airwake model
* descrete wind shear
" ground effect
b. Compute steady trim control power required
c. Settle on loop closure characteristics
• Augmentation and/or automatic control analysis and/orunmanned simulat ion
* Human pilot manned simulation
* Acceptable performance, e.g., for a given disturbancefrom Step a, how large may the attitude and positionerrors be? Obtain from pilot ratings and commentary.
TR-1116-1 97
L L-L" " ... 17
NADC-77052-30
d. Establish how much control saturation is acceptable from
simulation
0 based on performance
0 based on pilot acceptance (ratings and commentaryin simulation)
e. Check that adequate maneuvering can be accomplished withthe control power obtained from Steps a through c.
To develop better, more solidly acceptable crossover and exceedance
criteria requires a control power development program which includes a mov-
ing base manned simulation. As discussed in Section IV, the simulator
visual requirements for low speed and hover are quite stringent. However,
there appears to be no viable alternative to obtaining the data needed to
develop what are and what are not allowable levels of control saturation
and what is and what is not an acceptable level of performance for the
Navy mission.
2. Recomon ded Control Power CriteriaDevelopment Program
A two phase criteria development program is recommended. Phase I con-
sists of analysis and development of a simulation experimental plan. Phase 2
is the simulator experiment and analysis thereof to generate the data required
to set the specification boundaries.
The underlying concept of the research is the recognition that at one
extreme - a fully automatic system - the determination of required control
power is simply a matter of specifying command/disturbance inputs and accept-
able system performance. Further, such input/performance specifications are
related to and stem from the appropriate mission/task structure. Complicat-
ing factors enter the picture when, rather than under fully automatic control,
the system is partially or totally controlled by a human pilot; these compli-
cations are:
• The degree of saturation which the pilot will tolerate
is not known.
* The precision of control required by the pilot in hoveris not well established.
* The minimum maneuver/control desired/required by thepilot in hover is not well-defined.
The following program is designed to answer the above questions and thereby
unify control power specification whether for manual or for fully automaticsystems.
a. Phase 1
The data base generated by the Ref. 16 experiment should be analyzed to
gain insight into the following areas:
0 RMS and peak values of control utilization as a
function of disturbance inputs, i.e., deck motion,
steady wind vector, and wind turbulence over thedeck for rate, attitude, and velocity-command/position-hold augmentation.
* The extent to which pilots were willing to operatein the saturated region for each system.
0 Levels of system and stationkeeping performanceacceptable to the pilots.
Based on analysis of the time histories, approximate pilot models should be
defined. Of particular interest will be cases where saturation occurred,
although linear pilot models should also be developed. Inasmuch as pilots
frequently modify their tracking behavior in the presence of control system
limiting, the objective of such modeling will be to quantify the behavior
modification.
Closed-loop analyses should be performed on the following generic augmen-
tation schemes:
* Rate systems
0 Rate-command/attitude-hold systems
0 Response feedback attitude systems
• Model-following attitude systems
* Translational rate command (TRC) with attitude
a TRC with direct force control (DFC)
0 TRC with combination DFC and attitude
TR-1116-I 99
NADC-77052-30
Using appropriate pilot models, the required control power to "Just barely"
avoid saturation for each of the above systems should be determined and com-
pared for the following selected inputs:
* The latest version of the airwake model
0 Random turbulence
* Large discrete shear
The probability of exceedance level which constitutes "Just barely" avoid-
ing saturation for the random turbulence will be based on analysis of existing
simlation data and should be refined during the Phase A simulation effort
discussed subsequently. Additionally, the degradation in performance can
be calculated for specific levels of saturation. Based on the insights
gained from analysis of the Ref. 16 data, it should be possible to estimate
acceptable levels of saturation and performance degradation. These esti-
mates should form the basis for the final simulator investigation.
The final part of Phase 1 will utilize all of the above data to define
a simulation program. Minimum requirements for a simulation facility will
be established and certain specific simulators identified. Once the trade-
offs between cost, schedule, and technical requirements are established, and
a facility selected, Phase 1 will be complete.
b. Phase 2
Phase 2 consists of a carefully designed comprehensive simulation program
to generate the data required to set control power criterion boundaries for
low speed and hover. Based largely on the Phase 1 analysis and the existing
data review contained in this report, the "full" experimental matrix [which
consists of seven generic augmentation schemes, three disturbance models,
and varying levels of gust sensitivity (Xu, Yv and Mu, Lv)] should be reduced
to fewer, more "critical" and instructive cases. The nominal level of
control power for each configuration will be set by the value determined
from closed-loop analysis. Selected perturbations from these values should
be tested until the Level 1 and Level 2 boundaries have been established
for several levels of external disturbance.
TR-1116-I 100
NADC-77o52-3o
Feel system and control sensitivity characteristics should be separately
optimized for each of the generic test configuration.
The control power relief afforded by secondary controls will also be
investigated. Especially important in this regard is the additional work-
load required to operate the secondary control. Specific cases to be tested
are:
0 Retrimming nozzles when attitude is the primary trans-lation control.
0 Retriminng attitude when DFC is the primary translationcontrol.
Both manual and automatic trim followup should be considered.
Detailed pilot ratings and commentary will be obtained for each of the
following subtasks.
1. Transition to hover
2. Hover
3. Vertical descent
4. Takeoff and initial climb
The time spent on each of these areas should depend on their relative impor-
tance for each system tested based on initial pilot commentary and ratings.
These tasks will be simulated separately to allow the subject pilots to con-
centrate on a single well-defined task. Finally, the entire maneuver should
be simlated to allow the pilots to make an overall evaluation. At least
three subject pilots should be utilized.
Primary considerations for simulator selection are expected to be the
pilot's outside visual cues, and requirements for linear and rotational
motion.
It is suggested that the simulation be conducted in two phases. Phase A
would consist of a one-pilot checkout of each of the configurations, disturb-
ance models, auxiliary controls, and task scenarios to establish control
system dynamic and gain characteristics for each configuration. The data
obtained during Phase A will be utilized to refine the analysis, which in
turn will result in better information upon which to base the final test
plan for Phase B.
TR-1116-1 101
NADC-77052-30
Phase B would consist of actual data taking with a mininzm of three sub-
ject pilots. Any trends not supported by the closed-loop analysis should be
subjected to additional testing and when proven valid, incorporated into
the theory by the end of the program. Hence, the boundaries established
at the end of the experiment will, by definition, be supported by the analy-
sis. Such an approach allows filling in the blank spaces in the original
"full" test matrix through analytic extension of the experimental data
obtained.
4
TE -1116.1 102
F /
t NADC- 77052-30
SECTION VII
VERTICAL AXIS
A. BASIC CONSIDERATIONS
With the aircraft pitch attitude loop closed by the pilot (or by augmen-
tation) the vertical velocity response to a vertical thrust input may be
expresses as follows (see Ref. 4
,hN51 + Ye rT e (12)
Experience has shown that for Ye's consistent with normal piloted attitudecontrol, or SCAS practice, the effective gain is sufficiently high so that,
h h .
5T Ne s + (I/Te 2 )be
1/Te2 is approximately equal to the aircraft heave damping, -Zw., and
Z6T8T = -g(T/W - I) so that
h = ((14.)S-.Zw (4
B. DYNAMIC RESPONSE CONSIDERATIONS
For high disk loading VTOL' s, the aerodynamic heave damping tends tobe very low. The implications of this on piloted control of altitude canbe seen from the Bode asymptotes in Fig. 55. The well-developed theory
of pilot vehicle analysis states that the pilot will provide equalization
such that the open loop dynamics (h/he) have a K/s response in the region
of piloted crossover. (For example, see Ref. 13). Furthermore, if the
TR-1116-1 103
NADC-77052-30
Region ofVehicle K/s Piloted
Pilot Dynamics Crossover-
Speed
and Hove
hc + hc T hp ~S(s-Z.) h
if pilot suppliedlead at Z~
Figure 55. Piloted Control of Altitude in LowSpeed and Hover
required pilot lead equalization, TL, is greater than one second, the air-
craft will be rated as less than satisfactory. The very low values of Zw
which occur with high disk loading VTOL's (see Fig. 56) would therefore be
expected to be unsatisfactory without heave axis augmentation.
Examination of the data from several flight experiments (see Fig. 57)
shows, however, that zero heave damping can result in satisfactory pilot
commentary if the thrust to weight (T/W) is at least 1.1. The discrepancy
between this result and the extremely large data base which supports the
desirable range of TL is explainable on the basis of pilot task and environ-
ment. All of the experiments represented in Fig. 57 were accomplished with
very light or no turbulence and with negligible winds, thus minimizing the
need for moderate to high bandwidth. Conversely, there is experimental evi-
dence, discussed below, indicating that a K/s height response to moderate
frequencies is required for satisfactory ratings in a disturbed environment.
1. STI/Vought Binxiation (Ref. 16)
In this simulation, the baseline (attitude command) system was augmented
to K/s out to 1 rad/sec in the vertical axis. However, the backup (attitude
rate) system had no vertical axis augmentation resulting in a K/s2 response
throughout the region of piloted control. With low levels of wind over the
TR-1116-1 I04
t/
N{AD-77052-30
True Airspeed (kt)
0 50 100
- 0 -25
". AVO -BH E o-50 ' " X Lift + Lift
eeo> 1: Z .Cruise Fan
-75 UH-1 CH-53D
Figure 56. Comparison of Aerodynamic Heave Damping of
High and Low Disk Loading VTOLS
deck (WOD) the two systems were rated approximately equally (Cooper Harper
rating 3 to 4). With a 25 kt WOD, and correspondingly high turbulence, the
backup system was rated a 9 whereas the baseline system was still accept-
able (average rating = 4-1/2). Pilot commentary indicated that the extremely
poor rating for the backup system in the presence of disturbances was primarily
due to problems with height control. (See Fig. 11 for pilot ratings).
2. XV-5A Flight Test
During piloted evaluations of the XV-5A it was noted that height control
was satisfactory (Pilot rating = 2) when hovering out of ground effect. How-
ever, disturbances due to ground effect resulted in pilot ratings for height
control of 5-1/2 (Ref. 52 ). Attempts to achieve soft touchdowns were unsuc-
cessful. It was, therefore, necessary to set up a sink rate until ground
contact occurred with "no attempt to flare or cushion the landing with the
lift stick." (Ref. 53). The arodynamic height damping of the XV-5A is
TR-1116-1 105
NADC-7705P-30
41
.9 -_ _ _ _ _ _ _ _ _
0 X-14 (Ref. 54).8 (Or SC-I (Ref. 54)
nA CH-47 (Ref. 55)~VAK-191B (Ref. 56)
S.7-
CL
.5
E
.a2a 2- 21 2eeerto
.22
5~j3 22
6 51 A 3A312 2
.22
1. 4.3
Thus to AegtRai,/
Si6iFigure 57. Fligt Dat foertica Axscotjo
NADC- 770-52-30
approximately zero in hover. As noted above, this was satisfactory until
operation was attempted in a disturbed environment; further evidence that
zero height damping may not be practical. It should also be noted that
the XV-5A was restricted to operation in winds of less than 5 kts.
3. Vinje, Miller Simulation Data (Ref. 24)
As discussed in Section IV, these data have certain limitations and
are considered useful for trend information only. However, they do show
that when operating in a generally disturbed environment (10 kt mean wind
with 3.4 ft/sec rms gust along the X and Y axes) the ratings for three pilots
were all unsatisfactory for vertical axis damping less than 0.35 even with
T/W > 1.1. These pilots commented that "it would probably be impossible
to perform any other task, such as lateral air taxi, in addition to con-
trolling height" with lower height damping. An example of these data is
shown in Fig. 58. It is interesting to note that zero vertical axis damping
results in pilot ratings which do not even meet the Level 2 requirements.
There is also some evidence that finite values of heave damping are
required, even in a nondisturbed environment. These are given below.
a. A'Harrah/Kwiatkowski Simulation Data (Ref. 57). These datawere generated during an early attempt to establish handlingqualities criteria for low speed and hover for VTOL's. Heightdamping vs. control sensitivity boundaries were derived fromfixed base simulation pilot rating data as shown in Fig. 59.The atmospheric turbulence was zero during these tests. Thesedata were generated with effectively unlimited control power(T/W = 1 .5). They are in agreement with the Ref. 24 data inthat finite values of heave damping in the neighborhood of-Zw - 0.3 are required for satisfactory ratings.
b. Navy Carrier Landing Experience. The need for finite levelsof heave damping during precision height control tasks wasdemonstrated in Ref. 58 for the carrier approach task. Inthat study it was shown that a minimum level of 1/Te2 of0.35 was required for satisfactory pilot opinion.
C. HEAVE AXIS AUGME1TATION
Based on the above considerations it can be seen that there is strong
evidence that heave axis augmentation may be a practical necessity for opera-
tional VTOL's. The effects of such augmentation have been investigated in
a) Acceptance Boundaries for Altitude b) Acceptance Boundries for AltitudeControl Located on Quadrant Control Located on Floor
Figure 59. Fixed Base Simlation Data (T/W 1 .5)
(Fom Ref. 57)
two separate programs at NASA Langley utilizing the variable stability
CH-47 (Refs. 19 and 55). The data from Ref. 55 are plotted in Fig. 57.
They indicate that for acceleration from hover, i.e., takeoff, there is
a penalty for increasing the vertical velocity damping at constant T/W.
Pilot comments for the large -Zw cases tend to indicate an overly sluggish
response. This was also true for the vertical velocity commad system
tested in Ref. 19 as shown in Fig. 60. Another interesting feature of this
plot is that pilot opinion is not constant along lines of constant steady
climb rate to collective (hi/5,). This is somewhat at odds with the MIL F-
83500 (Ref. 59) and AGARD 577 criteria which are given in terms of constant
h'/5c boundaries.
The reasons for the above noted discrepancies are rooted in the details
of the mechanization of vertical axis augmentation. Mobst of the existing
experimental data are based on response feedback type augmentation wherein
the equalization is placed in the feedback path. The effect of this on the
h/S)c response is identihcal to increasing the aerodynaniic heave damping, Zw;
i.e., the steady state response to a collective input is reduced. This
short-coming can be overcome by placing the equalization in the forward
loop; frequently termed command augmentation. Utilization of command aug-
mentation removes the dependency of the steady response on the level of
heave damping. This is illustrated in Fig. 61.
4- 1116-I 109
NADC- 77052-30
Steady state climbrote per inch ofcollective p'f
Sluggish sensitive
-1.0-
OL PRIMARY PILorE
05 . .2Ma3r
Control Sensitivity (g/in.)
Figure 60. Primary Factor for Downrating Various Combinationsof Control Sensitivity and Height Damping (Ref. 19)
RESPONSE FEEDBACK COMMAND AUGMENTATION
Be s - Zw+ KA Z TK/5 8 s-Zw+K ZB &SK8 1
Figure 61. Effect of Different Implementations ofVertical Axis Aumentation
TR-1116-1 110
NADC-77052-30
From Fig. 61 it can be seen that in each case, increasing Kh has the
same effect on the dynamics, i.e., the heave damping is augmented so that
I/Th = Zw + KAZ5 . However, in the response feedback mechanization such
augmentation tends to suppress the steady response, (A/5C)s = I/Kf, result-
ing in pilot commentary of "sluggish". Thus it can be appreciated that the
lines of constant (/8c)ss utilized in Refs. 19 and 55 may really be only
an artifact of the SCAS mechanization and not a fundamental property ofvertical axis control.
Based on the above observations and issues, more experimental data are
required to:
1. Establish the effects of external disturbances inlongitudinal and lateral axes on vertical axis damp-ing requirements.
2. Isolate the effects of vertical axis damping fromsteady state climb rate to collective input,(u/bc)ss"
3. More closely delineate the vertical axis requirementsfor deceleration to hover as distinct from accelera-tion from hover using command augmentation.
D. NONLIEARITIES
Nonlinearities in the thrust response were shown to seriously degrade
pilot opinion of height control in the VAK-191B flight tests reported in
Ref. 56. More specifically, the pilot had two throttles; one for the "lift"
engines, the other for the main engine. These throttles were nominally
operated together in hover (where the diverted main engine thrust is also
lifting) to achieve control of altitude or sink rate. The nonlinear thrust
response occured due to automatic restriction of main engine thrust to
avoid exceeding design limits. At the heavier aircraft weights (Tmax/W :j
1.05), the resulting nonlinearity in the working region of throttle dis-
placement contributed heavily to very poor pilot opinion (Cooper Harper
pilot rating = 8). At lighter aircraft weights (T/W _Z i.I) where limiting
was not encountered, the height control was judged to be satisfactory (pilot
rating = 3). These rating differences are much higher than those attributable
directly to the difference in T/W - e.g., see Fig. 57. Clearly, thrust
TR-1116-1111
NADC-77052-30
non-linearities can have overriding impact and deserve investigation to
determine limits for acceptable operation.
E. EFECT OF LI'TIG SYSTEM RESPONSE DYNAMICS
The response dynamics of the lifting system introduce additional phase
lags in the ti/8c response. Degradations in pilot opinion due to phase
lags are easily predicted from pilot vehicle analysis techniques as out-
lined in Ref. 13. If we approximate the dynamic response by a first order
lag in the lifting system, the resulting fi/5c response is well represented
by (see Eq. 13).
K~e~h 5 (13)5c (s + + !T
Where 1/T is the augmented vertical axis heave damping (I/Tfa -Zw for
zero augmentation).
The current specification (Ref. 59) places an effective limit on the
magnitude of TL by requiring that it "be possible to achieve 63 percent of
a commanded incremental thrust of at least 0.05W in not more than 0.3 seconds".
Such a requirement erroneously assumes that the allowable lifting system lag
is independent of vertical axis heave damping. An attempt to account for
the combined effects of TL and Th by formulating a dynamic height control
criterion in terms of total phase angle vs. frequency was reported in Ref. 60.
This work was considered during the development of the current MIL F-83300(see Ref. 43) but was rejected on the grounds that further substantiation was
required. This was a reasonable conclusion considering that the Ref. 60 work
was done on a fixed base simulator. However, it is our opinion that the data
represents a valid starting point for further experiments as well as a tenta-
tive specification for the height control LOES. The criterion proposed in
Ref. 60 is shown in Fig. 62. The simulated turbulence environment consisted
of an rms level of 5.1 ft/sec in the longitudinal axis and 1.28 ft/sec in
the lateral axis. The pilots described the simulation as a medium turbu-
lent day.
TR-1116-I 112
/i
NADC-77052-30
-180
\Tfi) TL- UNSATISFACTORY
--0.4 0 A
- 0
(ThR
S .- i 0 3
.- 3 0 2
W -120-
0.
-90 I I
0 0.5 1.0 1.5 2.0
HEIGHT CONTROL FREQUENCY, W- RAD/SEC
Figure 62. Dynamic Height Control Criterion in Terms of PhaseAngle of Height Response (taken from Ref. 60)
The criterion shown in Fig. 62 represents a fairly stringent height
control requirement. In way of illustration, if all the system lags are
zero (1/TL = 0), the criterion in Fig. 62 indicates that the minimum
acceptable value of 1/Th would be about 0.9 sec- I . While in our opinion
this does not seem unreasonable, it does represent a significant increase
from the current MIL-F-83300 which requires only that 1/T > 0. In support
of the Fig. 62 criterion, it is consistent with a wide body of pilot vehicle
analysis which indicates that a requirement for the pilot to generate lead
greater than one second will result in unsatisfactory pilot opinion. Values
of 1/T < 1 would result in such a requirement (see Ref. 13).
TR-1116-1 113
/1NADC-77052-30
F. RO ED CRITERIA DEVELOPHW PROGRAMFOR HEIG CONTROL
The requirements for height control have been shown to be influenced
by the workload in the lateral and longitudinal axis. Visual and motion
cues available to the pilot are also major factors. The following criteria
development program is based on investigating these, as well as more direct
effects.
1 Limited Pilot Vehicle Analysis
A limited amount of pilot vehicle analysis work is required to
* Quantify pilot equalization requirements as a func-tion of the equivalent system parameters.
* Establish tentative criterion boundaries based onpilot vehicle analysis rules (Ref. 13) and onlimited available simulation data.
* Investigate the effect of nonlinear engine responseusing describing function analysis procedures.
The analytic results will be useful in scoping and detailing specific
desirable additional simulation experiments.
2. Piloted Experiment
The desirability of generating translational disturbances in the hori-
zontal plane as well as simulating levels of lateral and longitudinal aug-
mentation from rate to TRC essentially rules out the use of any existing
flight test facility. The selected simulation facility would preferably
have a real world visual scene (e.g., pilot looks out at simulator bay)
as well as one to one motion (no washouts).
It is expected that the variation in height control requirements with
increasing levels of external disturbance will be most apparent for the
less sophisticated augmentation. A logical test sequence would therefore
include the two augmentation schemes which occur at the extreme ends of the
spectrum; rate and TRC. The TRC system would be included primarily to test
the conclusion from existing data that the requirements on height damping
TR-1116-I 114
NADC-77052-30
can be relaxed to nearly zero if the lateral and longitudinal axis work-
load is low.
Each height control configuration would be tested under the following
conditions
LATERAL/ EXTERNALLONGITTDINAL
LNGITUDINAL D ISTURBANCEAUGMENTATION
Rate Lw.ModerateHigh
TRC High
Height control power (Tmax/W) should also be a variable in the experi-
ment to test existing results which indicate a tradeoff between control
power and height damping. The planned experiment would extend these results
to include the effects of secondary tasks and external disturbances. In
this regard the height damping should be inherent (aerodynamic) or generated
via response feedback augmentation. Approach to hover and hover tasks
should be evaluated separately from liftoff and acceleration tasks. The
purpose of emphasizing these separately is to evaluate the results of
Ref. 55 which indicate that takeoff is most critical from a minimum T/W
standpoint. Configurations which utilize response feedback and command
augmentation should be separately tested as well.
Configurations with a nonlinear thrust response to simulate limiting of
some components of the lifting system (a li VAK 191B) should be tested.
Results of these tests would allow specification of allowable nonlinearities
in the lifting system.
Combinations of height damping and lifting system lag should be tested
to determine limiting values of the lower order equivalent system (LOES)
parameters (Eq. 13). In addition, several higher order systems (HOS)
should be tested to determine the allowable departure from the LOES form
before pilot ratings show a degradation.
TR-1116-1 115
/
NADC-77052-30
SECTION VIII
ELUDING BLWEU ALGITATMN NODES
There is considerable evidence that augmentation schemes which are
appropriate for hover axe inappropriate for up and away flight (see Refs. 14
and 15). lbre specifically, attitude command/attitude hold (ACAH) or trans-
lational rate command (TRC) systems are required for adequate pilot ratings
in hover (when visual cues are lacking) whereas rate command/attitude hold
(RCAH) is in many cases more desirable for up and away flight. Hence, it
is necessary to consider the blending between these augmentation systems.
There is very little data which covers the limiting aspects of SCAS blend-
ing. This section describes the development of several SCAS blending schemesas well as the results of moving-base piloted evaluations on the NASA Ames
Flight Simulator for Advanced Aircraft (FSAA)*. The aircraft dynamics pro-
grammed on the simulator were representative of the XV-15 tilt rotor VTOL
aircraft.
A. DESCRIPTION OF AUGMENTATION SYSTEMS
The longitudinal control system utilized conventional feedbacks for
rate command/attitude hold (RCAH), attitude command/attitude hold (ACAH)
and translational rate command (TRC) as shown in Fig. 63. Figure 63 includes
some blending functions which will be discussed shortly.
The lateral SCAS was of identical form to the longitudinal SCAS (e.g.,
feedback of p, q, and Y).
B. SLUARY OF BLEDING SCHEMES
1.RCAH/ACAH
The variables defining blending between RCAH and ACAH are the length of
the blending interval and the logic which initiates the blend. Two methods
*This work was sponsored by the NASA Ames Research Center and was con-ducted under the supervision of Dr. James R. Franklin and W. J. Brigadier.STI participated in a consulting role. As of the present time it has notbeen published.
TR- 1116-1 116
NADC-77052.50
00
so
do
Ld i. 0
-0 C!4
t% CL I
TR-m6-1 11
KADC-77052-30
of initiating the SCAS blend were tested - an automatic blend initiation
based on airspeed, and a manual switch located on the collective control.It was hypothesized that it would be desirable to switch into ACAH approach-
ing hover at a different airspeed than when switching into RCAH duringacceleration out of hover. Hence, the logic includes RCAH - ACAH at Va
and ACAH - RCAH at Vb. Additionally, the automatic blend was initiated
only if the airspeed criterion was met for more than 3 seconds. This was
done to avoid switching back and forth in gusty air.
The blending interval is based on time rather than air or ground speed
since the deceleration/acceleration rates are expected to vary depene.ing
on the pilot and task.
The primary blending function is N, (see Fig. 63). A plot of thegeneral shape of N, is given below in Fig. 64. From Fig. 63 it can be
seen that when N1 is equal to unity, the forward loop integrator is phasedin, thereby providing the rate command input to the SCAS. Two types of
rate command SCAS stick shaping were tested. In one case N2 was left at
unity, which results in the shaping shown in Fig. 65. In other cases N2
was set to -1/K7p so that the proportional signal was zero (e.g., no high
frequency asymptote in Fig. 65). For these cases, the logic controlling
N2 was as follows:
N2 = 1 when NI < .95 RCAH -ACAH1
N2 = - 1 when N1 > .95 ACAH -'-RCAH
Due to an error in the computer program, N2 was set equal to zero (insteadof -1/K7P) for RCAH in nearly all of the blending runs. The effect on
the stick shaping in Fig. 65 was to increase the break frequency from 1 rad/
sec to 3.9 rad/sec. This effectively eliminates the high frequency asymp-
tote since it occurs well above the piloted crossover frequency.
2. RC-TRC - Longitudinal
As shown in Fig. 63 the blend from RCAH to TRC was identical to RCAH
to ACAH except the X feedback was blended in as 1-N1. Some thought was
given to synchronizing on X to eliminate transients when switching to TRC
at some forward speed (e.g., at the completion of the blend to TRC, zero
TR-1116-1 118
NADC- 77052-30
N: I RCAH
1.0 N\ 1 =0 ACAHN,
va Vb
Figure 64. N1 Blending Function
K9p
I+K7 p
K pI + K -p
log W
Figure 65. Stick Shaping
control position commanded the velocity existing at the switch point).
This option was abandoned early in the program due to the undesirability
of losing correspondence between zero control position and zero inertial
velocity. The correspondence between control position and velocity turned
out to be a significant asset of the TRC system because of limited visual
cues in hover with the simulator visual flight attachment (Redifon).
The correspondence between zero control position and zero ground speed
also requires that inertial velocity as opposed to airspeed be used as a
feedback. Attempts to use airspeed feedback in steady winds were rated
as unacceptable. Hence the block diagram in Fig. 63 shows X as the outerloop (as opposed to air velocity).
TR-1116-i 119
/
NADC-77052-30
5. RCAE/TRC L- Lateral
There was not time in the simulation to set up and test lateral TRC
blending. However, the primary consideration for lateral RCAH/TRC blending
is the inner-loop SCAS. This arises from the fact that RCAH is primarily
a turn-following mode (control heading with bank angle), whereas lateral
TRC is a constant heading mode. The blending between these different aug-
mentation schemes must be handled on a case by case basis since the feed-
backs depend on the basic vehicle deficiencies. Fortunately, most blending
will be done when in coordinated, or at least nearly coordinated, flight.
In such cases there will be no transients at the switch point.
C. SIMULATION SCENARIO
A six degree of freedom moving base simulator (NASA Ames FSAA) was
used with a Redifon visual flight attachment (VFA). A terrain board
developed for nap of the earth (NOE) maneuvering was utilized to implement
tasks 'which could exercise critical aspects of the blending. The pilot-
ing task was to start at 200 feet altitude at an airspeed of 60 knots and
to come to hover at a specified point. Next the aircraft was accelerated
at maximum rate to 60 kt at a very low altitude (following a road) and
then brought to hover again. The final transition from hover involved
an accelerating climbing left turn. This maneuver was set up to insure
that the blend would occur during the turn.
1. Pilot Counentary and Ratings on RCAH/ACAH Blend
The pilot commentary and Cooper -Harper ratings for the RCAH/ACAH
blends (see Table 5) lead to the following conclusions.
The most critical aspect of blending is in the lateralaxis while simultaneously turning and blending fromACAH to RCAH.
* There is a tendency to bobble pitch attitude duringacceleration from hover while blending from ACAR toRCAR.
9 A 10 second blend which occurs at 10 kt seemed aboutoptimum for acceleration and deceleration.
* Additional workload imposed by having the pilot manuallyswitch the SCAS was noticeable.
TR-m16-i 120
NADC-77O52-3O
t- 4 0 IU
0.5 cs $
Is a' 0 00 0
.0 0c 0 'a 4j.0 WN
0.. a4 4) 4) k)
!5C 0 4 54..- 4. 44) 4 0 01 0 .4 4,4 04\ -.
P4 . - ) 2
a)4 00.0O 0 A ~l$ 4) u
4- 4 rq~
4 . 4)0 0
V 10 o) 1~ .8 u.0 4). 0l al K45 o4 0 454
0H 4A f- S.4 k) 00 0
U O 0 0 .0' . ' * 00 ~04 1,5 540
.0.0 404 0 00-500) 4) 4)
4 4 0 11 0 0 +o2 4).- , 0 ,=4) -
0542) A 0
0 0 0
-4 o)0 0o r.
0 - a H0
04 r010
r4144 0 0 I3 00 'o 4v) C1 C - 0q0 k 14
0 0 , 0 4)4) 4) 4C' 0 0 0 0 04
0, 0
Au~ C. '.. Od. 1U % v , = t-
__ _U_ _ 4)
TR- 16-i121
NADC-77052-30
The most noticeable problem was a tendency for the bank angle to in-
crease when accelerating from hover in a turn. This was due to the largeamount of left stick required to hold a bank angle in the attitude command
mode. The stick deflection changes from a bank angle to a bank angle ratecommand during the blend to RCAH. This was aggravated by the fact thatthe lateral stick sensitivity and control power were low in the ACAH sys-
tem (full stick was only 30 deg of bank). These results indicate thatlateral control power requirements for ACA systems should be set, in part,
by the SCAS blending (ACAH - RCAH) in a turn.
The tendency to bobble pitch attitude while accelerating is attribut-
able to the same basic phenomenon as the turn problem, i.e., large stick
displacement at blend initiation. There is a requirement to convert from
a large forward stick displacement to zero stick displacement when convert-
ing from ACAH to RCAR while accelerating. As with the turn, increased
stick sensitivity in the ACAH system tends to minimize the problem. Decreased
stick sensitivity in the rate system would have the same effect.
Since the pilot rating for the best system was a 2 (Run 25-49, Table 5),
the above problems do not appear to be severe as long as the proper blend-
ing times and speeds are observed (10 sec and 10 kt).
It is doubtful if airspeed could actually be used as an automatic blend
initiation variable because of the obvious problems in steady winds. Air-
speed was used in this program because the tactical mission of the XV-15would not allow derivation of inertial speed, and it was initially thoughtthat larger blending speeds would be appropriate. However, since the
blending runs were made without wind, the effect went unnoticed.
In general, an automatic blend initiation at an inertial speed of 10 kt
should be used when possible (PR = 2). Manual selection of the SCAS mode
is acceptable (PR = 3-4) when inertial velocities are not available.
2. Pilot Comentwy and Ratings on RCAH/TRC Blend
The pilot commentary and Cooper-Harper ratings for the RCAH/TRC blends
0 There is a tendency to bobble pitch attitude duringacceleration from hover.
. A 10 second blend during deceleration and a 3 second
blend during acceleration represent the best compromise.These blends should be initiated at a speed of about10 kt.
* Initiating the blend at high speeds can result inlarge abrupt pitch attitudes, especially for theRCAH - TRC blend. As a result, the use of manual
>1 SCAS selection with the attendant possibility ofinadvertant high speed switching is not desirable.As discussed in Section 2, inertial speed will beavailable for blend initiation since it is requiredas a feedback on TRC systems.
To even a greater extent than the ACAH - RCAH blend, the stick position
of the TRC system is at or near its maximum forward limit during a rapid
acceleration. It is therefore not surprising that a large nose down pitch
rate can develop as the TRC SCAS blends to RCAH. The solution lies in
performing the blend from TRC to RCAH at as low a speed as possible (or
even just prior to leaving hover) and to perform the bulk of the accelera-
tion in RCAH.
Unlike the RCAH - ACAH blend, the best solution for the RCAH - TRC
blend is to use a longer time decelerating than accelerating. A longer
blend is required when going from RCAH to TRC to avoid a very abrupt com-
manded pitch up due to a sudden speed error. This effect was dramatically
exhibited in Runs 26-10 and 26-1I (blend time = 0) where the pilot gave a
rating of 10. Shorter blend times are desirable when accelerating to mini-
mize the stick retriming time, e.g., stick needs to go from forward to zero
when going from TRC to RCAH. A zero time switch tended to be too abrupt,
whereas a 3 second blend seemed like the best compromise.
TR-1116-1 124
- .- 4~--=~,"' - ______________________________
NADC-77052-30
SECTION IX-
SUMMY
The work presented in this report is summarized through presentation
of proposed modifications to certain paragraphs of MIL-F-83300 (Ref. 59).
In some of the areas studied, the necessary data were not available to define
quantitative limits or boundaries. In these cases paragraph numbers were
assigned and the reader referred to the appropriate section of the reportto review the proposed experiments as well as the recommended form of the
flying qualities criterion. In most cases only Level 1 boundaries are
specified.
A. DYNAMIC RESIONSE EQUIREMOM (3.2.2)
The dynamic response requirements shall be defined in accordance with
the outside visual cues (OVC) required to complete the specified mission
and the cockpit displays available to the pilot (see Fig. 5 and Table 2).
1. Requirements for Attitude Systems (3.2.2.1)
If an attitude system is indicated in Table 2, the requirements for
compliance (e.g., to show that the response is attitude-like as opposed
to rate or acceleration) are defined in Fig. 3. As indicated in Section
IIC some experimental data is required to finalize the numerical values
to be used in Fig. 3.
Both rate and attitude systems shall be compatible with the following
The appropriate frequency range for matching this LOES and the maximum
acceptable value of mismatch function, M, for TRC systems is not yet
defined. Tentative boundaries for Kkc and Tkeq are given in Figs. 35
and 36 for center stick and sidearm controllers respectively. These
boundaries are based on experiments where attitude alone was used for
translation. Further experiments are required to validate the boundaries
in Figs. 35 and 36 and to extend these results to include direct force
control.
3. CORMOL POR (3.2.3)
As discussed in Section VI, a viable control power criterion cannot
be established without additional experimentation which was beyond the
scope of the present study. The present status and required work is dis-
cussed in detail in Section VI.
1. ResPonse to Control Input (3.2.3.2)
This subparagraph should be deleted since specification of the
equivalent system sets the control sensitivity.
C. CONTOL IAGs (3.2 .)
Control lags are inherent to the LOES response and do not need to be
separately specified.
D. VEMTCAL 1LIT CHARACTERISTICS (3.2.5)
The LOES form for height control is given as
-Ts
~c (s+ )(s + 1
As with the previous LOES forms the maximum allowable value of the mismatch
function, M, and the appropriate frequency range need to be defined.
TR-1116-1 127
NADC-77052-30
1. DVDMLo Response for He1it Control (3.2...)
A tentative requirement on the maximm allowable phase lag due to
1/Tfi, 1/TL, and -f is given in Fig. 62. However, because the data were
taken on a fixed base simulator and because they indicate a fairly stringent
height control requirement, it is felt that additional data is required.
The experiments required to obtain the necessary data are outlined in Sec-
tion VI-F. It is likely that the limiting value of phase lag will be some-
what dependent on the level of lateral and longitudinal augmentation.
2. Sensitivity (3.2.5.2)
Levels of Kf1 which represent Level 1 and Level 2 flying qualities also
need to be established from the experiments defined in Section VI-F. Con-
siderations of the type of manipulator should be included since sensitivity
is highly manipulator dependent.
3. Heighit Control Power (3.2.5.3)
There is some experimental evidence that the required height control
power depends on the dynamic height response. These results were inherent
to the mechanization used response feedback and therefore should not be
generalized into a specification. Further experiments are required to
obtain more general height control power boundaries. (See Section VI-F).
I. Linearity of Lifting System Response (3.2.5.4)
The vertical thrust response shall not exhibit objectionable nonlineari-
ties in the region where
0.95 £T/W .. (T/W)max
Exactly what constitutes the maximum acceptable nonlinearity is not currently
known and should be investigated as discussed in Section VI-F.
TR-1116-1 128
&- . . . .. ... . . . .. ... . .I
NADC-77052-30
1. Hoh, R. H., R. H. Kl~ein, and W. A. Johnson, Development of an Inte-grated Configuration Management/Flight Director System for PilotedSTOL Approaches, NASA CR-2883, August 1977.
2. Hodgkinson, J. and K. A. Johnston, "Initial Results of an Inflight Simu-lation of Augmented Dynamics in Fighter Approach and Landing,"AIAA Paper No. 79-1783, presented at the AIAA Guidance and ControlConference held in Boulder, Colorado, 6-8 August, 1979.
3. Hodgkinson, J., W. J. LaManna, and J. L. Heyde, "Handling Qualitiesof Aircraft with Stability and Control Augmentation Systems -A Funda-mental Approach," The Aeronautical Journal, Vol. 80, No. 782, Feb.1976, PP. 75-81.
4. McRuer, Duane, Irving Ashkenas, and Dunstan Graham, Aircraft Dynamicsand Automatic Control, Princeton University Press, Princeton, N. J.,1973.
5. Heffley, Robert K., Wayne F. Jewell, John M. Lehman, and Richard A.Van Winkle, Compilation of Helicopter Handling Qalities Data,Systems Technology, Inc., TR-1087-1, Oct. 1977.
6. McCormick, R L., VTOL Handling Qualities Criteria Study ThroughMoving-Base Simlation, AFFDL-TR-69-27, Oct. 1969.
7. Lebacqz, J. V., Summary Documentation of AV-8B Model Development andX-22A Simulation of AV-8B, Calspan Corp. Rept. X-22A TM No. 98,20 July 1977.
8. Greif, Richard K., Emmett B. Fry, Roland M. Gerdes, and Terrence D.Gossett, Effect of Stabilization on VTOL Aircraft in HoveringFlight NASA TN D-6900, Aug. 1972.
9. Miller, R. J., and E. R Tribken, "Automatic Flight Control System fora Helicopter Night Landing System," The Guidance and Control ofV/STOL Aircraft and Helicopters at Night and in Poor Visibility,AGARD-CP-148, May 1975, pp. 25-1 to 25-9.
10. Traskos, R., USN/FMDD FRG VAK-191B Joint Flight Test Program FinalReport. Volume No. 1, Summary, NAVAIR-1R-76, Aug. 1976.
11. Seckel, E., J. J. Traybar, and G. E. Miller, Longitudinal HandlingQualities for Hovering, Princeton Univ., Dept. of Aero Eng.,Rept. No. 594, Dec. 1961.
12. Bryant, William B., James J. Cattel, William A. Russell, and Ralph B.Trueblood, VTOL Advanced Flight Control System Studies for All-Weather Flight. Vol. I: Task I Report, USAAMRDL-TR-75-13A, July1975.
TR-1116-I 129
NADC-77052-30
13: McRuer, D. T., and E. S. Krendel, Mhematical Models of Human Pi lot
15. Niessen, Frank R., James R. Kelly, John F. Garren, Jr., Kenneth R.Yenni and Lee H. Person, The Effect of Variations in Controls andDisplays on Helicopter Instrument Approach Capability NASA TND-8385, Feb. 1977.
16. Stapleford, Robert L., Warren F. Clement, Robert K. Heffley, George C.Booth, and Robert L. Fortenbaugh, Flight Control/Flying QualitiesInvestigation for Lift/Cruise Fan V/STOL. Vol. II: Piloted Simu-lation, Systems Technology, Inc. TR-1122-1, Aug. 1979.
17. Winn, Albert L., Warren E. Griffith II, and Carl F. Mittag, Instrument.Flight Evaluation OH-6A Helicopter, Part 1, USAASTA Project No.72-16, Nov. 1973.
18. Hofmann, L. G., Roger H. Hoh, Wayne F. Jewell, Gary L. Teper andPradip D. Patel,, Devel]opment of Automatic and Manual FlightDirector Landing Systems for the SV- 15 Tilt Rotor Aircraft inHelicopter Model NASA CR-152o4o, Jan. 197d.
19. Kelly, James R., Frank R. Niessen, Kenneth R. Yenni, and Lee H. Person, Jr.,Flight Investigation of a Vertical-Velocity Command System for VTOLAircraft, NASA TN D-8480, July 1977.
20. Kelly, James R., Frank R. Niessen, Jerry J. Thibodeaux, Kenneth R. Yenni,and John F. Garren , Jr., Flight Investigation of Manual and AutomaticVTOL Decelerating Instrument Approaches and Landings, NASA TN D-7524,July 1974.
21. Lebacqz, J. V., and R. C. Radford, "An Experimental Investigation ofControl-Display Requirements for a Jet-Lift VTOVL Aircraft in theTerminal Area,"1 A Collection of Technical Papers, AIMA AtmosphericFlight Mechanics Conference, Palo Alto, California, Aug. 7-9, 1978.pp. 243-252.
22. Bryant, William B., James J. Cattel, William A. Russell and Ralph B.Trueblood, VTO)L Advanced Flight Control System Studies for All-Weather Flight. Vol. II: Task III Report, USAAMRL-TR-75-13B,JU.1Y 1975.
23. Davis, J., T. Garnett, and J. Gaul, Heavy Lift Helicopter Flight ControlSystem. Vol. III: Automatic Flight Control System Development andFeasibility Demo~nstration, USAANRDL-TR-77-40C, Sept. 1977.
TR-11161 130
NADC-77052-30
24. Vinje, Edward W. and David P. Miller, Flight Simulator Experiments andAnalyses in Support of Further Development of MIL-F-83300-V/STOLFlying Qaalities Specification, A1ThL-TR-73-34., June 1973.
25. Corliss, L., R. K. Greif, and R. M. Gerdes, "Comparison of Ground-Basedand In-Flight Similation of VTOL Hover Control Concepts," AIAAJournal of Guidance and Control, Vol. 1, No. 3, May-June 197Fpp. 217-221.
26. Rolls, L. Stewart, Fred J. Drinkwater III, and Robert C. Innis, Effectsof Lateral Control Characteristics on Hovering a Jet Lift VTOL Air-craft, NASA TN D-2701, Mar. 1965.
27. Kelly, James R., John F. Garren, and John P. Reeder, A Visual FlightInvestigation of Hovering and Low-Speed VTOL Control Requirements,NASA TN D-2788, Apr. 1965.
28. McGregor, D. M., The Influence of Aircraft Size on Control Power andControl Sensitivity Requirements. A Comparison of Results FromTwo Variable Stability Helicopters, NRC Aero Rept. LR 459, July 1966.
29. Craig, Samuel J. and Anthony Campbell, Analysis of VTOL Handling Qali-ties Requirements: Part I Longitudinal Hover and Transition AFFDLTR-67-179, Oct. 1968 and Samuel J. Craig, Anthony Campbell, andR. H. Klein, Analysis of VTOL Handling Qualities Requirements.Part II. Lateral-Directional Hover and Transition, AFFDL-TR-67-179,Feb. 1970.
30. Morello, Samuel A., Lee H. Person, Jr., Robert E. Shanks and Richard G.Culpepper, A Flight Evaluation of a Vectored-Thrust-Jet V/STOLAirplane During Simulated Instrument Approaches Using the Kestrel(XV-6A) Airplane, NASA TN D-6791, May 1972.
31. Ashkenas, I. L., Some Open- and Closed-Loop Aspects of Airplane Lateral-Directional Handling Qualities, AGARD Report 533, May 1966.
32. Tapscott, Robert J. and Robert W. Sommer, A Flight Study with a LargeHelicopter Showing Trends of Lateral and Longitudinal Control Responsewith Size, NASA TN D-3600, Sept. 1966.
33. Garren, John F. Jr., James R. Kelly, Robert W. Sommer, "VTOL FlightInvestigation to Develop a Decelerating Instrument Approach Capa-bility," SAE Paper No. 691693, Oct. 6-1o, 1969.
34. Garren, John F. Jr., James R. Kelly, Rober W. Sommer, and Daniel J.DiCarlo, Flight Investigation of VTOL Control and Display Conceptfor Performing Decelerating Approaches to an Instrument Hover,NASA TN D-6108, Feb. 1971.
35. Corliss, Lloyd D. and Daniel C. Dugan, A VTOL Translational Rate ControlSystems Study on a Six-Degrees-Of-Freedom Motion Simulator, NASA TMX-62,194, Oct. 1972.
TR-1116-1 131
NADC-77052-30
36. Tactical Aircraft Guidance System Advanced Development Program FlightTest Phase Report, Vol. I, USAAMRDL-TR-75-69A, Apr. 1974.
37. Mrrick, Vernon K., "Study of the Application of an Implicit Model-Following Flight Controller to Lift-Fan VTOL Aircraft," NASATechnical Paper 1040,. Nov. 1977.
38. Feistel, Terrell W., Ronald M. Gerdes, and Emmett B. Fry, An Investi-gation of a Direct Side-Force Maneuvering System on a Deflected JetVTOL Aircraft, NASA TN D-.5175, Apr. 1969.
39. Fortenbaugh, R. L., Mathematical Models for the Aircraft OperationalEnvironment of DD-965 Class Ships, Vought Corporation Rept. No.2-55-8OO/8R-_3500, 26 Sept. 1978.-
40. McFadden, Norman M., Richard F. Vomaske, and Donovan R. Heinle, FlightInvestigation Using Variable-Stability Airplanes of Mininmm StabilityRequirements for High-Speed, High-Altitude Vehicles,, NASA TN D-779,Apr. 1961.
41. Craig, S. J. and I. L. Ashkenas, Backgroun Data and Recommended Revi-sions for MIL-F-8785B(ASG), "Military Specification-Flying qualitiesof Piloted Airplanes," Systems Technology, Inc. TR-169-1, Mar. 1971.
42. DiFranco,' Dante A., In-Flight Investigation of the Effects of Higher-Order Control System Dynamics on Longitudinal Handling Qualities,AFFDL TR-68-90, Aug. 1966.
43. Chalk, Charles R., David L. Key, John Kroll, Jr., Richard Wasserman, and'Robert C. Radford, Background Information and User Guide for MIL-F-83300- Military Specification - Flying Qqalities of Piloted V/STOLAircraft, AFFDL-TR-70-88, Mar. 1971.
44. Brigadier, W. J., forthcoming NASA TM (Ames Research Center).
46. Matranga, Gene J., Harold P. Washington, Paul L. Chenoweth, and William R.Young, Handling Qalities and Trajectory Requirements for TerminalLunar Landing. as Determined from Analog Silmationr NASA TN D-1921,Aug. 1963.
47. Garren, John F. Jr., Daniel J. DiCarlo, and Norman R. Driscoll, FlightInvestigation of an On-Of? Control for V/STOL Aircraft Under VisualConditions. NASA TN D-3439, Jun. 1966.
48. Walton, R. P., and I. L. Ashkenas, Analytical Review of Military Heli-coptr lyin Qlities, Systems Technology, Inc. TR-143-1, Aug.
TR-iii6-1 132
NADC-77052-30
"o.ll~ L. Stewart and Fred J. Dri-nkwater III, A Flight Determnination of,t he -Attitude Contrfqi Power and Damping Requirements for a VisualHovering Task in the Variable Stability and Control X-14~A ResearchVehicle, NASA TN D-1328, May 1962
90. Lollar, Thomas E. and Gerhard K. L. Kriechbaum., "VTEOL Handling QualitiesCriteria and Control Requirements - Ana-.ysis and Experiment," inJ. of the AHlS, Vol. 13, No. 3, July 1968, pp. 20-30.
51. Greif, Richard K., Emmett B. Fry, Ronald M. Gerdes, and Terrence D.Gossett, VTOL Control Systemn Studies on a Six-Degree-Of-FreedomMotion Sinmulator, NASA TM X-59065, 1966.
52. Preliminary Pilot Qualitative Evaluation of the XV-5A Research Aircraft,letter Report, Ai'my Aviation Test Activity (no number), Edwards AFB,
California, Oct. 28, 1965.
."3 aPlant, Porter II and Robert L. Baldwin,_Flight Evaluation of the53. LaXV-5A VSTIOL Aircraft, Air Force FTC-TR-66-30, Mar. 1967.
r;4. Gerdes. Ronald M., A Piloted Motion Simulator Investigation of VTOLHeight-Control Requirements, NASA TN D-2451, Aug. 1964'.
55. Kelly, James R., John F. Garren, Jr., and Perry L. Deal, Flight Investi-gation of V/STOL Height-Control Requirements for Hovering and L~ow-Speed Flight Under Visual Conditions, NASA TN D-3977, May 1967.
56. Obermeier, L., and J. Iles, USN/FMvOD FRG VAK-191B Joint Flight TestProgram, Vol., 3, Pilot Evaluations, NAVAIR-3R-76, Aug. 1976.
57. A'Harrah, R. C., and S. F. Kwiatkowski, "A New Look at V/STOL FlyingQualities," in Aerospace Engineering, Vol. 20, No. 7, July 1961,pp. 22-23, 86-92.
r,8. Cromwell, C. H., and I. L. Ashkenas, A Systems Analysis of LongitudinalPiloted Control in Carrier Approach, Systems Technology, Inc. TR-124-1, Jun. 1962.
59. Flying Qalities of Piloted V/STOL Aircraft, Military Specification,,* MIL-F-833oo, 31 Dec. 1970.
60. Vinje, Edward W., and David P. Miller, Analytical and Flight SimulatorStudies to Develop Design Criteria for VTIOL Aircraft Control SystemsAFFDL-TR-68-165, Apr. 1969.
TR-1 1 6-i 1335
DISTRIB"TION LIST
NADCO- -30
PE 62241N/WF 41-421
Copies Address
13 CommanderNaval Air Development CenterWarm nster, PA 18974
At.i: Mr. J. W. Clark, Jr. (6053) (10)Attn: Library (8131) - (3)
7 CommanderNaval Air Systems CommandDepartment of the NavyWashington, DC 20361
Attn: Ir. D. Kirkpatrick (ATR-32OD) - (I)Attn: Library (AIR-954) - (2)Attn: Mr. D. Hutchins (AIR-530112) - (i)Attn: (PMA-269) - (1)Attn: Mr. H. Andrews (AIR-O3PA) - (1)Attn: Mr. 0. Tsaparas (AIR-340D) - (I)
2 CommanderNaval Ship Research and Development CenterCarderock, im 2o034
Attn: Mr. p. Williams (Code 166o) - (1)Attn: Mr. J. Martin- (I
ChiefOffice of Naval Research1800 N. Quincy St.Arlington, VA 22217
Attn: Mr. P. Voriusen - (1)
SuperintendentNaval Postgraduate SchoolMbnterey, CA 93940
Attn: Dr. L Schmidt- (I )
CommanderNaval Weapons CenterChina Lake., CA 93555
2 ComnanderNaval Air Test CenterPatuxent %.ver, MD 20670|Attri: r. ', Traskr, s (S--3 (1
Attn: M-. A. Rossetti (SA-71) - (1I
Commanding ";eneralAr y Aviation System- Comman(I't. Tpuis, M 6310 2
4i Director I Rockell International.'ational Aeronautics and Space Administration too Angeles, CA 90053Ames Research Center:-bffett Field, CA 94035- 1 General Dynamics Corporation
Attn: %br. S. Ande:'son - (1) Ft. Worth, TX 761o8Attn- Mr. J Pranin - (1) Attn: Mr. 0. Joyce - (1)Attn.- Dr. J. V. L~bacqz - (1)Attn: Mr. 1. Statler (A'MRDL) - (1) 1 Fairchild-Republic Cjrporation
Farmingdale, NY 117351 Director
Jlattonal Aeronautics sa Space Administration 1 Lockheed California Co.Flight Re .isrch Center PO Box 551Edwards AFE, CA 93523 -Burbank, CA 91503
Attn, Mr. A. Ryrnes - (1)1 Director1 ':atlonal Aeronautics and space Administration 1 Northrop Corp.
tlaigley Research Center Hawthorne, CA 90250iasmpton, VA 23365 Attn: Dr. W. Martin - (1)
Attn: Rr. L. Taylor - (1)1 Lockheed Georgia Co.
I D .rector FMArietta, GA 30061AV;D/Es1=-C Attn: Mr. M. Jenkins-()WPAFR3Dayton, oH 41,33 2 Grumman Aerospace Corp.
12 Administrator Attn: Vr. A Whitaker (1C)Defense Documentation Center Attn: Mr. R. Msartorella iBldg. No. 5, Cameron StationAlexandria, VA 22314 1 Royal Aeronautical Establishment
BdodEngland UKC
3 .cDonnell Aircraft Co. - i)e ti.n Mr. 117 P.Ncos