K. Tanaka 1) , H. Takenaga 2) , K. Muraoka 3) , H.Urano 2) , C. Michael 1) , L.N. Vyacheslavov 4) , M. Yokoyama 1) O.Yamagishi 1) , S. Murakami 5) , A. Wakasa 6) and LHD Experimental group 1) National Institute for Fusion Science, 322-6 Oroshi, Toki, 509-5292, Japan 2) Japan Atomic Energy Agency 801-1 Mukouyama Naka Ibaraki, 311-0193, Japan 3) School of Engineering, Chubu University, 1200 Matsumoto, Kasugai, Aichi 487-8501 4) Budker Institute of Nuclear Physics, 630090, Novosibirsk, Russia 5) Department of Nuclear Engineering, Kyoto University, Kyoto 606-8501, Japan 6) Graduate School of Engineering, Hokkaido University, Sapporo, 060-8628, Japan Particle transport in LHD and comparisons with tokamaks ITPA CDBM and Transport meetings - Spring 2007 at EPFL Lausanne
Transcript
K. Tanaka1), H. Takenaga2), K. Muraoka3), H.Urano2), C. Michael1), L.N. Vyacheslavov4), M. Yokoyama1) O.Yamagishi1), S. Murakami5), A. Wakasa6) and LHD Experimental group
1) National Institute for Fusion Science, 322-6 Oroshi, Toki, 509-5292, Japan2) Japan Atomic Energy Agency 801-1 Mukouyama Naka Ibaraki, 311-0193, Japan3) School of Engineering, Chubu University, 1200 Matsumoto, Kasugai, Aichi 487-8501 4) Budker Institute of Nuclear Physics, 630090, Novosibirsk, Russia5) Department of Nuclear Engineering, Kyoto University, Kyoto 606-8501, Japan6) Graduate School of Engineering, Hokkaido University, Sapporo, 060-8628, Japan
Particle transport in LHD and comparisons with tokamaks
ITPA CDBM and Transport meetings - Spring 2007 at EPFL Lausanne
There is a similarity and dissimilarity between helical/stellarator and tokamak
Similarity
Both global energy confinements scaling (IPB98(y2) for tokamak and ISS04 for helical/stellarator) are similar and are Gyro Bohm like .
Dissimilarity
Shape of density profile.
The motivation of comparison study between helical/stellarator and
tokamak is to understand common underlined physics of transport.
0
0.5
1
1.5
2
2.5
PNBI=8.5MW PNBI=1MW
n e (10
19 m
-3)
0
1
2
3
4
5
0 0.2 0.4 0.6 0.8 1
Te
(keV
)
r/ a
0
1
2
3
4
5n e
(10
19 m
-3)
0
1
2
3
4
0 0.2 0.4 0.6 0.8 1
Te
(keV
)
r/ a
JT 60U Elmy H mode
LHD Rax=3.6m
Density scan at PNBI=8-10MW PNBI scan at similar averaged density
Different character of density profiles are observed in JT60U and LHD
Outline of talk
i) The brief overview of density profile of LHD
ii) Comparison between experimental particle transport coefficients and neoclassical ones
Is particle transport neoclassical or anomalous?
iii) Possible modeling and fluctuation behavior
iv) Comparison of peaking factor and collisionality dependence between LHD and JT60U
These differences are not due to particle fueling but due to transport characteristics.These differences are not due to particle fueling but due to transport characteristics.
0
1
2
3
0 0.5 1
8.5MW 2.7MW 1MW
Te(k
eV)
0
1
2
0 0.5 1
n e(x10
19m
- 3 )
1011
1012
1013
1014
Par
ticl
e So
urce
Rat
e (A
.U.)
Density profile of LHD changes from peaked to hollow.
PNBI=
Change of density profile in N-NBI heated plasma
Last closed flux surface Last closed flux surface
Magnetic axis position changes density profile as well.
Inward shiftedSmall magnetic helical ripple and reduced neoclassical transport
Outward shiftedLarge magnetic helical ripple and enhanced neoclassical transport
0
1
2
3Rax=3.50m, Bt=2.83T Rax=3.75m, Bt=2.64m
0 0.5 1
Te(k
eV)
0
1
2
0 0.5 1
n e(x10
19m
- 3 )
Magnetic axis position change magnetic helical ripple and higher ripple results in larger neoclassical transport
Position along Field Line
Mag
neti
c F
ield
+-
Helical ripple
Toroidal ripple
Trapped particle by the helical ripple
h_e
ff
t
Flux Surface
Orbit of guiding center
H C -I
Plasma
Helical coil
Shifts by external vertical field and Shafranov shifts
B contour
The particularity of helical/stellarator is enhanced neoclassical transport in low collision regime
Neo
clas
sica
l Tra
nsp
ort
co
effi
cien
t
Banana
regim
e
ei
Plateau regime
1/ regime
Future operation regime of reactor
Around one order
Experimental De,e
Around one order
helical/stellaratortokamaktokamak
Future operation regime of reactor
Neo
clas
sica
l Tra
nsp
ort
co
effi
cien
t
Plateau regime
ei
Experimental De,e
S. Murakami Nucl. Fusion 42 (2002) L19–L22
Axis Position Axis Position
Dne
o/D
toka
mak
pla
teu
Dne
o/D
toka
mak
pla
teu1/
regime
Plateau regimeIn 1/, neoclassical
transport is minimum at Rax=3.53m
In Plateau, neoclassical transport is smaller at more inward axis.
Dn
eo
*h
1)]/(/[ _2/3* qRvTeffhieh
5.12
_ effhtD
Dn
eo
ei*
h=1.0
3.63.75
3.9
3.53
Density profile tends to more peaked for higher collisionality and at more inward shifted configuration (smaller helical ripple)
heff 小
0.6
0.7
0.8
0.9
1
1.1
1.2
1.3
1.4
0.1 1 10 100
n e(0.2
)/<n
e>
*
h at =0.5
Rax=3.9mRax=3.75Rax=3.6m,Rax=3.53m,
Bt~1.5T
Inwar
d sh
ift
Small
er n
eocla
ssica
lPlateau
1/
H C -I
Plasma
Helical coil
B contour
Shifting by changing external vertical field
Inward Outward
Bt~1.5T
Is particle transport is neoclassical or anomalous?
The answer is Yes and NO.
0
1
2
3
NL
(x10
19m
-2)
(a)
S(
)
0
0.5
1
1.5
H
Inte
nsity
(A
.U.) (c)
0
100
200
300
400
Sto
red
Ene
rgy
(kJ)
(b)
0
5
10
15
0 1 2 3 4
Fue
ling
Rat
e (P
a m
3 /sec
)
t(sec)
(d)
0
0.5
1
1.5
-150-100-50050100150
0 5 10 15 20
R=3.669mR=3.939m phase
Am
pltit
ute
(A.U
.) Phase (degree)
f(Hz)
f=1/data length
Fuelling rate was controlled to modulate density with constant background.
The phase and amplitude was calculated by the FFT correlation analysis after subtracting background density.
Frequency signal of modulated components
Density modulation was done to study particle transport
3.0 3.5 4.0 4.5-1.5
-1.0
-0.5
0.0
0.5
1.0
1.5
R(m)
Z(m
)
Measured Cross Section
Modulation and equilibrium profiles are characterized by particle transports.
-10
0
10
20
30
40
Exp. Data Fitted Data
3.5 4R(m)
Inte
grat
ed M
odul
atio
n Ph
ase
(deg
ree)
0
0.5
1
1.5
3.5 4Inte
grat
ed M
odul
atio
n A
mpl
itude
(A.U
.)
R(m)0
0.5
1
1.5
2
0 0.5 1
n e(x10
19m
-3)
(a)
0.1
1
0 0.5 1
D(m
2 /sec
)
Dcore
Dedge
-2
-1
0
0 0.5 1V
(m/s
ec)
Vcore
Vedge
VnnD
Srrr
St
ne
1
D,V are determined to fit both modulation and equilibrium profiles
Modulation profile Equilibrium profile
Diffusion Convection
Analysis results are independent of absolute value of S.
Particle flux Particle source rate
Density modulation experiments shows Dcore is anomalous, outward Vcore is comparable with neoclassical one
Blank; Experiment, Colored; Neoclassical
10-3
10-2
10-1
100
101
0.1 1 10
h_core
Dco
re(m
2 /sec
)
Neo.
Exp.
Rax=3.6n, Bt=2.75, 2.8T
Rax=3.6n, Bt=1.49T
Rax=3.75n, Bt=1.5T
Rax=3.9n, Bt=1.54T
-1
0
1
2
3
0.1 1 10
h_core
Vco
re a
t =
0.7
(m/s
ec)
Inward
Outard
Dcore
Dedge
0.7
Vcore
Vedge0.7
1.0
10-3
10-2
10-1
100
101
0.1 1 10
h_core
Dco
re(m
2 /sec
)
Neo.
Exp.
This difference can be driven by turbulence
-1
0
1
2
3
0.1 1 10
h_core
Vco
re a
t =
0.7
(m/s
ec)
Inward
Outard
Exp. Neo.
At lower collisionality Dcore is close toDneo.
Dn
eo
*h
1* h
Inward Vcore is not neoclassical.
Plateau1/
0
5
0 0.5 1(
x1019
m-2
/sec
)
Out
war
dIn
war
d
Total particle fluxDiffusive fluxConvective flux
0
1
2
3
4
5
10-3
10-2
10-1
100
101
102
0 0.5 1
n e(x10
19m
- 3 )
Source R
ate (A.U
.)
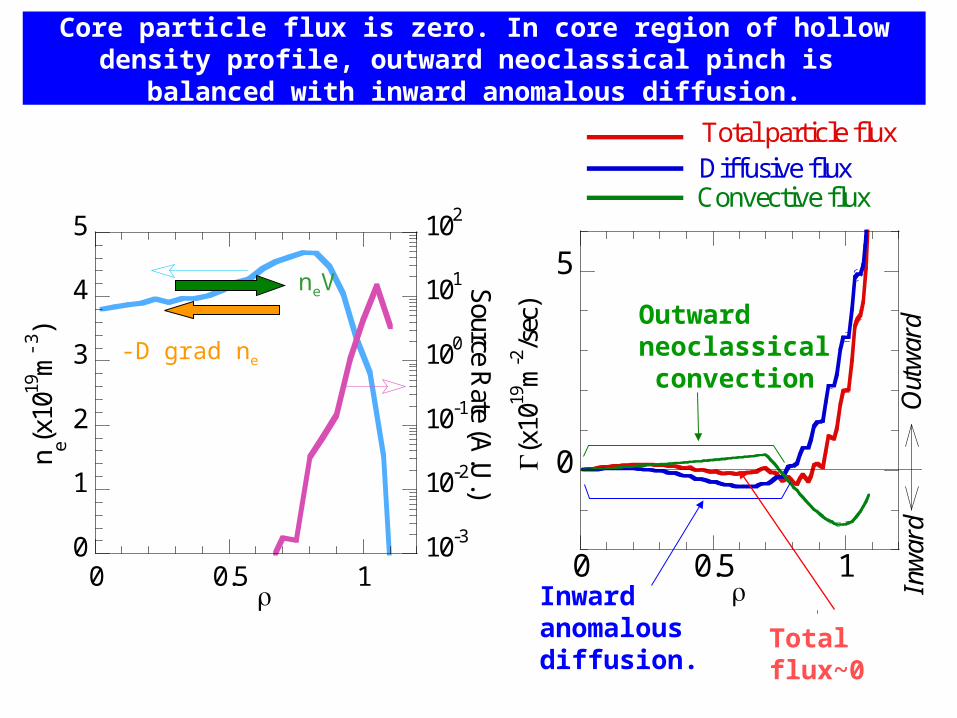
Core particle flux is zero. In core region of hollow density profile, outward neoclassical pinch is balanced with inward anomalous diffusion.
Outward neoclassical convection
Inward anomalous diffusion.
Total flux~0
-D grad ne
neV
0
1
2
10-3
10-2
10-1
100
0 0.5 1
n e(x10
19m
- 3 )
Source R
ate (A.U
.)-2
-1
0
1
2
3
0 0.5 1(
x1019
m-2
/sec
)
Total particle fluxDiffusive fluxConvective flux
Out
war
dIn
war
d
Anomalous dominated outward diffusion
Inward anomalous convection
Total flux~0
At reduced neoclassical configuration (inward shift configuration), peaked density profile is observed. Density profile can be determined by anomalous process
-D grad ne
neV
This is tokamak like.
According to gyro kinetic linear theory, the flux direction of quasi linear particle flux changes depending on density profile (Yamagishi, POP 14. 012505 (2007) )
~0 in core region, where particle source is zero.
Outward
Inward
In hollow density profile, ITG/TEM driven Q.L. flux in core is directed inward. This is consistent with that inward directed diffusion flux is anomalous from modulation experiments.In the peaked density profile, ITG/TEM driven Q.L. flux in core can be zero. This is tokamak like case
Strong Hollow
Peaking
Peaking
Calculation for LHDStrong Hollow
Weak Hollow
Te(
keV
)T
e(ke
V)
Q.L
. flu
x
/(
)2
n e(x1
019m
-3)
Weak Hollow
ITG/TEM is unstable at calculated data points.
For =0 condition, more peaked ne profile require more peaked Te profile. Hollow ne profile needs additional outward flux to satisfy =0
Q.L
. flu
x
/(
)2
1/Ln=-1/r dn/dr
Out
war
d F
lux
Inw
ard
Flux
Peaked Density profile
Hollow Density profile
LHD =0.8
=0 condition
Core fluctuation may play role on density profile shaping.Most of fluctuation components exists in ITG/TEM unstable region
Tokamak like. Turbulence transport produce peaked profile
Helical particular. Inward turbulence driven flux can be balanced with outward neoclassical
At high field (2.8T) inward shifted configuration, peaking factor of lower magnetic ripple in LHD shows similar trends to JT60U data
0.8
1
1.2
1.4
1.6
1.8
0.1 1
n e(r/a
=0.
2)/<
n e>
eff
(=0.5)
JT60U Elmy H mode 2~2.1TLHD Rax=3.5m (reduced neoclassical) 2.8T
LHD Rax=3.6m (enhanced neoclassical) 2.75, 2.8T
Lower ripple(Lower neoclassical)
JT60U; P-NBI, but beam source does not affect peaking.LHD;N-NBI and NNBI+ECH
De
eieff
At high field, neoclassical transport becomes smaller
0.8
1
1.2
1.4
1.6
1.8
1 2 3 4Te(0)/Ti(0)
n e(r/a
=0.
2)/<
n e>
LHD Rax=3.5m (reduced neoclassica) 2.8T
At low magnetic helical ripple configuration (reduced neoclassical -> at tokamak like configuration?), Te(0)/Ti(0) does not affects density peaking
This is against tokamak prediction (Garbet P.R.L (2003) 35001)
Summary
1. Density profile and particle transport in LHD show different characteristics with tokamak ones
2. Peaked density profiles are observed at inward shifted (smaller helical ripple and reduced neoclassical ) configuration and at lower collisionality (weak dependence)
3. Hollow density profiles are observed at outward shifted configuration (larger helical ripple and enhanced neoclassical) and at higher collisionality
4. In LHD, diffusion is anomalous, but outward convection is comparable with neoclassical values.
5. Qausilinear flux is inward directed in positive gradient region of hollow density profile. This can be balanced with outward directed neoclassical convection
6. Quasilinear flux can satisfy =0 condition for peaked density profile.
7. Fluctuation is dominated in the ITG/TEM unstable region
8. Te/Ti does not influence density profile on LHD at inward shifted reduced neoclassical configuration.
Gyro kinetic calculation was done for experimental ne and Te profile.
In hollow density profile, ITG/TEM Q.L. flux is inward directed and can be balance with outward directed neoclassical convection
In peaked profile, inward directed ITG/TEM flux can be balanced with outward directed neoclassical flux at <0.6.The neutral penetration length are almost identical for both profile, ~0 condition is same for both profile.
i) What flux balance is possible, where ITG/TEM is stable? ii) ~0 at <~0.9. Plasma boundary is ~1.2 due to the ergodic region. Inward directed flux is required for =0.6~0.9 in peaked profile.
iii) Can we rely one Q.L. flux. Turbulence is non linear status
Discrepancy of modulation and equilibrium coefficients
eqeqeq nVnD
incinc
eqeqeq
nVnD
δn
Γn δ
n
Γ δΓ
n
n
VnDn
n
Dn
VnV
n
nDn
n
D
nD
eqeq
eq
eqeqeq
eqeqinc
If flux is non linear, Deq,Veq are different from Dinc,Vinc
Equilibrium flux
Modulated flux
n
VnVn
n
Dn
VnV
n
nDn
n
D
nV
eqeq
eq
eqeqeq
eqeqinc
eqeq n/
eqeq nn /
Deq=Dinc
Veq=Vinc
eqeq n/
eqeq nn /
Dinc
Vinc
Deq
Veq
Increment value and equilibrium value can be different.
drnnnn calceIeIcalceReRradial 2
_exp_
2
_exp_
2
mod_~~~~
ch
calceIeIcalceReR dlndlndlndln2
_exp_
2
_exp_
2
intmod_~~~~
drnn calceqeqeq 2
_exp_
2
eqtotal weight 2intmod_
22
Radial
Integral
Equilibrium
Fitting Criteria
Presently simultaneous fitting is used
This is because modulation fitting is unstable due to localized amplitude at 10Hz. However, th え discrepancy between modulation and equilibrium coefficients should be examined.
Comparison of 2mod_int fitting and 2
total fitting
-10
0
10
20
30
40
3.5 4
Inte
grat
ed P
hase
(deg
ree) (c)
R(m)
0
0.5
1
1.5
Exp. Data total
Fitting mod_int
Fiitng
Inte
grat
ed A
mpl
itude
(A.U
.)
(a) (b)
3.5 4
(d)
R(m)
0
0.5
1
1.5
2
0 0.5 1
Reconstructed Profile total
Fitting 2
mod_int Fitting
n e(x10
19m
-3)
(a)
0 0.5 1
(b)
Modulation fitting Equilibrium fitting
Blue; Both modulation and equilibrium fitting
Green; Only modulation fitting
1MW5.2MW
1MW5.2MW
Fitted results
0.1
1
total
Fitting mod_int
Fitting
D(m
2 /sec
)
(a)
0.1
1
(b)
-2
-1
0
1
2
0 0.5 1
V(m
/sec
)
(c)
0 0.5 1-2
-1
0
1
2
(d)
0
0.5
1
Reconstructed Profile total
Fitting mod_int
Fitting
Rad
ial A
mpl
itude
(A
.U.) (a)
-100
0
100
0 0.5 1R
adia
l Pha
se (
degr
ee) (c)
(b)
0 0.5 1
(d)
Blue; Both modulation and equilibrium fitting
Green; Only modulation fitting
1MW5.2MW 1MW5.2MW
0
0.5
1
1.5
2
0
50
100
150
200
0 0.5 1
n e(x10
19m
- 3 )
Thom
son Signal (A
.U.)
0
0.5
1
1.5
2
2.5
0
50
100
150
200
0 0.5 1
n e(x10
19m
- 3 )
Thom
son Signal (A
.U.)
0
0.5
1
1.5
0
50
100
0 0.5 1
n e(x10
19m
- 3 )
Thom
son Signal (A
.U.)
0
0.5
1
1.5
0 0.5 1
Te(k
eV)
Rax=3.53m, Bt=1.45T,P
NB Co 1.7MW
0
0.5
1
1.5
0 0.5 1
Te(k
eV)
Rax=3.6m, Bt=1.49TPNB Co 2.7MW
0
0.5
1
1.5
2
2.5
0
50
100
150
200
0 0.5 1
n e(x10
19m
- 3 )
Thom
son Signal (A
.U.)
0
0.5
1
1.5
0 0.5 1
Te(k
eV)
Rax=3.75m, Bt=1.50TP
NBCtr. 3.3MW
0
0.5
1
1.5
0 0.5 1
Te(k
eV)
Rax=3.90m, Bt=1.54T,P
NBCO 5.2MW, Ctr. 3.1MW
At similar Te profile and By, density profile becomed more peaked at more inward shifted configuration
Inward shifted Small rippleReduce neoclassical
Outward shiftLarge rippleEnhanced neoclassical
0
0.5
1
1.5
0 0.5 1
Rax=3.75m, Bt=1.50T (large helical ripple)
Rax=3.53m, Bt=1.45T (low helical ripple)
Te(k
eV)
0
0.5
1
1.5
2
2.5
0 0.5 1
n e(x10
19m
- 3 )
Magnetic axis position changes density profile as well.
For tokamak configuration similar results are obtained (Yamagishi, POP 14. 012505 (2007) )
~0 in core region, where particle source is zero.
Outward
Inward
Strong Hollow
Peaking
Peaking
Calculation for tokamakStrong HollowWeak Hollow
Te(
keV
)T
e(ke
V)
Q.L
. flu
x
/(
)2
n e(x1
019m
-3)
Weak Hollow
ITG/TEM is unstable at calculated data points.
For the modeled profile, flux is non zero for pealed profile. For more peaked density profile, flux can be zero.