ANALY ECON for Cl YSIS OF E NOMIC AN United Prom limate Cha ECONOMIC EN D SOCIAL d Nations D oting Ene ange Mitig K CAL AND ERGY EFF D M L COMMIS Developme ergy Efficie gation and Case stud KUWA ENVIRON FICIENCY Developed Moncef Kr SSION FOR ent Accoun ency Inve d Sustaina dy AIT NMENTAL Y IN BUILD by: arti R WESTER nt project stments able Devel BENEFITS DINGS RN ASIA lopment S OF PRO OMOTING
Appendix A: Building Energy Conservation Code of Practice of 1983 and 2010 ................................. 35
Appendix B: Cost-Effectiveness of Optimal Energy Efficient Designs for Residences in Kuwait ....... 39
List of Figures
Figure 1: Per Capita Carbon Emissions for Selected Countries ....................................................................7
Figure 2: Per Capita Electricity Consumption for Selected MENA Countries (Source: IEA, 2006) ............8 Figure 3: Country Ranking and Level of Energy Consumption Subsidies per Person in US Dollars during 2011 (Source: Capital Standards, 2013) ........................................................................................................8
Figure 4: Annual per Capita Energy Use and Population Levels for Kuwait ...............................................9 Figure 5: Variation of Annual Electrical Peak Demand between 2002 and 2011 in Kuwait with Projected Peaks for 2020 and 2030 ............................................................................................................................ 10
Figure 6: Electrical Demand End-use Distribution in Kuwait during 2011 ............................................... 11 Figure 7: Monthly Electrical Load versus Monthly Average Outdoor Temperature for Kuwait in 2005 and 2011 ............................................................................................................................................................ 12 Figure 8: End-Use Distribution for a Kuwaiti Office Building Associated with (a) Annual Electricity Energy Consumption and (b) Electricity Peak Deamnd (Source: Krarti and Hajiah, 2011) ...................... 16 Figure 9: End-USe Distribution for a Kuwaiti Residence Associated with (a) Annual Electricity Energy Consumption and (b) Electricity Peak Demand (Source: Krarti and Hajiah, 2011)................................... 17 Figure 10: Life Cycle Cost Relative Ratio as a Function of Source Energy Savings for a Residence Located in Five Selected GCC Cities ....................................................................................................................... 19
Figure 11: Rendering for the Existing Kuwaiti House Energy Model Used in the Simulation Analysis .. 20 Figure 12: Maximum Percent Savings in Annual Energy Consumption for Some Energy Efficiency Measures Applied to an Existing House in Kuwait .................................................................................... 21
Figure 13: Annual Electrical Consumption for Five House Design Configurations .................................. 23 Figure 14: Annual Electrical Consumption Percent Savings by Applying Code 2010 on Code 1983 and Basecase House Configurations ................................................................................................................. 23 Figure 15: Impact of Market Share on the Economical and Environmental Benefits of the Building Energy Efficiency Retrofit Program ....................................................................................................................... 26
List of Tables
Table 1: Electrical Power Stations, their Capacity, and their Peak Load in Kuwait during 2011 .................9
Table 2: CO2 Emissions Intensity for Select MENA Countries ................................................................. 10
Table 3: Types and Number of Buildings in Kuwait at the end of 2011 .................................................... 11 Table 4: Comparative Summary of the Requirements for Kuwait Energy Conervation Code of Practice of 1983 and 2010 ............................................................................................................................................ 13
Table 5: General Characteristics and Annual Energy Use of Office Buildings in Kuwait ........................ 15 Table 6: List of EEMs for the Optimal LCC Case and Associated Initiated Costs and Annual Energy Use Savings ....................................................................................................................................................... 19
Table 7: Main Characteristics for 5 House Energy Models Considered in the Analysis ........................... 21 Table 8: Number, Annual Energy Use, and Peak Demand for all Building Types Considered in the Analysis .................................................................................................................................................................... 22
Table 9: Economical and Environmental Benefits for Level-1 Building Energy Efficiency retrofit Program for Kuwait Based on 2011 Building Stock Statistics ................................................................................. 24 Table 10: Economical and Environmental Benefits for Level-2 Building Energy Efficiency Retrofit Program for Kuwait Based on 2011 Building Stock Statistics ................................................................... 25 Table 11: Economical and Environmental Benefits for Level-3 Building Energy Efficiency Retrofit Program for Kuwait Based on 2011 Building Stock Statistics ................................................................... 25
Table 12: Average Costs for Energy Retrofits of Buildings in Kuwait (in US Dollars) ............................ 27
Table 13: Total Implementation Costs for Level-1 Building Energy Efficiency Retrofit Program ........... 28
Table 14: Total Implementation Costs for Level-2 Building Energy Efficiency Retrofit Program ........... 28
Table 15: Total Implementation Costs for Level-3 Building Energy Efficiency Retrofit Program ........... 28
Table 16: Cost-Effectiveness of Energy Efficiency Retrofit Programs for all Kuwaiti Building Stock .... 29 Table 17: Cost-Effectiveness of Energy Efficiency Retrofit Programs for only Private Residential Buildings in Kuwait .................................................................................................................................................... 29 Table 18: Employment Creation Impacts for Various Energy Sources from $1 Million of Expenditures (Source: Pollin et al., 2009) ........................................................................................................................ 30 Table 19: Number of Job Years that Could be Created from Building Energy Efficiency Retrofit Programs in Kuwait .................................................................................................................................................... 30
Acronyms
A/C: Air Conditioning
CFLs: Compact Fluorescent Lamps
COP: Coefficient of Performance
ECMs: Energy Conservation Measures
EEMs: Energy Efficiency Measures
GCC: Gulf Cooperation Council
HVAC: Heating, Ventilation and Air Conditioning
IEA: International Energy Agency
KD: Kuwaiti Dinar
KISR: Kuwait Institute for Scientific Research
LCC: Life Cycle Cost
MENA: Middle East and North Africa
MEW: Ministry of Electricity and Water
WWR: Window to Wall Ratio
Abstract In this report, an overview of the Kuwaiti energy sector characteristics is presented to include its generating capacity as well as its end-use consumption over the last two decade. Moreover, a detailed analysis of the total and end-use energy consumption attributed to various building types is provided. The report presents the specific regulations of the building energy conservation code of practice using its original version of 1983 and its revised version of 2010. The code enforcement mechanism is also outlined in the report. Based on a detailed review of the reported literature, the potential energy savings opportunities and their cost-effectiveness for Kuwaiti buildings are discussed. Using a comprehensive series of analyses, the report summarizes the economical and environmental benefits of improving energy efficiency for both new and retrofitted buildings in Kuwait. It is found that the 2010 revised version of the energy conservation code of practice can provide an additional 23% savings compared to the original version of the code developed and implemented in 1983. Moreover, it is found that without a gradual reduction of energy subsidies, the establishment of a mandatory energy efficiency retrofit program in Kuwaiti through implementation of basic energy efficiency measures and improved operating strategies for the existing building stock can provide significant economical and environmental benefits to Kuwait as well as the creation of significant job opportunities.
currently utption is expon by 2030ubsidies to may face enng daily pro
0.50
1.00
1.50
2.00
2.50
3.00
19
Ratio Relative 1992
shown in Fore than d
ubled from 991. The grcreased the the growing
Annual per
ination proce energy thah a combine(MEW, 201
al Power St
tion
Station
outh Station
orth Station
Station
t Station
outh Station
tion
s
tilizes almopected to in0, thus signiconsumers nergy shortaoduction at
992 1994
Figure 4. Thoubled bet1992 to 20
rowth in therequiremen
g residential
r Capita En
cess used inan surface fed capacity2).
tations, the
ost 300,000ncrease to ificantly redare estimatage during Subbiya po
1996 1998
Popu
he data obtatween 1980005 due toe populationts for elecl sector.
nergy Use
n Kuwait asfresh water
y of 13115
eir Capacit
2011
Capacity (MW)
120
660
600
1018
2381
4646
3690
13115
0 barrels of as high as ducing oil rted to exceethe summeower plant
2000 200
ulation
ained from M0 and 2005o high demon combinedctrical powe
and Popula
s well as inproductionMW servin
ty, and thei
Pe
f oils per d900,000 b
revenues ofed KWD 9 ber of 2014
and the So
2 2004 20
MEW indic5 (MEW, and in labod with higher generatio
ation Level
n most of thn. In 2011, Kng a peak l
r Peak Loa
eak Load on J (MW
120
540
600
770
172
411
336
112
ay for elecbarrels per f the countrbillion by 2and 2015 i
outh Az-Zou
006 2008
cate that the2012). Moor force af
h energy uson to meet
ls for Kuwa
he gulf regKuwait hadload of 112
ad in Kuwa
July 27, 2011W)
0
0
0
0
20
10
60
20
ctricity geneday or 20%ry. Moreov
2030. It is exif the projecur power p
2010
e energy useoreover, thefter the Iraqe by personthe nationa
ait
ion requiresd 8 electrica220 MW as
ait during
1
eration. The% of its oiver, the totaxpected thacts aimed a
plant by 500
e e q n al
s al s
e il al at at 0
megawattime (ME
Accordinin the MTable 2 countrieshigher thnatural gintensity.85% (IEA
Figure 5regressiodemand 2012). Bpredictedby 2030.
Figure
An
nu
al P
eak
Dem
and
tts each as wEW, 2012).
ng to an IEAMENA regio
summarizes during 20hat the worgas to gen. For instanA, 2012).
Tab
Cou
LibyKuwSauSyriUAJordTunQatEgyWor
5 illustrateson analysis oover the 1
Based on thd to be 15,0
e 5: Variati
0
2000
4000
6000
8000
10000
12000
14000
16000
18000
20000
2
(MW
)
well as the c
A study (IEon due to ites the CO2 09. Kuwait
rld average erate a sig
nce, the sha
ble 2: CO2
untry
ya wait udi Arabia ia E dan nisia ar
ypt rld (Averag
the annuaof the data 980’s peak
he rate of in000 MW by
ion of Annuwit
2002 2003
construction
A, 2012), Kts high reliaemissions
t generates of 573 gC
gnificant poare of natur
Emissions
ge)
al electricalindicates th
k with abouncrease of
y 2020 and
ual Electricth Projecte
y = 453R²
2004 2005
n of the Nor
Kuwait has ance on oilintensity e870 of gCO
CO2/kWh. Iortion of thral gas in th
Intensity f
CO
l peak demhat there is aut 6% avera
6% observover 20,00
cal Peak Deed Peaks fo
3.03x + 657² = 0.9846
2006 2007
rth Zour pow
one of the hl to producexpressed inO2 for eachIt should beheir electrihe total elec
for Select M
O2 emission(gCO2/k
872870757646358538494466573
mand variatia consistentage increasved in Figu0 MW (alm
emand betwor 2020 and
1.3
2008 2009
wer plants a
highest carbe electricityn gCO2/kWh kWh of ee noted thacity have ctricity gene
MENA Cou
ns intensitykWh) 2 0 7 1 1 1 8 4 6 3
ion from 2t growth rate rate in th
ure 5, the amost double
ween 2002 d 2030
2010 2011
are not impl
bon emissioy and desal
Wh for selecelectricity, sat countrieslow carbonerated in Q
untries
y
2002 througte of the elehe last decannual peake the current
and 2011 i
2020 2030
lemented on
ons intensityinate water
cted MENAsignificantly
that utilizen emissions
Qatar is ove
gh 2011. Aectrical peakade (MEW
k demand ist peak load
n Kuwait
0
n
y r. A y e s r
A k
W, s
d)
Figure 6 apartmenKuwaiti p
Table 3 lResidentistock wit
It shouldassociate
indicates thnt buildingspeak electri
Figure 6:
lists numberial buildingth about 87%
Table 3
Type
Private
Governm
Comme
Industri
Agricult
Services
Governm
Total
d be noteded with air
hat the resis, typically ical power i
: Electrical
r of each typgs either pr% of the tot
3: Types an
Residentia
mental Res
ercial
ial
tural
s
mental
d that a sigconditionin
dential sectreferred to
in 2011 (ME
Demand E
pe of buildiivate or gotal buildings
nd Number
N
al
sidential
gnificant png of buildin
tor (includino as investmEW, 2012).
End-use Dis
ings in the 2overnmentals in Kuwait
r of Buildin
Number of
390,2
1,44
45,6
1,8
4,5
93
7,5
452,2
ortion of tngs as clea
ng the privament buildi
stribution i
2011 existinl constitute t (MEW, 20
ngs in Kuwa
f Buildings
213
48
685
32
97
37
53
265
the electricrly illustrat
ately ownedings) const
in Kuwait d
ng building the vast m
012).
ait at the en
Percenta
86
0.
10
0.
1.
0.
1.
10
city demanded by Figur
d residencetitute over
during 201
stock servemajority of t
nd of 2011
age of Total
6.3%
.3%
0.1%
.4%
.0%
.2%
.7%
00%
d and consure 7 that co
es and renta57% of the
11
ed by MEWthe building
l
sumption isorrelates the
al e
W. g
s e
monthly electricity consumption in Kuwait as a function of monthly average outdoor temperature during both years of 2005 and 2011 using 3-parameter inversing modeling approach (Krarti, 2011). During winter months, the energy consumption remains low and flat and is mostly attributed to base-load demands such as lighting, plug loads, and other devices that are operated independently of the outdoor conditions. While, air conditioning energy consumption increases with increasing outdoor temperature during the summer. From 2005 to 2011, the electricity base-load consumption increased by about 36% in Kuwait from 2012.8 GWh to reach 2733.3 GWh mainly due to the increase in the number of buildings associated with growth in population and urbanization.
Figure 7: Monthly Electrical Load versus Monthly Average Outdoor Temperature for
Kuwait in 2005 and 2011
Several studies have indicated that Heating, Ventilation and Air Conditioning (HVAC) systems in buildings are the largest energy consumers in buildings in the GCC region including Kuwait. Indeed, air-conditioning accounts for almost 60% of the total energy use in a building in most GCC countries (Ventures, 2012). The market for HVAC systems in GCC countries is significant and was estimated at US$ 6.2 billion in 2011 with an annual growth of 3%. Most of the HVAC systems are made up of conventional air conditioning systems including air-handling units, chillers, pumps, and cooling towers. It has been estimated that the installation of energy efficient HVAC systems has the potential to reduce power consumption for air-conditioning by 35 to 40% in the GCC region (Ventures, 2012).
Current Building Energy Efficiency Policies Minimum requirements for efficient energy use in buildings have been enforced by the Ministry of Electricity and Water (MEW) sector for all new and retrofitted buildings since 1983, through an Energy Conservation Code of Practice which was prepared in accordance with the decision taken by The Council of Ministers in its session 18/80 dated April 20, 1980, that considered the fact that consumers pay only a fraction (5 to 10%) of actual cost of power and energy. The 1983 energy conservation code of practice specifies minimum thermal resistance for walls and roofs, size and quality for glazing, fresh air requirements, and performance standards for air-conditioning (A/C) systems. More importantly, the code sets the maximum allowable power for the A/C and lighting systems of buildings based on the application, area and type of A/C system. It has been reported that by implementing the code, buildings need 40% less cooling, and more than 40% less peak power and annual energy use. It has also been estimated that implementation of the
code, until 2005, resulted in over 2,530 MW savings of peak power, 1.26 million RT of cooling capacity, and nearly 131 million barrels of fuel. The estimated cost of these benefits is well over KD 2.25 billion, in addition to the reduction of over 55 million metric tons of CO2 in Kuwait’s environment (MEW, 2010). In 2010, a revised version of the energy conservation code of practice has been developed with more stringent requirements for energy efficiency for both new and retrofitted buildings in Kuwait. Table 4 provides a comparative summary of the features of both the recent version of the code of practice for energy conservation completed in 2010 and the original version issued and approved in 1983. As noted in Table 4, the 2010 code of practice has several additional requirements compared to the 1983 version. In particular, the 2010 energy conservation code of practice requires the use of thermal breaks for windows frames, more stringent window sizes and properties, use of programmable thermostats, use of more efficient air conditioning systems, and use of proven technologies such as variable speed drives, cool recovery units, and cool storage systems. Both codes are applicable to new residential and commercial buildings. The process of the implementation of the code of practice follows several regulations outlined in the following MEW documents:
MEW/R-1: Regulations for Electrical Installations MEW/R-2: Procedures for Approval of Electrical & A/C Drawings and connection of
power supply for construction and buildings projects. MEW/R-3: Electrical load form and explanatory memo MEW/R-4: Regulations for testing of Electrical installations before connection of power
supply MEW/R-5: General Guidelines for Energy Conservation in buildings MEW/R-6: Code of Practice for Energy Conservation in Kuwait building and Appendices MEW/R-7: Rules and Regulations for design of A/C System and Equipment MEW/R-8: Rules and Regulations for handing over Engineering Services (Electrical and
Mechanical) to the Maintenance Authority MEW/R-9: General specification for electrical installation
While, Kuwait Municipality inspect that the required thermal insulation levels, window sizes, and glazing types are properly installed, it is the responsibility of the Ministry of Electricity and Water (MEW) to ensure that the electrical and air conditioning systems requirements are met and will not approve the desired electrical power demand for buildings unless they meet the power density limit requirements set by the code of practice. The responsibility of each member of a design team of any new or retrofitted building is briefly summarized below:
1- Architect: ensures that the minimum requirement values for the building envelope components are met (such U-values of exterior walls and roofs, type of glazing for windows, and thermal breaks).
2- Mechanical design engineer: specifies HVAC systems to meet the regulations of the code of practice (outlined in MEW/R-6 and MEW/R-7). The HVAC contractor needs to obtain from MEW, a confirmation that the mechanical systems meet all the required regulations.
3- Electrical design engineer: is responsible to specify electrical systems that comply with MEW regulations (set by MEW/R-1, MEW/R-2, MEW/R-3, and MEW/R-6). The power available for the building is set by MEW and should be obtained by the electrical design engineer before tendering the project.
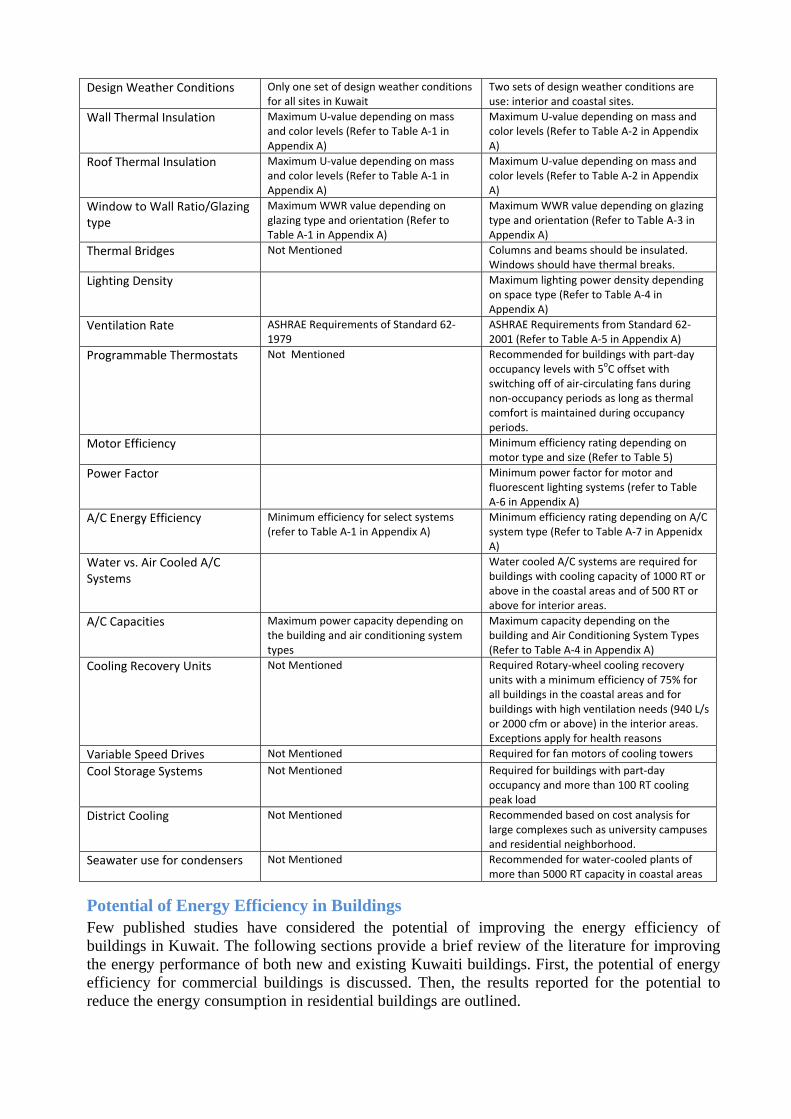
Table 4: Comparative Summary of the Requirements for Kuwait Energy Conervation Code of Practice of 1983 and 2010
Requirements Code of Practice 1983 Code of Practice 2010
Design Weather Conditions Only one set of design weather conditions for all sites in Kuwait
Two sets of design weather conditions are use: interior and coastal sites.
Wall Thermal Insulation Maximum U‐value depending on mass and color levels (Refer to Table A‐1 in Appendix A)
Maximum U‐value depending on mass and color levels (Refer to Table A‐2 in Appendix A)
Roof Thermal Insulation Maximum U‐value depending on mass and color levels (Refer to Table A‐1 in Appendix A)
Maximum U‐value depending on mass and color levels (Refer to Table A‐2 in Appendix A)
Window to Wall Ratio/Glazing type
Maximum WWR value depending on glazing type and orientation (Refer to Table A‐1 in Appendix A)
Maximum WWR value depending on glazing type and orientation (Refer to Table A‐3 in Appendix A)
Thermal Bridges Not Mentioned Columns and beams should be insulated. Windows should have thermal breaks.
Lighting Density Maximum lighting power density depending on space type (Refer to Table A‐4 in Appendix A)
Ventilation Rate ASHRAE Requirements of Standard 62‐1979
ASHRAE Requirements from Standard 62‐2001 (Refer to Table A‐5 in Appendix A)
Programmable Thermostats Not Mentioned Recommended for buildings with part‐day occupancy levels with 5oC offset with switching off of air‐circulating fans during non‐occupancy periods as long as thermal comfort is maintained during occupancy periods.
Motor Efficiency Minimum efficiency rating depending on motor type and size (Refer to Table 5)
Power Factor Minimum power factor for motor and fluorescent lighting systems (refer to Table A‐6 in Appendix A)
A/C Energy Efficiency Minimum efficiency for select systems (refer to Table A‐1 in Appendix A)
Minimum efficiency rating depending on A/C system type (Refer to Table A‐7 in Appenidx A)
Water vs. Air Cooled A/C Systems
Water cooled A/C systems are required for buildings with cooling capacity of 1000 RT or above in the coastal areas and of 500 RT or above for interior areas.
A/C Capacities Maximum power capacity depending on the building and air conditioning system types
Maximum capacity depending on the building and Air Conditioning System Types (Refer to Table A‐4 in Appendix A)
Cooling Recovery Units Not Mentioned Required Rotary‐wheel cooling recovery units with a minimum efficiency of 75% for all buildings in the coastal areas and for buildings with high ventilation needs (940 L/s or 2000 cfm or above) in the interior areas. Exceptions apply for health reasons
Variable Speed Drives Not Mentioned Required for fan motors of cooling towers
Cool Storage Systems Not Mentioned Required for buildings with part‐day occupancy and more than 100 RT cooling peak load
District Cooling Not Mentioned Recommended based on cost analysis for large complexes such as university campuses and residential neighborhood.
Seawater use for condensers Not Mentioned Recommended for water‐cooled plants of more than 5000 RT capacity in coastal areas
Potential of Energy Efficiency in Buildings Few published studies have considered the potential of improving the energy efficiency of buildings in Kuwait. The following sections provide a brief review of the literature for improving the energy performance of both new and existing Kuwaiti buildings. First, the potential of energy efficiency for commercial buildings is discussed. Then, the results reported for the potential to reduce the energy consumption in residential buildings are outlined.
PotentiaAl-Anzi energy uthese bui232 kWhconsumpcountries375 kWhand in Ho
Table
No.
1
2 M
3
4 B
5 B
6
7
8
9
Moreovewhole-buannual eKuwait. Fannual elAs clearlelectricalfraction o
al for Comm(2007) conse intensityildings rangh/m2/yr and
ption above s. For examh/m2/Yr (Toong Kong it
e 5: Genera
Building Type
Office Building
Mutli-Use Buil
Office Building
Bank Headquar
Bank Headquar
Office Building
Office Building
Office Building
Office Building
er, Krarti anuilding enerenergy use Figure 8 illulectricity coly indicatedl energy usof 26%, and
mercial Buinducted a sy. The resultged from abd 632 kWh400 kWh/m
mple, in the Uodesco, 199t is about 29
al Characte
e
g - Government
lding - Private
g - Private
rters - Private
rters - Private
g - Private
g - Government
g - Government
g - Private
nd Hajiah rgy simulat
associatedustrates theonsumptiond in Figure se and elecd 38% respe
(a) Ene
ildings survey of 9ts of the surbout 12,000h/m2/yr. M
m2/yr. This eUS the con96), while i92 KWh/m2
eristics and
Num
of Fl
t 2
1
1
1
3
2
t 1
t 6
1
(2011) havion of a wi
d to air-con end-use dis
n for a typic8, air-cond
ctricity peaectively with
ergy Use
9 commercirvey are sum
0 m2 to 46,0More than 2
energy use nsumption oin Australia2 (Lam et al
d Annual E
mber
loors
Condi
Floor
(m
24 33,
19 29,
12 16,
10 22,
32 13,
20 11,
10 31,
6 13,
18 46,
ve found thide range onditioning stribution ocal office buditioning repak demand hout accoun
ial buildingmmarized in000 m2, whi2/3 of the intensity isf a typical ha it is aboul., 2008).
nergy Use
itioned
r Area
m2)
Co
Ca
(T
000 1
519 1
855 4
695 1
310 4
545 4
267 7
238 4
230 1
hrough comof buildings of commer
of respectiveuilding in Kpresents a sfor the pro
nting for fan
(
gs in Kuwan Table 5. Tile the energsurveyed blarger than
high-rise ofut 254 kWh
of Office B
ooling
pacity
Tons)
A
El
Ene
(
,368 13,
,100 8,6
450 4,2
,030 5,3
438 8,4
450 4,6
750 13,
420 5,3
,300 17,
mbination othat electri
rcial buildinely the electKuwait (Krasignificant ototypical ons and pump
(b) Peak De
ait City to The conditiogy use rangbuildings h
n that reportffice buildin
h/m2/yr (CO
Buildings in
Annual
lectrical
ergy Use
(kWh)
E
p
(
,992,000
649,067
230,605
310,630
411,920
652,635
,507,344
348,152
,197,560
of energy aicity peak dings are sigtrical peak d
rarti and Haportion of office buildps.
emand
assess theioned area oged betweenhave energyted for otheng is around
OAG, 2012)
n Kuwait
nergy Use
per Floor
Area
kWh/m2)
424
293
251
234
632
403
432
404
372
auditing anddemand andgnificant indemand andajiah, 2011)both annuading with a
r f n y r d ),
d d n d ). al a
FigureElect
One of thAl-Ragomair-condireducing turning ocan be ac
More recenhancedconditionstrategies
1. R1sy
2. Imfl
3. Din
In all buibefore anenergy cocombined13.0% wwithout s Similar e170,000 improvedAfter thesavings ikW (or 2 A study with no consumpof annual
Reduction o3:00 and 14ystems. mproved colow rates as
De-lamping ncluding cor
ildings, peand after imponsumptiond peak dem
were achievesignificantly
enhanced om2 of spac
d controls, te implemenin energy us2.3% saving
by Al-Ajmor low cap
ption, while l energy con
al for Residd in Figur
ption in Kuon analysis, nergy consuly shown i
se Distriburgy Consum
empts to redthrough eneor area. Byion of the during non
annual energ
Mulla et alg strategiesrea of 4390
f cooling su4:00 during
ontrols afters well as turof spaces wrridors, lobb
ak demand aplementationn during sevmand was saed using ray affecting t
operating strce) in Kuwathe shoppinntation of tse is 9,919 M
gs).
mi (2012) shpital investmthe retrofittnsumption.
ential Buildre 5, resideuwait. Thro
Krarti and umption assin Figure 9
ution for a Kmption and
H
duce energyergy auditiny using freair-conditio-occupancygy consump
. (2013) has in eight 000 m2 and
upply durinweek days)
r occupancyning off anywhere excesbies, and pa
and energy n of the enhveral days daved for all
ather easy tothe indoor th
rategies havait by Al-H
ng mall conthe enhanceMWh/yr (or
howed that ment only ting ECMs
dings ential build
ough combiHajiah (201sociated to
9, air-condit
Kuwaiti Ofd (b) ElectrHajiah, 20
y use in exisng of a govee cooling oning systemy hours and ption.
ave describgovernme
d peak dem
ng one hour) by limitin
y period wiy non-essenss illuminatarking lots.
use savinghanced operduring one sl buildings.o implementhermal com
ave been imHadban et ansumes 84,0ed operatior 11.8% sav
non-retrofisaved 6.5%with signifi
dings accouination of 11) estimatea typical retioning rep
ffice Buildiricity Peak D11)
sting Kuwavernmental o
during them during thde-lamping
ed the resuntal buildi
mand of 29
r before theg the opera
ith changingntial lightingtion levels
s have beenrating stratesummer seaDaily ener
nt operatingmfort.
mplemented al. (2010). B000 MWh/yon strategiesvings) and a
itting energ% of an edficant capita
unt for aenergy auded the end-uesidence in resents a s
ng AssociaDeamnd (S
aiti buildingoffice builde winter (ehe non-occug, it is estim
ults of implngs with .3 MW. Th
e occupancytion of chill
g the tempeg fixtures. are observe
n achieved begies througason. Aboutrgy savings g strategies
in a large Before the
yr with a pes, it is estia reduction
gy conservatducational bl investmen
significant diting and wuse of electrKuwait as ignificant p
ated with (aSource: Kr
gs has been ding with 2economizer upied hours
mated that 2
lementing ta total cohe enhance
y period (ilers and air
erature setti
ed within th
based on dagh monitorint 8.90 MW s ranging fr
from all th
shopping implement
eak demand imated thatin peak dem
ation measubuilding annnt can save u
portion ofwhole-buildricity peak illustrated
portion of b
a) Annual arti and
reported by3,470 m2 ocycle) and
s as well as26% savings
three simpleombined aied operating
.e., betweendistribution
ings and ai
he buildings
ata obtainedng of hourly(or 30%) inom 3.2% tohe buildings
mall (abouation of theof 15 MW
t the annuamand of 345
ures (ECMsnual energyup to 49.3%
f electricityding energydemand andin Figure 9both annua
y f d s s
e r g
n n
r
s
d y n o s
ut e
W. al 5
) y
%
y y d
9. al
energy cofraction o
FiguElect
Using simof wall awindow-kWh/m2 model wiwall ratioenergy ef
Apyscin
Inth
Athgop
TgcocoInggbun
onsumptionof 48%, and
ure 9: End-tricity Ener
mulation anand roof into-wall ratiin Kuwait
ith no insulo, annual enfficiency m
As a result oeriods wereears. With chemes by nvestigated n order for hat is at leas
Another finahe retrofittiovernment ption.
The highly sovernment ost of retroonsumptionn 10 yearsovernment.overnment.uildings woational capa
n and electrd 64%, resp
(b)
-USe Distrirgy Consum
nalysis for 2nsulation anio is 10%) c
which is cation in the
nergy use saeasures. Thof the high
e very long. such long phomeowneto yield an retrofitting
st 650% higancing optioing cost. Wvaried from
ubsidized cwould seri
ofitting can n will provi, the savin This amou In additio
ould save 63acity
ricity peak dectively wit
Energy Use
ibution for mption and
H
2-story residnd reflectivecan decreascharacterize
walls and ravings of 25he study alsohly subsidiz
Even for thperiods, it irs. For thisacceptable to be cons
gher than theon was examWith this om 5 to 16 y
cost of electriously cons
be recoverde annual nngs of $57unt accountson, the pe36 MW of e
demand forthout accou
e
r a Kuwaiti d (b) ElectrHajiah, 20
dential builde double g
se the annuaed by a hot roof and wi50 kWh/m2
o found thatzed electricihe best caseis very diffis reason, altpayback pe
sidered fease current prmined in w
option, it wyears, and
ricity imposider retrofired in 6 yenational rev77 million s for the totaeak electricelectric pow
r both the vunting for fa
Residencericity Peak D11)
ding, Al-Raglass with ral energy co
and arid cth single cleor 46% cant: ity rates, ase of energy ficult to justternative preriod. sible, customrice, which i
which the gowas found it was 6 ye
ses a burdentting all old
ears. After venue of $13
(179 millioal cost of re
c load reduwer requirem
illa and theans and pum
(b) Dema
AssociatedDemand (S
gom (2003)educed winonsumptionclimate. Comear glazing n be achieve
s expected, saving, the tify implemricing polici
mers have tis 0.6 cents/
overnment pthat the pa
ears for the
n on the govd residentiathe sixth y36.26 millioon KD) caetrofitting thuctions duement, which
e office builmps.
and
d with (a) ASource: Kr
) has found ndow area n for a residmpared to and 23.5%
ed using bas
the custompayback pe
mentation ofies for elec
to be charg/kWh (2 filspays the fulayback pere most ener
vernment bual buildingsyear, savingon (42.27 man be realizhat is fully be to retrofh is 8% of t
lding with a
Annual arti and
that the use(so that the
dence to 293a base casewindow-to
sic envelope
mer paybackeriod was 37f retrofittingctricity were
ged at a rates/kWh). ll amount oriod for thergy efficien
udget. If thes, the initiags in energymillion KD)zed for theborne by thefitting thosethe installed
a
e e 3 e -e
k 7 g e
e
f e
nt
e al y ). e e e d
A recent study by Krarti and Ihm (2014) has indicated the potential of using proven energy efficiency measures to reduce the energy consumption of homes in various MENA countries. In the analysis, a sequential search optimization technique coupled with detailed energy simulation program are utilized to evaluate the most cost-effective energy efficiency measures that should be implemented for a prototypical residential building located in various sites within the MENA region. In the optimization analysis, a wide range of energy efficiency measures (EEMs) are considered including orientation, window location and size, glazing type, wall and roof insulation levels, lighting fixtures, temperature settings, and efficiencies of heating and cooling systems. A brief discussion of the options associated with each EEM is provided below:
Orientation defined by the azimuth angle between the true south and the front of the house. Seven options for the orientation are considered varying from 0o (baseline) to 270o.
Exterior wall and roof insulation defined by the thickness of polystyrene insulation. Four options are considered with a no insulation (R-value = 0) to 6-cm insulation (R-value = 3.0 W/m2.K).
Window size defined by the window-to-wall ratio (WWR). Four options are evaluated ranging from small windows (WWR=10%) to large windows (WWR=40%). The window to wall ratio (WWR) of the baseline building model is 25%.
Glazing type characterized by the number of panes and the coating type applied to the glazing surfaces. Six glazing types are considered in the analysis.
Lighting type defined by the lighting power density. Four lighting options are considered including (i) all fixtures are incandescent lamps (baseline with 7.3 W/m2), (ii) 1/3 of the fixtures are compact fluorescent lamps (CFLs) while the other remain incandescent lamps (i.e., 30% reduction in baseline lighting power density), (iii) 2/3 of the fixtures are CFLs while the other remain incandescent lamps (i.e., 50% reduction in baseline lighting power density), and (iv) all the fixtures are CFLs (i.e., 70% reduction in baseline lighting power density).
Air leakage level defined by the air infiltration rate. Four levels are considered: leaky (baseline with an infiltration rate of 0.7 L/s/m2), moderate leakage level with 25% reduction in baseline infiltration rate, good leakage level with 50% reduction in baseline infiltration rate, and tight level with 75% reduction in baseline infiltration rate.
Cooling temperature setting defined by the maximum acceptable indoor temperature needed to maintain thermal comfort. Three temperature settings are evaluated 24oC, 25oC, and 26oC.
Refrigerator energy efficiency level defined by its class label. Four options are considered: baseline with an annual use consumption of 800 kWh/year, refrigerator of class 3 with 30% reduction in baseline annual energy consumption, refrigerator of class 2 with 45% reduction in baseline annual energy consumption, and refrigerator of class 1 with 65% reduction in baseline annual energy consumption.
Boiler type defined by its energy efficiency level. Four energy efficiency levels are considered: 80% (baseline with low-efficiency), 85% (standard efficiency), and 90% (high efficiency), and 95% (premium efficiency consisting of a condensing boiler).
Cooling system type defined by its coefficient of performance or COP level. Four COP levels are considered: COP=2.6 (baseline with low-efficiency), COP=3.0 (standard efficiency), and COP=3.3 (high efficiency), and COP=3.5 (premium efficiency).
Figure 10 shows diagrams illustrating the optimal paths to design energy efficient residential buildings in five cities representative of climate features for GCC countries including Kuwait. It should be noted that the economic analysis (LCC) performed to obtain the optimization results of Figure 10 utilizes non-subsidized electricity generation costs. Appendix B provides additional results of the same study to illustrate the impact of both electricity prices and EEM implementation costs. As illustrated in Figure 10, optimal source energy savings for all the five cities ranging from
38% to 62% can be achieved while minimizing LCC values. Kuwait has the highest potential for energy use savings (62%). Table 6 lists the optimal package of EEMs and the initial costs that provide the minimal LCC value for all the five GCC locations considered in the analysis.
Figure 10: Life Cycle Cost Relative Ratio as a Function of Source Energy Savings for a Residence Located in Five Selected GCC Cities
Table 6: List of EEMs for the Optimal LCC Case and Associated Initiated Costs and Annual Energy Use Savings
Site, Country List of EEM for Optimal LCC Package
Initial Costs for all EEMs ($)
Annual Electrical Energy Use Savings [kWh, (%)]
Kuwait City, Kuwait 2‐cm Polystyrene Insulation in Walls and Roof; Tinted Bronze Glazing, CFL/LED lighting, Low air leakage, Premium efficiency AC (COP=3.3), Cooling Set Point = 26oC
$15,005 97,047 kWh (62%)
Riyadh (KSA) 2‐cm Polystyrene Insulation in Walls and Roof; Tinted Bronze
Glazing, CFL/LED lighting, Low air leakage, Premium efficiency AC (COP=3.3), Cooling Set Point = 26oC
$15,005 82,391 kWh (58%)
Doha (Qatar) Tinted Bronze Glazing, CFL/LED lighting, Low air
leakage, Premium efficiency AC (COP=3.3), Cooling Set Point = 26oC
AssessmWhile KubuildingsThus, a requiremconservafully imp In this sebuilding in energybuildings Analysis A whole Kuwait. house haenergy cequipmenconducte
Figure
The builconfigurathe 1983without abuildings
ah (Oman)
ment Analyuwait was ts in 1983, it
significantments of 198ation code oplemented in
ection, an astock to me
y use and pes considered
Approach: building siFigure 11 s
as 501 m2 (onsumptionnt operatio
ed by Al-Mu
11: Render
ding characations inclu code of prany fences os).
InsulaBronzelightinStand(COP=
CFL/LEDefficieCoolin
ysis Methothe first MEt took over t fraction
83 Energy Cof practice hn the new an
analysis is ceet the 2010eak demandd in this sec
mulation anshows rend(5390 ft2) on for the hoon are baseumin (2003
ring for the
cteristics ofuding, base cractice), codor neighbor
nalysis tool derings of thof total flooouse, schedued primaril).
e Existing K
f the housecase (as buide-2010 (mring building
nted L/LED kage, y AC g Set
ndard =3.0), 26oC
ry to develorevise the e
xisting builon code of pher slow aned buildings
to determinnservation cemissions s
ed on the wo
(i.e., eQUEhe house m
or area that ules that ouly on surv
Kuwaiti HoAnalysis
e energy moilt), worst c
meets the 20gs, and case
$12,715
op and impenergy conslding stockpractice. Tnd will mosts.
ne the impacode of pracsavings. Theork of Amee
EST) is utilimodel that i
is fully airutline peopl
vey data ob
ouse Energys
odel are sucase (no insu10 code of e B: with bo
lement enerservation cok in Kuwahe applicatit likely take
act of retrofctice exprese analysis aer and Krart
ized to mods considere-conditionele behaviorbtained for
y Model Us
ummarized iulation is uspractice) w
oth the fenc
30,592 (
rgy efficienode of practait complieion of the 2e some time
fitting existssed in termapproach forti (2014).
del an existied in this aned. In orderr, lighting sr 30 Kuwa
sed in the S
in Table 7 sed), code-
with two casces and the
(38%)
ncy code fotice in 2010es with the2010 energye before it is
ing Kuwaitms of savings
r residentia
ing house innalysis. Theto estimate
ystems, andaiti families
Simulation
for various1983 (meetsses (case Aneighboring
r 0. e y s
ti s
al
n e e d s
s s
A: g
Table 7: Main Characteristics for 5 House Energy Models Considered in the Analysis
Item Base Case Worst Case (Unisulated)
Code-1983 Code-2010 Case (A)
Code-2010 Case (B)
Ext. Wall U = 0.551 (W/m2.K)
U = 2.305 (W/m2.K)
U = 0.568 (W/m2.K)
U = 0.568 (W/m2.K)
U = 0.568 (W/m2.K)
Ext. Roof U = 0.693 (W/m2.K)
U = 0.693 (W/m2.K)
U = 0.397 (W/m2.K)
U = 0.397 (W/m2.K)
U = 0.397 (W/m2.K)
Window type Single
reflective Single clear
Double clear
Double reflective
Double reflective
Window over hang and fins
0.25 m over hang and
fins
No overhang and fins
No overhang and fins
No overhang and fins
0.25 m overhang and fins
Minimum outside air ventilation
0 0 0 According to
Table A-5 According to
Table A-5
Cooling COP 2 2 2 2.3 2.3 Lighting power density
9.7 W/m2 9.7 W/m2 15.07 W/m2 9.7 W/m2 9.7 W/m2
Fence Wall
2.50 m high fence walls
in all direction
No fence walls
No fence walls
No fence walls 2.50 m height
Neighbors
Two neighbors with 7.9 m height in front of
faces 2 & 4
No neighbors No
neighbors No neighbors
Two neighbors with 7.9 m height in
front of faces 2 & 4
Moreover, the simulation analysis includes the impact of several energy efficiency measures (EEMs) on the annual energy consumption of the house such as glazing type, windows size, temperature settings, and COP of the air conditioning system. Figure 12 shows the EEMs considered as well as their impact in reducing the energy use of the house. The improvement of the efficiency of the air conditioning system has the highest impact with a potential to reduce the annual electricity consumption for the house by up to 41% (Ameer and Krarti, 2014).
Figure 12: Maximum Percent Savings in Annual Energy Consumption for Some Energy Efficiency Measures Applied to an Existing House in Kuwait
0% 5% 10% 15% 20% 25% 30% 35% 40% 45%
COP of HVAC system
Exterior Wall Insulation
Cooling set point temperature
Glazing type
Lighting power density
Exterior Roof Insulation
Depth of overhang and fins
WWR
Orientation
Percentage of Annual Saving
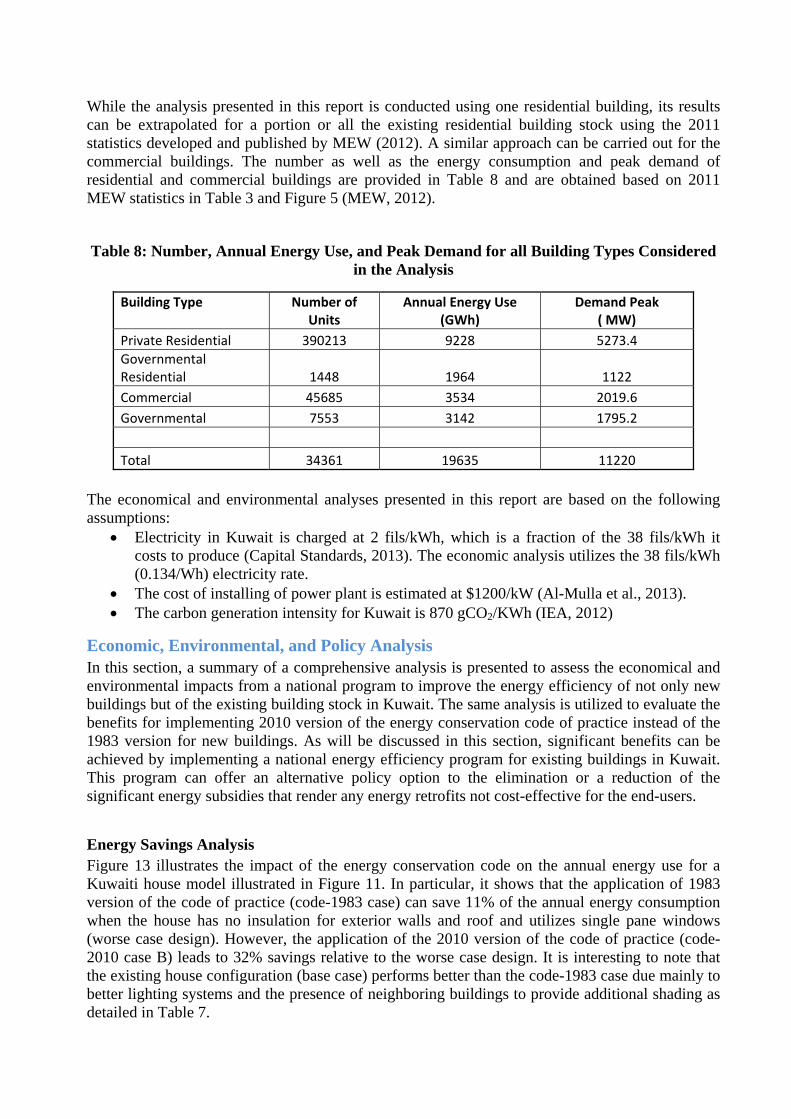
While the analysis presented in this report is conducted using one residential building, its results can be extrapolated for a portion or all the existing residential building stock using the 2011 statistics developed and published by MEW (2012). A similar approach can be carried out for the commercial buildings. The number as well as the energy consumption and peak demand of residential and commercial buildings are provided in Table 8 and are obtained based on 2011 MEW statistics in Table 3 and Figure 5 (MEW, 2012).
Table 8: Number, Annual Energy Use, and Peak Demand for all Building Types Considered in the Analysis
Building Type Number of Units
Annual Energy Use (GWh)
Demand Peak ( MW)
Private Residential 390213 9228 5273.4
Governmental Residential 1448 1964 1122
Commercial 45685 3534 2019.6
Governmental 7553 3142 1795.2
Total 34361 19635 11220
The economical and environmental analyses presented in this report are based on the following assumptions:
Electricity in Kuwait is charged at 2 fils/kWh, which is a fraction of the 38 fils/kWh it costs to produce (Capital Standards, 2013). The economic analysis utilizes the 38 fils/kWh (0.134/Wh) electricity rate.
The cost of installing of power plant is estimated at $1200/kW (Al-Mulla et al., 2013). The carbon generation intensity for Kuwait is 870 gCO2/KWh (IEA, 2012)
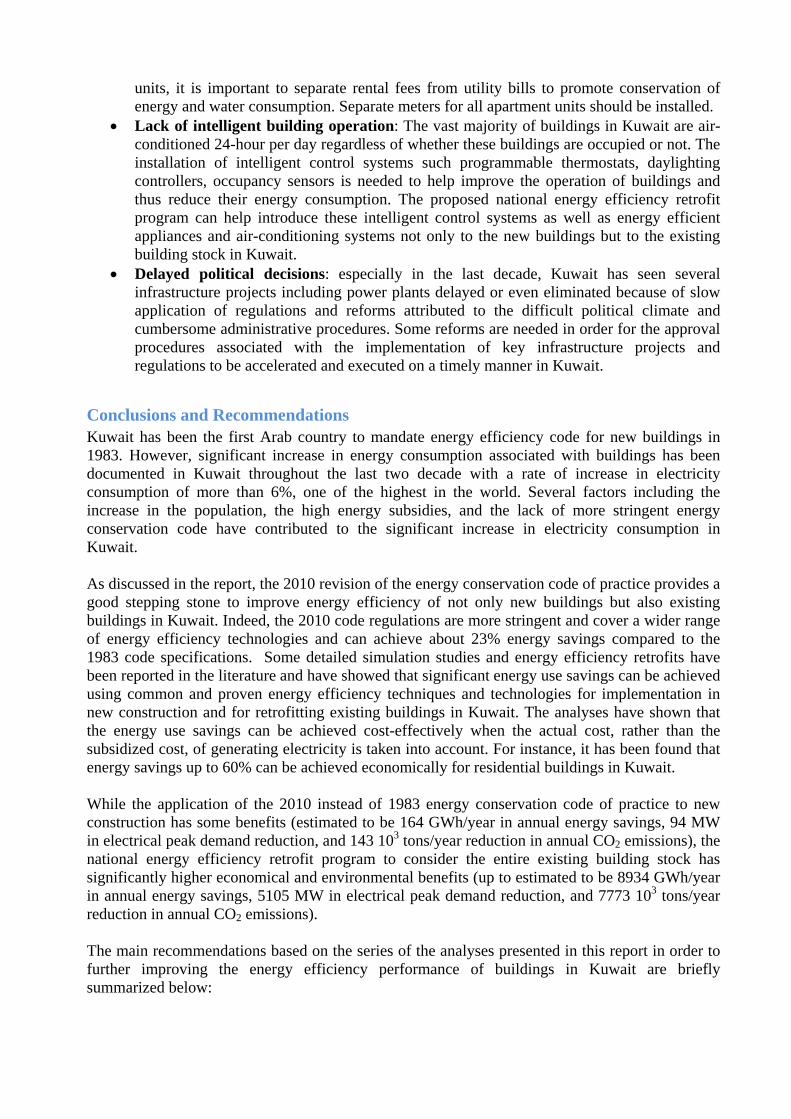
Economic, Environmental, and Policy Analysis In this section, a summary of a comprehensive analysis is presented to assess the economical and environmental impacts from a national program to improve the energy efficiency of not only new buildings but of the existing building stock in Kuwait. The same analysis is utilized to evaluate the benefits for implementing 2010 version of the energy conservation code of practice instead of the 1983 version for new buildings. As will be discussed in this section, significant benefits can be achieved by implementing a national energy efficiency program for existing buildings in Kuwait. This program can offer an alternative policy option to the elimination or a reduction of the significant energy subsidies that render any energy retrofits not cost-effective for the end-users.
Energy Savings Analysis Figure 13 illustrates the impact of the energy conservation code on the annual energy use for a Kuwaiti house model illustrated in Figure 11. In particular, it shows that the application of 1983 version of the code of practice (code-1983 case) can save 11% of the annual energy consumption when the house has no insulation for exterior walls and roof and utilizes single pane windows (worse case design). However, the application of the 2010 version of the code of practice (code-2010 case B) leads to 32% savings relative to the worse case design. It is interesting to note that the existing house configuration (base case) performs better than the code-1983 case due mainly to better lighting systems and the presence of neighboring buildings to provide additional shading as detailed in Table 7.
Figure 13: Annual Electrical Consumption for Five House Design Configurations
The potential annual energy use savings that can be achieved when an exsiting house (base case) is retrofitted to the 2010 energy conservation code of practice level are about 8% as shown in Figure 14. However, these savings increase to 23% when a house built using the 1983-code design specifications is retrofitted to the 2010-code design requirements through installing more energy efficient lighting system, glazing, and air conditioning system.
Figure 14: Annual Electrical Consumption Percent Savings by Applying Code 2010 on Code
1983 and Base-case House Configurations
Based on the analysis briefly outlined above and the available literature on potential energy use savings that can be achieved from retrofitting existing buildings in Kuwait (refer to the section entitled Potential Energy Efficiency in Buildings), it is highly recommended that MEW sets a national program to upgrade the energy efficiency for the existing building stock in Kuwait while continuing to require that any new building should be constructed to at least comply with the 2010 version of energy conservation code practice while working to establish more stringent regulations. Three levels of energy efficiency building retrofit program are suggested for Kuwait with different levels of economical and environmental benefits:
Level-1 of energy efficiency retrofit: in this case, the buildings are required to undergo basic or level-1 energy audit followed by implementing low-cost energy efficiency measures such installation of programmable thermostat, use of CLF or LED lighting, and weatherization of building shell to reduce air infiltration. The estimated savings from a level-1 retrofit program can range from 4% to 12% for all building types based on documented case studies for residential, commercial, and governmental buildings. In this analysis, average savings of 8% are considered for level-1 energy efficiency retrofits.
70000
80000
90000
100000
110000
120000
130000
Worst Case Code‐1983 Base Case Code‐2010(A)
Code‐2010(B)
Annual Consumption (kW
h)
0% 5% 10% 15% 20% 25%
Appling Code‐2010 on Code‐1983
Appling Code‐2010 on Base case
Percentage of Saving
Level-2 of energy efficiency retrofit: a standard or level-2 energy audit is required for this program in order to improve the building envelope components to meet at least 2010 energy conservation code of practice requirements as well as use of energy efficient cooling systems and appliances. Based on the analysis shown in Figure 13 as well as the exiting literature, average savings of 23% can be achieved for level-2 retrofit programs for all building types.
Level-3 of energy efficiency retrofit: for this program, detailed or level-3 energy audit is
required to perform deep retrofit of the buildings. A wide range of energy efficiency measures can be considered in this type of program including window replacement, cooling system replacement, use of variable speed drives, and installation of daylighting control systems. While, deep retrofits are typically costly, they can provide significant savings exceeding 50% as noted in the study of Ihm and Krarti (2014).
Economical and Environmental Analysis In this section, the economical and environmental benefits for the building energy efficiency retrofit program is assessed for residential, commercial, and governmental buildings using MEW statistics of 2011 for the building stock in Kuwait (MEW, 2012). The economical benefits are estimated using the cost of 38 fils/kWh for generating and distributing electricity (i.e., $0.134/kWh) rather than the subsidized rate of 2 fils/kWh (i.e., $0.006/KWh). The environmental benefits are estimated using the carbon emissions of 870 gCO2/kWh for Kuwait. Tables 9, 10, and 11 summarize the annual CO2 emissions savings (associated with reducing the amount of fuel needed to generate electricity), annual energy cost savings (associated with using less fuel to generate electricity), and the peak demand savings (associated with avoiding constructing new power plants) for respectively, Level-1, Level-2, and Level-3 building energy efficiency retrofit programs in Kuwait for various building types. As clearly shown in Tables 9-11, significant economical and environmental benefits can be achieved for all the levels of the retrofit programs. Higher benefits can be achieved for Level-2 and Level-3 programs compared to Level-1. However, these programs require higher investments as will be discussed in the Cost-Effectiveness Analysis section. The benefits are significantly higher for the residential buildings than for commercial or governmental buildings for any retrofit level. Indeed, 50% of the benefits can be achieved by solely retrofitting the residential buildings in Kuwait.
Table 9: Economical and Environmental Benefits for Level-1 Building Energy Efficiency retrofit Program for Kuwait Based on 2011 Building Stock Statistics
Building Type Annual Energy Use Savings (GWh/yr)
Peak Demand Savings (MW)
Annual CO2 Emissions Savings
(103 Tons/yr)
Annual Energy Cost Savings
($ Million/yr)
Peak Demand Savings
($ Million)
Private Residential 738 422 642 99 506
Governmental Residential
157 90 137 21 108
Commercial 283 162 246 38 194
Governmental 251 144 219 34 172
Total 1429 817 1244 192 980
Table 10: Economical and Environmental Benefits for Level-2 Building Energy Efficiency Retrofit Program for Kuwait Based on 2011 Building Stock Statistics
Building Type Annual Energy Use Savings (GWh/yr)
Peak Demand Savings (MW)
Annual CO2 Emissions Savings
(103 Tons/yr)
Annual Energy Cost Savings
($ Million/yr)
Peak Demand Savings
($ Million)
Private Residential 2123 1213 1847 286 1455
Governmental Residential 452 258 393 61 310
Commercial 813 465 707 109 557
Governmental 723 413 629 97 495
Total 4110 2348 3575 553 2818
Table 11: Economical and Environmental Benefits for Level-3 Building Energy Efficiency Retrofit Program for Kuwait Based on 2011 Building Stock Statistics
Building Type Annual Energy Use Savings (GWh/yr)
Peak Demand Savings (MW)
Annual CO2 Emissions Savings
(103 Tons/yr)
Annual Energy Cost Savings
($ Million/yr)
Peak Demand Savings
($ Million)
Private Residential 4614 2637 4014 621 3164
Governmental Residential
982 561 854 132 673
Commercial 1767 1010 1537 238 1212
Governmental 1571 898 1367 211 1077
Total 8934 5105 7773 1202 6126
It is expected that the implementation of the proposed building energy efficiency retrofit program to be gradual and to require several years for implementation due to the needed investments (refer to the Cost-Effectiveness Analysis section), and the lack of qualified energy efficiency contractors in Kuwait. However, the retrofit program can lead to significant economical and environmental benefits for Kuwait even if only a small fraction of the existing stock is targeted. Figure 15 illustrates the effect of market share (fraction of the building considered among the entire existing building stock) for implementing any level of the building energy efficiency retrofit program on annual savings of carbon emissions [i.e., Figure 15(a)], annual savings of annual energy costs [i.e., Figure 15(b)], and savings of peak demand costs [i.e., Figure 15(c)]. The benefits remain significant especially for retrofitting the existing residential buildings.
(a) Annual CO2 Emissions Savings
(b) Annual Energy Cost Savings
(c) Peak Demand Savings
Figure 15: Impact of Market Share on the Economical and Environmental Benefits of the Building Energy Efficiency Retrofit Program
It should be noted that over the last decade, the number of buildings in Kuwait has increased at an average annual rate of 4% mostly attributed to new buildings (MEW). Based on the existing building stock in 2011, the application of the 2010 instead of 1983 version of the energy conservation code of practice to only new buildings would lead to the following benefits (that can
0
500
1000
1500
2000
2500
3000
3500
4000
4500
10% 30% 50%
Annual CO2 emissions Savings (1000 Tons/Yr)
Market Share
Level‐1
Level‐2
Level‐3
0
100
200
300
400
500
600
700
10% 30% 50%
Annual Energy Cost Savings (Million $/Yr)
Market Share
Level‐1
Level‐2
Level‐3
0
500
1000
1500
2000
2500
3000
3500
10% 30% 50%
Peak Demand Cost Savings (Million $)
Market Share
Level‐1
Level‐2
Level‐3
be estimated from Figures 12-14 with a market share of 4% associated to Level-2 energy efficiency retrofit program):
164 GWh/year in annual energy savings 94 MW in peak demand reduction 143 103 metric tons/year in annual reduction of CO2 emissions
While these benefits are substantial, they are not significant when compared to the benefits associated with the retrofit of the entire existing building stock or even solely the existing privately owned residential buildings in Kuwait. In the next section, the implementation and the cost-effectiveness of mandatory national energy efficiency retrofit program for the entire Kuwaiti building stock is discussed.
Policy Design Considerations In this section, first the costs needed to fully implement the building energy efficiency retrofit program are evaluated. In this analysis, the particular costs attributed to updating the Kuwait buildings to meet the energy savings potential set by the 2010 energy conservation code of practice are estimated. Then, the cost-effectiveness of energy efficiency program is determined for various building types and levels of energy efficiency retrofit. The job creation potential associated with the energy efficiency retrofit program is also discussed in this section.
Cost-Effectiveness Analysis In order to assess the required investments needed to implement any of the three levels of building energy efficiency retrofit program, a cost-effectiveness analysis is carried out. It should be noted that these investments can be provided by the government of Kuwait at least in the first phase of implementation (for instance to jump start level-1 program for the first 10% of the residential buildings). Several techniques are now available to determine the best buildings for energy retrofits (Krarti, 2012). Other alternatives exist to implement the retrofit program including providing incentives and grants for energy retrofits while gradually eliminating energy subsidies. As noted in Figure 3, Kuwaiti government is currently providing about $3729 per person in energy subsidies. As discussed later, this amount is sufficient to perform Level-1 and even Level-2 energy retrofit for most residences in Kuwait. Instead of subsidies, the Kuwaiti government can provide in the form of grants of $1,000 or $5,000 for each homeowner to perform Level-1 or Level-2 energy retrofit. The cost of the implementation for each level of building energy retrofit depends on several factors including the building size and the physical conditions of the building energy systems. Based on various sources including cost of labor and materials in Kuwait, the average costs of completing energy retrofit for buildings are estimated (Krarti, 2011; Ihm and Krarti, 2014; and Ameer and Krarti, 2014). Table 12 summarizes these costs of implementation for any of the three level of energy retrofit specific to residential, commercial, and governmental buildings including costs for performing energy audits as well as for installing suitable energy efficiency measures.
Table 12: Average Costs for Energy Retrofits of Buildings in Kuwait (in US Dollars)
Building Type Level‐1 Level‐2 Level‐3
Private Residential $500 $5,000 $10000
Governmental Residential $500 $5,000 $10000
Commercial $10,000 $50,000 $100000
Governmental $30,000 $150,000 $300000
The total costs of implementation for each level of the building energy efficiency retrofit program to upgrade the existing building stock in Kuwait are provided in Table 13 (for Level-1), Table 14 (Level-2), and Table 15 (for Level-3). To retrofit the entire building stock, investments of $879 Millions, $5376 Millions, and $10571 Millions are required for respectively, Level-1, Level-2, and Level-3 of building energy efficiency retrofit program. While these amounts seem significant, the program is very cost-effective as noted in Table 16 for the entire building stock and Table 17 for only the private residential buildings. In fact, Level-1 retrofit program does not effectively require any investments since it provides sufficient savings from the reduction in electricity peak demand to avoid investing in additional power plants. For the residential buildings, Level-2 and Level-3 retrofit programs have a payback of 1.7 years and 1.2 years, respectively.
Table 13: Total Implementation Costs for Level-1 Building Energy Efficiency Retrofit Program
Building Type Number of Units
Per Unit Retrofit Cost ($/Unit)
Total Retrofit Cost (Million $)
Private Residential 390,213 500 195
Governmental Residential 1,448 500 1
Commercial 45,685 10,000 457
Governmental 7,553 30,000 227
Total 444,899 879
Table 14: Total Implementation Costs for Level-2 Building Energy Efficiency Retrofit
Program
Building Type Number of Units
Per Unit Retrofit Cost ($/Unit)
Total Retrofit Cost (Million $)
Private Residential 390,213 5,000 1951
Governmental Residential
1,448 5,000 7
Commercial 45,685 50,000 2284
Governmental 7,553 150,000 1133
Total 444,899 5,376
Table 15: Total Implementation Costs for Level-3 Building Energy Efficiency Retrofit Program
Building Type Number of Units
Per Unit Retrofit Cost ($/Unit)
Total Retrofit Cost (Million $)
Private Residential 390,213 10000 3902
Governmental Residential
1,448 10000 14
Commercial 45,685 100000 4569
Governmental 7,553 300000 2266
Total 444,899 10,751
Table 16: Cost-Effectiveness of Energy Efficiency Retrofit Programs for all Kuwaiti Building
Job Creation Analysis The other economical impact of the building energy efficiency retrofit program is the potential to create new jobs in Kuwait. Indeed, a study by Rockefeller Foundation (2012) has indicated that retrofit of existing buildings including replacing and upgrading energy consuming systems offer an important investment opportunity with significant economic and environmental impacts including high employment potential. Specifically, the study has found that $279 billion can be invested in retrofitting US residential, commercial, and institutional buildings with savings in energy costs of $1 trillion over 10 years (i.e., with an average payback period of less than 4 years) resulting in annual reduction by 30% in US electricity expenditures. When all the retrofits are undertaken, about 3.3 million jobs can be created throughout the US with the vast majority related to improve the energy efficiency of residential buildings. The job creation model used is based on a study by Pollin et al. (2009) which utilized survey data to estimate the number of direct and indirect full time job years that can be created by $1.0 million expenditures in the energy sector as outlined in Table 18 for various energy sources. For building retrofits, the direct effects consist of jobs created to implement the energy efficiency measures while the indirect effects are associated with the jobs needed to produce and supply energy efficiency equipment and materials. It should be noted that there are induced job creation associated with the direct and indirect effects, that is, the expansion of employment as the result of spending earnings from people who have acquired direct or indirect jobs. For the energy sector, it was found that the level of induced job-year creation is 40% of the level for direct and indirect job-year creation. Thus, the induced job years created from building retrofits are estimated at 4.9 per $1 million of expenditures. Most of the jobs created in building retrofits are in the construction and manufacturing industries with a wide range of pay level and technical specialization including electricians, HVAC technicians, insulation installers, energy auditors, building inspectors, and construction managers.
Table 18: Employment Creation Impacts for Various Energy Sources from $1 Million of Expenditures (Source: Pollin et al., 2009)
Energy Source Direct Job Creation per $1 million expenditures
(# job‐years)
Indirect Job Creation per $1 million expenditures
(# job‐years)
Direct and Indirect Job Creation per $1 million expenditures
(# job‐years)
Fossil Fuel Oil and Natural Gas Coal
0.8 1.9
2.9 3.0
3.7 4.9
Energy Efficiency Building Retrofits Mass Transit Smart Grid
7.0 11.0 4.3
4.9 4.9 4.6
11.9 15.9 8.9
Renewables Wind Solar Biomass
4.6 5.4 7.4
4.9 4.4 5.0
9.5 9.8 12.4
In order to have a rough estimate of the new job opportunities associated with the proposed energy efficiency retrofit programs, the job creation model of Table 18 is applied to Kuwait. It is found that up to 127,937 new job years can be created when retrofitting the existing building stock in Kuwait as illustrated in Table 19. As noted earlier, most of the jobs created will be associated with retrofitting existing and privately owned residential buildings.
Table 19: Number of Job Years that Could be Created from Building Energy Efficiency Retrofit Programs in Kuwait
Building Type Level‐1
Level‐2
Level‐3
Private Residential 2321 23217 46434
Governmental Residential
12 83 167
Commercial 5438 27180 54371
Governmental 2701 13483 26965
Total 10460 63974 127937
Barriers for Energy Efficiency Policies Implementation In Kuwait, several barriers exist to implement energy efficiency programs for buildings including more stringent mandatory building energy efficiency code for new buildings and a gradual mandatory national energy efficiency retrofit program as outlined in the previous sections. Among the most critical barriers for building energy efficiency in Kuwait are:
High energy subsidies: costs of producing electricity (as well as water) are heavily subsidized in Kuwait like most of GCC countries. Due to the artificially low prices, end users in Kuwait and GCC countries lack awareness and desire to conserve energy and water resources. It is recommended that the Kuwaiti government gradually reduce these energy and water subsidies.
Separate rent and utility bills: In Kuwait, it is common for landlords to combine rent with utility bills reducing any incentive for renters to conserve energy and water. Since there are over 2.8 million expatriates living in Kuwait needing to rent houses or apartment
units, it is important to separate rental fees from utility bills to promote conservation of energy and water consumption. Separate meters for all apartment units should be installed.
Lack of intelligent building operation: The vast majority of buildings in Kuwait are air-conditioned 24-hour per day regardless of whether these buildings are occupied or not. The installation of intelligent control systems such programmable thermostats, daylighting controllers, occupancy sensors is needed to help improve the operation of buildings and thus reduce their energy consumption. The proposed national energy efficiency retrofit program can help introduce these intelligent control systems as well as energy efficient appliances and air-conditioning systems not only to the new buildings but to the existing building stock in Kuwait.
Delayed political decisions: especially in the last decade, Kuwait has seen several infrastructure projects including power plants delayed or even eliminated because of slow application of regulations and reforms attributed to the difficult political climate and cumbersome administrative procedures. Some reforms are needed in order for the approval procedures associated with the implementation of key infrastructure projects and regulations to be accelerated and executed on a timely manner in Kuwait.
Conclusions and Recommendations Kuwait has been the first Arab country to mandate energy efficiency code for new buildings in 1983. However, significant increase in energy consumption associated with buildings has been documented in Kuwait throughout the last two decade with a rate of increase in electricity consumption of more than 6%, one of the highest in the world. Several factors including the increase in the population, the high energy subsidies, and the lack of more stringent energy conservation code have contributed to the significant increase in electricity consumption in Kuwait. As discussed in the report, the 2010 revision of the energy conservation code of practice provides a good stepping stone to improve energy efficiency of not only new buildings but also existing buildings in Kuwait. Indeed, the 2010 code regulations are more stringent and cover a wider range of energy efficiency technologies and can achieve about 23% energy savings compared to the 1983 code specifications. Some detailed simulation studies and energy efficiency retrofits have been reported in the literature and have showed that significant energy use savings can be achieved using common and proven energy efficiency techniques and technologies for implementation in new construction and for retrofitting existing buildings in Kuwait. The analyses have shown that the energy use savings can be achieved cost-effectively when the actual cost, rather than the subsidized cost, of generating electricity is taken into account. For instance, it has been found that energy savings up to 60% can be achieved economically for residential buildings in Kuwait. While the application of the 2010 instead of 1983 energy conservation code of practice to new construction has some benefits (estimated to be 164 GWh/year in annual energy savings, 94 MW in electrical peak demand reduction, and 143 103 tons/year reduction in annual CO2 emissions), the national energy efficiency retrofit program to consider the entire existing building stock has significantly higher economical and environmental benefits (up to estimated to be 8934 GWh/year in annual energy savings, 5105 MW in electrical peak demand reduction, and 7773 103 tons/year reduction in annual CO2 emissions). The main recommendations based on the series of the analyses presented in this report in order to further improving the energy efficiency performance of buildings in Kuwait are briefly summarized below:
1- Ensure that the energy conservation code of practice is updated at least once every 5 years to include more stringent regulations and proven energy efficiency technologies. This approach is common in most countries with well established building energy efficiency codes and standards. For instance, ASHRAE energy efficiency code in the US is updated every 3 years.
2- Start to implement gradually a mandatory energy efficiency retrofit program first for the residential building sector then for the entire existing building stock in Kuwait. Three levels of energy retrofit are evaluated in this report. It is found that a basic retrofit level (i.e., level-1 energy efficiency retrofit program) consisting of improving energy efficiency level of lighting and air conditioning systems can pay for itself through elimination of the capital costs needed for new electrical power plants.
3- Gradually reduce energy and water subsidies to ensure that deeper energy retrofit of existing building stock can become cost-effective even for building owners. Without any reduction in subsidies, level-2 and level-3 energy efficiency retrofit programs are now cost-effective for the Kuwaiti government, but not for the end users, due to the avoided costs of the subsidies as a result of the implementation of the measures. When the level of subsidies decreases, the measures become less cost effective for the government but more cost effective for the end users.
In addition to the significant economical and environmental benefits for improving the energy efficiency of both new and existing buildings in Kuwait, the energy retrofit program can create significant number of jobs in Kuwait (up to 127000 job years can created if all the building stock is retrofitted). The mandatory building energy efficiency retrofit program can be applied not only in Kuwait but in any GCC country that provides high energy subsidies. Similar economical and environmental benefits found for Kuwait can be obtained for other GCC countries.
References Al-Ajmi, A. 2012. Energy audit of an educational building in a hot summer climate, Energy and Buildings, 47, 122–130. Al-Anzi, A. 2007. Architectural and Energy Related Parameters of Office Buildings in the State of Kuwait, Proceedings of 8th International Conference on Multi-purpose High-rise Towers and Tall Buildings, Abu Dhabi, UAE. Al-Hadban, Y., Maheshwari, G.P., Al-Taqi, H., Al-Nakib, D. and Alasseri, R. 2010, Implementation of Energy and Power Saving Scheme in The Avenues Mall, Proceedings of the Tenth International Conference for Enhanced Building Operations, Kuwait, October 26-28, 2010. Al-Mumin, A., Khattab, O., and Sridhar, G., Occupants’ behavior and activity patterns influencing the energy consumption in the Kuwaiti residences, Energy and Buildings 35 549–559, 2003. Al-Ragom, F., 2002, Improving Operational strategies of an Institutional Building in Kuwait, Proceedings of the Second International Conference for Enhanced Building Operations, Richardson, Texas, October 14-18, 2002. Al-Ragom, F. 2003. Retrofitting residential buildings in hot and arid climates, Energy Conversion and Management 44 (2003) 2309–2319. Ameer, B. and Krarti, M. 2014. Assessment of Design Features of Residential Communities in Kuwait. Internal Technical paper, University of Colorado at Boulder, to be submitted to Energy and Buildings. Capital Standards, 2013, Kuwait Utilities Sector, A research study by Capital Standards, Safat, Kuwait. COAG, 2012, Baseline Energy Consumption and Greenhouse Gas EmissionsIn Commercial Buildings in Australia. Part 1. Report by Council of Australian Government, National Strategy on Energy Efficiency. IEA, 2006. World Energy Outlook. Report for the Organization for Economic Co-operation and Development , Paris, France. IEA, 2012. IEA Statistics: CO2 Emissions from Fuel Combustion, 2012 Edition. Report for the Organization for Economic Co-operation and Development , Paris, France. Ihm, P., and Krarti, M., 2012. Design optimization of energy efficient residential buildings in Tunisia, Building and Environment, 2012, 58(12), 81-90. Krarti, M., 2011, Energy Audit of Building Systems: An Engineering Approach, Second Edition, Francis and Taylor, CRC Press, Florida. Krarti, M. 2012. Weatherization of Residential Buildings, textbook, Taylor and Francis Publishing, New York, NY. Krarti, M. and Hajiah, A. 2011. Analysis of impact of daylight time savings on energy use of buildings in Kuwait, Energy Policy, 39 (5), 2319-2329.
Krarti, M. and Ihm, P. 2014. Design Optimization of Energy Efficient Residential buildings in MENA region, Proceedings of ASHRAE conference on hot and humid climates, Doha, February 24-27, 2014. Lam, J., Wan, K, Yang, L., 2008. Sensitivity analysis and energy conservation measures implications, Energy Conservation and Management, 49(2008), 3170-3177. MEW, 2010. Energy Conservation Code of Practice, MEW/R-6/2010, Second Edition, Ministry of Electricity and Water, Kuwait. MEW, 2011. Summary of the cost of production and distribution of electric power, by A. o. A.-C. o. P. Costs for the Ministry of Electricity and Water , Kuwait, 2010/2011. MEW, 2012. Statistical Year Book for 2011, report by the Ministry of Electricity and Water, Kuwait. Oxford Economics, 2009. Global Construction 2020: A global forecast for the construction industry over the next decade to 2020, report by Global Construction Perspectives and Oxford perspectives, London, UK.
Pollin, R., Heintz J., and Garrett-Peltier H. 2009. The Economic Benefits of Investing in Clean Energy. Report by the Center for American Progress, Political Economy Research Institute (PERI), University of Massachusetts Amherst, Amherst, MA. Rockefeller Foundation. 2012. United States Building Energy Efficiency Retrofits, Market Sizing and Financing Models. March 2012. Todesco, G. 1998. Efficiency through design integration. ASHRAE Journal, 40(6): 52-56. UN-Habitat, 2012. The State of Arab Cities 2012: Challenges of Urban Transition, United Nations Human Settlements Programme report, Second Edition, Kenya. Ventures, 2012. Heating, Ventilation and Air Conditioning (HVAC) Market in the GCC. Reprort By Ventures Middle East, July 2012. www.ventures-me.com. WBCSD, 2009. Energy Efficiency in Buildings: Transforming the Market. Report by the World Business Council for Sustainable Development. Washington, D.C.
Appendix A: Building Energy Conservation Code of Practice of 1983 and 2010
Table A-1: Requirements of 1983 Code of Practice for Building Energy Conservation Requirements Value
Maximum Lighting power 15 W/m2 (1.39 W/ft2)
Maximum DX Power 65 W/m2 (6.04 W/ft2)
Maximum power rating for A/C system 2 kW/RT at 48oC
(COP is about 2 at 35oC)
Glazing Type
WWR Window type
0 ‐ 10 Any type
11 ‐ 15 Any type of double glazing
More than 15
Type of double glazing is left to designer
and building owner to obtain required
W/m2
Maximum overall U in W/m2.K (Btu/h.ft2.F)
Wall Roof
Heavy Const.
Med. – light external color
0.568
(0.1)
0.397
(0.07)
Any other Const.
Should be reduced
to have the
equivalent thermal
gain
Should be reduced
to have the
equivalent thermal
gain
Table A-2: Maximum U-values for Walls and Roofs in Kuwait using 2010 Code of Practice
Construction Type* Umax for Exterior WallsW/m2.oC (Btu/hr.ft2.oF)
Umax for RoofsW/m2.oC (Btu/hr.ft2.oF)
Heavy Construction with medium‐light external Color 0.568 (0.100) 0.397 (0.070)
Heavy Construction with dark external Color 0.426 (0.075) 0.256 (0.045)
Medium Construction with medium‐light external Color 0.483 (0.085) 0.341 (0.060)
Medium Construction with dark external Color 0.426 (0.075) 0.199 (0.035)
Medium Construction with medium‐light external Color 0.426 (0.075) 0.284 (0.050)
Medium Construction with dark external Color 0.369 (0.065) 0.170 (0.030)* constructions are classified by their mass per unit area as follow: heavy (above 485 kg/m
2 for walls and above 245 kg/m
2 for roofs), medium
(between 245 and 480 kg/m2 for walls and between 125 and 240 kg/m
2), and light (below 240 kg/m
2 for walls and below 120 kg/m
2 for roofs)
Table A-3: Maximum Window-to-Wall Ratio for Glazing Types in Kuwaiti Buildings for 2010 Code of Practice
Glazing SHGC Tv U‐value Window‐to‐Wall Ratio (WWR)
Garages and Warehouses ‐ Enclosed parking spaces ‐ Auto repair rooms ‐ Warehouses ‐ Factory areas
5
1.5 1.5 0.05 0.10
7.5 7.5 0.25 0.50
Sports and Amusement Buildings ‐ Spectator areas ‐ Game rooms ‐ Swimming pools/deck areas ‐ Gymnasium areas ‐ Ballrooms ‐ Bowling alleys
150 70 30 100 75
15 25
20 25 25
8 13 10 13 13
0.5
2.5
Table A-6: Minimal Values for Power Factor and Efficiency Allowed for Electrical Motors and Lighting Fixtures for 2010 Code of Practice
Type of Electrical Motor and Lighting Fixture Minimum Value for Full‐Load Power Factor
Minimum Value for Full‐Load Motor Efficiency
(%)
Single‐Phase Motors (240 V; 1450 rpm; 50 Hz)
0.80 35‐80
Three‐Phase Motors (415 V; 1500 rpm; 50 Hz) ‐ 15 HP < Capacity < 50 HP ‐ 50 HP < Capacity < 100 HP ‐ 100 HP < Capacity < 200 HP ‐ 200 HP < Capacity < 400 HP ‐ Capacity > 400 HP
0.83 0.85 0.87 0.88 0.89
86‐89 89‐90 90‐91 93‐94 >94
Fluorescent and discharge Lamps 0.90 ‐
Table A-7: Maximum Values for Power Rating Allowed for Air-Conditioning (A/C) Systems based on 2010 Code of Practice
A/C System Capacity(RT)
Power Rating (kW/RT)
Chiller Cooling Tower Fan
Condenser Water Pump
Chiller Water Pump
Air Handling
Fan
Total A/C System
Ducted split and packaged
units
all
1.70
Air‐cooled all 1.60 0.05 0.35 2.00
Water‐cooled
< 250
250‐500 >500
0.95 0.75 0.70
0.04
0.06
0.07
0.38 1.50 1.30 1.25
Appen
Table B-the optimprototypiliving routilized tand a hgovernm
Impact ofThe cost
ndix B: Co
1 summarizmization anical home (
ooms and isto maintain heating set-
ment perspec
Figure B-1
of Utility Rat of electric
st-Effectiv
zes the basialysis of K(often, refers air condiindoor ther
-point of 2ctive. For de
Table
Number Floor
Floor-to-flExterior
WindoWindow-toNumber ofNumber of
CoolingHeating
1: Isometric
ates city to the c
veness of O
c characteriKrarti and Ih
rred to as ationed withrmal comfo22℃ duringetails, refer t
B-1: Charafam
of floorsr area
floor heightwall area
ow area o-wall ratiof bedroomsf bathroomsg Systemg System
c view of an
consumers
Optimal Ein Kuwa
istics of a phm (2014). a villa). Theh a split syort with a cog wintertimto Krarti an
acteristics omily residen
Split
n energy mo
is highly s
nergy Effiait
prototypical Figure B-1
e residentiaystem. Throooling set-pme. The annd Ihm (201
of a prototyntial buildi
2 sto221 m² (2
3 m (9381 m² (495.2 m² (
25% of all 32
system residenBaseb
odel for a pr
subsidized i
icient Desi
single-fami1 provides aal building oughout thepoint of 24℃nalysis is 4).
onsidered inering of theooms and 2hermostat isummertimet using the
building
s the impac
n e 2 s
e, e
ct
electricity costs, the effects of the increasing utility rates from 0% to 200% are analyzed in this section to determine optimal energy efficiency package for a residence in Kuwait. Figure B-2 provides LCC ratio to baseline LCC as a function of source energy savings for various increase levels of utility electricity rates when the residential building is located in Kuwait city. The optimal paths of LCC ratio as a function of source energy savings is affected significantly by the cost of energy. In particular, the optimal source energy savings is increased from 59% to 67% as the utility rates are increased from 0% to 200% as shown in Figure B-2. Meanwhile, the optimal LCC ratios are decreased from 0.75 to 0.53.
Figure B-2: Life cycle cost ratio as a function of source energy savings for Kuwait as a function of increase level of utility rates for five selected cities in the GCC
Impact of EEM costs Figure B-3 illustrates the optimal paths to design an energy-efficient residential building when the costs of EEM options are varied from -60% (reduction) to 60% (increase) for the prototypical residential building located in Kuwait. With higher EEM costs, optimal LCC ratios are increased while optimal source energy savings are decreased. Specifically, when the EEM implementation costs increase from 0 to 60%, the optimal LCC ratio increases from 0.75 to 0.83 and the optimal source energy savings are slightly reduced from 59% to 57%. However, when the EEM implementation costs decrease from 0 to -60%, the optimal LCC ratio is reduced from 0.75 to 0.57 and the optimal source energy savings are noticeably increased from 59% to 67%. Indeed, lower costs for EEM options results in additional energy efficient features to be cost-effective in designing residential buildings and consequently to higher source energy use savings and lower LCC values as shown in Figure B-3 for Kuwait.
0.5
0.6
0.7
0.8
0.9
1
1.1
0 10 20 30 40 50 60 70
LC
Cca
se/L
CC
bas
elin
e
Source energy saving [%]
Baseline 100% 200%
Figure B-3: Life cycle cost ratio as a function of source energy savings for a residential building in Kuwait and the cost of energy-efficient measure increase.