14
Entrepreneurship and Poverty Reduction in Rural America Nicholas Kacher & Stephan Weiler Colorado State University & REDI@CSU [email protected] [email protected]

Entrepreneurship and Poverty Reduction in Rural America
Nicholas Kacher & Stephan WeilerColorado State University & REDI@CSU
[email protected]@colostate.edu

Research Question(s)
• Does entrepreneurial business dynamism contribute to ’inclusive growth’ in rural America?– Employment growth, increases in median household
income, decreases in poverty rate
• By extension, should policy-makers incentivize entrepreneurship as a part of a development strategy?
Kacher 2
Context and Motivation(Regional) endogenous growth • Schumpeter (1942), Aghion & Howitt (1990), Krugman (1991), Lucas (1988) Romer (1990)
Regional divergence/convergence• Barro and Sala-i-Martin (1991), Blanchard & Katz (1992)
Metro/Nonmetro growth• Carlino & Mills (1987), Hammond & Thompson (2006), Muro & Whiton (2018
Importance of local information and innovation• Akerlof (1970), Lang & Nakamura (1993), Strumsky & Thill (2013), Audretsch & Keilbach (2004)
Dynamism• Hathaway and Litan (2014), Decker et al. (2013), Bunten et al. (2015), Shambaugh et al.
(2018), Haltiwanger et al. (2017), Alon et al. (2017)
Kacher 3
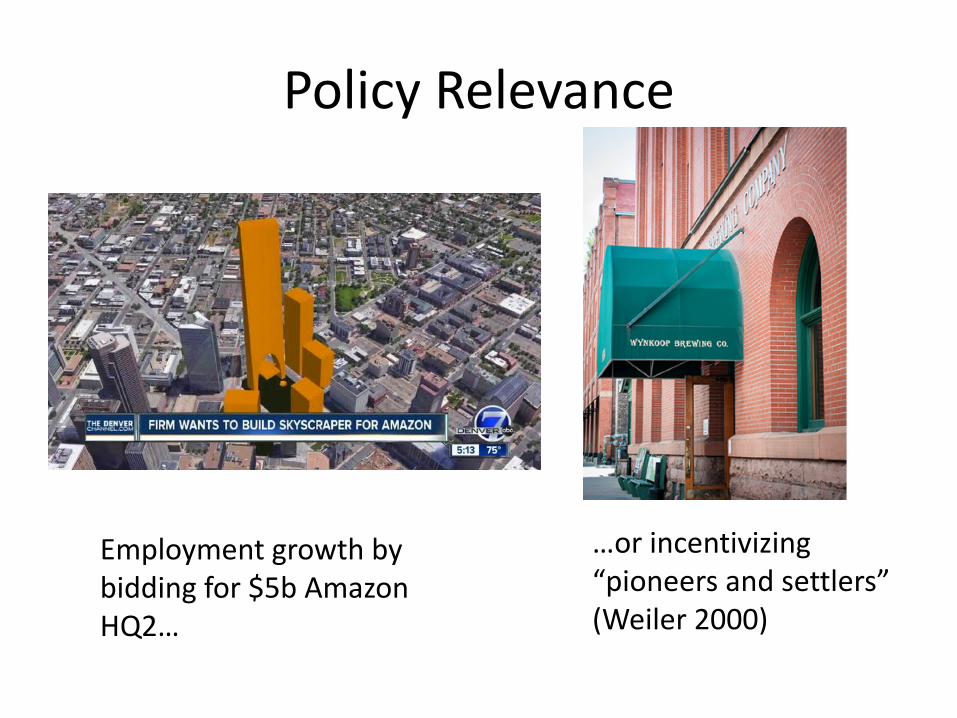
Policy Relevance
Employment growth by bidding for $5b Amazon HQ2…
…or incentivizing “pioneers and settlers” (Weiler 2000)

Data – County Panel, 2008-2014Variable SourcePercent employment growth Statistics of US Businesses
Change in percent of residents below poverty line
Small Area Income and Poverty Estimates
Median household income Small Area Income and Poverty Estimates
Establishment* openings and closures (calculated per 1000 employees)
Statistics of US Businesses
Employment by 6-digit NAICS sector, used to create Bartik instrument
Quarterly Census of Employment and Wages
Home price index – potential IV Federal Housing Finance Agency
Kacher 5
*Establishment: single physical location where business is conducted. Must have at least one employee.

Data Concerns• SAIPE data is a model-based estimate
– Uses “direct estimates from the American Community Survey… administrative records, postcensal population estimates and decennial census data”• IRS tax return data, SNAP participation, etc.
• Census advises against using SAIPE to compare poverty across areas– Panel structure helps control for correlated errors over time within a county
• Robustness check (in progress): SAIPE reports counties with a statistically-significant change in poverty rates– Logistic regression for increase/decrease in poverty rate by county
• FHFA house price index limitations– Uses only single family homes mortgaged or securitized by Fannie/Freddie– Repeat-sales methodology– Limited insight into rental prices, which may be an important determinant of
entrepreneurial activity
Kacher 6
Kacher 7
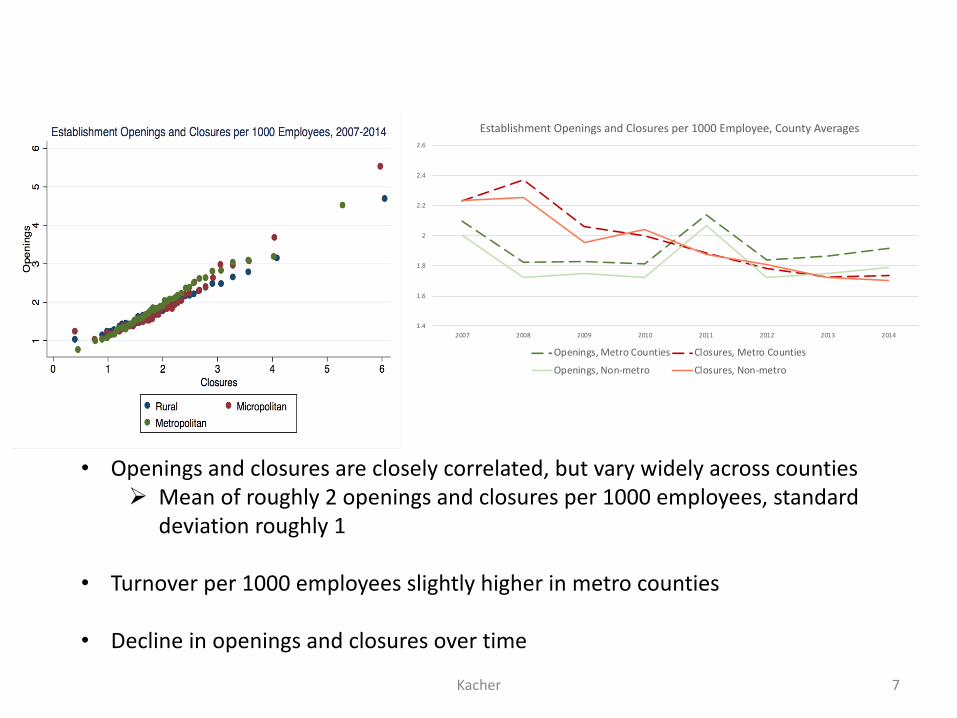
• Openings and closures are closely correlated, but vary widely across countiesØ Mean of roughly 2 openings and closures per 1000 employees, standard
deviation roughly 1
• Turnover per 1000 employees slightly higher in metro counties
• Decline in openings and closures over time
1.4
1.6
1.8
2
2.2
2.4
2.6
2007 2008 2009 2010 2011 2012 2013 2014
Establishment Openings and Closures per 1000 Employee, County Averages
Openings, Metro Counties Closures, Metro CountiesOpenings, Non-metro Closures, Non-metro
Kacher 8
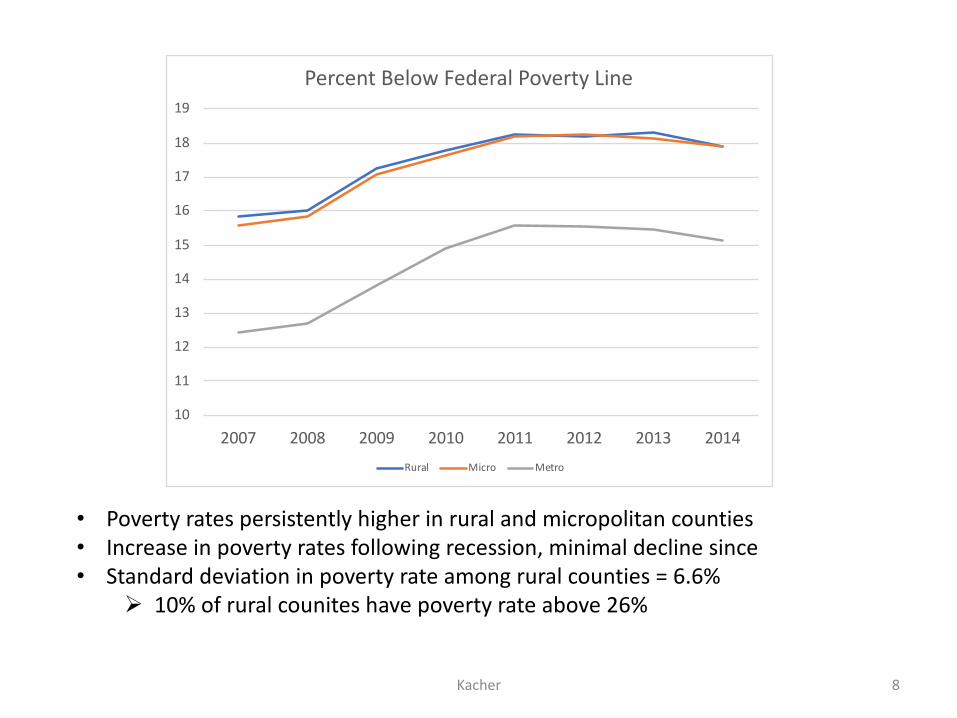
• Poverty rates persistently higher in rural and micropolitan counties• Increase in poverty rates following recession, minimal decline since• Standard deviation in poverty rate among rural counties = 6.6%
Ø 10% of rural counites have poverty rate above 26%
10
11
12
13
14
15
16
17
18
19
2007 2008 2009 2010 2011 2012 2013 2014
Percent Below Federal Poverty Line
Rural Micro Metro

Theory
• Openings: direct beneficial impact growth, and potentially on median income and poverty reduction
• Closures: direct negative impacts
• Openings*Closures (“dynamism”): possible indirect effects– Positive: information spillovers (Bunten et al. 2015)
– Negative: Frictional unemployment, increased perceptions of risk or uncertainty in other establishments
• Effects may vary across urban/rural counties
– Denser counites could ease transmission of information, but a marginal piece of information may be more valuable in a ‘thin’ market
Kacher 9
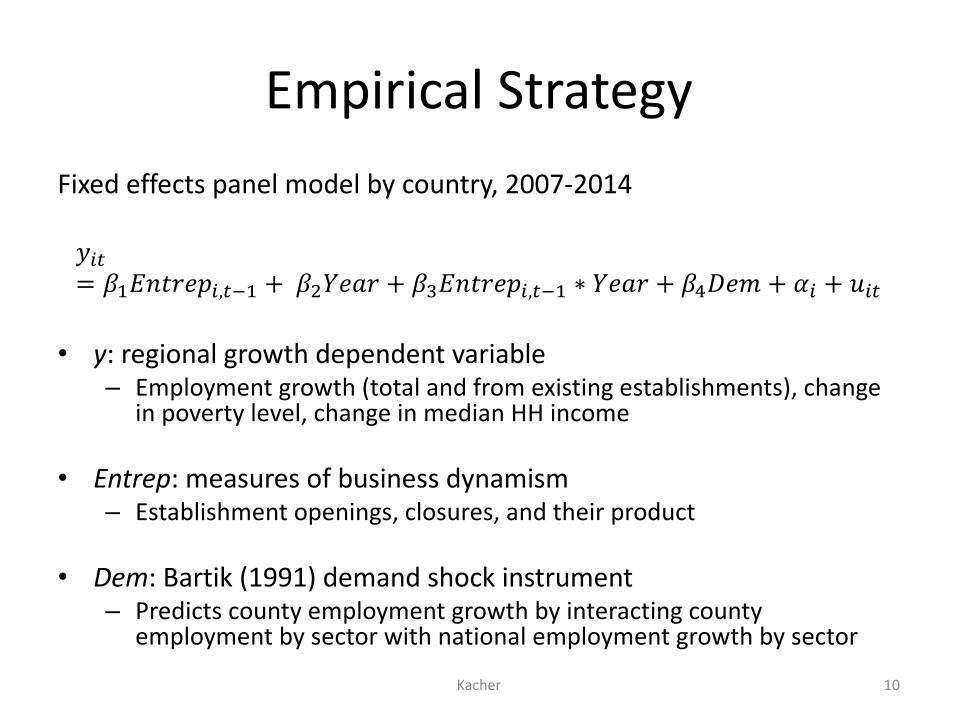
Empirical StrategyFixed effects panel model by country, 2007-2014
!"#= %&'()*+,",#.& + %01+2* + %3'()*+,",#.& ∗ 1+2* + %56+7 + 8" + 9"#
• y: regional growth dependent variable– Employment growth (total and from existing establishments), change
in poverty level, change in median HH income
• Entrep: measures of business dynamism– Establishment openings, closures, and their product
• Dem: Bartik (1991) demand shock instrument– Predicts county employment growth by interacting county
employment by sector with national employment growth by sector
Kacher 10

ResultsI II III IV V VIPercent Employment Change
Percent Employment Change
Change in Median Household Income
Change in Median Household Income
Change in Poverty Rate
Change in Poverty Rate
Openings per 1000 employees
2.872***(0.360)
2.658***(0.447)
-492.8*(285.8)
397.7**(182.3)
-0.460**(0.182)
-0.397**(0.166)
Closures per 1000 employees
-4.220***(0.284)
-3.300***(0.340)
-1069.0*** (208.2)
-115.7(161.1)
0.294** (0.134)
0.0826(0.147)
Opening rate * closure rate
0.111(0.0728)
0.112*(0.0654)
178.8***(52.23)
-12.19(34.71)
0.0378(0.0279)
0.0310(0.0252)
Demand Shock 2.368*(1.265)
1.261(5.011)
1224.4(834.8)
1527.4(1364.4)
-1.064(0.655)
-1.188(0.912)
Constant -3.096**(1.467)
-4.086(5.059)
-490.9(947.4))
-3058.3** (1411.3)
2.165***(0.755)
2.710***(0.953))
Counties All Rural All Rural All RuralN 20,392 10,444 17,557 9,011 17557 9,011adj. R-squared 0.533 0.234 0.334 0.132 0.156 0.071
Cluster-robust standard errors in parenthesesCounty and year fixed effects and location quotient controls used in all specifications* p<0.1, ** p<0.05, *** p<0.01Fixed effects panel regression with one-year lags on all independent variables
Kacher 11
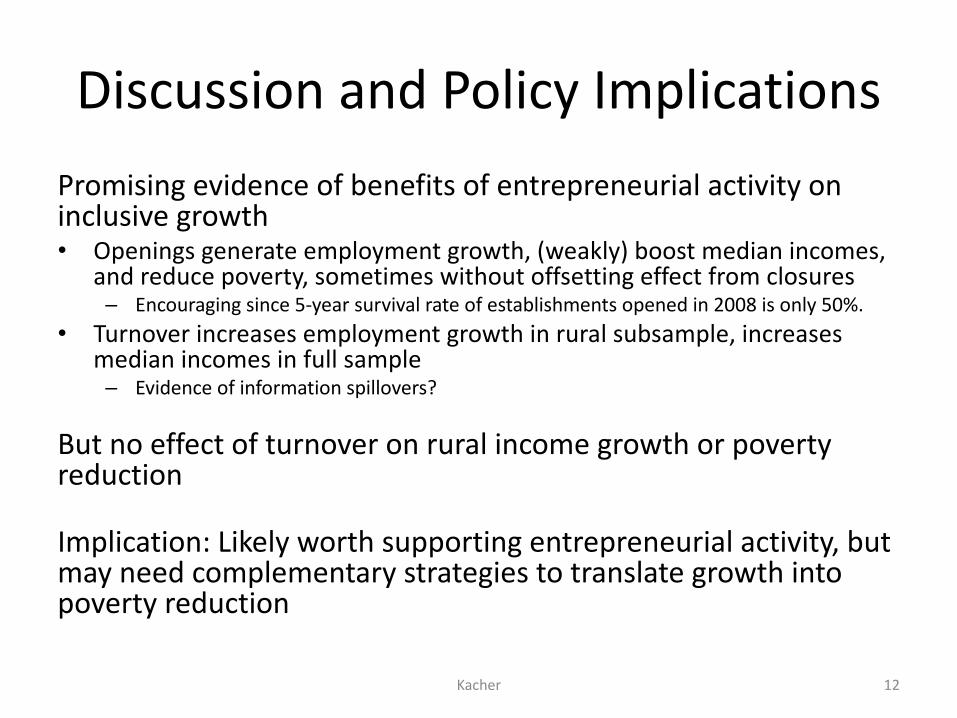
Discussion and Policy ImplicationsPromising evidence of benefits of entrepreneurial activity on inclusive growth• Openings generate employment growth, (weakly) boost median incomes,
and reduce poverty, sometimes without offsetting effect from closures– Encouraging since 5-year survival rate of establishments opened in 2008 is only 50%.
• Turnover increases employment growth in rural subsample, increases median incomes in full sample– Evidence of information spillovers?
But no effect of turnover on rural income growth or poverty reduction
Implication: Likely worth supporting entrepreneurial activity, but may need complementary strategies to translate growth into poverty reduction
Kacher 12
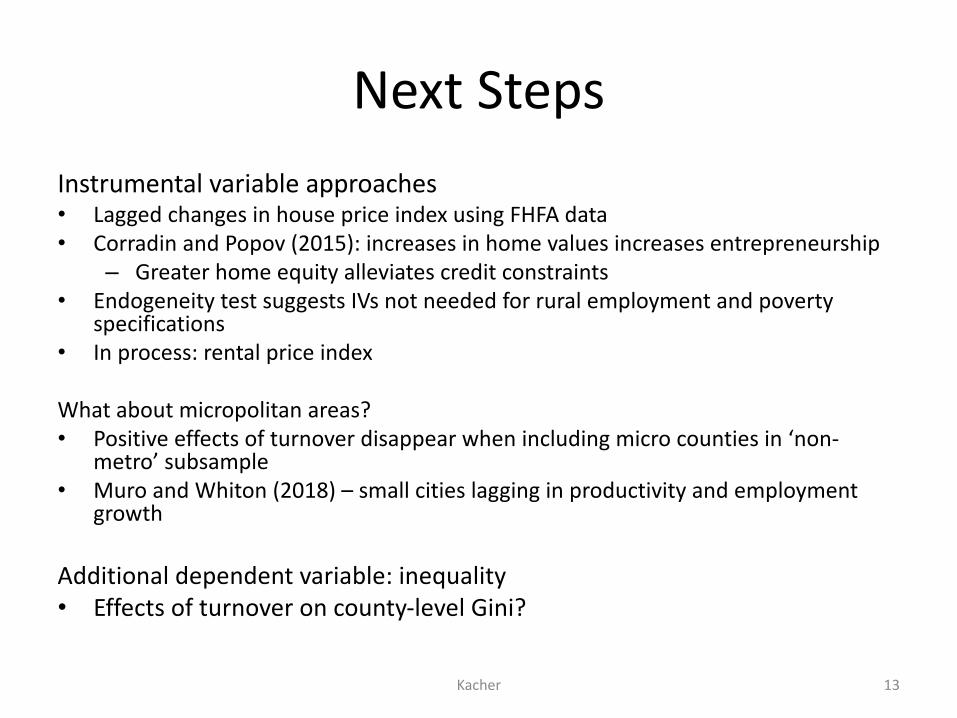
Next Steps
Instrumental variable approaches
• Lagged changes in house price index using FHFA data
• Corradin and Popov (2015): increases in home values increases entrepreneurship
– Greater home equity alleviates credit constraints
• Endogeneity test suggests IVs not needed for rural employment and poverty
specifications
• In process: rental price index
What about micropolitan areas?
• Positive effects of turnover disappear when including micro counties in ‘non-
metro’ subsample
• Muro and Whiton (2018) – small cities lagging in productivity and employment
growth
Additional dependent variable: inequality
• Effects of turnover on county-level Gini?
Kacher 13