58
1 Kafka Performances Brice Leporini brice@confluent.io Florent Ramière florent@confluent.io
2
3
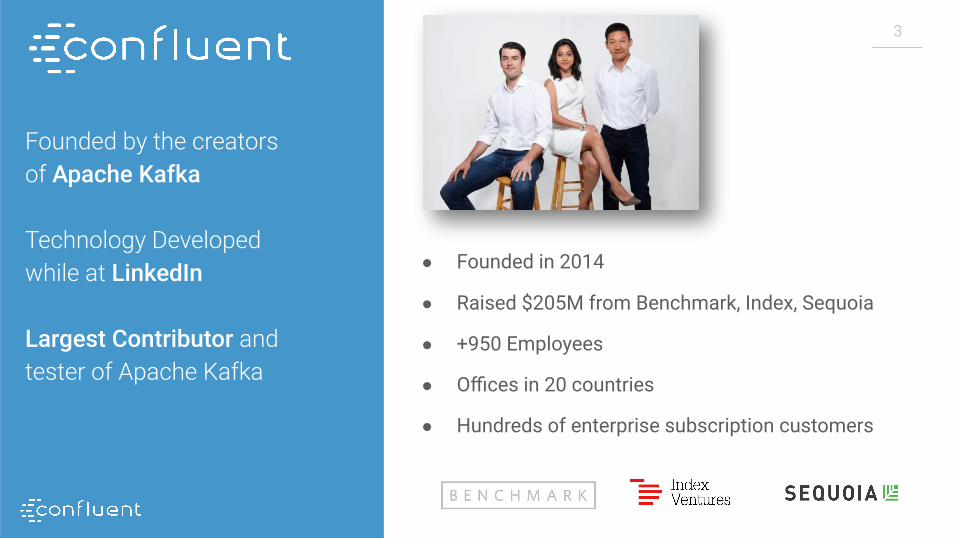
● Founded in 2014
● Raised $205M from Benchmark, Index, Sequoia
● +950 Employees
● Offices in 20 countries
● Hundreds of enterprise subscription customers

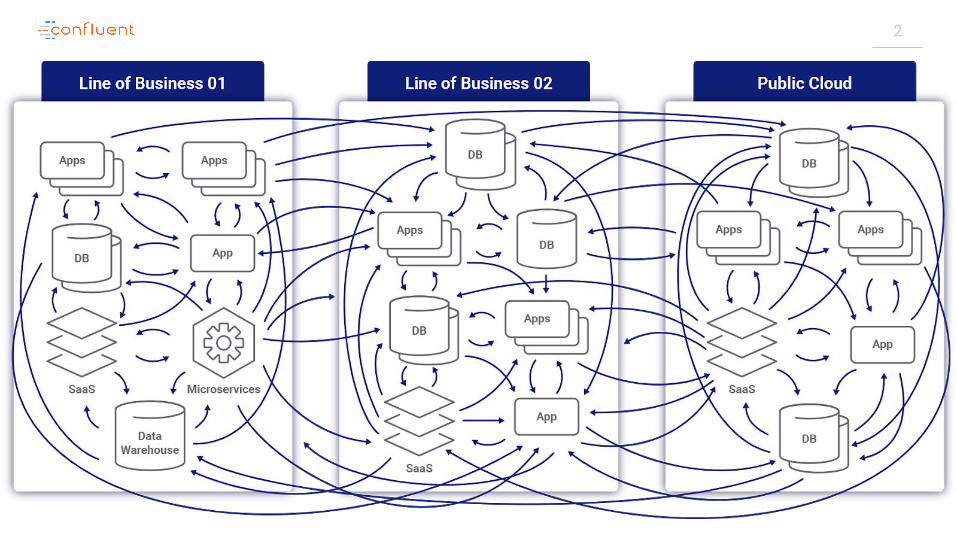
4Silos explained by Data Gravity concept
As data accumulates (builds mass) there is a greater likelihood that additional services and applications will be attracted to this data. This is the same effect gravity has on objects around a planet. As the mass or density increases, so does the strength of gravitational pull.

5
6

7
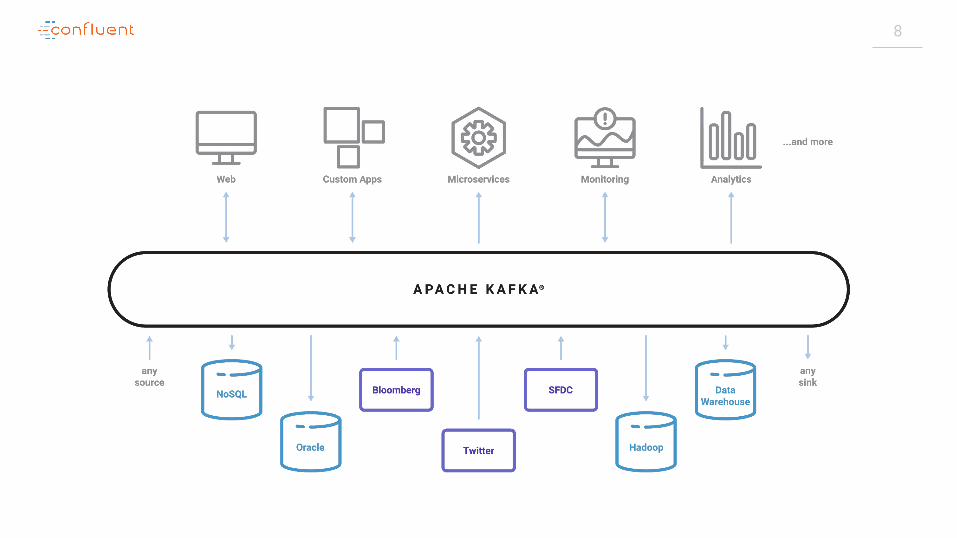
8
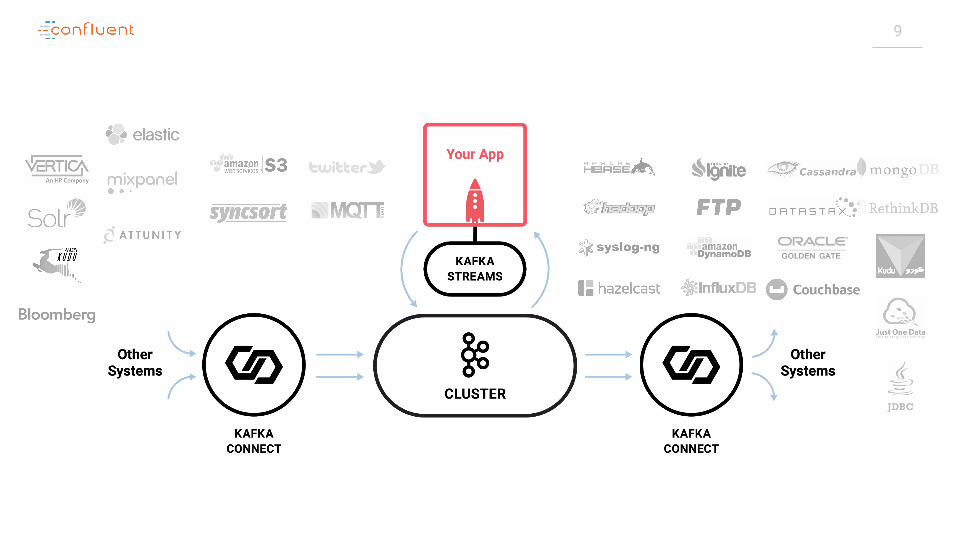
9
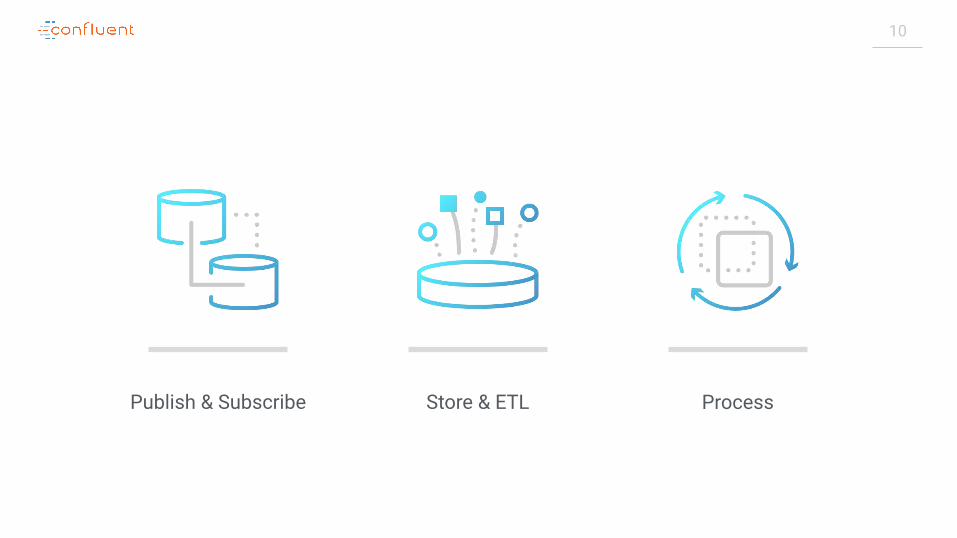
10
Store & ETL ProcessPublish & Subscribe

11
• Scalability• Retention• Durability• Replication• Security• Resiliency• Throughput• Ordering• Exactly Once Semantic• Transaction• Idempotency• Immutability• …

12
And many more...
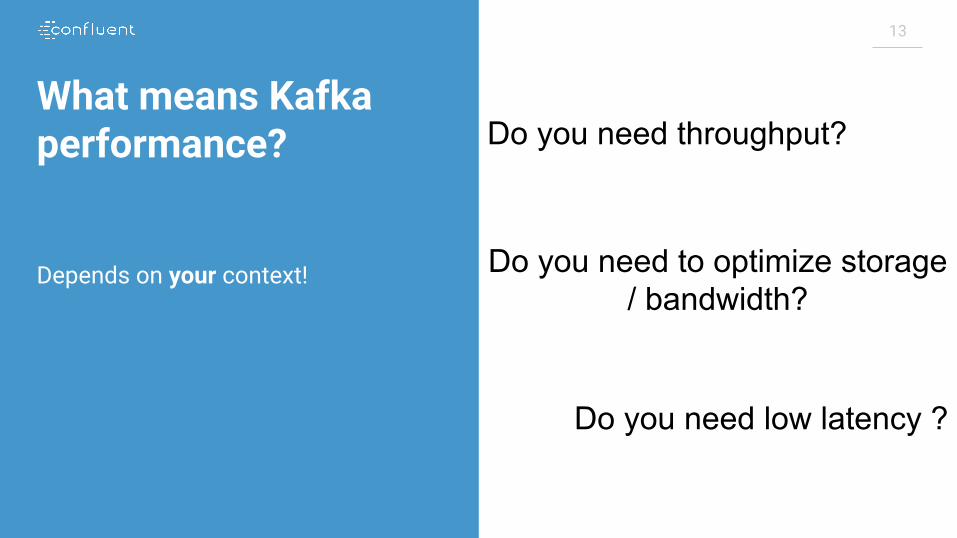
13
What means Kafka performance?
Depends on your context!
Do you need throughput?
Do you need low latency ?
Do you need to optimize storage / bandwidth?

14
What is your SLA ?

1515
No SLA ?Stop ! And gather them right away!

1616
But first ...

1717
Kafka in bash !https://github.com/framiere/kafka-in-bash

1818
On the producer side
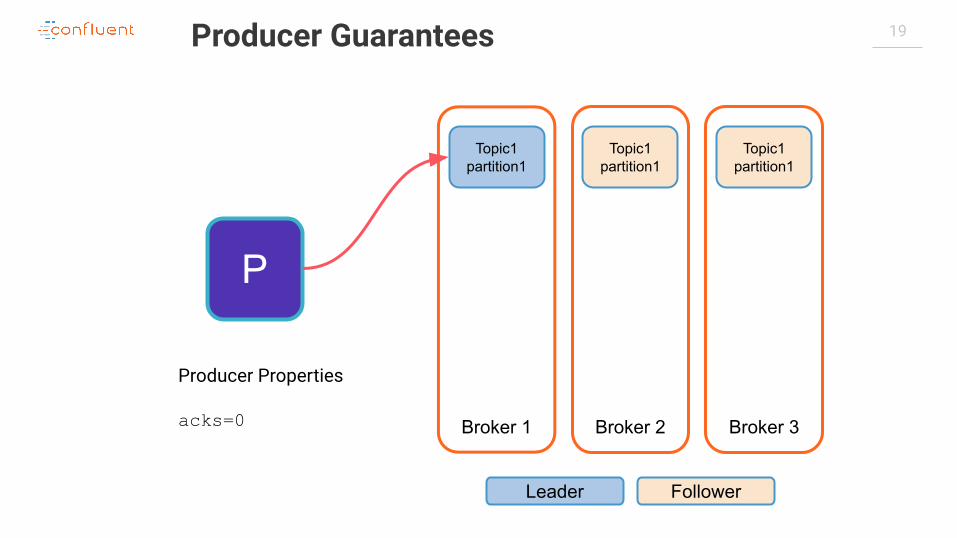
19
P
Broker 1 Broker 2 Broker 3
Topic1 partition1
Leader Follower
Topic1 partition1
Topic1 partition1
Producer Properties
acks=0
Producer Guarantees
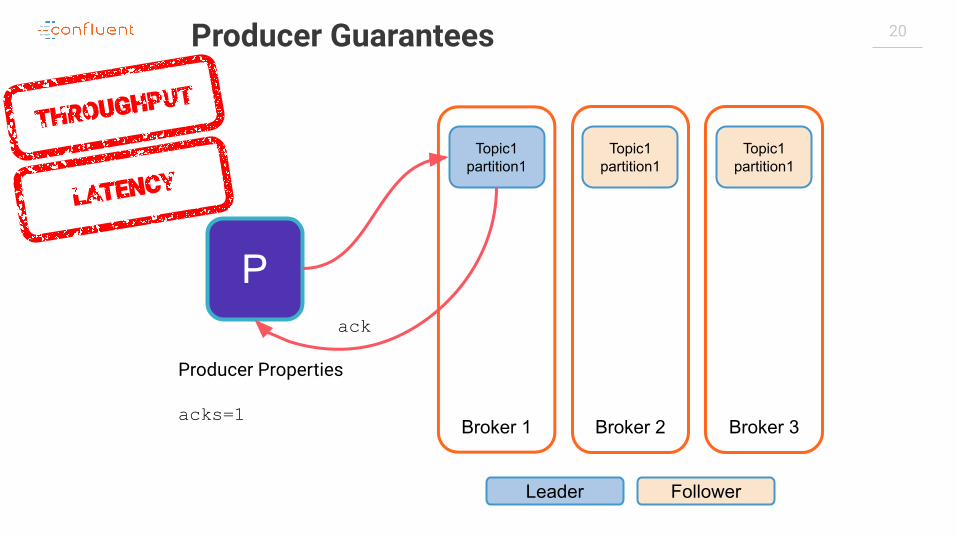
20
P
Broker 1 Broker 2 Broker 3
Topic1 partition1
Leader Follower
Topic1 partition1
Topic1 partition1
ack
Producer Properties
acks=1
Producer Guarantees
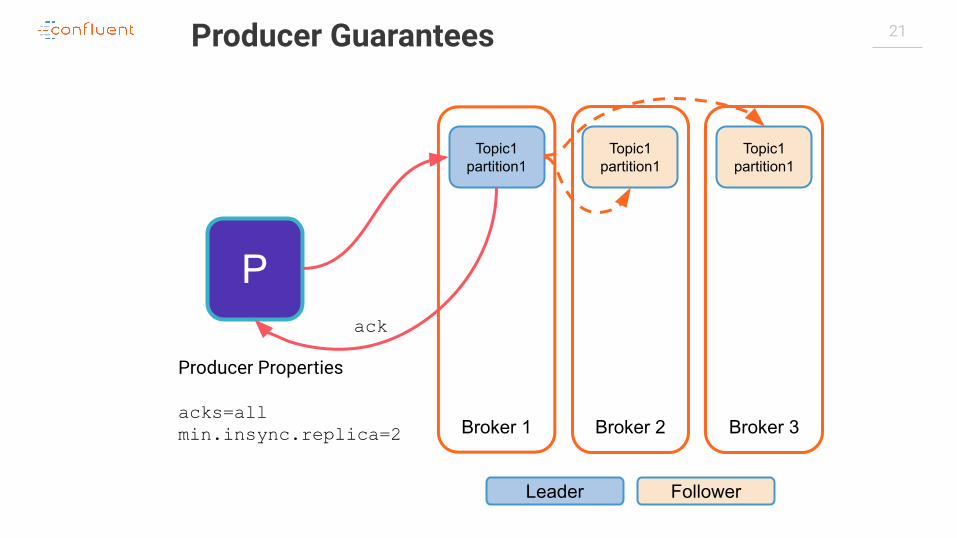
21Producer Guarantees
P
Broker 1 Broker 2 Broker 3
Topic1 partition1
Leader Follower
Topic1 partition1
Topic1 partition1
Producer Properties
acks=allmin.insync.replica=2
ack
22
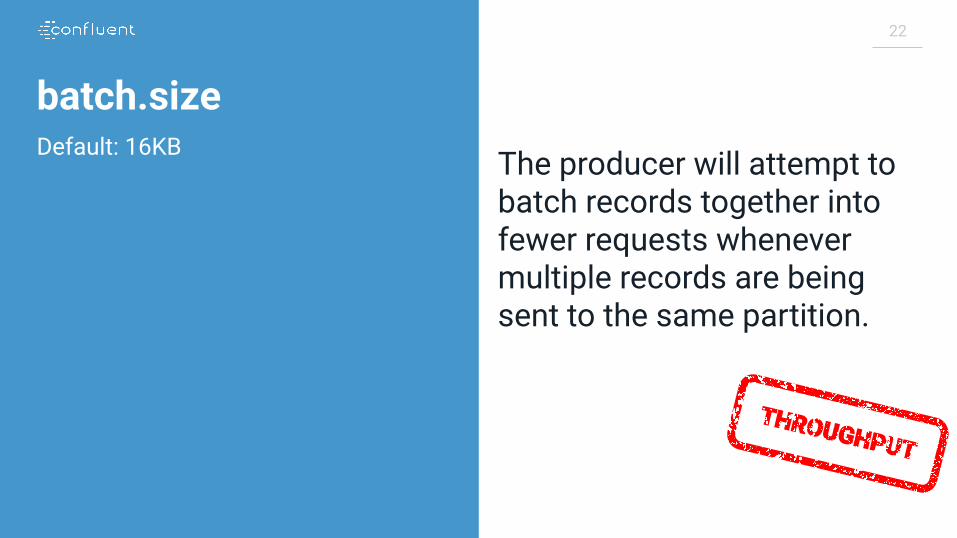
batch.sizeDefault: 16KB The producer will attempt to
batch records together into fewer requests whenever multiple records are being sent to the same partition.

2323
but... (yes there is a but)
24
linger.msDefault: O ms
This parameter may overrule the batch size, especially with the default value...
25
max.in.flight.requests.per.connection
Default: 5
The maximum number of unacknowledged requests the client will send on a single connection before blocking.

2626
but... (yes there is a but)
27
max.in.flight.requests.per.connection
Default: 5
Sending parallel requests to the broker avoids ordering guarantee.

2828
but... (yes there is a but)
29
enable.idempotence
Default: false Enabling idempotence avoids any duplicate message and restore the ordering guaranteeretries
Default: 2147483647
30
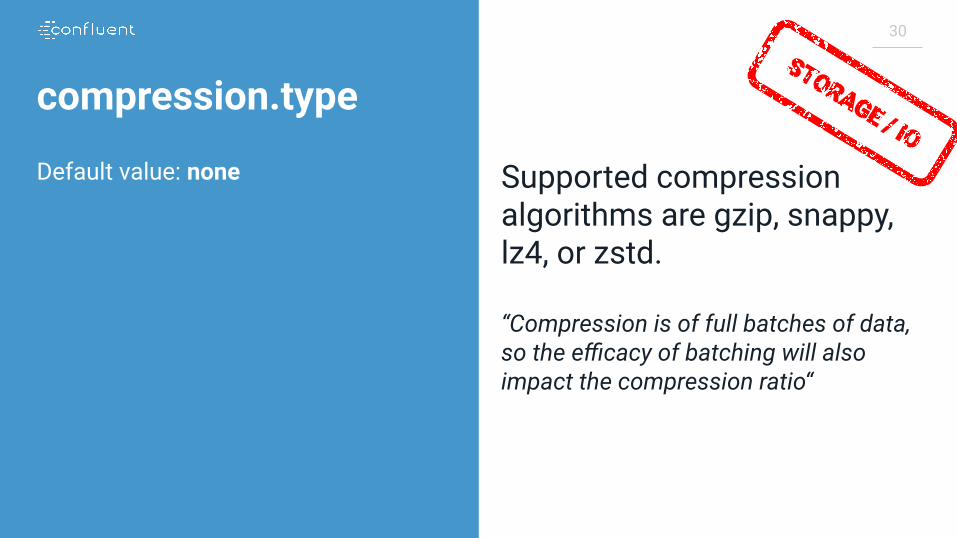
compression.type
Default value: none Supported compression algorithms are gzip, snappy, lz4, or zstd.
“Compression is of full batches of data, so the efficacy of batching will also impact the compression ratio“

3131
On the consumer side
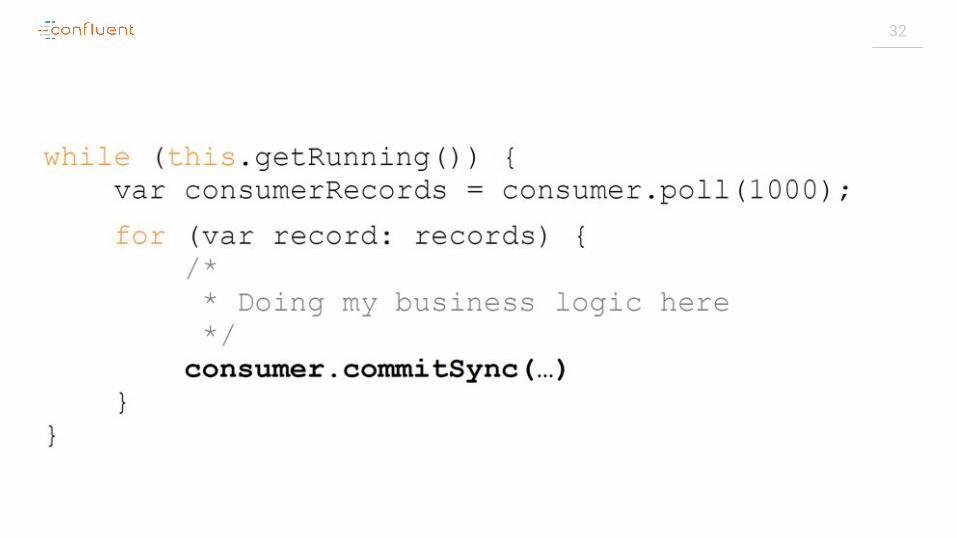
32
33
commitManually committing aggressively…
Add a huge workload on Apache Kafka
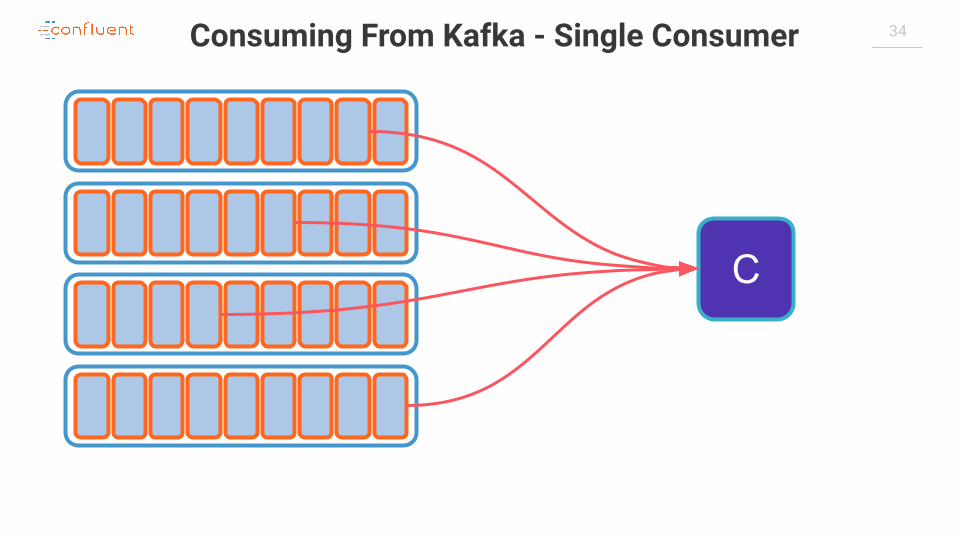
34Consuming From Kafka - Single Consumer
C
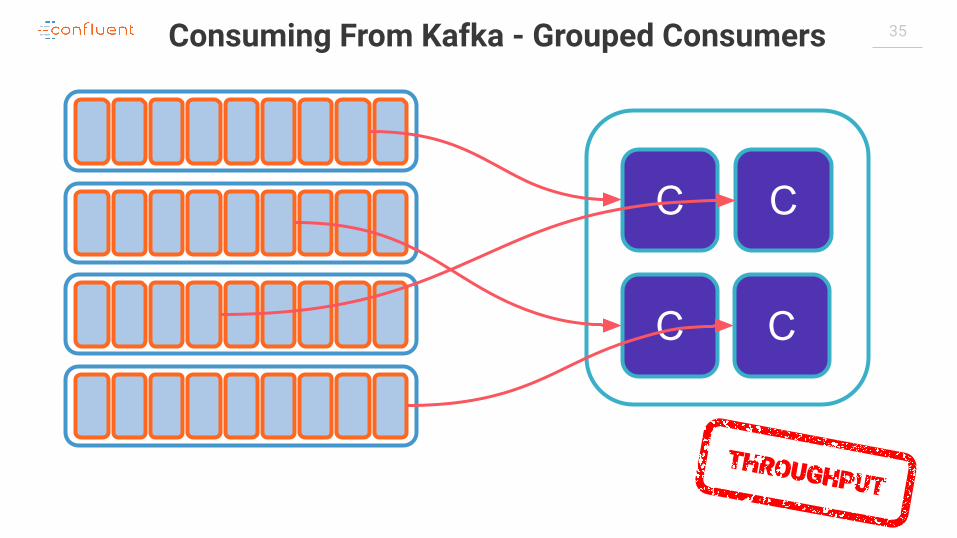
35Consuming From Kafka - Grouped Consumers
C C
C C

3636
On the broker side
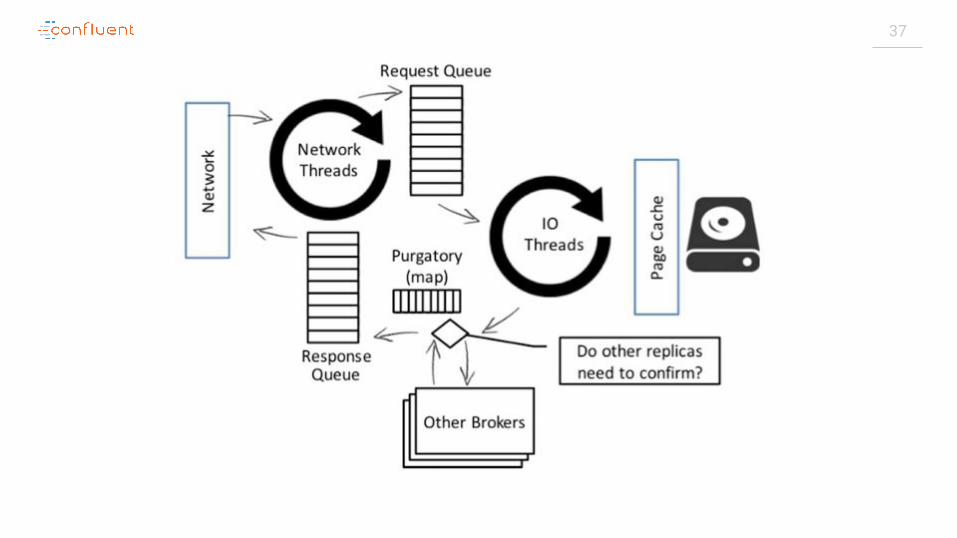
37

38
3939
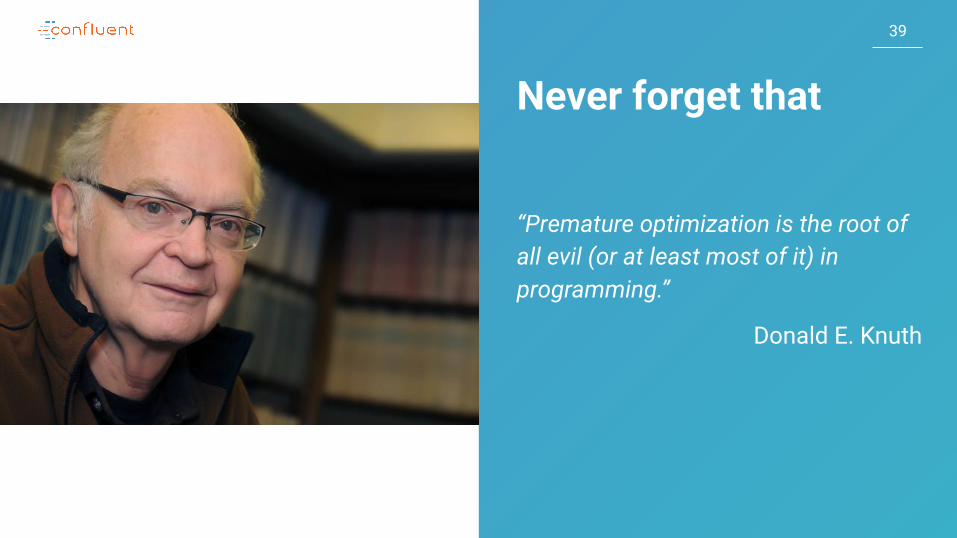
Never forget that
“Premature optimization is the root of all evil (or at least most of it) in programming.”
Donald E. Knuth

4040
Monitoring producers
41
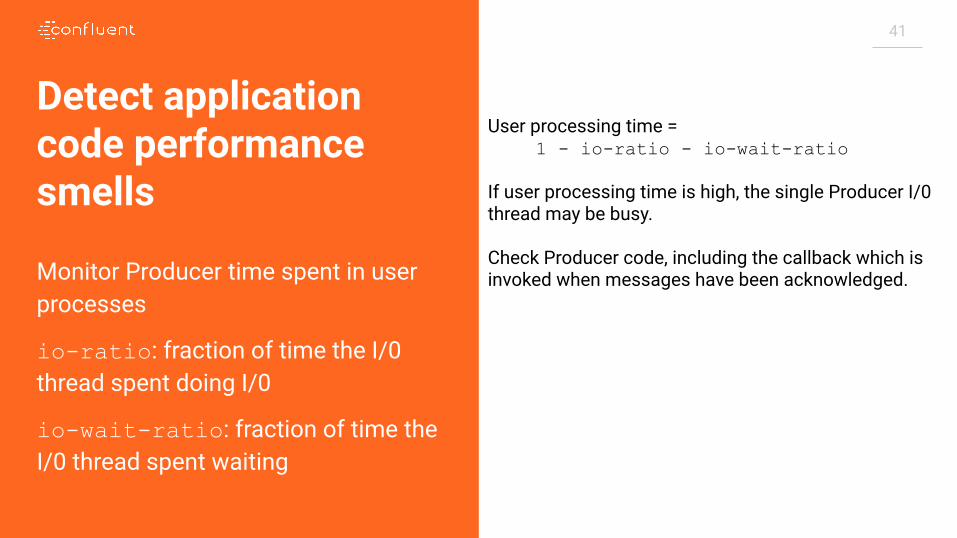
Detect application code performance smells
Monitor Producer time spent in user processes
io-ratio: fraction of time the I/0 thread spent doing I/0
io-wait-ratio: fraction of time the I/0 thread spent waiting
User processing time = 1 - io-ratio - io-wait-ratio
If user processing time is high, the single Producer I/0 thread may be busy.
Check Producer code, including the callback which is invoked when messages have been acknowledged.
42
Check your tuning efficiency
batch-size-avg
compression-rate-avg
Small batch-size-avg : linger.ms too low?
Poor compression rate: batch.size too small? linger.ms too low?
43
Check broker response time
request-latency-avg
A high request latency on the producer side may be the first clue of a deeper investigation!
44
Check the client efficiency
buffer-available-bytes
buffer-total-bytes
waiting-threads
A high buffer usage may be a clue that your code is producing at a very high pace. Consider the following options:
● Running more application instances, beware of ordering concerns
● Digging deeper: network → broker → disks● acks=1 if compliant with the business

4545
Monitoring consumers
46
Infer consumer performance
records-lag-max
records-lag
The maximum lag in terms of number of records for any partition in this window.
An increasing value over time is your best indication that the consumer group is not keeping up with the producers.

4747
Monitoring brokers
4848
Monitoring leaders and partitions
LeaderCount
PartitionCount
These gauges are critical to monitor performance.
Give clues about how balanced is the load across brokers and may explain if one broker seems to face more load than another.
4949
I/O and Network
RequestHandlerAvgIdlePercent
I/O metric
NetworkProcessorAvgIdlePercent
Network metric
Values are between 0 and 1:● 0 indicates all resources are used● 1 indicates all resources are available
Values below 0.4 should trig alerts and raise questions:
● Over usage?● Infrastructure issue? ● Capacity planning to update?● Thread pool sizing?
50
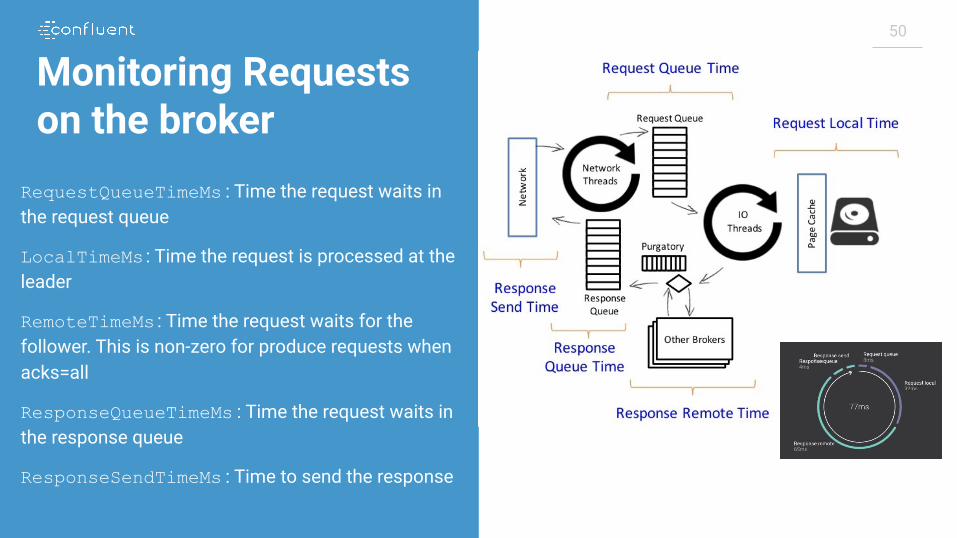
Monitoring Requests on the broker
RequestQueueTimeMs : Time the request waits in the request queue
LocalTimeMs : Time the request is processed at the leader
RemoteTimeMs : Time the request waits for the follower. This is non-zero for produce requests when acks=all
ResponseQueueTimeMs : Time the request waits in the response queue
ResponseSendTimeMs : Time to send the response
51
Disk usage > 60%
CPU usage > 60%
Network IO usage > 60%
File handle usage > 60%
⇒ Warning!
Monitoring the broker host OS

5252
Hosting
53
Zookeeper
Critical component but not facing a huge traffic nor holding a lot of data.
Sensitive to latency
⇒ Fast drive (SSD)
⇒ Single digit network latency between nodes
In VMs, provision dedicated resources.
54
BrokerBrokers are designed to take benefit of the Kernel Page Cache
⇒ Keep half of the RAM free to allow Kernel to leverage it
Avoid sharing disks with other applications or brokers.
User several disks to maximize throughput:
● Through a RAID controller, except RAID5/6● With multiple mount points
Avoid hosting brokers and Zookeeper on the same host as their running profiles are completely different.

5555
Under a profilerhttps://github.com/framiere/a-kafka-performance-story
5656
Optimizing Your Kafka DeploymentThroughput, Latency, Durability, and Availability
https://www.confluent.io/white-paper/optimizing-your-apache-kafka-deployment/

58