50
NOVEMBER 2011 RESTRUCTURING MEDICARE ’ S BENEFIT DESIGN Implications for Beneficiaries and Spending Medicare Policy KAISER FAMILY FOUNDATION

NOVEMBER 2011
RESTRUCTURING MEDICARE’S BENEFIT DESIGN
Implications for Beneficiaries and Spending
Medicare PolicyK A I S E R F A M I L Y F O U N D A T I O N

NOVEMBER 2011
RESTRUCTURING MEDICARE’S BENEFIT DESIGN
Implications for Beneficiaries and Spending
Prepared by:
Juliette Cubanski Tricia NeumanZachary LevinsonThe Henry J. Kaiser Family Foundation
and
Monica BrennerJames MaysActuarial Research Corporation
Medicare PolicyK A I S E R F A M I L Y F O U N D A T I O N

RestRuctuRing MedicaRe’s Benefit design – Implications for Beneficiaries and Spending i
i
EXECUTIVE SUMMARY Among the many options under discussion for controlling the growth in Medicare spending is one that would restructure Medicare’s benefit design in a manner that would achieve savings. Several recent deficit-reduction proposals suggest replacing the current Medicare benefit design with a combined deductible for Parts A and B and a uniform coinsurance on virtually all Medicare-covered services, coupled with a new limit on beneficiaries’ out-of-pocket spending. Medicare currently has separate deductibles for Parts A and B, varying cost-sharing amounts for covered services, and no out-of-pocket spending limit. Some have proposed to achieve additional savings by combining a restructured Medicare benefit design with a policy that prohibits Medigap policies from providing so-called “first-dollar” coverage that pays for virtually all Medicare deductibles and coinsurance for covered services.
This study examines the effects of restructuring the Medicare fee-for-service (FFS) benefit design in 2013, with a $550 deductible for Parts A and B, a 20 percent coinsurance on virtually all services (including inpatient, home health, and skilled nursing facility), and a $5,500 limit on cost sharing for Medicare-covered services, based on parameters specified in some recent deficit-reduction proposals. In addition, we examine the effects of imposing a higher or lower limit on out-of-pocket spending, and consider the implications of implementing the alternative Medicare benefit design along with restrictions on first-dollar Medigap coverage. We examine the effects of these benefit changes on beneficiary out-of-pocket spending, and on spending by Medicare, Medicaid (state and federal), employers (including TRICARE), and other supplemental insurers. Unless otherwise noted, beneficiary out-of-pocket spending includes the deductible and cost sharing for Medicare-covered services only and premiums for Medicare and supplemental coverage. Because the cost-sharing restructuring proposals generally do not change the Part D drug benefit, our analysis excludes out-of-pocket spending on prescription drugs and premiums for Part D coverage.
Efforts to model programmatic and policy reforms require a number of policy and behavioral assumptions and some degree of uncertainty. We model the specified changes in Medicare’s benefit design, assuming full implementation in 2013 and no changes in supplemental coverage in that year – other than the aforementioned restriction on Medigap first-dollar coverage. We assume static insurance coverage – that is, no change in the share of beneficiaries with supplemental coverage or in the share of benefits paid by supplemental insurers – under the alternative benefit design. We made this assumption because there is no definitive evidence suggesting what the direction or magnitude of such changes in supplemental coverage might be, and because it seems unlikely that major changes would occur in the first year of implementation (though changes could occur over a longer period of time). If supplemental payers reduce the generosity of coverage or drop coverage altogether in response to changes in Medicare’s benefit design in 2013, we would expect that costs would generally be shifted onto Medicare-eligible enrollees, resulting in higher average out-of-pocket spending and greater savings for supplemental payers and Medicare than our results suggest. A detailed description of the methodology, key assumptions, and limitations is included in Appendix A.
Our estimates of changes in beneficiary out-of-pocket spending, both cost sharing and premiums, are driven by two main factors. The first factor relates to individual health status and expected use of Medicare-covered services. The second factor relates to each beneficiary’s source of supplemental coverage, if applicable. Today, 90 percent of Medicare beneficiaries have supplemental coverage, including employer-sponsored retiree health plans, Medigap, and Medicaid. Supplemental insurers typically cover a portion of their enrollees’ expenses, including deductibles and coinsurance. Thus, the type and generosity of supplemental insurance play a major role in determining the impact of Medicare cost-sharing restructuring on beneficiaries’ out-of-pocket spending, including premiums.
KEY FINDINGS Restructuring Medicare’s fee-for-service benefit design, with a single deductible for Parts A and B of $550, 20 percent coinsurance on most Medicare-covered services, and a $5,500 annual limit on cost sharing in 2013: Nearly three-fourths (71 percent) of the 41 million beneficiaries in the fee-for-service Medicare
program would have higher out-of-pocket spending (including premiums and cost sharing for Medicare-covered services) under the alternative Medicare benefit design, 5 percent would have
RestRuctuRing MedicaRe’s Benefit design – Implications for Beneficiaries and Spendingii
ii
71%
5%
5%
No/nominal change
24%
Distribution of Medicare FFS Beneficiaries, by Change in Expected Out-of-Pocket Spending Under an Alternative Medicare Benefit Design, 2013
Exhibit ES1
Among 5%, average reduction =
$1,570
Among 71%, average increase =
$180
SOURCE: Actuarial Research Corporation analysis for the Kaiser Family Foundation.NOTES: FFS is fee-for-service. Out-of-pocket costs includes premiums and cost-sharing requirements. No/nominal change group includes beneficiaries with changes in spending no more than ±$25.
Alternative benefit design = $550 deductible, 20% coinsurance for all services, $5,500 cost-sharing limit
Spending reduction
Spending increase
Total Medicare FFS Beneficiaries, 2013 = 40.8 million
Average among 12% with increase greater than $250 =
$660
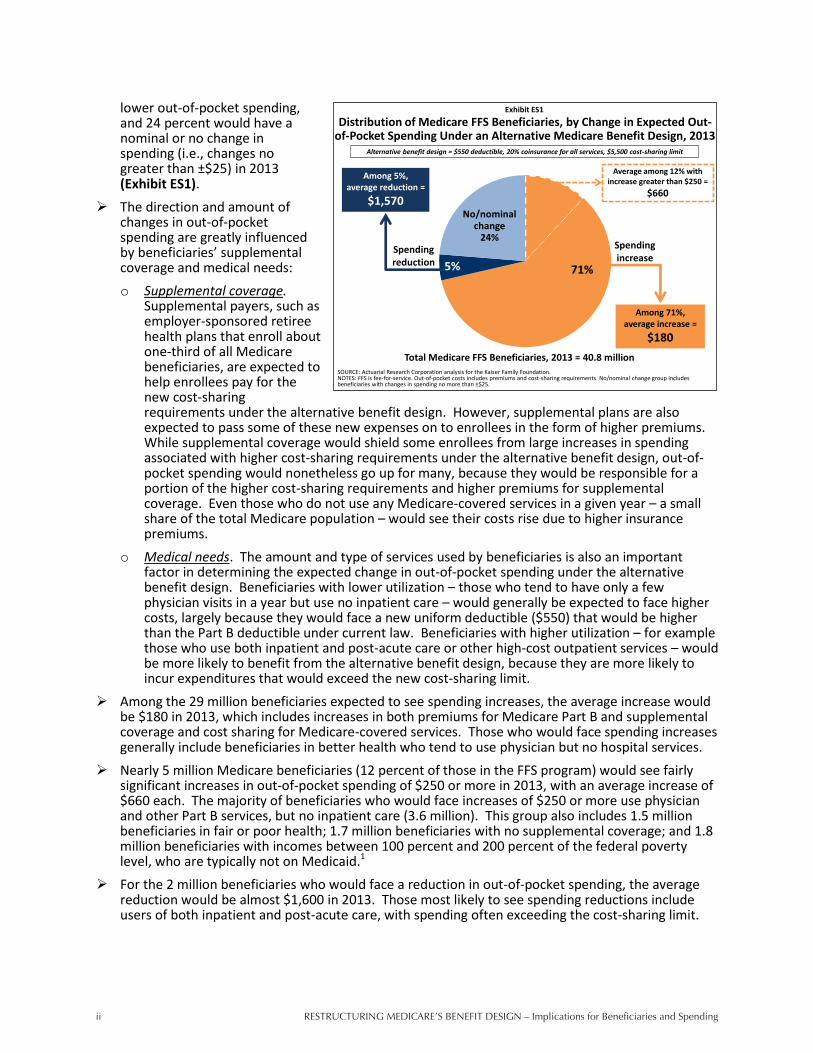
lower out-of-pocket spending, and 24 percent would have a nominal or no change in spending (i.e., changes no greater than ±$25) in 2013 (Exhibit ES1).
The direction and amount of changes in out-of-pocket spending are greatly influenced by beneficiaries’ supplemental coverage and medical needs: o Supplemental coverage.
Supplemental payers, such as employer-sponsored retiree health plans that enroll about one-third of all Medicare beneficiaries, are expected to help enrollees pay for the new cost-sharing requirements under the alternative benefit design. However, supplemental plans are also expected to pass some of these new expenses on to enrollees in the form of higher premiums. While supplemental coverage would shield some enrollees from large increases in spending associated with higher cost-sharing requirements under the alternative benefit design, out-of-pocket spending would nonetheless go up for many, because they would be responsible for a portion of the higher cost-sharing requirements and higher premiums for supplemental coverage. Even those who do not use any Medicare-covered services in a given year – a small share of the total Medicare population – would see their costs rise due to higher insurance premiums.
o Medical needs. The amount and type of services used by beneficiaries is also an important factor in determining the expected change in out-of-pocket spending under the alternative benefit design. Beneficiaries with lower utilization – those who tend to have only a few physician visits in a year but use no inpatient care – would generally be expected to face higher costs, largely because they would face a new uniform deductible ($550) that would be higher than the Part B deductible under current law. Beneficiaries with higher utilization – for example those who use both inpatient and post-acute care or other high-cost outpatient services – would be more likely to benefit from the alternative benefit design, because they are more likely to incur expenditures that would exceed the new cost-sharing limit.
Among the 29 million beneficiaries expected to see spending increases, the average increase would be $180 in 2013, which includes increases in both premiums for Medicare Part B and supplemental coverage and cost sharing for Medicare-covered services. Those who would face spending increases generally include beneficiaries in better health who tend to use physician but no hospital services.
Nearly 5 million Medicare beneficiaries (12 percent of those in the FFS program) would see fairly significant increases in out-of-pocket spending of $250 or more in 2013, with an average increase of $660 each. The majority of beneficiaries who would face increases of $250 or more use physician and other Part B services, but no inpatient care (3.6 million). This group also includes 1.5 million beneficiaries in fair or poor health; 1.7 million beneficiaries with no supplemental coverage; and 1.8 million beneficiaries with incomes between 100 percent and 200 percent of the federal poverty level, who are typically not on Medicaid.1
For the 2 million beneficiaries who would face a reduction in out-of-pocket spending, the average reduction would be almost $1,600 in 2013. Those most likely to see spending reductions include users of both inpatient and post-acute care, with spending often exceeding the cost-sharing limit.

RestRuctuRing MedicaRe’s Benefit design – Implications for Beneficiaries and Spending iii
iii
$0.7
$2.3
$4.2
$0.6
$0.05
$0.4
$0.04
$0.2
Net
Other
Federal
Exhibit ES2
SOURCE: Actuarial Research Corporation analysis for the Kaiser Family Foundation.NOTES: FFS is fee-for-service. Other supplemental insurers includes Veterans’ Administration, Indian Health Service and other federal sources; other state and local sources; worker’s compensation; and other unclassified sources.
Net Change in Total Health Care Spending From Current Law Under an Alternative Medicare Benefit Design, 2013
Medicare Medicaid: Federal - State
Beneficiaries
Employers
Other supplemental insurers
TRICARE
SPENDING DECREASES
SPENDING INCREASES
NET CHANGE
Total = $4.3 billion decrease
Total = $3.6 billion
increase
Total = $0.7 billion decrease
Alternative benefit design = $550 deductible, 20% coinsurance for all services, $5,500 cost-sharing limit
Compared to current law, Medicare spending under the alternative benefit design would decrease by $4.2 billion and Medicaid spending (federal and state combined) would decrease by $0.1 billion in 2013 – a total decrease of $4.3 billion (Exhibit ES2). Aggregate spending would increase for beneficiaries by $2.3 billion. In addition, aggregate spending would increase for employers ($0.6 billion), TRICARE ($0.2 billion), and other payers ($0.4 billion), for a total increase of $3.6 billion. o These changes would result
in a net reduction in total health care spending of $0.7 billion in 2013.
o On net, federal spending – including Medicare, the federal portion of Medicaid, and TRICARE – would decrease by $4.1 billion in 2013 under the alternative benefit design.
Varying the Cost-Sharing Limit Raising or lowering the limit on beneficiary cost sharing for Medicare-covered services would have a
significant impact on the share of beneficiaries who would experience an increase or decrease in out-of-pocket spending and on aggregate beneficiary and federal spending. o If the limit were increased from $5,500 to $7,500, the share of beneficiaries facing a spending
increase would remain unchanged (71 percent versus 72 percent), but the share estimated to have a spending increase of $250 or more would increase from 12 percent to 39 percent.
o With a lower $4,000 limit, nearly one-third of beneficiaries (30 percent) would see a reduction in out-of-pocket spending (versus 5 percent with a $5,500 limit), while a smaller share (8 percent) would have spending increases of $250 or more.
o Compared to current law, federal spending would decrease by $13.2 billion with a $7,500 cost-sharing limit, but would increase by $5.1 billion with a $4,000 limit.
Restructuring Medicare’s Benefit Design with Restrictions on Medigap “First-Dollar” Coverage About 1 in 5 Medicare beneficiaries has a Medigap policy, and virtually all Medigap policyholders
have first-dollar coverage. If the restructured Medicare benefit design were combined with restrictions on Medigap first-dollar coverage (no coverage of the first $550 in costs, and no more than 50 percent coverage of cost sharing up to the out-of-pocket limit): o Overall, half of all Medicare FFS beneficiaries would be expected to have higher out-of-pocket
costs (including premiums); nearly one quarter (24 percent) would have lower costs, and 26 percent would face no or a nominal change in spending.
A larger share of beneficiaries would see cost decreases if the alternative benefit design were implemented with Medigap restrictions than without (24 percent versus 5 percent, respectively). o More than 8 million beneficiaries, or 20 percent of FFS beneficiaries, would be expected to see
out-of-pocket costs decrease by more than $250 in 2013 under the alternative benefit design with Medigap restrictions. This group includes many beneficiaries in relatively good health who use few services, and many Medigap policyholders.

RestRuctuRing MedicaRe’s Benefit design – Implications for Beneficiaries and Spendingiv
iv
o However, nearly 6 million Medicare beneficiaries in the FFS program (14 percent) would be expected to see out-of-pocket costs increase by more than $250 (with an average increase of $780 each). This group includes 2.5 million Medicare beneficiaries who are Medigap policyholders, 2.1 million in fair or poor health, and 3.2 million beneficiaries with incomes below 200 percent of the poverty level.2
Among Medigap policyholders specifically, 27 percent would face higher out-of-pocket spending for premiums and cost sharing; 71 percent would have lower spending, and 2 percent would face no or a nominal change in spending. The relatively large share of Medigap policyholders who would experience a spending reduction is largely attributable to a decrease in Medigap premiums. Medigap premiums are expected to go down because Medigap would cover limited amounts of Medicare cost sharing; in addition, enrollees themselves would take on more cost-sharing responsibility and are expected to use fewer services as a result, and therefore Medigap plans would be covering cost sharing for fewer Medicare-covered claims.
The distribution of beneficiaries with spending reductions and increases under the alternative benefit design with Medigap coverage restrictions looks very different depending on whether the out-of-pocket spending measure includes both cost sharing and premium changes, as above, or cost-sharing amounts only. This is particularly true for Medigap policyholders. Excluding premiums, 95 percent of Medigap enrollees would face an increase in out-of-pocket spending, 1 percent would face a decrease in spending, and 5 percent would face a nominal or no change. Overall, 61 percent of Medigap enrollees would face an increase of $500 or more in out-of-pocket spending on cost sharing for Medicare-covered services only, excluding premium changes.
Federal savings would be substantially greater with Medigap restrictions than without ($8.8 billion vs. $4.1 billion), because Medigap enrollees would be expected to use fewer Medicare-covered services in response to their higher cost-sharing obligations.
Aggregate beneficiary spending would decrease on net by $1.5 billion, which reflects $10.3 billion in higher spending as a result of additional cost-sharing obligations, offset by an aggregate premium reduction of $11.8 billion (including Part B and supplemental coverage).
CONCLUSION This analysis illustrates the expected shifts in costs that are likely to occur in 2013 if Medicare fee-for-service cost-sharing requirements are restructured, as has been recommended by some as part of deficit-reduction efforts. This work underscores a dilemma for policymakers: a restructured Medicare benefit design with a new limit on beneficiary cost sharing for Medicare-covered services has the potential to produce savings to Medicare while also providing substantial help to a minority of beneficiaries with high medical spending, but would also impose additional costs on a majority of beneficiaries who are relatively healthy and modest users of medical care. While most beneficiaries would not reach the cost-sharing limit in any given year, knowing that Medicare coverage includes a catastrophic limit could give them peace of mind and a greater sense of financial security, as well as mitigate the need to obtain supplemental coverage. With most beneficiaries currently covered by supplemental insurance, the effects of a restructured benefit design would be attenuated somewhat, because supplemental insurers would cover a large share of beneficiaries’ new cost-sharing obligations. Our study does not address the health or long-term cost implications of imposing new cost-sharing requirements on beneficiaries. We assume beneficiaries would use fewer services when confronted with higher cost-sharing requirements, which in turn would lower both Medicare and out-of-pocket spending. Other studies have found that people forego both necessary and unnecessary care, the former of which could lead to health complications and additional costs in the long run. Building on our analysis, future research could consider the various ways in which a restructured Medicare benefit design could provide greater financial protections to beneficiaries, minimize the need for beneficiaries to purchase supplemental insurance, encourage beneficiaries to use higher value care, and minimize cost shifting that could adversely affect beneficiaries, states, and other payers.
RestRuctuRing MedicaRe’s Benefit design – Implications for Beneficiaries and Spending 1
1
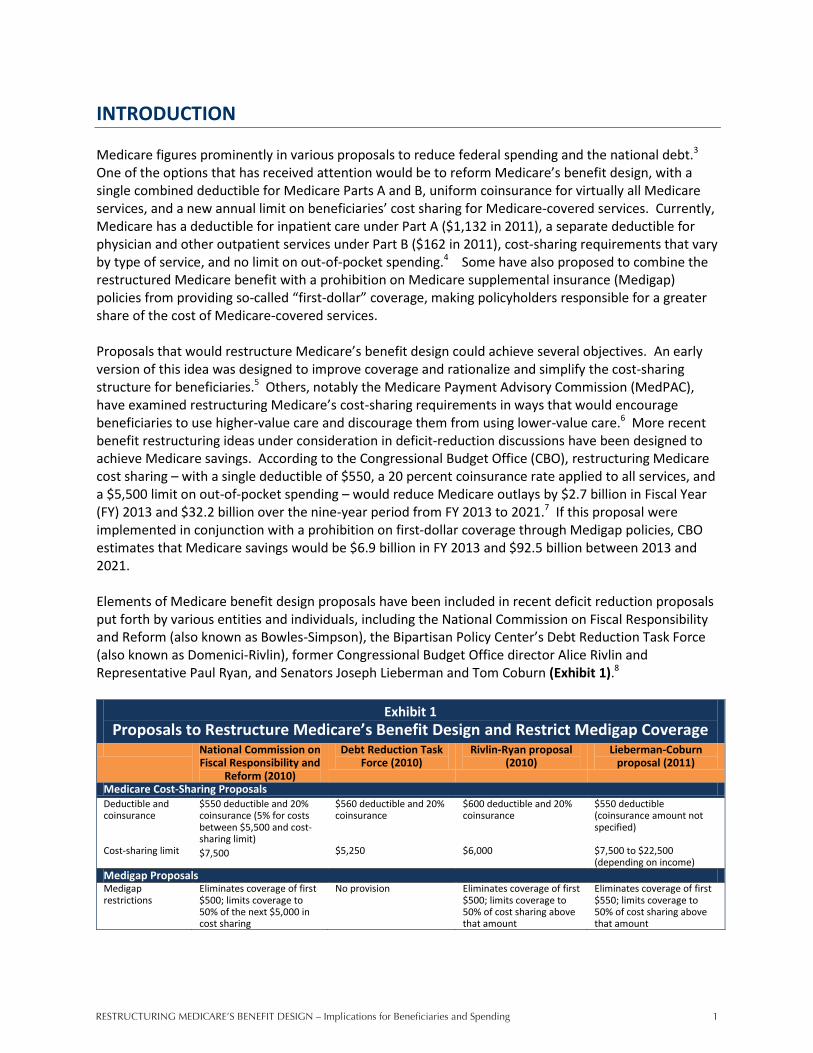
INTRODUCTION Medicare figures prominently in various proposals to reduce federal spending and the national debt.3 One of the options that has received attention would be to reform Medicare’s benefit design, with a single combined deductible for Medicare Parts A and B, uniform coinsurance for virtually all Medicare services, and a new annual limit on beneficiaries’ cost sharing for Medicare-covered services. Currently, Medicare has a deductible for inpatient care under Part A ($1,132 in 2011), a separate deductible for physician and other outpatient services under Part B ($162 in 2011), cost-sharing requirements that vary by type of service, and no limit on out-of-pocket spending.4 Some have also proposed to combine the restructured Medicare benefit with a prohibition on Medicare supplemental insurance (Medigap) policies from providing so-called “first-dollar” coverage, making policyholders responsible for a greater share of the cost of Medicare-covered services. Proposals that would restructure Medicare’s benefit design could achieve several objectives. An early version of this idea was designed to improve coverage and rationalize and simplify the cost-sharing structure for beneficiaries.5 Others, notably the Medicare Payment Advisory Commission (MedPAC), have examined restructuring Medicare’s cost-sharing requirements in ways that would encourage beneficiaries to use higher-value care and discourage them from using lower-value care.6 More recent benefit restructuring ideas under consideration in deficit-reduction discussions have been designed to achieve Medicare savings. According to the Congressional Budget Office (CBO), restructuring Medicare cost sharing – with a single deductible of $550, a 20 percent coinsurance rate applied to all services, and a $5,500 limit on out-of-pocket spending – would reduce Medicare outlays by $2.7 billion in Fiscal Year (FY) 2013 and $32.2 billion over the nine-year period from FY 2013 to 2021.7 If this proposal were implemented in conjunction with a prohibition on first-dollar coverage through Medigap policies, CBO estimates that Medicare savings would be $6.9 billion in FY 2013 and $92.5 billion between 2013 and 2021. Elements of Medicare benefit design proposals have been included in recent deficit reduction proposals put forth by various entities and individuals, including the National Commission on Fiscal Responsibility and Reform (also known as Bowles-Simpson), the Bipartisan Policy Center’s Debt Reduction Task Force (also known as Domenici-Rivlin), former Congressional Budget Office director Alice Rivlin and Representative Paul Ryan, and Senators Joseph Lieberman and Tom Coburn (Exhibit 1).8
Exhibit 1 Proposals to Restructure Medicare’s Benefit Design and Restrict Medigap Coverage
National Commission on Fiscal Responsibility and
Reform (2010)
Debt Reduction Task Force (2010)
Rivlin-Ryan proposal (2010)
Lieberman-Coburn proposal (2011)
Medicare Cost-Sharing Proposals Deductible and coinsurance
$550 deductible and 20% coinsurance (5% for costs between $5,500 and cost-sharing limit)
$560 deductible and 20% coinsurance
$600 deductible and 20% coinsurance
$550 deductible (coinsurance amount not specified)
Cost-sharing limit $7,500 $5,250 $6,000 $7,500 to $22,500 (depending on income)
Medigap Proposals Medigap restrictions
Eliminates coverage of first $500; limits coverage to 50% of the next $5,000 in cost sharing
No provision Eliminates coverage of first $500; limits coverage to 50% of cost sharing above that amount
Eliminates coverage of first $550; limits coverage to 50% of cost sharing above that amount

RestRuctuRing MedicaRe’s Benefit design – Implications for Beneficiaries and Spending2
2
Those who support reforming Medicare’s cost-sharing design offer several reasons for the change. First is the potential to reduce Medicare spending, which would help to reduce the federal budget deficit. To the extent that these reforms increase cost-sharing requirements, with beneficiaries and supplemental insurers bearing more of the cost of Medicare-covered services, beneficiaries could become more price-sensitive in using medical care, resulting in lower utilization and greater Medicare savings.9 Second is the opportunity to simplify Medicare cost sharing for beneficiaries and more closely align it to benefit designs typically offered by large employer plans.10 Third, an annual cost-sharing limit could shield high-cost beneficiaries from significant out-of-pocket costs for Medicare-covered services, and mitigate the need for supplemental insurance, such as employer-sponsored retiree health plans and Medigap. While most beneficiaries may not reach the limit in any given year, knowing that Medicare coverage includes a catastrophic limit could give them peace of mind and a greater sense of financial security. Others have expressed concern that restructuring Medicare cost sharing has the potential to shift significant costs from Medicare onto beneficiaries and other payers, and that the higher cost sharing imposed on certain services, in conjunction with Medigap coverage restrictions, would result in some beneficiaries foregoing needed care, which could lead to higher Medicare spending in the long run.11 Although some beneficiaries with significant medical needs could see their out-of-pocket spending decline if they have expenses that exceeds the new cost-sharing limit, others (particularly those who use few services) could face higher spending due to the combined deductible that is greater than the current Part B deductible and the new coinsurance requirements for certain services. These new cost-sharing requirements could be particularly burdensome for beneficiaries without supplemental coverage and those with modest incomes. Previous studies have analyzed various approaches to Medicare cost-sharing reforms and Medigap coverage restrictions, with some reforms reducing beneficiary spending at a cost to the government and others increasing beneficiary costs to achieve Medicare savings.12,13,14,15 Prior studies confirm that the specific design parameters matter greatly in determining the share of beneficiaries likely to be affected (positively or negatively), the direction and magnitude of effects on federal spending (savings or spending), and the tradeoffs involved in raising costs somewhat for a large share of the population in order to provide greater financial protection to a small share of beneficiaries with exceptionally high costs. This study builds upon previous research to provide a timely analysis of recently proposed cost-sharing reforms. Our analysis focuses on the options discussed by the CBO in its March 2011 report, which are reflected in or similar to proposals included in recent deficit-reduction plans. The recent CBO analysis estimates the effect on Medicare spending, but does not address the cost implications for individuals, employers, and states. In addition to discussing the implications for beneficiary out-of-pocket spending, our analysis also presents estimates of the distributional impact that cost-sharing restructuring proposals are expected to have on different groups of beneficiaries.
ABOUT THIS ANALYSIS This analysis takes an in-depth look at proposals to restructure Medicare’s benefit design, modeling the effects on beneficiaries’ out-of-pocket spending, federal and state spending, and employer spending. The effects are modeled for implementation in calendar year 2013. The analysis documents the share of beneficiaries who would be expected to incur higher or lower out-of-pocket spending under the proposed benefit design changes relative to current law, the expected average increase or decrease in spending, and the characteristics of beneficiaries estimated to have higher and lower spending.

RestRuctuRing MedicaRe’s Benefit design – Implications for Beneficiaries and Spending 3
3
We modeled the effect of replacing the current Medicare benefit design in 2013 with an alternative that has a single deductible for Parts A and B of $550, a 20 percent coinsurance rate on Medicare-covered services (including inpatient, home health and skilled nursing facility, but excluding hospice), and an annual limit on out-of-pocket spending for Medicare-covered services, set at $5,500 (Exhibit 2). Compared to current law, this policy lowers the deductible for those who would otherwise pay the Part A deductible and raises the deductible for beneficiaries who would otherwise only pay the Part B deductible. These parameters are the same as those specified by the CBO in its analysis of spending and revenue options in March 2011, and are similar, but not identical, to those recommended by the Bowles-Simpson Commission and the Domenici-Rivlin Debt Reduction Task Force. We also assessed the effects of modifying this proposal by varying the limit on out-of-pocket spending, modeling a lower ($4,000) and higher ($7,500) limit.16
We then modeled the effects of implementing this alternative benefit design together with a proposal that prohibits Medigap policies from providing first-dollar coverage, based on the parameters specified by the CBO, whereby Medigap policies would be prohibited from covering the first $550 of Medicare cost-sharing requirements (i.e., the new unified deductible), and Medigap coverage would be limited to 50 percent of cost sharing for Medicare-covered services above the deductible up to the new limit on out-of-pocket spending. Under current law, Medigap insurers are required to offer policies that conform to standard benefit designs. Today, there are 10 plan types, and the majority of Medigap policyholders have plans C and F, both of which offer first-dollar coverage, including coverage of Medicare Part A and B deductibles and coinsurance for covered services.17
Exhibit 2 Comparison of Cost-Sharing Requirements under the Current Medicare Program and
an Alternative Medicare Benefit Design, 2013 BENEFIT DESIGN CURRENT ALTERNATIVE Deductible Part A: $1,204 per benefit period
Part B: $156 Combined Part A/B: $550
Out-of-pocket spending limit None $5,500 Part A services Inpatient hospital No coinsurance for first 60 days
$301/day for days 61-90 $602/day for days 91-150 No coverage for days after 150
20% coinsurance
Skilled nursing facility No coinsurance for first 20 days $150.50/day for days 21-100 No coverage for days after 100
20% coinsurance
Home health No coinsurance 20% coinsurance Hospice No coinsurance NO CHANGE
Inpatient psychiatric hospital Same coverage as inpatient hospital stay (up to 190 days in a lifetime)
20% coinsurance
Part B services Physician and other medical services (such as ambulatory surgical services) 20% coinsurance 20% coinsurance Clinical laboratory services No coinsurance 20% coinsurance Home health care No coinsurance 20% coinsurance Outpatient mental health services 35% coinsurance (phasing down to 20% in 2014) 20% coinsurance One-time "Welcome to Medicare" physical exam and annual “Wellness” visit No coinsurance 20% coinsurance
Preventive services No coinsurance for most services (although 20% coinsurance for some). Some limitations based on frequency, type of service, and patient’s age and medical history.
20% coinsurance
NOTE: Table does not include all Medicare-covered benefits, and does not include Part C or Part D coverage because the alternative benefit design would not apply to those parts of the program. Current law dollar amounts for 2013 are based on estimates from the 2011 Medicare Trustees Report.

RestRuctuRing MedicaRe’s Benefit design – Implications for Beneficiaries and Spending4
4
OVERVIEW OF METHODS This analysis examines the effects of restructuring Medicare’s benefit design, using a model developed by the Actuarial Research Corporation (ARC) for the Kaiser Family Foundation, based on the Medical Expenditure Panel Survey (MEPS) 2006-2008. The dataset includes individual-level spending, utilization, supplemental insurance coverage, and demographic information on the Medicare population receiving services covered under the fee-for-service (FFS) Medicare program. Although MEPS includes beneficiaries who are enrolled in Medicare Advantage plans, they were excluded from this analysis because these plans do not follow the standard Medicare cost-sharing structure and cost sharing varies from plan to plan. The dataset also does not explicitly identify coverage through the Federal Employees Health Benefits Program. We modeled implementation of the restructured Medicare benefit design on its own and combined with the restrictions on first-dollar Medigap coverage in calendar year 2013, in order to show the full effects of these policies if implemented in the near future. To show the effects of these changes on beneficiaries’ financial obligations for Medicare-covered services, we estimated the effects on premiums and cost sharing separately, but present them in combination in the main report, which we refer to as “out-of-pocket spending,” Beneficiaries estimated to have a change in out-of-pocket spending of less than $25 (increase or decreases) are shown as having “no/nominal change.” Using the MEPS dataset, we first controlled the data to 2013 spending levels from CBO’s March 2011 Fact Sheet, with additional detail by aged/disabled and service broken out using data from the 2011 Trustees Report and the 2010 Health Care Financing Review Statistical Supplement.18 We estimated baseline cost-sharing spending patterns by applying current-law cost-sharing rules to each record in the dataset. Cost sharing was distributed among out-of-pocket and supplemental insurers based on the actual distribution of spending at the record level, which reflects each individual’s source of coverage (including different sources of coverage during the year, where applicable) and generosity of coverage. We then applied the future-law cost-sharing rules to the dataset to estimate the amount and distribution of spending based on the proposed benefit design reforms. We adjusted spending to account for changes in utilization expected to occur in response to exposure to higher or lower cost-sharing requirements, using induction assumptions that vary by service type, reflecting greater price sensitivity to certain services (e.g., physician visits) than others (e.g., inpatient admissions). For spending on premiums, we assumed that each type of payer (e.g., Medigap, employer-sponsored insurance) charges the same premium to all of its enrollees under current law and would continue to do so under a restructured Medicare benefit design. Efforts to model programmatic and policy reforms invariably require a number of assumptions and some degree of uncertainty. Our analysis incorporated a variety of modeling decisions and assumptions that influence our results. First, we modeled the effects of full implementation of these benefit design changes in 2013, although we recognize the administrative challenges of implementing such changes by then, as well as possible legal issues associated with prohibiting first-dollar coverage for current Medigap policyholders.19 We modeled the effects of the Medicare benefit redesign assuming static insurance coverage (i.e., no change in coverage) before and after the changes to the benefit design, both because there is no definitive evidence to suggest what the direction or magnitude of such changes in supplemental coverage might be, and because our model produces results for a single year and therefore it seems unlikely that we would observe meaningful changes in coverage in that time period that would affect our results. We also assumed that supplemental payers would continue to cover the same portion of enrollees’ Medicare-covered expenses (and premiums, if applicable) under the

RestRuctuRing MedicaRe’s Benefit design – Implications for Beneficiaries and Spending 5
5
alternative Medicare benefit design as they do under the current FFS design. To the extent that supplemental insurers made changes to their coverage that shifted more costs onto enrollees, we would expect Medicare (and supplemental payers) to see greater savings and beneficiaries to face larger increases in average out-of-pocket costs, relative to our results. We also conducted a sensitivity analysis around changes in the share of benefits paid by supplemental insurers to test the robustness of our results relative to our assumption of no change. A more complete discussion of how changes to our assumptions could affect our results and the results of sensitivity testing is included in Appendix A (see “Key Model Parameters, Assumptions, and Limitations”). The process of modeling the effects of a policy change for more than 40 million Medicare beneficiaries requires policy and behavioral assumptions that may oversimplify individual decisions and responses, while averaging out variations in circumstances. We nonetheless took this approach to develop a greater understanding of the expected effects of this proposal for beneficiaries and spending. An important limitation of our analysis is that while the model assumes that higher cost sharing results in lower utilization, it is beyond the scope of this analysis to consider any secondary effects resulting from changes in beneficiaries’ medical use and spending. Reductions in utilization might adversely affect the health status of beneficiaries, which is of concern in itself, but could also potentially lead to the use of more health services, and thus higher costs, over the long run. Two recent research papers have indicated the possibility of offsetting effects in response to increased cost sharing.20 Rather than going without care altogether, beneficiaries might substitute some types of services for others.21 Although we did not model these secondary effects, this is an important area to explore in future research. A detailed description of the methods, data, and assumptions used in this analysis and the results of sensitivity testing is included in Appendix A. Appendix B presents the full results of our analysis in a series of supplementary tables. Dollar estimates presented in the report, exhibits, and tables are rounded to the nearest $10.
KEY FINDINGS
Modeling the Impact of an Alternative Medicare Benefit Design The following are the key effects of restructuring the Medicare benefit design, with a single deductible for Parts A and B of $550, 20 percent coinsurance on most Medicare-covered services, and a $5,500 annual limit on cost sharing in 2013:
Nearly three-fourths (71 percent) of all beneficiaries in the traditional Medicare FFS program would have higher out-of-pocket spending for premiums and cost sharing under the alternative benefit design than under current law, 5 percent would have lower out-of-pocket spending, and nearly one quarter (24 percent) would have a nominal or no change in out-of-pocket spending.
The average increase among those with higher spending would be $180 in 2013; among the relatively small share of beneficiaries with lower costs, the average decrease would be $1,570.
Medicare spending would decrease by $4.2 billion and Medicaid spending (state and federal combined) would decline by $0.1 billion in 2013, for a total reduction of $4.3 billion. Costs are projected to increase for beneficiaries (by $2.3 billion), employers (by $0.6 billion), TRICARE ($0.2 billion), and other insurers (by $0.4 billion), for a total increase of $3.6 billion. The net change in health care spending would be a $0.7 billion reduction in 2013.
RestRuctuRing MedicaRe’s Benefit design – Implications for Beneficiaries and Spending6
6
71%
5%
5%
No/nominal change
24%
Distribution of Medicare FFS Beneficiaries, by Change in Expected Out-of-Pocket Spending Under an Alternative Medicare Benefit Design, 2013
Exhibit 3
Among 5%, average reduction =
$1,570
Among 71%, average increase =
$180
SOURCE: Actuarial Research Corporation analysis for the Kaiser Family Foundation.NOTES: FFS is fee-for-service. Out-of-pocket costs includes premiums and cost-sharing requirements. No/nominal change group includes beneficiaries with changes in spending no more than ±$25.
Alternative benefit design = $550 deductible, 20% coinsurance for all services, $5,500 cost-sharing limit
Spending reduction
Spending increase
Total Medicare FFS Beneficiaries, 2013 = 40.8 million
Average among 12% with increase greater than $250 =
$660
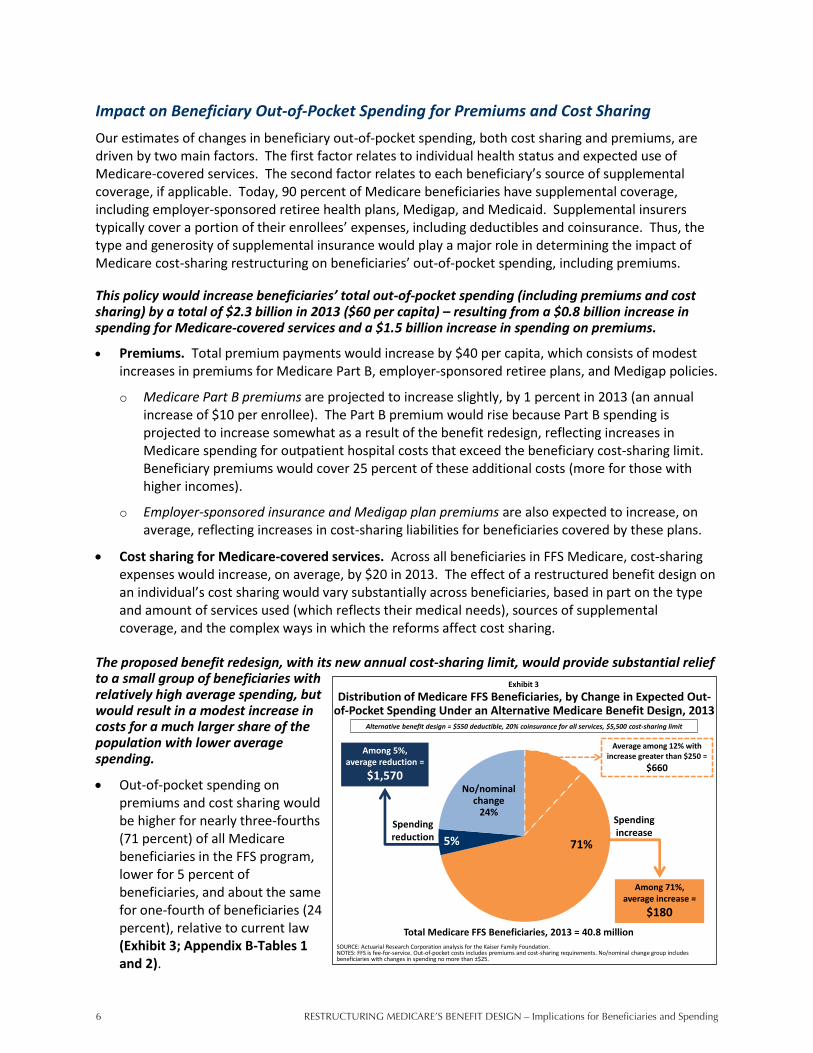
Impact on Beneficiary Out-of-Pocket Spending for Premiums and Cost Sharing Our estimates of changes in beneficiary out-of-pocket spending, both cost sharing and premiums, are driven by two main factors. The first factor relates to individual health status and expected use of Medicare-covered services. The second factor relates to each beneficiary’s source of supplemental coverage, if applicable. Today, 90 percent of Medicare beneficiaries have supplemental coverage, including employer-sponsored retiree health plans, Medigap, and Medicaid. Supplemental insurers typically cover a portion of their enrollees’ expenses, including deductibles and coinsurance. Thus, the type and generosity of supplemental insurance would play a major role in determining the impact of Medicare cost-sharing restructuring on beneficiaries’ out-of-pocket spending, including premiums. This policy would increase beneficiaries’ total out-of-pocket spending (including premiums and cost sharing) by a total of $2.3 billion in 2013 ($60 per capita) – resulting from a $0.8 billion increase in spending for Medicare-covered services and a $1.5 billion increase in spending on premiums.
Premiums. Total premium payments would increase by $40 per capita, which consists of modest increases in premiums for Medicare Part B, employer-sponsored retiree plans, and Medigap policies.
o Medicare Part B premiums are projected to increase slightly, by 1 percent in 2013 (an annual increase of $10 per enrollee). The Part B premium would rise because Part B spending is projected to increase somewhat as a result of the benefit redesign, reflecting increases in Medicare spending for outpatient hospital costs that exceed the beneficiary cost-sharing limit. Beneficiary premiums would cover 25 percent of these additional costs (more for those with higher incomes).
o Employer-sponsored insurance and Medigap plan premiums are also expected to increase, on average, reflecting increases in cost-sharing liabilities for beneficiaries covered by these plans.
Cost sharing for Medicare-covered services. Across all beneficiaries in FFS Medicare, cost-sharing expenses would increase, on average, by $20 in 2013. The effect of a restructured benefit design on an individual’s cost sharing would vary substantially across beneficiaries, based in part on the type and amount of services used (which reflects their medical needs), sources of supplemental coverage, and the complex ways in which the reforms affect cost sharing.
The proposed benefit redesign, with its new annual cost-sharing limit, would provide substantial relief to a small group of beneficiaries with relatively high average spending, but would result in a modest increase in costs for a much larger share of the population with lower average spending.
Out-of-pocket spending on premiums and cost sharing would be higher for nearly three-fourths (71 percent) of all Medicare beneficiaries in the FFS program, lower for 5 percent of beneficiaries, and about the same for one-fourth of beneficiaries (24 percent), relative to current law (Exhibit 3; Appendix B-Tables 1 and 2).

RestRuctuRing MedicaRe’s Benefit design – Implications for Beneficiaries and Spending 7
7
Distribution of Medicare FFS Beneficiaries, by Medical Service Use and Change in Expected Out-of-Pocket Spending Under an
Alternative Medicare Benefit Design, 2013
5% 1%17%
30%
63%
24%21%
20%
24%
11%
60% 66%47%
35%
16%
12% 12% 15% 11% 10%Spending increase >$250
Spending increase <$250
No/nominal change
Spending reduction
Exhibit 4
SOURCE: Actuarial Research Corporation analysis for the Kaiser Family Foundation.NOTES: FFS is fee-for-service. SNF is skilled nursing facility. Out-of-pocket spending includes premiums and cost-sharing requirements. No/nominal change group includes beneficiaries with changes in spending no more than ±$25. Users of hospitalization and SNF services are a subset of the 8.2 million beneficiaries with one or more hospitalization. Amounts may not total 100% due to rounding.
Number of beneficiaries:
Total FFS Medicare
40.8 million
Physician but no hospital services
29.6 million
One hospitalization
5.8 million
Two or more hospitalizations
2.5 million
Hospitalization and SNF services
1.6 million
Alternative benefit design = $550 deductible, 20% coinsurance for all services, $5,500 cost-sharing limit
o Among the 71 percent of beneficiaries projected to face higher costs in 2013, average out-of-pocket spending would rise by $180.
Nearly 5 million Medicare beneficiaries (12 percent of those in the FFS program) would see out-of-pocket spending increase by $250 or more in 2013, relative to current law, with an average increase of $660 each. These are mostly beneficiaries with low cost sharing under current law whose costs would increase under the alternative benefit design as a result of the combined deductible and new cost-sharing charges, including the inpatient coinsurance beginning on day one of a hospital stay. Those projected to have spending increases of $250 or more include: 1.5 million beneficiaries in fair or poor health; 1.7 million beneficiaries with no supplemental coverage; and 1.8 million beneficiaries with incomes between 100 percent and 200 percent of the federal poverty level, who are typically not on Medicaid.22
o Among the 5 percent of beneficiaries expected to see a decrease in total out-of-pocket spending in 2013, the average decrease would be $1,570.
Three percent of all Medicare FFS beneficiaries would see a decrease in out-of-pocket spending of $250 or more, with an average reduction of $2,150 each. These are mostly beneficiaries with high cost sharing under current law who would spend less under the new benefit design due to the annual cost-sharing limit.
The expected change in beneficiaries’ out-of-pocket spending is largely a function of the amount and type of services beneficiaries use, which is related to their health status (Exhibit 4).
The restructured cost-sharing design would affect different types of services in varied ways: increasing (or applying new) coinsurance for some services, lowering it for other services, and changing the deductible that beneficiaries pay before coverage under Parts A and B begins.
Beneficiaries with lower utilization – those who tend to have only a few physician visits in a year but who use no inpatient care, and who may be relatively healthy – would be expected to face higher costs, largely because they would face a new uniform deductible that would be higher than the Part B deductible under current law.
o Among those who only use Part B services (an estimated 73 percent of FFS Medicare beneficiaries in 2013), 78 percent would face an expected increase in out-of-pocket spending in 2013 under the restructured cost-sharing design, relative to current law. Just 1 percent would see savings, and 21 percent would have a nominal or no change in out-of-pocket spending.

RestRuctuRing MedicaRe’s Benefit design – Implications for Beneficiaries and Spending8
8
Distribution of Medicare FFS Beneficiaries, by Supplemental Coverage and Change in Expected Out-of-Pocket Spending Under an
Alternative Medicare Benefit Design, 2013
5% 4% 6% 4% 4%
24%8% 1%
40%
83%
60%77% 84% 14%
11%12% 10% 8%
42%
3%Spending increase >$250
Spending increase <$250
No/nominal change
Spending reduction
Exhibit 5
Number of beneficiaries:
Total FFS Medicare
40.8 million
Employer-sponsored insurance
15.9 million
Medigap
11.8 million
Medicare only
4.1 million
Medicaid
6.9 million
SOURCE: Actuarial Research Corporation analysis for the Kaiser Family Foundation.NOTES: FFS is fee-for-service. Out-of-pocket spending includes premiums and cost-sharing requirements. Employer includes TRICARE enrollees. No/minimal change group includes beneficiaries with changes in spending no greater than ±$25. Amounts may not total 100% due to rounding.
Alternative benefit design = $550 deductible, 20% coinsurance for all services, $5,500 cost-sharing limit
Beneficiaries with higher utilization – those who need expensive inpatient and post-acute care or who use other high-cost outpatient services, and who may be in relatively poor health – would be more likely to benefit from the alternative benefit design, because they are more likely to incur expenditures that would exceed the new cost-sharing limit.
o Nearly one in five beneficiaries with one hospitalization (an estimated 17 percent in 2013) would see a reduction in their out-of-pocket spending, as would nearly one-third of those with two or more hospitalizations annually, and nearly two-thirds of those with a hospitalization followed by a stay in a skilled nursing facility; for this group, out-of-pocket spending is projected to be $1,090 lower, on average, under the alternative benefit design than under current law.
Beneficiaries with no utilization in 2013 would face no change in cost-sharing amounts but are expected to face higher costs under the alternative benefit design as a result of higher premiums for Medicare Part B and supplemental coverage, if applicable.
Supplemental insurance also plays a major role in determining the impact of Medicare cost-sharing restructuring on beneficiaries’ out-of-pocket spending (Exhibit 5).
Supplemental payers are expected to help enrollees pay for the new cost-sharing requirements under the alternative benefit design. However, some supplemental plans are also expected to pass some of these new expenses on to enrollees in the form of higher premiums. While supplemental coverage would shield some enrollees from large increases in spending associated with higher cost-sharing requirements under the alternative benefit design, out-of-pocket spending would nonetheless go up for many, because they would be responsible for a portion of the higher cost-sharing requirements and higher premiums for their supplemental coverage. Even those who do not use any Medicare-covered services in a given year – a small share of the total Medicare population – would see their costs rise due to higher insurance premiums.
Medicare FFS only (no supplemental coverage). In comparison to other groups, beneficiaries without supplemental coverage, who are responsible for paying the full cost-sharing amount for Medicare-covered services, would be more likely to have relatively large increases in spending of $250 or more (42 percent, compared to 8 percent of all other beneficiaries). Overall, more than half (56 percent) of the 4 million beneficiaries without supplemental coverage would face an increase in out-of-pocket spending compared to current law, 4 percent would have lower spending, and 40 percent would have a nominal or no change. Beneficiaries without supplemental coverage would benefit from the cost-sharing limit, but that level of financial protection is generally reached in any given year only by a very small share with very high medical spending. The majority of those without supplemental coverage would face higher out-of-pocket costs due to the combined deductible for Part A and B services, coinsurance for inpatient hospital and SNF beginning on day one of a stay, and the imposition of new cost-sharing requirements for home health services.

RestRuctuRing MedicaRe’s Benefit design – Implications for Beneficiaries and Spending 9
9
Employer-sponsored retiree coverage. For the more than one-third (39 percent) of all Medicare beneficiaries who have supplemental coverage from an employer-sponsored plan (including TRICARE enrollees), virtually all (87 percent) would be expected to face an increase in out-of-pocket spending relative to current law, with an average increase of $150. Beneficiaries with employer-sponsored insurance tend to be healthier than others on Medicare, so they would be less likely to benefit from the annual cost-sharing limit and more likely to see their out-of-pocket spending increase due to the combined deductible and new cost-sharing requirements. Having employer coverage would moderate the effect of the alternative benefit redesign on enrollees’ cost-sharing payments by covering a portion of enrollees’ new liabilities; however, some of the new employer plan spending would be passed on to all enrollees in the form of a modest average increase in premiums. Premiums for employer-sponsored retiree coverage (but not TRICARE) are expected to increase by 6 percent in 2013 under the restructured benefit design ($40 per year for enrollees).
Medigap. Medicare beneficiaries with Medigap would be expected to fare similarly to beneficiaries with employer coverage under the restructured cost-sharing design. A large majority of Medicare beneficiaries with Medigap (93 percent) are projected to see an increase in out-of-pocket spending in 2013, relative to current law, with an average increase of $140. Medigap premiums are projected to rise by 2 percent ($40 per year for enrollees), reflecting the expected increase in cost-sharing obligations for policyholders, some of which would be paid for by Medigap.
Medicaid. In contrast to those with other sources of supplemental coverage, or none whatsoever, the vast majority of beneficiaries covered by Medicaid (83 percent) would see no substantial change in their out-of-pocket spending because Medicaid generally pays Medicare’s premiums, deductibles and coinsurance on behalf of full dual eligibles. However, some full dual eligibles could be liable for cost sharing because they reside in states that do not pay Medicare’s coinsurance in full. Moreover, our analysis may misstate the effects for full-year full-dual eligibles, because the model reflects a mix of full and partial benefits. Beneficiaries with partial Medicaid coverage would be affected by the cost-sharing reforms. For instance, Specified Low-Income Medicare Beneficiaries (SLMBs) receive assistance paying for Medicare premiums but not for cost sharing and would thus be responsible for the new unified deductible and coinsurance. Additionally, part-year Medicaid enrollees could be responsible for cost sharing during the portion of the year when they were not covered by Medicaid.
Because the type and amount of health spending and supplemental coverage under current law varies by demographic group, such as gender, age, and race/ethnicity, the alternative benefit design would have different implications for different subgroups of FFS beneficiaries (Appendix B-Table 1).
Relative to current law, subgroups of beneficiaries that are more likely than others to experience a reduction in out-of-pocket spending in 2013, or less likely than others to experience an increase in spending, include those with relatively low incomes and those of racial/ethnic minority groups. Conversely, subgroups that are more likely than others to have an increase in out-of-pocket spending, or less likely to have a reduction in spending, include those with relatively high incomes and white beneficiaries.
Partly because Medicaid and the Medicare Savings Programs (MSP) cover all or a portion of Medicare’s cost sharing for low-income Medicare beneficiaries, a smaller share of those with lower incomes would face higher costs associated with the restructured cost sharing than those with higher incomes. This would also likely be the case for beneficiaries in racial/ethnic minority groups, who tend to have lower incomes than white beneficiaries and are therefore more likely to qualify for cost-sharing assistance from Medicaid or MSP. However, our model does not have the ability to

RestRuctuRing MedicaRe’s Benefit design – Implications for Beneficiaries and Spending10
10
$0.7
$2.3
$4.2
$0.6
$0.05
$0.4
$0.04
$0.2
Net
Other
Federal
Exhibit 6
SOURCE: Actuarial Research Corporation analysis for the Kaiser Family Foundation.NOTES: FFS is fee-for-service. Other supplemental insurers includes Veterans’ Administration, Indian Health Service and other federal sources; other state and local sources; worker’s compensation; and other unclassified sources.
Net Change in Total Health Care Spending From Current Law Under an Alternative Medicare Benefit Design, 2013
Medicare Medicaid: Federal - State
Beneficiaries
Employers
Other supplemental insurers
TRICARE
SPENDING DECREASES
SPENDING INCREASES
NET CHANGE
Total = $4.3 billion decrease
Total = $3.6 billion
increase
Total = $0.7 billion decrease
Alternative benefit design = $550 deductible, 20% coinsurance for all services, $5,500 cost-sharing limit
allow us to quantify the interplay of supplemental coverage, utilization, and demographics (such as race/ethnicity, income, and age) – which could all be moving in tandem or in opposite directions – in order to fully explain the effects we observe at the subgroup level.
Impact on Total Health Care Spending Proposals that involve making substantial changes to the Medicare program often have direct and indirect effects on other payers. For example, an earlier study of the effects of raising the age of eligibility for Medicare from 65 to 67, also conducted by the Kaiser Family Foundation and ARC, illustrated that this policy would reduce Medicare spending but shift costs to other payers, and would ultimately result in an increase in total health spending.23
As with the proposal to raise the age of Medicare eligibility, the proposal for restructuring Medicare’s benefit design would reduce federal spending but increase spending by beneficiaries and other payers, resulting in a net $0.7 billion reduction in total health care spending in 2013. The net downward effect includes reductions in spending for Medicare ($4.2 billion) and Medicaid ($0.1 billion), offset by increases for beneficiaries ($2.3 billion), employers ($0.6 billion), TRICARE ($0.2 billion), and other payers ($0.4 billion) (Exhibit 6). Medicare and Other Federal Spending. Medicare and federal Medicaid spending would be expected to decrease by $4.2 billion ($3.6 billion if Part B premium receipts are excluded) and $0.05 billion respectively, offset by a $0.2 billion increase in TRICARE spending. Our estimates of changes in Medicare spending assume implementation at the beginning of calendar year (CY) 2013 and are controlled to CBO’s estimates of changes in federal outlays. Our estimate of federal savings ($4.2 billion in Medicare savings in CY 2013) differs slightly from that published by CBO in its March 2011 report ($2.7 billion in Medicare savings for fiscal year (FY) 2013). More than half of the difference is due to CBO’s FY 2013 estimate only reflecting the first nine months of the 2013 calendar year, while our analysis includes a full 12-month calendar year estimate. Further, our analysis takes into account Part B premium receipts in the calculation of savings, but CBO reflects only outlays. If our analysis excluded premium receipts and used a fiscal year time frame, the savings would be identical because we aligned with CBO for aggregate changes to outlays before examining the distributional effects. The $3.6 billion reduction in Medicare spending, excluding premium receipts, includes a net $2.8 billion reduction in aggregate Medicare spending on FFS benefit payments and a $0.8 billion reduction in spending on Medicare Advantage, based on our assumption that payments to Medicare Advantage plans would be adjusted by the implied percentage change in benefits for FFS beneficiaries.24 Despite the new cost-sharing limit, Medicare spending would decrease, on net, primarily due to increasing

RestRuctuRing MedicaRe’s Benefit design – Implications for Beneficiaries and Spending 11
11
Net Change in Medicare Spending From Current Law Under an Alternative Medicare Benefit Design, 2013
$4.6
$6.8
$3.6
$2.3 $1.3 $0.5 $0.8 $0.6
Exhibit 7
SOURCE: Actuarial Research Corporation analysis for the Kaiser Family Foundation.
Inpatient Hospital
Net Medicare Savings
Home Health (Part B)
Home Health (Part A)
Physician
Medicare Spending = $8.2 billion
Medicare Savings = $12.4 billionMedicare
Advantage
Part B Premiums
Outpatient Skilled Nursing Facility
$4.2 billion
Alternative benefit design = $550 deductible, 20% coinsurance for all services, $5,500 cost-sharing limit
beneficiaries’ exposure to cost sharing for services that currently have no or very little coinsurance, including home health, the first 60 days of a benefit period for hospitalizations, and the first 20 days of a SNF stay (Exhibit 7). Medicare benefit payments are estimated to increase for some services and decrease for others under the restructured cost-sharing design. Under the restructured benefit design, Medicare spending would increase for skilled nursing facility and outpatient services by $8.2 billion overall, but would decrease for all other Medicare-covered services by $11.0 billion overall, for a net aggregate reduction in benefit spending of $2.8 billion. For Part A services, Medicare spending would decrease by $4.5 billion, which would improve the financial outlook of the Hospital Insurance Trust Fund. The net Part A reduction would result from the following spending changes:
$6.8 billion decrease for inpatient services, resulting from the 20 percent coinsurance for inpatient stays beginning on day one of a hospital stay and expected reduction in utilization.
$1.3 billion decrease for home health services covered by Part A, as a result of the new 20 percent coinsurance on home health services and expected reduction in utilization.
$3.6 billion increase for skilled nursing facility stays, as a large portion of SNF spending is preceded by a hospital stay with accompanying physician services, and thus would be expected to occur after beneficiaries had reached the catastrophic limit, and would therefore be covered by Medicare.
For Part B services, Medicare spending would increase by $1.8 billion on net as a result of the following spending changes:
$4.6 billion increase for outpatient services, as the expense of those services and associated physician services plus the higher likelihood of inpatient hospital stays for outpatient service users would likely push their costs above the out-of-pocket maximum, which would shift costs from beneficiaries and other payers onto Medicare.
$2.3 billion decrease for home health services covered by Part B, due to the new coinsurance for these services and expected reduction in utilization.
$0.5 billion decrease for physician services, as a result of the combined deductible that is higher than the current-law deductible for Part B services and expected reduction in utilization.
The $1.8 billion increase in Part B spending would be offset by a $0.6 billion increase in Part B premiums, which are set annually to cover 25 percent of Part B costs.

RestRuctuRing MedicaRe’s Benefit design – Implications for Beneficiaries and Spending12
12
Medicaid Spending (Federal and State). On net, Medicaid spending would decrease by about $0.1 billion in 2013 as a result of this policy ($0.05 billion federal/ $0.04 billion states, based on percentages roughly equivalent to the federal/state share of aggregate Medicaid spending).25 Savings to Medicaid are primarily due to reductions in spending on benefit payments for dual eligibles with hospitalizations and/or post-acute SNF stays, as Medicare would assume a larger share of the cost for dual eligibles who reach Medicare’s new limit on out-of-pocket spending. Medicaid savings from the cost-sharing limit would be offset by higher Medicaid costs associated with the unified deductible (which would be higher for those using only Part B-covered services under current law) and the new coinsurance requirements for inpatient, home health, and SNF services. Medicaid savings would be further offset by $0.2 billion in higher spending on Part B premiums for dual eligibles, in accordance with the increase in Part B premiums that reflects higher Part B spending projected to occur under this policy. Employer Spending. On net, costs associated with employer-sponsored retiree coverage would increase by $1.2 billion in 2013 as a result of this policy. We assume half of this increase ($0.6 billion) would be paid by employers and half would be paid by retirees in the form of higher premiums. This increase is largely a function of the unified deductible that would be higher under the restructured cost-sharing design for those without an inpatient stay than under current law, and new coinsurance requirements for inpatient, SNF and home health services paid by beneficiaries with employer-sponsored retiree health benefits. Our analysis finds that employers would not benefit as much as might be expected from the out-of-pocket spending limit because cost sharing would essentially be shifted from higher-cost to lower-cost beneficiaries under the alternative benefit design. While employers would no longer have to pay for extremely high cost sharing for high-cost beneficiaries, they would have to pay the combined deductible and 20 percent coinsurance where currently there is either no cost sharing whatsoever (home health) or none until a beneficiary exceeds a certain number of days in a hospital or skilled nursing facility. Modeling the Impact of an Alternative Medicare Benefit Design with Different Cost-Sharing Limits To understand how sensitive our results are to the specific threshold used to establish the limit on beneficiary cost sharing for Medicare-covered services, we modeled the restructured Medicare benefit design with limits above ($7,500) and below ($4,000) the $5,500 limit, holding constant the $550 deductible and the 20 percent coinsurance on virtually all services.26 Under these different limits, we recalculated the impact on the share of beneficiaries estimated to have higher or lower spending, and the effects on aggregate beneficiary, federal, Medicaid, and employer spending.
Lowering the threshold from $5,500 to $4,000 would significantly increase the share of beneficiaries who would see a reduction in out-of-pocket spending, from 5 percent to 30 percent, and would decrease the share who would see an increase in out-of-pocket spending, from 71 percent to 37 percent.
Conversely, increasing the limit from $5,500 to $7,500 would modestly decrease the number of beneficiaries who would see lower out-of-pocket spending as a result of the benefit restructuring, from 5 percent to 3 percent, but would have virtually no effect on the share of beneficiaries who would face an increase in out-of-pocket spending (71 percent versus 72 percent). Imposing a higher limit, however, would significantly increase the number of beneficiaries with increases in spending of $250 or more (from 12 percent to 39 percent) (Appendix B-Tables 3, 4 and 5).
RestRuctuRing MedicaRe’s Benefit design – Implications for Beneficiaries and Spending 13
13
Distribution of Medicare FFS Beneficiaries, by Change in Expected Out-of-Pocket Spending Under an Alternative Medicare Benefit Design
with Different Cost-Sharing Limits, 2013
Exhibit 8
5%
3%
30%
24%
24%
32%
60%
33%
29%
12%
39%
8%
$5,500
$7,500
$4,000
Spending reduction No/nominal change Spending increase <$250 Spending increase >$250Cost-sharing limit:
Alternative benefit design = $550 deductible, 20% coinsurance for all services, $4,000/$5,500/$7,500 cost-sharing limit
SOURCE: Actuarial Research Corporation analysis for the Kaiser Family Foundation.NOTES: FFS is fee-for-service. Out-of-pocket costs includes premiums and cost-sharing requirements. No/minimal change group includes beneficiaries with changes in spending no greater than ±$25. Amounts may not total 100% due to rounding.
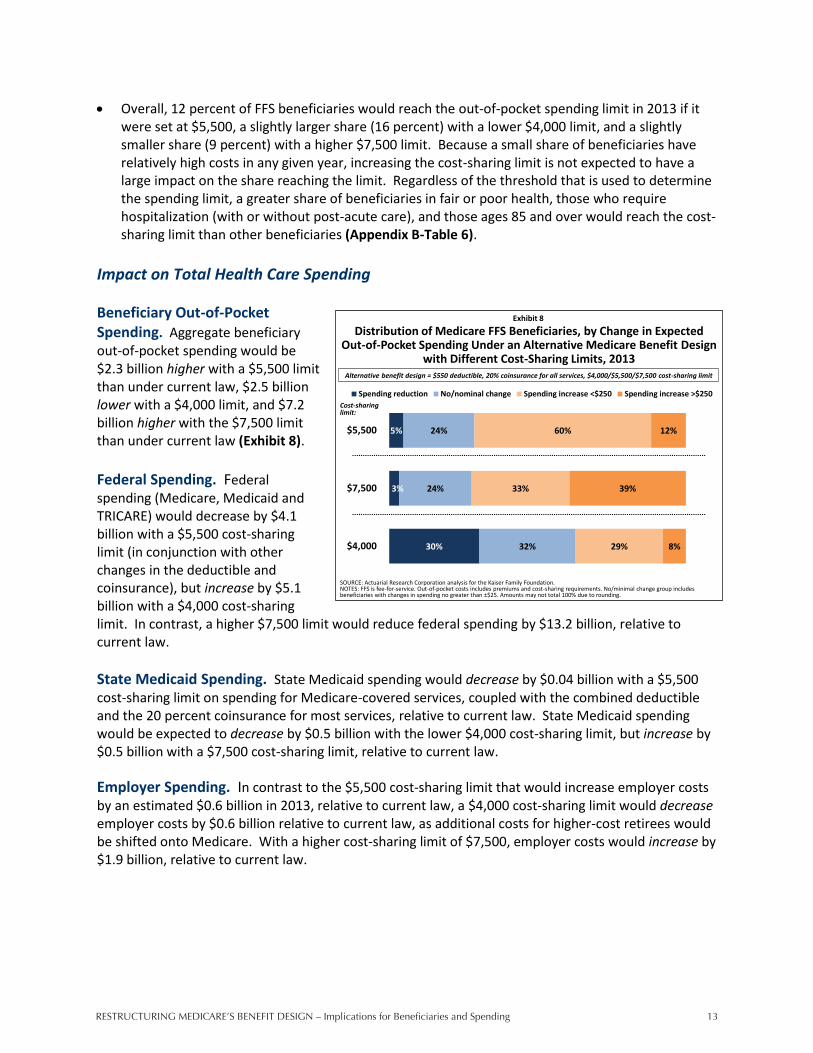
Overall, 12 percent of FFS beneficiaries would reach the out-of-pocket spending limit in 2013 if it were set at $5,500, a slightly larger share (16 percent) with a lower $4,000 limit, and a slightly smaller share (9 percent) with a higher $7,500 limit. Because a small share of beneficiaries have relatively high costs in any given year, increasing the cost-sharing limit is not expected to have a large impact on the share reaching the limit. Regardless of the threshold that is used to determine the spending limit, a greater share of beneficiaries in fair or poor health, those who require hospitalization (with or without post-acute care), and those ages 85 and over would reach the cost-sharing limit than other beneficiaries (Appendix B-Table 6).
Impact on Total Health Care Spending Beneficiary Out-of-Pocket Spending. Aggregate beneficiary out-of-pocket spending would be $2.3 billion higher with a $5,500 limit than under current law, $2.5 billion lower with a $4,000 limit, and $7.2 billion higher with the $7,500 limit than under current law (Exhibit 8). Federal Spending. Federal spending (Medicare, Medicaid and TRICARE) would decrease by $4.1 billion with a $5,500 cost-sharing limit (in conjunction with other changes in the deductible and coinsurance), but increase by $5.1 billion with a $4,000 cost-sharing limit. In contrast, a higher $7,500 limit would reduce federal spending by $13.2 billion, relative to current law. State Medicaid Spending. State Medicaid spending would decrease by $0.04 billion with a $5,500 cost-sharing limit on spending for Medicare-covered services, coupled with the combined deductible and the 20 percent coinsurance for most services, relative to current law. State Medicaid spending would be expected to decrease by $0.5 billion with the lower $4,000 cost-sharing limit, but increase by $0.5 billion with a $7,500 cost-sharing limit, relative to current law. Employer Spending. In contrast to the $5,500 cost-sharing limit that would increase employer costs by an estimated $0.6 billion in 2013, relative to current law, a $4,000 cost-sharing limit would decrease employer costs by $0.6 billion relative to current law, as additional costs for higher-cost retirees would be shifted onto Medicare. With a higher cost-sharing limit of $7,500, employer costs would increase by $1.9 billion, relative to current law.
RestRuctuRing MedicaRe’s Benefit design – Implications for Beneficiaries and Spending14
14
Exhibit 9
SOURCE: Actuarial Research Corporation analysis for the Kaiser Family Foundation.NOTES: FFS is fee-for-service. Amounts may not sum to totals due to rounding.
Net Change in Total Health Care Spending From Current Law Under an Alternative Medicare Benefit Design
with Different Cost-Sharing Limits, 2013Alternative benefit design = $550 deductible, 20% coinsurance for all services, $4,000/$5,500/$7,500 cost-sharing limit
Cost-sharing limit:$5,500 $4,000 $7,500
Federal – Total -$4.1 billion $5.1 billion -$13.2 billionMedicare -$4.2 $5.8 -$14.4Medicaid -$0.05 -$0.7 $0.6TRICARE $0.2 -$0.1 $0.5
Beneficiary – Total $2.3 -$2.5 $7.2Coinsurance $0.8 -$0.7 $2.4Premiums $1.5 -$1.8 $4.8
State Medicaid -$0.04 -$0.5 $0.5Employers $0.6 -$0.6 $1.9Other supplemental insurers $0.4 $0.06 $0.8Total savings $4.3 billion $4.4 billion $14.4 billion
Total spending $3.6 billion $5.9 billion $11.4 billion
Net Change in Total Health Spending: $0.7 billiondecrease
$1.5 billionincrease
$2.9 billiondecrease
Distribution of Medicare FFS Beneficiaries, by Change in Expected Out-of-Pocket Spending Under an Alternative Medicare Benefit Design
with and without Medigap Coverage Restrictions, 2013
24%
5%
26%
24%
36%
60%
14%
12%
Spending reduction No/nominal change Spending increase <$250 Spending increase >$250
Exhibit 10
Alternative benefit design:- $550 deductible- 20% coinsurance- $5,500 cost-sharing limit
Alternative benefit design with Medigap restrictions:- Alternative benefit design- Medigap restrictions: Plans cannot cover first
$550 in Medicare A/B costs Plans cannot cover more
than 50% of cost sharing up to new limit
SOURCE: Actuarial Research Corporation analysis for the Kaiser Family Foundation.NOTES: FFS is fee-for-service. Out-of-pocket costs includes premiums and cost-sharing requirements. No/minimal change group includes beneficiaries with changes in spending no greater than ±$25.
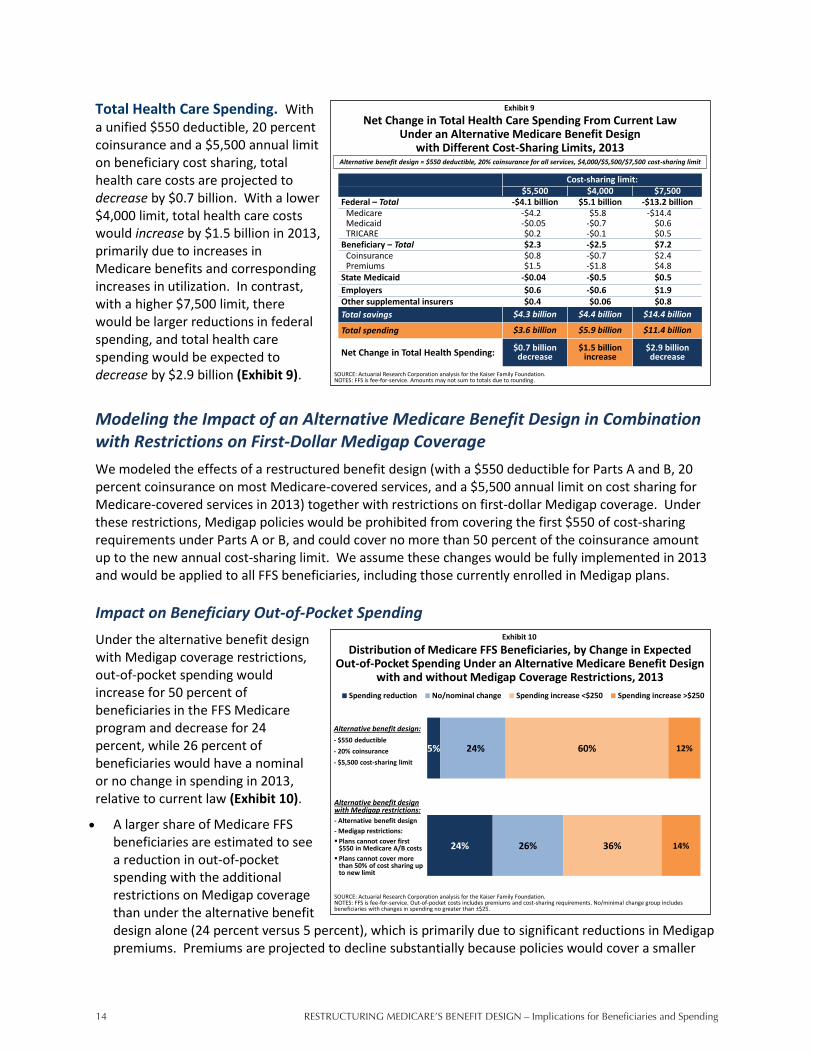
Total Health Care Spending. With a unified $550 deductible, 20 percent coinsurance and a $5,500 annual limit on beneficiary cost sharing, total health care costs are projected to decrease by $0.7 billion. With a lower $4,000 limit, total health care costs would increase by $1.5 billion in 2013, primarily due to increases in Medicare benefits and corresponding increases in utilization. In contrast, with a higher $7,500 limit, there would be larger reductions in federal spending, and total health care spending would be expected to decrease by $2.9 billion (Exhibit 9).
Modeling the Impact of an Alternative Medicare Benefit Design in Combination with Restrictions on First-Dollar Medigap Coverage We modeled the effects of a restructured benefit design (with a $550 deductible for Parts A and B, 20 percent coinsurance on most Medicare-covered services, and a $5,500 annual limit on cost sharing for Medicare-covered services in 2013) together with restrictions on first-dollar Medigap coverage. Under these restrictions, Medigap policies would be prohibited from covering the first $550 of cost-sharing requirements under Parts A or B, and could cover no more than 50 percent of the coinsurance amount up to the new annual cost-sharing limit. We assume these changes would be fully implemented in 2013 and would be applied to all FFS beneficiaries, including those currently enrolled in Medigap plans. Impact on Beneficiary Out-of-Pocket Spending Under the alternative benefit design with Medigap coverage restrictions, out-of-pocket spending would increase for 50 percent of beneficiaries in the FFS Medicare program and decrease for 24 percent, while 26 percent of beneficiaries would have a nominal or no change in spending in 2013, relative to current law (Exhibit 10).
A larger share of Medicare FFS beneficiaries are estimated to see a reduction in out-of-pocket spending with the additional restrictions on Medigap coverage than under the alternative benefit design alone (24 percent versus 5 percent), which is primarily due to significant reductions in Medigap premiums. Premiums are projected to decline substantially because policies would cover a smaller

RestRuctuRing MedicaRe’s Benefit design – Implications for Beneficiaries and Spending 15
15
Distribution of Medicare FFS Beneficiaries, by Supplemental Coverage and Change in Expected Out-of-Pocket Spending Under an
Alternative Medicare Benefit Design with Medigap Restrictions, 2013
24%5%
71%
4% 4%
26%
11%
2%
41%
83%
36%
77%
5%
14%
11%14% 7%21%
40%
3%Spending increase >$250
Spending increase <$250
No/nominal change
Spending reduction
Exhibit 11
Number of beneficiaries:
Total FFS Medicare
40.8 million
Employer-sponsored insurance
15.9 million
Medigap
11.8 million
Medicare only
4.1 million
Medicaid
6.9 million
SOURCE: Actuarial Research Corporation analysis for the Kaiser Family Foundation.NOTES: FFS is fee-for-service. Out-of-pocket spending includes premiums and cost-sharing requirements. Employer includes TRICARE enrollees. No/minimal change group includes beneficiaries with changes in spending no greater than ±$25. Amounts may not total 100% due to rounding.
Alternative benefit design = $550 deductible, 20% coinsurance for all services, $5,500 cost-sharing limit
Distribution of Medigap Policyholders by Change in Expected Out-of-Pocket Spending, with and without Premiums, 2013
Under an Alternative Medicare Benefit Design with Medigap Coverage Restrictions
1%
71%
5%
2%
11%
5%
84%
21%
Spending reduction No/nominal change Spending increase <$250 Spending increase >$250
Exhibit 12
Change in out-of-pocket costs for Medigap policyholders, including premiums and cost sharing
SOURCE: Actuarial Research Corporation analysis for the Kaiser Family Foundation.NOTES: FFS is fee-for-service. Out-of-pocket costs includes premiums and cost-sharing requirements. No/minimal change group includes beneficiaries with changes in spending no greater than ±$25.
Change in out-of-pocket costs for Medigap policyholders, including cost sharing only (excluding premiums)
Percent with spending reduction, including premiums
Percent with spending increase >$250, excluding premiums
share of Medicare-covered claims and beneficiaries would use fewer services when faced with higher cost-sharing requirements (Exhibit 5 and Exhibit 11).
More than 8 million beneficiaries, or 20 percent of FFS beneficiaries, would be expected to see out-of-pocket spending decrease by more than $250 in 2013 under the alternative benefit design with Medigap restrictions. This group includes many beneficiaries in relatively good health who use few services, and many Medigap policyholders. But nearly 6 million Medicare beneficiaries in the FFS program (14 percent of those in the FFS program) would be expected to see out-of-pocket spending increase by more than $250 (with an average increase of $780 each). This group includes 2.5 million Medicare beneficiaries who are Medigap policyholders and 1.6 million beneficiaries without supplemental coverage, 2.1 million beneficiaries in fair or poor health, and more than 3 million beneficiaries with incomes below 200 percent of the poverty level (Appendix B-Tables 7 and 8).
Among Medigap policyholders alone, the changes in out-of-pocket spending relative to the alternative benefit design alone are even greater. Without the restrictions on Medigap coverage, just 6 percent of Medigap enrollees would see a reduction in out-of-pocket costs, relative to current law. With the Medigap restrictions, more than 7 in 10 (71 percent) of all Medigap policyholders would see a reduction in out-of-pocket costs, in large part due to a reduction in premiums. Medigap premiums are expected to go down because Medigap would cover limited amounts of Medicare cost sharing; in addition, enrollees would take on a larger portion of Medicare cost sharing and are expected to use fewer services as a result, and therefore Medigap plans would be covering cost sharing for fewer Medicare-covered claims.
o The distribution of beneficiaries with spending reductions and increases looks quite different depending on whether or not the out-of-pocket spending measure includes both cost sharing and premium changes or cost sharing only. If premiums are excluded from out-of-pocket spending, 95 percent of Medigap enrollees would face an increase in out-of-pocket spending, 1 percent would face a decrease in spending, and 5 percent would face a nominal or no change (Exhibit 12).

RestRuctuRing MedicaRe’s Benefit design – Implications for Beneficiaries and Spending16
16
Distribution of Medicare FFS Beneficiaries, by Medical Service Use and Change in Expected Out-of-Pocket Spending Under an
Alternative Medicare Benefit Design with Medigap Restrictions, 2013
24% 26% 22% 24%
48%
26% 23% 23% 26%
11%
36% 41%
25% 14%11%
14% 11%30% 37% 30%
Spending increase >$250
Spending increase <$250
No/nominal change
Spending reduction
Exhibit 13
SOURCE: Actuarial Research Corporation analysis for the Kaiser Family Foundation.NOTES: FFS is fee-for-service. SNF is skilled nursing facility. Out-of-pocket spending includes premiums and cost-sharing requirements. No/nominal change group includes beneficiaries with changes in spending no more than ±$25. Users of hospitalization and SNF services are a subset of the 8.2 million beneficiaries with one or more hospitalization. Amounts may not total 100% due to rounding.
Number of beneficiaries:
Total FFS Medicare
40.8 million
Physician but no hospital services
29.6 million
One hospitalization
5.8 million
Two or more hospitalizations
2.5 million
Hospitalization and SNF services
1.6 million
Alternative benefit design = $550 deductible, 20% coinsurance for all services, $5,500 cost-sharing limit
Net Change in Total Health Care Spending from Current Law Under an Alternative Medicare Benefit Design with and without
Medigap Coverage Restrictions, 2013
Exhibit 14
SOURCE: Actuarial Research Corporation analysis for the Kaiser Family Foundation.NOTES: Amounts may not sum to totals due to rounding.
Alternative benefit design
Alternative benefit design with Medigap
restrictionsFederal – Total -$4.1 billion -$8.8 billion
Medicare -$4.2 -$8.8Medicaid -$0.05 -$0.2TRICARE $0.2 $0.2
Beneficiary – Total $2.3 -$1.5Coinsurance $0.8 $10.3Premiums $1.5 -$11.8
State Medicaid -$0.04 -$0.2Employers $0.6 $0.6Other supplemental insurers $0.4 $0.4Total savings $4.3 billion $21.1 billionTotal spending $3.6 billion $11.6 billionNet Change in Total Health Spending: $0.7 billion decrease $9.5 billion decrease
Alternative benefit design = $550 deductible, 20% coinsurance for all services, $5,500 cost-sharing limit
Overall, 61 percent of Medigap enrollees would face an increase in spending on cost sharing alone of $500 or more.
The expected change in beneficiaries’ out-of-pocket costs under the alternative benefit design with Medigap coverage restrictions is also largely driven by the Medicare-covered services they use (Exhibit 4 and Exhibit 13).
o Combining the alternative benefit design with restrictions on Medigap coverage, a much smaller share of relatively healthy beneficiaries who use Part B services only (i.e., no hospitalizations), would experience an increase in costs than under the alternative Medicare benefit design alone (52 percent versus 78 percent). This is because higher cost sharing for this group (mainly attributable to the unified deductible) would be more than offset by reductions in Medigap premiums.
o Conversely, when combining the Medigap restrictions with the alternative benefit design, a larger share of beneficiaries who use inpatient hospital and post-acute SNF care would face higher out-of-pocket costs than without the Medigap restrictions (41 percent versus 26 percent). With the Medigap coverage restrictions, some of these high users would be responsible for a larger share of inpatient and SNF coinsurance than under current law or the restructured benefit design alone, which would likely outweigh any decrease in premiums they might otherwise experience.
Impact on Total Health Care Spending By incorporating the restriction on Medigap coverage with the alternative benefit design, aggregate beneficiary spending would decrease, rather than increase as under the alternative benefit design alone, while Medicare spending and total health care spending would decrease even further than they would under the alternative benefit design alone (Exhibit 14). The increased savings are largely attributable to a reduction in Medicare spending on Medicare-covered services that would result

RestRuctuRing MedicaRe’s Benefit design – Implications for Beneficiaries and Spending 17
17
from a reduction in use by Medigap enrollees in response to increased exposure to cost sharing; this would result in lower Medigap premiums, as Medigap policies cover a substantially smaller share of enrollees’ total Medicare costs. Beneficiary Out-of-Pocket Spending. Aggregate beneficiary spending would be expected to decrease by $1.5 billion in 2013 when Medigap restrictions are imposed in combination with the restructured Medicare benefit design. In contrast, without the restrictions on first-dollar Medigap coverage, beneficiary spending would be expected to increase by $2.3 billion. The aggregate reduction in beneficiary spending that is expected to occur with the restriction on Medigap first-dollar coverage is due to a significant reduction in Medigap premiums as enrollees become responsible for a larger share of the cost of Medicare-covered services, as well as the reduction in their use of services as a result; the total reduction in premiums is greater than the total increase in cost sharing that results from less generous Medigap policies. In the aggregate, beneficiary premium spending would decrease by $11.8 billion, while beneficiary cost sharing would increase by $10.3 billion. Federal Spending. Federal spending would decrease by an estimated $8.8 billion in 2013 if the alternative Medicare benefit design were combined with restrictions on Medigap coverage – more than double the estimated $4.1 billion in federal savings under the alternative FFS benefit design alone. The greater reduction in Medicare spending is due to reductions in utilization that would occur when beneficiaries with Medigap are faced with higher cost-sharing requirements. State Medicaid Spending. Because Part B premiums are expected to decrease under the alternative benefit design in combination with Medigap restrictions, state Medicaid expenses (which cover dual eligibles’ premiums) would decrease by $0.2 billion in 2013, more than the $0.04 billion estimated under the restructured Medicare benefit without the Medigap restrictions. Employer Spending. Employers would not be directly affected by the Medigap restrictions, and as a result, the combination of the restriction in Medigap coverage and the alternative FFS benefit design would have the same impact on employer spending as would the restructured benefit alone. Total Health Care Spending. When Medigap restrictions are combined with a restructured Medicare benefit, total health care spending is projected to decrease by an estimated $9.5 billion in 2013, which primarily results from large reductions in Medicare spending and Medigap premiums, offset somewhat but not completely by higher beneficiary coinsurance payments. This is substantially larger than the net reduction in total health care spending of $0.7 billion under the alternative Medicare benefit design alone. The substantially larger total savings occurs when beneficiaries with Medigap scale back on utilization of Medicare-covered services in response to higher cost-sharing requirements in Medicare combined with restricted Medigap coverage, along with reductions in premiums paid by Medigap enrollees. As noted earlier, however, this analysis does not explore the extent to which reductions in utilization could have an adverse impact on the health of beneficiaries if beneficiaries forego needed care, or lead to higher costs in the longer term as a result. Further analysis looking at these offsetting costs of imposing higher cost sharing on elderly and disabled beneficiaries is needed before definitely concluding that this policy would result in a reduction in total (or federal) health care spending over the long term.

RestRuctuRing MedicaRe’s Benefit design – Implications for Beneficiaries and Spending18
18
DISCUSSION OF ALTERNATIVE PROPOSALS Our analysis focuses on one of many possible ways to restructure the Medicare benefit design, based on proposals that have been considered in the context of reducing Medicare spending and the national deficit and debt. Others have suggested alternative approaches to restructuring the Medicare benefit to achieve different policy objectives, including introducing more progressivity in the benefit design by providing less protection to higher-income beneficiaries and/or more protection to those with modest incomes, encouraging the use of higher-value services and discouraging the use of lower-value services through a value-based benefit design, and mitigating the need for private supplemental insurance by providing similar or better coverage as an option under Medicare. Below, we discuss some of these alternatives, the expected effects for beneficiaries and spending, and possible implementation challenges (where applicable). Maintain the unified deductible and coinsurance, but income-relate the annual cost-sharing limit.
This proposal would increase the progressivity of the alternative benefit design by imposing a higher out-of-pocket spending limit on beneficiaries with higher incomes and a lower limit on those with more modest incomes. Such a design could lead to higher Medicare spending, however, depending on where the cost-sharing limits are set and how many beneficiaries ultimately reached the lower levels. A variation of this approach, which would likely achieve somewhat greater savings than the alternative design modeled in our analysis, would be to raise the cost-sharing limit for higher-income beneficiaries, and maintain the same limit for all others. To implement income-related limits, several administrative issues would need to be addressed, such as how Medicare would determine the income of each beneficiary in order to implement the income-related limit and how employers and other supplemental insurers would administer an income-related wrap-around benefit.
Provide subsidies to protect low-income beneficiaries from new cost-sharing expenses. Our
analysis shows an increase in out-of-pocket spending for the majority of Medicare beneficiaries under the alternative benefit design, including many with low incomes. Greater financial protection could be offered to low-income beneficiaries by adopting the approach used under the Medicare Part D prescription drug benefit that provides additional Medicare-funded subsidies to individuals with incomes below 150 percent of poverty and modest assets. Such an approach could build on the current administrative structure already in place for determining eligibility. An alternative approach could build upon current programs for full or partial dual eligibles, including those covered under the Medicare Savings Programs, that are jointly funded with federal and state Medicaid dollars. The former approach would increase federal spending, possibly offsetting any federal savings that could otherwise be achieved under the alternative benefit design, and would potentially reduce Medicaid spending (assuming there is no “clawback” similar to Part D). The latter approach would likely increase federal and state spending under Medicaid.
Apply the Medicare Part D “True Out-of-Pocket” (TrOOP) concept to the annual cost-sharing spending limit for services under Parts A and B. Under Part D, the concept of TrOOP refers to counting out-of pocket spending on cost-sharing amounts paid (rather than incurred) by each beneficiary (and other designated payers) towards the prescription drug out-of-pocket spending limit, and excludes payments by employers (and some other third-party payers) on the beneficiary’s behalf. If this concept were applied to the alternative benefit design, beneficiaries with employer-sponsored retiree health benefits or other types of supplemental coverage would not reach the

RestRuctuRing MedicaRe’s Benefit design – Implications for Beneficiaries and Spending 19
19
cost-sharing limit until they themselves incurred $5,500 in out-of-pocket spending on cost sharing for Medicare-covered services. If the TrOOP concept were adopted with the alternative benefit design and payers – primarily employers in this case – made no changes in their benefit design in response, this approach would likely increase Medicare savings relative to our estimate because beneficiaries with supplemental coverage would need to incur more spending before qualifying for the limit on out-of-pocket spending, when Medicare would begin paying 100 percent. If supplemental insurers scaled back benefits, or terminated coverage in response – a more likely scenario – then Medicare spending and employer and other payer costs would likely be lower than our analysis suggests. The impact on beneficiary spending would depend on the extent to which their supplemental coverage was scaled back, if not eliminated; their spending would likely be higher for cost sharing (which would induce lower Medicare spending), but this could be offset to some degree by lower or nonexistent supplemental insurance premiums. To address concerns about employers scaling back or terminating retiree drug benefits, federal subsidies are provided to employers who continue to offer prescription drug coverage to their retirees that is comparable to Part D. Further scrutiny would be needed to evaluate the interactions between this TrOOP policy and supplemental coverage if applied in conjunction with the alternative benefit design.
Impose a premium surcharge on beneficiaries who purchase first-dollar Medigap coverage, in conjunction with adopting the alternative benefit design. Our analysis considers the effects of prohibiting first-dollar Medigap coverage in combination with the alternative benefit design. The Obama Administration recently proposed a variation on the prohibition of first-dollar coverage that would impose a 30 percent Part B premium surcharge on new enrollees who purchase first-dollar Medigap coverage, beginning in 2017.27 By imposing a premium surcharge on first-dollar Medigap coverage, rather than an outright prohibition on such policies, the expected savings to Medicare are likely to be lower than under the approach we modeled because some policyholders would be expected to maintain first-dollar coverage, even at a higher premium. If the premium surcharge were applied only to new enrollees, rather than current and new policyholders, the expected savings would be considerably lower. Beneficiaries who chose to switch to less generous Medigap policies or traditional FFS Medicare with no supplemental coverage in response to the premium surcharge would be expected to use fewer services in response to higher cost-sharing obligations (as our model assumes is the case for those with no supplemental coverage under the alternative benefit design).
Maintain the existing Medicare FFS benefit structure, but provide a voluntary option to implement the new cost-sharing parameters. In 2005, Karen Davis and colleagues proposed implementing an alternative benefit design similar to that which we modeled, but rather than modify the Medicare benefit design for all FFS enrollees, it would offered as a new and separate voluntary option, referred to as Medicare “Part E.”28 Any additional costs of this optional Part E would be financed entirely by a separate premium paid by beneficiaries who elected this coverage option. Those who chose this option would receive all of their Medicare services under Part E, and would have a combined deductible, uniform coinsurance, and an annual cost-sharing limit. The voluntary approach to an alternative benefit design would offer beneficiaries an opportunity to receive enhanced coverage only if they were willing to pay the premium, rather than imposing any higher out-of-pocket costs associated with an enhanced benefit design on all FFS enrollees. Making such an option available under Medicare could also help to mitigate the need for private supplemental insurance. A potential drawback of this option is the risk of adverse selection, whereby beneficiaries who expect to have relatively large expenses might be more likely to enroll in Part E because of the spending limit, which could undermine the fiscal sustainability of Part E. This

RestRuctuRing MedicaRe’s Benefit design – Implications for Beneficiaries and Spending20
20
issue could be addressed, as suggested by Davis and colleagues, by automatically enrolling beneficiaries in Part E but allowing them to opt-out, or by preventing Medigap plans from age-adjusting premiums, a practice which might discourage relatively younger and healthier enrollees from choosing to sign up for Part E.
Establish “value-based” cost-sharing requirements. Rather than imposing a uniform coinsurance amount for all Medicare-covered services, cost-sharing amounts for different types of services could be linked to evidence on their clinical and/or cost-effectiveness in order to encourage the use of evidence-based care or care that is of equal (if not greater) effectiveness but lower cost. Medicare Part D plans, for example, use tiered cost sharing to encourage greater use of generic drugs as an alternative to therapeutically equivalent but more costly brand-name drugs. The Patient Protection and Affordable Care Act of 2010 took a step in this direction for Medicare FFS coverage by eliminating cost sharing for many Medicare-covered preventive services. The implications for beneficiary and program spending of adopting other value-based benefit design elements would require further work to identify the specific services that might be considered high-value and low-value and to determine the appropriate cost-sharing amounts to apply.
Modify the parameters discussed in this report. Policymakers could choose to modify individual components of the benefit design – for example, increasing or decreasing the deductible amount, coinsurance rate, or cost-sharing limit – or to implement changes in a piecemeal fashion – for example, introducing cost sharing for home health services only. An alternative approach to restructuring cost sharing would be to identify services where copayments could be charged, rather than coinsurance, adopting a type of cost sharing often used by Medicare Advantage plans. Depending on the parameters modified and the amounts chosen, the effects on beneficiaries and spending would vary somewhat or greatly from the effects presented in this report.
Future modeling activities could help to illustrate the tradeoffs for beneficiaries and program spending associated with these and other alternative Medicare benefit designs, as well as the complexities that result from a majority of beneficiaries having supplemental insurance.
CONCLUSION In the midst of concerns about the size of the federal deficit and the national debt, the Medicare program has been the focus of much discussion and debate. Several individuals and entities have proposed to incorporate significant Medicare savings as part of a broader package of proposals to reduce the federal budget deficit. A wide range of ideas have been presented, some involving more fundamental reforms to the program than others. Over the past year, for example, significant attention has been focused on proposals to transform Medicare to a system of premium supports (sometimes described as defined contributions or vouchers), raise the age of Medicare eligibility, and restructure cost-sharing requirements under the fee-for-service program. Each of these options is estimated to reduce Medicare spending while shifting costs onto beneficiaries and other payers, and in some instances, would result in higher health care spending overall. Our analysis illustrates the shifts in costs that would be expected to occur if Medicare fee-for-service cost-sharing requirements are restructured in a manner that has been recommended by some as part of deficit-reduction efforts. The results underscore a dilemma for policymakers: a restructured Medicare benefit design with a new limit on beneficiary cost sharing for Medicare-covered services has the
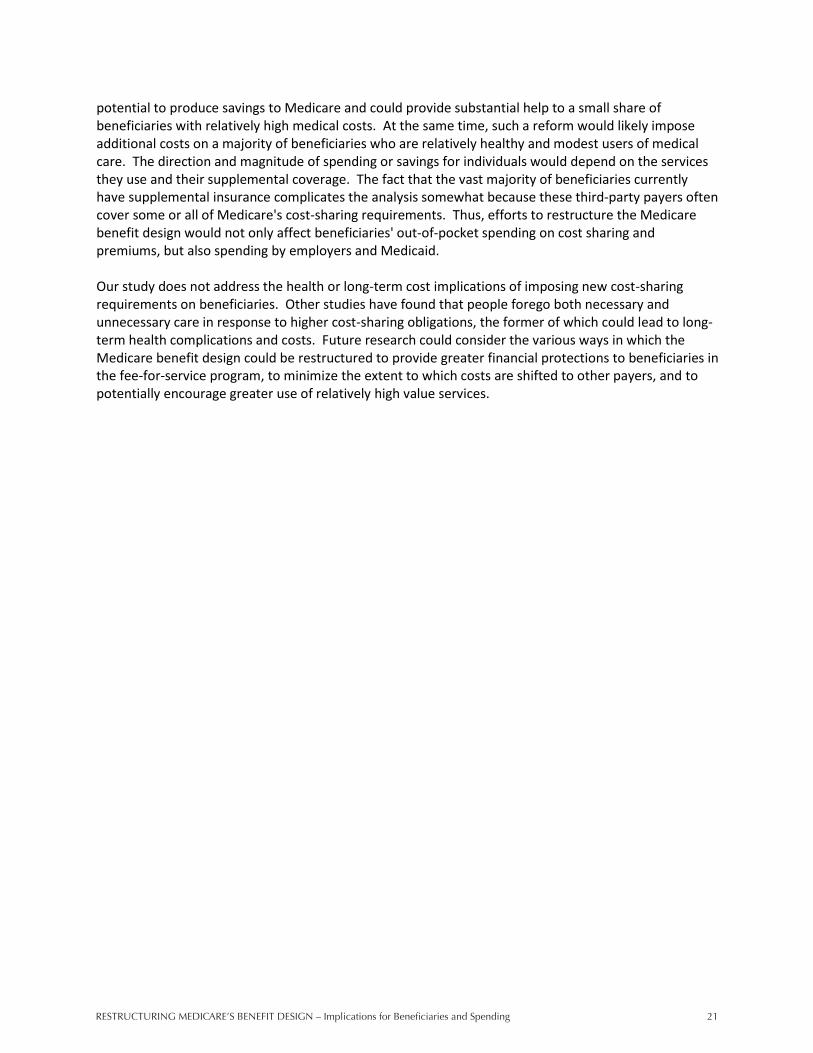
RestRuctuRing MedicaRe’s Benefit design – Implications for Beneficiaries and Spending 21
21
potential to produce savings to Medicare and could provide substantial help to a small share of beneficiaries with relatively high medical costs. At the same time, such a reform would likely impose additional costs on a majority of beneficiaries who are relatively healthy and modest users of medical care. The direction and magnitude of spending or savings for individuals would depend on the services they use and their supplemental coverage. The fact that the vast majority of beneficiaries currently have supplemental insurance complicates the analysis somewhat because these third-party payers often cover some or all of Medicare's cost-sharing requirements. Thus, efforts to restructure the Medicare benefit design would not only affect beneficiaries' out-of-pocket spending on cost sharing and premiums, but also spending by employers and Medicaid. Our study does not address the health or long-term cost implications of imposing new cost-sharing requirements on beneficiaries. Other studies have found that people forego both necessary and unnecessary care in response to higher cost-sharing obligations, the former of which could lead to long-term health complications and costs. Future research could consider the various ways in which the Medicare benefit design could be restructured to provide greater financial protections to beneficiaries in the fee-for-service program, to minimize the extent to which costs are shifted to other payers, and to potentially encourage greater use of relatively high value services.

RestRuctuRing MedicaRe’s Benefit design – Implications for Beneficiaries and Spending22
22
APPENDIX A: METHODOLOGY Data Our primary data source was the 2006-2008 Medical Expenditure Panel Survey (MEPS), an annual survey of households and medical providers conducted by the Agency for Healthcare Research and Quality. This dataset includes individual-level information on demographics, income, health status and conditions, use of medical care, health expenses, and insurance coverage for both nonelderly and elderly people. Although MEPS includes beneficiaries who are enrolled in Medicare Advantage plans, we excluded them from our analysis because these plans do not follow the standard Medicare cost-sharing structure and the cost-sharing structure varies depending on the plan. We supplemented our MEPS-based analysis with data from the Medicare Current Beneficiary Survey (MCBS) – a nationally representative survey of Medicare beneficiaries sponsored by the Centers for Medicare & Medicaid Services – to impute additional information where needed (e.g., SNF utilization and spending) and to validate some of our results (e.g., spending distribution by payer). For Medicare beneficiaries, we aligned the poverty distribution to conform to the CBO distribution of Part B enrollees by poverty status, and controlled counts of dual eligible to the current counts in the 2011 Trustees report.29 We assigned beneficiaries to one of five supplemental coverage groups: Medicare only (no supplemental coverage), Medicaid (full and partial coverage combined), employer-sponsored insurance (including TRICARE), Medigap, and other insurers (including Veterans’ Administration (VA), Indian Health Service and other federal sources; other state and local sources; Worker’s Compensation; and other unclassified/unknown sources). The Federal Employees Health Benefit Program is not explicitly identified in MEPS. For beneficiaries who listed more than one supplemental insurer, we assigned them to the source of coverage that they were enrolled in for the most number of months. The MEPS dataset itself does not include records for persons in long-term care facilities, who tend to incur relatively high Medicare spending attributable to inpatient hospital and skilled nursing facility use and many of whom are dually eligible for Medicare and Medicaid. However, the control totals from CBO for 2013 for population and spending do include the institutionalized. As a result, total Medicare spending is spread over a distribution in the dataset that presumably has a slightly lower share of high-cost cases, resulting in a slightly flatter expenditure distribution. However, since all Medicare-covered spending is reflected in the total, it is unknown whether the effect on a given subgroup’s change in costs would be an increase or a decrease, and regardless it appears unlikely that the effect would be substantial. Calculating Out-of-Pocket Spending The analysis looks exclusively at spending associated with Medicare-covered services. We excluded spending on non-Medicare covered services, such as dental, from the MEPS data prior to conducting the analysis. We began by estimating, at the individual level, what share of Medicare-covered services would be covered by the beneficiary and what share would be covered by each payer under current law in 2013. We have controlled the MEPS Medicare channel of payment (Medicare reimbursement) by service to data from the CBO March 2011 baseline for Medicare benefits spending (with refinements at the service and aged/disabled level where available from the 2011 Medicare Trustees report). Total covered charges for each service in the record are then calculated based on the controlled Medicare reimbursement amount and the cost sharing for the service corresponding to the utilization data in the

RestRuctuRing MedicaRe’s Benefit design – Implications for Beneficiaries and Spending 23
23
record.30 In this way, spending for each record is limited to Medicare-covered services only. The cost sharing (total covered charges minus Medicare spending) is distributed across the beneficiary and third-party payers according to their respective shares of total cost sharing for that service. To determine an individual’s out-of-pocket spending liability, we applied Medicare cost-sharing rules under current law to each beneficiary’s spending to divide the amount between Medicare and the beneficiary and/or their supplemental insurer. Cost sharing was distributed among beneficiaries and supplemental insurers based on the actual distribution of spending at the record level, which reflects each individual’s source of supplemental coverage and the generosity of coverage. We then applied alternative cost-sharing requirements under the restructured benefit design to determine shifts in the amount and distribution of spending for Medicare, beneficiaries, and other payers. (See the section beginning on page 29 for an example of how we model changes in the distribution of cost sharing under current law versus the alternative benefit design.) We first calculated the impact of the new cost-sharing rules on each individual’s exposure to cost sharing holding utilization constant. We also subject any increased cost sharing to the supplemental insurance the individual has, assuming insurers pay the same percentage of the new Medicare cost sharing that they pay under current-law cost sharing. (We conducted sensitivity tests to determine the extent to which changes in supplemental coverage benefit rates would affect the distribution of beneficiaries paying more or less, and the average change in out-of-pocket spending, as described below under “Sensitivity Analysis”). We then adjusted these calculations to account for changes in utilization and spending that would be expected to occur in response to cost-sharing changes, based on numerous studies showing that individuals tend to lower their use of care – and thereby their spending on health – when their exposure to cost sharing increases (and vice-versa). To make this adjustment, we applied induction factors, which estimate how total expenses for a person would change in response to a change in cost sharing. After applying these factors and determining the new spending levels for each beneficiary, we recalculated the share of spending covered by each payer. With regard to preventive services, we assumed that coinsurance under the alternative benefit design would be uniformly applied to all Medicare-covered benefits (except hospice), even though the Affordable Care Act of 2010 provided for certain Medicare-covered preventive services to be available at no cost to beneficiaries, beginning in 2011. However, MEPS does not classify services at a level refined enough to allow us to identify which services would qualify for no cost sharing, and as such we were unable to apply this provision of current law to our model of the alternative benefit design. Had we been able to do so, the effect would have been to decrease the amount of beneficiary cost sharing from that which our model suggests. But we do not believe that excluding cost sharing for these services would have had more than a small impact on our results. Because Medicaid is jointly-financed by the federal and state governments, we divided spending between the two payers based on current average spending patterns, with the federal government covering 57 percent of Medicaid spending on average and states covering the remaining 43 percent. Calculating Changes in Premiums Due to MEPS and other data limitations, we assumed that each type of payer (e.g., Medigap, employer-sponsored insurance) charges the same premium to all of its enrollees under current law and would continue to do so under a restructured Medicare benefit design. Our baseline Medigap premium estimate is in line with data on Medigap premiums from NAIC and Weiss Ratings. We adopted a similar approach for employer-sponsored insurance premiums, using a different administrative expense load
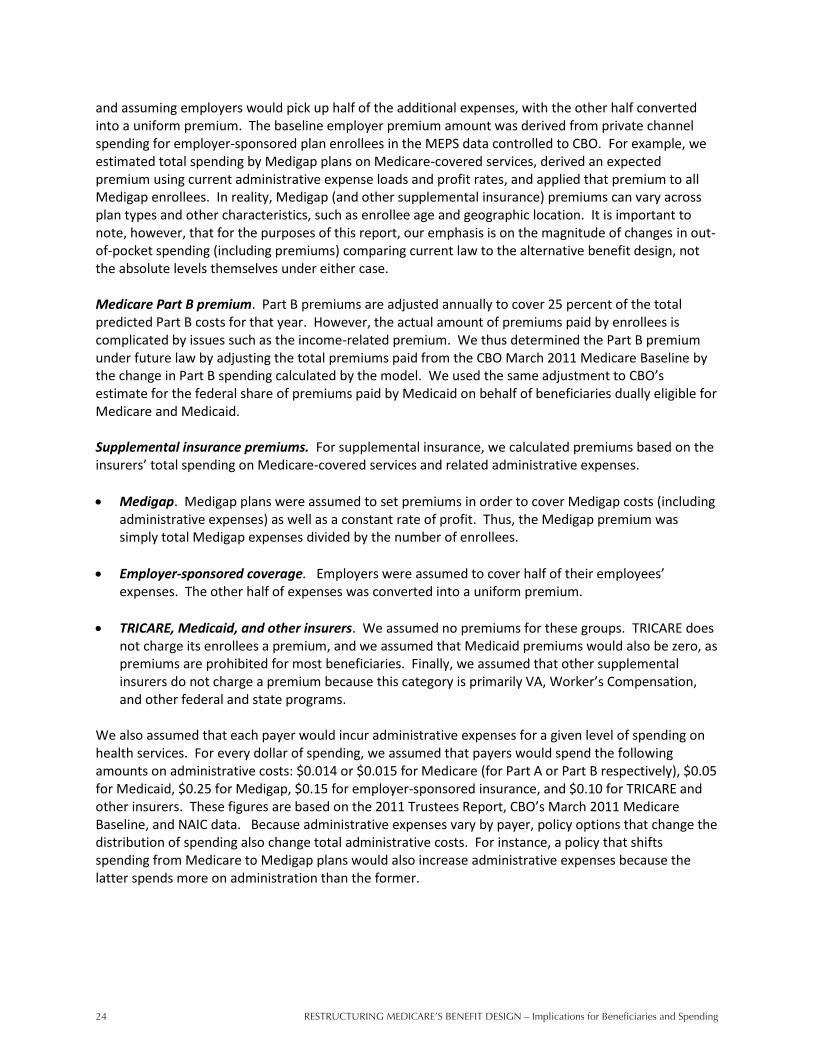
RestRuctuRing MedicaRe’s Benefit design – Implications for Beneficiaries and Spending24
24
and assuming employers would pick up half of the additional expenses, with the other half converted into a uniform premium. The baseline employer premium amount was derived from private channel spending for employer-sponsored plan enrollees in the MEPS data controlled to CBO. For example, we estimated total spending by Medigap plans on Medicare-covered services, derived an expected premium using current administrative expense loads and profit rates, and applied that premium to all Medigap enrollees. In reality, Medigap (and other supplemental insurance) premiums can vary across plan types and other characteristics, such as enrollee age and geographic location. It is important to note, however, that for the purposes of this report, our emphasis is on the magnitude of changes in out-of-pocket spending (including premiums) comparing current law to the alternative benefit design, not the absolute levels themselves under either case. Medicare Part B premium. Part B premiums are adjusted annually to cover 25 percent of the total predicted Part B costs for that year. However, the actual amount of premiums paid by enrollees is complicated by issues such as the income-related premium. We thus determined the Part B premium under future law by adjusting the total premiums paid from the CBO March 2011 Medicare Baseline by the change in Part B spending calculated by the model. We used the same adjustment to CBO’s estimate for the federal share of premiums paid by Medicaid on behalf of beneficiaries dually eligible for Medicare and Medicaid. Supplemental insurance premiums. For supplemental insurance, we calculated premiums based on the insurers’ total spending on Medicare-covered services and related administrative expenses. Medigap. Medigap plans were assumed to set premiums in order to cover Medigap costs (including
administrative expenses) as well as a constant rate of profit. Thus, the Medigap premium was simply total Medigap expenses divided by the number of enrollees.
Employer-sponsored coverage. Employers were assumed to cover half of their employees’ expenses. The other half of expenses was converted into a uniform premium.
TRICARE, Medicaid, and other insurers. We assumed no premiums for these groups. TRICARE does not charge its enrollees a premium, and we assumed that Medicaid premiums would also be zero, as premiums are prohibited for most beneficiaries. Finally, we assumed that other supplemental insurers do not charge a premium because this category is primarily VA, Worker’s Compensation, and other federal and state programs.
We also assumed that each payer would incur administrative expenses for a given level of spending on health services. For every dollar of spending, we assumed that payers would spend the following amounts on administrative costs: $0.014 or $0.015 for Medicare (for Part A or Part B respectively), $0.05 for Medicaid, $0.25 for Medigap, $0.15 for employer-sponsored insurance, and $0.10 for TRICARE and other insurers. These figures are based on the 2011 Trustees Report, CBO’s March 2011 Medicare Baseline, and NAIC data. Because administrative expenses vary by payer, policy options that change the distribution of spending also change total administrative costs. For instance, a policy that shifts spending from Medicare to Medigap plans would also increase administrative expenses because the latter spends more on administration than the former.
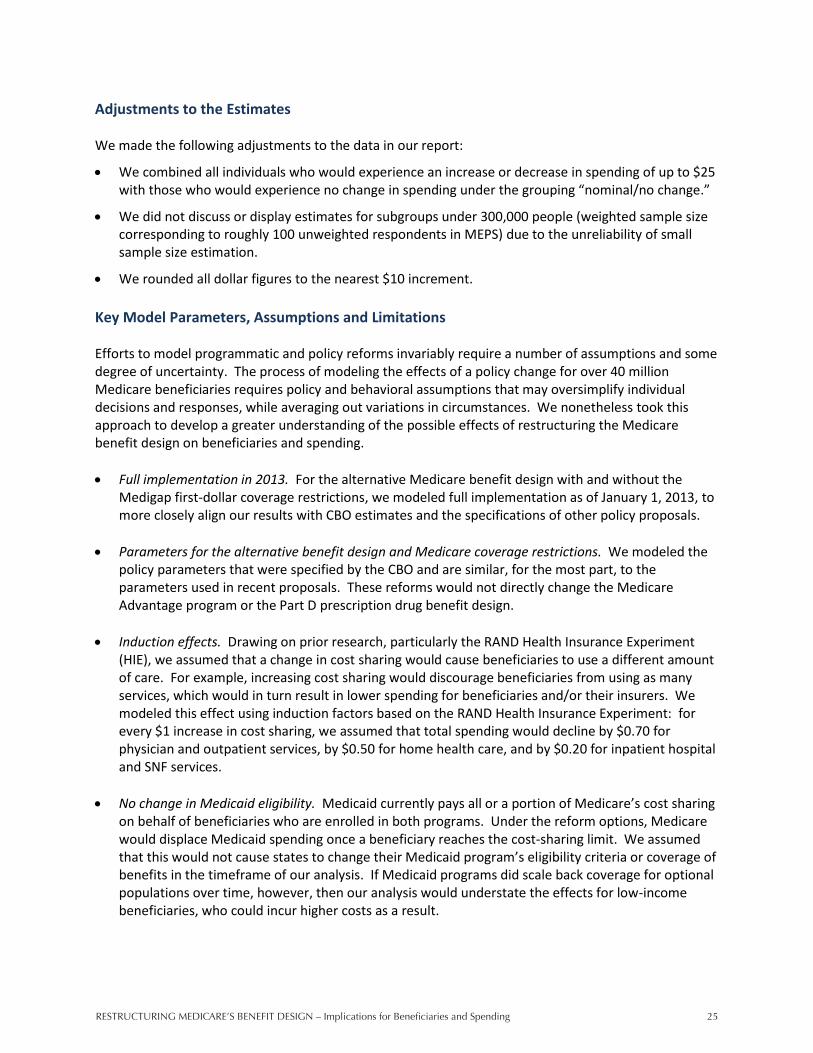
RestRuctuRing MedicaRe’s Benefit design – Implications for Beneficiaries and Spending 25
25
Adjustments to the Estimates We made the following adjustments to the data in our report:
We combined all individuals who would experience an increase or decrease in spending of up to $25 with those who would experience no change in spending under the grouping “nominal/no change.”
We did not discuss or display estimates for subgroups under 300,000 people (weighted sample size corresponding to roughly 100 unweighted respondents in MEPS) due to the unreliability of small sample size estimation.
We rounded all dollar figures to the nearest $10 increment. Key Model Parameters, Assumptions and Limitations Efforts to model programmatic and policy reforms invariably require a number of assumptions and some degree of uncertainty. The process of modeling the effects of a policy change for over 40 million Medicare beneficiaries requires policy and behavioral assumptions that may oversimplify individual decisions and responses, while averaging out variations in circumstances. We nonetheless took this approach to develop a greater understanding of the possible effects of restructuring the Medicare benefit design on beneficiaries and spending. Full implementation in 2013. For the alternative Medicare benefit design with and without the
Medigap first-dollar coverage restrictions, we modeled full implementation as of January 1, 2013, to more closely align our results with CBO estimates and the specifications of other policy proposals.
Parameters for the alternative benefit design and Medicare coverage restrictions. We modeled the
policy parameters that were specified by the CBO and are similar, for the most part, to the parameters used in recent proposals. These reforms would not directly change the Medicare Advantage program or the Part D prescription drug benefit design.
Induction effects. Drawing on prior research, particularly the RAND Health Insurance Experiment
(HIE), we assumed that a change in cost sharing would cause beneficiaries to use a different amount of care. For example, increasing cost sharing would discourage beneficiaries from using as many services, which would in turn result in lower spending for beneficiaries and/or their insurers. We modeled this effect using induction factors based on the RAND Health Insurance Experiment: for every $1 increase in cost sharing, we assumed that total spending would decline by $0.70 for physician and outpatient services, by $0.50 for home health care, and by $0.20 for inpatient hospital and SNF services.
No change in Medicaid eligibility. Medicaid currently pays all or a portion of Medicare’s cost sharing on behalf of beneficiaries who are enrolled in both programs. Under the reform options, Medicare would displace Medicaid spending once a beneficiary reaches the cost-sharing limit. We assumed that this would not cause states to change their Medicaid program’s eligibility criteria or coverage of benefits in the timeframe of our analysis. If Medicaid programs did scale back coverage for optional populations over time, however, then our analysis would understate the effects for low-income beneficiaries, who could incur higher costs as a result.
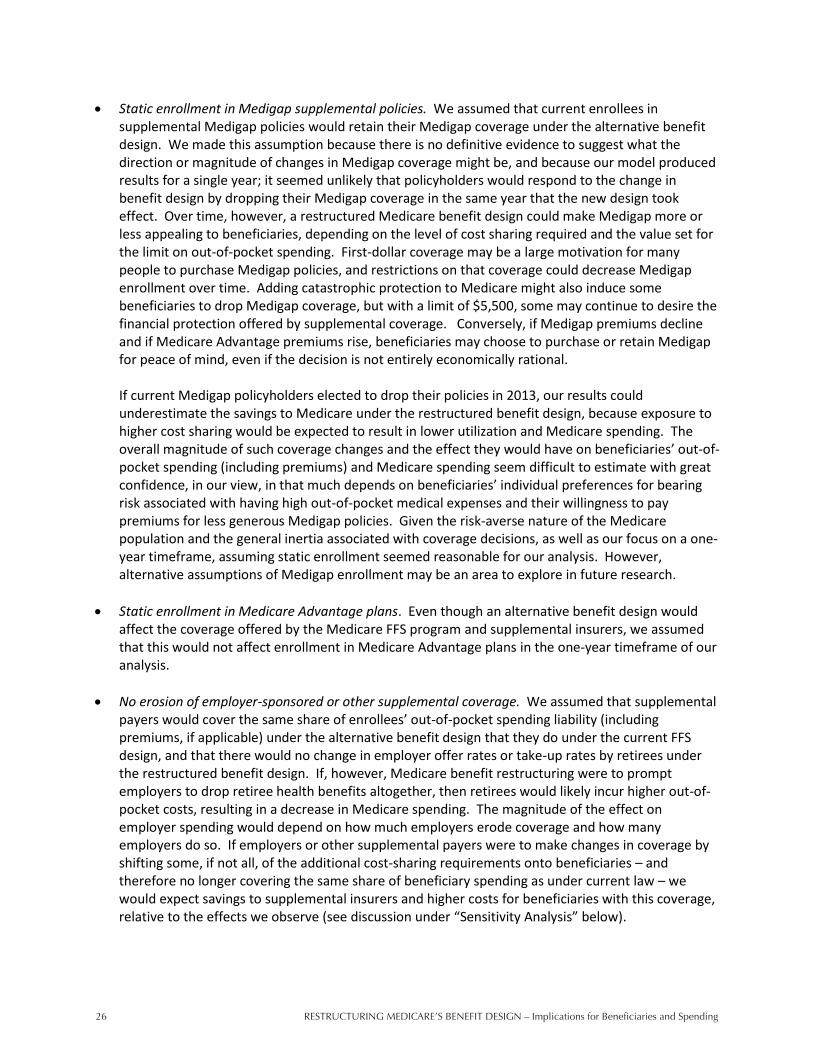
RestRuctuRing MedicaRe’s Benefit design – Implications for Beneficiaries and Spending26
26
Static enrollment in Medigap supplemental policies. We assumed that current enrollees in supplemental Medigap policies would retain their Medigap coverage under the alternative benefit design. We made this assumption because there is no definitive evidence to suggest what the direction or magnitude of changes in Medigap coverage might be, and because our model produced results for a single year; it seemed unlikely that policyholders would respond to the change in benefit design by dropping their Medigap coverage in the same year that the new design took effect. Over time, however, a restructured Medicare benefit design could make Medigap more or less appealing to beneficiaries, depending on the level of cost sharing required and the value set for the limit on out-of-pocket spending. First-dollar coverage may be a large motivation for many people to purchase Medigap policies, and restrictions on that coverage could decrease Medigap enrollment over time. Adding catastrophic protection to Medicare might also induce some beneficiaries to drop Medigap coverage, but with a limit of $5,500, some may continue to desire the financial protection offered by supplemental coverage. Conversely, if Medigap premiums decline and if Medicare Advantage premiums rise, beneficiaries may choose to purchase or retain Medigap for peace of mind, even if the decision is not entirely economically rational. If current Medigap policyholders elected to drop their policies in 2013, our results could underestimate the savings to Medicare under the restructured benefit design, because exposure to higher cost sharing would be expected to result in lower utilization and Medicare spending. The overall magnitude of such coverage changes and the effect they would have on beneficiaries’ out-of-pocket spending (including premiums) and Medicare spending seem difficult to estimate with great confidence, in our view, in that much depends on beneficiaries’ individual preferences for bearing risk associated with having high out-of-pocket medical expenses and their willingness to pay premiums for less generous Medigap policies. Given the risk-averse nature of the Medicare population and the general inertia associated with coverage decisions, as well as our focus on a one-year timeframe, assuming static enrollment seemed reasonable for our analysis. However, alternative assumptions of Medigap enrollment may be an area to explore in future research.
Static enrollment in Medicare Advantage plans. Even though an alternative benefit design would affect the coverage offered by the Medicare FFS program and supplemental insurers, we assumed that this would not affect enrollment in Medicare Advantage plans in the one-year timeframe of our analysis.
No erosion of employer-sponsored or other supplemental coverage. We assumed that supplemental
payers would cover the same share of enrollees’ out-of-pocket spending liability (including premiums, if applicable) under the alternative benefit design that they do under the current FFS design, and that there would no change in employer offer rates or take-up rates by retirees under the restructured benefit design. If, however, Medicare benefit restructuring were to prompt employers to drop retiree health benefits altogether, then retirees would likely incur higher out-of-pocket costs, resulting in a decrease in Medicare spending. The magnitude of the effect on employer spending would depend on how much employers erode coverage and how many employers do so. If employers or other supplemental payers were to make changes in coverage by shifting some, if not all, of the additional cost-sharing requirements onto beneficiaries – and therefore no longer covering the same share of beneficiary spending as under current law – we would expect savings to supplemental insurers and higher costs for beneficiaries with this coverage, relative to the effects we observe (see discussion under “Sensitivity Analysis” below).

RestRuctuRing MedicaRe’s Benefit design – Implications for Beneficiaries and Spending 27
27
No effect on retirement decisions. We assumed Medicare benefit design restructuring would not affect retirement decisions in the short term. If changes in Medicare’s benefit design prompted workers to delay retirement, out-of-pocket spending could decline for younger workers (assuming their employer policies’ cost-sharing rules were more generous than the restructured Medicare benefit), and Medicare spending would decline somewhat (if Medicare was secondary payer rather than primary), but employer costs would rise.
An important caveat to our results is that we only assess the financial effects on beneficiaries, and our single-year analysis does not consider or evaluate the health effects or long-term costs of the alternative Medicare benefit design. Our model incorporates the assumption that as beneficiary cost sharing increases, beneficiaries would use fewer services, which would produce short-term savings for Medicare but which could also result in poor (or worse) health outcomes – thereby increasing costs to Medicare over the longer term. It is outside the scope of our analysis to determine whether beneficiaries would forgo necessary or unnecessary services, and the extent to which this would affect their health or expenses over the longer term. Two recent studies have suggested the existence of secondary (and unintended) effects of increased cost sharing in the Medicare program. Trivedi and coauthors found that Medicare Advantage plans that nearly doubled copayments for ambulatory care experienced increases in hospitalizations, especially for enrollees with certain chronic conditions.31 Gruber and coauthors also found increases in hospitalizations after a large retiree health plan introduced copayments for physician services and increased copayments for pharmaceuticals.32 We also do not evaluate or incorporate any potential substitution effects that might offset certain reductions in utilization; for instance, beneficiaries who use fewer home health services because of the new coinsurance might use more physical therapy or physician visits. Based on the available evidence, it was not possible to model these longer-term effects with any degree of confidence, particularly since our estimates are based on a single year of implementation (specifically, 2013). As a result, our model may overestimate the amount of savings to Medicare that could result from increased cost sharing if the analysis were conducted over a multiple-year period – for instance, if beneficiaries simply substitute some types of care for other services, or if their health deteriorates, requiring additional care in the future – and underestimate the cost to beneficiaries associated with cost sharing for additional services used over the longer term. These are important areas to explore in future research. Sensitivity Analyses Variations in induction factors, by income. Our analysis assumes that all beneficiaries would respond to a given change in cost sharing in the same way. For example, we assume that for every $1 increase in inpatient cost sharing for a given beneficiary, any beneficiary would lower their use of care by some uniform amount, resulting in a $0.20 reduction in net inpatient spending by that individual (based on the induction factor we used). However, research has shown that behavioral responses may vary depending on individual characteristics. The RAND Health Insurance Experiment raised the possibility that lower-income beneficiaries may respond to changes in cost sharing to a different degree than higher-income beneficiaries. If this were the case, then our assumption of a uniform response regardless of income could underestimate the extent to which spending by low-income beneficiaries would decline in response to increased exposure to cost sharing and overestimate the change for beneficiaries with higher incomes.
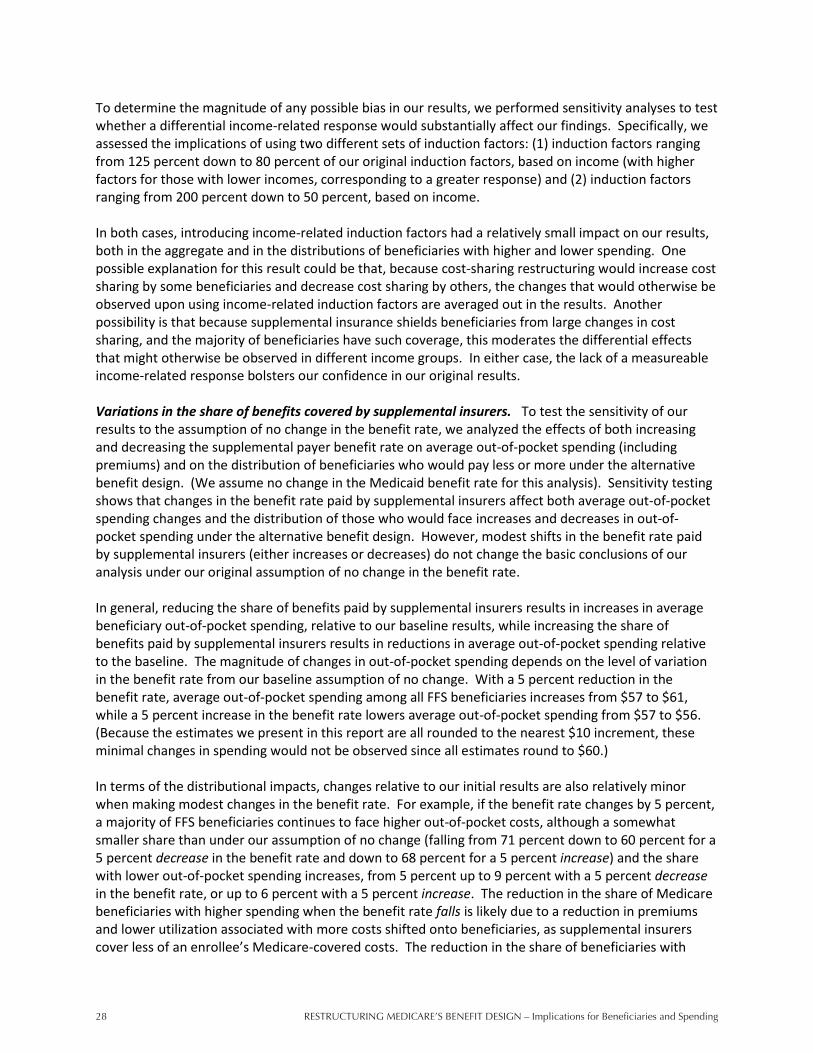
RestRuctuRing MedicaRe’s Benefit design – Implications for Beneficiaries and Spending28
28
To determine the magnitude of any possible bias in our results, we performed sensitivity analyses to test whether a differential income-related response would substantially affect our findings. Specifically, we assessed the implications of using two different sets of induction factors: (1) induction factors ranging from 125 percent down to 80 percent of our original induction factors, based on income (with higher factors for those with lower incomes, corresponding to a greater response) and (2) induction factors ranging from 200 percent down to 50 percent, based on income. In both cases, introducing income-related induction factors had a relatively small impact on our results, both in the aggregate and in the distributions of beneficiaries with higher and lower spending. One possible explanation for this result could be that, because cost-sharing restructuring would increase cost sharing by some beneficiaries and decrease cost sharing by others, the changes that would otherwise be observed upon using income-related induction factors are averaged out in the results. Another possibility is that because supplemental insurance shields beneficiaries from large changes in cost sharing, and the majority of beneficiaries have such coverage, this moderates the differential effects that might otherwise be observed in different income groups. In either case, the lack of a measureable income-related response bolsters our confidence in our original results. Variations in the share of benefits covered by supplemental insurers. To test the sensitivity of our results to the assumption of no change in the benefit rate, we analyzed the effects of both increasing and decreasing the supplemental payer benefit rate on average out-of-pocket spending (including premiums) and on the distribution of beneficiaries who would pay less or more under the alternative benefit design. (We assume no change in the Medicaid benefit rate for this analysis). Sensitivity testing shows that changes in the benefit rate paid by supplemental insurers affect both average out-of-pocket spending changes and the distribution of those who would face increases and decreases in out-of-pocket spending under the alternative benefit design. However, modest shifts in the benefit rate paid by supplemental insurers (either increases or decreases) do not change the basic conclusions of our analysis under our original assumption of no change in the benefit rate. In general, reducing the share of benefits paid by supplemental insurers results in increases in average beneficiary out-of-pocket spending, relative to our baseline results, while increasing the share of benefits paid by supplemental insurers results in reductions in average out-of-pocket spending relative to the baseline. The magnitude of changes in out-of-pocket spending depends on the level of variation in the benefit rate from our baseline assumption of no change. With a 5 percent reduction in the benefit rate, average out-of-pocket spending among all FFS beneficiaries increases from $57 to $61, while a 5 percent increase in the benefit rate lowers average out-of-pocket spending from $57 to $56. (Because the estimates we present in this report are all rounded to the nearest $10 increment, these minimal changes in spending would not be observed since all estimates round to $60.) In terms of the distributional impacts, changes relative to our initial results are also relatively minor when making modest changes in the benefit rate. For example, if the benefit rate changes by 5 percent, a majority of FFS beneficiaries continues to face higher out-of-pocket costs, although a somewhat smaller share than under our assumption of no change (falling from 71 percent down to 60 percent for a 5 percent decrease in the benefit rate and down to 68 percent for a 5 percent increase) and the share with lower out-of-pocket spending increases, from 5 percent up to 9 percent with a 5 percent decrease in the benefit rate, or up to 6 percent with a 5 percent increase. The reduction in the share of Medicare beneficiaries with higher spending when the benefit rate falls is likely due to a reduction in premiums and lower utilization associated with more costs shifted onto beneficiaries, as supplemental insurers cover less of an enrollee’s Medicare-covered costs. The reduction in the share of beneficiaries with
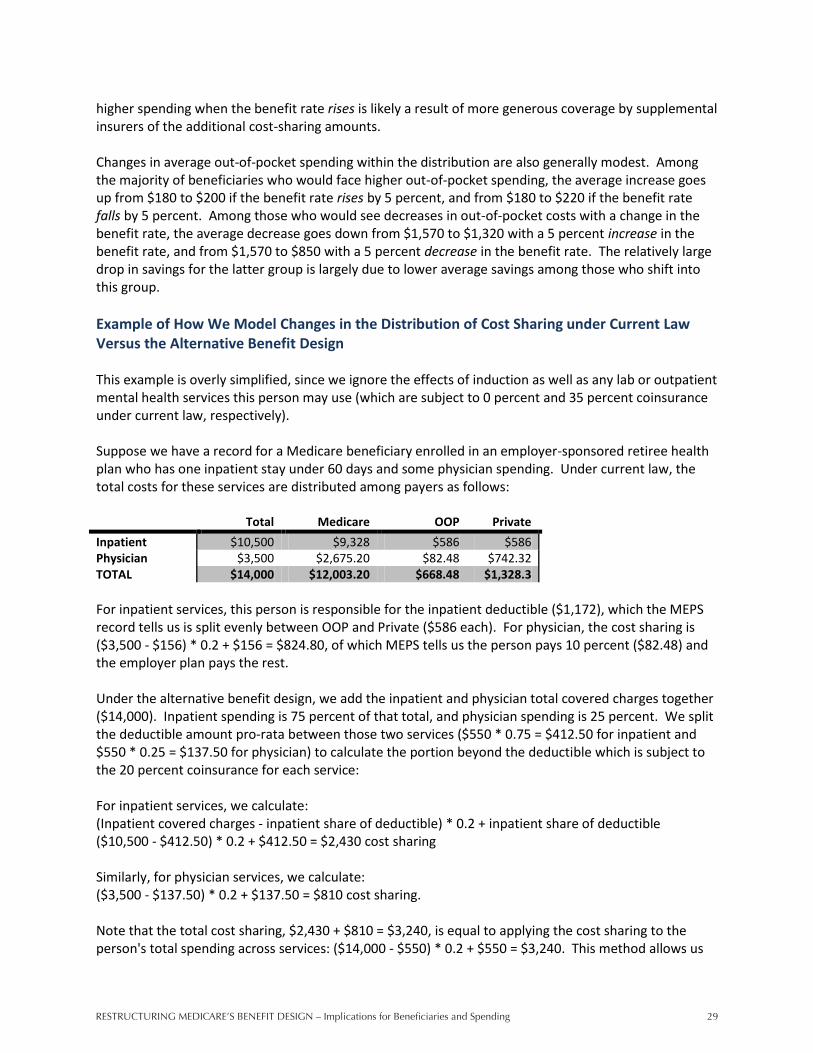
RestRuctuRing MedicaRe’s Benefit design – Implications for Beneficiaries and Spending 29
29
higher spending when the benefit rate rises is likely a result of more generous coverage by supplemental insurers of the additional cost-sharing amounts. Changes in average out-of-pocket spending within the distribution are also generally modest. Among the majority of beneficiaries who would face higher out-of-pocket spending, the average increase goes up from $180 to $200 if the benefit rate rises by 5 percent, and from $180 to $220 if the benefit rate falls by 5 percent. Among those who would see decreases in out-of-pocket costs with a change in the benefit rate, the average decrease goes down from $1,570 to $1,320 with a 5 percent increase in the benefit rate, and from $1,570 to $850 with a 5 percent decrease in the benefit rate. The relatively large drop in savings for the latter group is largely due to lower average savings among those who shift into this group. Example of How We Model Changes in the Distribution of Cost Sharing under Current Law Versus the Alternative Benefit Design This example is overly simplified, since we ignore the effects of induction as well as any lab or outpatient mental health services this person may use (which are subject to 0 percent and 35 percent coinsurance under current law, respectively). Suppose we have a record for a Medicare beneficiary enrolled in an employer-sponsored retiree health plan who has one inpatient stay under 60 days and some physician spending. Under current law, the total costs for these services are distributed among payers as follows: Total Medicare OOP Private Inpatient $10,500 $9,328 $586 $586 Physician $3,500 $2,675.20 $82.48 $742.32 TOTAL $14,000 $12,003.20 $668.48 $1,328.3 For inpatient services, this person is responsible for the inpatient deductible ($1,172), which the MEPS record tells us is split evenly between OOP and Private ($586 each). For physician, the cost sharing is ($3,500 - $156) * 0.2 + $156 = $824.80, of which MEPS tells us the person pays 10 percent ($82.48) and the employer plan pays the rest. Under the alternative benefit design, we add the inpatient and physician total covered charges together ($14,000). Inpatient spending is 75 percent of that total, and physician spending is 25 percent. We split the deductible amount pro-rata between those two services ($550 * 0.75 = $412.50 for inpatient and $550 * 0.25 = $137.50 for physician) to calculate the portion beyond the deductible which is subject to the 20 percent coinsurance for each service: For inpatient services, we calculate: (Inpatient covered charges - inpatient share of deductible) * 0.2 + inpatient share of deductible ($10,500 - $412.50) * 0.2 + $412.50 = $2,430 cost sharing Similarly, for physician services, we calculate: ($3,500 - $137.50) * 0.2 + $137.50 = $810 cost sharing. Note that the total cost sharing, $2,430 + $810 = $3,240, is equal to applying the cost sharing to the person's total spending across services: ($14,000 - $550) * 0.2 + $550 = $3,240. This method allows us

RestRuctuRing MedicaRe’s Benefit design – Implications for Beneficiaries and Spending30
30
to determine roughly what portion of cost sharing goes to each service, which allows us to retain the underlying cost-sharing distributions for each service as well as apply induction separately by service. For inpatient, the total cost sharing is then split evenly, as under current law, between OOP and Private ($1,215 each), and for physician, 10 percent ($81) of the cost sharing is presumed to be OOP. Thus, under the alternative benefit design, the total costs would be distributed among payers as follows: Total Medicare OOP Private Inpatient $10,500 $8,070 $1,215 $1,215 Physician $3,500 $2,690 $81 $729 TOTAL $14,000 $10,760 $1,296 $1,944

RestRuctuRing MedicaRe’s Benefit design – Implications for Beneficiaries and Spending 31
31
APPENDIX B: SUPPLEMENTARY TABLES TABLE 1: Impact of an Alternative Medicare Benefit Design on Medicare Fee-for-Service Beneficiaries, By Change in Out-of-Pocket Spending and Characteristics, 2013
Number of FFS Beneficiaries (in millions) Percentage of FFS Beneficiaries Average Change in Spending
All Increase (>$25)
Decrease (>-$25)
Nominal or no
change (<±$25)
Increase (>$25)
Decrease (>-$25)
Nominal or no
change (<±$25)
All Increase (>$25)
Decrease (>-$25)
Nominal or no
change (<±$25)
Overall 40.8 29.1 2.0 9.8 71% 5% 24% $60 $180 -$1,570 $10 Health status1
Excellent 5.8 4.6 0.1 1.1 79% 1% 19% $90 $140 -- $10 Very good 10.2 8.0 0.3 1.9 78% 3% 19% $100 $150 -$830 $10 Good 11.8 8.6 0.4 2.8 73% 3% 24% $70 $160 -$1,350 $10 Fair 7.2 4.5 0.5 2.2 62% 7% 31% $40 $210 -$1,280 $0 Poor 3.5 1.9 0.3 1.2 55% 9% 36% -$90 $280 -$2,650 $0
Utilization No use 2.9 1.1 0.0 1.8 37% 0% 63% $30 $60 -- $10 Part B only 29.6 23.2 0.2 6.2 78% 1% 21% $80 $140 -- $10 1 hospital stay 5.8 3.6 1.0 1.2 63% 17% 20% $70 $440 -$1,180 $0 2+ hospital stay 2.5 1.1 0.7 0.6 46% 30% 24% -$160 $330 -$1,020 $0
Hospital stay, no SNF 6.6 4.3 0.7 1.6 65% 11% 24% $140 $390 -$1,140 $0
Hospital and SNF stay 1.6 0.4 1.0 0.2 26% 63% 11% -$540 $580 -$1,090 --
Supplemental insurance
Employer 15.9 13.9 0.7 1.3 87% 4% 8% $90 $150 -$980 $10 Medigap 11.8 11.0 0.7 0.1 93% 6% 1% $80 $140 -$800 -- Medicaid 6.9 1.0 0.3 5.7 14% 4% 83% $10 $200 -- $0 Other 2.1 1.0 0.1 1.0 48% 5% 47% $70 $390 -- $10 None 4.1 2.3 0.2 1.6 56% 4% 40% -$20 $560 -- $10
Income (as % of FPL)
<= 100% 8.1 3.1 0.3 4.7 38% 4% 58% -$40 $240 -$3,250 $0 100-133% 5.5 3.5 0.3 1.6 64% 6% 30% $80 $230 -$1,250 $10 133-200% 7.1 5.4 0.4 1.3 76% 6% 18% $80 $220 -$1,510 $10 200-300% 5.3 4.3 0.2 0.8 81% 4% 15% $80 $180 -- $10 300-400% 3.5 3.0 0.1 0.3 86% 4% 10% $90 $180 -- $10 400%+ 11.4 9.8 0.6 1.0 86% 5% 9% $80 $140 -$820 $10
Age <65 7.5 3.7 0.3 3.5 49% 4% 47% -$20 $300 -$3,700 $0 65-74 17.3 13.1 0.7 3.4 76% 4% 20% $70 $150 -$1,130 $10 75-84 11.4 8.7 0.6 2.1 76% 5% 19% $70 $170 -$1,110 $10 85+ 4.6 3.6 0.3 0.7 78% 7% 16% $90 $220 -$1,190 $10
Gender Male 18.2 12.8 0.9 4.4 71% 5% 24% $40 $190 -$2,020 $10 Female 22.6 16.2 1.1 5.3 72% 5% 24% $70 $180 -$1,190 $0
Race/ethnicity2 White 32.4 25.0 1.6 5.9 77% 5% 18% $60 $180 -$1,550 $10 Hispanic 2.5 1.0 0.1 1.4 40% 4% 56% $50 $200 -- $0 Black 4.0 2.2 0.2 1.6 54% 5% 41% $10 $210 -- $0
MSA3 Rural 9.4 6.6 0.4 2.4 71% 4% 25% $70 $170 -$1,350 $10 Urban 29.5 21.3 1.3 7.0 72% 4% 24% $60 $180 -$1,540 $10
NOTE: ‘--' Indicates estimate not displayed due to small sample size. Out-of-pocket spending includes premiums and cost-sharing requirements. Employer group includes TRICARE enrollees. FFS is fee-for-service. SNF is skilled nursing facility. FPL is federal poverty level. MSA is metropolitan statistical area. 1 Results not shown for 6 percent of beneficiaries whose health status is unknown. 2 Results not shown for 4 percent of beneficiaries of the following races/ethnicities: American Indian, Alaska Native, Asian, Pacific Islander, and multiple ethnicities. 3 Results not shown for 5 percent of beneficiaries whose MSA is unknown.
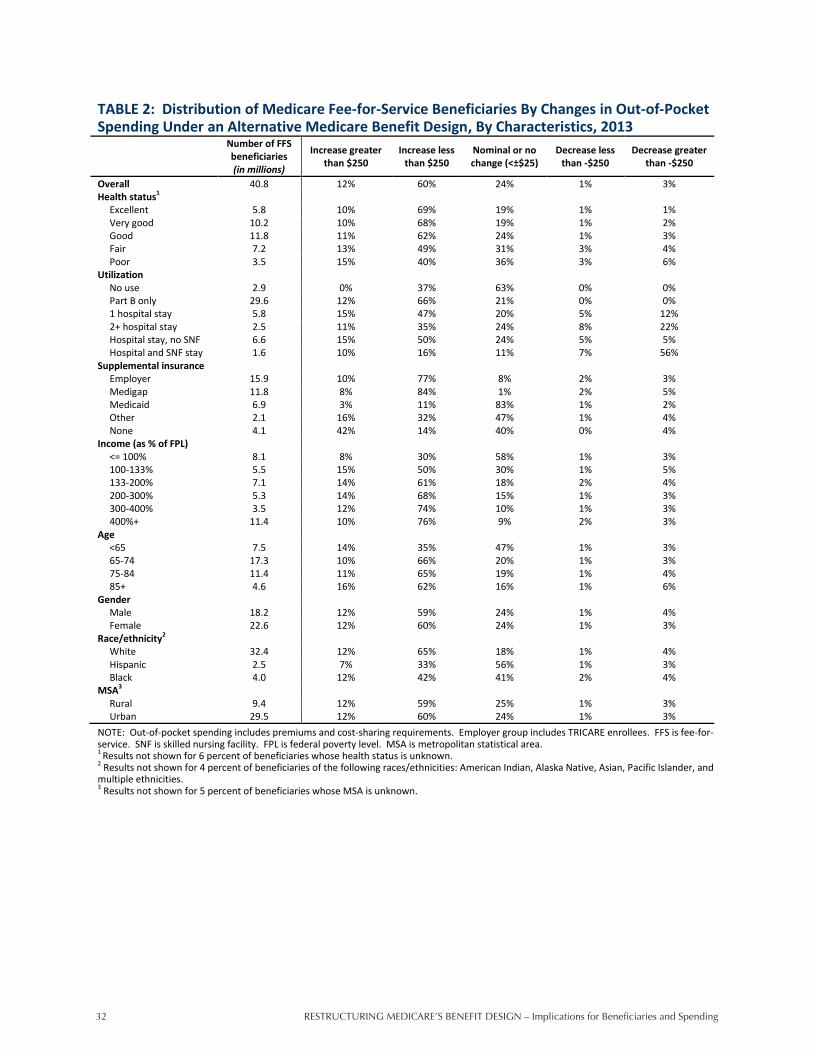
RestRuctuRing MedicaRe’s Benefit design – Implications for Beneficiaries and Spending32
32
TABLE 2: Distribution of Medicare Fee-for-Service Beneficiaries By Changes in Out-of-Pocket Spending Under an Alternative Medicare Benefit Design, By Characteristics, 2013
Number of FFS beneficiaries (in millions)
Increase greater than $250
Increase less than $250
Nominal or no change (<±$25)
Decrease less than -$250
Decrease greater than -$250
Overall 40.8 12% 60% 24% 1% 3% Health status1
Excellent 5.8 10% 69% 19% 1% 1% Very good 10.2 10% 68% 19% 1% 2% Good 11.8 11% 62% 24% 1% 3% Fair 7.2 13% 49% 31% 3% 4% Poor 3.5 15% 40% 36% 3% 6%
Utilization No use 2.9 0% 37% 63% 0% 0% Part B only 29.6 12% 66% 21% 0% 0% 1 hospital stay 5.8 15% 47% 20% 5% 12% 2+ hospital stay 2.5 11% 35% 24% 8% 22% Hospital stay, no SNF 6.6 15% 50% 24% 5% 5% Hospital and SNF stay 1.6 10% 16% 11% 7% 56%
Supplemental insurance Employer 15.9 10% 77% 8% 2% 3% Medigap 11.8 8% 84% 1% 2% 5% Medicaid 6.9 3% 11% 83% 1% 2% Other 2.1 16% 32% 47% 1% 4% None 4.1 42% 14% 40% 0% 4%
Income (as % of FPL) <= 100% 8.1 8% 30% 58% 1% 3% 100-133% 5.5 15% 50% 30% 1% 5% 133-200% 7.1 14% 61% 18% 2% 4% 200-300% 5.3 14% 68% 15% 1% 3% 300-400% 3.5 12% 74% 10% 1% 3% 400%+ 11.4 10% 76% 9% 2% 3%
Age <65 7.5 14% 35% 47% 1% 3% 65-74 17.3 10% 66% 20% 1% 3% 75-84 11.4 11% 65% 19% 1% 4% 85+ 4.6 16% 62% 16% 1% 6%
Gender Male 18.2 12% 59% 24% 1% 4% Female 22.6 12% 60% 24% 1% 3%
Race/ethnicity2 White 32.4 12% 65% 18% 1% 4% Hispanic 2.5 7% 33% 56% 1% 3% Black 4.0 12% 42% 41% 2% 4%
MSA3 Rural 9.4 12% 59% 25% 1% 3% Urban 29.5 12% 60% 24% 1% 3%
NOTE: Out-of-pocket spending includes premiums and cost-sharing requirements. Employer group includes TRICARE enrollees. FFS is fee-for-service. SNF is skilled nursing facility. FPL is federal poverty level. MSA is metropolitan statistical area. 1 Results not shown for 6 percent of beneficiaries whose health status is unknown. 2 Results not shown for 4 percent of beneficiaries of the following races/ethnicities: American Indian, Alaska Native, Asian, Pacific Islander, and multiple ethnicities. 3 Results not shown for 5 percent of beneficiaries whose MSA is unknown.

RestRuctuRing MedicaRe’s Benefit design – Implications for Beneficiaries and Spending 33
33
TABLE 3: Impact of Different Cost-Sharing Limits in an Alternative Medicare Benefit Design on Medicare Fee-for-Service Beneficiaries, by Change in Out-of-Pocket Spending, 2013
Number of FFS Beneficiaries (in millions)
Percent of FFS Beneficiaries Average Change in Spending
Increase (>$25)
Decrease (>-$25)
Nominal or no
change (<±$25)
Increase (>$25)
Decrease (>-$25)
Nominal or no
change (<±$25)
All Increase (>$25)
Decrease (>-$25)
Nominal or no
change (<±$25)
Cost-Sharing Limit: $5,500 29.1 2.0 9.8 71% 5% 24% $60 $180 -$1,570 $10 $4,000 15.2 12.4 13.2 37% 30% 32% -$60 $200 -$450 $0 $7,500 29.5 1.4 10.0 72% 3% 24% $180 $320 -$1,580 $0
NOTE: Out-of-pocket spending includes premiums and cost-sharing requirements. FFS is fee-for-service.

RestRuctuRing MedicaRe’s Benefit design – Implications for Beneficiaries and Spending34
34
TABLE 4: Impact of an Alternative Medicare Benefit Design with a $4,000 Cost-Sharing Limit on Medicare Fee-For-Service Beneficiaries, By Change in Out-of-Pocket Spending and Characteristics, 2013
Number of FFS Beneficiaries (in millions) Percentage of FFS Beneficiaries Average Change in Spending
All Increase (>$25)
Decrease (>-$25)
Nominal or no
change (<±$25)
Increase (>$25)
Decrease (>-$25)
Nominal or no
change (<±$25)
All Increase (>$25)
Decrease (>-$25)
Nominal or no
change (<±$25)
Overall 40.8 15.2 12.4 13.2 37% 30% 32% -$60 $200 -$450 $0 Health status1
Excellent 5.8 2.2 1.6 2.0 38% 28% 34% -$10 $140 -$230 $0 Very good 10.2 4.0 3.0 3.1 39% 30% 31% -$20 $150 -$270 $0 Good 11.8 4.4 3.6 3.9 37% 30% 33% -$40 $180 -$340 $0 Fair 7.2 2.6 2.2 2.4 36% 31% 34% -$80 $230 -$520 $0 Poor 3.5 1.3 1.0 1.2 36% 29% 35% -$230 $270 -$1,120 $0
Utilization No use 2.9 1.2 0.3 1.3 42% 12% 46% -$10 $40 -180 $0 Part B only 29.6 12.1 7.8 9.7 41% 26% 33% -$20 $160 -$320 $0 1 hospital stay 5.8 1.5 2.7 1.5 26% 47% 27% -$180 $570 -$710 $0 2+ hospital stay 2.5 0.3 1.5 0.6 14% 61% 25% -$410 $380 -$750 $0
Hospital stay, no SNF 6.6 1.7 2.9 1.9 26% 45% 29% -$80 $510 -$490 $0
Hospital and SNF stay 1.6 0.1 1.3 0.2 9% 78% 14% -$920 -- -$1,270 --
Supplemental insurance
Employer 15.9 7.6 1.3 7.0 48% 8% 44% $10 $140 -$740 $0 Medigap 11.8 0.8 10.5 0.5 7% 89% 4% -$190 $330 -$240 $0 Medicaid 6.9 0.9 0.3 5.7 13% 4% 83% $0 $170 -- $0 Other 2.1 1.9 0.1 0.0 94% 6% 1% $20 $190 -- -- None 4.1 3.9 0.2 0.0 95% 5% 0% -$120 $290 -- --
Income (as % of FPL)
<= 100% 8.1 2.1 1.4 4.5 26% 18% 56% -$110 $230 -$960 $0 100-133% 5.5 2.0 1.9 1.6 36% 35% 30% -$70 $240 -$450 $0 133-200% 7.1 2.8 2.7 1.5 40% 38% 21% -$70 $240 -$440 $0 200-300% 5.3 2.4 1.8 1.1 45% 33% 22% -$40 $180 -$360 $0 300-400% 3.5 1.4 1.1 1.0 40% 32% 28% -$50 $180 -$380 $0 400%+ 11.4 4.5 3.5 3.4 39% 31% 30% -$40 $150 -$320 $0
Age <65 7.5 3.2 0.9 3.4 43% 12% 45% -$100 $230 -$1,720 $0 65-74 17.3 6.7 5.0 5.6 39% 29% 33% -$40 $160 -$360 $0 75-84 11.4 3.8 4.5 3.1 33% 40% 27% -$70 $200 -$340 $0 85+ 4.6 1.5 2.0 1.1 32% 43% 24% -$80 $300 -$400 $0
Gender Male 18.2 7.2 4.9 6.0 40% 27% 33% -$80 $190 -$580 $0 Female 22.6 7.9 7.5 7.2 35% 33% 32% -$50 $200 -$370 $0
Race/ethnicity2 White 32.4 12.2 11.1 9.1 38% 34% 28% -$70 $190 -$420 $0 Hispanic 2.5 0.8 0.4 1.4 30% 16% 55% -$10 $190 -$450 $0 Black 4.0 1.5 0.6 1.9 37% 16% 47% -$60 $210 -$890 $0
MSA3 Rural 9.4 3.7 3.0 2.7 40% 32% 29% -$50 $180 -$380 $0 Urban 29.5 10.9 8.6 10.0 37% 29% 34% -$50 $190 -$430 $0
NOTE: ‘--' Indicates estimate not displayed due to small sample size. Out-of-pocket spending includes premiums and cost-sharing requirements. Employer group includes TRICARE enrollees. FFS is fee-for-service. SNF is skilled nursing facility. FPL is federal poverty level. MSA is metropolitan statistical area. 1 Results not shown for 6 percent of beneficiaries whose health status is unknown. 2 Results not shown for 4 percent of beneficiaries of the following races/ethnicities: American Indian, Alaska Native, Asian, Pacific Islander, and multiple ethnicities. 3 Results not shown for 5 percent of beneficiaries whose MSA is unknown.
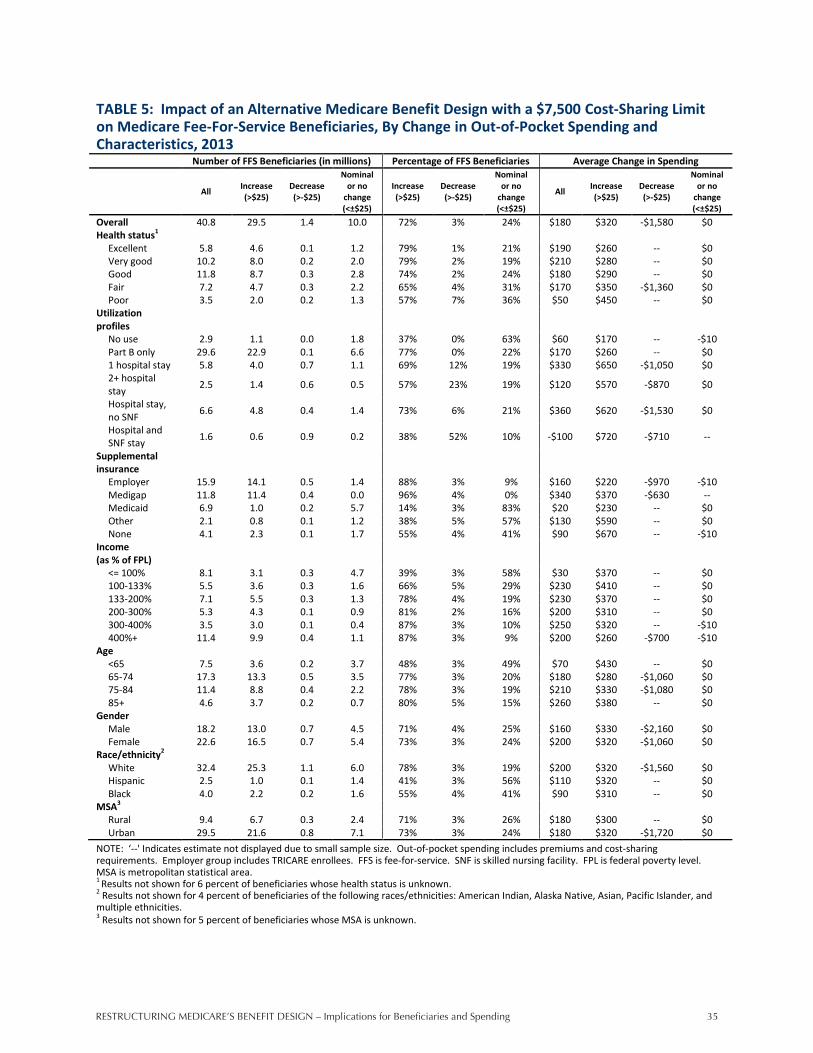
RestRuctuRing MedicaRe’s Benefit design – Implications for Beneficiaries and Spending 35
35
TABLE 5: Impact of an Alternative Medicare Benefit Design with a $7,500 Cost-Sharing Limit on Medicare Fee-For-Service Beneficiaries, By Change in Out-of-Pocket Spending and Characteristics, 2013
Number of FFS Beneficiaries (in millions) Percentage of FFS Beneficiaries Average Change in Spending
All Increase (>$25)
Decrease (>-$25)
Nominal or no
change (<±$25)
Increase (>$25)
Decrease (>-$25)
Nominal or no
change (<±$25)
All Increase (>$25)
Decrease (>-$25)
Nominal or no
change (<±$25)
Overall 40.8 29.5 1.4 10.0 72% 3% 24% $180 $320 -$1,580 $0 Health status1
Excellent 5.8 4.6 0.1 1.2 79% 1% 21% $190 $260 -- $0 Very good 10.2 8.0 0.2 2.0 79% 2% 19% $210 $280 -- $0 Good 11.8 8.7 0.3 2.8 74% 2% 24% $180 $290 -- $0 Fair 7.2 4.7 0.3 2.2 65% 4% 31% $170 $350 -$1,360 $0 Poor 3.5 2.0 0.2 1.3 57% 7% 36% $50 $450 -- $0
Utilization profiles
No use 2.9 1.1 0.0 1.8 37% 0% 63% $60 $170 -- -$10 Part B only 29.6 22.9 0.1 6.6 77% 0% 22% $170 $260 -- $0 1 hospital stay 5.8 4.0 0.7 1.1 69% 12% 19% $330 $650 -$1,050 $0 2+ hospital stay 2.5 1.4 0.6 0.5 57% 23% 19% $120 $570 -$870 $0
Hospital stay, no SNF 6.6 4.8 0.4 1.4 73% 6% 21% $360 $620 -$1,530 $0
Hospital and SNF stay 1.6 0.6 0.9 0.2 38% 52% 10% -$100 $720 -$710 --
Supplemental insurance
Employer 15.9 14.1 0.5 1.4 88% 3% 9% $160 $220 -$970 -$10 Medigap 11.8 11.4 0.4 0.0 96% 4% 0% $340 $370 -$630 -- Medicaid 6.9 1.0 0.2 5.7 14% 3% 83% $20 $230 -- $0 Other 2.1 0.8 0.1 1.2 38% 5% 57% $130 $590 -- $0 None 4.1 2.3 0.1 1.7 55% 4% 41% $90 $670 -- -$10
Income (as % of FPL)
<= 100% 8.1 3.1 0.3 4.7 39% 3% 58% $30 $370 -- $0 100-133% 5.5 3.6 0.3 1.6 66% 5% 29% $230 $410 -- $0 133-200% 7.1 5.5 0.3 1.3 78% 4% 19% $230 $370 -- $0 200-300% 5.3 4.3 0.1 0.9 81% 2% 16% $200 $310 -- $0 300-400% 3.5 3.0 0.1 0.4 87% 3% 10% $250 $320 -- -$10 400%+ 11.4 9.9 0.4 1.1 87% 3% 9% $200 $260 -$700 -$10
Age <65 7.5 3.6 0.2 3.7 48% 3% 49% $70 $430 -- $0 65-74 17.3 13.3 0.5 3.5 77% 3% 20% $180 $280 -$1,060 $0 75-84 11.4 8.8 0.4 2.2 78% 3% 19% $210 $330 -$1,080 $0 85+ 4.6 3.7 0.2 0.7 80% 5% 15% $260 $380 -- $0
Gender Male 18.2 13.0 0.7 4.5 71% 4% 25% $160 $330 -$2,160 $0 Female 22.6 16.5 0.7 5.4 73% 3% 24% $200 $320 -$1,060 $0
Race/ethnicity2 White 32.4 25.3 1.1 6.0 78% 3% 19% $200 $320 -$1,560 $0 Hispanic 2.5 1.0 0.1 1.4 41% 3% 56% $110 $320 -- $0 Black 4.0 2.2 0.2 1.6 55% 4% 41% $90 $310 -- $0
MSA3 Rural 9.4 6.7 0.3 2.4 71% 3% 26% $180 $300 -- $0 Urban 29.5 21.6 0.8 7.1 73% 3% 24% $180 $320 -$1,720 $0
NOTE: ‘--' Indicates estimate not displayed due to small sample size. Out-of-pocket spending includes premiums and cost-sharing requirements. Employer group includes TRICARE enrollees. FFS is fee-for-service. SNF is skilled nursing facility. FPL is federal poverty level. MSA is metropolitan statistical area. 1 Results not shown for 6 percent of beneficiaries whose health status is unknown. 2 Results not shown for 4 percent of beneficiaries of the following races/ethnicities: American Indian, Alaska Native, Asian, Pacific Islander, and multiple ethnicities. 3 Results not shown for 5 percent of beneficiaries whose MSA is unknown.

RestRuctuRing MedicaRe’s Benefit design – Implications for Beneficiaries and Spending36
36
TABLE 6: Share of Medicare Fee-for-Service Beneficiaries Reaching the Cost-Sharing Limit Under an Alternative Medicare Benefit Design with Different Cost-Sharing Limits and with Medigap Coverage Restrictions, By Characteristics, 2013
Alternative Medicare Benefit Design with:
Number of FFS beneficiaries (in millions)
$5,500 cost-sharing
limit
$4,000 cost-sharing
limit
$4,815 cost-sharing
limit1
$7,500 cost-sharing
limit
Medigap coverage
restrictions Overall 40.8 12% 16% 14% 9% 12% Health Status2
Excellent 5.8 3% 4% 4% 2% 3% Very good 10.2 6% 8% 7% 4% 6% Good 11.8 9% 13% 10% 7% 9% Fair 7.2 17% 23% 19% 13% 17% Poor 3.5 27% 36% 30% 21% 26%
Utilization No use 2.9 0% 0% 0% 0% 0% Part B only 29.6 2% 5% 3% 1% 2% 1 hospital stay 5.8 40% 54% 46% 28% 39% 2+ hospital stay 2.5 77% 88% 81% 65% 77% Hospital stay, no SNF 6.6 42% 56% 47% 29% 42% Hospital and SNF stay 1.6 85% 95% 93% 79% 85%
Supplemental insurance Employer 15.9 11% 15% 13% 8% 11% Medigap 11.8 15% 19% 17% 11% 14% Medicaid 6.9 12% 17% 14% 10% 12% Other 2.1 10% 16% 12% 7% 10% None 4.1 11% 15% 12% 9% 11%
Income (as % of FPL) <= 100% 8.1 13% 17% 15% 11% 13% 100-133% 5.5 15% 20% 17% 11% 14% 133-200% 7.1 14% 18% 16% 11% 14% 200-300% 5.3 8% 13% 11% 6% 8% 300-400% 3.5 10% 15% 12% 8% 10% 400%+ 11.4 10% 14% 12% 7% 10%
Age <65 7.5 11% 15% 12% 9% 11% 65-74 17.3 10% 13% 11% 8% 10% 75-84 11.4 14% 18% 15% 10% 14% 85+ 4.6 18% 25% 22% 13% 17%
Gender Male 18.2 12% 16% 14% 10% 12% Female 22.6 12% 16% 14% 9% 11%
Race/ethnicity3 White 32.4 12% 17% 14% 9% 12% Hispanic 2.5 10% 13% 10% 8% 10% Black 4.0 13% 17% 15% 11% 13%
MSA4 Rural 9.4 10% 14% 12% 7% 10% Urban 29.5 11% 15% 13% 8% 11%
NOTE: Employer group includes TRICARE enrollees. FFS is fee-for-service. SNF is skilled nursing facility. FPL is federal poverty level. MSA is metropolitan statistical area. 1 This out-of-pocket limit would be budget-neutral to Medicare in 2013. 2 Results not shown for 6 percent of beneficiaries whose health status is unknown. 3 Results not shown for 4 percent of beneficiaries of the following races/ethnicities: American Indian, Alaska Native, Asian, Pacific Islander, and multiple ethnicities. 4 Results not shown for 5 percent of beneficiaries whose MSA is unknown.

RestRuctuRing MedicaRe’s Benefit design – Implications for Beneficiaries and Spending 37
37
TABLE 7: Impact of an Alternative Medicare Benefit Design with Medigap Coverage Restrictions on Medicare Fee-For-Service Beneficiaries, By Change in Out-of-Pocket Spending and Characteristics, 2013
Number of FFS Beneficiaries (in millions) Percentage of FFS Beneficiaries Average Change in Spending
All Increase (>$25)
Decrease (>-$25)
Nominal or no
change (<±$25)
Increase (>$25)
Decrease (>-$25)
Nominal or no
change (<±$25)
All Increase (>$25)
Decrease (>-$25)
Nominal or no
change (<±$25)
Overall 40.8 20.5 9.8 10.5 50% 24% 26% -$50 $280 -$780 $0 Health status1
Excellent 5.8 2.9 1.7 1.2 50% 29% 21% -$120 $160 -$700 $0 Very good 10.2 5.3 2.8 2.1 52% 27% 20% -$80 $190 -$650 $0 Good 11.8 6.0 2.8 3.0 51% 24% 25% -$30 $240 -$660 $0 Fair 7.2 3.4 1.5 2.3 48% 21% 32% $20 $360 -$760 $0 Poor 3.5 1.6 0.6 1.3 45% 17% 38% -$80 $450 -$1,630 $0
Utilization No use 2.9 0.7 0.3 1.8 26% 12% 63% -$120 $30 -$1,060 -$10 Part B only 29.6 15.3 7.6 6.8 52% 26% 23% -$100 $170 -$730 $0 1 hospital stay 5.8 3.2 1.3 1.3 55% 22% 23% $180 $690 -$890 $0 2+ hospital stay 2.5 1.3 0.6 0.6 51% 24% 26% $140 $770 -$1,040 $0
Hospital stay, no SNF 6.6 3.7 1.1 1.8 57% 16% 27% $260 $710 -$860 $0
Hospital and SNF stay 1.6 0.7 0.8 0.2 41% 48% 11% -$200 $750 -$1,050 --
Supplemental insurance
Employer 15.9 13.4 0.8 1.7 84% 5% 11% $60 $120 -$850 -$10 Medigap 11.8 3.2 8.4 0.3 27% 71% 2% -$230 $750 -$610 -- Medicaid 6.9 1.0 0.3 5.7 14% 4% 83% $10 $200 -- $0 Other 2.1 0.7 0.1 1.2 36% 6% 58% $40 $480 -- -$10 None 4.1 2.2 0.2 1.7 55% 4% 41% -$50 $550 -- -$10
Income (as % of FPL)
<= 100% 8.1 2.3 1.1 4.8 28% 13% 59% -$80 $370 -$1,410 $0 100-133% 5.5 2.3 1.4 1.7 42% 26% 31% -$20 $400 -$710 $0 133-200% 7.1 3.6 2.1 1.5 50% 29% 21% -$40 $370 -$760 -$10 200-300% 5.3 2.9 1.5 0.9 55% 27% 18% -$50 $270 -$700 -$10 300-400% 3.5 2.2 0.9 0.4 63% 26% 12% -$40 $240 -$730 -$10 400%+ 11.4 7.3 2.9 1.2 64% 25% 11% -$40 $190 -$650 -$10
Age <65 7.5 3.1 0.8 3.7 41% 10% 49% -$70 $330 -$2,010 $0 65-74 17.3 9.5 4.2 3.6 55% 24% 21% -$50 $210 -$710 $0 75-84 11.4 5.6 3.4 2.4 49% 30% 21% -$50 $300 -$640 $0 85+ 4.6 2.3 1.4 0.8 51% 31% 18% $10 $440 -$670 $0
Gender Male 18.2 9.5 3.9 4.8 52% 22% 26% -$70 $270 -$950 $0 Female 22.6 11.0 5.9 5.8 49% 26% 25% -$30 $300 -$670 $0
Race/ethnicity2 White 32.4 17.2 8.7 6.5 53% 27% 20% -$50 $290 -$750 $0 Hispanic 2.5 0.8 0.3 1.4 31% 12% 57% $0 $270 -$660 $0 Black 4.0 1.8 0.5 1.7 45% 13% 42% -$50 $250 -$1,170 $0
MSA3 Rural 9.4 4.5 2.5 2.5 48% 26% 26% -$60 $260 -$720 $0 Urban 29.5 15.1 6.9 7.5 51% 23% 26% -$40 $260 -$760 $0
NOTE: ‘--' Indicates estimate not displayed due to small sample size. Out-of-pocket spending includes premiums and cost-sharing requirements. Employer group includes TRICARE enrollees. FFS is fee-for-service. SNF is skilled nursing facility. FPL is federal poverty level. MSA is metropolitan statistical area. 1 Results not shown for 6 percent of beneficiaries whose health status is unknown. 2 Results not shown for 4 percent of beneficiaries of the following races/ethnicities: American Indian, Alaska Native, Asian, Pacific Islander, and multiple ethnicities. 3 Results not shown for 5 percent of beneficiaries whose MSA is unknown.

RestRuctuRing MedicaRe’s Benefit design – Implications for Beneficiaries and Spending38
38
TABLE 8: Distribution of Medicare Fee-for-Service Beneficiaries By Change In Out-of-Pocket Spending Under an Alternative Medicare Benefit Design with Medigap Coverage Restrictions, By Characteristics, 2013
Number of FFS beneficiaries (in millions)
Increase greater than $250
Increase less than $250
Nominal or no change (<±$25)
Decrease less than -$250
Decrease greater than -$250
Overall 40.8 14% 36% 26% 4% 20% Health status1
Excellent 5.8 7% 43% 21% 3% 26% Very good 10.2 10% 43% 20% 3% 24% Good 11.8 14% 37% 25% 4% 20% Fair 7.2 19% 28% 32% 5% 15% Poor 3.5 21% 24% 38% 4% 13%
Utilization No use 2.9 0% 26% 63% 0% 12% Part B only 29.6 11% 41% 23% 2% 23% 1 hospital stay 5.8 30% 25% 23% 10% 12% 2+ hospital stay 2.5 37% 14% 26% 8% 16% Hospital stay, no SNF 6.6 33% 24% 27% 9% 8% Hospital and SNF stay 1.6 30% 11% 11% 13% 35%
Supplemental insurance Employer 15.9 7% 77% 11% 2% 3% Medigap 11.8 21% 5% 2% 8% 63% Medicaid 6.9 3% 11% 83% 1% 2% Other 2.1 15% 21% 58% 2% 4% None 4.1 40% 14% 41% 0% 4%
Income (as % of FPL) <= 100% 8.1 10% 18% 59% 2% 11% 100-133% 5.5 19% 24% 31% 4% 22% 133-200% 7.1 19% 31% 21% 5% 24% 200-300% 5.3 15% 40% 18% 4% 23% 300-400% 3.5 14% 48% 12% 3% 22% 400%+ 11.4 11% 53% 11% 4% 22%
Age <65 7.5 14% 27% 49% 2% 8% 65-74 17.3 11% 44% 21% 3% 21% 75-84 11.4 16% 33% 21% 4% 26% 85+ 4.6 22% 29% 18% 6% 26%
Gender Male 18.2 14% 39% 26% 3% 19% Female 22.6 15% 34% 25% 4% 22%
Race/ethnicity2 White 32.4 15% 38% 20% 4% 23% Hispanic 2.5 9% 22% 57% 2% 10% Black 4.0 12% 32% 42% 3% 11%
MSA3 Rural 9.4 14% 33% 26% 3% 23% Urban 29.5 13% 38% 26% 4% 20%
NOTE: Out-of-pocket spending includes premiums and cost-sharing requirements. Employer group includes TRICARE enrollees. FFS is fee-for-service. SNF is skilled nursing facility. FPL is federal poverty level. MSA is metropolitan statistical area. 1 Results not shown for 6 percent of beneficiaries whose health status is unknown. 2 Results not shown for 4 percent of beneficiaries of the following races/ethnicities: American Indian, Alaska Native, Asian, Pacific Islander, and multiple ethnicities. 3 Results not shown for 5 percent of beneficiaries whose MSA is unknown.
RestRuctuRing MedicaRe’s Benefit design – Implications for Beneficiaries and Spending 39
39
ENDNOTES 1 Groups not mutually exclusive. 2 Groups not mutually exclusive. 3 See Kaiser Family Foundation, “Comparison of Medicare Provisions in Deficit and Debt Reduction Proposals,” September 2011, http://www.kff.org/medicare/upload/8124.pdf. 4 The Medicare Part D prescription drug benefit has a separate deductible and out-of-pocket spending limit, but is typically excluded from policy proposals that would restructure Medicare’s cost-sharing requirements. 5 These were major motivations in Karen Davis et al., “Medicare Extra: A Comprehensive Benefit Option For Medicare Beneficiaries,” Health Affairs, October 2005, and also mentioned in Zuckerman et al., “Reforming Beneficiary Cost Sharing to Improve Medicare Performance,” Inquiry Journal, Fall 2010. 6 Medicare Payment Advisory Commission. (June 2011) Report to Congress: Medicare and the Health Care Delivery System. http://www.medpac.gov/documents/Jun11_EntireReport.pdf. 7 Congressional Budget Office, Reducing the Deficit: Spending and Revenue Options, March 2011, http://www.cbo.gov/ftpdocs/120xx/doc12085/03-10-ReducingTheDeficit.pdf. 8 National Commission on Fiscal Responsibility and Reform, “The Moment of Truth,” December 2010, http://www.fiscalcommission.gov; Debt Reduction Task Force, “Restoring America’s Future,” November 2010, http://www.bipartisanpolicy.org; Congressional Budget Office, “Preliminary Analysis of the Rivlin-Ryan Health Care Proposal,” November 2010, http://www.cbo.gov/ftpdocs/119xx/doc11966/11-17-Rivlin-Ryan_Preliminary_Analysis.pdf; and Senators Joseph Lieberman and Tom Coburn, “A Bipartisan Plan to Save Medicare & Reduce Debt,” June 2011, http://coburn.senate.gov. 9 These justifications were offered in the Lieberman-Coburn and Bowles-Simpson plans. The RAND Health Insurance Experiment found that exposure to cost sharing decreases the use of medical care, at least in the short-term. For a summary of the research on how cost sharing affects spending and health outcomes, see Swartz, Kathryn, Cost-Sharing: Effects on Spending and Outcomes, Robert Wood Johnson Foundation, December 2010. 10 Davis et al., “Medicare Extra: A Comprehensive Benefit Option For Medicare Beneficiaries,” Health Affairs, October 2005. 11 These concerns were implied in recent studies that found that, while increased cost sharing for ambulatory care and/or prescription drugs decreased use of those services, it also ultimately increased use of inpatient hospital care. See Chandra, Amitabh, Jonathan Gruber, and Robin McKnight, “Patient Cost-Sharing, Hospitalization Offsets, and the Design of Optimal Health Insurance for the Elderly”, National Bureau of Economic Research Working Paper Series, March 2007; and Trivedi, Amal N., Husein Moloo, and Vincent Mor, “Increased Ambulatory Care Copayments and Hospitalizations among the Elderly,” New England Journal of Medicine, January 2010. 12 The Medicare Payment Advisory Commission (MedPAC) assessed various cost-sharing reforms that would be budget-neutral from Medicare’s perspective and would combine an out-of-pocket spending limit with a uniform deductible (such as a deductible of $1,170 deductible combined with a $5,000 out-of-pocket limit). MedPAC estimated that most beneficiaries would not experience an appreciable change in spending, more beneficiaries would spend more than less, but those who saved would have relatively large savings. See Medicare Payment Advisory Commission, “Report to Congress: Medicare and the Health Care Delivery System,” June 2011, http://www.medpac.gov/documents/Jun11_EntireReport.pdf. 13 Zuckerman and colleagues estimated the impact of four reforms that would combine a catastrophic limit with a uniform deductible and coinsurance rate (as well as eliminate the Part D deductible and “doughnut hole”) that would have increased Medicare spending, rather than achieve savings, and for the most part reduce beneficiary spending. They found that sicker beneficiaries, beneficiaries with higher initial spending levels, and enrollees in employer-sponsored plans benefited more from the reforms than other groups. See Zuckerman, Stephen, Baoping Shang, and Timothy Waidmann, “Reforming Beneficiary Cost Sharing to Improve Medicare Performance,” Inquiry Journal, Fall 2010. 14 In 2002, Maxwell, Storeygard, and Moon modeled the impact of 12 policies that would add an out-of-pocket limit to Medicare, with a combined deductible, modified coinsurance, and premium changes, illustrating spending tradeoffs between beneficiaries and the federal government, and documenting how higher utilizers and sick beneficiaries were especially likely to benefit from these reforms, contingent on supplemental coverage. See Maxwell, Stephanie, Matthew Storeygard, and Marilyn Moon, “Modernizing Medicare Cost-Sharing: Policy Options and Impacts on Beneficiary and Program Expenditures,” The Commonwealth Fund, November 2002. 15 Merlis, Mark, Medigap Reforms: Potential Effects of Benefit Restrictions on Medicare Spending and Beneficiary Costs, Kaiser Family Foundation, July 2011. 16 We also modeled a limit that would be budget neutral to Medicare ($4,815). Effects of the budget-neutral option are not discussed in the main report but shown in Appendix B, Table 4. 17 Kaiser Family Foundation, Medigap Reform: Setting the Context, September 2011, http://www.kff.org/medicare/8235.cfm. 18 Congressional Budget Office, March 2011 Medicare Baseline, March 2011, http://www.cbo.gov/budget/factsheets/2011b/medicare.pdf; Medicare Board of Trustees, 2011 Annual Report of the Board of Trustees of the Federal Hospital Insurance and Federal Supplementary Medical Insurance Trust Funds, May 2011, https://www.cms.gov/reportstrustfunds/downloads/tr2011.pdf; and Centers for Medicare and Medicaid Services, 2010 Medicare and Medicaid Statistical Supplement, https://www.cms.gov/MedicareMedicaidStatSupp/09_2010.asp.

RestRuctuRing MedicaRe’s Benefit design – Implications for Beneficiaries and Spending40
40
19 For a discussion of the legal issues associated with amending Medigap coverage for in-force policies, see National Association of Insurance Commissioners, “Letter to the Joint Select Committee on Deficit Reduction Regarding Prohibition of Medigap First-Dollar Coverage,” September 21, 2011. 20 Chandra, Amitabh, Jonathan Gruber, and Robin McKnight, “Patient Cost-Sharing, Hospitalization Offsets, and the Design of Optimal Health Insurance for the Elderly,” National Bureau of Economic Research Working Paper Series, March 2007; Trivedi, Amal N., Husein Moloo, and Vincent Mor, “Increased Ambulatory Care Copayments and Hospitalizations among the Elderly,” New England Journal of Medicine, January 2010. 21 Goldman, Dana and Tomas J. Philipson, “Integrated Insurance Design in the Presence of Multiple Medical Technologies,” American Economic Review, May 2007. 22 Groups not mutually exclusive. 23 Kaiser Family Foundation, Raising the Age of Medicare Eligibility: A Fresh Look Following Implementation of Health Reform, July 2011, http://www.kff.org/medicare/upload/8169.pdf. 24 Our model does not examine how changes in Medicare Advantage payments would affect changes in out-of-pocket spending by Medicare Advantage enrollees. It is possible that plans would choose to offset lower Medicare payments by raising beneficiary cost sharing (and vice versa), but such effects are outside the scope of our analysis. 25 We assumed that 57 percent of Medicaid spending is paid for by the federal government and 43 percent is paid for by states. 26 The effects of the $4,815 budget-neutral out-of-pocket spending limit are in between the lower and higher out-of-pocket limits discussed here. 27 Office of Management and Budget, Living Within Our Means and Investing in the Future: The President’s Plan for Economic Growth and Deficit Reduction, September 2011. 28 Davis et al., “Medicare Extra: A Comprehensive Benefit Option For Medicare Beneficiaries,” Health Affairs, October 2005. 29 Congressional Budget Office, A Detailed Description of CBO’s Cost Estimate for The Medicare Prescription Drug Benefit, July 2004; 2011 Annual Report Of The Boards Of Trustees Of The Federal Hospital Insurance And Federal Supplementary Medical Insurance Trust Funds, May 2011. 30 While there is a possibility that some of the cost-sharing amounts reported in MEPS might be associated with balance billing, given that balance billing is now a very small percentage of allowed charges (0.04 percent in 2009, according to the 2010 Health Care Financing Review Statistical Supplement) we think there is essentially no effect of including these amounts in the spending totals. Additionally, our examination of MCBS claims data including and excluding non-covered claims within Medicare-covered service categories (such as a particular procedure under the physician category that is not covered by Medicare) indicates that the possible presence of non-Medicare-covered claims in MEPS data is not large enough to have a substantial effect on the distributions of out-of-pocket and third-party spending by service and supplemental insurance type. 31 Trivedi, Amal N., Husein Moloo, and Vincent Mor, “Increased Ambulatory Care Copayments and Hospitalizations among the Elderly,” New England Journal of Medicine, January 2010. 32 Chandra, Amitabh, Jonathan Gruber, and Robin McKnight, “Patient Cost-Sharing, Hospitalization Offsets, and the Design of Optimal Health Insurance for the Elderly,” National Bureau of Economic Research Working Paper Series, March 2007.


THE HENRY J. KAISER FAMILY FOUNDATION
Headquarters2400 Sand Hill RoadMenlo Park, CA 94025Phone 650-854-9400 Fax 650-854-4800
Barbara Jordan Conference Center1330 G Street, NWWashington, DC 20005Phone 202-347-5270 Fax 202-347-5274
www.kff.org
This publication (#8256) is available on the Kaiser Family Foundation’s website at www.kff.org.
The Kaiser Family Foundation, a leader in health policy analysis, health journalism and communication, is dedicated to filling the need for trusted, independent information on the major health issues facing our nation and its people. The Foundation is a non-profit private operating foundation, based in Menlo Park, California.


