1 PREFACE The Publication entitled District Statistical Hand Book 2013-2014 Kancheepuram District, has been prepared based on data gathered from various departments. This Hand Book provides informations on various sectors such as Area and Population, Education, Climate & Rainfall, Agriculture, Industries, Transport, Health & Welfare, Consumption of production of Electricity etc. I extend my sincere thanks to the District Collector for having instructed the District level Officers of various Departments to furnish the particulars to this Office. I also to extend my thanks to various Heads of Government Offices, Public sector, and Private sector Organisation for having furnished the required data I hope this Hand book will be useful to Administrators, Research Scholars, Statisticians, and Socio-Economic and planners whoare in need different statistics relating to Kanchipuram District. Suggestions for the improvement of this Hand Book are most welcome. Kancheepuram. Date: 13.05 .2015 Deputy Director of Statistics, Kancheepuram.
Transcript
1
PREFACE
The Publication entitled District Statistical Hand Book 2013-2014
Kancheepuram District, has been prepared based on data gathered from
various departments.
This Hand Book provides informations on various sectors such as
Area and Population, Education, Climate & Rainfall, Agriculture, Industries,
Transport, Health & Welfare, Consumption of production of Electricity etc.
I extend my sincere thanks to the District Collector for having
instructed the District level Officers of various Departments to furnish the
particulars to this Office.
I also to extend my thanks to various Heads of Government
Offices, Public sector, and Private sector Organisation for having furnished
the required data
I hope this Hand book will be useful to Administrators, Research
Scholars, Statisticians, and Socio-Economic and planners whoare in need
different statistics relating to Kanchipuram District.
Suggestions for the improvement of this Hand Book are
most welcome.
Kancheepuram. Date: 13.05 .2015 Deputy Director of Statistics, Kancheepuram.
2
SALIENT FEATURES ON GEOGRAPHICAL POSITION OF KANCHIPURAM DISTRICT
Kanchipuram - the Ancient town of TamilNadu, which held and still holds a lot of historical significance is prominent during the pallava dynasty. 'Kanchi' in Tamil literature was also one of the seven celebrated holy cities of ancient and medieval India. Azhwars like Nammazhwar, Periyazhvar and Saivite Nayanmars like Sudramoorthy, Thirunavukkarasar sung their hymns in this town. A great Vainava scholar Sri Ramanujar was born in Thiruperumbudur of Kancheepuram District. Sri Athisanakarar has founded and established Kamakoti Peetam. In 6th century Jainism and Buddhism flourished in this town. Chinese scholars Fahian and Hiuen Tsung also visited this town. The saint named Thomas a follower of Jesus Christ also came and preached in the place now named after him as Saint Thomas Mount. There were two famous universities in this region in ancient days. One was Nalanda University in northern region and another one was Kanchi university during the Pallava regime. An architectural, historical town known as 'Mamallapuram' is also located in this district. The atomic power station, which started functioning in 1983 is at Kalpakkam which is nearer to Mamallapuram. Kancheepuram town is locateds on the bank of the Vegavathi river which is found dried most of the years. Initially known as Chengalpattu District, was bifurcated on 18.11.1997 as Kancheepuram and Thiruvallur districts. Kancheepuram District consists of 11 Taluks, 13 Panchayat unions, 8 Municipalities and 18 Town Panchayats. GEOGRAPHY :The area of this district is 4433 Sq.Km. and the length of the coastal line is 87.2 Km. It has Chennai district and Bay of Bengal on the East, Tiruvallur and Chennai on the North, Thiruvannamalai and Vellore Districts on the West and Villupuram District on South. This district is flat and having small hills in Chengalpattu and Manuranthgam Taluks CLIMATE : The climate is normal during winter but very hot in Summer RAINFALL : This District depends on the South-West and North-East Monsoons. RIVERS :Palar is the main river of this district. Cheyyar and Vegavathy rivers are tributory and join the Palar river at Thirumukkudal. CONCLUSION : The famous Vedanthangal Bird sanctuary is found in this district. This district is also famous for Silk sarees. Most of the people are engaged in Agriculture, Weaving, Business in silk sarees and general merchants. DATE: 13.05.2015 Deputy Director of Statistics Kancheepuram.
3
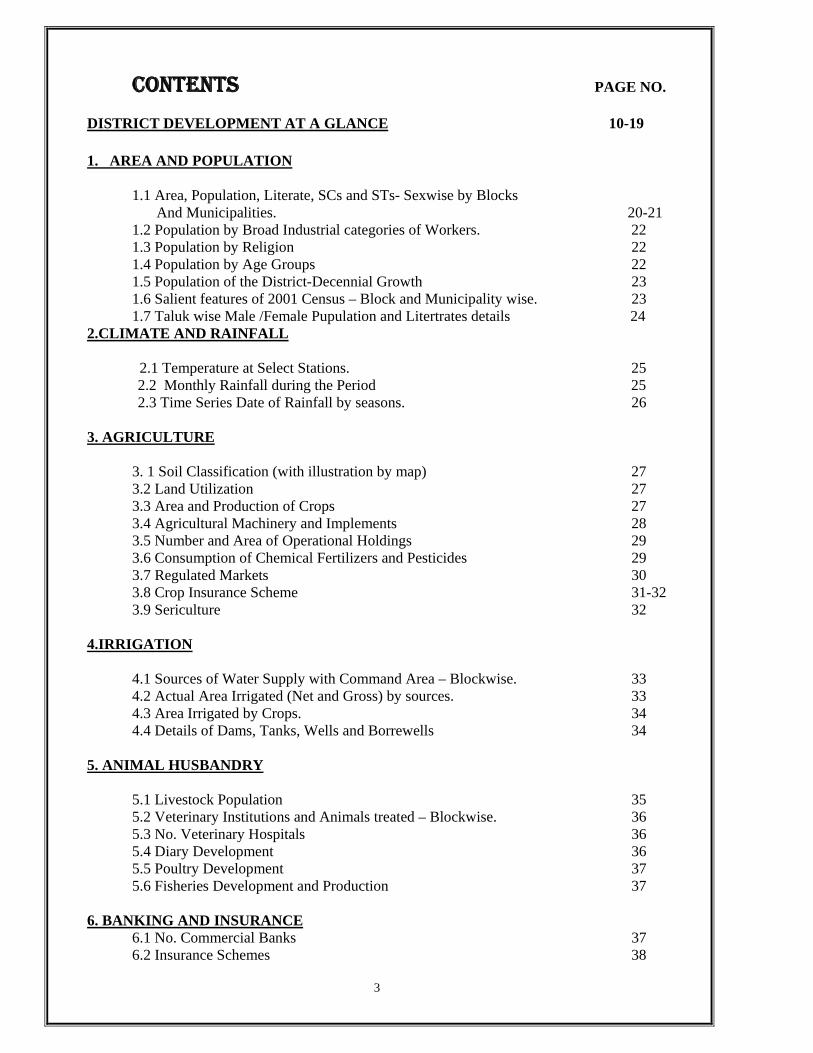
CONTENTS PAGE NO. DISTRICT DEVELOPMENT AT A GLANCE 10-19 1. AREA AND POPULATION 1.1 Area, Population, Literate, SCs and STs- Sexwise by Blocks
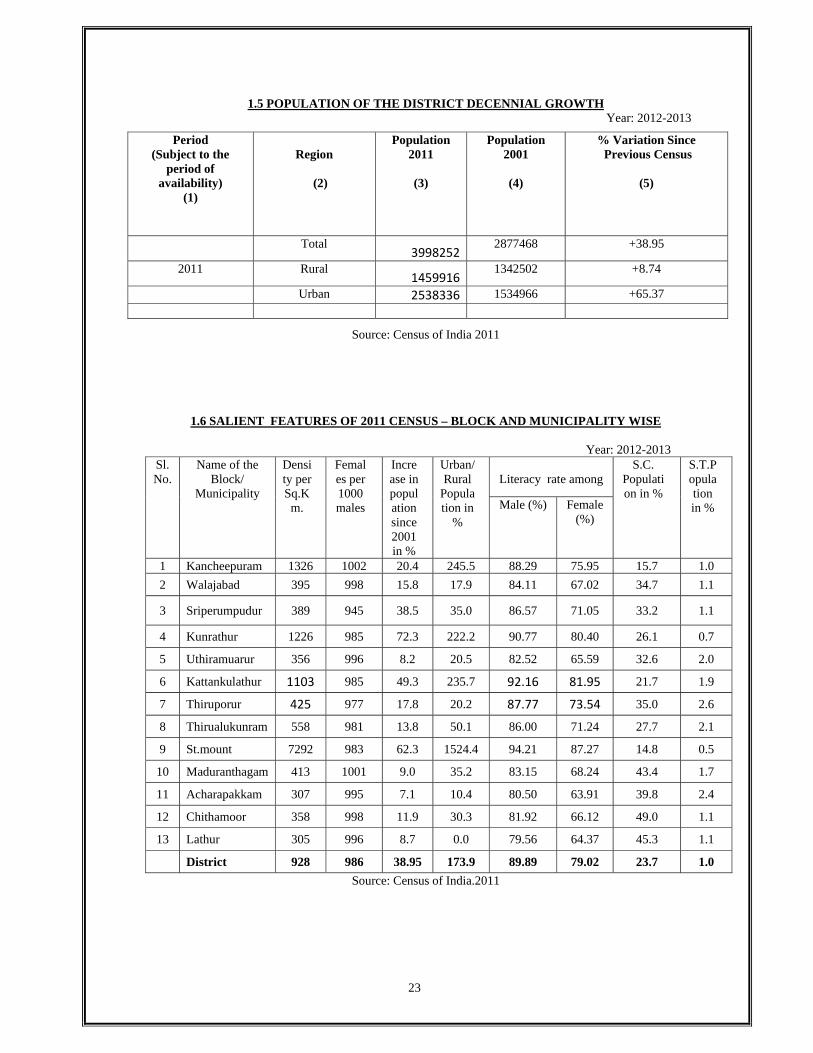
And Municipalities. 20-21 1.2 Population by Broad Industrial categories of Workers. 22 1.3 Population by Religion 22 1.4 Population by Age Groups 22 1.5 Population of the District-Decennial Growth 23
1.6 Salient features of 2001 Census – Block and Municipality wise. 23 1.7 Taluk wise Male /Female Pupulation and Litertrates details 24 2.CLIMATE AND RAINFALL
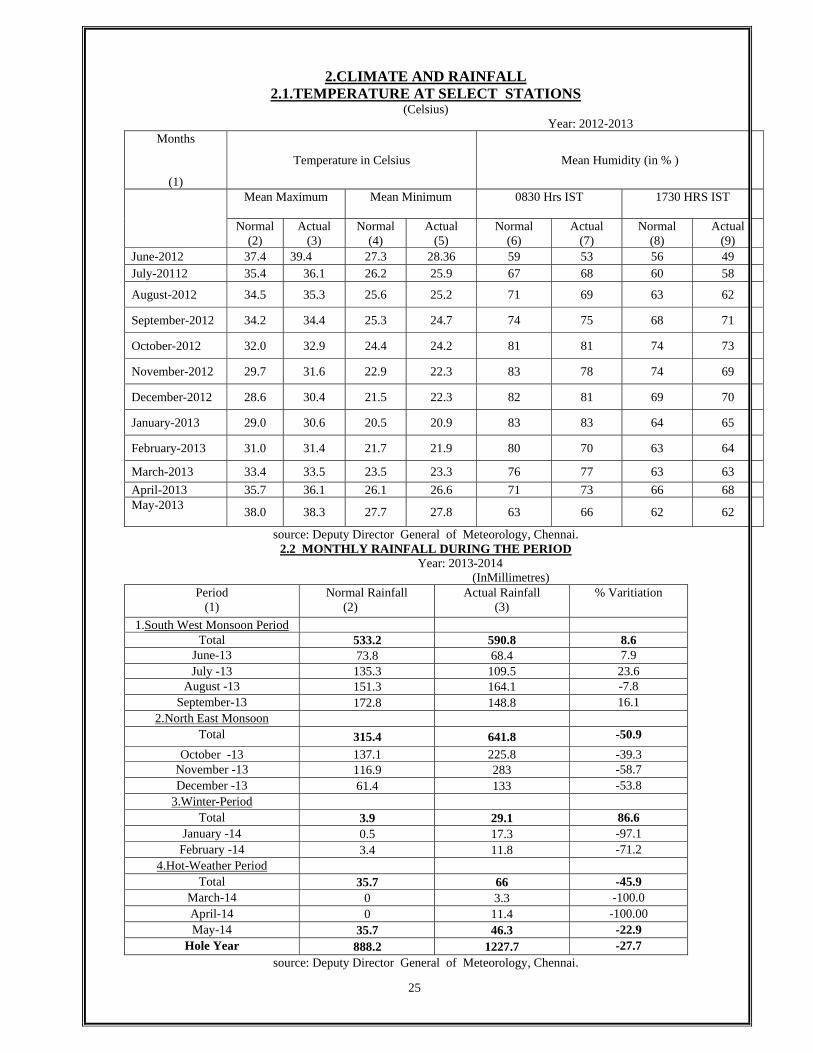
2.1 Temperature at Select Stations. 25
2.2 Monthly Rainfall during the Period 25 2.3 Time Series Date of Rainfall by seasons. 26
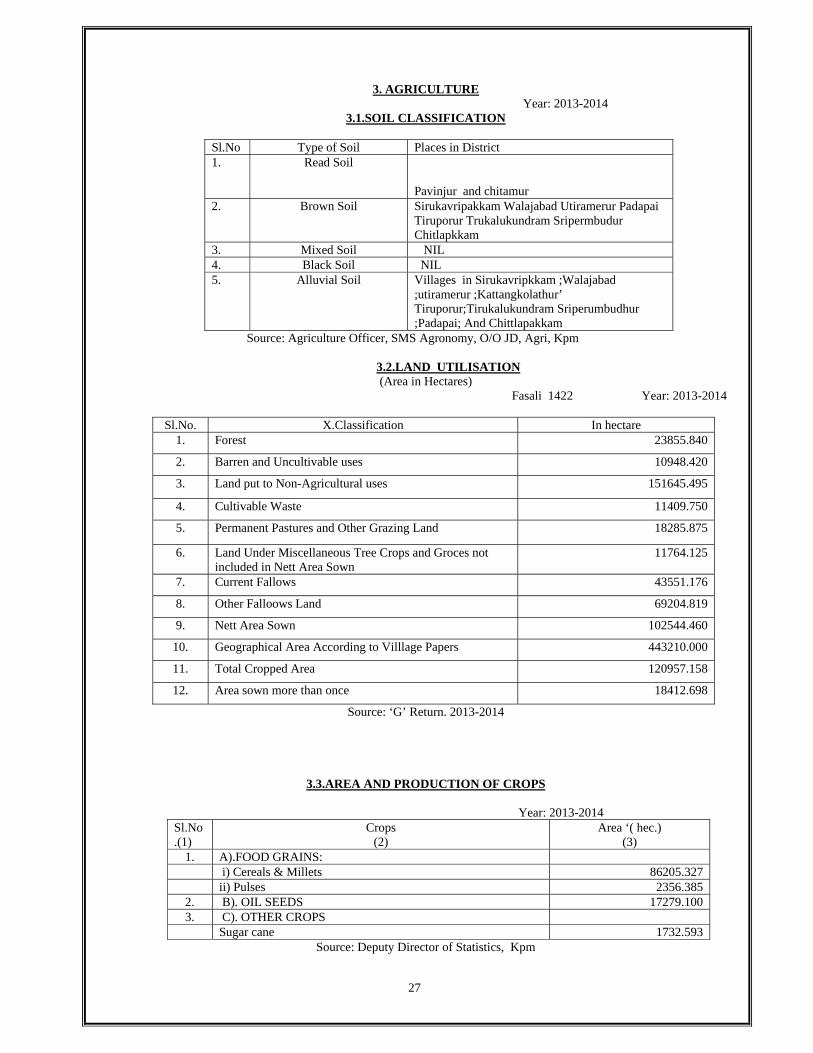
3. AGRICULTURE
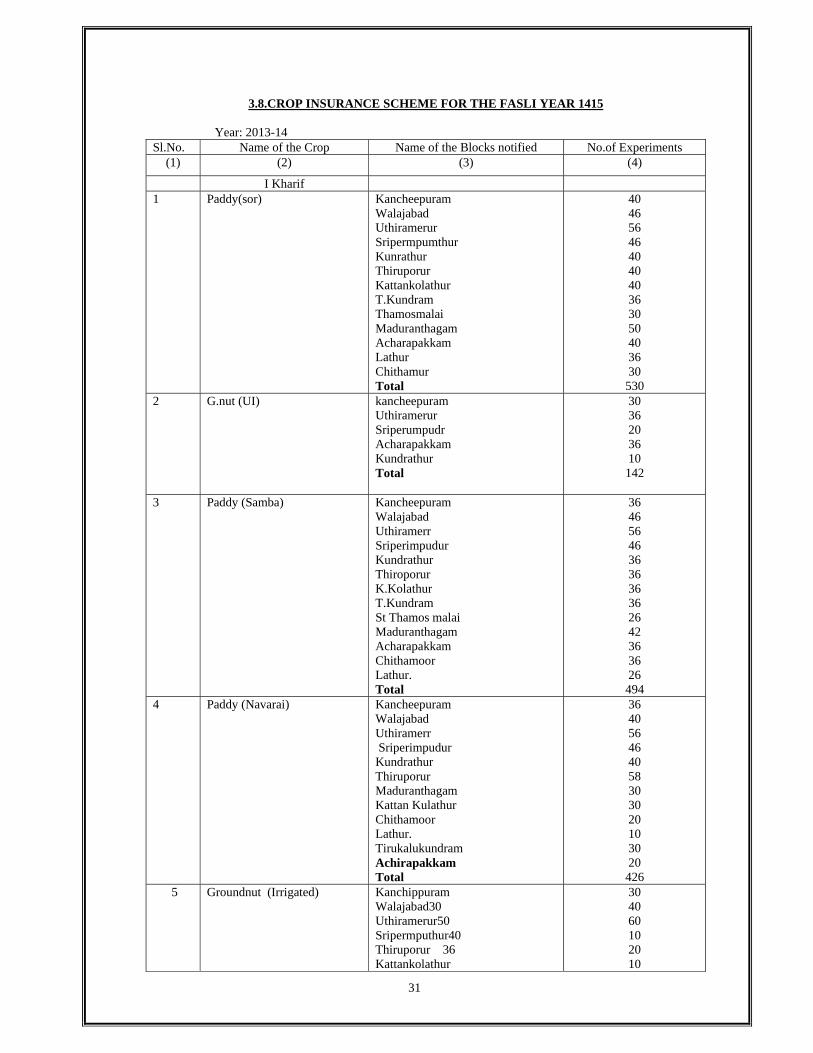
3. 1 Soil Classification (with illustration by map) 27 3.2 Land Utilization 27 3.3 Area and Production of Crops 27 3.4 Agricultural Machinery and Implements 28 3.5 Number and Area of Operational Holdings 29 3.6 Consumption of Chemical Fertilizers and Pesticides 29 3.7 Regulated Markets 30 3.8 Crop Insurance Scheme 31-32 3.9 Sericulture 32
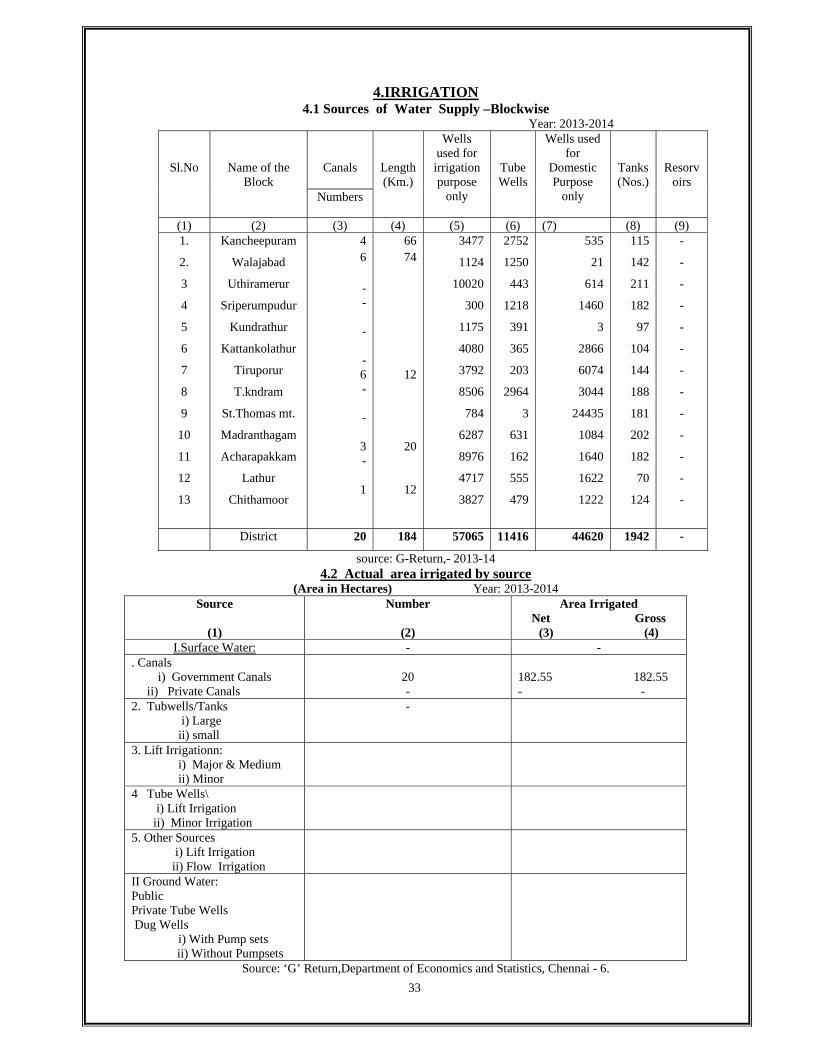
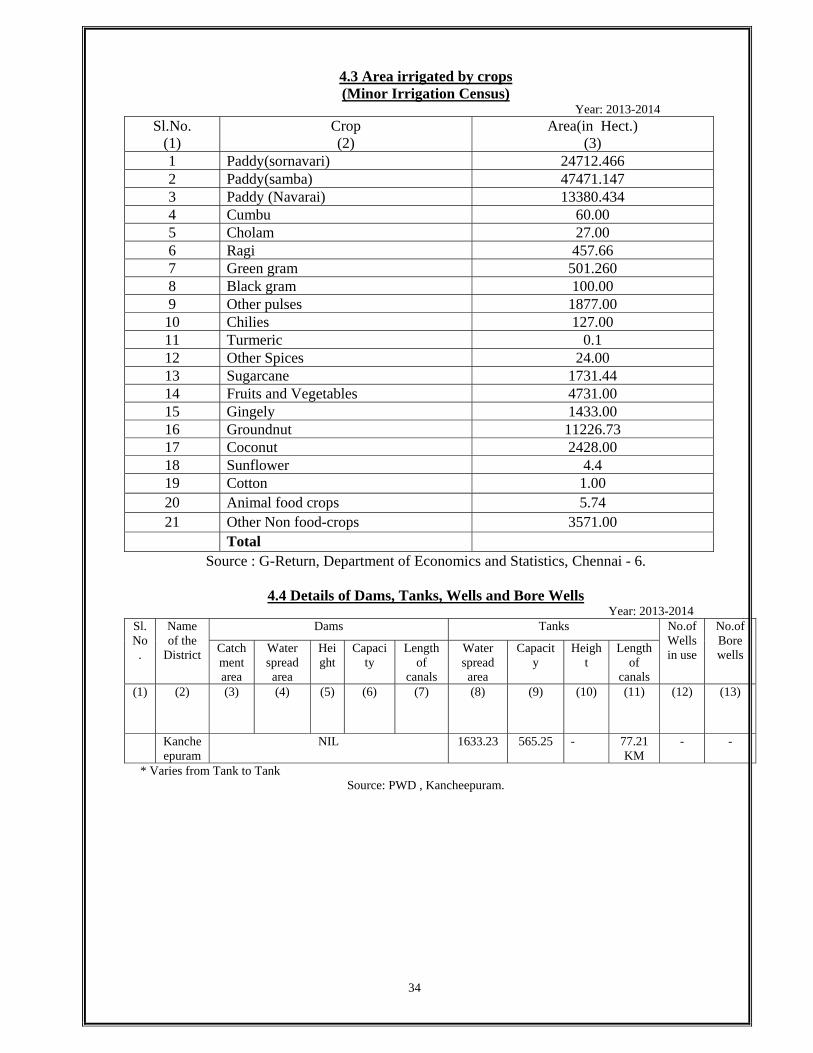
4.IRRIGATION 4.1 Sources of Water Supply with Command Area – Blockwise. 33 4.2 Actual Area Irrigated (Net and Gross) by sources. 33 4.3 Area Irrigated by Crops. 34 4.4 Details of Dams, Tanks, Wells and Borrewells 34
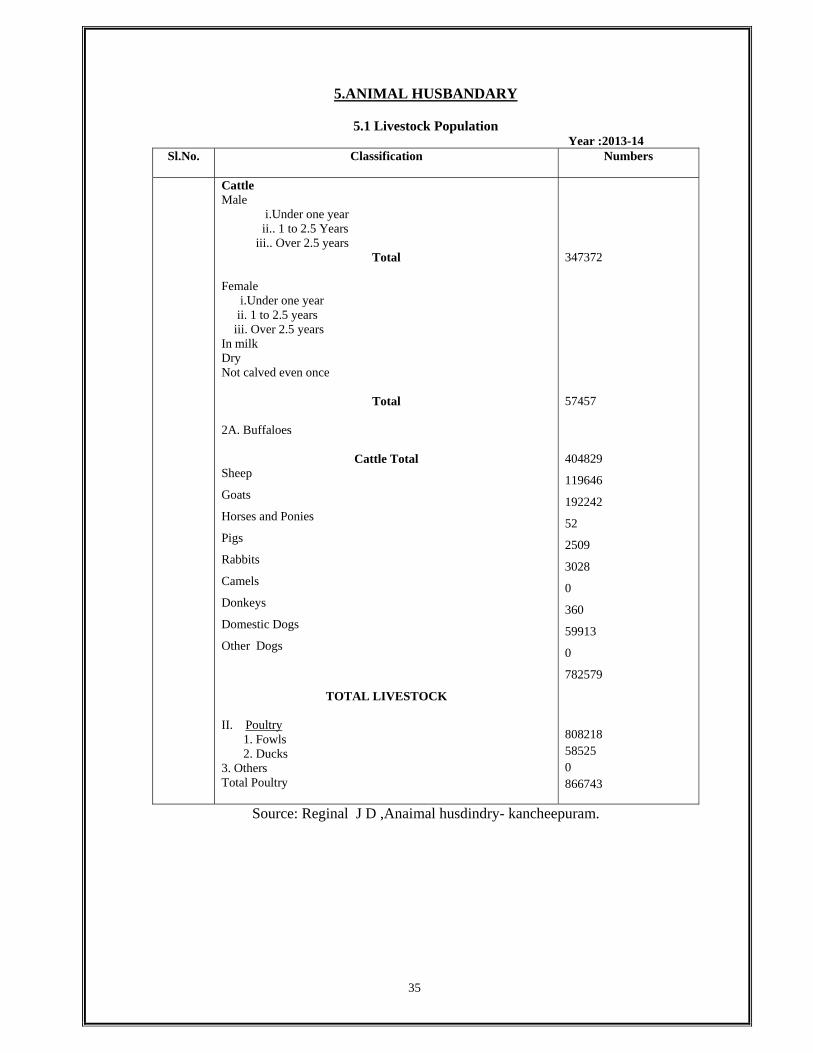
5. ANIMAL HUSBANDRY 5.1 Livestock Population 35 5.2 Veterinary Institutions and Animals treated – Blockwise. 36 5.3 No. Veterinary Hospitals 36 5.4 Diary Development 36 5.5 Poultry Development 37 5.6 Fisheries Development and Production 37
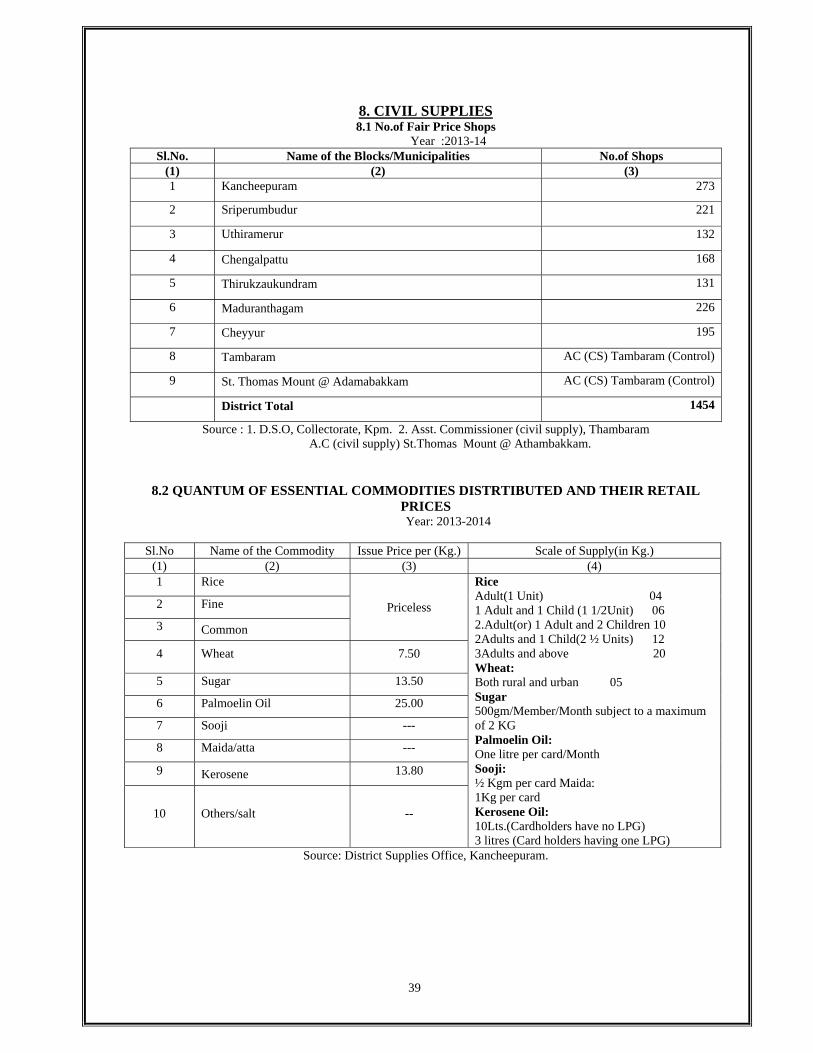
8.1 No. Fair Price Shops 39 8.2 Quantum of Essential Commodities 40 8.3 No. Ration Cards (Rural and Urban) 41
8.4 Quantity supplied 41 8.5 No. LPG Connections 41 8.6 No of Persons waiting for LPG connections 42
9. COMMUNICATION 9.1 Post-Offices doing postal business only 42 9.2 Post-Offices doing Post and Telegraphic Business 42 9.3 Telegraph Offices 42 9.4 No. Telephone Exchanges, Capacity and No. Use 43 9.5 No. PCOs attached to each exchange 43 9.6 No. Persons waiting for Phone Connection. 43
10. ELECTRICITY 10.1No.of Power Stations 44 10.2 Quantum of Power purchased 44 10.3 Power Consumption Sectorwise 45 10.4 Peak Demand and Energy Output 45 1 0.5 Revenue from Electric Schemes and Cost per Unit 45 10.6 Transmission and Distribution of Electricity 46 10.7 Capacity of Transformers 47-50 10.8 Rural Electrification 51 10.9 Name and Address of fault report offices. 51
11. EDUCATION 11.1 Universities, Students and Teachers and Courses offered 51-59 11.2 Colleges for General Education, Students and Teachers 59 11.3 College for Professional Education, Students and Teachers 60 11.4 Colleges for Special Education, Students and Teachers 60 11.5 Schools for General Education, Students and Teachers 61 11.6 Schools for Professional Education, Students and Teachers 62 11.7 Schools for Special Education, Students and Teachers 62 11.8 Institutions for Other Professional Education,
Students and Teachers 62 11.9 Computer Training Centres 63 11.10 Hostels and Inmates by Community 63 11.11 Scholarships to Students by Community 63
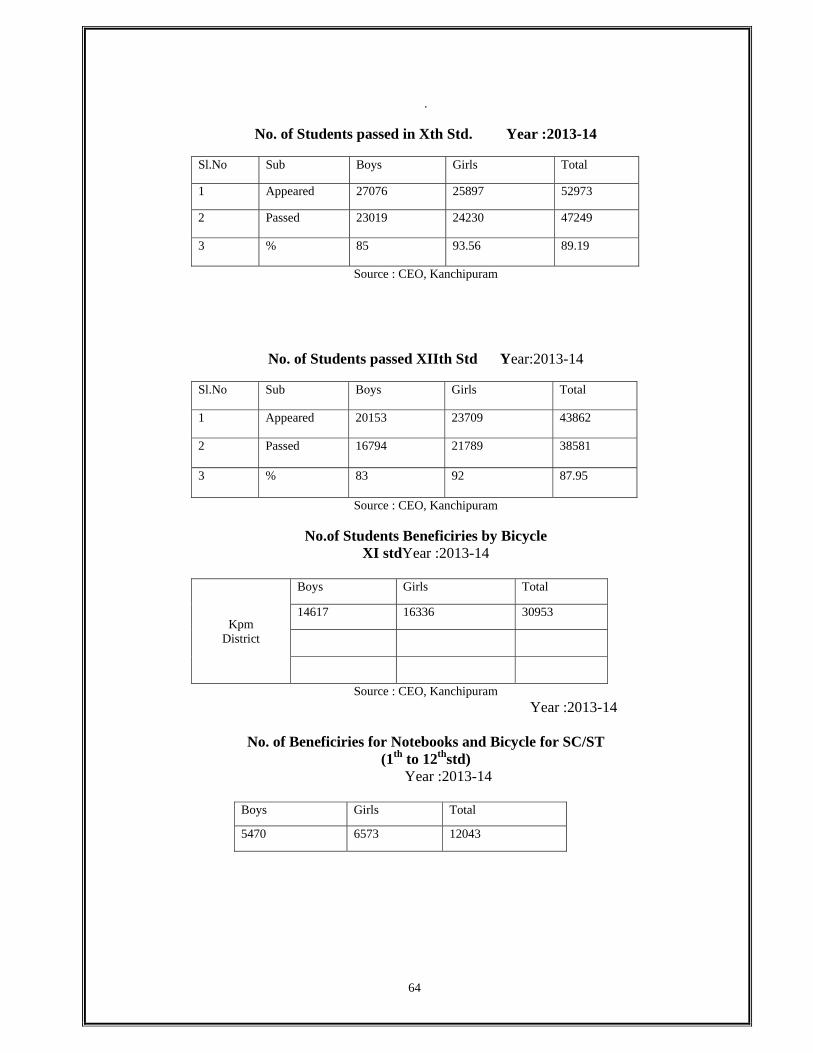
11.12. School Students Beneficiaries Details 64
5
12. FISHERIES 12.1 Fisheries Development 65 12.2 Estimated M F Production/Inland Fish Production 66 12.3 No. Families engaged in Fishing 66
13. HANDLOOM
13.1 No.of Focal Centres with Location details 66 13.2 No. Societies and Variety wise Production 67 13.3 No.of Power Looms and No.of Employees working 67 13.4 No.of Families engaged 67
14. HANDICRAFTS
14.1 Name and Addresses of Handicrafts 67 14.2 Articles available in the Handicrafts 68 14.3 Value of Articles produced 68 14.4 No.of Families engaged in Handicrafts 69
15.HEALTH AND FAMILY WELFARE
15.1 Hospitals, Dispensaries, Bed Strength, Doctors and Nurses 69 15.2 No. Allied Pathological Units available 70 15.3 Disease wise patients treated 70 15.4 Distribution of Medical Personnel 71 15.5 Progress of Family Welfare Program 71
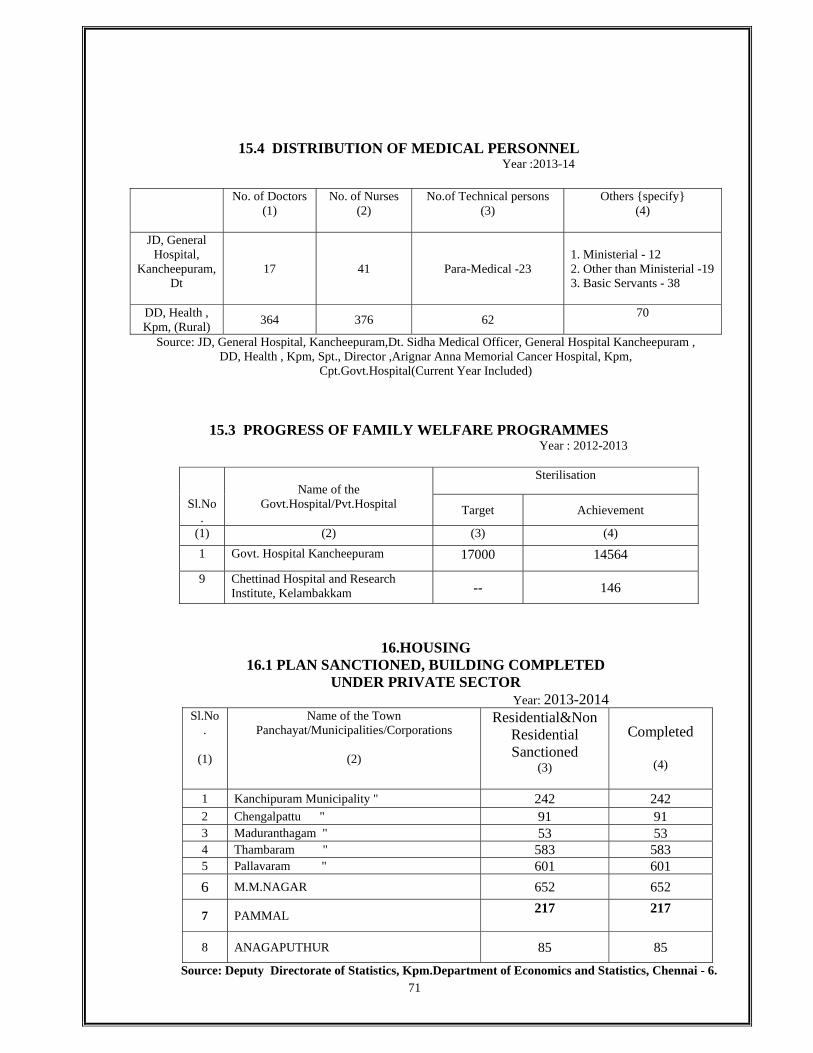
16.HOUSING
16.1 Plans sanctioned, Building completed under Private Sector 71 16.2 Plans sanctioned, Building completed under Public Sector 72 16.3 Amount invested in Housing and Building activity under Public Sector 72 16.4 Construction activity of Tamil Nadu Housing Board 73 16.5 Construction activity of Tamil Nadu Slum Clearance Board 73 16.6 Index No. Building Construction cost in Urban centres 74 16.7 Labour charges of Construction Workers 74
17- INDUSTRIES
17.1 Results of ASI 74 17.2 Estimates of Output and Value Added by Manufacture BASED ON 75 Annual Survey of Industries. 17.3 Industrial Production. 75 17.4 Production and Value of Major Minerals in the District 75 17.5 Production of Handloom Cloth 75 17.6 Small Scale Industries 75 17.7 Khadi and Village Industries 76 17.8 No.of Printing Presses 76 17.9 No.of Photocopy (Xerox) centres 76 17.10 Khadi and Village Industries 77 17.11 Village industries 77
6
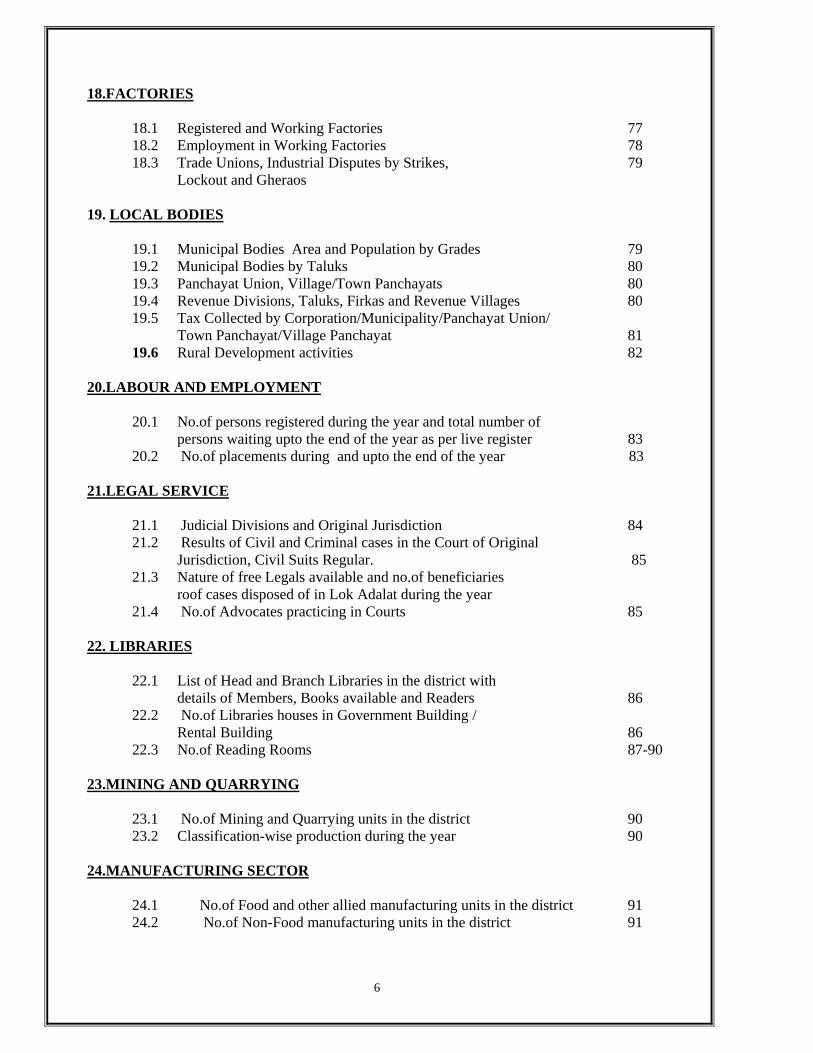
18.FACTORIES
18.1 Registered and Working Factories 77 18.2 Employment in Working Factories 78 18.3 Trade Unions, Industrial Disputes by Strikes, 79 Lockout and Gheraos
19. LOCAL BODIES
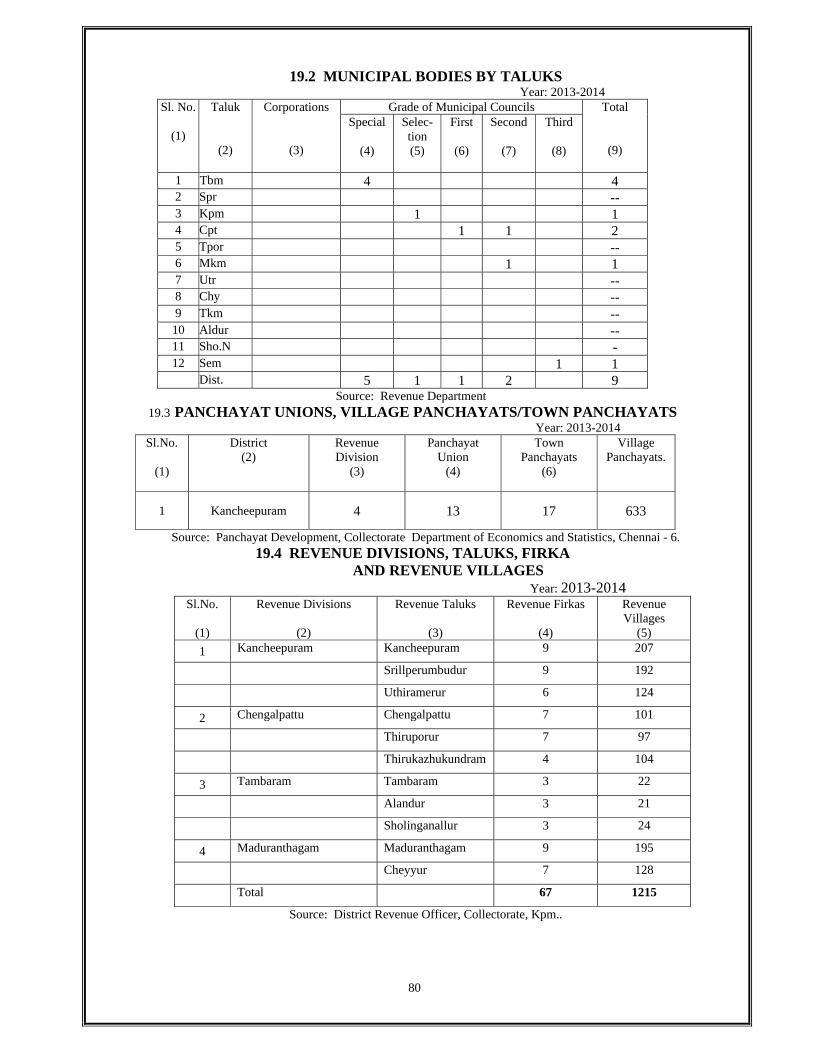
19.1 Municipal Bodies Area and Population by Grades 79 19.2 Municipal Bodies by Taluks 80 19.3 Panchayat Union, Village/Town Panchayats 80 19.4 Revenue Divisions, Taluks, Firkas and Revenue Villages 80 19.5 Tax Collected by Corporation/Municipality/Panchayat Union/ Town Panchayat/Village Panchayat 81 19.6 Rural Development activities 82
20.LABOUR AND EMPLOYMENT
20.1 No.of persons registered during the year and total number of persons waiting upto the end of the year as per live register 83 20.2 No.of placements during and upto the end of the year 83
21.LEGAL SERVICE
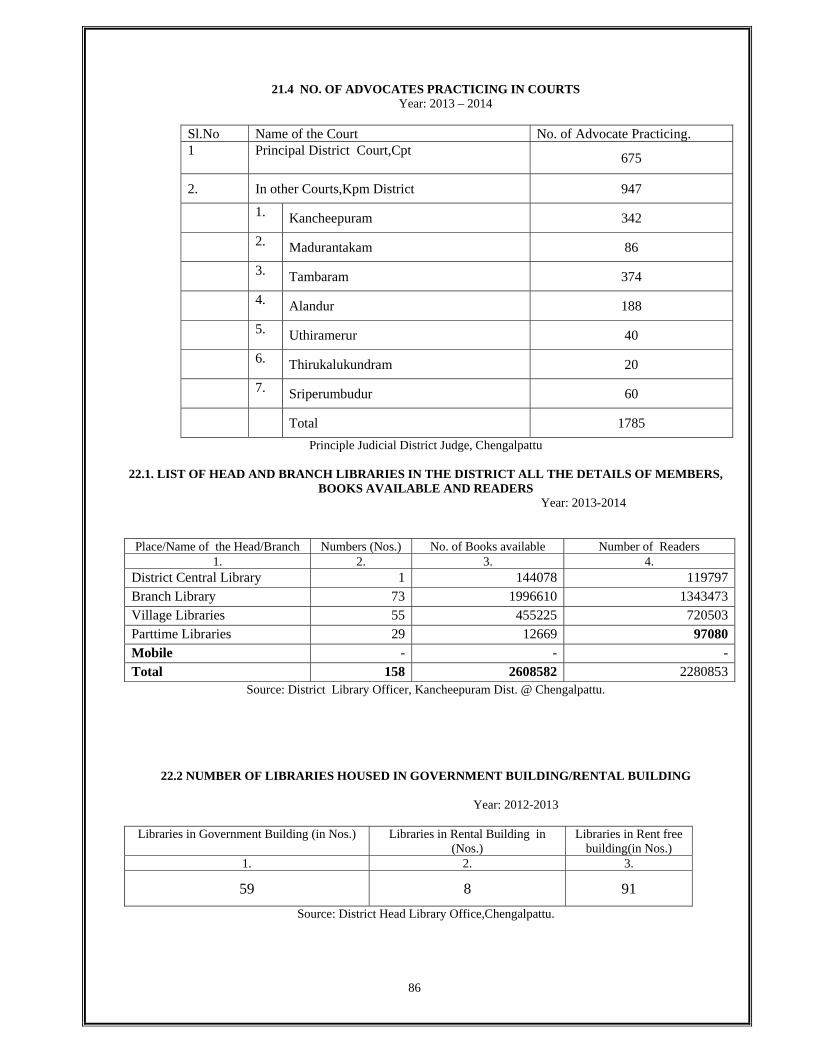
21.1 Judicial Divisions and Original Jurisdiction 84 21.2 Results of Civil and Criminal cases in the Court of Original Jurisdiction, Civil Suits Regular. 85 21.3 Nature of free Legals available and no.of beneficiaries roof cases disposed of in Lok Adalat during the year 21.4 No.of Advocates practicing in Courts 85
22. LIBRARIES
22.1 List of Head and Branch Libraries in the district with details of Members, Books available and Readers 86 22.2 No.of Libraries houses in Government Building / Rental Building 86 22.3 No.of Reading Rooms 87-90
23.MINING AND QUARRYING
23.1 No.of Mining and Quarrying units in the district 90 23.2 Classification-wise production during the year 90
24.MANUFACTURING SECTOR
24.1 No.of Food and other allied manufacturing units in the district 91 24.2 No.of Non-Food manufacturing units in the district 91
7
25. MEDICAL SERVICES 25.1 No.of Medical Colleges in the district with Students and Teachers 91 25.2 No.of College of Pharmacy with Students and Teachers 91 25.3 No.of Medical Stores in the district - Category-wise 92 25.4 No.of Veterinary Colleges with Students and Teachers 92
26 MOTOR VEHICLES 26.1 No.of Motor Vehicles (Category-wise) Registered during 92-94 the year and upto the end of the year 26.2 No.of Motor Vehicles (Category-wise) available for hire purpose during and upto the end of the year 94 26.3 No.of Persons issued with Driving Licence 95
27. NON-CONVENTIONAL ENERGY GENERATION
27.1 No.of solar energy generating units in the district with 95 production data
27.2 No.of Wind Mills Generating units with production data 95
28. POLICE AND PRISONS 28.1 Police Force 95 28.2 Cognizable Offences under Indian Penal Code 96 28.3 Prisons and Convicts 96 28.4 Classification of convicts 97 28.5 No.of Cases Registered under PCR 97 28.6 No.of Cases Registered against Woman 98
Harassment and Dowry
29. PUBLIC HEALTH
29.1 Public Health and Medical Services rendered by 98 Organisations and Individual 29.2 No.of Primary Health Centres with Sub-centres 98
30. PRINTING AND PUBLICATION
30. 1 No.of News papers, Weekly Magazines, Monthly Magazines, 99 etc., Published 30. 2 No.of Publishers in the district other than News papers and 99 Magazines 30. 3 No.of Printing ;presses in the district 99
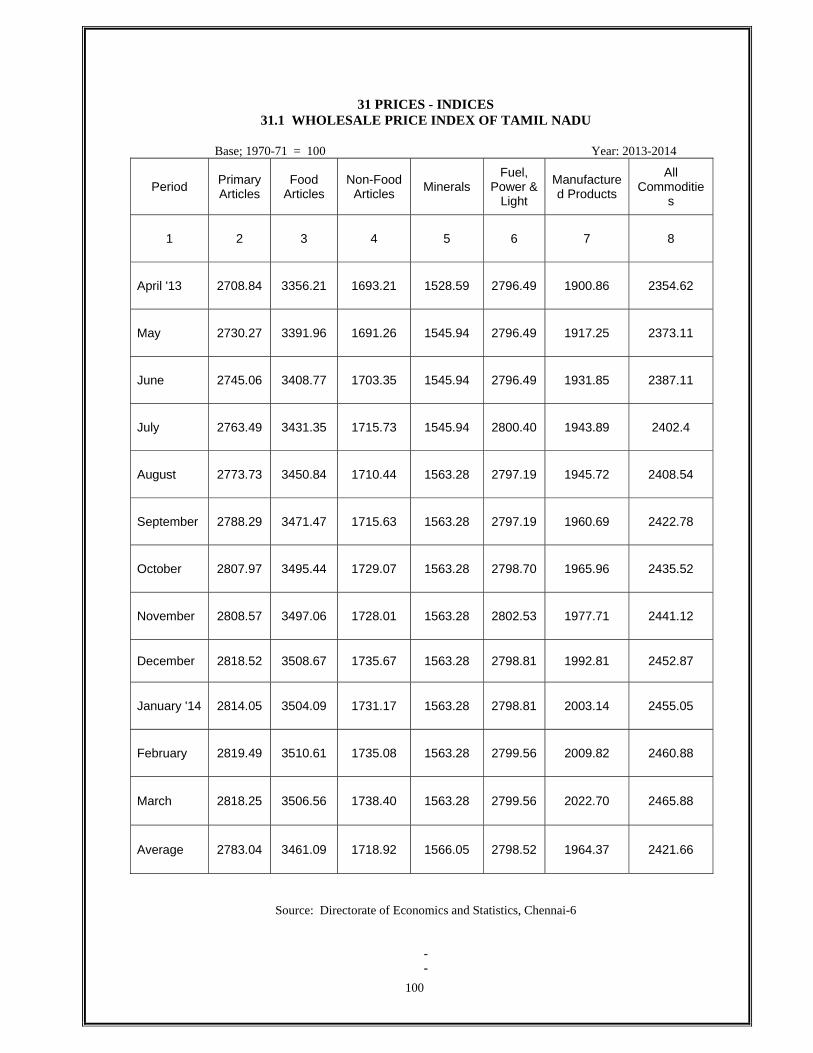
31. PRICE INDICES
31.1 Index Numbers of Wholesale Prices 100 31.2 Consumer Price Index Numbers for Industrial Workers 101 31.3 Consumer Price Index Numbers for selected essential items in Rural 101 31.4 Consumer Price Index Numbers for selected essential items in Urban 102 31.5 Linked All India ConsumerPrice Index On Base 1984-85=100 102
8
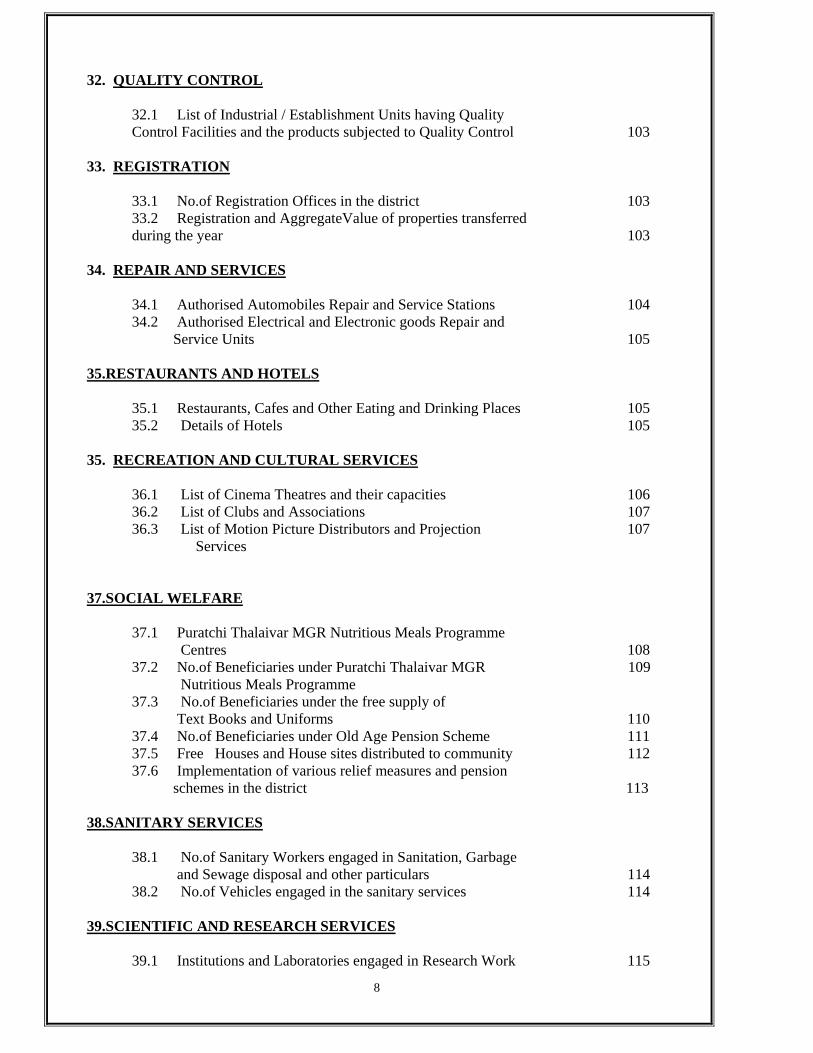
32. QUALITY CONTROL
32.1 List of Industrial / Establishment Units having Quality Control Facilities and the products subjected to Quality Control 103
33. REGISTRATION
33.1 No.of Registration Offices in the district 103 33.2 Registration and AggregateValue of properties transferred during the year 103
34. REPAIR AND SERVICES
34.1 Authorised Automobiles Repair and Service Stations 104 34.2 Authorised Electrical and Electronic goods Repair and Service Units 105
35.RESTAURANTS AND HOTELS 35.1 Restaurants, Cafes and Other Eating and Drinking Places 105 35.2 Details of Hotels 105
35. RECREATION AND CULTURAL SERVICES
36.1 List of Cinema Theatres and their capacities 106 36.2 List of Clubs and Associations 107 36.3 List of Motion Picture Distributors and Projection 107 Services
Nutritious Meals Programme 37.3 No.of Beneficiaries under the free supply of
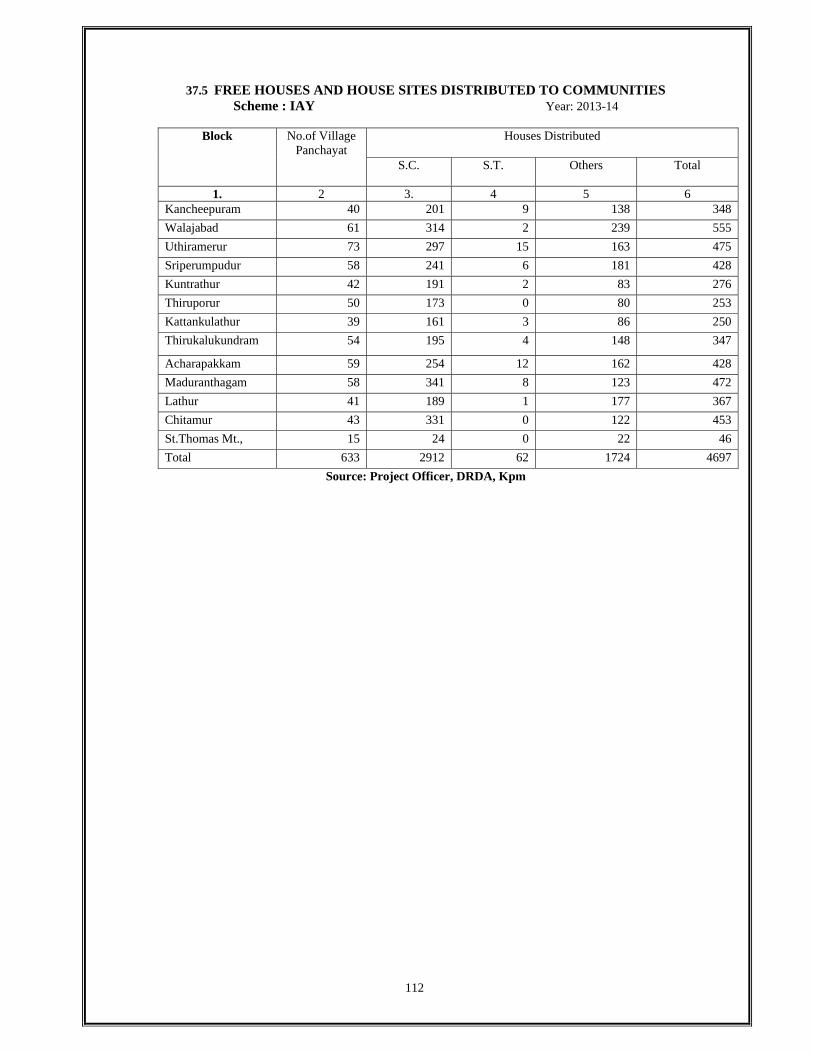
Text Books and Uniforms 110 37.4 No.of Beneficiaries under Old Age Pension Scheme 111 37.5 Free Houses and House sites distributed to community 112 37.6 Implementation of various relief measures and pension schemes in the district 113
38.SANITARY SERVICES
38.1 No.of Sanitary Workers engaged in Sanitation, Garbage and Sewage disposal and other particulars 114
38.2 No.of Vehicles engaged in the sanitary services 114 39.SCIENTIFIC AND RESEARCH SERVICES
39.1 Institutions and Laboratories engaged in Research Work 115
9
40.STORAGE FACILITIES
40.1 List of Agricultural and Non-Agricultural Storage Godowns 115 40.2 List of Cold Storage Godowns 116
41. TEXTILES
41.1 No.of Ginning, Spinning and Weaving Mills in the district 116 41.2 Quantum of Production during the year 116
42.TRADE AND COMMERCE
42.1 No.of Major and Minor Trade and Commercial Estate in the district 116
43.TRANSPORT
43.1 Length of Roads 117 43.2 Road Accidents 117 43.3 Register Motor Vehicles 118 43.4 Transport Corporation 118 43.5 Select indicators of overall performance of State Transport Corporation 119 43.6 Railway Lines and Stations 119 43.7 Port Development 120 43.8 Airports 120 43.9 Private Transport Operations 121-122
44. TOURISM
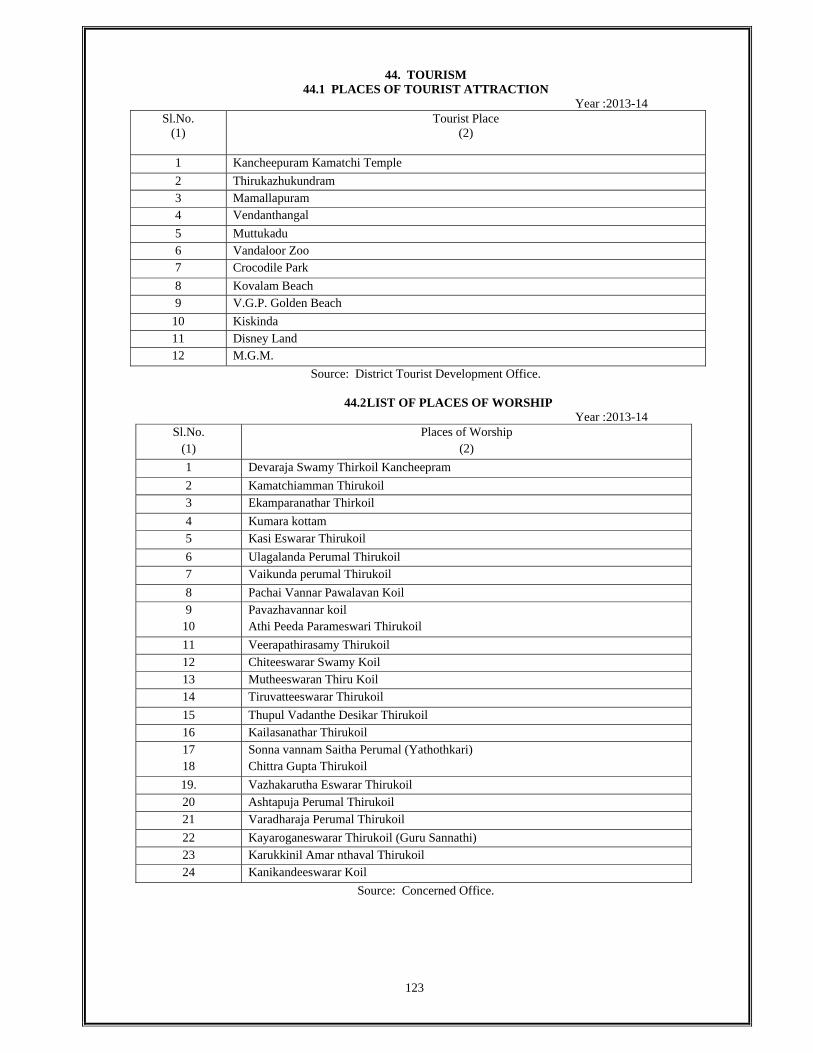
44.1 Places of Tourist Attraction 123 44.2 List of places of Worship 123 44.3 Hotels and Restaurants 124 44.4 Travel Agents 124 44.5 Train and Air Service Timings 124
45.VITAL STATISTICS
45.1 Births and Deaths registered in the district 125 45.2 Birth , Death and Infant Mortality rates in the district 125 45.3 Death by causes 125
46.VOLUNTARY SERVICES
46.1 List of Voluntary Services available in the district for the development of Rural and Urban Population 126
47.WATER WORK AND SUPPLY 47.1 No.of Schemes Operated in the district 127
47.2 No.of Workers engaged in the Water Works and Supply 127 47.3 No.of house connections and fountains 127
48.ECONOMICS CENSUS-2005 128-130
10
D I S T R I C T AT A GLANCE - 2013-2014 KANCHEEPURAM DISTRICT
1. GEOGRAPHICAL POSITION
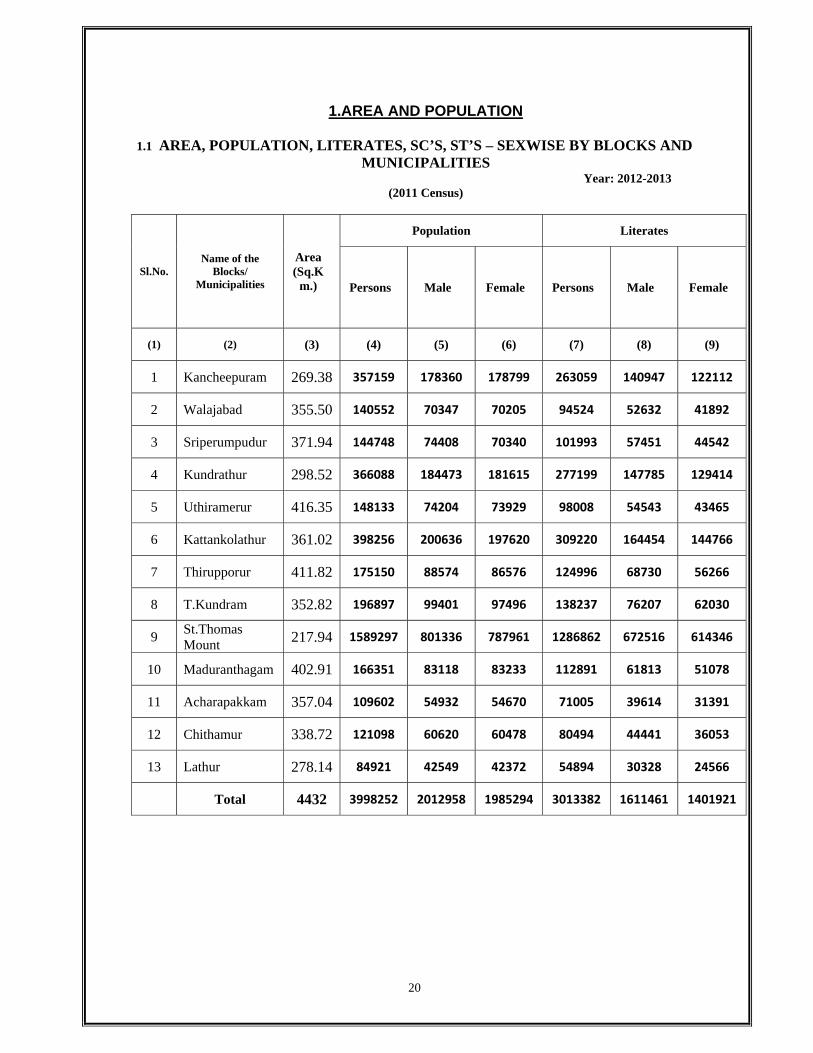
North Latitude : Between 110 00' and 120 00 ' East Longitude : Between 770 28 ' and 780 50 ' 2. AREA AND POPULATION
i. Area (Sq.Km.) : 4,433 ii. Population : 3998252
( As per 2011 Census)
a) Male Population : 2012958 b) Female Population : 1985294 c) Rural Population : 1459916 d) Urban Population : 2538336
iii. Density : 928
iv. Literates : 3013382 v. Workers
a) Total Workers : 1673814 b) Male Workers : 1181308 c) Female Workers : 492506 d) Rural Workers : 678251 e) Urban Workers : 995563 f) Cultivators : 74761 g) Agricultural Labourers : 162494 h) Household Industry : 41149 i) Other Workers : 1088974 j) Marginal Workers : 306436
vi. Non-Workers : 2324438 vii. Language Spoken in
the District : Tamil, Telugu, Urudu
3. VITAL STATISTICS (2012-13) i. Birth : 42539
ii. Death : 20604 iii. Still Birth : 381 iv. Infant Deaths : 463 v. Birth Rate (Per 1000 Population)
a) Rural : 15.0 b) Urban : 14.2 c) Combined : 14.8
vi. Death Rate (Per 1000 Population) a) a. Rural : 5.0 b) b. Urban : 4.4 c) c. Combined : 4.8
11
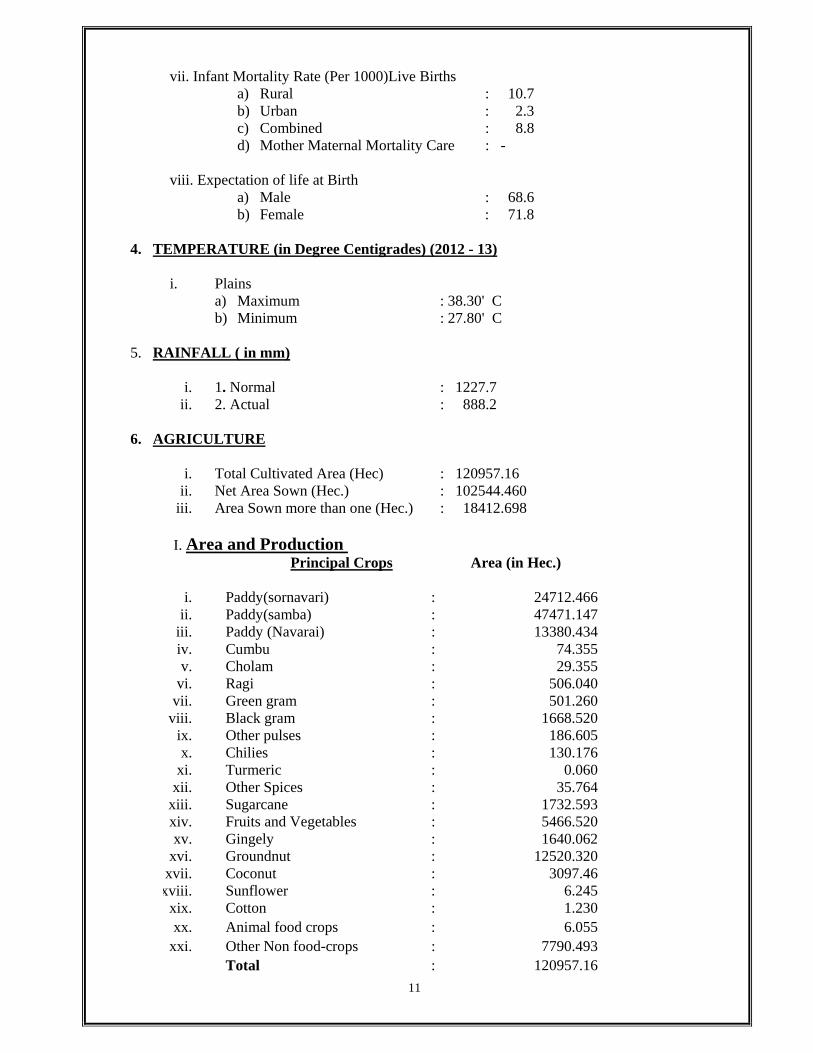
vii. Infant Mortality Rate (Per 1000)Live Births a) Rural : 10.7 b) Urban : 2.3 c) Combined : 8.8 d) Mother Maternal Mortality Care : -
viii. Expectation of life at Birth
a) Male : 68.6 b) Female : 71.8
4. TEMPERATURE (in Degree Centigrades) (2012 - 13)
i. Plains
a) Maximum : 38.30' C b) Minimum : 27.80' C
5. RAINFALL ( in mm)
i. 1. Normal : 1227.7
ii. 2. Actual : 888.2
6. AGRICULTURE
i. Total Cultivated Area (Hec) : 120957.16 ii. Net Area Sown (Hec.) : 102544.460
iii. Area Sown more than one (Hec.) : 18412.698
I. Area and Production Principal Crops Area (in Hec.)
i. Paddy(sornavari) : 24712.466
ii. Paddy(samba) : 47471.147 iii. Paddy (Navarai) : 13380.434 iv. Cumbu : 74.355 v. Cholam : 29.355
vi. Ragi : 506.040 vii. Green gram : 501.260
viii. Black gram : 1668.520 ix. Other pulses : 186.605 x. Chilies : 130.176
xi. Turmeric : 0.060 xii. Other Spices : 35.764
xiii. Sugarcane : 1732.593 xiv. Fruits and Vegetables : 5466.520 xv. Gingely : 1640.062
xvi. Groundnut : 12520.320 xvii. Coconut : 3097.46
xviii. Sunflower : 6.245 xix. Cotton : 1.230 xx. Animal food crops : 6.055
xxi. Other Non food-crops : 7790.493 Total : 120957.16
12
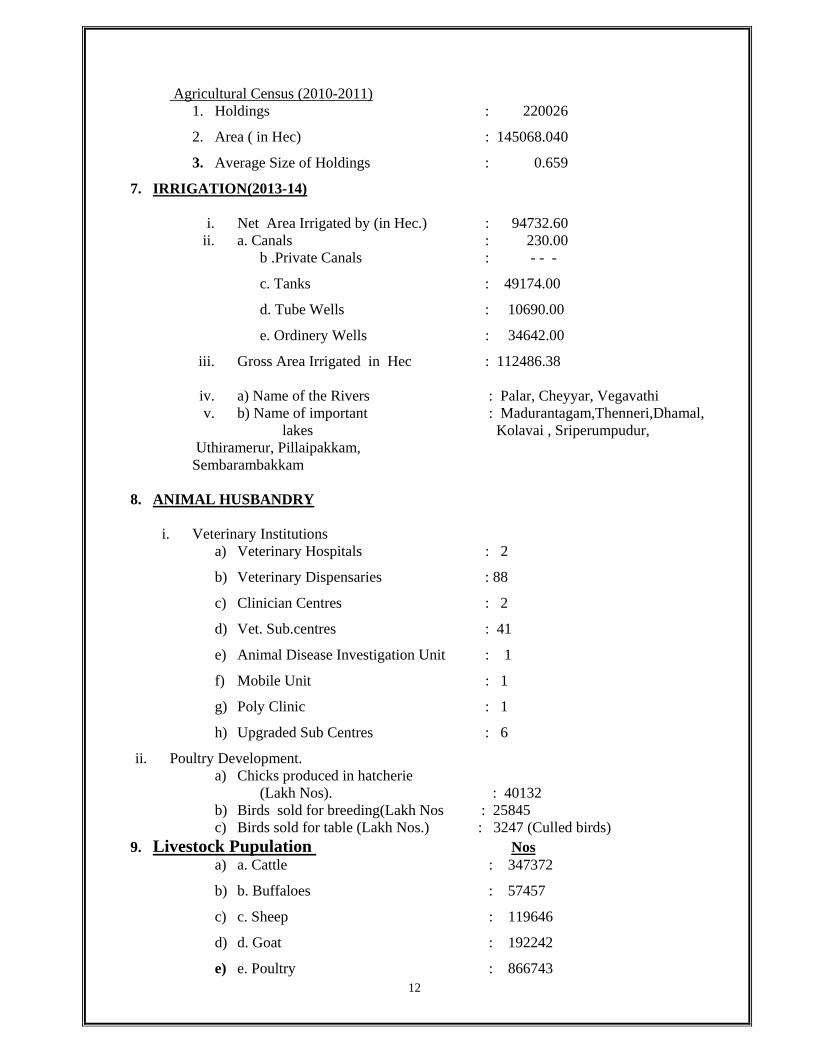
Agricultural Census (2010-2011)
1. Holdings : 220026
2. Area ( in Hec) : 145068.040
3. Average Size of Holdings : 0.659
7. IRRIGATION(2013-14)
i. Net Area Irrigated by (in Hec.) : 94732.60 ii. a. Canals : 230.00
b .Private Canals : - - -
c. Tanks : 49174.00
d. Tube Wells : 10690.00
e. Ordinery Wells : 34642.00
iii. Gross Area Irrigated in Hec : 112486.38 iv. a) Name of the Rivers : Palar, Cheyyar, Vegavathi v. b) Name of important : Madurantagam,Thenneri,Dhamal,
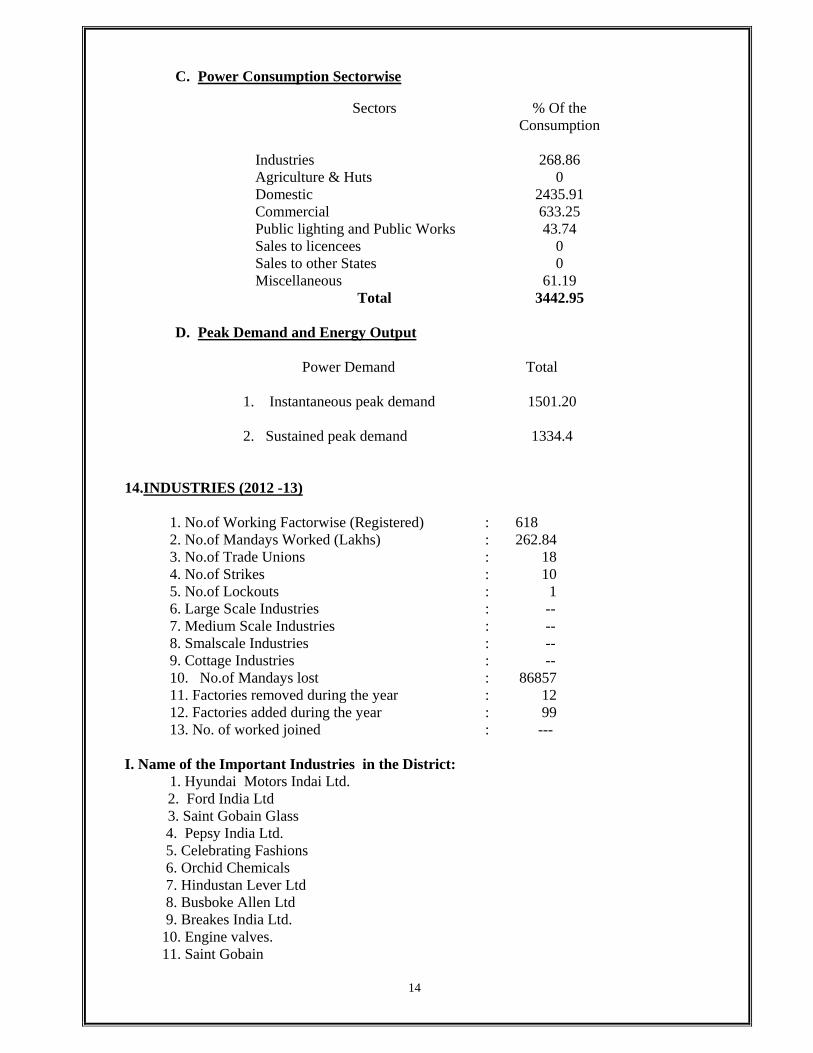
1. No.of Working Factorwise (Registered) : 618 2. No.of Mandays Worked (Lakhs) : 262.84 3. No.of Trade Unions : 18 4. No.of Strikes : 10 5. No.of Lockouts : 1 6. Large Scale Industries : -- 7. Medium Scale Industries : -- 8. Smalscale Industries : -- 9. Cottage Industries : -- 10. No.of Mandays lost : 86857 11. Factories removed during the year : 12 12. Factories added during the year : 99 13. No. of worked joined : ---
I. Name of the Important Industries in the District: 1. Hyundai Motors Indai Ltd. 2. Ford India Ltd 3. Saint Gobain Glass 4. Pepsy India Ltd. 5. Celebrating Fashions 6. Orchid Chemicals 7. Hindustan Lever Ltd 8. Busboke Allen Ltd 9. Breakes India Ltd. 10. Engine valves. 11. Saint Gobain
15
II. Name of the Industrial Park: 1. SIPCOT 2. Mahendra 3. Origai – Zari 4. Alathur – Pharmacy 5. Perungudi – Electronics, Software 6. Thiruvanmiyur – Electronics, Software 7. Madras Export Processing Zone 8. Thirumudivakkam – Leather products, finished leather 15. HANDLOOMS : (2012 -13) No.of Families Engaged : 6966 No.of Focal centres : 11 No.of Handloom co-operative socities : 74 ProductionValue in mtr(Lakhs) (in Lakhs) Cotton 4.73 629.05 Silk 2.49 4056.63 16. KHADI AND VILLAGE INDUSTRIES KHADISALES (Rs.in Lakhs)
17. HANDICRAFTS: a. No.of articles available : 330 b. No.of Families engaged : 631 18. MEDICAL AND HELTH (Govt. Hospitals & Govt. Arignar Anna Memorial Cancer Hospital) (2012 -13) Modern Medicine a. No.of Hospitals : 12 b. Dispensaries : 1 c. Primary Health Centres : 57 d. Health Sub Centres : 364 e. Other Medical Institution : 1 f. Beds in Hospitals and Dispensaries : 915 g. Total Number of Doctors : 114 h. Total Number of Nurses : 148
19. EDUCATION 1. Universities : 7 (DEEMED) 2. Arts and Science Colleges(VLR Regional) : 11 3. Colleges for Professional Education : -
a. Medicine i. Allopathy : 4 (Govt. 1 Pvt.3) ii. Ayurvedic : 1 (Pvt) iii. Homoeopathy : 1 (Pvt)
b. Engineering and Technology : 85
c. Law : 1
16
4. Colleges for Special Education : 1 5. Schools for General Education :
i. Nursery : 1372 ii. Primary : 1327 iii. Middle : 385 iv. High School : 170 v. Higher Secondary : 156 vi. Matriculation Schools : 277
6. Schools for Professional Education : 36 7. Schools for Special Education : 3 8. District Institution of Education and Training : 1
1. National Highways : 150.800 2. State Highways : 509.290 3. Major District Roads : 376.980 4. Other District Roads : 1217.330 5.Sugarcane mils Roads : 51.600
A. Registered Motor Vehicles Meenampakkam 1. Commercial : 19179 2. Non-Commercial : 161334
B. Railway Lines and Stations 1. Route Length (Km.) : i. Broad Gauge : 139 ii. Meter Gauge : -- 2. Track Length (Km.) i. Broad Gauge : 229 ii. Meter Gauge : -- 3. Number of Railway Stations : 36
C. Number of Air Ports : 2 D. Registered Motor Vehicles
1. Commercial : 49044 2. Non-Commercial : 21.COMMUNICATION A. Post & Telecgraph i.Post Offices doing postal business Alone : 368 ii.Post Offices doing Post & Telegraph Business : --- B. Telephones (2012 - 13) i. No.of Telephones in use : 816173 ii. No.of Telephones Exchanges : 329 iv. No.of Public calls with STD /ISD : 3956
17
22. CIVIL SUPPLIES : i. No. of Ration shops : 1654 ii. No.of Ration Cards (urban & rural)(2012-13) : 915525 23. CO-OPERATION
Primary Agri-co op Bank : 162 Co-op Urban Bank : 5 Primary Agri & Rural Development Bank : 5 Spl.Type of co op society : 26 Student co op society : 5 Employees Co-op Society : 54 Primary Co-operative society : 7 Co-operative Marketing Societies : 2 Kancheepuram central co-op Bank : 1
24. REGISTRATIONS a. No.of Registration Offices : 13 b. No of Registrations : 82635 c. Aggregte Value of property Transferred (Rs.in Crores) : 269.52
25.HOUSING i. No.of tenements constructed by Tamil Nadu Housing Board : 102 ii. Deputy Registrar Housing : -- iii. THADCO : -- iv. Group houses to Adi-Dravidas for IAY : 2912 v. No.of tenements constructed by
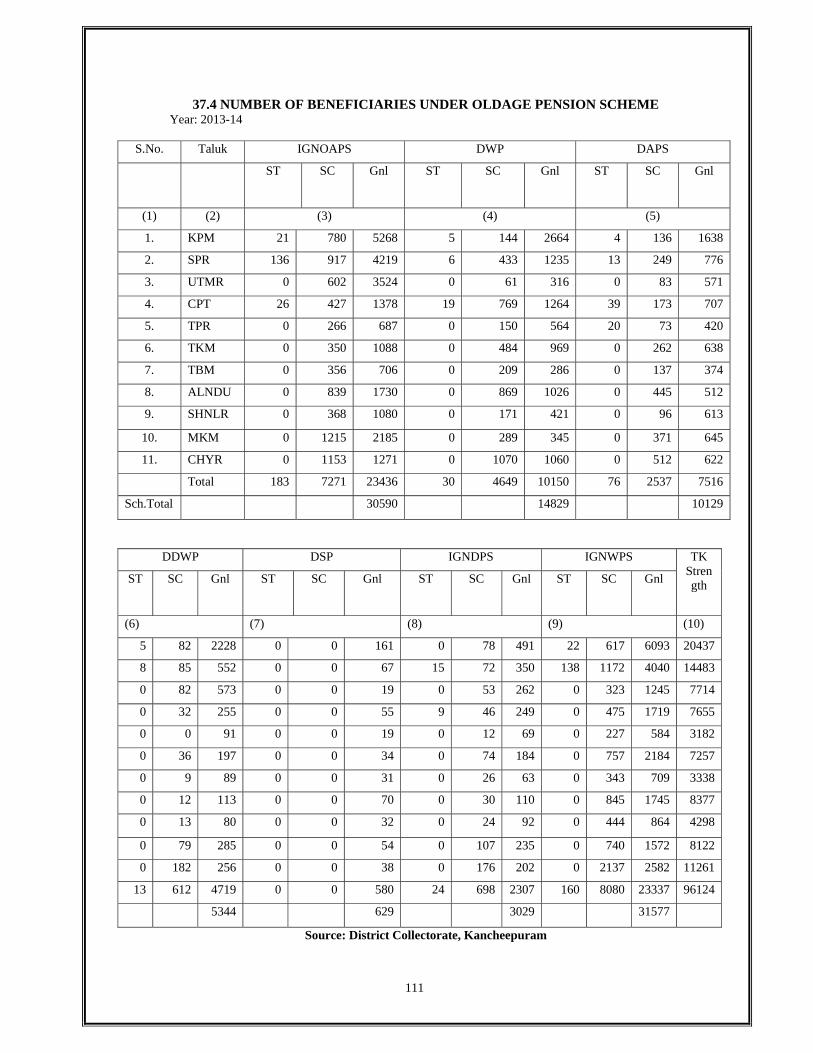
Tamil Nadu Slum Clearance Board : 2048 26.SOCIAL WELFARE (in Nos.)
1 JA- Indira Gandhi National Old Age Pension 05-social security Pension
: 30590
2 JB - Pension for the Differently abled 05-Social Security Pension
: 10129
3 JD - Pension to Deserted Wives 05-Social Security Pension
: 5344
4 JE - Pension Widows Pensions 05-Social Security Pension
: 14829
5 JF - Pension for Old poor Spinster 05-Social Security Pension
: 626
6 JK- Indira Gandhi National Disabled PensionScheme 05-social security Pension
: 3029
7 JL- Indira Gandhi National Widow PensionScheme 05-social security Pension
: 31577
Total beneficiaries
: 96124
18
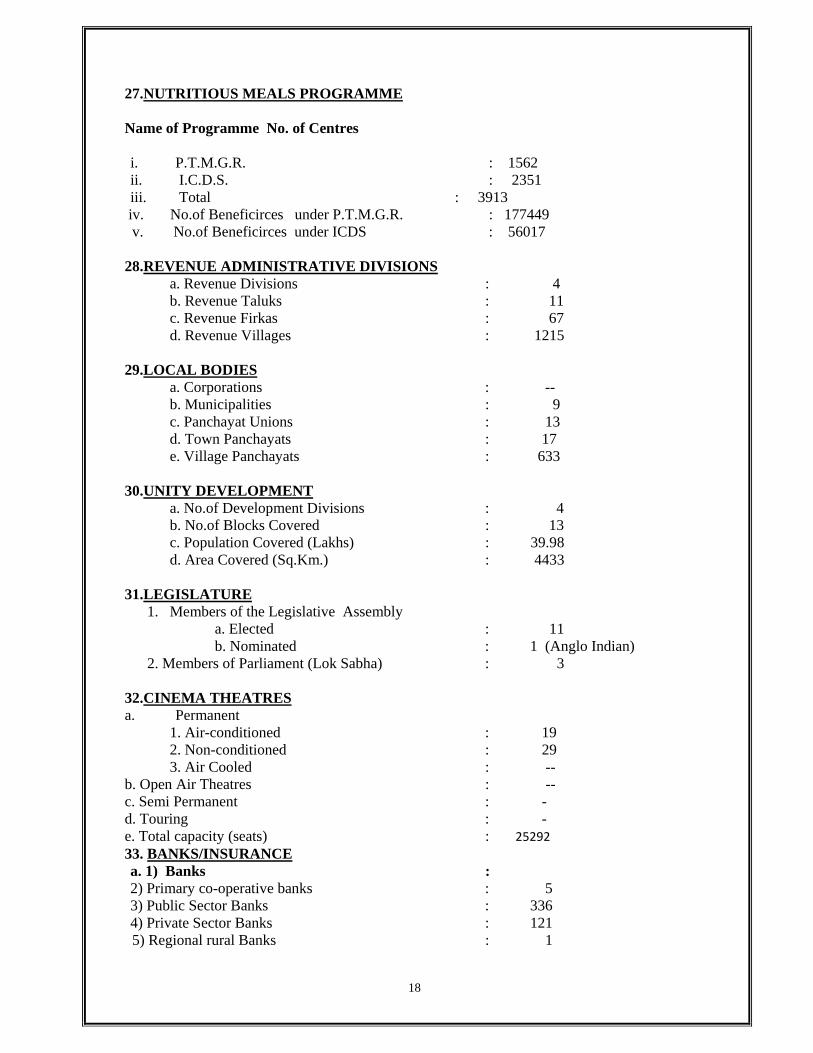
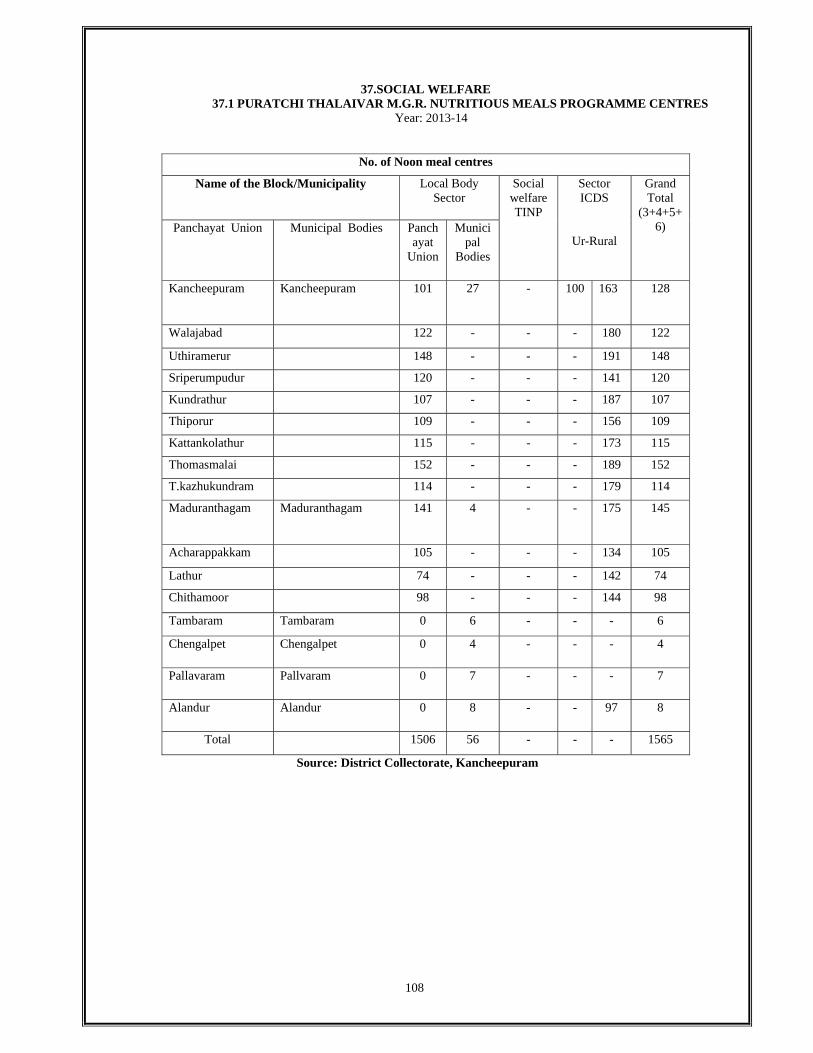
27.NUTRITIOUS MEALS PROGRAMME Name of Programme No. of Centres i. P.T.M.G.R. : 1562 ii. I.C.D.S. : 2351 iii. Total : 3913
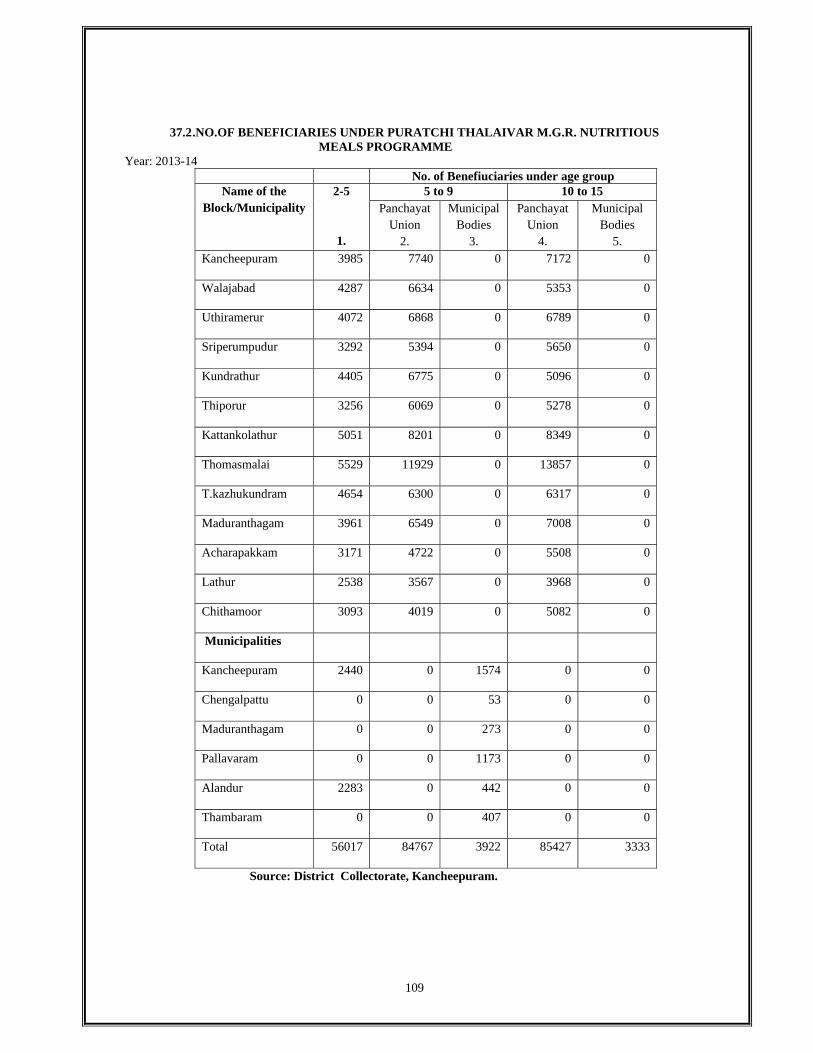
iv. No.of Beneficirces under P.T.M.G.R. : 177449 v. No.of Beneficirces under ICDS : 56017 28.REVENUE ADMINISTRATIVE DIVISIONS a. Revenue Divisions : 4 b. Revenue Taluks : 11 c. Revenue Firkas : 67 d. Revenue Villages : 1215 29.LOCAL BODIES a. Corporations : -- b. Municipalities : 9 c. Panchayat Unions : 13 d. Town Panchayats : 17 e. Village Panchayats : 633 30.UNITY DEVELOPMENT a. No.of Development Divisions : 4 b. No.of Blocks Covered : 13 c. Population Covered (Lakhs) : 39.98 d. Area Covered (Sq.Km.) : 4433 31.LEGISLATURE
1. Members of the Legislative Assembly a. Elected : 11 b. Nominated : 1 (Anglo Indian) 2. Members of Parliament (Lok Sabha) : 3 32.CINEMA THEATRES a. Permanent 1. Air-conditioned : 19 2. Non-conditioned : 29 3. Air Cooled : -- b. Open Air Theatres : -- c. Semi Permanent : - d. Touring : - e. Total capacity (seats) : 25292 33. BANKS/INSURANCE a. 1) Banks : 2) Primary co-operative banks : 5 3) Public Sector Banks : 336 4) Private Sector Banks : 121 5) Regional rural Banks : 1
19
b. Life Insurance (2012 - 13) 1. Offices : 1 2. Policies Issued : 20813 3. Sum Assured (Rs.in Crores) : 260.26 4. No.of Beneficiries : 6954 5. Amount of paid compensation (Rs in crores) : 11.18 34.Mining& Quarrying (in Nos)
Rough Stone Quarry : 61 Black Granite : 5 Selika Sand : 11
35.POLICE AND PRISIONS\
a. Police 1. Local : 1309 2. Armed Reserve : 307 3. Police Stations : 37 4 No out station : 2 5. No of women police stations : 5 b. Prisons 1. Central Prisons : -- 2. Other Prisons : 3 Sub Jail 36. DISTRICT LIBRARY
i. Central Library : 1 ii. Branch Library : 73 iii. Village Library : 55 iv. Part-time Library : 29
8.2 QUANTUM OF ESSENTIAL COMMODITIES DISTRTIBUTED AND THEIR RETAIL PRICES Year: 2013-2014
Sl.No Name of the Commodity Issue Price per (Kg.) Scale of Supply(in Kg.)
(1) (2) (3) (4) 1 Rice
Priceless
Rice Adult(1 Unit) 04 1 Adult and 1 Child (1 1/2Unit) 06 2.Adult(or) 1 Adult and 2 Children 10 2Adults and 1 Child(2 ½ Units) 12 3Adults and above 20 Wheat: Both rural and urban 05 Sugar 500gm/Member/Month subject to a maximum of 2 KG Palmoelin Oil: One litre per card/Month Sooji: ½ Kgm per card Maida: 1Kg per card Kerosene Oil: 10Lts.(Cardholders have no LPG) 3 litres (Card holders having one LPG)
2 Fine
3 Common
4 Wheat 7.50
5 Sugar 13.50
6 Palmoelin Oil 25.00
7 Sooji ---
8 Maida/atta ---
9 Kerosene 13.80
10 Others/salt --
Source: District Supplies Office, Kancheepuram.
40
8.2.QUANTUM OF ESSENTAIL COMMODITIES DISTRIBUTED AND THEIR RETAIL PRICES Sl.No Name of the Commodity Issue Price Scale of Supply (in Kg.)
1 RICE PRICELESS
1 Unit 12 kg. 1.5 Unit 14 kg. 2 Unit 16 kg. 2.5 Unit 18 kg. 3 Unit 20 kg.
2 WHEAT 7.50 1 Unit 5 kg. Maximum restriced to 10 kg.
3 SUGAR 13.50 1 Unit 500gms Maximum restricted to 2kgs.
9.5 NO.OF PUBLIC CALL OFFICES ATTACHED TO EACH DGM
Year: 2012-2013 Sl.No.
Name of the DGM Centre No.of Public Call Offices With STD/ISD Without STD/ISD
(2) (3) (4) 1. KANCHIPURAM 402 -
2. CHENGALPUT 723 -
3. CHROMPET 1477 - 4. THOMASMOUNT 1354 -
TOTAL 3956 -
Source:G.M.BSNL Eldomns Road Chennai
9.6 NO.OF PERSONS WAITING FOR PHONE CONNECTION
Year: 2012-2013 Sl.No. No. of the DGM Centres No.of persons waiting for phone connections
(1) (2) (3)
Nil Nil
Source: G.M.BSNL Eldomns Road, Chennai-6.
44
10. ELECTRICITY 10.1 No.of Power Stations
Year: 2013-14 Sl.No. Name of the
Power Stations Year of
Operation Installed Capacity (M.W.)
Generation (M.U.)
Station Consumption
(M.U.)
Nett Unit sent out (M.U.)
(1) (2) (3) (4) (5) (6) (7) 1. Hydro
- -NIL- - - -
2. Thermal
- -NIL- - - -
3. Gas Turbine
- -NIL- - - -
4. Wind Mills
2005 0.225 0.048549 0.004836
0.043716
5. Atomic -
-NIL- -
-
-
Source: 1. S.E, Kancheepuram Electricity distribution circle, O.M pettai, Kpm.
2. S.E, Chengalpattu, Electricity distribution circle, Chengalpattu 3. S.E, Chennai Elec. Distribution circle south, K.K. Nagar chennai- 78. 4. Madras Atomic Power Station, Kalpakkam-603 102
10.2 QUANTUM OF POWER PURCHASED Year: 2013-14
Power purchased sectors name Power purchased in M.U.
(1) (2)
M/s. Nandha Energy Ltd (Biomass) -
M/s S.V.Sugar Mill Ltd. 46.63
M/s. Noble Tech Industries (CPP) 2.97
Wind Eergy -
M/s. Chennai Pen Products 0.55
M/s.Larsen & Toubro Ltd. 1.41
M/s.Larsen & Toubro Ltd. 0.32
M/s.Larsen & Toubro Ltd. 0.06
M/s.Uniply Industries Ltd. 1.61
M/s Sastha paper Ltd. 4.52
Annai Flour Mills Pvt.Ltd., 0.72
M/s .Sakthi Steel Industries Ltd 12.31
M/s . Sakthi Steel Industries Ltd. 33.26
M/s .Hatsan agro products Ltd 1.60
M/s. Rane Madras Ltd. 0.97
M/s.Mohan Breweries Distileries 4.578
S.E, Kancheepuram Electricity distribution circle, O.M pettai, Kpm, Chpt
45
10.3 Power Consumption Sectorwise
Year: 2013-14 Sl.No. Sectors
% Of the
Consumption Kancheepuram Div.
CPT Div.
KK Nagar Div
(1) (2)
(4) (5) (6) (7)
1.
2.
3.
4.
5.
6.
7.
8.
Industries
Agriculture & Huts
Domestic
Commercial
Public lighting and Public Works
Sales to licencees
Sales to other States
Miscellaneous
268.86
0
2435.91
633.25
43.74
0
0
61.19
5.12
47.38
33.10
7.44
3.13
0.00
0.00
3.83
2911.864
239.88
509.254
259.827
41.799
-
-
623.139
7.81
0
70.75
18.39
1.27
0
0
1.78
Total 3442.95 100 4585.763 100
Source: 1. S.E, Kancheepuram Electricity distribution circle, O.M pettai, Kpm. 2. S.E, Chengalpattu, Electricity distribution circle, Chengalpattu
3. S.E, Chennai Elec. Distribution circle south, K.K. Nagar chennai- 78.
10.4 Peak Demand and Energy Output Year: 2013-14
Power Demand KPM CPT KK Nagar Total (1) (2) (3) (4) (5)
Ph.D 479 Faculty of Sanskrit & Indian Culture, Faculty of Management, Human Resources and Commerce,Faculty of Engineering & Technology, Faculty of Science, Faculty of Arts & Humanities, Faculty of Health Sciene, Faculty of Education
6 Sree Balaji Medical College & Hospital,
Chromepet
UG MBBS CRRI 305 46
315 45
620 91
College-67 Hospital-155
MBBS
PG 114 111 225 1.MD General Medicine 2.MD Paediatrics 3.MD Pulmonary Medicine (TB & Chest) 4. MD Dermatology (Skin & STD) 5. MD Anaesthesia 6. MD Pshychiatry 7. MD Radiology 8. MD Anatomy 9. MD Physiology 10. MD Biochemistry 11. MD Microbiology 12. MD Pathology 13. MD Pharmacology 14. MD Community Medicine 15. MS General Surgery 16. MS OB & G 17. MS OB & G 18. MS Orthopaedics 19. MS Ophthalmology 20. MS ENT
PG Super Specialty
2 - 2 D.M. Neurology
7 Meenakshni Medical College Hospital & Research Institute,
Enathur, Kancheepuram
UG 72 77 149 364 MBBS
8 Meenakshni Medical College Hospital & Research Institute,
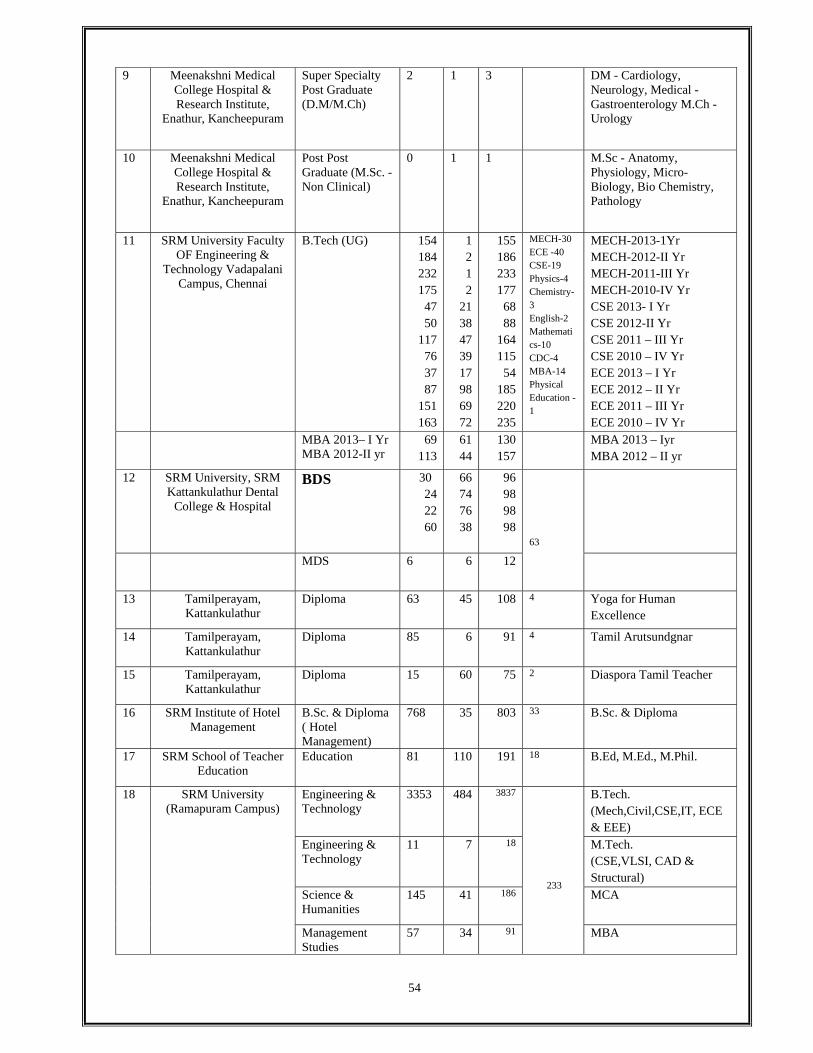
MECH-2013-1Yr MECH-2012-II Yr MECH-2011-III Yr MECH-2010-IV Yr CSE 2013- I Yr CSE 2012-II Yr CSE 2011 – III Yr CSE 2010 – IV Yr ECE 2013 – I Yr ECE 2012 – II Yr ECE 2011 – III Yr ECE 2010 – IV Yr
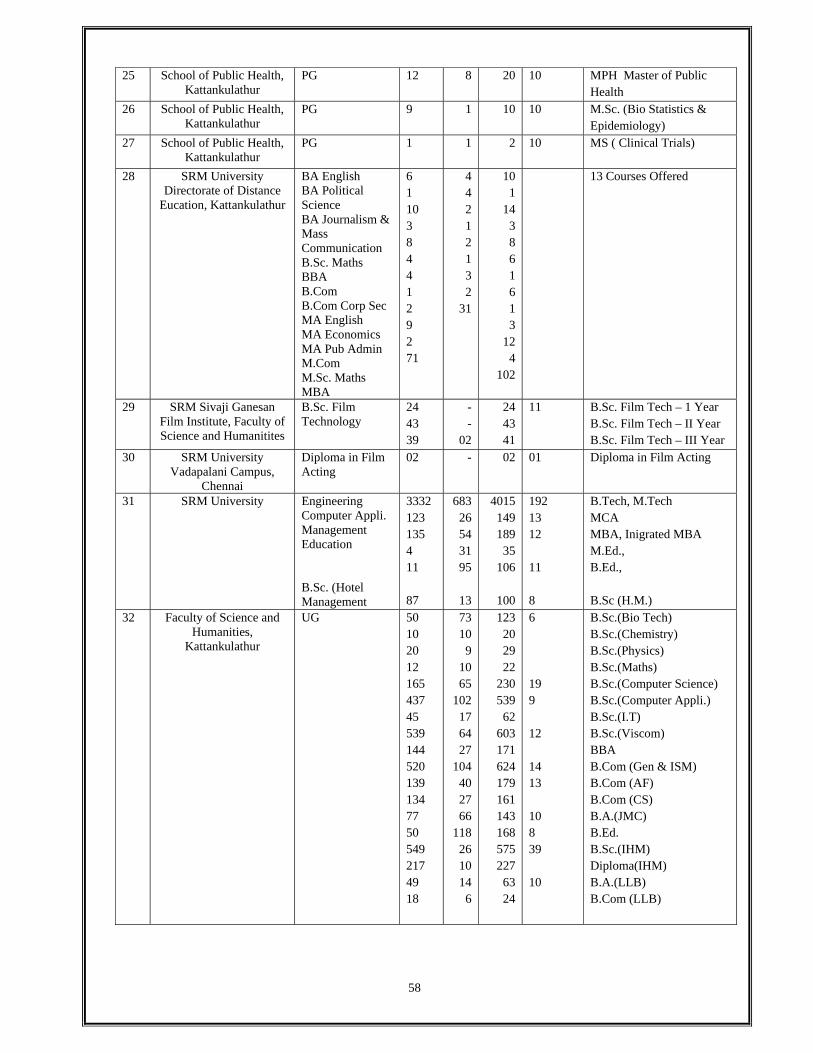
BA English BA Political Science BA Journalism & Mass Communication B.Sc. Maths BBA B.Com B.Com Corp Sec MA English MA Economics MA Pub Admin M.Com M.Sc. Maths MBA
6 1 10 3 8 4 4 1 2 9 2 71
4 4 2 1 2 1 3 2
31
10 1
14 3 8 6 1 6 1 3
12 4
102
13 Courses Offered
29 SRM Sivaji Ganesan Film Institute, Faculty of Science and Humanitites
B.Sc. Film Technology
24 43 39
- -
02
24 43 41
11 B.Sc. Film Tech – 1 Year B.Sc. Film Tech – II Year B.Sc. Film Tech – III Year
14.2 ARTICLES AVAILABLE IN HANDICRAFTS Year: 2013-2014
Sl.No. (1)
Name of the Handicrafts (2)
No. of Units
1. Sculpture 18
2. Embroidery 270
3. Muod Potrait of Clay - 4.
Silk Sartees. 13
5. Horticultre
-
6. Articles made of fibre -
7. Handicrafts articles 8
8. Toys 13
9. Wire products -
10. Ornaments -
11. Sculpture art of wood Nil
TOTAL 330 Source: District Industrial Centre, KPM.
14.3 VALUE OF ARTICLES PRODUCED Year: 2013-2014
Sl.No.
(1)
Name of the Handicraft
(2)
Value of the Products RS.in Lakhs
(3)
1. Sculpture 12
2. Embroidery 150
3. Mud potrat of clay 0
4. Silk Sarees 15
5. Horticultre 0
6. Articles made of fibre 0
7. Handicrafts articles 10
8. Toys 20
9. Wire products 0
10. Ornaments 8
11. Sculpture art of wood 0
Total 215
Source: District Industries Centre, KpM.
69
14.4 NO.OF FAMILIES ENGAGED IN HANDICRAFTS
Year: 2013-2014
Sl.No.
(1)
Name of the Handicrafts (2)
Man power Employed (3)
1. Sculpture 35
2. Embroidery 537
3. Mudpotrat of clay 0
4. Silk sarees 15
5. Horticulture 0
6. Articles made of fibre 0
7. Handicrafts articles 12
8. Toys 25
9. Wire Products 0
10. Ornaments 7
11. Sculpture 0
Total 631
Source: District Industries Centre, Kpm
15. HEALTH & FAMILY WELFARE 15.1 HOSPITALS, DISPENSARIES BED STRENGTH, DOCTORS
AND NURSES Year: 2012-2013
Sl No
Classification
(1)
Modern Medicine
(2)
Indian Medicine Grand Total
(8)
Ayurvedic
(3)
Siddha
(4)
Unani (5)
Ayurvedic Siddha Unani
combined (6)
Homeo pathy
(7) 1
2
3
4
5
6
7
8
9
Hospitals
Dispensaries
Primary Health Centres Health Sub Centres Other Medicals Institutions Bed Strength
Numbr of Doctors Number of Nurses ANMS
10 1
57
364 1
915
114
148
1
160
22
28
1
150
25
24
12
1
57
364
1
1225
161
200
Source: JD, General Hospital, Kancheepuram,Dt. Sidha Medical Officer, General Hospital Kancheepuram , DD, Health , Kpm, Spt., Director ,Arignar Anna Memorial Cancer Hospital, Kpm,
70
15.2 NO.OF ALLIED PATHOLOGICAL UNITS AVAILABLE
Year :2013-14
Source: JD, General Hospital, Kancheepuram,Dt. Sidha Medical Officer, General Hospital Kancheepuram , DD, Health , Kpm, Spt., Director ,Arignar Anna Memorial Cancer Hospital, Kpm,
Cpt.Govt.Hospital(Current Year Included 15.3 PRIVATE HOSPITAL PATIENTS TREATED
Year :2013-14
Sl.No. (1)
Name of the Disease (2)
No.of patients treated (3)
Cancer (4)
1 Out patients 3,98,771 152
2 Inpatients 37743 22
Source: JD, General Hospital, Kancheepuram,Dt. Sidha Medical Officer, General Hospital Kancheepuram ,
DD, Health , Kpm, Spt., Director ,Arignar Anna Memorial Cancer Hospital, Kpm, Cpt.Govt.Hospital,National institute of sidha
15.3 GOVT HOSPITAL CANCERPATIENTS TREATED Year :2013-14
Sl.No.
(1) Name of the Disease
(2) Cancer Old
(3) Cancer New
(4) 1 Out patients 22958 1662 + 5060
2 Inpatients 3498 1665
Source:Meenakshi Medical College & Research Institute, Kancheepuram. Dharma Ayurvedha Medical College & Hospital Sriperumbudhur.
Velumailu Sidha Medical College Sriperumbudhur.
Sl.No. (1)
Name of the Block/Municipality (2)
No.of Pathalogical Units (3)
1 1. Cancer Hospital, Karapettai 1 2 2. Cancer Institute, Kancheepuram 1 3 1.Clinical Pathology,
15.4 DISTRIBUTION OF MEDICAL PERSONNEL Year :2013-14
No. of Doctors
(1) No. of Nurses
(2) No.of Technical persons
(3) Others {specify}
(4)
JD, General Hospital,
Kancheepuram,Dt
17 41 Para-Medical -23
1. Ministerial - 12 2. Other than Ministerial -19 3. Basic Servants - 38
DD, Health , Kpm, (Rural) 364 376 62 70
Source: JD, General Hospital, Kancheepuram,Dt. Sidha Medical Officer, General Hospital Kancheepuram , DD, Health , Kpm, Spt., Director ,Arignar Anna Memorial Cancer Hospital, Kpm,
Cpt.Govt.Hospital(Current Year Included)
15.3 PROGRESS OF FAMILY WELFARE PROGRAMMES Year : 2012-2013
37 CONSTRUCTION OF PLATFORM FOR WTER SUPPLY SOURCE (NRDWP)
407 44.49 406 44.38
38 VILLAGE PANCHAYAT SERVICE CENTRE
231 3333.33 0 0.00
39 BLOCK PANCHAYAT SERVICE CENTRE
4 120.56 0 0.00
40 CONSTRUCTION OF GREEN SANITARY COMPLEX WITH BIO DIGESTER
2 6.40 0 0.00
Source: PO, DRDA, Kancheepuram.
20. LABOUR AND EMPLOYMENT
20.1 NO.OF PERSONS REGISTERED DURING THE YEAR AND TOTAL NO.OF PERSONS WAITING UPTO
THE END OF THE YEAR AS PER LIVE REGISTER Year: 2013-2014
Sl.No (1)
Type of Employment Exchange
(2)
No.of Persons registered during the year
(3)
Total No.of persons waiting up to the end of the year
(4)
1 Employment 71558 324526
Source: District Employment Office
20.2 No. of Placements during the and upto the end of the year: Year: 2012-2013
Sl.No. Type of Employment
Exchange Placements during the
year Placements upto the year
1 Employment 1792 9709
Source: District Employment Office
84
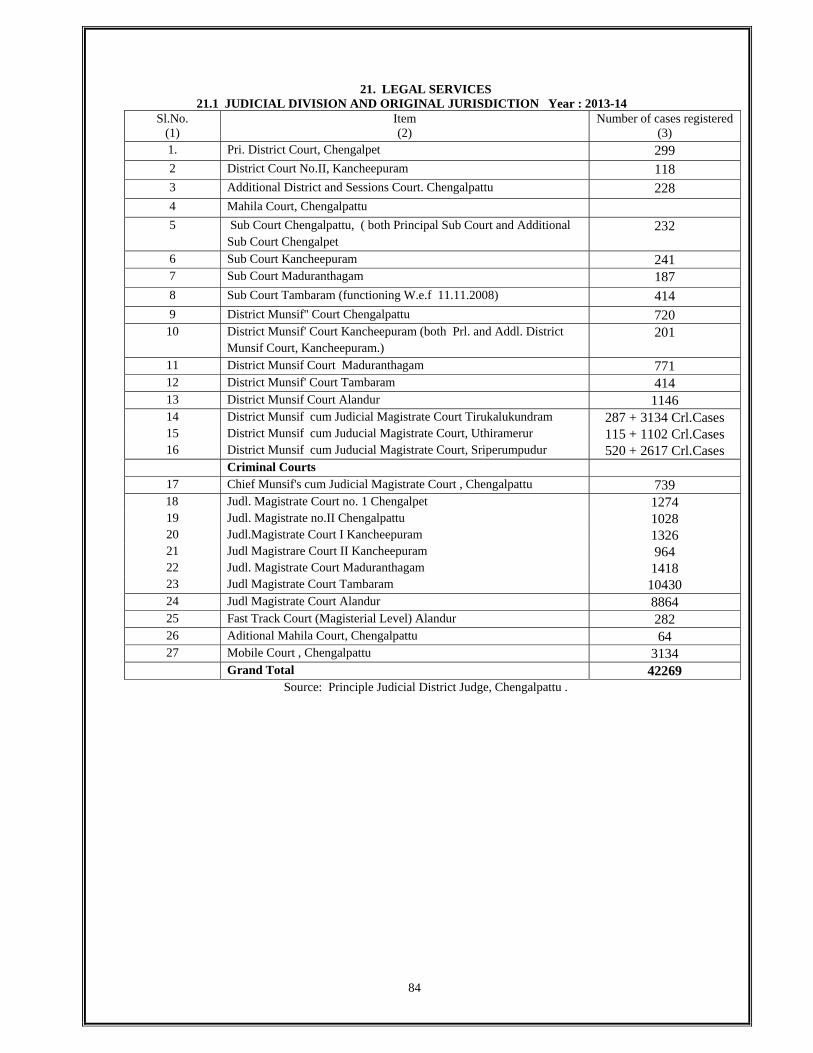
21. LEGAL SERVICES
21.1 JUDICIAL DIVISION AND ORIGINAL JURISDICTION Year : 2013-14 Sl.No.
(1) Item (2)
Number of cases registered (3)
1. Pri. District Court, Chengalpet 299 2 District Court No.II, Kancheepuram 118 3 Additional District and Sessions Court. Chengalpattu 228 4 Mahila Court, Chengalpattu 5 Sub Court Chengalpattu, ( both Principal Sub Court and Additional
Sub Court Chengalpet 232
6 Sub Court Kancheepuram 241 7 Sub Court Maduranthagam 187 8 Sub Court Tambaram (functioning W.e.f 11.11.2008) 414 9 District Munsif'' Court Chengalpattu 720
10 District Munsif' Court Kancheepuram (both Prl. and Addl. District Munsif Court, Kancheepuram.)
201
11 District Munsif Court Maduranthagam 771 12 District Munsif' Court Tambaram 414 13 District Munsif Court Alandur 1146 14 District Munsif cum Judicial Magistrate Court Tirukalukundram 287 + 3134 Crl.Cases 15 District Munsif cum Juducial Magistrate Court, Uthiramerur 115 + 1102 Crl.Cases 16 District Munsif cum Juducial Magistrate Court, Sriperumpudur 520 + 2617 Crl.Cases Criminal Courts
Source: Director of Labour Bureau, Shimla. * Source: Department of Economics and Statistics, Chennai-6 (Base:1982=100)
31.3 CONSUMER PRICE INDEX NUMBERS FOR SELECTED ESSENTIAL ITEMS IN URBAN TAMIL NAD Base : 1970-71 = 100 Year: 2013--2014
Period Food Fuel Power and
Lighting Clothing Misc Composite Index
(1) (2) (3) (4) (5) (6)
April '13 3192.00 2482.00 1890.00 3282.00 3082.37
May 3240.00 2497.00 1901.00 3303.00 3124.02
June 3285.00 2508.00 1911.00 3325.00 3163.03
July 3322.00 2528.00 1926.00 3360.00 3197.57
August 3354.00 2549.00 1941.00 3409.00 3229.30
September 3389.00 2571.00 1959.00 3434.00 3261.72
October 3428.00 2586.00 1977.00 3471.00 3297.84
November 3469.00 2603.00 1989.00 3503.00 3334.97
December 3477.00 2613.00 1993.00 3521.00 3343.70
January '14 3473.00 2634.00 2006.00 3579.00 3347.28
February 3473.00 2639.00 2024.00 3625.00 3352.30
March 3482.00 2651.00 2032.00 3659.00 3363.46
Average 3382.00 2571.75 1962.42 3455.92 3258.13
Source: Department of Economics and Statistics, Chennai-6.
102
31.4 CONSUMER PRICE INDEX NUMBERS FOR SELECTED ESSENTIAL ITEMS IN RURUAL TAMIL NADU
Base : 1970-71 = 100 Year: 2013-2014
Period Food Fuel Power and
Lighting
Clothing and Footwear
Miscellaneous items
Composite Index
(1) (2) (3) (4) (5) (6) April '13 2976 2681.00 2535.00 2754.00 2893.20 May 3023.00 2697.00 2543.00 2770.00 2930.57 June 3064.00 2703.00 2556.00 2793.00 2964.51 July 3090.00 2722.00 2566.00 2818.00 2988.99 August 3097.00 2738.00 2583.00 2849.00 3001.33 September 3111.00 2757.00 2595.00 2879.00 3018.35 October 3134.00 2773.00 2610.00 2915.00 3042.69 November 3160.00 2788.00 2619.00 2930.00 3065.10 December 3159.00 2803.00 2622.00 2936.00 3066.64 January '14 3139.00 2819.00 2631.00 2969.00 3059.90 February 3135.00 2831.00 2640.00 2991.00 3062.23 March 3137.00 2841.00 2644.00 3010.00 3067.85
Average 3102.08 2762.75 2595.33 2884.50 3013.45
Source: Department of Economics and Statistics, Chennai-6.
31.5 LINKED ALL INDIA CONSUMER PRICE INDEX ON BASE 2001==100
Period Linked Index NO.
(1) (2)
April '13 226 May 228 June 231 July 235 August 237 September 238 October 241 November 243 December 239 January '14 237 February 238 March 239 Average 236
Source: Director of Labour Bureau, Shimla.
103
CONSUMER PRICE INDEX NUMBERS FOR RURAL, URBAN AND
COMBINED - 2013-14. CENTRE: TAMIL NADU BASE YEAR: 2010=100 Period Rural Urban Combined
1 2 3 4 April '13 132.2 132.4 132.3 May 134.0 134.0 134.0 June 136.0 136.0 136.0 July 137.0 136.0 137.0 August 138.0 137.0 137.0 September 139.0 137.0 138.0 October 141.0 138.0 139.0 November 141.0 139.0 140.0 December 141.0 139.0 139.0 January '14 139.0 138.0 139.0 February 140.0 139.0 139.0 March 140.0 139.0 140.0 Average 138.2 137.0 137.5
32 QUALITY CONTROL 32.1 LIST OF INDUSTRIAL/ESTABLISHMENT UNITS HAVING QUALITY CONTROL FACILITIES AND
THE PRODUCTS SUBJECTED TO QUALITY CONTROL. Year : 2013-2014
Sl.No.
(1)
List of Industries
(2)
Establishment Units having, Quality Control Facilities
(3)
Products subjected to Quality Control
(4) NOT AVILABLE
Source: Concerned Office.
33. REGISTRATION
33.1 NO.OF REGISTRATION OFFICES IN THE DISTRICT
Year: 2013-14
Sl.No. (1)
Name of the Registration Office (2)
No.of Registration Office (3)
1 District Registar, Kancheepuram District
13
Total 13
Source: District Registration Office.Kpm,Cpt,&Sdt 33.2 REGISTRATION AND AGGREGATE VALUE OF PROPERTIES TRANSFERRED
DURING THE YEAR Year: 2013-14
Name of the Office No. of Registration
(Moveable and Immovable) Aggregate Value of Properties Transferred
(Moveable and Immoveable ) Rs. crores.
District Register Office- Kancheepuram District
82635 Rs.269.52/-
Total 82635 Rs.269.52/-
Source: District Registration Office, Kpm,Cpt,&Sdt.
104
34. REPAIR AND SERVICE
34.1 AUTHORISED AUTOMOBILES REPAIR AND SERVICE STATIONS
Year: 2013-14
Name of the Block / Municipalities (1)
Authorised Automobiles Repair and Service (in No's.)
(2) St.Thomas Mount 3 11
Sriperumpudur 5
Kuntrathur 3
Walajabad 3
Kancheepuram 6
Kattankolattur 13
Maduranthagam 17
Acharapakkam 3
Thirukalukundram 3
Chithamur 1
Lattur 14
Thiruporur 6
Uthiramerur 15
Pallavaram 4
Alandur 4
Chengalpattu 4
Tambaram 6
Source: Concerned Office.
105
34.2 AUTHORISED ELECTRICAL AND ELECTRONIC GOODS REPAIR AND SERVICE UNITS
Year: 2013-14
Name of the Block/Municipalities
(1)
Electrical and Electronic goods Repair and Service
Units (in No's)
(2)
St Thomas Mount 12
Sri Perumpudur 7
Kuntrathur 2
Walajabad 8
Kancheepuram 53
Kattankukathur 14
Maduranthagam 3
Acharapakkam 2
Thirukazhikundram 10
Chitamur 2
Lathur 5
Thiruporur 2
Uthiramerur 7
Pallavaram 10
Alandur 3
Kancheepuram 14
Chengalpattu 13
Maduranthagam 7
Tambaram 15
Source: Concerned Office. 35. RESTAURANTS AND HOTELS
35.1 RESTAURANTS, CAFES AND OTHER EATING AND DRINKING PLACES Year: 2013-14
Sl.No. (1)
Items (2)
Place (3)
1. Restaurants
28
2. Cafes 19
3. Other Eating and Drinking Centres 150
Source: Municipalities, & Town Panchayats
35.2 DETAILS OF HOTELS Year: 2013-14 Sl.No.
(1)
Place
(2)
No. of the Hotels with Lodging Facilities
(3)
No. of the Hotels without Lodging Facilities
(4) 1 Kancheepuram 24 121
Source: Municipalities & Town panchayats
106
36. RECREATION AND CULTURAL SERVICES 36.1 LIST OF CINEMA THEATRES AND THEIR CAPACITIES
Year: 2013-14
Sl.No. (1)
Name of the District (2)
No of Cinema Theatres (3)
Capacity(Seats) (4)
1. Chengalpattu 1. Anngamuthu Theatre 2. S.R.K. 1/AC 3.S.R.K. 2/AC 4.Latha Cinema AC 5. Venkateswara Theatre AC
808 434 196 411 484
2. Kancheepuram 1.Babu AC 2.Babu Mini 3.Babu Paradise AC 4.Sri Aruna AC 5.Siva Aruna AC 6.Bala Aruna AC 7.Sri Narayanamoorthi AC 8.Sri Narayanamoorthi AC 9.Balaji AC 10.Sri Balasubramaniam AC 11.Sri Balasubramaniam Delux AC 12.Karthikeyan AC
38.2 NO. OF VEHICLES ENGAGED IN SANITARY SERVICES Year: 2013-14
Sl.No.
1.
Name of the /Municipality
2.
No. of vehicles engaged in Sanitary Services
3.
1 Pammal - 2 Ullagaram - 3 Kancheepuram - 4. Maduranthagam - 5. Tambaram - 6 Alandur - 7. Pallavaram - 8. Chengalpet - 9. Maraimalainagar - 10. Anagaputhur - 11. All Town Panchayats 93 12 All Panchyat union -
Source: Municipalities & Town Panchayats
115
39 SCIENTIFIC AND RESEARCH SERVICE
39.1 INSTITUTIONS AND LABORATORIES ENGAGED IN RESEARCH WORK Year :2013-14
Name and address of Institutions and Laboratories
1.
Type of Reseach Field 2
Anna Memorial Cancer Hospital Kancheepuram
Cancer Research
Soil Research Centre, Kancheepuram
Soil Research
Source: Concerned Institutions
40. STORAGE FACILITIES YEAR=2013-14
40.1 LIST OF AGRICULTURAL AND NON-AGRICULTURAL STORAGE GODOWNS Name of the Taluk
1. Name of address of Non-
Agricultural Godowns 2.
Capcaity in Tones
Area of the Godown in sq.ft
1.Kancheepuram Sirukaveripakkam 1400 35,500 Sq. Meter 2. Vadapalayam Vadapalayam 9000 16,692 Sq. Meter 3. Tirukazukundram Tirukazukundram 1500 10,280 Sq. Meter 4. Sriperumbudur Sriperumbudur 3000 13,700 Sq. Meter 5.Madurantagam Silavatta 2950 4,779 Sq. Meter 6.V.V.Nallur Cheyyur 1500 10,280 Sq. Meter 7. MRM Thimmavaram MRM Thimmavaram 7000 30,900 Sq. Meter 8. Vallam Vallam 800 5,483 Sq. Meter
Source: District Warehousing office & TNCSC,Kpm
116
40.2 LIST OF COLD STORAGE AND GODOWNS Sl.No.
1. Name and address of the cold storage centres Storage capacity in ltrs
1. Dairy Development of Damal at Baluchettychatram CC 30000 2. Dairy Development of ELLAPAKAM BMC 3000 3. DiryDevelopment perumbakkam BMC 3000 4. Dairy D EVELOPMENT Utiramerur BMC 5000 5. Dairy Development Tirukalukundram BMC 3000 6 Perunagar BMC 5000
7 Sanoor CC 30000
Source: Deputy Registrar (Dairying),Kancheepuram.
TEXTILES 41.1 No. of Ginning, Spinning and Weaving mills
Year: 2013-2014 Sl.No.
Name of the District
No. of Ginning mills
No. of Spinning mills
No. of Weaving
mills
1 2 3 4 5
1. Kancheepuram NIL NIL NIL
Source : The Kancheepuram Kamatchi Amman Co-Operative Spinning Mills Ltd, Kancheepuram CLOSED FROM 16.07.2003
41.2 QUANTUM OF PRODUCTION DURING THE YEAR. Year: 2013-2014
* Revenuefigures are for both international and domestic
Source: AirPort, Meenambakkam.
121
43.9.PRIVATE TRANSPORT OPERATIONS Year: 2013-14
Sl.No. (1)
Name of the Transport Operations (2)
1 R. Ameer Basha v.m bus Kvbusservice
2 V.Anandammal Jain 3 Y. AnandaRamakrishnan 4 S. Arunachalam 5 P. Bakthavatchalam 6 R. Balamani 7 P. baliah 8 S. Devi 9 S. DelhiBai 10 Dhanapal Bus Service11 Dhanapal12 Durgarani. 13 J. Mamsala 14 D. Munusamy Mudaliar 15 Thamil Kumar 16 S. Thamodharan17 A. Durairajan18 V.S. Geethalakshmi 19 Gandiban bus Service 20 T. Govindarajan Mudaliyar 21 g. Anushya 22 S. Ganapathy23 V. Jagadeesan24 JanakiRaman 25 K. Jayapal 26 B. Kannaiyan 27 G. Kanjana 28 S. Krishnamoorthy 29 P. Kothandan 30 S. Leelavathy 31 A.M. Mahalakshmi 32. M. Mahendrakumar 33 Mohamad Sharif 34 Musarath Began 35 D. Muthulakshmi 36 Jayalakshmi Bus Service 37 A.M. Muthusamy Mudaliar 38 S. Nagammal 39 E. Narayanamoorthy 40 B.N. Nasar 41 R.A. NawabJohn
42 A.M. Pachaippan 43 J. Palanivelu 44. A. Parthasarathy 45. P.C. Panchabatchavan 46. R. Prabhakaran 47. P. Radhakrishnan 48. Rajarani Bus Service 49. K.S. Ramalingam 50 J. Ramesh 51. M. Ravikumar 52 M. Ravisekar, 53 V. Raangaarajan 54 T.S. Ravi 55 Sekar
122
56. U.G. Sampath 57. A.M. Sanjeevi, 58. A.M. Sanjeevi 59. K. Selvaraj 60. B. Sonana 61 Shanmugananda Bus Servuce 62 B. Srinivasan 63 R. Sundaravaradan, 64 S. Subramaniam 65 K. Subramanian 66 K. Sriramulu 67 A.M. Vijayammal 68 S. Vijayakumar 69 S. Vimala 70 R. vimala 71 P. Vasudevan 72 M. Selvam 73. Sivarasan Bus Service 74. S. Ramakrishnan 75. M. Ravichandran 76. C.P. Kasi 77. Parveen Bus Service. 78. R. Durga Rani
79 Vijayalakshmi 80. G. Krishnaveni
81. 82
V.M.Bus Service K.V.R.Bus Service
RTO,Meenambakkam
83 Gandiban Bus Service RTO,Chengalpattu
84. Kumaran Bus Service ,, 85. Murugan Bus Service ,, 86. Shanmugananda Bus Service ,, 87. Sri Vinayagar Bus Service ,,
88. Sri Kumaran Bus Service ,, 89. Thiru Kumaran Bus Service ,, 90. Mahalakshmi Bus Servicee ,, 91. Pazhani Murugan Bus Service ,,
92. V.M.S. Bus Service ,, 93. Mahaveer Bus Service ,,
94. V.A.T. Bus Service ,, Source Concerned Transport Corporation
123
44. TOURISM 44.1 PLACES OF TOURIST ATTRACTION
Year :2013-14 Sl.No.
(1) Tourist Place
(2)
1 Kancheepuram Kamatchi Temple 2 Thirukazhukundram 3 Mamallapuram 4 Vendanthangal 5 Muttukadu 6 Vandaloor Zoo 7 Crocodile Park 8 Kovalam Beach 9 V.G.P. Golden Beach 10 Kiskinda 11 Disney Land 12 M.G.M.
46.1 LIST OF VOLUNTARY SERVICES AVAILABLE IN THE DISTRICT FOR THE DEVELOPMENT OF RURAL AND URBAN POPULATION
Year :2013-14 Sl. No
(1) List of Voluntary Service
(2)
1 Association for community Development services , No.3/260, Sathan Kuppam, Kelambakkam 2 Agency for Rural Development Services, No. 3K/7, Anna Nagar, Kolapakkam, Vandalur(via),
15 Taribavan Community Development Society, No.1/451, Muthamizh Nagar, GST Road, Vandalone Chennai-8
16 Womens Educational and Economics Development Society, Zion Cottage, Illedu, Cheyyur Taluk, Chunanpet - 630401
Source: Project Officer, Women Devt., Collectorate , Kancheepurm
127
47. WATER WORKS AND SUPPLY 47.1NO. OF SCHEMES OPERATED IN THE DISTRICT
Year :2013-14 Sl.No.
(1) Name of the Schemes
(2) No.of the Programmes in the Schemes
(3) Taken up Completed
I NRDWP Schemes 1 New IPP Schemes 248 248 2 Quality Affected Habitations 7 7 Iii Special Programme 1 Water supply to Schools 0 0 2 Recharge Structures a AGWRS b NRDWP i Percolation pond 35 35 ii Check Dam 41 41 iii Oorani Improvements 0 0 3 Water supply to Anganvadies 273 273 4 Defunct Bore well 0 0 5 Jalmani 0 0 6 Dilapidated OHT 7 7 7 Roof top water harwesting 611 611
Source: R.W.S. DIVN, TWAD, Kpm.
47.2 NO.OF WORKERS ENGAGED IN THE WATER WORKS AND SUPPLY Year :2013-14
Sl.No. (1)
Name of the Office (2)
No.of Workers engaged in water works and supply (3)
1. Kancheepuram Municipality -
2. Chengalpet Municipality -
3. Maduranthagam Municipality 5
4. Pallavaram Municipality 20
5. Alandur Municipality -
6. Tambaram Municipality 18
7 Annakaputhur 9 8 Town Panchayat – Kancheepuram
District 42
9 All Panchayat Union -
10 MM. Nagar -
11 Pammal 12
Source: All P.Us , All Municipalities, All T.Ps Department of Economics and Statistics, Chennai - 6. 47.3 No. of House Connection, Fountains:
Year: 2013-14 Sl.No. Name of the Block / Municipality No of House water
Connections 1 All Municipality 27876 2 All Town Panchayat 39426 3 All Village Panchayat -
128
5th Economic Census – 2005 Kanchipuram District for Rurals