600 Park Street Hays, Kansas 67601-4099 Telephone: (785) 628-4197 FAX: (785) 628-4188 www.fhsu.edu/docking
Gary Brinker, PhD Michael S. Walker, MS Director Assistant Director Jian Sun, PhD Leslie Paige, MS, EdS Research Scientist Grants Facilitator Joyce Wolfe, MS Lynette Pfeifer Research Scientist Administrative Specialist Survey Center Manager
Mission:
To Facilitate Effective Public Policy Decision-Making.
The staff of the Docking Institute of Public Affairs and its University Center for Survey Research are dedicated to
serving the people of Kansas and surrounding states.
Kansas Speaks 2010
Prepared By:
Jian Sun, Ph.D. Gary Brinker, Ph.D. Research Scientist Director
Docking Institute of Public Affairs
Prepared For:
The Citizens of Kansas In pursuit of
Fort Hays State University’s Public Affairs Mission
List of Figures .......................................................................................................................................................................................................................... ii
Introduction and Methods ..................................................................................................................................................................................................... 6
Section 1: Overall Quality of life in Kansas ............................................................................................................................................................................. 7
Section 4: State Government................................................................................................................................................................................................ 18
Section 5: Energy Policy ........................................................................................................................................................................................................ 23
Section 6: Public Policy Issues............................................................................................................................................................................................... 32
Section 7: Healthcare and Education .................................................................................................................................................................................... 37
Appendix A: Demographic Characteristics of the Sample .................................................................................................................................................... 50
Appendix B: Mail Survey Instrument .................................................................................................................................................................................... 53
The Docking Institute of Public Affairs: Kansas Speaks 2010 Page ii
List of Figures
Figure 1: Rating of Kansas as an Overall Place to Live: 2009 and 2010 ............................................................................................................................................ 8
Figure 2: Rating of Kansas as an Overall Place to Live by Race: 2010 ............................................................................................................................................... 8
Figure 3: Rating of Kansas Economy: 2009 and 2010 ....................................................................................................................................................................... 9
Figure 4: Satisfaction Levels with Governors’ and State Party leaders’ Ideas to Improve the Health of the Kansas Economy: 2009 and 2010............................ 10
Figure 5: Satisfaction Levels with Democratic Party Leaders’ Ideas to Improve the Health of Kansas Economy by Party Affiliation: 2010 .................................. 11
Figure 6: Satisfaction Levels with Republican Party Leaders’ Ideas to Improve the Health of Kansas Economy by Party Affiliation: 2010 .................................. 12
Figure 7: Concerns with the Threat from the Economic Conditions in Kansas to Individuals’ or Families’ Welfare: 2009 and 2010 ............................................ 12
Figure 8: Opinions on Changes of Income Tax, Sales Tax, and Property Tax: 2010 ........................................................................................................................ 13
Figure 9: Opinions on Property Tax Change by Education Level: 2010 .......................................................................................................................................... 14
Figure 10: Preferred Tax Changes on Different Groups: 2009 and 2010 ........................................................................................................................................ 15
Figure 11: Preferred Tax Changes on Top Income Earners by Party Affiliation: 2010 .................................................................................................................... 16
Figure 12: Preferred Tax Changes on Large Corporations by Party Affiliation: 2010 ..................................................................................................................... 17
Figure 13: Rating of Kansas State Government: 2009 and 2010 .................................................................................................................................................... 18
Figure 14: Satisfaction with Performance of the Kansas Legislature, Governors, and State/U.S. Legislators: 2009 and 2010 ...................................................... 19
Figure 15: Satisfaction with Performance of State Senator in Respondent’s District by Party Affiliation: 2010 ............................................................................ 20
Figure 16: Satisfaction with Performance of U.S Senator in Respondent’s District by Party Affiliation: 2010 ............................................................................... 21
Figure 17: Opinion on Kansas Government Spending: 2009 and 2010 .......................................................................................................................................... 22
Figure 18: Opinion on Kansas Government Spending by Party Affiliation: 2010 ........................................................................................................................... 22
Figure 19: Opinion on Kansas Government Spending by Voter Registration Status: 2010 ............................................................................................................ 23
Figure 20: Opinion on Devoting Resources to the Development of Coal, Oil, and Wind: 2009 and 2010 ..................................................................................... 24
Figure 21: Opinion on Devoting Resources to the Development of Coal by Party Affiliation: 2010 .............................................................................................. 25
Figure 22: Opinion on Devoting Resources to the Development of Oil by Party Affiliation: 2010 ................................................................................................. 26
The Docking Institute of Public Affairs: Kansas Speaks 2010 Page iii
Figure 23: Opinion on Devoting Resources to the Development of Wind by Party Affiliation: 2010 ............................................................................................. 27
Figure 24: Opinion on Devoting Resources to the Development of Coal by Voter Registration Status: 2010 ............................................................................... 28
Figure 25: Opinion on Economic Benefits vs. Environmental Impact of Coal and Oil Production: 2009 and 2010 ........................................................................ 29
Figure 26: Opinion on Economic Benefits vs. Environmental Impact of Coal Production by Party Affiliation: 2010 ..................................................................... 30
Figure 27: Opinion on Economic Benefits vs. Environmental Impact of Oil Production by Party Affiliation: 2010 ........................................................................ 31
Figure 28: Opinion on Providing Proof of Legal Residence to Law Enforcement Officer: 2010 ..................................................................................................... 32
Figure 29: Opinion on Providing Proof of Legal Residence to Law Enforcement Officer by Party Affiliation: 2010 ....................................................................... 33
Figure 30: Opinion on State Funding for Social Services: 2010 ...................................................................................................................................................... 34
Figure 31: Opinion on State Funding for Social Services by Party Affiliation: 2010 ........................................................................................................................ 35
Figure 32: Opinion on State Funding for Social Services by Household Income: 2010 .................................................................................................................. 36
Figure 33: Knowledge of Recent Federal Health Care Legislation: 2010 ........................................................................................................................................ 37
Figure 34: Opinion of Household Health Cost Change due to Recent Federal Health Care Legislation: 2010 ............................................................................... 38
Figure 35: Opinion of Household Health Cost Change due to Recent Federal Health Care Legislation by Party Affiliation: 2010 ................................................ 39
Figure 36: Opinion on Healthcare in Kansas: 2009 and 2010 ......................................................................................................................................................... 40
Figure 37: Opinion on Healthcare in Kansas by Party Affiliation: 2010 .......................................................................................................................................... 41
Figure 38: Opinion on State Education Funding: 2009 and 2010 ................................................................................................................................................... 42
Figure 39: Opinion on State Education Funding for K-12 by Party Affiliation: 2010 ....................................................................................................................... 43
Figure 40: Opinion on State Education Funding for Higher Education by Party Affiliation: 2010 ................................................................................................. 44
Figure 42: Likelihood of Terminating Landline Phone: 2010 .......................................................................................................................................................... 46
Figure 43: Personal Cell Phone Ownership: 2010 ........................................................................................................................................................................... 47
Figure 44: Number of Adults Using a Cell Phone: 2010 .................................................................................................................................................................. 48
Figure 45: Number of Children Using a Cell Phone: 2010............................................................................................................................................................... 48
Figure 46: Features Used on Cell Phone: 2010 ............................................................................................................................................................................... 49
Docking Institute of Public Affairs: Kansas Speaks 2010 1
Executive Summary
The Docking Institute of Public Affairs at Fort Hays State University conducted the 2010 Kansas Speaks survey from June 21 to September
17, 2010. A random sample of adult residents of Kansas age 18 and older was surveyed to assess attitudes and opinions regarding various issues
of interest to Kansas citizens. The survey finds:
Over half of the respondents (58.5%) in 2010 said they felt Kansas was either an “excellent” or “very good” place to live. Only 3.3% said
Kansas was either a “poor” or “very poor” place to live. Perceptions of the quality of life in Kansas in 2010 were slightly more negative
than measured in 2009. There was considerable variation in opinions between respondents’ racial categories, with white respondents
being most likely to rate quality of life as at least “good” and African-American respondents being most likely to rate it as less than
“good.”
Only 6.6% of respondents in 2010 said they thought the Kansas economy was either “excellent” or “very good,” while 21.8% said the
economy was “poor” or “very poor.” These opinions were consistent across all demographic categories. In 2009, 10.7% rated the
economy as “very good” or “excellent,” while only 15.8% rated it as “poor” or “very poor.” The difference between 2009 and 2010 was
statistically significant. This suggests an impression among Kansans that the Kansas economy is not as healthy as it was one year ago.
Respondents tended to report slightly higher levels of satisfaction with Republican leaders’ ideas to improve the Kansas economy than
with Democratic leaders’ ideas in 2010. In 2009, satisfaction was slightly higher for Democratic leaders’ efforts to improve the Kansas
economy.
Respondents tended to be more satisfied with the efforts of leaders of the parties with which they self-identified, with those at least
leaning toward Democratic identity tending to approve more highly of Democratic leaders and those at least leaning toward Republican
identity tending to approve more highly of Republican leaders.
Docking Institute of Public Affairs: Kansas Speaks 2010 2
In 2010, 46.2% of respondents said they were either “moderately satisfied” or “very satisfied” with Governor Parkinson’s ideas to
improve the health of the Kansas economy, while 25.5% said they were “not satisfied.” In 2009, respondent’s opinions of Governor
Sebelius were significantly different from those of Governor Parkinson in 2010. Opinions in 2009 of Governor Sebelius’ efforts to foster
the health of the Kansas economy were more polarized, with respondents being more likely to be either “very satisfied” or “not
satisfied.”
Two thirds (68.3%) of respondents in 2010 said they were at least “moderately concerned” that economic conditions in Kansas
threatened their own or their family’s welfare, while two-fifths (40%) said they were “very concerned.” This represents a significant
increase in concern compared to respondents in 2009, when only 28.7% said they were “very concerned.”
When asked about preferences for changes in income, sales and property taxation policy, respondents were most likely to favor keeping
the current income (49.3%) and sales tax (45.6%) policies in place. Respondents were most likely to favor decreasing property taxes
(51%). Among those who favored raising taxes, most favored increasing sales tax (24.1%), followed by income tax (15.2%). Only 9%
favored increasing property taxes.
The higher the respondent’s level of education, the more likely they were to favor increasing property taxes.
When asked about preferences for changes on taxation policy for various earner categories, respondents were most likely to favor
increasing taxes on large corporations and top income earners and decreasing taxes on small businesses. Most favored keeping current
tax policies for the middle class. The most significant change compared to 2009 respondents was a higher percentage favoring increased
taxes for top income earners (46.8% in 2010 vs. 41.3% in 2009) and a lower percentage favoring decreasing taxes for top income earners
(13.1% in 2010 vs. 17.6% in 2009).
In 2010, the more strongly respondents self-identified as Republicans, the more likely they were to favor decreasing or keeping taxes on
top income earners and large corporations the same. The more strongly respondents self-identified as Democrats, the more likely they
were to favor increasing or keeping taxes the same on top income earners and large corporations.
Docking Institute of Public Affairs: Kansas Speaks 2010 3
When respondents in 2010 were asked to rate Kansas state government, only 8% rated state government as “very good” or “excellent,”
while 27.2% rated it as “poor” or “very poor.” Compared to ratings in 2009, more respondents in 2010 rated the state government as
“fair, poor or very poor.” This tended to be true across all demographic categories.
In 2010, respondents’ satisfaction with the Governor and with their own state and U.S. legislators varied widely. Satisfaction tended to
be lower compared with satisfaction in 2009. Respondents’ satisfaction with the Kansas legislature in general tended to be lower than
with their own legislators or the Governor in both years, also decreasing between 2009 and 2010.
Republicans, as well as Independents leaning Republican, tended to be more satisfied with their own state Senator than Independents
and those leaning Democratic. The more strongly respondents self-identified with the Republican Party, the more likely they were to be
satisfied with their own U.S. Senator.
In 2010, over half of respondents (52.7%) favored decreasing state spending, while only 15.2% favored increasing spending. Compared
to 2009, respondents were generally more likely to favor lower state spending in 2010. Generally, the more strongly respondents self-
identified as Republican, the more likely they were to favor reduced spending. Registered voters were also much more likely to favor
reduced spending compared to non-registered voters.
As in 2009, respondents in 2010 were most likely to say it is “extremely important” for Kansas to devote resources to the development
of wind energy, followed by oil and coal. There were only small differences in opinion on energy policy between 2009 and 2010. The
more strongly respondents self-identified as Republican, the more likely they were to feel it is important to devote resources to oil and
coal development. The more strongly respondents self-identified as Democratic, the more likely they were to feel it is important to
devote resources to wind development. Registered voters were also much more likely to feel it is important to develop coal energy than
non-registered voters.
Respondents were somewhat divided regarding their opinions of the degree to which the economic benefits of oil and coal production
outweigh concerns of the environmental impact, but most (63.3%) believe the economic benefits of oil production and well over half
(59.5%) believe the benefits of coal production outweigh environmental concerns. Support for oil and coal development is even
stronger in 2010 than in 2009.
Docking Institute of Public Affairs: Kansas Speaks 2010 4
The more strongly respondents self-identified as Republican, the more likely they were to agree that the economic benefits of oil and
coal production outweigh concerns of the environmental impact. The more strongly respondents self-identified as Democratic, the
more likely they were to disagree.
Respondents were highly supportive of having a state law that requires Kansas citizens to provide proof of legal residence to any law
enforcement officer who asks for the proof, with 69% saying they would at least “somewhat support” and 54% saying they would
“strongly support” such a law. Only 18.4% of respondents said they would oppose such a law. The more strongly respondents self-
identified as Republican, the more likely they were to support such a law.
When asked about support for state spending for social services, almost half (46.4%) favored increased spending, while only 7.5%
favored decreased spending. Independents and those leaning Democratic were more likely to favor increased spending, while those
leaning Republican were more likely to favor keeping spending for social services at the current level. Respondents with household
incomes of less than $60,000 were more likely to favor increased spending, while the percentage favoring decreased spending was
highest among those with household incomes of $60,000 and more.
Respondents were asked about possible misconceptions regarding the new federal healthcare legislation. One-fourth (24.9%) believed
incorrectly that all Americans would now be required to purchase their own healthcare insurance, while over one-fifth (22.3%) believed
incorrectly that the federal government will now provide health insurance to all those uninsured. However, over half (52.7%) correctly
indicated that neither of these misconceptions are true.
When asked about assumptions regarding changes in household healthcare costs resulting from recent federal healthcare legislation,
two-thirds (68%) of respondents said they believe healthcare costs would be higher, and one-third (33.9%) believed they would be
significantly higher. Only 4.8% believed household healthcare costs would be lower due to the legislation. Generally, the more strongly
respondents self-identified as Republican, the more likely they were to believe healthcare costs will be higher. The more strongly
respondents self-identified as Democratic, the more likely they were to believe healthcare costs will be lower.
When asked about the adequacy of the Kansas healthcare system, respondents to the 2010 survey were most likely to say Kansas’
healthcare system needs minor changes (40%). One third (33.8%) believe major changes are needed. Only one-fourth (26.2%) believe
Docking Institute of Public Affairs: Kansas Speaks 2010 5
the current system is adequate. The data suggest that Kansans are more satisfied with the state healthcare system now than they were
in 2009. The more strongly respondents self-identified as Republican, the more likely they were to feel the current state healthcare
system is adequate and less likely to believe it needs major changes.
When asked about funding for public education, respondents in 2010 were most likely to say they would keep funding for higher
education the same and increase funding for K-12. However, almost two-fifths (38.2%) favored increased funding for higher education.
Support for funding higher education declined slightly compared to 2009, whereas support for funding K-12 remained essentially the
same. The more strongly respondents self-identified as Democratic, the more likely they were to support increased funding for K-12 and
higher education.
More than eighty percent (86.8%) of respondents said they have landline phones in their households, and more than three quarters
(78.7%) of them said it was not likely at all that they would discontinue their landline service within the next year.
The vast majority (86.8%) of respondents said that members of their households use cell phone for personal use only, and 11.1% of cell
phone households indicated that more than two adult members in their households use a cell phone. Less than one fifth (18.3%) of
respondents from cell phone households said that children in their households use a cell phone.
In addition to making and receiving calls, the most common use of cell phones among respondents was for taking pictures or videos
(52.9%), followed by texting (49.5%) and the alarm function (39.4%). Less than twenty percent use them to listen to music (18.8%) and
for the GPS function (16.8%).
Docking Institute of Public Affairs: Kansas Speaks 2010 6
Introduction and Methods
The Docking Institute of Public Affairs at Fort Hays State University surveyed a random sample of adult residents of Kansas age 18 and
older to assess attitudes and opinions regarding various issues of interest to Kansas citizens. The survey was administered through both
telephone and mail, utilizing an addressed-based sampling technique to facilitate the most representative sample possible. Respondents for
which telephone numbers were available were surveyed by telephone. Those respondents who were not able to be reached by telephone, as
well as those for whom no phone number was available, were mailed the questionnaire and a self-addressed business reply envelope. The
telephone survey was conducted from June 21 to September 10, 2010, when 1,597 households were contacted via telephone. A total of 797
households completed the telephone survey, resulting in a 50% response rate (797/1,597). The survey questionnaires were mailed to 2,325
households on August 11. By September 17, the end of the data collection period, 35 mail invitations were returned as undeliverable, and 205
questionnaires were completed and mailed back to the Docking Institute. The valid population size for the mail survey is thus 2,290 (2,325 – 35),
and the response rate for the mail survey is 9% (205/2,290). With a total of 1,002 households completing the survey, the overall response rate is
25.8% (1,002/3,887). At a 95% confidence level, the margin of error for the full sample of 1,002 is 3.1%, assuming no response bias. A margin of
error of 3.1% means that there is a 95% probability that findings among the sample vary no more than +/- 3.1% from the value that would be
found if the entire population of interest (adult Kansas residents) were surveyed, assuming no response bias. Sample demographics were
compared to known Census-based distribution (see Appendix A). The sample matches closely with all Census-based distribution except Hispanic
origin and age. The survey had higher response rates among Kansas residents who are non-Hispanic and those over 50. Therefore, the overall
population estimates are biased toward the opinions of non-Hispanic and older Kansans.
This report contains eight sections. Each section presents not only descriptive analyses of respondents’ answers to each question, but
also statistically significant relationships with key demographic variables to see how citizens in various social categories differ in their opinions
on various issues. These eight sections are:
1) Overall Quality of life in Kansas. This section shows how Kansans generally feel about Kansas as a place to live.
2) Economy. This section shows results to questions addressing various economic concerns to citizens.
Docking Institute of Public Affairs: Kansas Speaks 2010 7
3) Taxes. This section shows results to opinion questions regarding fair and effective personal and business taxation policies.
4) State Government. This section presents the results of citizens’ ratings of the state government in general, as well as their various state
government elected officials.
5) Energy Policy. A key component of this study is to assess the level of citizen support for public resources being devoted to developing
various sources of energy production, including oil, coal and wind.
6) Public Policy Issues. This section looks at citizens’ opinions on several key policy issues, including illegal immigration and social services.
7) Healthcare and Education. This section presents the results of citizens’ opinions on the general state of healthcare in Kansas, as well as
knowledge and opinions on the recent federal health care legislation. Opinions about the appropriate amount of state funding for K-12
and higher education are also included in this section.
8) Phone Usage. This final section presents self-reports of landline and cell phone usage.
Section 1: Overall Quality of life in Kansas
Respondents were asked to rate Kansas generally as a place to live. Among those 997 respondents who provided valid answers to this
question, 22.7% said Kansas was an “excellent” place to live, 35.8% felt Kansas was a “very good” place to live, and 28.7% believed Kansas was a
“good” place to live. Respondents’ ratings in 2010 differ from those in 2009. The percentage of respondents who viewed Kansas as at least a
“good” place to live dropped from 91.6% in 2009 to 87.2% in 2010 (Figure 1). The difference between 2009 and 2010 is statistically significant,
indicating a 95% probability that such a difference would be found if the entire population of interest was surveyed, assuming no response bias
in the survey.
Opinions of the quality of life varied significantly by respondent’s race. In year 2010, 60% of white respondents said that Kansas was at
an “excellent” or “very good” place to live. Less than a third (28.5%) of African American respondents said so. A higher percentage of African
American respondents said that Kansas was a “poor” or “very poor” place to live than white respondents and respondents of other races
(Figure 2).
Docking Institute of Public Affairs: Kansas Speaks 2010 8
Figure 1: Rating of Kansas as an Overall Place to Live: 2009 and 2010
Figure 2: Rating of Kansas as an Overall Place to Live by Race: 2010
22.7%
22.7%
41.5%
35.8%
27.3%
28.7%
6.9%
9.5%
1.0%
2.3%0.5%
1.0%
0% 10% 20% 30% 40% 50% 60% 70% 80% 90% 100%
2009 (n=1218)
2010 (n=997)
Excellent Very Good Good Fair Poor Very Poor
21.4%
11.8%
23.6%
7.1%
37.3%
36.4%
25.0%
33.3%
28.5%
35.7%
9.8%
8.7%
7.1%
2.0%
2.1%
3.6%
5.9%
0.7%
0% 10% 20% 30% 40% 50% 60% 70% 80% 90% 100%
African American
Others
White
Excellent Very Good Good Fair Poor Very Poor
Docking Institute of Public Affairs: Kansas Speaks 2010 9
Section 2: Economy
When asked to rate the Kansas economy, 40.3% of the 995 respondents who provided valid answers said it was at least “good”, while
21.8% said Kansas had a “poor” or “very poor” economy. Compared with the 2009 survey, the percentage of respondents who thought the
Kansas economy was at least “good” dropped by 12.2%, and the percentage who thought the Kansas economy was “poor” or “very poor”
increased by 6% (Figure 3). The difference between 2009 and 2010 is statistically significant.
Figure 3: Rating of Kansas Economy: 2009 and 2010
The survey continued by asking respondents’ satisfaction levels with Governor Parkinson’s and state party leaders’ ideas to improve the
health of the Kansas economy. Respondents’ satisfaction levels with governors’ and state Democratic Party leaders’ efforts dropped significantly
in 2010 compared with 2009. In 2010, 33.3% of respondents were moderately or very satisfied with Kansas Democratic Party leaders’ ideas,
dropping from 47% in 2009; and 46.2% were moderately or very satisfied with Governor Parkinson’s ideas, dropping from 51.4% with Governor
Sebelius in 2009 (Figure 4). Respondents’ satisfaction levels with state Republican Party leader’s efforts in 2010 dropped slightly from 2009. In
2010, 38.5% of respondents were moderately or very satisfied with Kansas Republican Party leaders’ ideas to improve the health of the Kansas
economy, a 4.8% decrease from 2009 (Figure 4).
0.8%
0.7%
9.9%
5.9%
41.8%
33.7%
31.7%
37.9%
12.5%
17.4%
3.3%
4.4%
0% 10% 20% 30% 40% 50% 60% 70% 80% 90% 100%
2009 (n=1197)
2010 (n=995)
Excellent Very Good Good Fair Poor Very Poor
Docking Institute of Public Affairs: Kansas Speaks 2010 10
Figure 4: Satisfaction Levels with Governors’ and State Party Leaders’ Ideas to Improve the Health of the Kansas Economy: 2009 and 2010
Respondents’ party affiliations affected their satisfaction levels with state party leaders’ ideas to improve the health of the Kansas
economy in 2010. Democrats and independent voters leaning Democratic were more likely to feel very or moderately satisfied with Democratic
Party leaders’ ideas, whereas Republicans and independent voters leaning Republican were more likely to feel very or moderately satisfied with
Republican leaders’ ideas (Figures 5 and 6).
15.8%
11.6%
11.0%
7.2%
5.7%
5.7%
35.6%
34.6%
36.0%
26.1%
37.6%
32.8%
20.8%
28.2%
22.9%
25.4%
28.7%
29.1%
27.8%
25.5%
30.2%
41.3%
28.0%
32.3%
0% 10% 20% 30% 40% 50% 60% 70% 80% 90% 100%
2009 (n=1155)
2010 (n=885)
2009 (n=1104)
2010 (n=859)
2009 (n=1105)
2010 (n=872)G
ove
rno
r Se
be
lius(
20
09
)/
Go
vern
or
Par
kin
son
(20
10
)
KS
De
mo
crat
ic
Par
tyK
S R
ep
ub
lican
P
arty
Very Satisfied Moderately Satisfied Slightly Satisfied Not Satisfied
Docking Institute of Public Affairs: Kansas Speaks 2010 11
Figure 5: Satisfaction Levels with Democratic Party Leaders’ Ideas to Improve the Health of the Kansas Economy by Party Affiliation: 2010
Respondents were also asked how concerned they were that the Kansas economy would seriously threaten their or their families’
welfare. A total of 68.3% of respondents were either “very concerned” or “moderately concerned” in 2010. The percentage of respondents who
were very or moderately concerned was only 61.9% in 2009. Forty percent (40%) of respondents were “very concerned” in 2010, an 11.3%
increase from 2009 (Figure 7). The difference between 2009 and 2010 is statistically significant.
1.0%
1.5%
0.8%
3.3%
18.3%
3.8%
25.2%
9.1%
20.6%
13.4%
25.2%
43.9%
37.7%
55.1%
22.6%
29.4%
31.1%
32.5%
25.6%
30.2%
13.4%
67.3%
48.5%
54.6%
39.1%
12.2%
28.3%
6.3%
0% 10% 20% 30% 40% 50% 60% 70% 80% 90% 100%
Strong Republican
Not Very Stong Republican
Independent Leaning Republican
Independent
Independent Leaning Democrat
Not Very Strong Democrat
Strong Democrat
Very Satisfied Moderately Satisfied Slightly Satisfied Not Satisfied
Docking Institute of Public Affairs: Kansas Speaks 2010 12
Figure 6: Satisfaction Levels with Republican Party Leaders’ Ideas to Improve the Health of the Kansas Economy by Party Affiliation: 2010
Figure 7: Concerns with the Threat from the Economic Conditions in Kansas to Individuals’ or Families’ Welfare: 2009 and 2010
16.3%
1.3%
5.6%
2.7%
1.9%
1.6%
46.2%
46.1%
39.2%
22.7%
20.9%
25.0%
16.0%
26.9%
36.8%
32.8%
38.0%
20.9%
28.8%
20.8%
10.6%
15.8%
22.4%
36.7%
58.1%
44.2%
61.6%
0% 10% 20% 30% 40% 50% 60% 70% 80% 90% 100%
Strong Republican
Not Very Stong Republican
Independent Leaning Republican
Independent
Independent Leaning Democrat
Not Very Strong Democrat
Strong Democrat
Very Satisfied Moderately Satisfied Slightly Satisfied Not Satisfied
28.7%
40.0%
33.2%
28.3%
23.1%
20.7%
15.1%
11.0%
0% 10% 20% 30% 40% 50% 60% 70% 80% 90% 100%
2009 (n=1214)
2010 (n=984)
Very Concerned Moderately Concerned Slightly Concerned Not Concerned
Docking Institute of Public Affairs: Kansas Speaks 2010 13
Section 3: Taxes
Kansas has three primary revenue sources: income tax, sales tax, and property tax. After being asked to think of the current economy,
15.2% of respondents thought that income tax should be significantly or somewhat increased. About a quarter (24.1%) of respondents thought
that sales tax should be significantly or somewhat increased. More than half (51%) of respondents thought that property tax should be
somewhat or significantly decreased (Figure 8). Respondents’ education levels are significantly related with their opinions on property tax
changes. Respondents with higher levels of education were more likely to support a property tax increase than those with lower levels of
education (Figure 9).
Figure 8: Opinions on Changes of Income Tax, Sales Tax, and Property Tax: 2010
1.0%
3.2%
2.2%
8.0%
20.9%
13.0%
40.0%
45.6%
49.3%
28.0%
19.7%
22.5%
23.0%
10.7%
13.0%
0% 10% 20% 30% 40% 50% 60% 70% 80% 90% 100%
Property Tax (n=973)
Sales Tax (n=983)
Income Tax (n=979)
Significantly Increased Somewhat Increased Remain the Same Somewhat Decreased Significantly Decreased
Docking Institute of Public Affairs: Kansas Speaks 2010 14
Figure 9: Opinion on Property Tax Change by Education Level: 2010
Tax increases and reductions can be targeted at different people or businesses. In 2010, 52.8% of respondents thought taxes on small
businesses should be decreased, and 54.2% of respondents believed that taxes on large corporations should be increased. More than one-third
(37.5%) of respondents thought that taxes on middle class should be decreased, while only 13.1% said taxes on top income earners should be
decreased. Respondents’ answers in 2009 were fairly similar to those in 2010. Across all target groups, slightly lower percentages of
respondents thought taxes should be decreased in 2010 compared to 2009 (Figure 10). Statistical tests show that only respondents’ opinions of
1.2%
0.4%
0.9%
0.5%
3.5%
2.9%
7.0%
4.6%
13.3%
13.0%
26.3%
32.4%
36.8%
36.8%
38.9%
42.7%
50.4%
47.4%
20.6%
30.6%
33.5%
25.9%
26.1%
19.1%
26.3%
47.1%
28.5%
22.3%
29.6%
17.5%
13.9%
0% 10% 20% 30% 40% 50% 60% 70% 80% 90% 100%
Less Than High School
High School Diploma
Some College
Associates or Technical
Bachelors
Masters or Law
Doctoral
Significantly Increased Somewhat Increased Remain the Same Somewhat Decreased Significantly Decreased
Docking Institute of Public Affairs: Kansas Speaks 2010 15
tax change on top earners differ significantly from 2009 to 2010. Respondents’ party affiliations are strongly associated with their opinions of tax
changes on those different groups. Democrats and independent voters leaning Democratic were more likely to feel that taxes should be
increased on the top income earners and large corporations, whereas Republicans and independent voters leaning Republican were less likely to
feel so (Figures 11 and 12).
Figure 10: Tax Changes on Different Groups: 2009 and 2010
41.3%
46.8%
4.4%
4.3%
51.9%
54.2%
2.9%
2.5%
41.1%
40.1%
54.5%
58.3%
33.3%
34.2%
41.9%
44.7%
17.6%
13.1%
41.1%
37.5%
14.8%
11.6%
55.2%
52.8%
0% 10% 20% 30% 40% 50% 60% 70% 80% 90% 100%
2009 (n=1169)
2010 (n=964)
2009 (n=1192)
2010 (n=987)
2009 (n=1130)
2010 (n=938)
2009 (n=1170)
2010 (n=973)
Top
Inco
me
Ea
rne
rsM
idd
le C
lass
Larg
e
Co
rpo
rtat
ion
sSm
all B
usi
ne
sse
s
Increased Remain the same Decreased
Docking Institute of Public Affairs: Kansas Speaks 2010 16
Figure 11: Tax Changes on Top Income Earners by Party Affiliation: 2010
21.1%
33.7%
36.9%
56.5%
68.1%
71.7%
71.7%
54.1%
57.0%
49.6%
34.1%
26.6%
25.0%
23.2%
24.8%
9.3%
13.5%
9.4%
5.3%
3.3%
5.1%
0% 10% 20% 30% 40% 50% 60% 70% 80% 90% 100%
Strong Republican
Not Very Stong Republican
Independent Leaning Republican
Independent
Independent Leaning Democrat
Not Very Strong Democrat
Strong Democrat
Increased Remain the Same Decreased
Docking Institute of Public Affairs: Kansas Speaks 2010 17
Figure 12: Tax Changes on Large Corporations by Party Affiliation: 2010
30.3%
44.6%
48.2%
59.5%
67.7%
76.3%
78.2%
46.9%
48.2%
41.0%
28.6%
29.0%
23.7%
15.0%
22.7%
7.2%
10.8%
11.9%
3.2%
6.8%
0% 10% 20% 30% 40% 50% 60% 70% 80% 90% 100%
Strong Republican
Not Very Stong Republican
Independent Leaning Republican
Independent
Independent Leaning Democrat
Not Very Strong Democrat
Strong Democrat
Increased Remain the Same Decreased
Docking Institute of Public Affairs: Kansas Speaks 2010 18
Section 4: State Government
In 2010, 37.1% of respondents felt that the Kansas state government’s performance was at least “good,” and 27.2% of respondents
thought that the state government’s performance was “poor” or “very poor.” Respondents’ ratings in 2009 were significantly different from that
in 2010. In 2009, 51.2% of respondents thought the state government’s performance was at least “good,” and 17.1% thought it was “poor” or
“very poor” (Figure 13). This represents a significant decline in approval of state government over the past year.
In general, respondents’ satisfaction levels were lower in 2010 than in 2009 with the overall performance of the Kansas legislature and
state and U.S. senators and representatives. The differences were all statistically significant. Except for the performance of the Governors, more
than 10% fewer respondents in 2010 felt very or moderately satisfied with the performance of the Kansas legislature and political leaders
compared to 2009. For instance, 48.5% of respondents felt very or moderately satisfied with their U.S. representatives in 2010, whereas 62.1%
of respondents felt so in 2009. In 2009, 70.0% of respondents were very or moderately satisfied with the performance of their state Senator. In
2010, 53.4% of respondents felt so about their state Senator’s performance in 2010 (Figure 14). Satisfaction with the Governor tended to move
more from the extreme ratings of Governor Sebelius to moderately or slightly satisfied ratings for Governor Parkinson.
Figure 13: Rating of Kansas State Government: 2009 and 2010
1.5%
0.8%
7.8%
7.2%
41.9%
29.1%
31.7%
35.6%
13.4%
20.1%
3.7%
7.1%
0% 10% 20% 30% 40% 50% 60% 70% 80% 90% 100%
2009 (n=1166)
2010 (n=969)
Excellent Very Good Good Fair Poor Very Poor
Docking Institute of Public Affairs: Kansas Speaks 2010 19
Figure 14: Satisfaction with Performance of the Kansas Legislature, Governors, and State/U.S. Legislators: 2009 and 2010
2.6%
2.9%
22.1%
14.3%
19.1%
11.9%
20.3%
12.2%
17.3%
13.1%
17.2%
13.1%
46.8%
34.4%
34.0%
39.1%
50.9%
41.5%
49.7%
44.0%
48.2%
37.7%
44.9%
35.4%
29.2%
33.4%
16.6%
25.7%
16.9%
26.9%
17.0%
24.9%
16.1%
23.7%
20.4%
26.4%
21.5%
29.3%
27.2%
20.9%
13.1%
19.7%
13.0%
18.9%
18.3%
25.4%
17.5%
25.1%
0% 10% 20% 30% 40% 50% 60% 70% 80% 90% 100%
2009 (n=1155)
2010 (n=937)
2009 (n=1184)
2010 (n=869)
2009 (n=2046)
2010 (n=839)
2009 (n=1032)
2010 (n=847)
2009 (n=1103)
2010 (n=893)
2009 (n=1081)
2010 (n=885)K
ansa
s Le
gisl
atu
re
Go
vern
or
Seb
eliu
s(2
00
9)/
Go
vern
or
Par
kin
son
(20
10
)St
ate
Se
nat
or
Stat
e
Re
pre
sen
tati
veU
.S. S
en
ato
r
U.S
. C
on
gre
ssp
ers
on
Very Satisfied Moderately Satisfied Slightly Satisfied Not Satisfied
Docking Institute of Public Affairs: Kansas Speaks 2010 20
The party affiliation variable had significantly strong relationships with respondents’ satisfaction levels. In 2010, Republicans and
Independent voters leaning Republican were more likely to be very or moderately satisfied with the performance of their state and U.S. Senators
than Democrats and Independent voters leaning Democratic. More than half of the Republicans and Independent voters leaning Republican felt
very or moderately satisfied with their state and U.S. Senators, whereas less than half of the Democratic and Independent voters leaning
Democratic felt so (Figures 15 and 16).
Figure 15: Satisfaction with Performance of State Senator in Respondent’s District by Party Affiliation: 2010
17.2%
14.5%
12.9%
8.1%
12.3%
1.9%
12.1%
47.9%
50.0%
53.2%
35.1%
33.3%
46.2%
30.2%
22.4%
23.7%
24.2%
29.1%
30.9%
28.8%
28.4%
12.5%
11.8%
9.7%
27.7%
23.5%
23.1%
29.3%
0% 10% 20% 30% 40% 50% 60% 70% 80% 90% 100%
Strong Republican
Not Very Stong Republican
Independent Leaning Republican
Independent
Independent Leaning Democrat
Not Very Strong Democrat
Strong Democrat
Very Satisfied Moderately Satisfied Slightly Satisfied Not Satisfied
Docking Institute of Public Affairs: Kansas Speaks 2010 21
Figure 16: Satisfaction with Performance of U.S. Senator in Respondent’s District by Party Affiliation: 2010
When asked about Kansas government spending, 15.2% of respondents thought it should be “increased,” 32.1% thought it should
“remain the same,” and 52.7% thought it should be “decreased” in 2010. In 2009, the percentage of respondents who thought Kansas
government spending should be “increased” or “remain the same” was 5.8% higher than in 2010 (Figure 17). The change in respondents’
opinions from 2009 to 2010 is statistically significant. Republicans and Independent voters leaning Republican were less likely to say that Kansas
government spending should be “increased” in 2010, compared with Democrats, neutral Independent voters and independent voters leaning
Democratic (Figure 18).
26.4%
13.3%
17.8%
5.4%
7.9%
5.5%
4.9%
45.7%
49.4%
39.3%
34.5%
29.2%
32.7%
30.3%
17.8%
22.9%
23.0%
31.1%
24.7%
30.9%
20.5%
10.1%
14.5%
20.0%
29.1%
38.2%
30.9%
44.3%
0% 10% 20% 30% 40% 50% 60% 70% 80% 90% 100%
Strong Republican
Not Very Stong Republican
Independent Leaning Republican
Independent
Independent Leaning Democrat
Not Very Strong Democrat
Strong Democrat
Very Satisfied Moderately Satisfied Slightly Satisfied Not Satisfied
Docking Institute of Public Affairs: Kansas Speaks 2010 22
Figure 17: Opinion on Kansas Government Spending: 2009 and 2010
Figure 18: Opinion on Kansas Government Spending by Party Affiliation: 2010
18.4%
15.2%
34.7%
32.1%
46.8%
52.7%
0% 10% 20% 30% 40% 50% 60% 70% 80% 90% 100%
2009 (n=1117)
2010 (n=934)
Increased Remain the same Decreased
5.6%
8.0%
8.8%
19.3%
15.9%
18.3%
36.7%
26.8%
42.0%
28.7%
34.3%
47.7%
31.7%
28.1%
67.6%
50.0%
62.5%
46.4%
36.4%
50.0%
35.2%
0% 10% 20% 30% 40% 50% 60% 70% 80% 90% 100%
Strong Republican
Not Very Stong Republican
Independent Leaning Republican
Independent
Independent Leaning Democrat
Not Very Strong Democrat
Strong Democrat
Increased Remain the Same Decreased
Docking Institute of Public Affairs: Kansas Speaks 2010 23
Whether respondents were registered voters or not also affected their opinions on government spending. Respondents who were not
registered to vote were more likely to say that Kansas government spending should be “increased” or “remain the same,” whereas registered
voters were more likely to favor decreased state spending (Figure 19).
Figure 19: Opinion on Kansas Government Spending by Registration Status: 2010
Section 5: Energy Policy
More than 80% of respondents thought that it was “extremely important” or “important” for Kansas to devote resources to the
development of wind energy in both 2009 and 2010. Respondents’ opinions about the development of energy changed somewhat from 2009 to
2010, with a tendency to report less importance in 2010. Less than 60% of respondents (57.6%) thought it was “extremely important” or
“important” for Kansas to develop oil energy in 2010, while in 2009 the percentage was 63%. About 45% of respondents felt it was “extremely
important” or “important” for Kansas to develop coal energy in 2010, whereas in 2009 the percentage was 49.4%. The percentages of
respondents who felt it was “extremely important” or “important” for Kansas to develop all three energy sources, including wind, were lower in
2010 than in 2009 (Figure 20).
14.1%
30.6%
18.3%
33.9%
67.6%
35.5%
0% 10% 20% 30% 40% 50% 60% 70% 80% 90% 100%
Registered Voters
Non Registered Voters
Increased Remain the Same Decreased
Docking Institute of Public Affairs: Kansas Speaks 2010 24
Figure 20: Opinion on Devoting Resources to the Development of Coal, Oil, and Wind: 2009 and 2010
Respondents self-identifying different party affiliations varied in their opinions on energy policies. In general, Republicans and
Independent voters leaning Republican were more likely to say it was “extremely important” or “important” for Kansas to devote resources to
the development of coal and oil energy in 2010. About two-thirds (66.9%) of strong Republicans felt it is “extremely important” or “important”
to develop coal energy, whereas 35.8% of strong Democrats felt so (Figure 21). More than half of Republicans and independent voters leaning
Republican said it was “extremely important” or “important” for Kansas to develop oil energy, whereas less than half of Democrats, neutral
Independent voters, and Independent voters leaning Democratic said so (Figure 22). Support for the development of wind energy was relatively
high across all party affiliations, but percentages of strong Democrats and Independent voters leaning Democratic who said it was “extremely
important” or “important” to develop wind energy were higher than for respondents of other party affiliations (Figure 23).
21.1%
19.7%
28.4%
25.4%
62.6%
59.7%
28.3%
25.4%
34.6%
32.2%
23.9%
22.8%
26.9%
36.2%
24.9%
30.1%
10.3%
13.8%
23.7%
18.7%
12.2%
12.4%
3.2%
3.8%
0% 10% 20% 30% 40% 50% 60% 70% 80% 90% 100%
2009 (n=1159)
2010 (n=937)
2009 (n=1192)
2010 (n=961)
2009 (n=1205)
2010 (n=980)
Co
alO
ilW
ind
Extremely Important Important Somewhat Important Not at all Important
Docking Institute of Public Affairs: Kansas Speaks 2010 25
Figure 21: Opinion on Devoting Resources to the Development of Coal by Party Affiliation: 2010
32.5%
16.5%
19.4%
15.6%
13.3%
16.9%
11.9%
34.4%
18.8%
30.2%
22.8%
17.8%
11.9%
23.9%
25.8%
45.9%
35.3%
38.9%
36.7%
50.8%
35.8%
7.2%
18.8%
15.1%
22.8%
32.2%
20.3%
28.4%
0% 10% 20% 30% 40% 50% 60% 70% 80% 90% 100%
Strong Republican
Not Very Stong Republican
Independent Leaning Republican
Independent
Independent Leaning Democrat
Not Very Strong Democrat
Strong Democrat
Extremely Important Important Somewhat Important Not At All Important
Docking Institute of Public Affairs: Kansas Speaks 2010 26
Figure 22: Opinion on Devoting Resources to the Development of Oil by Party Affiliation: 2010
42.0%
25.6%
21.0%
20.1%
12.1%
26.7%
14.3%
34.2%
30.0%
35.7%
28.4%
28.6%
21.7%
34.6%
18.7%
38.9%
32.9%
33.1%
36.3%
38.3%
32.3%
5.0%
5.6%
10.5%
18.3%
23.1%
13.3%
18.8%
0% 10% 20% 30% 40% 50% 60% 70% 80% 90% 100%
Strong Republican
Not Very Stong Republican
Independent Leaning Republican
Independent
Independent Leaning Democrat
Not Very Strong Democrat
Strong Democrat
Extremely Important Important Somewhat Important Not At All Important
Docking Institute of Public Affairs: Kansas Speaks 2010 27
Figure 23: Opinion on Devoting Resources to the Development of Wind by Party Affiliation: 2010
47.3%
58.2%
57.2%
66.5%
71.0%
57.4%
71.1%
23.2%
24.2%
25.5%
20.8%
18.3%
21.3%
20.4%
20.0%
15.4%
15.2%
10.4%
8.6%
21.3%
7.7%
9.5%
2.2%
2.1%
2.3%
2.2%
0.7%
0% 10% 20% 30% 40% 50% 60% 70% 80% 90% 100%
Strong Republican
Not Very Stong Republican
Independent Leaning Republican
Independent
Independent Leaning Democrat
Not Very Strong Democrat
Strong Democrat
Extremely Important Important Somewhat Important Not At All Important
Docking Institute of Public Affairs: Kansas Speaks 2010 28
There was also a significant difference between registered voters’ opinions on development of coal compared to those not registered in
2010. Almost half (49.3%) of registered voters thought it was extremely important or important for Kansas to devote resources to the
development of coal energy, whereas 24.7% of those who were not registered felt so (Figure 24).
Figure 24: Opinion on Devoting Resources to the Development of Coal by Registration Status: 2010
Respondents were asked about their opinions on the economic benefits versus the environmental impact of coal and oil production. In
2010, almost two-thirds (63.3%) of respondents strongly agreed or agreed that the economic benefits of oil production outweigh concerns about
the impact on the environment, and 59.5% of respondents strongly agreed or agreed that the economic benefits of coal production outweigh
concerns of the impact on the environment. Respondents’ opinions in 2009 were significantly different from those in 2010. In 2009, the
percentages of respondents who strongly agreed or agreed the economic benefits of coal and oil production outweigh concerns about the
impact on the environment were both lower than those in 2010, despite the fact that data collection occurred in the wake of the Deepwater
Horizon oil spill (Figure 25).
20.5%
6.2%
28.8%
18.5%
38.4%
47.7%
12.3%
27.7%
0% 10% 20% 30% 40% 50% 60% 70% 80% 90% 100%
Registered Voters
Non Registered Voters
Extremely Important Important Somewhat Important Not At All Important
Docking Institute of Public Affairs: Kansas Speaks 2010 29
Figure 25: Opinion on Coal and Oil Production: 2009 and 2010
In the 2010 survey, the party affiliation variable has significantly strong relationships with respondents’ opinions on the economic
benefits and environmental impact of coal and oil production. Republicans and Independent voters leaning Republican were more likely to
“strongly agree” or “agree” that the economic benefits of coal and oil production outweigh concerns about the impact on environment than
Democrats, Independent voters leaning Democratic and neutral Independent voters. More than 60% of Republicans and Independent voters
leaning Republican strongly agreed or agreed that the economic benefits of coal and oil production outweigh concerns about its impact on
environment. The percentages of Democrats, Independent voters leaning Democratic and neutral Independent voters who strongly agreed or
agreed so were generally less than 60% (Figures 26 and 27).
12.1%
13.7%
10.8%
15.5%
39.6%
45.8%
43.1%
47.8%
35.3%
29.3%
37.1%
26.4%
13.1%
11.2%
9.1%
10.3%
0% 10% 20% 30% 40% 50% 60% 70% 80% 90% 100%
2009 (n=1111)
2010 (n=900)
2009 (n=1133)
2010 (n=919)
The
eco
no
mic
b
en
efi
ts o
f co
al
pro
du
ctio
n
ou
twe
igh
co
nce
rns
som
e
pe
op
le m
ay
hav
e a
bo
ut
its
imp
act
on
th
e
en
viro
nm
en
t
The
eco
no
mic
b
en
efi
ts o
f o
il p
rod
uct
ion
ou
twe
igh
co
nce
rns
som
e
pe
op
le m
ay
hav
e a
bo
ut
its
imp
act
on
th
e
en
viro
nm
en
t
Strongly Agree Agree Disagree Strongly Disagree
Docking Institute of Public Affairs: Kansas Speaks 2010 30
Figure 26: Opinion on Economic Benefits and Environmental Impact of Coal Production by Party Affiliation: 2010
24.8%
13.6%
16.4%
8.7%
9.0%
7.0%
6.2%
54.0%
49.4%
50.7%
42.2%
34.8%
45.6%
36.9%
18.3%
33.3%
24.6%
32.3%
36.0%
29.8%
38.5%
3.0%
3.7%
8.2%
16.8%
20.2%
17.5%
18.5%
0% 10% 20% 30% 40% 50% 60% 70% 80% 90% 100%
Strong Republican
Not Very Strong Republican
Independent Leaning Republican
Independent
Independent Leaning Democrat
Not Very Strong Democrat
Strong Democrat
Strongly Agree Agree Disagree Strongly Disagree
Docking Institute of Public Affairs: Kansas Speaks 2010 31
Figure 27: Opinion on Economic Benefits and Environmental Impact of Oil Production by Party Affiliation: 2010
28.0%
16.5%
15.9%
8.0%
8.0%
8.6%
9.6%
48.8%
50.6%
54.3%
44.8%
39.8%
51.7%
43.0%
16.4%
28.2%
25.4%
32.5%
35.2%
20.7%
34.8%
6.8%
4.7%
4.3%
14.7%
17.0%
19.0%
12.6%
0% 10% 20% 30% 40% 50% 60% 70% 80% 90% 100%
Strong Republican
Not Very Strong Republican
Independent Leaning Republican
Independent
Independent Leaning Democrat
Not Very Strong Democrat
Strong Democrat
Strongly Agree Agree Disagree Strongly Disagree
Docking Institute of Public Affairs: Kansas Speaks 2010 32
Section 6: Public Policy Issues
When asked if they support or oppose a state law that would require Kansas citizens to provide proof of legal residence to any law
enforcement officer who asks for the proof, 54% of 984 respondents who provided valid answers said that they would “strongly support” such a
law, and 15% said they would “somewhat support” it. About one-seventh (13.8%) said that they would “strongly oppose” it (Figure 28).
Figure 28: Opinion on Providing Proof of Legal Residence to Law Enforcement Officer: 2010 (n=984)
54.0%
15.0% 12.6%
4.6%
13.8%
0.0%
10.0%
20.0%
30.0%
40.0%
50.0%
60.0%
Strongly Support Somewhat Support Neutral Somewhat Oppose Strongly Oppose
Docking Institute of Public Affairs: Kansas Speaks 2010 33
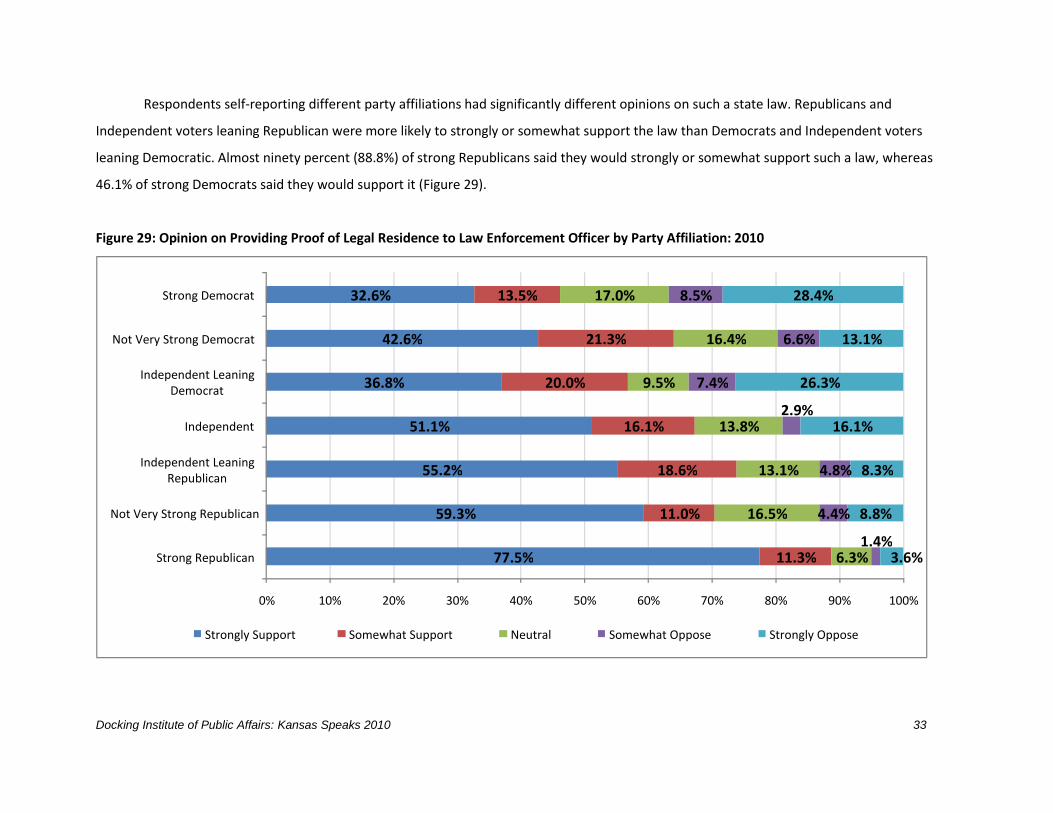
Respondents self-reporting different party affiliations had significantly different opinions on such a state law. Republicans and
Independent voters leaning Republican were more likely to strongly or somewhat support the law than Democrats and Independent voters
leaning Democratic. Almost ninety percent (88.8%) of strong Republicans said they would strongly or somewhat support such a law, whereas
46.1% of strong Democrats said they would support it (Figure 29).
Figure 29: Opinion on Providing Proof of Legal Residence to Law Enforcement Officer by Party Affiliation: 2010
77.5%
59.3%
55.2%
51.1%
36.8%
42.6%
32.6%
11.3%
11.0%
18.6%
16.1%
20.0%
21.3%
13.5%
6.3%
16.5%
13.1%
13.8%
9.5%
16.4%
17.0%
1.4%
4.4%
4.8%
2.9%
7.4%
6.6%
8.5%
3.6%
8.8%
8.3%
16.1%
26.3%
13.1%
28.4%
0% 10% 20% 30% 40% 50% 60% 70% 80% 90% 100%
Strong Republican
Not Very Strong Republican
Independent Leaning Republican
Independent
Independent Leaning Democrat
Not Very Strong Democrat
Strong Democrat
Strongly Support Somewhat Support Neutral Somewhat Oppose Strongly Oppose
Docking Institute of Public Affairs: Kansas Speaks 2010 34
Respondents were asked if the current level of state funding for social services, such as senior and disability services, should be
“increased,” “kept at the same level,” or “decreased.” Among those 965 respondents who provided valid answers, 46.4% said the level of state
funding for social services should be “increased,” 46.1% said it should be “kept at the same level,” and 7.5% said it should be “decreased” (Figure
30).
Figure 30: Opinion on State Funding for Social Services: 2010 (n=965)
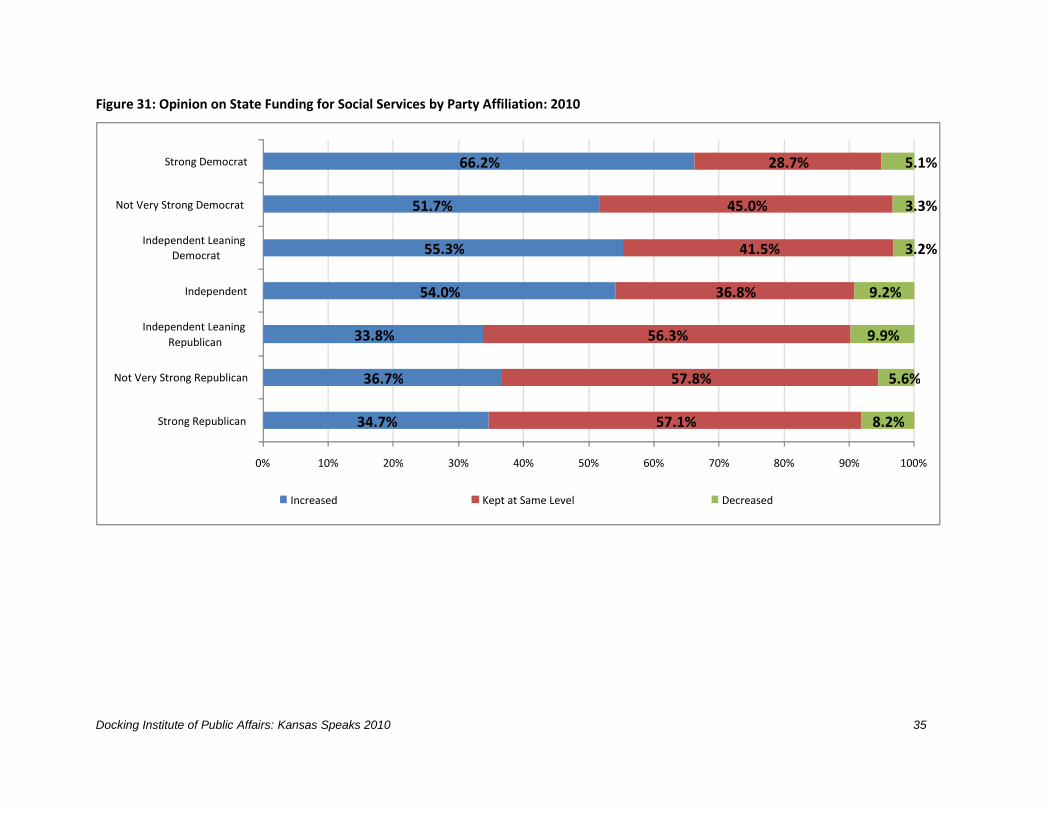
Respondents’ self-identified party affiliations and household incomes were both significantly associated with opinions on state funding
for social services. Republicans and Independent voters leaning Republican were less likely to support increased state funding for social services
than Democrats, Independent voters leaning Democratic, and neutral independent voters (Figure 31). In general, respondents with higher
household income were less supportive of increased state funding for social services (Figure 32).
46.4%
46.1%
7.5%
Increased
Kept at Same Level
Decreased
Docking Institute of Public Affairs: Kansas Speaks 2010 35
Figure 31: Opinion on State Funding for Social Services by Party Affiliation: 2010
34.7%
36.7%
33.8%
54.0%
55.3%
51.7%
66.2%
57.1%
57.8%
56.3%
36.8%
41.5%
45.0%
28.7%
8.2%
5.6%
9.9%
9.2%
3.2%
3.3%
5.1%
0% 10% 20% 30% 40% 50% 60% 70% 80% 90% 100%
Strong Republican
Not Very Strong Republican
Independent Leaning Republican
Independent
Independent Leaning Democrat
Not Very Strong Democrat
Strong Democrat
Increased Kept at Same Level Decreased
Docking Institute of Public Affairs: Kansas Speaks 2010 36
Figure 32: Opinion on State Funding for Social Services by Household Income: 2010
61.3%
64.2%
50.5%
51.5%
44.0%
55.7%
34.7%
37.8%
32.3%
30.9%
44.2%
44.3%
49.5%
40.5%
52.8%
51.4%
6.5%
4.9%
5.3%
4.1%
6.4%
3.8%
12.5%
10.8%
0% 10% 20% 30% 40% 50% 60% 70% 80% 90% 100%
Less than $10,000
$10,000-19,999
$20,000-29,999
$30,000-39,999
$40,000-49,999
$50,000-59,999
$60,000-69,999
More than $70,000
Increased Kept at Same Level Decreased
Docking Institute of Public Affairs: Kansas Speaks 2010 37
Section 7: Healthcare and Education
The survey asked respondents about their knowledge of the recent federal health care legislation. Among the 846 respondents who
provided valid answers, 24.9% thought that the new legislation requires that “all Americans have to purchase their own health insurance,” and
22.3% thought that the new legislation requires “the federal government to provide health insurance to all those who are uninsured.” The fact is
that people are not currently required to purchase their own health insurance, and the federal government will not provide health insurance to
all those currently uninsured. Therefore, a little more than half (52.7%) of respondents who selected “neither is true”, had the correct
knowledge of the recent federal health care legislation (Figure 33).
Figure 33: Knowledge about Recent Federal Health Care Legislation: 2010 (n=846)
24.9%
22.3%
52.7%
All Americans now have to purchase their own health insurance
The federal government will now provide health insurance to all those who are uninsured
Neither is true
Docking Institute of Public Affairs: Kansas Speaks 2010 38
The survey continued to ask if respondents believed that their household health care costs would be higher, the same, or lower as a
result of the recent federal health care legislation. Among those 959 respondents who provided valid answers, 33.9% thought their household
health care costs would be “significantly higher” due to the recent federal health care legislation, 34.1% thought the costs would be “somewhat
higher,” 27.2% thought the costs would be “about the same,” and 4.8% thought they would be somewhat or significantly lower (Figure 34).
Figure 34: Household Health Care Cost Change due to Recent Federal Health Care Legislation: 2010 (n=959)
33.9%
34.1%
27.2%
3.9% 0.9%
Significantly Higher
Somewhat Higher
About the Same
Somewhat Lower
Significantly Lower
Docking Institute of Public Affairs: Kansas Speaks 2010 39
Respondents with different party affiliations tended to differ in their perceptions of changes in health care costs. In general, Republicans
and Independent voters leaning Republican were more likely to believe that their household health care costs would be higher due to the recent
federal health care legislation than Democrats and Independent voters leaning Democratic. More than 70% of Republicans and Independent
voters leaning Republican believed that their household health costs would be significantly or somewhat higher, whereas less than 70% of
Democrats and Independent voters leaning Democratic believed so (Figure 35).
Figure 35: Household Health Cost Change due to Recent Federal Health Care Legislation by Party Affiliation: 2010
53.4%
30.0%
33.3%
36.8%
12.0%
28.1%
17.6%
32.9%
46.7%
39.7%
33.9%
25.0%
35.1%
26.5%
12.3%
22.2%
24.1%
24.6%
53.3%
35.1%
44.1%
1.4%
1.1%
2.8%
3.5%
9.8%
1.8%
8.1%
1.2%
3.7%
0% 10% 20% 30% 40% 50% 60% 70% 80% 90% 100%
Strong Republican
Not Very Strong Republican
Independent Leaning Republican
Independent
Independent Leaning Democrat
Not Very Strong Democrat
Strong Democrat
Significantly Higher Somewhat Higher About the Same Somewhat Lower Significantly Lower
Docking Institute of Public Affairs: Kansas Speaks 2010 40
The survey also asked about respondents’ opinions on the adequacy of health care in Kansas. In 2010, 26.2% of respondents felt that the
“Kansas healthcare system is adequate,” 40% said it “needs minor changes,” and 33.8% said it “needs major changes.” Respondents’ opinions
were significantly different from that in 2010. In 2009, half of the respondents said that the “Kansas healthcare needs major changes” compared
to one third in 2010 (Figure 36). Respondents with different party affiliations differed in their opinions on healthcare in Kansas in 2010.
Compared with Democrats, Independent voters leaning Democratic, and neutral Independent voters, Republicans and Independent voters
leaning Republican were more likely to say that the “Kansas healthcare system is adequate” and less likely to say it “needs major changes”
(Figure 37).
Figure 36: Opinion on the Adequacy of Health Care in Kansas: 2009 and 2010
16.4%
26.2%
33.4%
40.0%
50.3%
33.8%
0% 10% 20% 30% 40% 50% 60% 70% 80% 90% 100%
2009 (n=1168)
2010 (n=955)
Kansas healthcare system is adequate Kansas healthcare needs minor changes Kansas healthcare needs major changes
Docking Institute of Public Affairs: Kansas Speaks 2010 41
Figure 37: Opinion on the Adequacy of Health Care in Kansas by Party Affiliation: 2010
37.6%
29.2%
30.8%
22.8%
21.1%
20.3%
14.6%
39.4%
43.8%
43.4%
35.1%
42.2%
42.4%
36.5%
23.0%
27.0%
25.9%
42.1%
36.7%
37.3%
48.9%
0% 10% 20% 30% 40% 50% 60% 70% 80% 90% 100%
Strong Republican
Not Very Strong Republican
Independent Leaning Republican
Independent
Independent Leaning Democrat
Not Very Strong Democrat
Strong Democrat
Kansas healthcare system is adequate Kansas healthcare needs minor changes Kansas healthcare needs major changes
Docking Institute of Public Affairs: Kansas Speaks 2010 42
The survey asked about respondents’ opinions on the levels of state funding for Kindergarten through 12th grade (K-12) and higher
education in Kansas. Support for increasing state funding for K-12 in 2010 declined only slightly from that in 2009. About 53% of respondents
said that the level of state funding for K-12 should be “increased” in both years, though the percent favoring reduced spending increased
slightly. Support for state funding of higher education also declined in 2010. The percentage of respondents who said the state funding for
higher education should be “increased” was 38.2% in 2010, about 5% lower than that in 2009. As with K-12, a higher percentage (14.2%) of
respondents said that state funding for higher education should be “decreased,” which is about 5% higher than in 2009 (Figure 38). Statistical
analysis shows that respondents’ opinions about state funding for higher education changed significantly from 2009 to 2010.
Figure 38: Opinion on State Education Funding: 2009 and 2010
52.4%
52.8%
43.3%
38.2%
40.9%
38.8%
47.6%
47.7%
6.7%
8.4%
9.1%
14.2%
0% 20% 40% 60% 80% 100%
2009 (n=1169)
2010 (n=981)
2009 (n=1153)
2010 (n=967)
Fun
din
g fo
r G
rad
es
Kin
de
rgar
ten
Thro
ugh
Hig
h
Sch
oo
l
Fun
din
g fo
r St
ate
C
olle
ges
and
U
niv
ers
itie
s
Increased Kept at Same Level Decreased
Docking Institute of Public Affairs: Kansas Speaks 2010 43
Respondents’ opinions on state funding of public education were significantly related to their party affiliations in 2010. Democrats,
Independent voters leaning Democratic and neutral Independent voters were more likely to support increased state funding for K-12 and higher
education than Republicans and Independent voters leaning Republican. More than 60% of Democrats and Independent voters leaning
Democratic said the state funding for K-12 should be “increased,” whereas less than 50% of Republicans and Independent voters leaning
Republican said so. More than 50% of Democrats and Independent voters said the state funding for higher education should be “increased,”
whereas less than one third of Republicans and Independent voters leaning Republican said so (Figures 39 and 40).
Figure 39: Opinion on State Education Funding for K-12 by Party Affiliation: 2010
39.5%
47.3%
41.8%
58.7%
63.2%
63.3%
71.4%
46.4%
46.2%
50.7%
31.3%
34.7%
36.7%
23.6%
14.1%
6.6%
7.5%
10.1%
2.1%
5.0%
0% 10% 20% 30% 40% 50% 60% 70% 80% 90% 100%
Strong Republican
Not Very Strong Republican
Independent Leaning Republican
Independent
Independent Leaning Democrat
Not Very Strong Democrat
Strong Democrat
Increased Kept at Same Level Decreased
Docking Institute of Public Affairs: Kansas Speaks 2010 44
Figure 40: Opinion on State Education Funding for Higher Education by Party Affiliation: 2010
27.8%
30.7%
26.5%
41.0%
50.5%
56.7%
52.9%
55.1%
58.0%
55.8%
44.5%
40.9%
40.0%
33.6%
17.1%
11.4%
17.7%
14.5%
8.6%
3.3%
13.6%
0% 10% 20% 30% 40% 50% 60% 70% 80% 90% 100%
Strong Republican
Not Very Strong Republican
Independent Leaning Republican
Independent
Independent Leaning Democrat
Not Very Strong Democrat
Strong Democrat
Increased Kept at Same Level Decreased
Docking Institute of Public Affairs: Kansas Speaks 2010 45
Section 8: Phone Usage
The survey asked if respondents had a landline phone in their household. Among 988 respondents who provided valid answers, 86.8%
said they had at least one landline phone in their household (Figure 41). The survey continued asking those who had landline phones in their
households how likely respondents would discontinue landline service within the next year and use a cell phone only. A majority (78.7%) of
them said it was not at all likely that they would discontinue their landline phone within the next year and use a cell phone only instead (Figure
42).
Figure 41: Landline Phone Ownership: 2010 (n=988)
86.8%
13.2%Yes, I have landline phone(s) in the
household
No, I do not have a landline phone in the
household
Docking Institute of Public Affairs: Kansas Speaks 2010 46
Figure 42: Likelihood of Terminating Landline Phone: 2010 (n=851)
3.8% 4.3%
13.2%
78.7%
0.0%
10.0%
20.0%
30.0%
40.0%
50.0%
60.0%
70.0%
80.0%
90.0%
Extremely Likely Very Likely Somewhat Likely Not Likely At All
Docking Institute of Public Affairs: Kansas Speaks 2010 47
When asked if members of their households use cell phones for personal use only, 990 respondents answered the question, and among
them 88.5% said “Yes” (Figure 43). The survey continued asking the numbers of adults and children in the household who use cell phones. A
majority (88.9%) of respondents indicated that two or fewer adult members in their households use a cell phone (Figure 44). Less than twenty
percent (18.3%) of respondents said that children in their households use a cell phone (Figure 45).
Figure 43: Personal Cell Phone Ownership: 2010 (n=990)
88.5%
11.5%
Yes, members in my household use cell phones for personal
use only
No, members in my household do not use cellphone for personal
use only
Docking Institute of Public Affairs: Kansas Speaks 2010 48
Figure 44: Number of Adults Using a Cell Phone: 2010 (n=879)
Figure 45: Number of Children Using a Cell Phone: 2010 (n=854)
0.9%
32.1%
55.9%
8.2%2.5% 0.3% 0.1%
0.0%
10.0%
20.0%
30.0%
40.0%
50.0%
60.0%
0 1 2 3 4 5 6
81.7%
10.8%6.4%
0.9% 0.1%0.0%
10.0%
20.0%
30.0%
40.0%
50.0%
60.0%
70.0%
80.0%
90.0%
0 1 2 3 4
Docking Institute of Public Affairs: Kansas Speaks 2010 49
Cell phones are used mostly for making and receiving calls among respondents surveyed. Almost all (98.2%) respondents indicated that
they use cell phones for making and receiving calls. More than half (52.9%) of respondents said they used cell phones for taking pictures or
videos. Less than twenty percent (16.8%) use the GPS function on their cell phones (Figure 46).
Figure 46: Features Used on Cell Phone: 2010
10.3%
16.8%
18.8%
33.4%
36.3%
39.4%
49.5%
52.9%
98.2%
0.0% 20.0% 40.0% 60.0% 80.0% 100.0% 120.0%
Others (n=729)
GPS (n=750)
Listening to music (n=761)
Internet (n=784)
Calendar (n=799)
Alarm clock (n=812)
Texting (n=831)
Taking pictures or videos (n=823)
Making or receiving calls (n=878)
Docking Institute of Public Affairs: Kansas Speaks 2010 50
Appendix A: Demographic Characteristics of the Sample
Social Indicators Survey Sample
Study Population
Gender
(N=998)
Male 44.2% 49.7% a
Female 55.8% 50.3% a
Hispanic Origin
(N=995)
2.9% 9.3% a
Race
(N=989)
White 92.0% 88.5% a
Black or African American 2.8% 6.2% a
Biracial 0.9% 1.9% a
Asian 0.6% 2.3% a
American Indian 1.1% 1.0% a
Other 2.5% 0.1% a
Household Income
(N=869)
Less than $10,000 3.7% 8.6% b
$10,000-$19,999 9.6% 13.0% b
$20,000-$29,000 11.6% 14.2% b
$30,000-$39,999 11.3% 13.4% b
$40,000-$49,999 12.9% 11.7% b
$50,000-$59,999 9.4% 9.6% b
$60,000 and more 41.5% 29.7% b
Docking Institute of Public Affairs: Kansas Speaks 2010 51
Appendix A (cont.): Demographic Characteristics of the Sample
Social Indicators Survey Sample
Study Population
Education
(N=1000)
Less Than High School 3.5% 14.0% b
High School Diploma 24.8% 29.8% b
Some College 25.0% 24.6% b
Associates or Technical Degree 11.4% 7.7% b
Bachelors 21.6% 17.1% b
Masters or Law 11.8% 6.1% b
Doctoral 1.9% 0.9% b
Age (of those 18 and older)
(N=977)
18 to 19 years old 0.72% 28.0% c
20 to 24 years old 2.46% 7.9% a
25 to 29 years old 3.28% 7.1% a
30 to 34 years old 3.58% 6.0% a
35 to 39 years old 5.63% 6.2% a
40 to 44 years old 6.35% 6.2% a
45 to 49 years old 8.09% 7.2% a
50 to 54 years old 11.57% 7.1% a
55 to 59 years old 12.28% 6.2% a
60 to 64 years old 10.64% 5.0% a
65 to 69 years old 9.83% 3.7% a
70 to 74 years old 9.01% 2.9% a
75 to 79 years old 6.76% 2.4% a
80 to 84 years old 5.73% 2.0% a
85 years old and over 4.09% 2.1% a
Docking Institute of Public Affairs: Kansas Speaks 2010 52
Appendix A (cont.): Demographic Characteristics of the Sample
Social Indicators Survey Sample
Study Population
Political Party Affiliation
(N=943) Strong Republican 23.8% n/a
Not Very Strong Republican 9.9% n/a
Independent Leaning Republican 15.6% n/a
Independent 19.0% n/a
Independent Leaning Democrat 10.1% n/a
Not Very Strong Democrat 6.5% n/a
Strong Democrat 15.3% n/a
Years living in Kansas
(N=979)
1 to 20 years 19.4% n/a
21 to 40 years 25.9% n/a
41 to 60 years 29.6% n/a
More than 60 years 25.0% n/a
Participation in 2008 election
(N=991)
Vote 85.1% n/a
Not Vote 14.9% n/a
Registered to vote
(N=147)
Registered 53.1% n/a
Not Register 46.9% n/a
n/a = not available
a Source: U.S. Census Bureau (http://factfinder.census.gov). The information comes from 2009 population estimation.
b Source: U.S. Census Bureau (http://factfinder.census.gov). The information comes from 2000 decennial census.
c Source: U.S. Census Bureau (http://factfinder.census.gov). The information comes from 2009 population estimation. This is the percentage of
people of 0 to 19 years old.
Appendix B: Mail Survey Instrument
53
Mail Survey
For the following questions, please circle the number corresponding to your answer. Skip any question for
which you have no opinion or response.
Q1. In general, how would you rate Kansas as a place to live, the Kansas economy, and the Kansas state
government?
Excellent
Very
Good Good Fair Poor Very Poor
As a place to live, Kansas is 1 2 3 4 5 6
The Kansas economy is 1 2 3 4 5 6
The Kansas state government is 1 2 3 4 5 6
Q2. How satisfied are you with the overall performance of the Kansas legislature, Governor Parkinson,
and your state and congressional senators and representatives?
Very
Satisfied
Moderately
Satisfied
Slightly
Satisfied
Not
Satisfied
Overall performance of the Kansas legislature 1 2 3 4
Overall performance of Governor Parkinson 1 2 3 4
Overall performance of state senator in your district 1 2 3 4
Overall performance of state representative in your district 1 2 3 4
Overall performance of your U.S. senator 1 2 3 4
Overall performance of your U.S. Congressperson 1 2 3 4
If you would rather complete this survey online, please log on to www.fhsu.edu/docking and click on the web
surveys link at the bottom of the page to access the Kansas Speaks survey. The password is: docking. Please DO
NOT share this link with others in order to maintain representativeness.