44
Kao Corporation February 2, 2017 FY2016 From January 1 to December 31, 2016 This is a translation of materials used for the analyst meeting held in Japan on February 2, 2017.

Kao CorporationFebruary 2, 2017
FY2016From January 1 to December 31, 2016
This is a translation of materials used for the analyst meeting held in Japan on February 2, 2017.

2
Forward-looking statements such as earnings forecasts and other projections contained in this release are based on information available at this time and assumptions that management believes to be reasonable, and do not constitute guarantees of future performance. Actual results may differ materially from those expectations due to various factors.
These presentation materials are available on our website in PDF format:
http://www.kao.com/jp/en/corp_ir/presentations.html
■ Fiscal year end is December 31 from FY2012
Term of consolidation for FY2012- Group companies whose fiscal year end was previously March 31*: April-December 2012- Group companies whose fiscal year end was already December 31: January-December 2012
* Kao Corporation and certain consolidated subsidiaries with the same fiscal year end
■ IFRS adopted in FY2016

3
Business Environment January 1 - December 31, 2016Business Environment January 1 - December 31, 2016
4
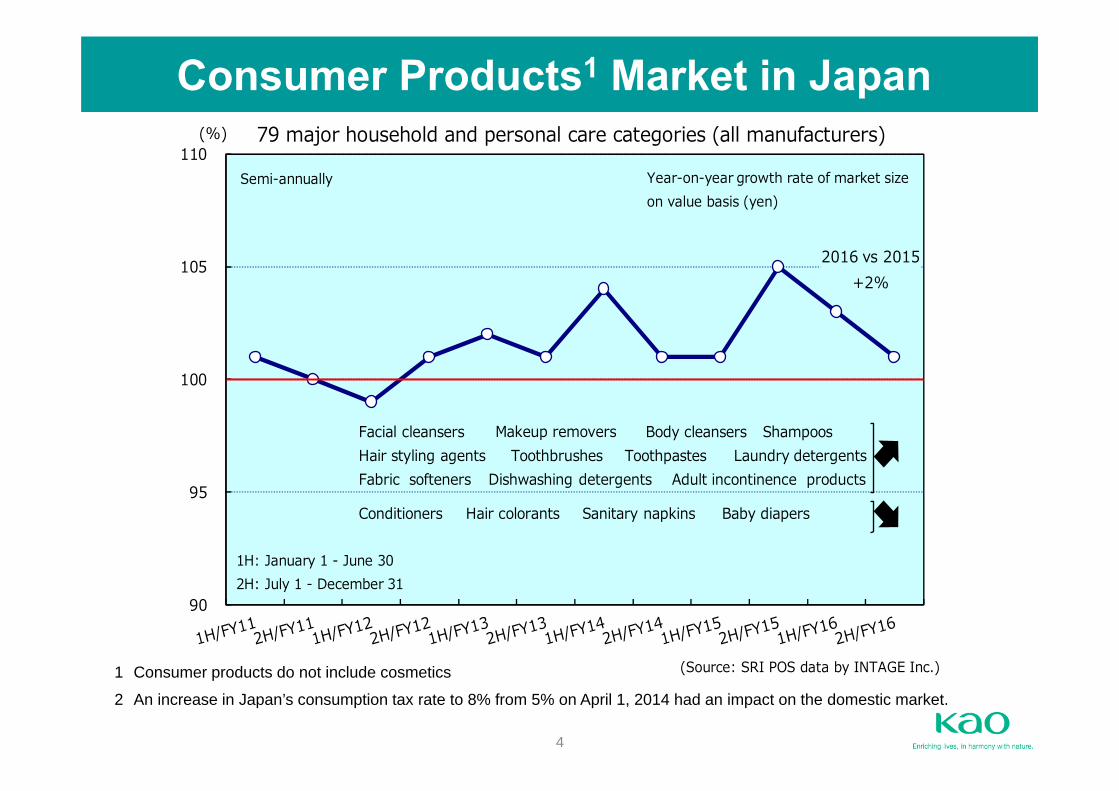
(Source: SRI POS data by INTAGE Inc.)
90
95
100
105
110(%)
Semi-annually Year-on-year growth rate of market sizeon value basis (yen)
1H: January 1 - June 302H: July 1 - December 31
79 major household and personal care categories (all manufacturers)
Fabric softenersToothpastes
Sanitary napkins
Dishwashing detergentsLaundry detergents
Conditioners Baby diapers
Body cleansersFacial cleansers ToothbrushesHair styling agents
Adult incontinence products
Makeup removers
Hair colorants
Shampoos
2016 vs 2015+2%
Consumer Products1 Market in Japan
1 Consumer products do not include cosmetics
2 An increase in Japan’s consumption tax rate to 8% from 5% on April 1, 2014 had an impact on the domestic market.
5
Cosmetics Products Market in Japan
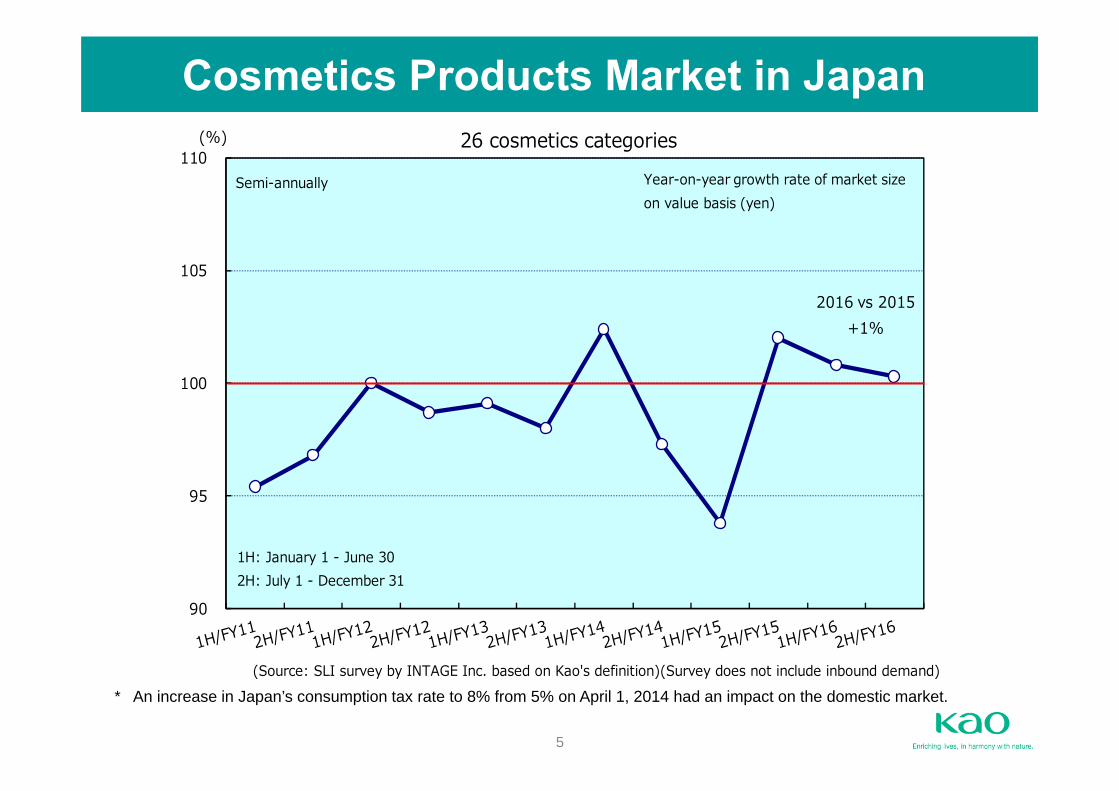
* An increase in Japan’s consumption tax rate to 8% from 5% on April 1, 2014 had an impact on the domestic market.(Source: SLI survey by INTAGE Inc. based on Kao's definition)(Survey does not include inbound demand)
90
95
100
105
110(%) 26 cosmetics categories
Year-on-year growth rate of market sizeon value basis (yen)
Semi-annually
1H: January 1 - June 302H: July 1 - December 31
2016 vs 2015+1%
6
Consumer Purchase Prices in Japan
_
100
98 99
97 97
95
97
94 95
93
95 94
96 97
100 100 100 99
80
85
90
95
100
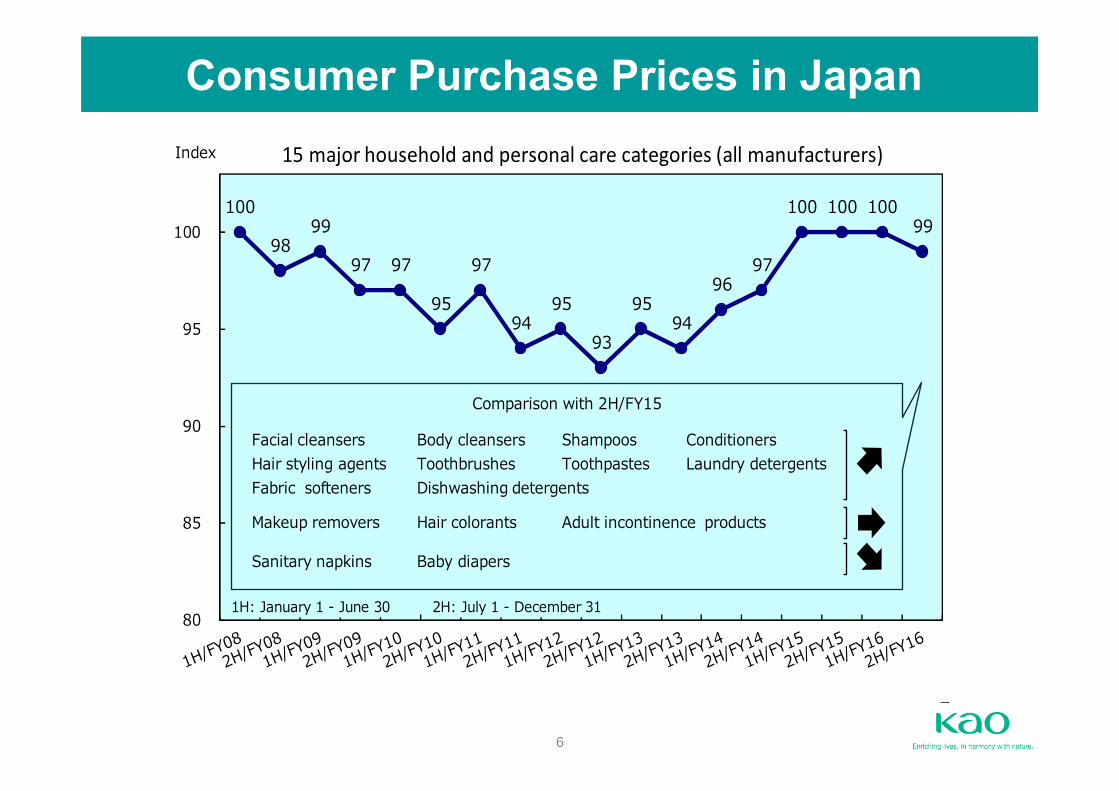
Index
Comparison with 2H/FY15
1H: January 1 - June 30 2H: July 1 - December 31
15 major household and personal care categories (all manufacturers)
Toothpastes Fabric softeners
Sanitary napkins
Dishwashing detergentsLaundry detergents
Baby diapers
ConditionersBody cleansersFacial cleansers ToothbrushesHair styling agents
Adult incontinence products Makeup removers Hair colorants
Shampoos
7
Consolidated Financial Results January 1 - December 31, 2016Consolidated Financial Results January 1 - December 31, 2016
8
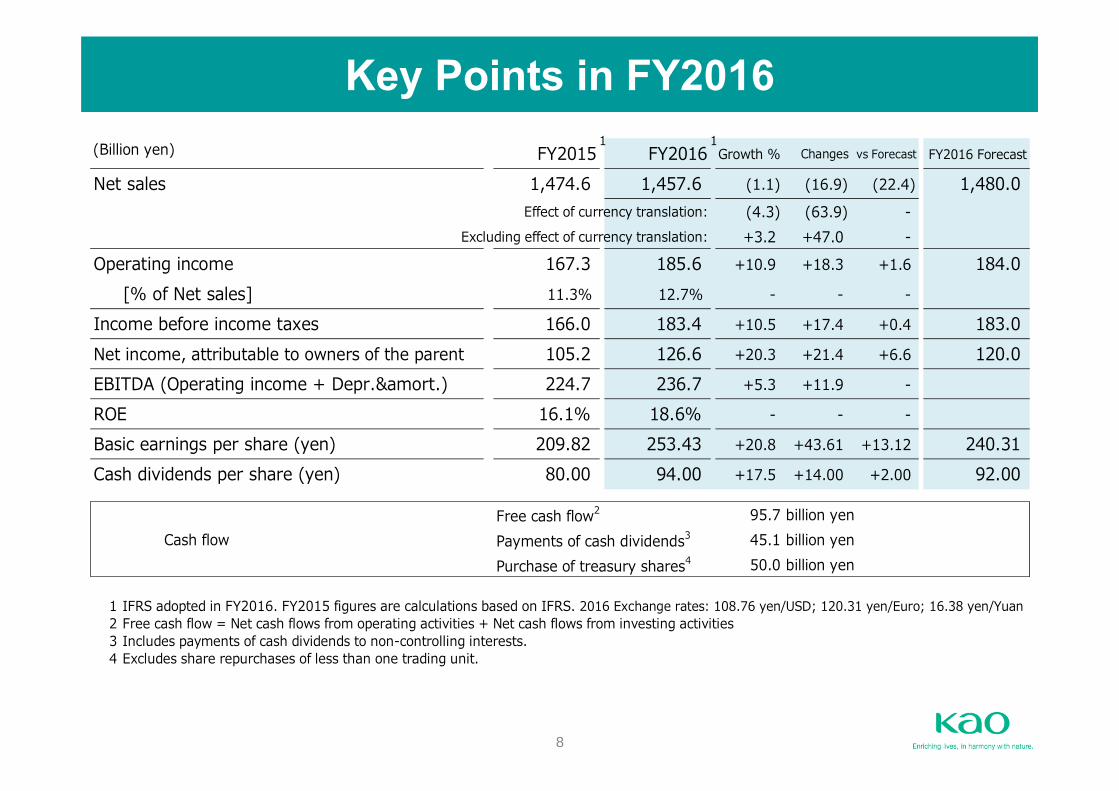
Key Points in FY2016(Billion yen) FY2015 FY2016 Growth % Changes vs Forecast FY2016 Forecast
Net sales 1,474.6 1,457.6 (1.1) (16.9) (22.4) 1,480.0 Effect of currency translation: (4.3) (63.9) -
Excluding effect of currency translation: +3.2 +47.0 - Operating income 167.3 185.6 +10.9 +18.3 +1.6 184.0
[% of Net sales] 11.3% 12.7% - - -
Income before income taxes 166.0 183.4 +10.5 +17.4 +0.4 183.0 Net income, attributable to owners of the parent 105.2 126.6 +20.3 +21.4 +6.6 120.0 EBITDA (Operating income + Depr.&amort.) 224.7 236.7 +5.3 +11.9 -
ROE 16.1% 18.6% - - -
Basic earnings per share (yen) 209.82 253.43 +20.8 +43.61 +13.12 240.31 Cash dividends per share (yen) 80.00 94.00 +17.5 +14.00 +2.00 92.00
Free cash flow2 95.7 billion yenCash flow Payments of cash dividends3 45.1 billion yen
Purchase of treasury shares4 50.0 billion yen
1 IFRS adopted in FY2016. FY2015 figures are calculations based on IFRS. 2016 Exchange rates: 108.76 yen/USD; 120.31 yen/Euro; 16.38 yen/Yuan2 Free cash flow = Net cash flows from operating activities + Net cash flows from investing activities3 Includes payments of cash dividends to non-controlling interests.4 Excludes share repurchases of less than one trading unit.
11

9
Executive Summary
FY2016 was a full year of initiatives in preparation for Kao Group Mid-term Plan “K20” Operating income exceeded the forecast1 and reached a
record high for the 4th consecutive fiscal year2
Announcement of Kao Group Mid-term Plan “K20” Preparation for the future
Shareholder returns Annual cash dividends per share for FY2016: Planned
increase of 14 yen compared with the previous fiscal year to 94 yen, 2 yen higher than the forecast and the 27th consecutive fiscal year of increases in cash dividends
Share repurchases: 50 billion yen
1. Forecast announced on February 3, 20162. IFRS has been adopted from FY2016 (formerly accounting principles generally accepted in Japan)

10
Consolidated Statement of Income(Billion yen) Changes
% ofNet sales
% ofNet sales
1,474.6 100.0 1,457.6 100.0 (16.9)Cost of sales (658.9) 44.7 (637.5) 43.7 21.4
815.7 55.3 820.1 56.3 4.4 SG&A expenses (642.7) 43.6 (633.4) 43.5 9.4 Other operating income/expenses (5.6) 0.4 (1.2) 0.1 4.5
167.3 11.3 185.6 12.7 18.3 Financial income/expenses (2.8) 0.2 (4.0) 0.3 (1.2)Share of profit in investments accounted for usingthe equity method 1.5 0.1 1.9 0.1 0.4
166.0 11.3 183.4 12.6 17.4 Income taxes (60.1) 4.1 (55.5) 3.8 4.5
106.0 7.2 127.9 8.8 21.9 Attributable to owners of the parent 105.2 7.1 126.6 8.7 21.4 Attributable to non-controlling interests 0.8 0.1 1.3 0.1 0.6
* IFRS adopted in FY2016. FY2015 figures are calculations based on IFRS.
FY2015 FY2016
Net income
Net sales
Gross profit
Operating income
Income before income taxes

11
FY2016 Consolidated Operating Income Analysis
Operating income1
FY2015 167.3 billion yen (Billion yen)
Increase in sales volume +22.0
Impact from change in raw material prices (net) +13.0
Total Cost Reduction (TCR) +11.0
-23.0
-4.7
FY2016 185.6 billion yen
1 IFRS adopted in FY2016. FY2015 figures are calculations based on IFRS.2 Excluding the impact of currency translation.
+18.3
Increase in SG&A expenses2
Product mix, impact of currency translation and others
12
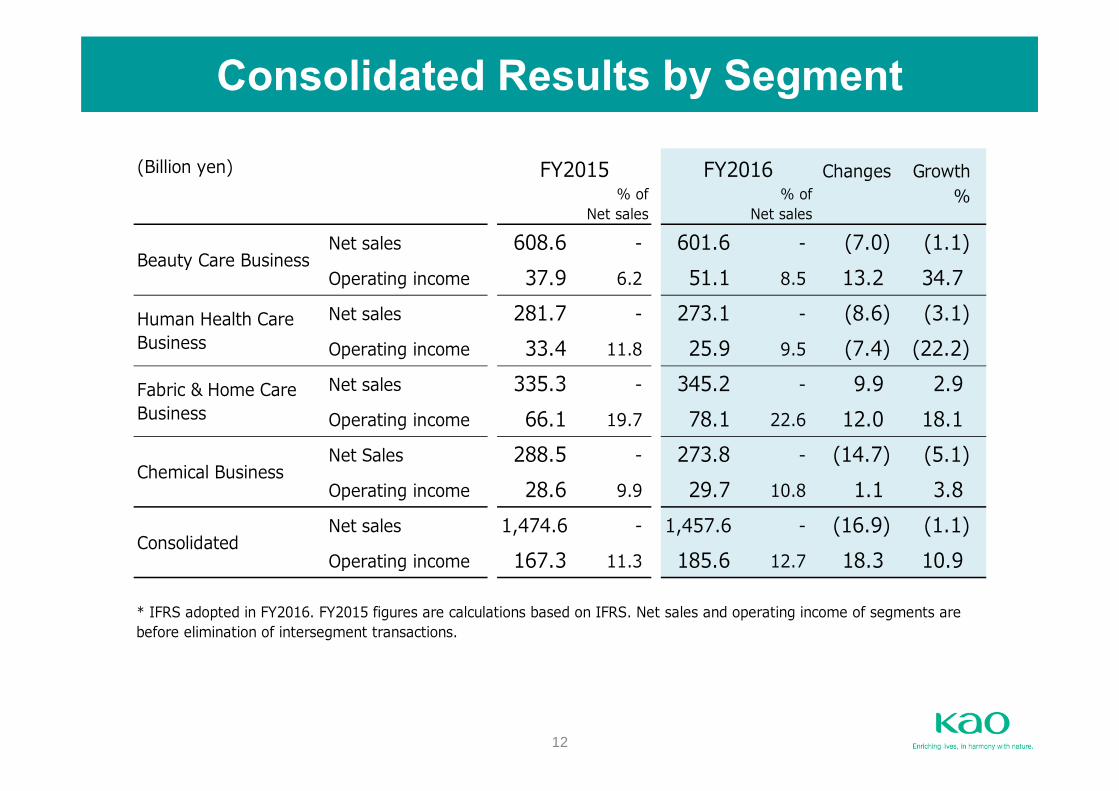
Consolidated Results by Segment
(Billion yen) Changes Growth% of
Net sales% of
Net sales%
Net sales 608.6 - 601.6 - (7.0) (1.1)Operating income 37.9 6.2 51.1 8.5 13.2 34.7 Net sales 281.7 - 273.1 - (8.6) (3.1)Operating income 33.4 11.8 25.9 9.5 (7.4) (22.2)Net sales 335.3 - 345.2 - 9.9 2.9 Operating income 66.1 19.7 78.1 22.6 12.0 18.1 Net Sales 288.5 - 273.8 - (14.7) (5.1)Operating income 28.6 9.9 29.7 10.8 1.1 3.8 Net sales 1,474.6 - 1,457.6 - (16.9) (1.1)Operating income 167.3 11.3 185.6 12.7 18.3 10.9
* IFRS adopted in FY2016. FY2015 figures are calculations based on IFRS. Net sales and operating income of segments arebefore elimination of intersegment transactions.
FY2015 FY2016
Beauty Care Business
Human Health CareBusiness
Fabric & Home CareBusiness
Chemical Business
Consolidated
13
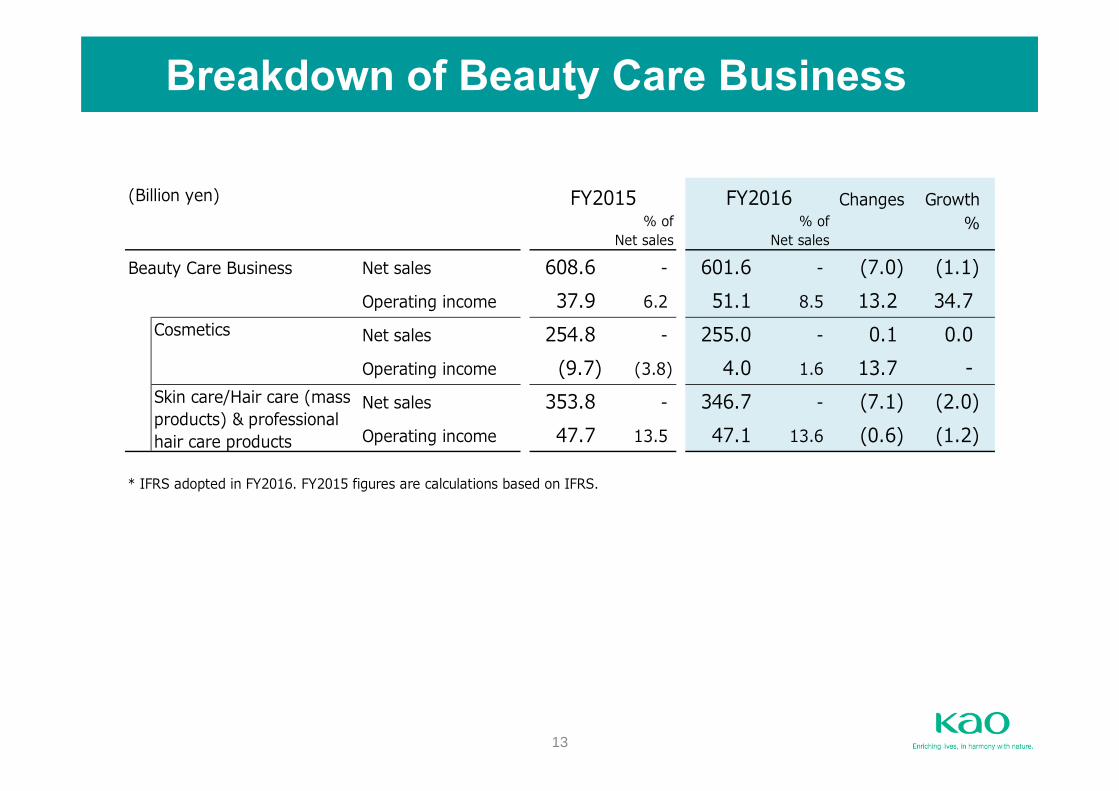
Breakdown of Beauty Care Business
(Billion yen) Changes Growth% of
Net sales% of
Net sales%
Beauty Care Business Net sales 608.6 - 601.6 - (7.0) (1.1)Operating income 37.9 6.2 51.1 8.5 13.2 34.7
Cosmetics Net sales 254.8 - 255.0 - 0.1 0.0 Operating income (9.7) (3.8) 4.0 1.6 13.7 - Net sales 353.8 - 346.7 - (7.1) (2.0)Operating income 47.7 13.5 47.1 13.6 (0.6) (1.2)
* IFRS adopted in FY2016. FY2015 figures are calculations based on IFRS.
Skin care/Hair care (massproducts) & professionalhair care products
FY2015 FY2016

14
(Billion yen) % of Net salesFY2015 FY2016 Growth % Like-for-
like % FY2015 FY2016 FY2015 FY2016923.8 943.0 2.1 2.1 115.5 132.0 12.5 14.0 182.7 180.8 (1.1) 13.0 12.3 15.8 6.7 8.7 89.7 80.1 (10.7) (0.5) 3.7 2.8 4.1 3.6 89.9 78.1 (13.1) (0.8) 7.0 3.7 7.8 4.7
(60.5) (62.2) - - (1.1) 0.8 - - 1,225.6 1,219.8 (0.5) 3.0 137.4 155.1 11.2 12.7
Net sales growth rates China: 24% Taiwan: 5% Vietnam: 24%of main countries (Like-for-like%) Indonesia: 19% Thailand: 1%
* IFRS adopted in FY2016. FY2015 figures are calculations based on IFRS. Like-for-like % are growth excluding the effect of currency translation.
Consumer Products Business
Net sales Operating income
Japan
Asia
Americas
Europe
Eliminations
Consumer Products Business

15
Forecast for FY 2017Forecast for FY 2017

16
Impact of IFRS 15 and Revision of Sales System
Early adoption of IFRS 15 “Revenue from contracts with customers” Revision of sales system in the Consumer Products Business in Japan
Reflect the estimated impacts to FY2016 net sales
Change in recording of sales from FY2017
FY2016 announced on February 2, 2017
FY2016 reflecting the estimated impacts
Net sales Relevant expenses
1,457.6billion yen 61.5
billion yen
Net sales Relevant expenses
1,396.1billion yen
61.5 billion yen deducted from net sales
Operating margin: 12.7% Operating margin: 13.3%

17
Major Assumptions for FY2017 Forecast Year-on-year growth rate of consumer products1 market size in value (yen) in Japan +1% Year-on-year growth rate of cosmetics market size in value (yen) in Japan2 Flat
Growth Net sales ¥1,470.0 billion +5.3% Effect of currency translation +¥8.0 billion +0.6% Sales growth excluding effect of currency translation +¥65.9 billion +4.7%
Estimated impact on income Impact from change in raw material prices Gross impact -¥1.0
billion Net impact -¥1.0 billion
Total Cost Reduction (TCR) activities +¥7.0 billion
Capital expenditures/depreciation and amortization Capital expenditures ¥80.0 billion Depreciation and
amortization ¥55.0 billion
Exchange rate assumptions
110 yen/USD (FY2016 actual exchange rate [average] 108.76 yen/USD) 123 yen/Euro (FY2016 actual exchange rate [average] 120.31 yen/Euro) 16.8yen/Yuan (FY2016 actual exchange rate [average] 16.38 yen/Yuan)
1 Consumer products do not include cosmetics2 Excludes inbound demand

18
(Billion yen)
Growth % Change Growth%
1,457.6 (1.1) 1,396.1 (615) 1,470.0 +5.3
185.6 +10.9 200.0 +7.8
[% of Net sales] 12.7% 13.6% -
183.4 +10.5 199.0 +8.5
[% of Net sales] 12.6% 13.5% -
126.6 +20.3 138.0 +9.0
[% of Net sales] 8.7% 9.4% -
253.43 +20.8 280.00 +10.5
18.6% 19.1% -
236.7 +5.3 255.0 +7.7
94.0 +17.5 108.0 +14.9
1
2 Exchange rate assumptions: 110 yen/USD, 123 yen/Euro, 16.8 yen/Yuan
Revision of sales system for Consumer Products Business in Japan and early adoption of IFRS 15 planned from the fiscalyear ending December 31, 2017. Amount calculated using the same standard for FY2016.
Net sales
Operating income
FY2016 FY2017 (F)
Income before income taxes
Net income, attributable to owners of theparent
Basic earnings per share (yen)
ROE
EBITDA (Operating income + Depr. & amort.)
Cash dividends per share (yen)
1
2
Consolidated Operating Results Forecast

19
Billion yen Growth
1,470.0 5.3% (Billion yen)
Growth Growth
Beauty Care 601.0 5.3% 1,030.0 3.7%
Human Health Care 280.0 8.7% 279.0 6.1%
Fabric & Home Care 340.0 2.9% 130.0 4.7%
Chemical 284.0 3.9% 150.0 10.1%
2 Before elimination of transactions among segments or geographic areas.
1 Growth rate taking into account revision of sales system for Consumer Products Business in Japan and earlyadoption of IFRS 15 from the fiscal year ending December 31, 2017.
Americas
Europe
Consolidated net sales
By Segment2 Reference: By Geographic Area2
Japan
Asia
1 1
1
Sales Outlook by Segment - FY2017
20
1,470.0 1,396.1
13.6%
15.0%
13.3%
0
500
1,000
1,500
2,000
FY2016 FY2017Forecast
FY2020
Net sales forecast Net sales actual Operating margin forecast Operating margin actual
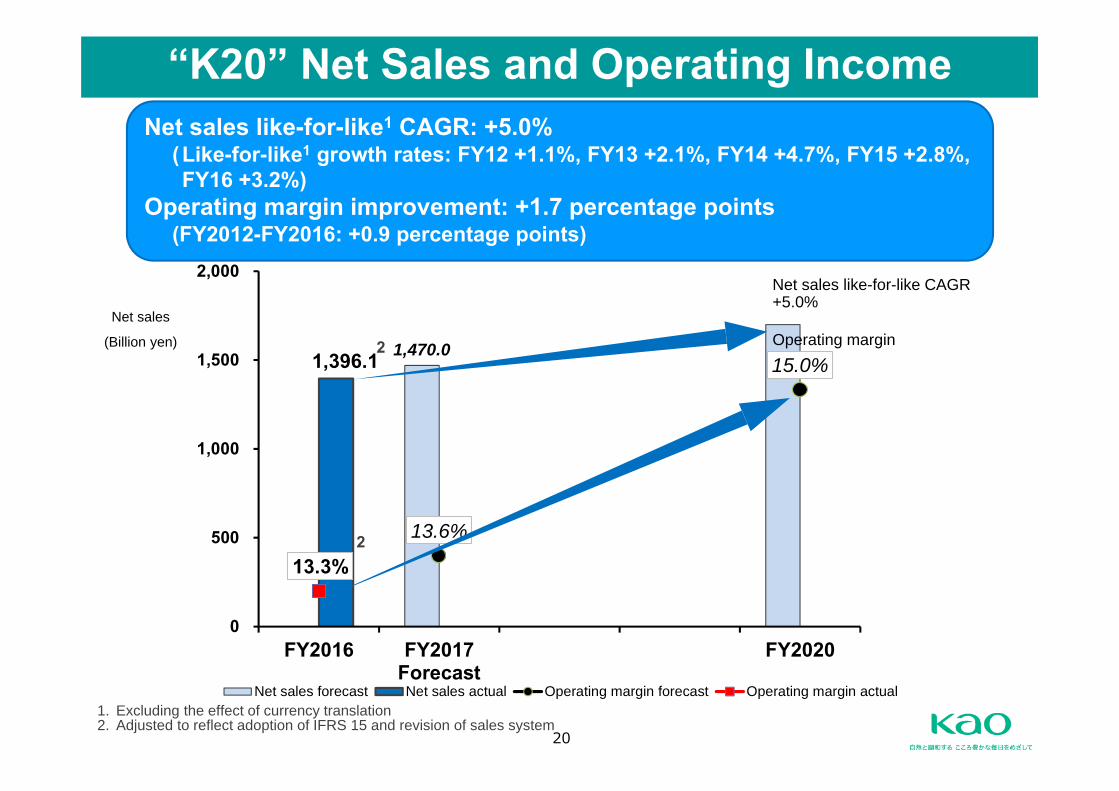
“K20” Net Sales and Operating Income
2
1. Excluding the effect of currency translation2. Adjusted to reflect adoption of IFRS 15 and revision of sales system
Net sales
(Billion yen) Operating margin
Net sales like-for-like1 CAGR: +5.0%(Like-for-like1 growth rates: FY12 +1.1%, FY13 +2.1%, FY14 +4.7%, FY15 +2.8%, FY16 +3.2%)
Operating margin improvement: +1.7 percentage points (FY2012-FY2016: +0.9 percentage points)
2
Net sales like-for-like CAGR+5.0%

21
2. Steady and continuous cash dividends(40% payout ratio target)
Use steadily generated cash flow effectively in order ofpriority shown below from an EVA standpoint toward further growth.
Use of Cash Flow* and Shareholder Returns
* Net cash flows from operating activities
1. Investment for future growth(capital expenditures, M&A, etc.)
3. Share repurchases and early repayment of interest-bearing debt including borrowings

22
Notches on shampoo bottle
ESG Initiatives to Enhance Corporate Value Development of easy-to-refill products to help achieve a recycling-oriented society.
Made efforts to spread this throughout the industry, contributing to reduction of plastic. Over the 20 years since 1995, the industry percentage of refill and replacement
containers1 rose from 10% to 79% Kao’s refill and replacement rate2 for 2016 is 84%
Started universal design in 1990 with bottles that distinguish shampoo from conditioner; applied to more than 90% of new and renewed products in 2016.3
Began offering a water-conserving category that includes single-rinse compact laundry detergent Attack Neo, dishwashing detergent with fast-rinsing foam CuCute, etc. Selected as an A List Company in the field of water for 2016 by CDP, a UK-based
nonprofit organization Ongoing promotion since 2012 of a “water-saving campaign” in cooperation with the Chinese
government to raise awareness of water conservation in China. First in Japan to introduce Forest Stewardship Council (FSC®)-certified corrugated
cardboard. Completed switch to FSC®-certified materials for 50% of new corrugated cardboard used by end of 2016.
Promotion of health management.Chosen for the “Health & Productivity Stock Selection” for the second consecutive
year in 2016 Compact Board of Directors for strengthened oversight function and ongoing discussions
from a medium-to-long-term perspective. Selected as one of the World‘s Most Ethical Companies for the tenth consecutive
year in 2016Notes:1. Industry percentage of refill and replacement containers: Announced by the Japan Soap and Detergent Association2. Refill and replacement rate: Percentage of sales volume of Kao refill and replacement products (unit basis) 3. Based on new and renewed products for consumers in Japan
23
Evaluations from External OrganizationsSelected as the Grand Prix Recipient of the 5th
Corporate Value Improvement Award by Tokyo Stock Exchange, Inc.
In recognition of the Kao Group’s efforts to continuously improve corporate value using management that factors in the cost of invested capital by incorporating EVA®* as the main management metric.
Selected as a winner of Corporate Governance of the Year® 2016 Prize
Japan Association of Corporate Directors established the prize to support greater management efficiency and mid- to long-term growth of corporations that operate in Japan by enhancing their corporate governance.
Received RobecoSAM Bronze Class 2017 distinction in the personal products industry
RobecoSAM evaluates the sustainability practices of leading global companies in terms of economic, environmental and social criteria and announces its assessment annually in the Sustainability Yearbook.* EVA® is a registered trademark of Stern Stewart & Co, a consulting company in the United States.

24
SRI Indexes and External CSR Evaluations
(As of February 2, 2017)
https://www.msci.com/esg-integration
SRI indexes for which Kao has been selected
CSR-related evaluations from external organizations
CSR: Corporate Social Responsibility SRI: Socially Responsible Investment

25
AppendicesAppendices

26
Fabric and Home Care FY2016 sales: ¥345.2 billion
ChemicalFY2016 sales: ¥273.8 billion
Beauty CareFY2016 sales: ¥601.6 billion
Human Health CareFY2016 sales: ¥273.1 billion
Business Segments and Main Product Categories
Consumerdriven
Consumerdriven
Laundry detergents and fabric treatmentsProducts for kitchen, bath, toilet and living room care
Oleo chemicalsPerformance chemicalsSpecialty chemicals
Note: Sales include intersegment sales. Like-for-like growth excludes the effect of currency translation. Share of net sales is calculated based on sales to customers.
Professional hair care productsCosmeticsSkin care (mass products)Hair care (mass products)
Consum
er Products B
usinessC
hemical B
usiness
Consum
er Products B
usiness
[Like-for-like growth: +2.9% / Share of net sales: 41.3%] [Like-for-like growth: +1.3% / Share of net sales: 18.7%]
[Like-for-like growth: +4.7% / Share of net sales: 23.7%] [Like-for-like growth: +2.5% / Share of net sales: 16.3%]
Consum
er Products B
usiness
BeveragesOral careBlood circulation enhancement products(incl. bath additives and thermal pads)Sanitary products
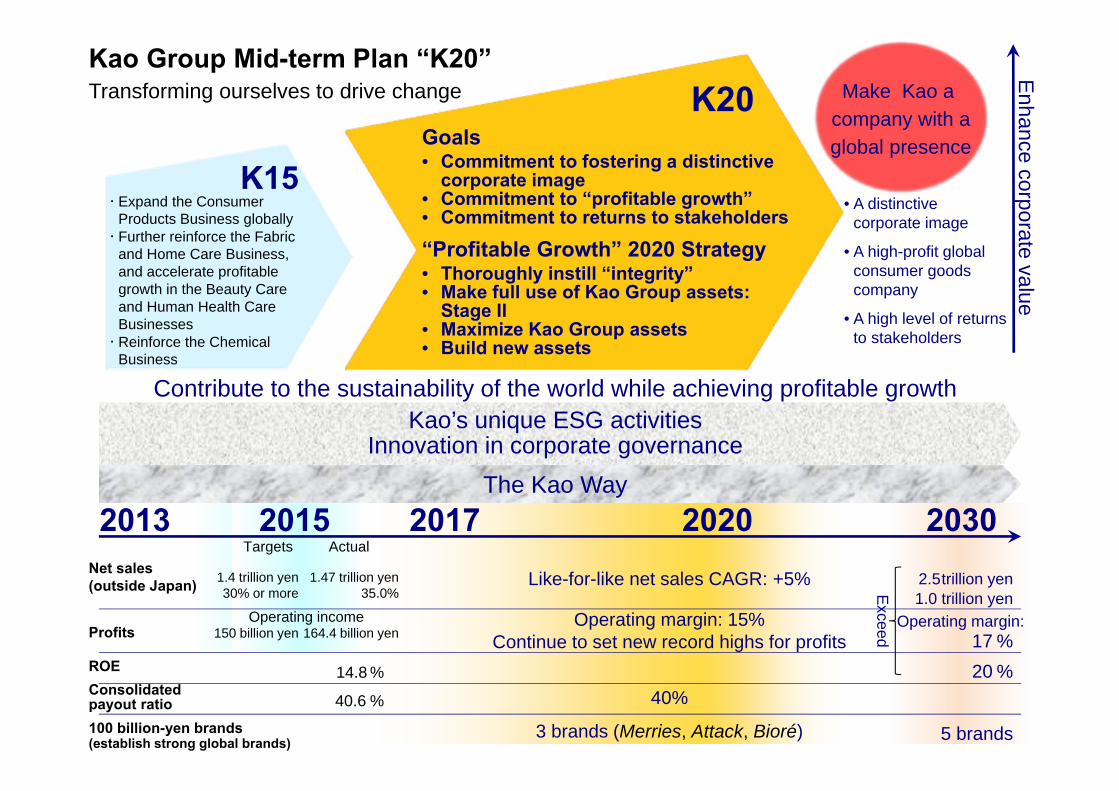
・ Expand the Consumer Products Business globally
・ Further reinforce the Fabric and Home Care Business, and accelerate profitable growth in the Beauty Care and Human Health Care Businesses
・ Reinforce the Chemical Business
K15
Make Kao a company with aglobal presence
K20
Kao’s unique ESG activitiesInnovation in corporate governance
Kao’s unique ESG activitiesInnovation in corporate governance
Contribute to the sustainability of the world while achieving profitable growth
Enhance corporate value
• A distinctive corporate image
• A high-profit global consumer goods company
• A high level of returns to stakeholders
Goals• Commitment to fostering a distinctive
corporate image• Commitment to “profitable growth”• Commitment to returns to stakeholders
“Profitable Growth” 2020 Strategy• Thoroughly instill “integrity”• Make full use of Kao Group assets:
Stage II• Maximize Kao Group assets• Build new assets
Kao Group Mid-term Plan “K20”Transforming ourselves to drive change
100 billion-yen brands(establish strong global brands)
Like-for-like net sales CAGR: +5%
Operating margin: 15%Continue to set new record highs for profits
40%
3 brands (Merries, Attack, Bioré)
2013 2015 2017 2020 20302.5trillion yen1.0 trillion yen
17 %20 %
5 brands
1.4 trillion yen30% or more
150 billion yen
14.8 %
40.6 %
Targets Actual
Operating income Operating margin:
The Kao WayThe Kao Way
Net sales(outside Japan)
Profits
ROEConsolidated payout ratio
1.47 trillion yen35.0%
164.4 billion yen
Exceed

28
Our Vision by 2030
Make Kao a company with a global presence
A distinctive corporate image A high-profit global consumer goods company
that exceeds:2.5 trillion yen in net sales (1.0 trillion yen outside Japan) 17% operating margin20% ROE
A high level of returns to stakeholders
“K20” is an important milestone toward achieving our vision by 2030.
29
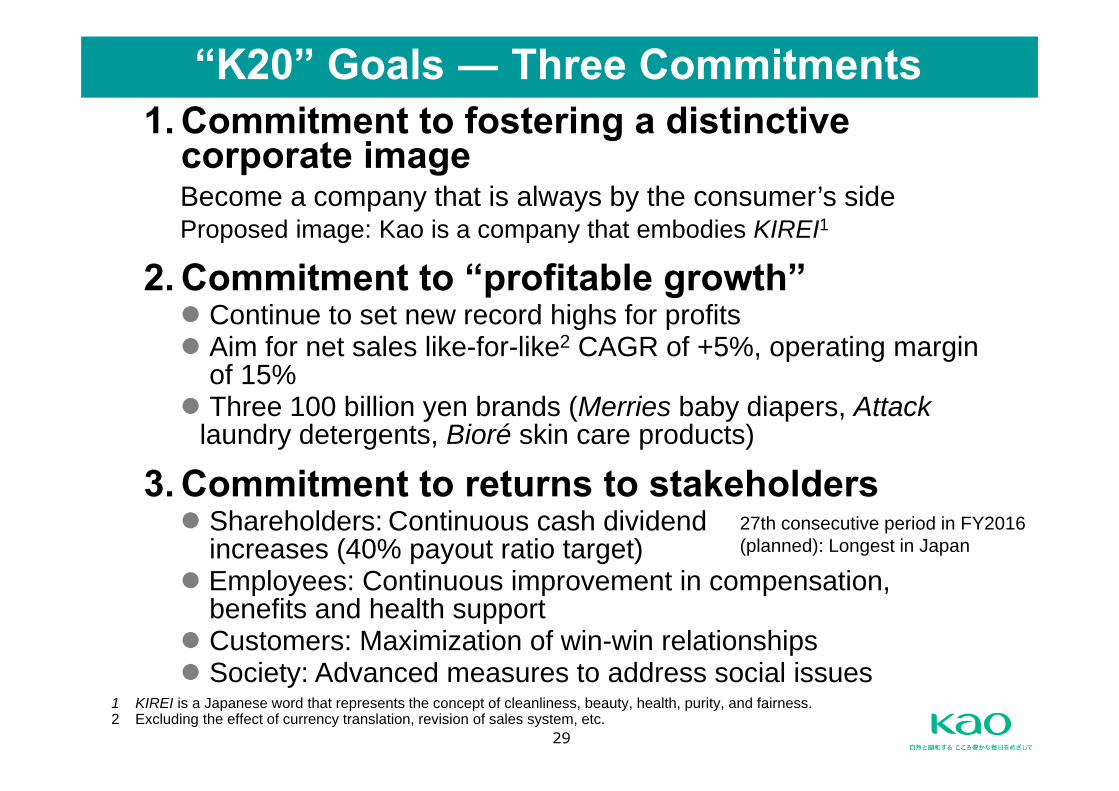
“K20” Goals ― Three Commitments1. Commitment to fostering a distinctive
corporate imageBecome a company that is always by the consumer’s sideProposed image: Kao is a company that embodies KIREI1
2. Commitment to “profitable growth” Continue to set new record highs for profits Aim for net sales like-for-like2 CAGR of +5%, operating margin
of 15% Three 100 billion yen brands (Merries baby diapers, Attack
laundry detergents, Bioré skin care products)
3. Commitment to returns to stakeholders Shareholders: Continuous cash dividend
increases (40% payout ratio target) Employees: Continuous improvement in compensation,
benefits and health support Customers: Maximization of win-win relationships Society: Advanced measures to address social issues
1 KIREI is a Japanese word that represents the concept of cleanliness, beauty, health, purity, and fairness.2 Excluding the effect of currency translation, revision of sales system, etc.
27th consecutive period in FY2016 (planned): Longest in Japan
30
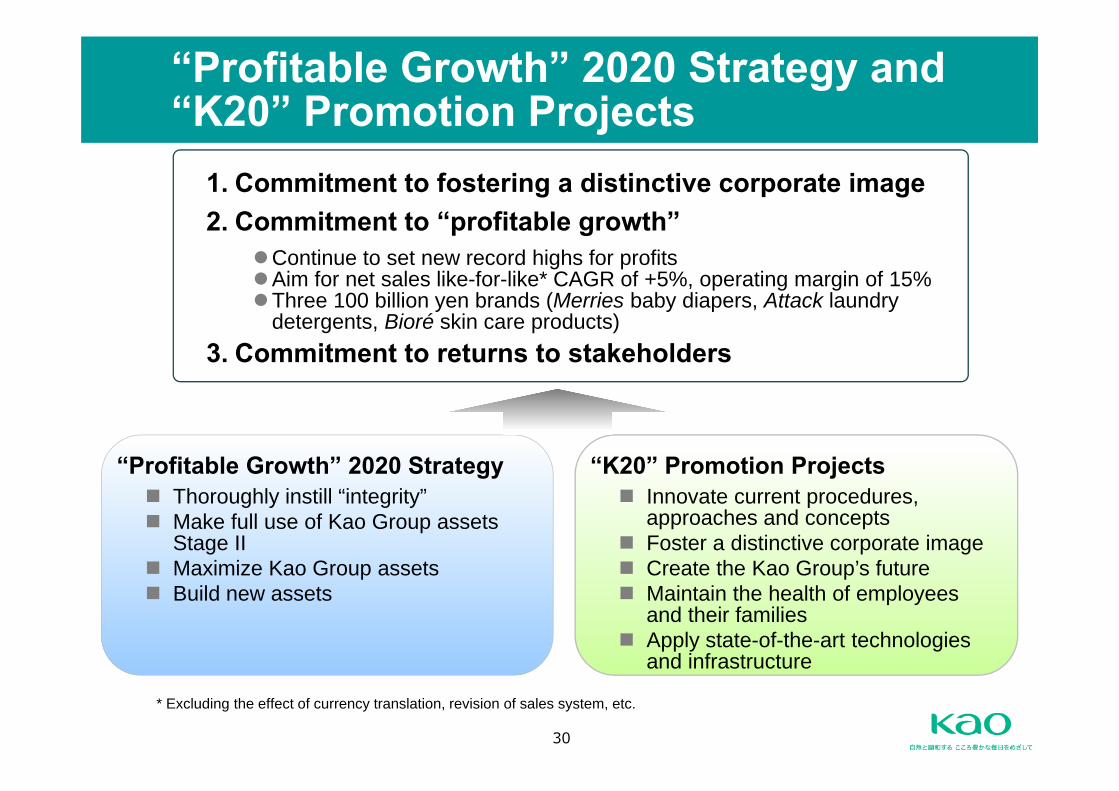
“Profitable Growth” 2020 Strategy and “K20” Promotion Projects
1. Commitment to fostering a distinctive corporate image2. Commitment to “profitable growth”
Continue to set new record highs for profitsAim for net sales like-for-like* CAGR of +5%, operating margin of 15%Three 100 billion yen brands (Merries baby diapers, Attack laundry
detergents, Bioré skin care products)3. Commitment to returns to stakeholders
“Profitable Growth” 2020 Strategy Thoroughly instill “integrity” Make full use of Kao Group assets
Stage II Maximize Kao Group assets Build new assets
“K20” Promotion Projects Innovate current procedures,
approaches and concepts Foster a distinctive corporate image Create the Kao Group’s future Maintain the health of employees
and their families Apply state-of-the-art technologies
and infrastructure
* Excluding the effect of currency translation, revision of sales system, etc.

31
“Profitable Growth” 2020 Strategy1. Thoroughly instill “integrity” Practice the Kao Way, the Kao Group’s corporate philosophy Maintain a high level of risk and crisis management and respond to
changes in ways such as thorough quality control, consumer consultations, compliance, etc.
2. Make full use of Kao Group assets Stage II Enhance and energize human capital Continuously strengthen high-margin businesses Expand the Consumer Products Business in Asia and increase its margin
3. Maximize Kao Group assets Make cosmetics a pillar of growth Achieve a high margin (10% operating margin) in the Consumer
Products Business in the Americas and Europe Accelerate development of high-value-added products in the Chemical
Business
4. Build new assets Create new businesses Re-enter the food business Acquire new assets through M&A

32
Financial DataFinancial Data
33
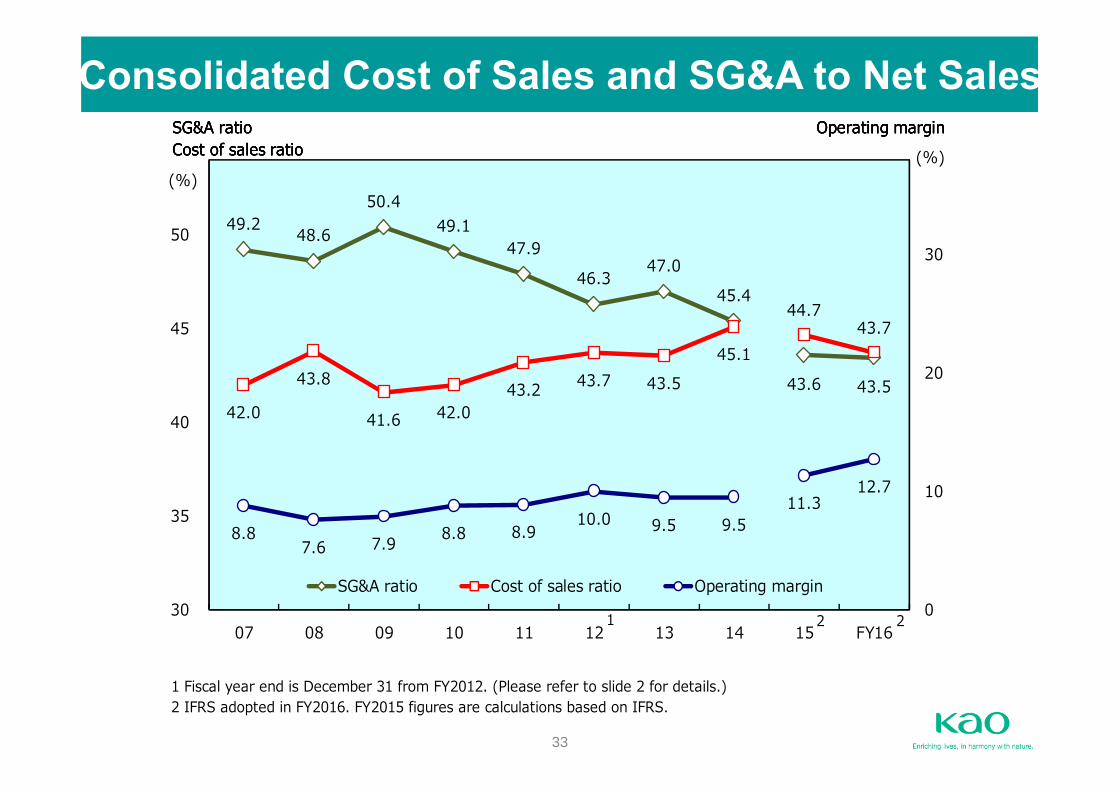
Consolidated Cost of Sales and SG&A to Net Sales
1 Fiscal year end is December 31 from FY2012. (Please refer to slide 2 for details.)2 IFRS adopted in FY2016. FY2015 figures are calculations based on IFRS.
49.2 48.6
50.4 49.1
47.9 46.3
47.0 45.4
43.6 43.5 42.0
43.8
41.6 42.0 43.2 43.7 43.5
45.1
44.7 43.7
8.8 7.6 7.9 8.8 8.9
10.0 9.5 9.5 11.3
12.7
0
10
20
30
30
35
40
45
50
07 08 09 10 11 12 13 14 15 FY16
(%)
SG&A ratio Cost of sales ratio Operating margin
Cost of sales ratioSG&A ratio Operating marginCost of sales ratioSG&A ratio Operating marginCost of sales ratioSG&A ratio Operating marginCost of sales ratioSG&A ratio Operating margin
(%)
2 21

34
(Billion yen) Changes Growth% of
Net sales% of
Net sales%
Japan Net sales 1,019.8 - 1,035.7 - 15.9 1.6 Operating income 127.8 12.5 145.1 14.0 17.4 13.6
Asia Net sales 284.8 - 281.5 - (3.3) (1.1)Operating income 20.9 7.3 22.8 8.1 2.0 9.5
Americas Net sales 137.8 - 124.7 - (13.2) (9.6)Operating income 7.8 5.6 7.2 5.8 (0.6) (7.4)
Europe Net sales 154.4 - 137.2 - (17.1) (11.1)Operating income 12.1 7.8 9.4 6.8 (2.7) (22.3)
Consolidated Net sales 1,474.6 - 1,457.6 - (16.9) (1.1)Operating income 167.3 11.3 185.6 12.7 18.3 10.9
FY2015 FY2016
* IFRS adopted in FY2016. FY2015 figures are calculations based on IFRS. Net sales and operating income by geographicarea are before elimination of transactions among geographic areas.
Consolidated Results by Geographic Area
35
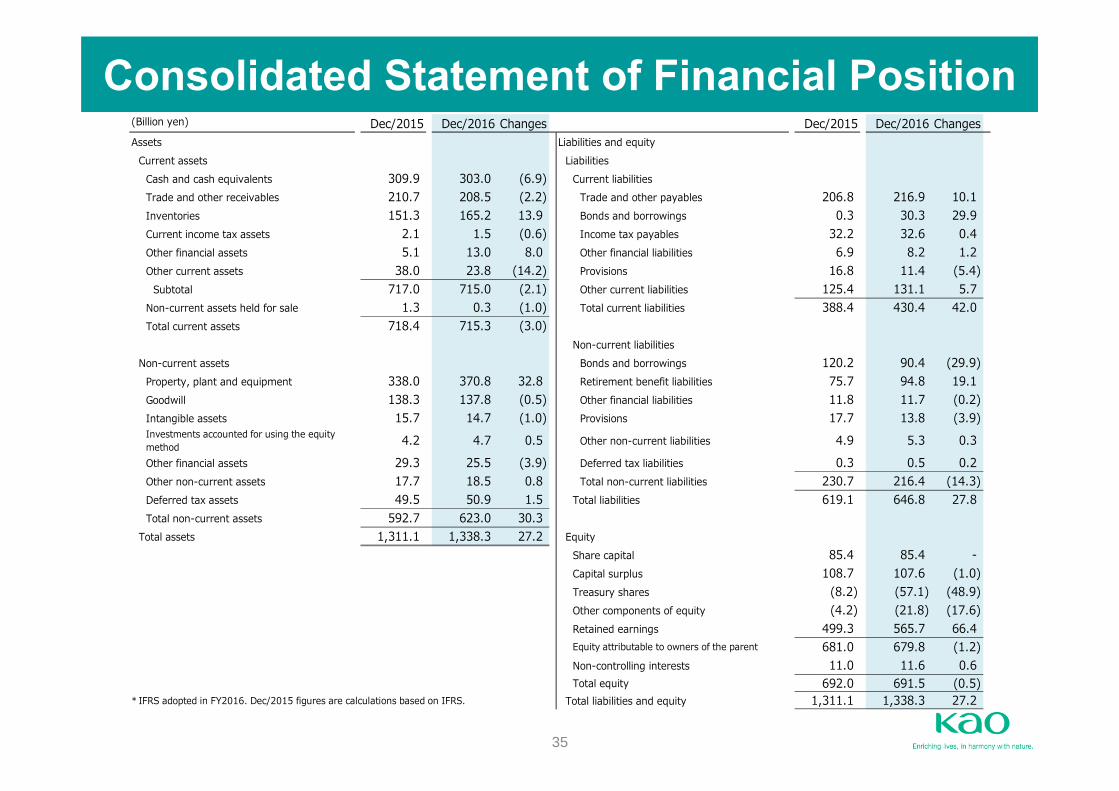
Consolidated Statement of Financial Position(Billion yen) Dec/2015 Dec/2016 Changes Dec/2015 Dec/2016 ChangesAssets Liabilities and equity
Current assets LiabilitiesCash and cash equivalents 309.9 303.0 (6.9) Current liabilitiesTrade and other receivables 210.7 208.5 (2.2) Trade and other payables 206.8 216.9 10.1 Inventories 151.3 165.2 13.9 Bonds and borrowings 0.3 30.3 29.9 Current income tax assets 2.1 1.5 (0.6) Income tax payables 32.2 32.6 0.4 Other financial assets 5.1 13.0 8.0 Other financial liabilities 6.9 8.2 1.2 Other current assets 38.0 23.8 (14.2) Provisions 16.8 11.4 (5.4)
Subtotal 717.0 715.0 (2.1) Other current liabilities 125.4 131.1 5.7 Non-current assets held for sale 1.3 0.3 (1.0) Total current liabilities 388.4 430.4 42.0 Total current assets 718.4 715.3 (3.0)
Non-current liabilitiesNon-current assets Bonds and borrowings 120.2 90.4 (29.9)
Property, plant and equipment 338.0 370.8 32.8 Retirement benefit liabilities 75.7 94.8 19.1 Goodwill 138.3 137.8 (0.5) Other financial liabilities 11.8 11.7 (0.2)Intangible assets 15.7 14.7 (1.0) Provisions 17.7 13.8 (3.9)
4.2 4.7 0.5 Other non-current liabilities 4.9 5.3 0.3 Other financial assets 29.3 25.5 (3.9) Deferred tax liabilities 0.3 0.5 0.2 Other non-current assets 17.7 18.5 0.8 Total non-current liabilities 230.7 216.4 (14.3)Deferred tax assets 49.5 50.9 1.5 Total liabilities 619.1 646.8 27.8 Total non-current assets 592.7 623.0 30.3
Total assets 1,311.1 1,338.3 27.2 EquityShare capital 85.4 85.4 - Capital surplus 108.7 107.6 (1.0)Treasury shares (8.2) (57.1) (48.9)Other components of equity (4.2) (21.8) (17.6)Retained earnings 499.3 565.7 66.4
681.0 679.8 (1.2)Non-controlling interests 11.0 11.6 0.6 Total equity 692.0 691.5 (0.5)
* IFRS adopted in FY2016. Dec/2015 figures are calculations based on IFRS. Total liabilities and equity 1,311.1 1,338.3 27.2
Investments accounted for using the equitymethod
Equity attributable to owners of the parent
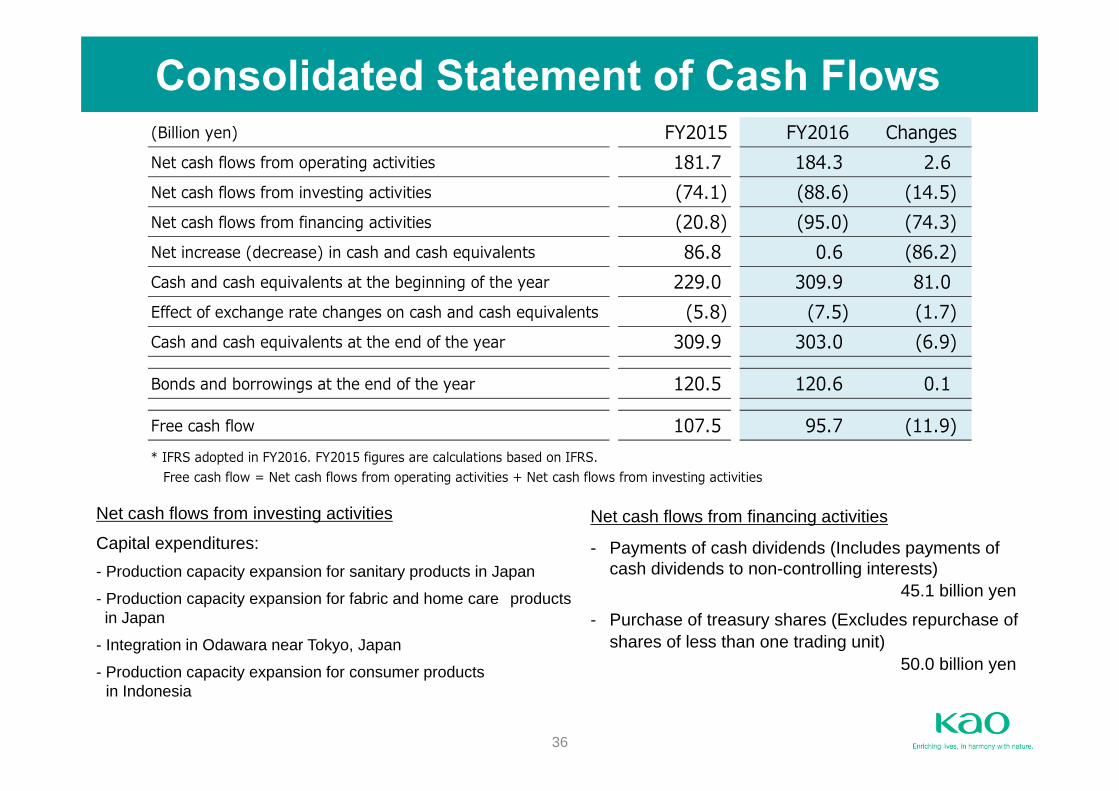
36
Net cash flows from investing activities
Capital expenditures:- Production capacity expansion for sanitary products in Japan
- Production capacity expansion for fabric and home care products in Japan
- Integration in Odawara near Tokyo, Japan
- Production capacity expansion for consumer products in Indonesia
Net cash flows from financing activities
- Payments of cash dividends (Includes payments ofcash dividends to non-controlling interests)
45.1 billion yen
- Purchase of treasury shares (Excludes repurchase of shares of less than one trading unit)
50.0 billion yen
Consolidated Statement of Cash Flows (Billion yen) FY2015 FY2016 Changes
181.7 184.3 2.6 (74.1) (88.6) (14.5)(20.8) (95.0) (74.3)86.8 0.6 (86.2)
229.0 309.9 81.0 (5.8) (7.5) (1.7)
309.9 303.0 (6.9)
120.5 120.6 0.1
107.5 95.7 (11.9)* IFRS adopted in FY2016. FY2015 figures are calculations based on IFRS. Free cash flow = Net cash flows from operating activities + Net cash flows from investing activities
Bonds and borrowings at the end of the year
Free cash flow
Cash and cash equivalents at the end of the year
Net cash flows from operating activities
Net cash flows from investing activities
Net cash flows from financing activities
Net increase (decrease) in cash and cash equivalents
Cash and cash equivalents at the beginning of the year
Effect of exchange rate changes on cash and cash equivalents

37
Share Repurchase
* Excludes repurchase of shares of less than one trading unit.Number of issued shares including treasury shares as of December 31, 2016 is 504.0 million shares.
10.0 10.0
19.9
29.1
16.0
27.3
2.0
9.3
13.9 10.0 11.5
8.9
0
10
20
30Million shares
Aggregate to168.0 Million shares
December, 2016
29.5 28.6
56.8
77.2
36.7
70.0
5.0
30.0 30.0 30.0
50.0 50.0
0
25
50
75
99 00 01 02 03 04 05 06 07 08 09 10 11 12 13 14 15 FY16
Billion yenAggregate to493.8 Billion yen
December, 2016
Num
ber of sharesPurchase price

38
(Billion yen)
FY2017 FY2017Actual Forecast Actual Forecast
Beauty Care 202.5 190.0 199.0 4.7 425.3 401.0 420.0 4.7
Human Health Care 103.6 100.3 101.0 0.7 215.3 208.5 219.0 5.0
Fabric & Home Care 133.8 129.5 134.0 3.5 302.3 291.9 298.0 2.1
Consumer Products Business 439.9 419.8 434.0 3.4 943.0 901.3 937.0 4.0
1 Revision of sales system for Consumer Products Business in Japan and early adoption of IFRS 15 planned from the fiscal year endingDecember 31, 2017. Amount calculated using the same standard for FY2016.2 Growth rate taking into account revision of sales system for Consumer Products Business in Japan and early adoption of IFRS 15 fromthe fiscal year ending December 31, 2017.
Growth%
1st Half Full yearFY2016FY2016 Growth
%
2 2
1 1
Sales Outlook for the Consumer Products Business in Japan - FY2017

39
1 Operating income before amortization of goodwill and intellectual property rights related to M&A.2 Fiscal year end is December 31 from FY2012. (Please refer to slide 2 for details.)3 IFRS adopted in FY2016. FY2015 figures are calculations based on IFRS. EBITA is not presented because amortizationof goodwill has been discontinued under IFRS.
1,216.1
1,012.6
1,315.2 1,401.7
1,474.6 1,457.6 1,470.0
142.2
125.7
154.8 162.1
108.6 101.6
124.7 133.3
167.3
185.6 200.0
0
100
200
0
500
1,000
1,500
11 12 13 14 15 16 FY17(F)
Net sales EBITA Operating income
Net sales EBITA
(Billion yen)
Operating incomeNet sales EBITA
Operating income(Billion yen)
11.7%12.4% 11.8% 11.6%
8.9%10.0% 9.5% 9.5%
11.3%12.7%
13.6%
EBITA margin Operating margin2 33
Consolidated Net Sales/EBITA1/Operating Income

40
*1 Fiscal year end is December 31 from FY2012. (Please refer to slide 2 for details.)*2 IFRS adopted in FY2016. FY2015 figures are calculations based on IFRS.
108.6 101.6 124.7 133.3
167.3 185.6
200.0
79.8 59.8
77.3 79.7
57.4 51.1
55.0
188.4
161.4
202.0 212.9
224.7 236.7
255.0
0
50
100
150
200
250
11 12 13 14 15 16 FY17(F)
Operating income Depreciation & amortization EBITDA
(Billion yen)
1 22
EBITDA

41
ROE & EPS1
Weighted average number ofshares outstanding (Millionshares)
536.1 536.0 533.0 521.9 521.8 513.9 508.7 501.4 501.4 499.4 499.4
Net income [J-GAAP] (Billionyen) 64.5 40.5 46.7 52.4 52.8 64.8 79.6 98.9 Net income, attributable toowners of the parent [IFRS](Billion yen)
105.2 126.6 138.0
1 Net income per share [J-GAAP] / Basic earnings per share [IFRS]2 Fiscal year end is December 31 from FY2012. (Please refer to slide 2 for details.)3 ROE of FY2012 are for the transitional period connected with the change in fiscal year end.4 IFRS adopted in FY2016. FY2015 figures are calculations based on IFRS.
11.5
7.3 8.5
9.8 9.4 10.7
12.4
14.8
16.1 18.6 19.1
120.3
75.6 87.7
100.5 101.1
126.0
156.5
197.2 209.8
253.4
280.0
0
50
100
150
200
250
300
0
5
10
15
20
08 09 10 11 12 13 14 15 15 16 FY17(F)
ROE EPS
(%)
23
ROE EPS (Yen)
44
42
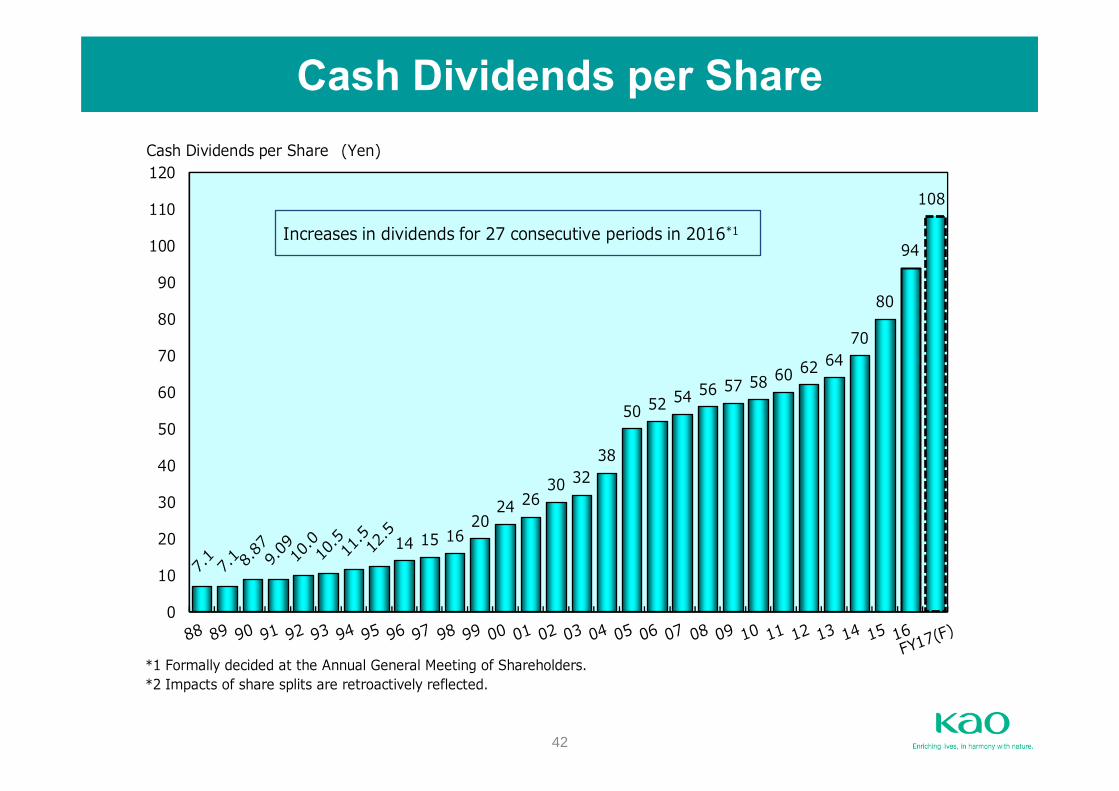
Cash Dividends per Share
*1 Formally decided at the Annual General Meeting of Shareholders.*2 Impacts of share splits are retroactively reflected.
14 15 16 20
24 26 30 32
38
50 52 54 56 57 58 60 62 64 70
80
94
108
0
10
20
30
40
50
60
70
80
90
100
110
120(Yen)Cash Dividends per Share
Increases in dividends for 27 consecutive periods in 2016*1
43
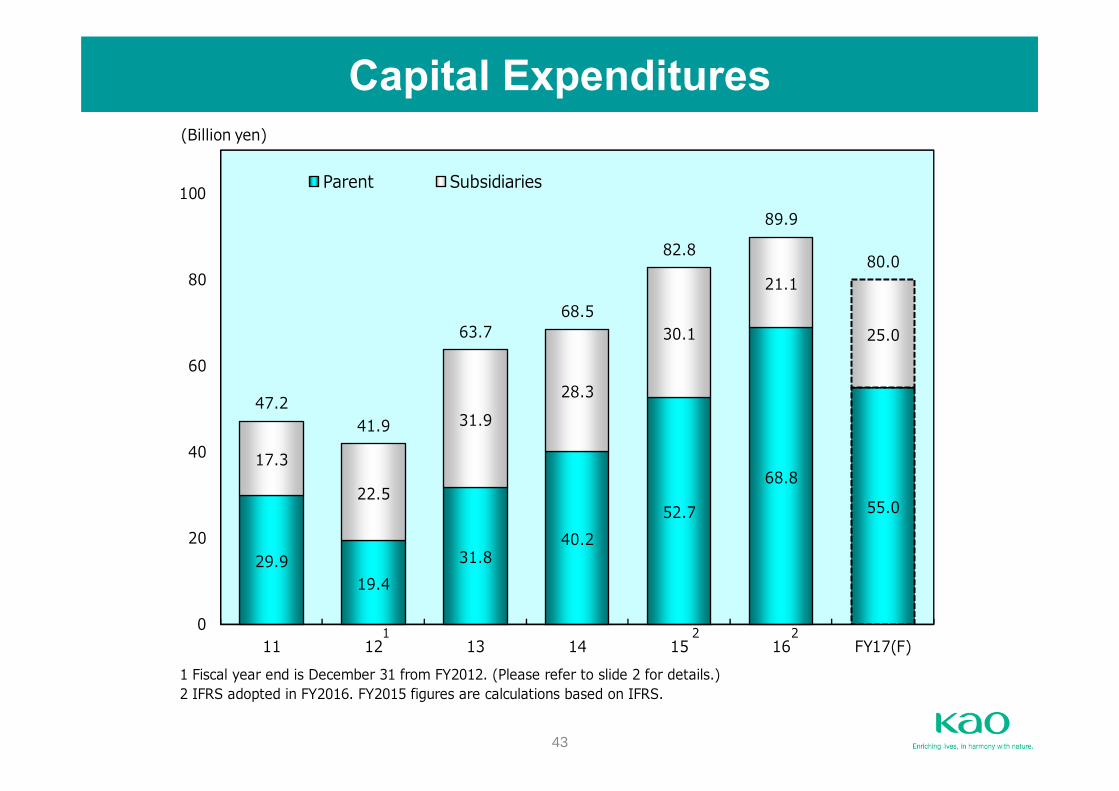
1 Fiscal year end is December 31 from FY2012. (Please refer to slide 2 for details.)2 IFRS adopted in FY2016. FY2015 figures are calculations based on IFRS.
29.9 19.4
31.8 40.2
52.7
68.8
55.0
17.3
22.5
31.9 28.3
30.1
21.1
25.0
47.2 41.9
63.7 68.5
82.8
89.9
80.0
0
20
40
60
80
100
11 12 13 14 15 16 FY17(F)
Parent Subsidiaries
(Billion yen)
1 22
Capital Expenditures


