47
KAP INDUSTRIAL HOLDINGS LIMITED AUDITED RESULTS FOR THE YEAR ENDED 30 JUNE 2019

KAP INDUSTRIAL
HOLDINGS LIMITEDAUDITED RESULTS FOR THE YEAR ENDED 30 JUNE 2019

INTEGRATED INTO EVERY DAY
INTRODUCTIONJAAP DU TOIT
CHAIRMAN

UNAUDITED INTERIM RESULTS FOR THE
SIX MONTHS ENDED 31 DECEMBER 2016
3
AGENDA
INTRODUCTION JAAP DU TOIT
STRATEGY IMPLEMENTATION GARY CHAPLIN
DIVISIONAL OPERATIONAL REVIEW GARY CHAPLIN
FINANCIAL ANALYSIS FRANS OLIVIER
OUTLOOK GARY CHAPLIN
Q&A GARY CHAPLIN / FRANS OLIVIER
AUDITED RESULTS FOR THE YEAR ENDED 30 JUNE 2019
INTEGRATED INTO EVERY DAY
STRATEGY IMPLEMENTATIONGARY CHAPLIN
CHIEF EXECUTIVE OFFICER
5
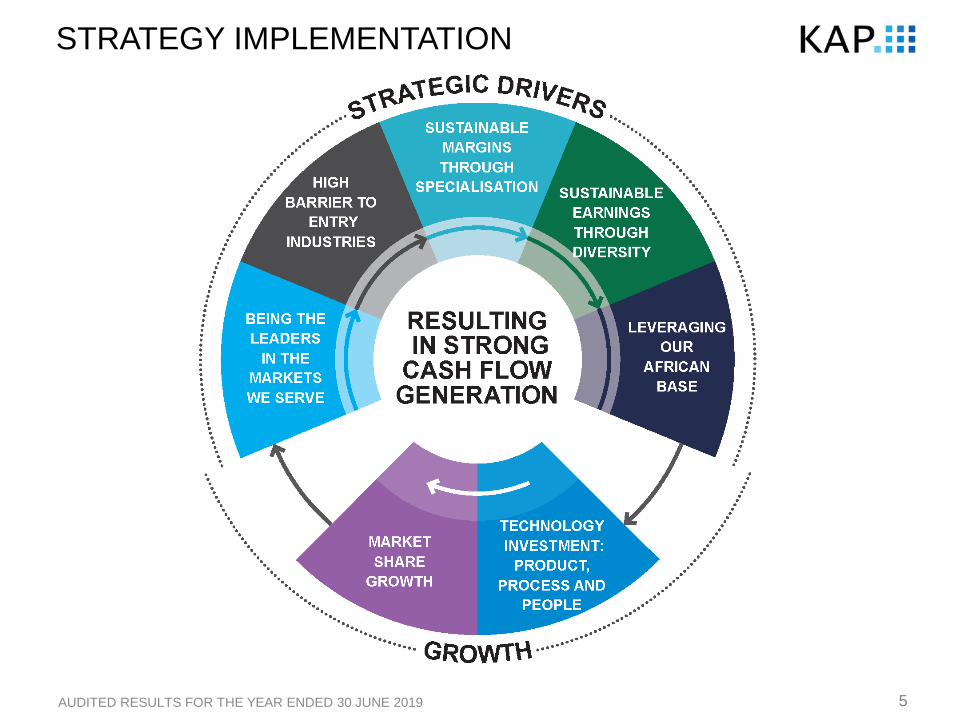
STRATEGY IMPLEMENTATION
AUDITED RESULTS FOR THE YEAR ENDED 30 JUNE 2019

6AUDITED RESULTS FOR THE YEAR ENDED 30 JUNE 2019
0
5 000
10 000
15 000
20 000
25 000
30 000
2014 2015 2016 2017 2018 2019
0
10
20
30
40
50
60
70
2014 2015 2016 2017 2018 2019
0
1 000
2 000
3 000
2014 2015 2016 2017 2018 2019
0
10
20
30
2014 2015 2016 2017 2018 2019
REVENUE (Rm) – CAGR* 12% OPERATING PROFIT (Rm) – CAGR* 13%
HEPS (cents) – CAGR* 9% DPS (cents) – CAGR* 14%
STRATEGY IMPLEMENTATION
FIVE-YEAR COMPOUND ANNUAL GROWTH AS A RESULT OF ORGANIC EXPANSION AND ACQUISITION OF COMPLEMENTARY BUSINESSES
* Compound annual growth rate of continuing operations, excluding the non-recurring, non-cash impact of the Unitrans B-BBEE transaction.

7AUDITED RESULTS FOR THE YEAR ENDED 30 JUNE 2019
STRATEGY IMPLEMENTATION: F2019 FOCUS
• Multiple projects embarked on and acquisitions concluded in recent years
• R7.8 billion invested in 24 months to 30 June 2018
• Good execution record, with the exception of Safripol (Durban) expansion
• Focus for F2019 was on:
• Final implementation of various expansion projects
• Final integration of various acquisitions
• Extraction of value from capital invested
• Strong cash generation to reduce gearing
• Market share growth
• ESG
• Responsible approach in the context of a challenging economic environment
• F2019 focus extended to include the rationalisation of non-performing operations

8
FTSE4GOOD ESG RATING
STRATEGY IMPLEMENTATION: F2019 FOCUS
AUDITED RESULTS FOR THE YEAR ENDED 30 JUNE 2019
0
1
2
3
4
5
ESG rating Environment Social Governance
KAP
SUB-SECTOR AVERAGE – DIVERSIFIED INDUSTRIALS
INDUSTRY AVERAGE – INDUSTRIALS
3.0
2.32.4
2.6
1.9 1.9
2.5
1.92.1
4.3
3.4 3.4

INTEGRATED INTO EVERY DAY
GARY CHAPLIN
CHIEF EXECUTIVE OFFICER
DIVISIONAL OPERATIONAL REVIEW

10
DIVISIONAL OPERATIONAL REVIEW
AUDITED RESULTS FOR THE YEAR ENDED 30 JUNE 2019
REVENUE* OPERATING PROFIT* TOTAL ASSETS
DIVERSIFIED INDUSTRIAL 30%
34%DIVERSIFIED CHEMICAL
DIVERSIFIED LOGISTICS 36%
DIVERSIFIED INDUSTRIAL 48%
28%DIVERSIFIED CHEMICAL
DIVERSIFIED LOGISTICS 24%
DIVERSIFIED INDUSTRIAL 37%
34%DIVERSIFIED CHEMICAL
DIVERSIFIED LOGISTICS 29%
* From continuing operations, excluding the non-recurring, non-cash impact of the Unitrans B-BBEE transaction.
GROUP SEGMENTAL ANALYSIS

11
REVENUE
12%
OPERATING
PROFIT
FLAT
INTEGRATED TIMBER
AUDITED RESULTS FOR THE YEAR ENDED 30 JUNE 2019
• Panel products business performed well
• Recent technology upgrades and expansions operated ahead of expectation,
thereby facilitating production and sales volume growth
• Maintenance shuts delayed to coincide with F2020 plant upgrades
• Export sales supported increased production volumes
• Value-add ratio increased to 58% (FY18: 55%), thereby improving R/m3 profit
• Resin operations performed well with increased volume and improved sales mix
• R68 million operating profit impact of recent fires on plantation, sawmill
and pole operations
• Recovery operations in relation to June 2017 plantation fires completed; recovery
operations in relation to November 2018 fires due for completion by December 2019
12
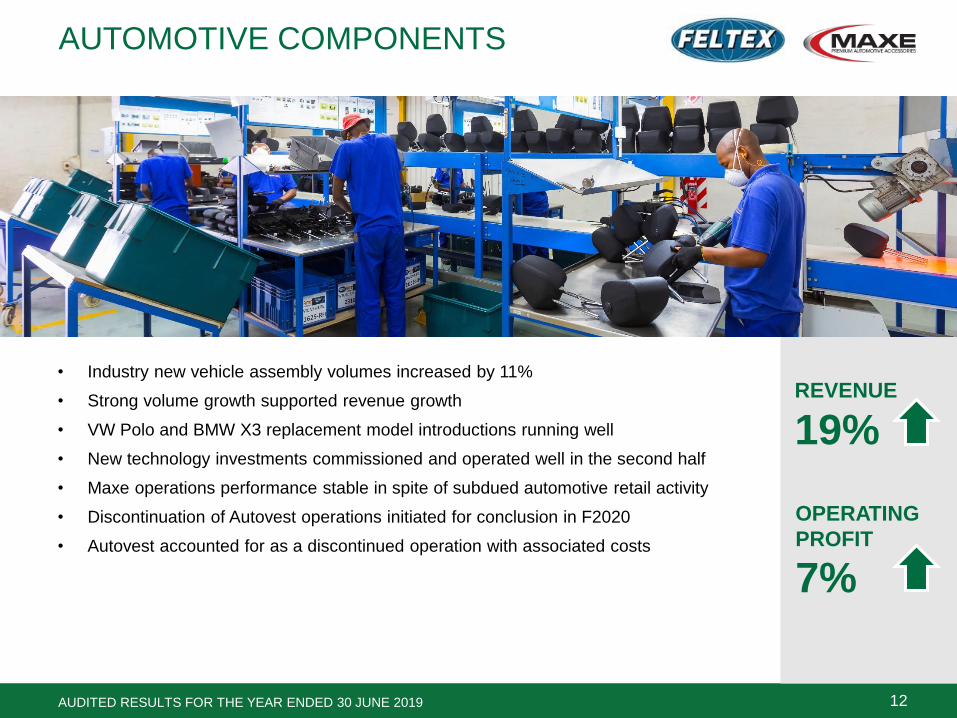
AUTOMOTIVE COMPONENTS
AUDITED RESULTS FOR THE YEAR ENDED 30 JUNE 2019
REVENUE
19%
OPERATING
PROFIT
7%
• Industry new vehicle assembly volumes increased by 11%
• Strong volume growth supported revenue growth
• VW Polo and BMW X3 replacement model introductions running well
• New technology investments commissioned and operated well in the second half
• Maxe operations performance stable in spite of subdued automotive retail activity
• Discontinuation of Autovest operations initiated for conclusion in F2020
• Autovest accounted for as a discontinued operation with associated costs
13
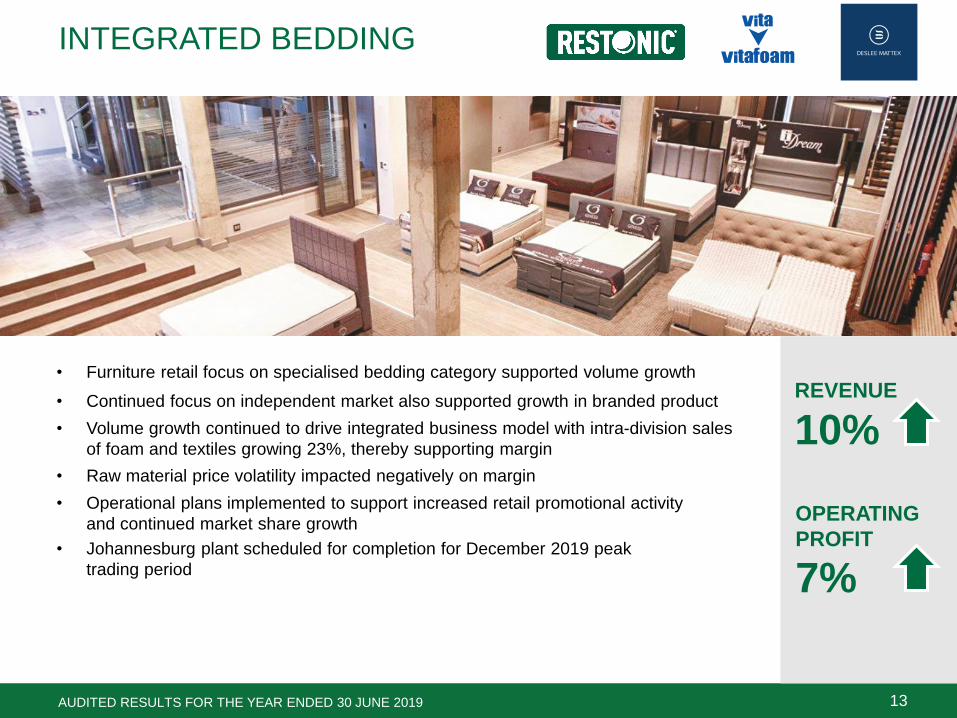
INTEGRATED BEDDING
AUDITED RESULTS FOR THE YEAR ENDED 30 JUNE 2019
REVENUE
10%
OPERATING
PROFIT
7%
• Furniture retail focus on specialised bedding category supported volume growth
• Continued focus on independent market also supported growth in branded product
• Volume growth continued to drive integrated business model with intra-division sales
of foam and textiles growing 23%, thereby supporting margin
• Raw material price volatility impacted negatively on margin
• Operational plans implemented to support increased retail promotional activity
and continued market share growth
• Johannesburg plant scheduled for completion for December 2019 peak
trading period

14
PET – 43%
HDPE – 33%
PP – 24%
UF RELATED – 19%
REVENUE
POLYMERS
AUDITED RESULTS FOR THE YEAR ENDED 30 JUNE 2019
VOLUMES
PET – 43%
HDPE – 33%
PP – 24%
UF RELATED – 19%
15
POLYMERS
AUDITED RESULTS FOR THE YEAR ENDED 30 JUNE 2019
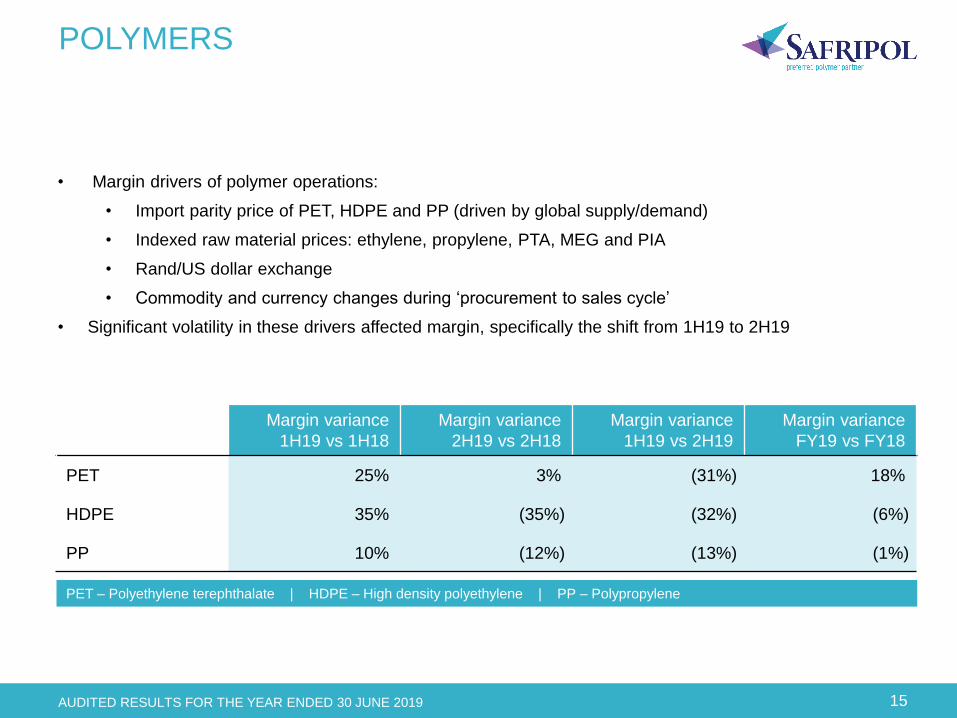
• Margin drivers of polymer operations:
• Import parity price of PET, HDPE and PP (driven by global supply/demand)
• Indexed raw material prices: ethylene, propylene, PTA, MEG and PIA
• Rand/US dollar exchange
• Commodity and currency changes during ‘procurement to sales cycle’
• Significant volatility in these drivers affected margin, specifically the shift from 1H19 to 2H19
Margin variance
1H19 vs 1H18
Margin variance
2H19 vs 2H18
Margin variance
1H19 vs 2H19
Margin variance
FY19 vs FY18
PET 25% 3% (31%) 18%
HDPE 35% (35%) (32%) (6%)
PP 10% (12%) (13%) (1%)
PET – Polyethylene terephthalate | HDPE – High density polyethylene | PP – Polypropylene
16
POLYMERS
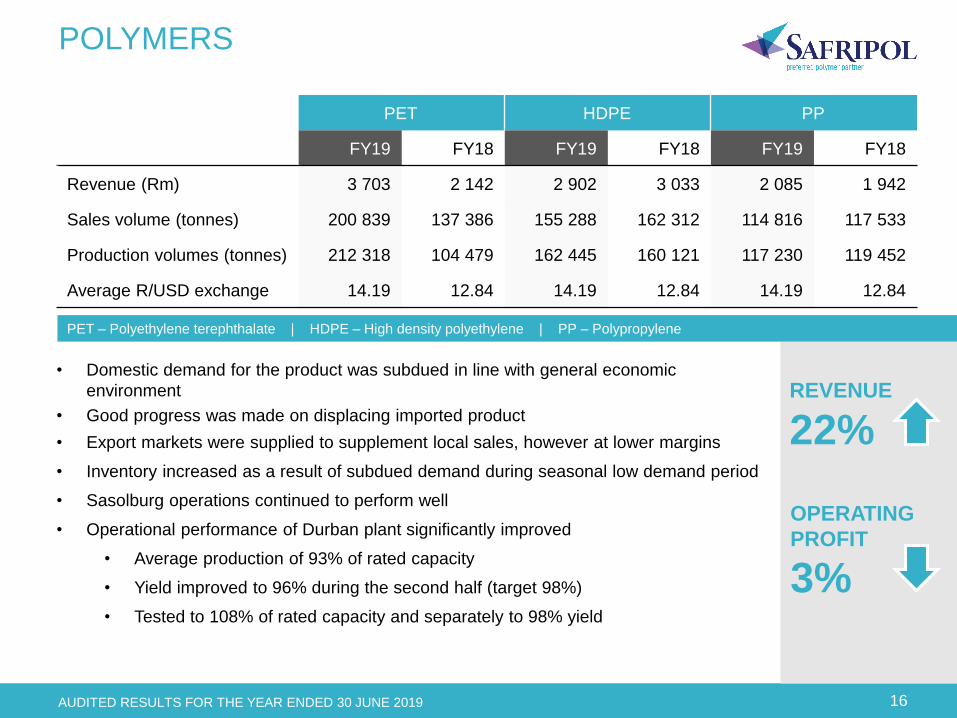
REVENUE
22%
OPERATING
PROFIT
3%
• Domestic demand for the product was subdued in line with general economic
environment
• Good progress was made on displacing imported product
• Export markets were supplied to supplement local sales, however at lower margins
• Inventory increased as a result of subdued demand during seasonal low demand period
• Sasolburg operations continued to perform well
• Operational performance of Durban plant significantly improved
• Average production of 93% of rated capacity
• Yield improved to 96% during the second half (target 98%)
• Tested to 108% of rated capacity and separately to 98% yield
AUDITED RESULTS FOR THE YEAR ENDED 30 JUNE 2019
PET HDPE PP
FY19 FY18 FY19 FY18 FY19 FY18
Revenue (Rm) 3 703 2 142 2 902 3 033 2 085 1 942
Sales volume (tonnes) 200 839 137 386 155 288 162 312 114 816 117 533
Production volumes (tonnes) 212 318 104 479 162 445 160 121 117 230 119 452
Average R/USD exchange 14.19 12.84 14.19 12.84 14.19 12.84
PET – Polyethylene terephthalate | HDPE – High density polyethylene | PP – Polypropylene

17
CONTRACTUAL LOGISTICS – SOUTH AFRICA
DIVERSE REVENUE BASE
AUDITED RESULTS FOR THE YEAR ENDED 30 JUNE 2019
FOOD – 27%
GENERAL FREIGHT – 25%
PETROLEUM – 21%
CEMENT – 13%
CHEMICALS – 9%
MINING – 5%
REVENUE
• 45% of division sold effective 3 September 2018 in B-BBEE transaction and successfully implemented
• New executive management structure implemented effective 1 December 2018
• South African operations now independently managed from rest of Africa operations
• Full operational and support structures rationalised and fully accounted for at 30 June 2019
• Balance sheet review completed with no material impact

18
CONTRACTUAL LOGISTICS – SOUTH AFRICA
AUDITED RESULTS FOR THE YEAR ENDED 30 JUNE 2019
REVENUE
4%
OPERATING
PROFIT*
49%
* Excluding B-BBEE cost
• Trading environment extremely challenging
• Revenue inflated by cost recoveries (fuel, wages, tyres, etc.)
• Volume and margin pressure in all areas, a reflection of subdued economic activity
• Petroleum, Mining and General Freight and Warehousing businesses remained stable
• Cement and Chemicals business negatively impacted by lower customer volumes
• Food business materially impacted by a contractual dispute on a major contract
and subdued activity in the poultry sector
• R50 million impact of non-trading provision for onerous contract
• Annualised revenue of renewals – R913 million
• Annualised revenue of new contracts – R426 million
• Annualised revenue of contracts lost – R86 million
19
CONTRACTUAL LOGISTICS – AFRICA
DIVERSE REVENUE BASE
AUDITED RESULTS FOR THE YEAR ENDED 30 JUNE 2019
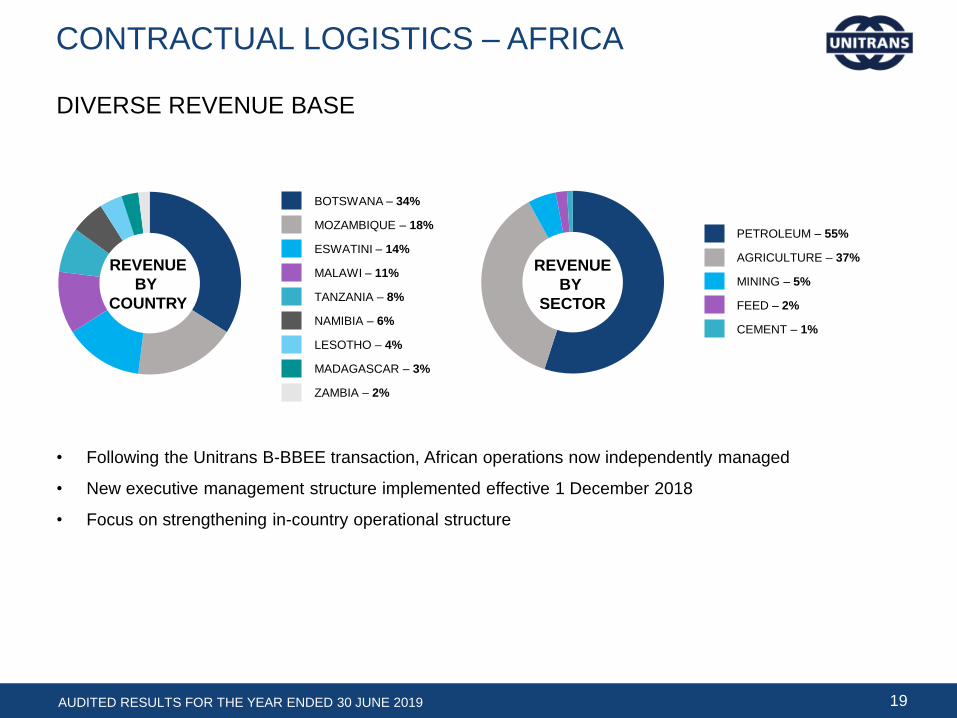
BOTSWANA – 34%
MOZAMBIQUE – 18%
ESWATINI – 14%
MALAWI – 11%
TANZANIA – 8%
NAMIBIA – 6%
LESOTHO – 4%
MADAGASCAR – 3%
ZAMBIA – 2%
PETROLEUM – 55%
AGRICULTURE – 37%
MINING – 5%
FEED – 2%
CEMENT – 1%
REVENUE
BY
COUNTRY
REVENUE
BY
SECTOR
• Following the Unitrans B-BBEE transaction, African operations now independently managed
• New executive management structure implemented effective 1 December 2018
• Focus on strengthening in-country operational structure

20
CONTRACTUAL LOGISTICS – AFRICA
AUDITED RESULTS FOR THE YEAR ENDED 30 JUNE 2019
REVENUE
10%
OPERATING
PROFIT
6%
• Core business currently Petroleum and Agriculture
• Volumes and margins were stable for the year
• Cyclone Idai impacted negatively on Beira operations, however, successfully mitigated
by management interventions and insurance
• No significant year-on-year seasonal impacts
• Cost escalations successfully recovered
• Margin pressure on contract renewals
• Focus on expanding operations in existing territories
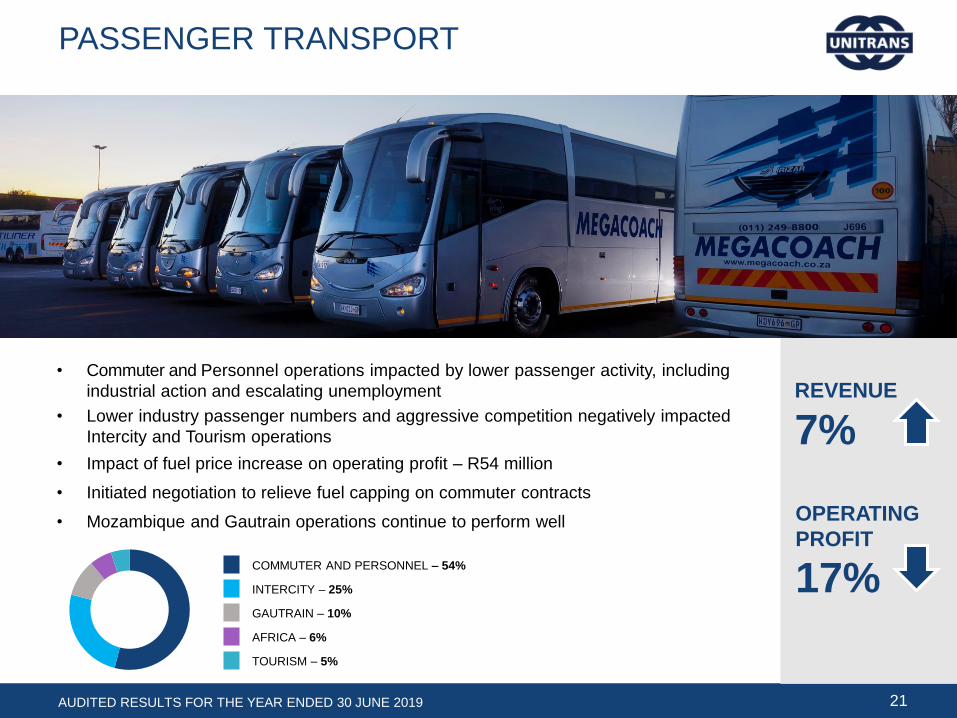
COMMUTER AND PERSONNEL – 54%
INTERCITY – 25%
GAUTRAIN – 10%
AFRICA – 6%
TOURISM – 5%
21
PASSENGER TRANSPORT
AUDITED RESULTS FOR THE YEAR ENDED 30 JUNE 2019
REVENUE
7%
OPERATING
PROFIT
17%
• Commuter and Personnel operations impacted by lower passenger activity, including
industrial action and escalating unemployment
• Lower industry passenger numbers and aggressive competition negatively impacted
Intercity and Tourism operations
• Impact of fuel price increase on operating profit – R54 million
• Initiated negotiation to relieve fuel capping on commuter contracts
• Mozambique and Gautrain operations continue to perform well

22
DIVISIONAL OPERATIONAL REVIEW
GROUP REVENUE ANALYSIS
AUDITED RESULTS FOR THE YEAR ENDED 30 JUNE 2019
0
1 000
2 000
3 000
4 000
5 000
6 000
FY18 IntegratedTimber
AutomotiveComponents
IntegratedBedding
Polymers ContractualLogistics SA
ContractualLogistics Africa
PassengerTransport
FY19
(Rm)
22 813
25 602
12%
10%
22%4%
10%
19%
Stable10% 79%
7%
ChemicalIndustrial Logistics
22%13% 5%
From continuing operations, excluding the non-recurring, non-cash impact of the Unitrans B-BBEE transaction.
Comparative segmental information restated for the move of the group’s resin business from chemical to industrial.

0
100
200
300
400
500
600
700
800
900
FY18 IntegratedTimber
AutomotiveComponents
IntegratedBedding
Polymers ContractualLogistics SA
ContractualLogistics Africa
PassengerTransport
FY19
2 901
2 723
–7% (3%)
6%
7% (49%)
(17%)
DIVISIONAL OPERATIONAL REVIEW
GROUP OPERATING PROFIT ANALYSIS
23AUDITED RESULTS FOR THE YEAR ENDED 30 JUNE 2019
ChemicalIndustrial Logistics
(3%)2% (21%)
(Rm)
From continuing operations, excluding the non-recurring, non-cash impact of the Unitrans B-BBEE transaction.
Comparative segmental information restated for the move of the group’s resin business from chemical to industrial.
UNAUDITED INTERIM RESULTS FOR THE
SIX MONTHS ENDED 31 DECEMBER 2016
Op
era
tin
g m
arg
in (
%)
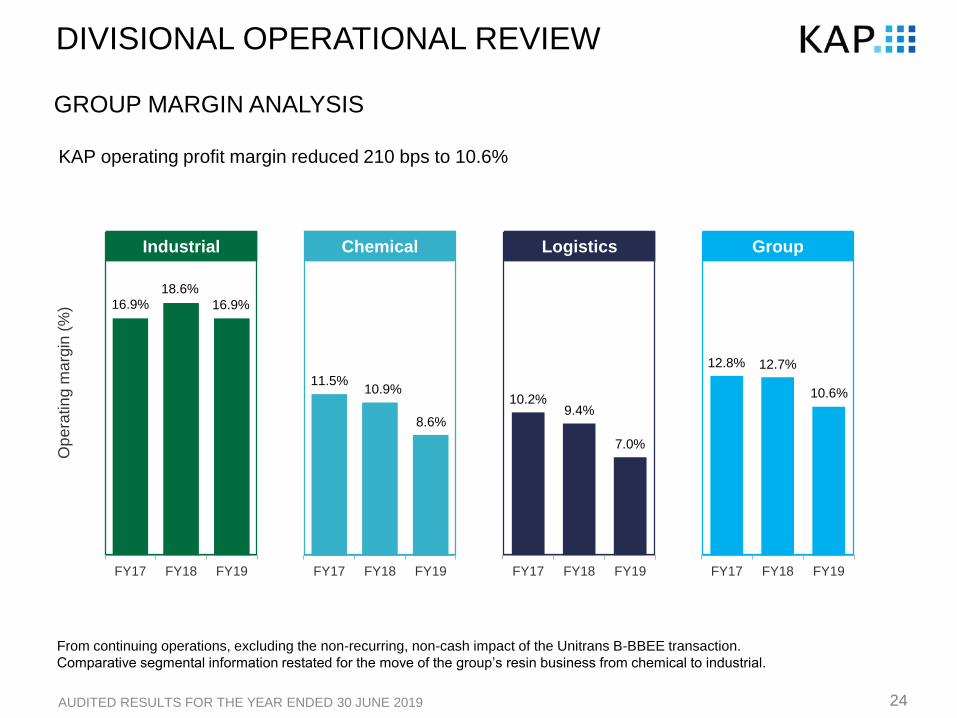
KAP operating profit margin reduced 210 bps to 10.6%
GROUP MARGIN ANALYSIS
24AUDITED RESULTS FOR THE YEAR ENDED 30 JUNE 2019
FY17 FY18 FY19 FY17 FY18 FY19
Chemical
8.6%
10.9%11.5%
Industrial
18.6%
16.9%16.9%
Logistics
FY17 FY18 FY19
9.4%
7.0%
10.2%
12.3%
FY17 FY18 FY19
Group
12.7%
10.6%
12.8%
DIVISIONAL OPERATIONAL REVIEW
From continuing operations, excluding the non-recurring, non-cash impact of the Unitrans B-BBEE transaction.
Comparative segmental information restated for the move of the group’s resin business from chemical to industrial.
INTEGRATED INTO EVERY DAY
FINANCIAL ANALYSISFRANS OLIVIER
CHIEF FINANCIAL OFFICER

UNAUDITED INTERIM RESULTS FOR THE
SIX MONTHS ENDED 31 DECEMBER 2016
26
FINANCIAL HIGHLIGHTS
Results from continuing operations FY19 FY18 Variance
Revenue (Rm) 25 602 22 813 12%
EBITDA before B-BBEE cost (Rm) 3 909 3 944 1%
Operating profit before B-BBEE cost and capital items (Rm) 2 723 2 901 6%
Core headline earnings per share (cents)* 53.2 61.6 14%
Cash generated from operations (Rm) 4 033 3 308 22%
Dividend per share (cents) 23 23 Stable
Net asset value per share (cents) 474 454 4%
* Excluding the non-recurring, non-cash impact of the Unitrans B-BBEE transaction.
STRATEGY IMPLEMENTATION PRODUCES STABLE EBITDA* WITH STRONG CASH CONVERSION
AUDITED RESULTS FOR THE YEAR ENDED 30 JUNE 2019

• Achieve > 51% ‘black’ and > 30% ‘black women’ ownership in South African logistics business
• Minimise dilution to shareholders
• Equity interest sold at market value, taking into account peer multiples
• Funding provided at market rates
• Ensure compliance with B-BBEE Commission requirements
• Ensure a sustainable scheme to create value for B-BBEE shareholders
• Ensure sustainable growth of South African logistics business
27AUDITED RESULTS FOR THE YEAR ENDED 30 JUNE 2019
FINANCIAL ANALYSIS
UNITRANS B-BBEE TRANSACTION OBJECTIVES
UNAUDITED INTERIM RESULTS FOR THE
SIX MONTHS ENDED 31 DECEMBER 2016
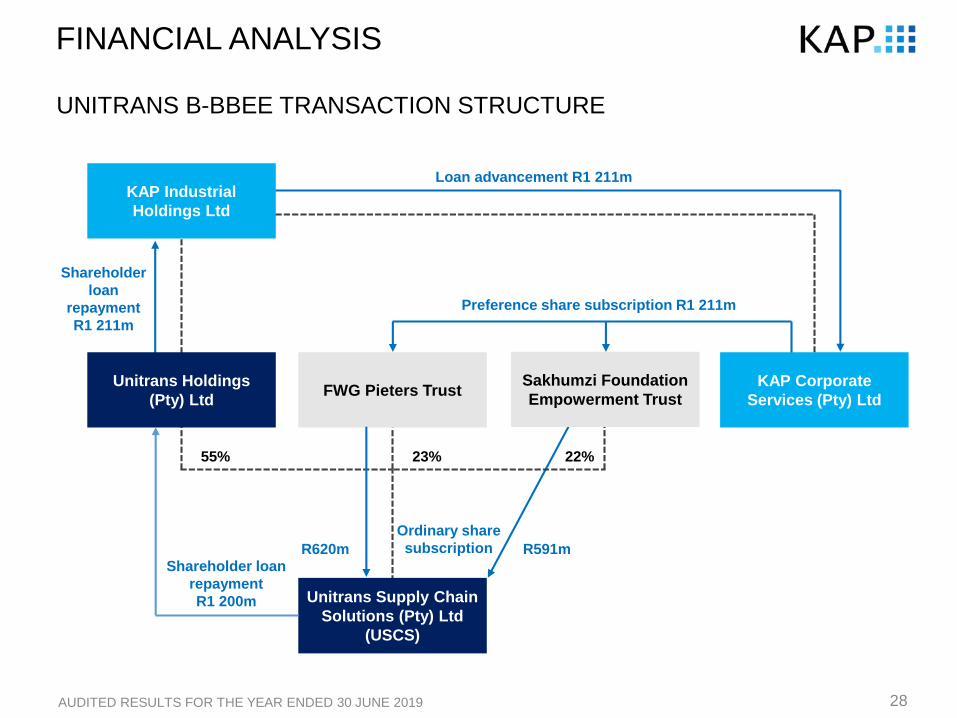
FINANCIAL ANALYSIS
UNITRANS B-BBEE TRANSACTION STRUCTURE
AUDITED RESULTS FOR THE YEAR ENDED 30 JUNE 2019 28
Unitrans Holdings
(Pty) LtdFWG Pieters Trust
KAP Industrial
Holdings Ltd
KAP Corporate
Services (Pty) Ltd
Unitrans Supply Chain
Solutions (Pty) Ltd
(USCS)
Loan advancement R1 211m
Shareholder
loan
repayment
R1 211m
55%
Shareholder loan
repayment
R1 200m
Preference share subscription R1 211m
Sakhumzi Foundation
Empowerment Trust
R620m R591m
Ordinary share
subscription
22%23%
UNAUDITED INTERIM RESULTS FOR THE
SIX MONTHS ENDED 31 DECEMBER 2016
29
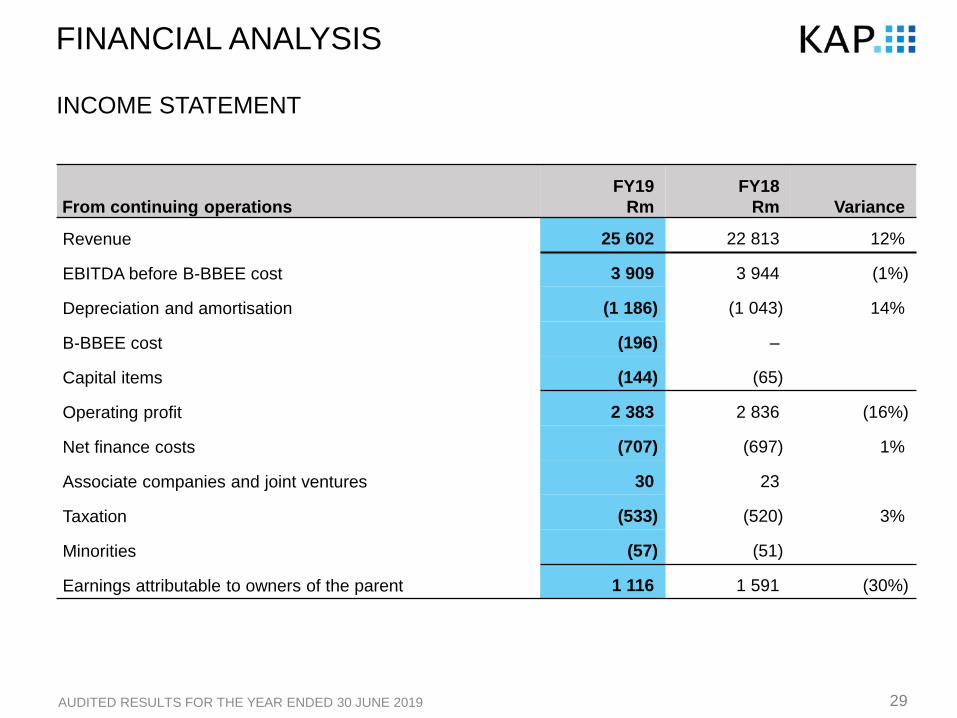
From continuing operations
FY19
Rm
FY18
Rm Variance
Revenue 25 602 22 813 12%
EBITDA before B-BBEE cost 3 909 3 944 (1%)
Depreciation and amortisation (1 186) (1 043) 14%
B-BBEE cost (196) –
Capital items (144) (65)
Operating profit 2 383 2 836 (16%)
Net finance costs (707) (697) 1%
Associate companies and joint ventures 30 23
Taxation (533) (520) 3%
Minorities (57) (51)
Earnings attributable to owners of the parent 1 116 1 591 (30%)
INCOME STATEMENT
AUDITED RESULTS FOR THE YEAR ENDED 30 JUNE 2019
FINANCIAL ANALYSIS

UNAUDITED INTERIM RESULTS FOR THE
SIX MONTHS ENDED 31 DECEMBER 2016
30
From continuing operations
FY19
Rm
FY18
Rm Variance
Earnings attributable to owners of the parent 1 116 1 591 (30%)
Add back capital items net of taxation 121 55
Headline earnings 1 237 1 646 (25%)
Add back B-BBEE cost 196 – –
Core headline earnings 1 433 1 646 (13%)
Weighted average number of ordinary shares (m) 2 696 2 671 1%
Headline earnings per share (cents) 45.9 61.6 (25%)
Core headline earnings per share (cents) 53.2 61.6 (14%)
INCOME STATEMENT (CONTINUED)
AUDITED RESULTS FOR THE YEAR ENDED 30 JUNE 2019
FINANCIAL ANALYSIS
UNAUDITED INTERIM RESULTS FOR THE
SIX MONTHS ENDED 31 DECEMBER 2016
31
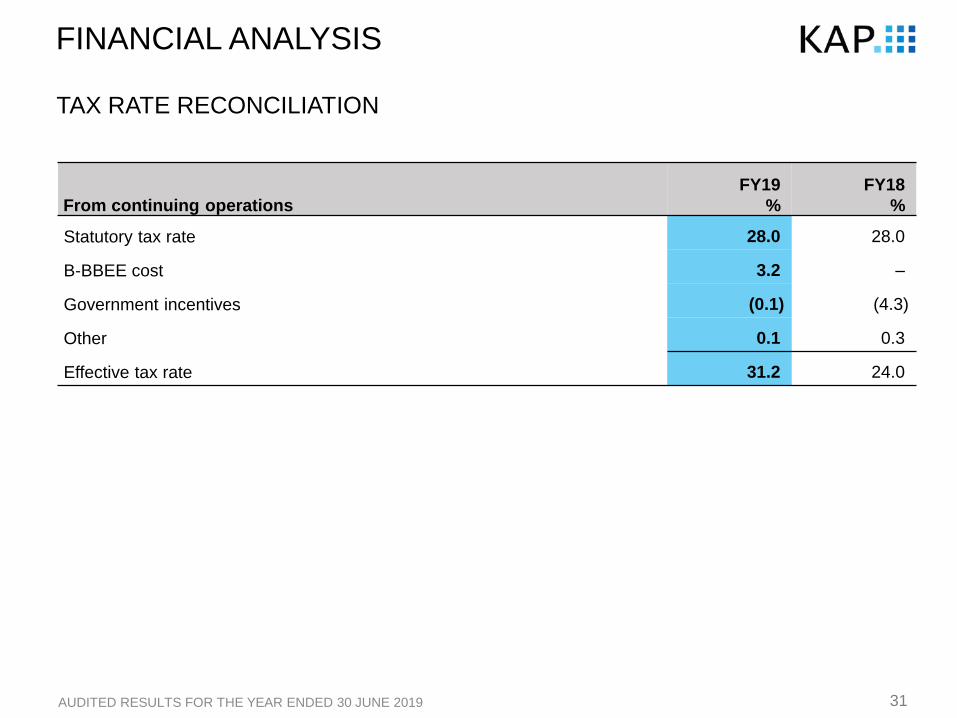
TAX RATE RECONCILIATION
AUDITED RESULTS FOR THE YEAR ENDED 30 JUNE 2019
FINANCIAL ANALYSIS
From continuing operations
FY19
%
FY18
%
Statutory tax rate 28.0 28.0
B-BBEE cost 3.2 –
Government incentives (0.1) (4.3)
Other 0.1 0.3
Effective tax rate 31.2 24.0

SOUTH AFRICA – 83%
REST OF AFRICA – 11%
OTHER – 6%
32
FINANCIAL ANALYSIS
• Provides diversity in markets and broader growth opportunities
• Dollar-driven activities impact revenue and raw material prices, therefore representing
‘dollar margin’ business
REVENUE ANALYSIS
AUDITED RESULTS FOR THE YEAR ENDED 30 JUNE 2019
Geographic analysis*
* From continuing operations.
RAND-driven activities – 62%
US DOLLAR-driven activities – 38%
Currency analysis*
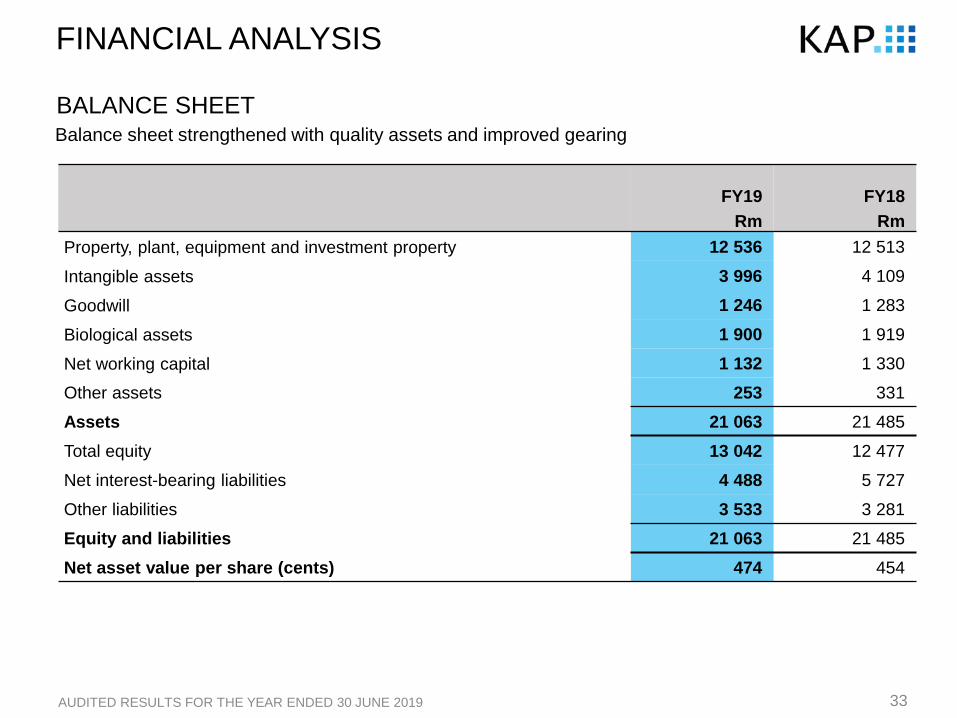
FY19
Rm
FY18
Rm
Property, plant, equipment and investment property 12 536 12 513
Intangible assets 3 996 4 109
Goodwill 1 246 1 283
Biological assets 1 900 1 919
Net working capital 1 132 1 330
Other assets 253 331
Assets 21 063 21 485
Total equity 13 042 12 477
Net interest-bearing liabilities 4 488 5 727
Other liabilities 3 533 3 281
Equity and liabilities 21 063 21 485
Net asset value per share (cents) 474 454
Balance sheet strengthened with quality assets and improved gearing
33
FINANCIAL ANALYSIS
BALANCE SHEET
AUDITED RESULTS FOR THE YEAR ENDED 30 JUNE 2019

1 341
2 285
6 083
1 723
1 243
0
1 000
2 000
3 000
4 000
5 000
6 000
7 000
FY15 FY16 FY17 FY18 FY19
PLANT & MACHINERY – 28%
VEHICLES & BUSES – 24%
INTANGIBLE ASSETS – 20%
LAND & BUILDINGS – 12%
BIOLOGICAL ASSETS – 10%
GOODWILL – 6%
34
FINANCIAL ANALYSIS
STRONG ASSET BASE OF NEW TECHNOLOGY ASSETS
AUDITED RESULTS FOR THE YEAR ENDED 30 JUNE 2019
Capex and acquisition investments (Rm) Asset base at 30 June 2019
R7.8 billion

0
100
200
300
400
500
600
700
800
1 870
35
FINANCIAL ANALYSIS
1 881
(Rm)
(186)
(23)
235
1 907
Jun 18 Increase
due to
growth
Decrease
due to normal
harvesting
Decrease
due to
inflation
differential
Total prior
to effect
of fire
Excess
harvesting
resulting in
inventory
Recovery
estimate
Jun 19
• Harvesting completed for June 2017 fire
• Fire damages 845 ha in November 2018
Normal operations Fire-related impact
PLANTATION REVALUATION
(13) (24)
AUDITED RESULTS FOR THE YEAR ENDED 30 JUNE 2019

• Inventory inflated mainly due to softer polymer demand
-50
150
350
550
750
950
1 150
1 350
1 550
1 750
Jun-18 Inventory Receivables Payables Jun-19
284
36
FINANCIAL ANALYSIS
WORKING CAPITAL BREAKDOWN
1 367
(72)(434)
1 145
(Rm)
AUDITED RESULTS FOR THE YEAR ENDED 30 JUNE 2019
Jun 18 Jun 19

37
FINANCIAL ANALYSIS
CASH FLOW
AUDITED RESULTS FOR THE YEAR ENDED 30 JUNE 2019
FY19
Rm
FY18
Rm
EBITDA before B-BBEE cost 3 909 3 944
Net revaluation of biological assets 20 64
Discontinued operations (78) (57)
Other non-cash adjustments 24 38
Cash generated before working capital changes 3 875 3 989
Working capital changes 158 (681)
Inventory (315) (389)
Receivables 37 (343)
Payables 436 51
Cash generated from operations 4 033 3 308
Net finance charges (717) (764)
Taxation (209) (237)
Dividends received 18 10
Cash flow from operating activities 3 125 2 317
Cash conversion ratio* 153% 116%
* Excluding the non-recurring, non-cash impact of the Unitrans B-BBEE transaction.

FY19
Rm
FY18
Rm
Cash flow from operating activities 3 125 2 317
Investing activities (1 142) (1 723)
Expansion capex (420) (811)
Replacement capex (811) (837)
Disposal/(acquisition) of investments 101 (29)
Other investing activities (12) (46)
Free cash flow before dividends 1 983 594
Dividends paid (656) (630)
Financing activities (1 692) 178
Movement in cash and cash equivalents (365) 142
38
FINANCIAL ANALYSIS
CASH FLOW (CONTINUED)
AUDITED RESULTS FOR THE YEAR ENDED 30 JUNE 2019

39AUDITED RESULTS FOR THE YEAR ENDED 30 JUNE 2019
TREASURY ACTIVITY
DEBT FUNDING ACTIVITIES
• Corporate bonds settled at maturity:
• KAP003 – Listed: R250 million
• KAP002 – Listed: R428 million
• Corporate bonds settled prior to maturity:
• KAP04U – Unlisted: R1 billion
• Term loans settled prior to maturity:
• Syndicated term loan: R800 million
• Corporate bonds issued during the year with a three-year tenure:
• KAP013 – Listed: R700 million
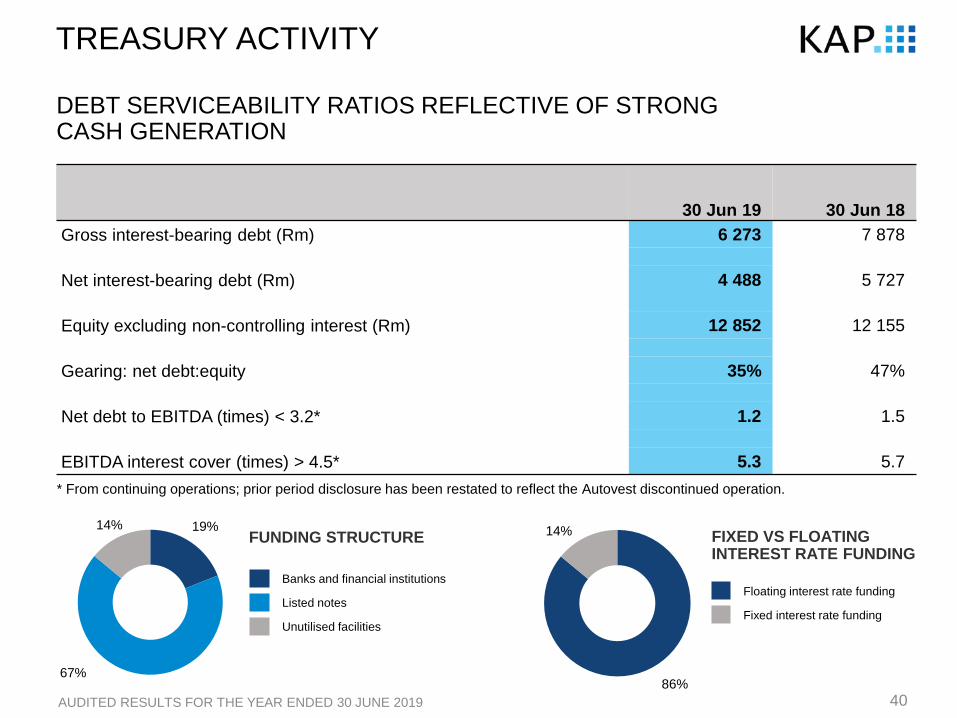
30 Jun 19 30 Jun 18
Gross interest-bearing debt (Rm) 6 273 7 878
Net interest-bearing debt (Rm) 4 488 5 727
Equity excluding non-controlling interest (Rm) 12 852 12 155
Gearing: net debt:equity 35% 47%
Net debt to EBITDA (times) < 3.2* 1.2 1.5
EBITDA interest cover (times) > 4.5* 5.3 5.7
86%
14%FUNDING STRUCTURE
Banks and financial institutions
Listed notes
Unutilised facilities
FIXED VS FLOATING INTEREST RATE FUNDING
Floating interest rate funding
Fixed interest rate funding
40
TREASURY ACTIVITY
DEBT SERVICEABILITY RATIOS REFLECTIVE OF STRONG CASH GENERATION
* From continuing operations; prior period disclosure has been restated to reflect the Autovest discontinued operation.
19%
67%
14%
AUDITED RESULTS FOR THE YEAR ENDED 30 JUNE 2019
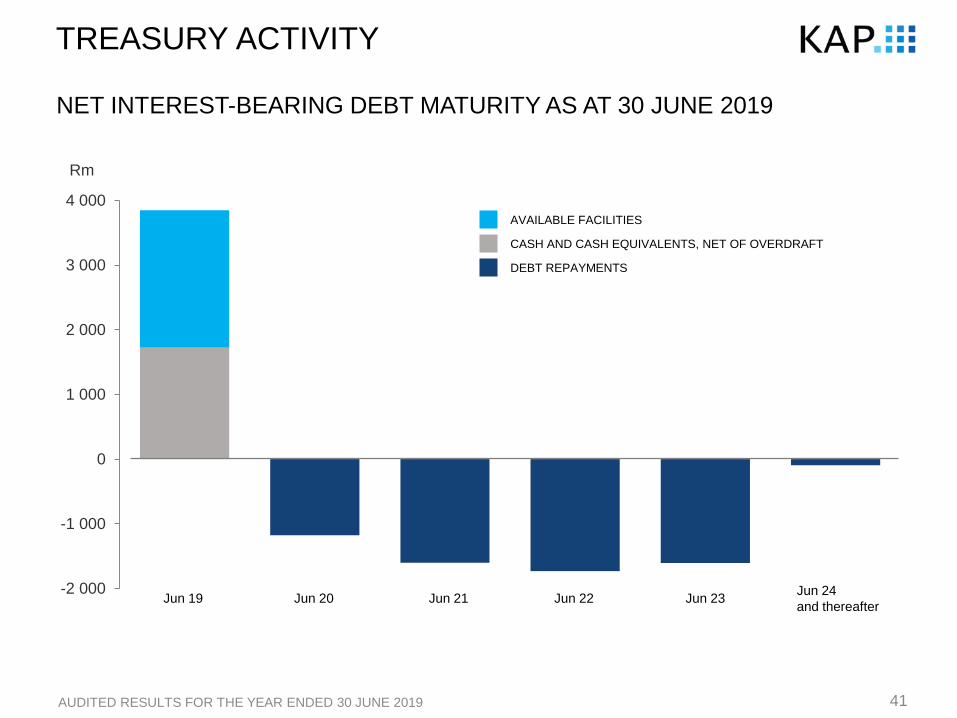
-2 000
-1 000
0
1 000
2 000
3 000
4 000AVAILABLE FACILITIES
CASH AND CASH EQUIVALENTS, NET OF OVERDRAFT
DEBT REPAYMENTS
Rm
Jun 19 Jun 20 Jun 21 Jun 22 Jun 23Jun 24
and thereafter
41
TREASURY ACTIVITY
NET INTEREST-BEARING DEBT MATURITY AS AT 30 JUNE 2019
AUDITED RESULTS FOR THE YEAR ENDED 30 JUNE 2019
INTEGRATED INTO EVERY DAY
OUTLOOKGARY CHAPLIN
CHIEF EXECUTIVE OFFICER
43
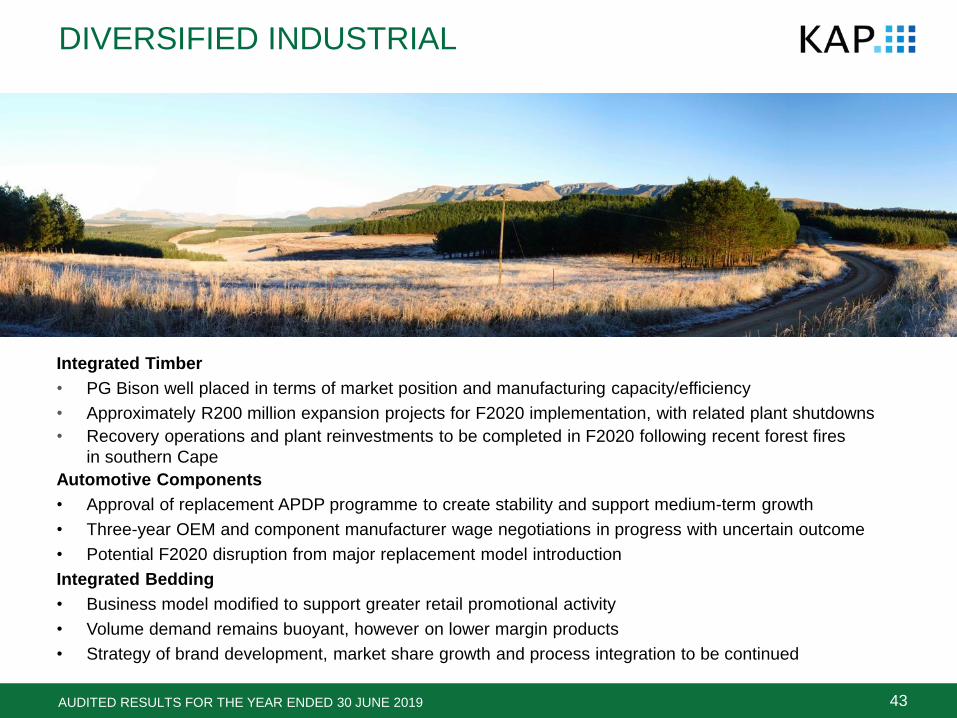
DIVERSIFIED INDUSTRIAL
AUDITED RESULTS FOR THE YEAR ENDED 30 JUNE 2019
Integrated Timber
• PG Bison well placed in terms of market position and manufacturing capacity/efficiency
• Approximately R200 million expansion projects for F2020 implementation, with related plant shutdowns
• Recovery operations and plant reinvestments to be completed in F2020 following recent forest fires
in southern Cape
Automotive Components
• Approval of replacement APDP programme to create stability and support medium-term growth
• Three-year OEM and component manufacturer wage negotiations in progress with uncertain outcome
• Potential F2020 disruption from major replacement model introduction
Integrated Bedding
• Business model modified to support greater retail promotional activity
• Volume demand remains buoyant, however on lower margin products
• Strategy of brand development, market share growth and process integration to be continued
44
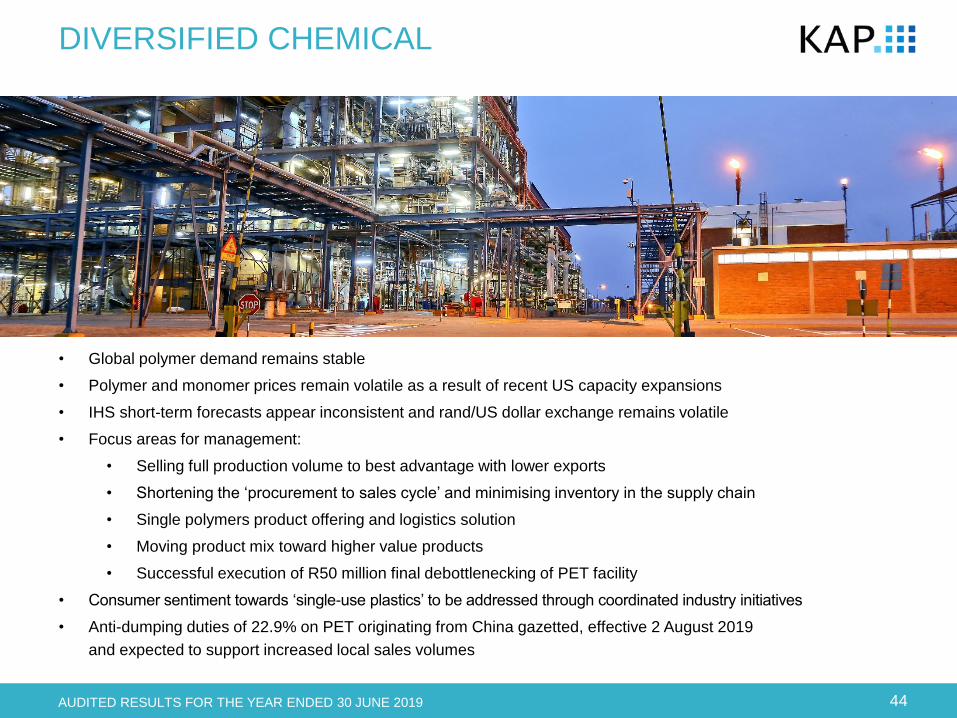
DIVERSIFIED CHEMICAL
AUDITED RESULTS FOR THE YEAR ENDED 30 JUNE 2019
• Global polymer demand remains stable
• Polymer and monomer prices remain volatile as a result of recent US capacity expansions
• IHS short-term forecasts appear inconsistent and rand/US dollar exchange remains volatile
• Focus areas for management:
• Selling full production volume to best advantage with lower exports
• Shortening the ‘procurement to sales cycle’ and minimising inventory in the supply chain
• Single polymers product offering and logistics solution
• Moving product mix toward higher value products
• Successful execution of R50 million final debottlenecking of PET facility
• Consumer sentiment towards ‘single-use plastics’ to be addressed through coordinated industry initiatives
• Anti-dumping duties of 22.9% on PET originating from China gazetted, effective 2 August 2019
and expected to support increased local sales volumes
45
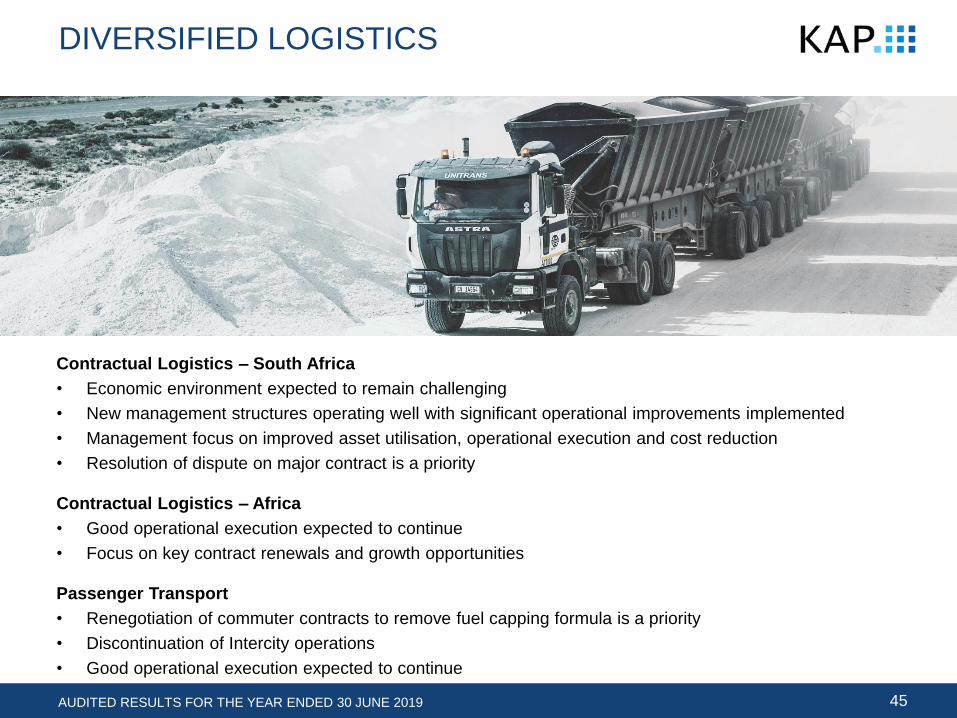
DIVERSIFIED LOGISTICS
Contractual Logistics – South Africa
• Economic environment expected to remain challenging
• New management structures operating well with significant operational improvements implemented
• Management focus on improved asset utilisation, operational execution and cost reduction
• Resolution of dispute on major contract is a priority
Contractual Logistics – Africa
• Good operational execution expected to continue
• Focus on key contract renewals and growth opportunities
Passenger Transport
• Renegotiation of commuter contracts to remove fuel capping formula is a priority
• Discontinuation of Intercity operations
• Good operational execution expected to continue
AUDITED RESULTS FOR THE YEAR ENDED 30 JUNE 2019
INTEGRATED INTO EVERY DAY
Q&AGARY CHAPLIN / FRANS OLIVIER
CHIEF EXECUTIVE OFFICER / CHIEF FINANCIAL OFFICER
INTEGRATED INTO EVERY DAY
THANK YOU


![KAP Chemistry Syllabus—2016-2017 Hilliard Bradley High ... · [1] KAP Chemistry Syllabus—2016-2017 . Hilliard Bradley High School . Instructor: Jennifer Kieffer . KAP Chemistry](https://static.documents.pub/doc/80x56/5b2467787f8b9aca7c8b46cc/kap-chemistry-syllabus2016-2017-hilliard-bradley-high-1-kap-chemistry.jpg)


