Hubli-Dharwad Sustainable Healthcare Waste
Management Project
1
REPORT
KAP-SECOND (Knowledge, Attitude and Practices)
SUSTAINABLE HEALTHCARE WASTE MANAGEMENT PROJECT, HUBLI-DHARWAD
By
HEALTH CARE WITHOUT HARM AND TOXICS LINK
Hubli-Dharwad Sustainable Healthcare Waste Management Project GD Patil Building, 1st Main 4th Cross, behind Shri Krishna Kalyanmantap,
Phone: +91 836 6455 103, +91 98 8041 02222, email: [email protected]
Hubli-Dharwad Sustainable Healthcare Waste
Management Project
2
SECTION-I 1.0. Knowledge, Attitude and Practice (KAP-II)
1.1. Introduction:
The Hubli-Dharwad Sustainable Healthcare Waste Management Project was set out to
help the hospitals and clinics of the district improve their practices so that they can
reduce harm and save money. Health Care Without Harm and Toxics Link with the
support of Deshpande Foundation have been working with Hubli Dharwad Municipal
Corporation (HDMC) for last year. Since, the knowledge and attitude have a vital impact
on the behaviour of the people, all HDMC staff have been trained once and ongoing
training is conducted on a monthly basis to refresh knowledge and to introduce new staff
members to the subject. Training of trainers has commenced to create a pool of people
experienced in passing on their knowledge and give the HDMC to capability of
maintaining high standards of waste management in the long term. During the last year of
the project, two model wards (Chitaguppi and Old Bus Stand Hospitals) and two model
clinics (Ganesh Pet and Navanagar) have been set up to demonstrate best practice.
The aim of knowledge, attitude and practice (KAP) second was undertaken in early 2009
to review the existing health care waste management status in the project area after one
full year of intervention. The results of the study provide the key data, which shows
improvement in status of knowledge, attitude and practices on biomedical waste
management in the twin city, Hubli Dharwad.
Objectives:
1. Analyzing the overall bio medical waste management status Hubli Dharwad.
2. Assessing the knowledge, attitude and practice of the health care staff in Hubli-
Dharwad
Hubli-Dharwad Sustainable Healthcare Waste
Management Project
3
3. Impact assessment of the bio medical waste management inter4vention in Hubli
Dharwad
1.2. Sampling and Methodology
There are a total of 176 hospitals in Hubli-Dharwad, including 72 facilities that only deal
with outpatients. Under the KAP survey a total 13 health care facilities of the twin city,
Hubli-Dharwad were selected for the study. Of these 13 facilities, 8 facilities belonged
Hubli Dharwad Municipal Corporation (HDMC) wherein the sustainable healthcare
waste management Project was intervened and of the 8 HCMC facilities, the 4 HDMC
health care facilities have the good practice models (two model wards and two model
clinics). A total of 114 respondents were interviewed randomly from the 13 selected
facilities. Of the 114 respondents, 59 respondents belonged to facilities under HDMC
(project intervention sites) and 37 respondents were from the faculties with model wards.
The data was collected with the help of interview schedule prepared on the various
aspects of bio medical waste management. Apart from the interview, the data was also
collected through observation method. With the aim to assess the bio medical waste
management status in the Hubli-Dharwad and the impact of the project in the first year of
intervention, the data was purposefully analyzed at two levels i.e. overall bio medical
waste management status at all the health care facilities and the comparative assessment
of HDMC health care facilities (Project Intervention site) Non- HDMC health care
facilities. The data was analyzed by using SPSS package.
1.3. General Profile of the respondents and facilities:
1.3.1. Age of the respondents:
Of the total 114 respondents 15 per cent of the respondents were in the age group of 20-
30 years of age, 24 percent were in the age group of 31-40 years, 24 per cent were 41-50
years of age and 37 per cent were above 50 years.
Hubli-Dharwad Sustainable Healthcare Waste
Management Project
4
Fig 5: Age of Interviewee
15%
24%
37%
24%
20-30 years
31-40 years
41-50 years
Above 50 years
1.3.2 Gender: The fig. 4 shows that of 114 respondents 83 per cent were female and 17 percent were male.
Fig 4: Gender of Interviewee
17%
83% Male
Female
Hubli-Dharwad Sustainable Healthcare Waste
Management Project
5
1.3.3. Designation of the respondents: The figure 2 shows that of 114 respondents
seven per cent of the respondents were doctors, about 63 per cent were paramedic, about
6 per cent were student, about 33 per cent were auxiliary staff and one of the respondents
was a surgeon.
Fig 2: Designation of Interviewee
8
60
17
38
7
52.6
0.96.1
33.3
010203040506070
Doctor Paramedic HouseSurgeon
Student AuxiliaryStaff
F%
1.3.4. Educational qualification: The figure.3 shows that out of 114 respondents about
3 per cent of the respondents were post graduate, about 9 per cent of the respondents
were graduates, about 66 per cent were educated up to secondary level, about 17 per cent
were educated up to primary level and remaining about 16 per cent were illiterate.
Fig 3: Education qualification
310
64
19 18
2.68.8
56.1
16.7 15.8
0
10
20
30
40
50
60
70
Post Graduate Graduate Secondary Primary Illiterate
F%
1.3.5: Type of Facility of the respondents: Fig 1 shows that of 114 respondents about
21 per cent of the respondents belonged to medical college, about 21 per cent belonged to
Hubli-Dharwad Sustainable Healthcare Waste
Management Project
6
private hospital/nursing home, about 18 percent were from dispensary and about 40
percent of the respondents belonged to maternity health center.
Fig 1:Type of Facility interviewee belong to
24 24 20
46
21.1 21.1 17.5
40.4
0
20
40
60
80
100
Medical CollegeHospital
Private Hospital /Nursing Home
Dispensary Maternity healthcenter
F%
1.3.6. Number of beds in facilities: Fig 6 shows that 33 per cent of the respondents
belonged to more than 100 bedded health care facilities, 28 per cent belonged to 01-25
bedded facilities, 27 per cent respondents belonged to 26-50 bedded facilities and
remaining 12 per cent respondents belonged to 51-100 bedded health care facilities.
Fig 6: No of beds in Facilties
28%
27%12%
33%
01 – 25
26 – 50
51 – 100
More than 100
Hubli-Dharwad Sustainable Healthcare Waste
Management Project
7
1.4.0 FINDING AND ANALYSIS:
1.4.1. Knowledge about waste management policy: Of the total 114 respondents
about 76 per cent of the respondents were aware of the bio medical waste management
rules, about 25 percent knew the name of the rule, while only about 16 percent
respondents had the knowledge of the year of the rule passed and about 60 per cent of the
respondents responded positive about the waste management committee in the health care
facility. Though the knowledge about the name of the rules among the respondents has
increases after the initiation of the project in the area from 10 per cent to 25 per cent but
still needs to be improved.
Fig 7: Knowledge about waste management policy
76.3
25.415.8
60.5
23.7
76.4684.2
39.5
0
20
40
60
80
100
Awareness ofLegislation
Knowledge ofrule name
Knowledge ofrule year
Existence ofWMCinFacility
Yes %No %
1.4.2. Responsibility for the waste management: Figure 8 shows that majority of the
respondents felt that each staff member has crucial role to play in waste management and
felt that it is teamwork. The majority of the respondents felt that the waste management
should be responsibility of the all staff member such as head of hospital (94 %), head of
department (90%), nursing superintendent (98%), pharmacist (84%) and lab supervisor
(87%). While, before the inception of the project most of the respondents had the view
that head of the hospital and nursing supervisor were responsible for the waste
management. This indicates that the project has made considerable improvement on the
attitude towards the responsibility of the staff about waste management.
Hubli-Dharwad Sustainable Healthcare Waste
Management Project
8
Fig 8: Responsibilty about waste Management
89.598.2
84.2 86.8
2.6 5.3 1.087.9 53.5 5.3 0
7.9 8.8
93.9
0
20
40
60
80
100
Head o
f hos
pital
Depart
ment H
eads
Nursing
supe
rinten
dent
Pharm
acist
Lab S
uperv
isor
YES %
NO %
DK %
1.4.3. Knowledge about Centralized Treatment Facility (CTF): Figure 9 shows that
about 59 per cent of the respondents were found to be aware of the authorization of the
facility by state pollution control board for the treatment of bio medical waste by a
centralized facility. However, about 94 per cent of the respondents were aware of that
their waste was collected by the authorized centralized facility.
Fig. 9 : Knowledge about CTF
58.8
93.9
9 6.1
40.4
00
20
40
60
80
100
Authorizion by SPCB Waste Collection by authorizedfacility
YES %NO %DK %
1.4.4: Frequency of collection of waste: Figure 10 shows that majority of the
respondents (75 per cent) mentioned that collection of waste from their health care
facility by centralized facility takes place on daily basis. Eight per cent of the respondents
Hubli-Dharwad Sustainable Healthcare Waste
Management Project
9
mentioned that their facility getting the service of collection of waste by CTF on
alternative days and 10 per cent of them said waste collection service takes place weekly
(5 per cent) and irregular (5 per cent). However, the percentage of the respondents who
pointed out that the collection of waste is taking place in their health care facilities on
daily basis has increased from 64 per cent to 75 per cent, but still there is a scope of
improvement in the disposal of waste.
Fig 10: Frequency of waste colection by CTF
75%
8%
7%
5%
5%
Daily
On alternate days
Tw ice a w eek
Once a w eek
Irregularly
1.4.5: Availability of treatment and disposal options: The figure 11 reveals that of the
total respondents about 91 per cent of the respondents mentioned that their health care
facilities were having the facilities of ‘segregation of waste into coloured containers’ and
‘collection of waste by authorized waste disposal agents’, while about 66 per cent and 65
per cent of the respondents mentioned that their health care facilities having the facilities
of ‘chemical disinfection’ and ‘autoclaving’ respectively.
Hubli-Dharwad Sustainable Healthcare Waste
Management Project
10
Fig 11: Availabilty of treatment and disposal options
91.2
1.8
65.8
5.30.9
64.9
0
91.2
0
14.9
6.18.8
97.4
33.3
93.398.2
34.2
99.1
7.9
98.2
83.3
58.8
0 0.9 0.9 0.9 0.9 0.9 0.9 0.9 1.8 1.8
35.1
0
20
40
60
80
100
120
Segregat ionint o coloredcont ainers
Cont ainment Chemicaldisinf ect ions
Bur ial Deep bur ial Aut oclave Collect ion byrecyclers
Collect ion byaut hor ized
agent s
Burning Incinerat ion Ot her (pleasespecif y)
Yes %No %DK %
1.4.6: Usage of waste treatment and disposal facilities: Figure 12 shows that about 91
per cent pf the respondents mentioned that their health care facilities were utilizing the
facilities of ‘segregation of waste into coloured containers’ and ’collection of waste by
authorized waste disposal agents’, while about 66 per cent and 65 per cent of the
respondents mentioned that their health care facilities having the facilities of ‘chemical
disinfection’ and ‘autoclaving’ respectively. A small number of the respondents did not
know about the disposal. The above two figures i.e. 11 and 12 shows that if the treatment
& disposal facilities are available are being utilized them.
Hubli-Dharwad Sustainable Healthcare Waste
Management Project
11
Fig. 12: Usage of waste treatment and disposal facilties
91.2
0
65.8
0 0
64.9
0
91.2
0 00 1.8 05.3
0.9 0 0 0 0
14.98.8
98.2
34.2
94.799.1
35.1
100
8.8
100
83.3
0
20
40
60
80
100
Yes %
No %
NA %
1.4.7: Segregation of waste: The figure 13 shows that majority of the facilities i.e., 95
per cent of the health care facilities were found to be segregating their waste.
Fig 13: Practice about segregation
95%
5%
Yes
No
Hubli-Dharwad Sustainable Healthcare Waste
Management Project
12
4.8: Segregation responsibility: The figure 14 shows that majority of the respondents
mentioned that the nursing staff & auxiliary staff in their health care facilities do the
segregation of waste and 35 per cent said that it is done by the auxiliary staff only, while
only 5 per cent and one per cent respondents mentioned that the segregation is the
responsibility of the nursing assistant and doctors respectively. In fact, all staff who
produce waste should segregate it at source, to prevent contamination of recyclable waste
and possible harm if waste handlers are left to segregate waste later.
Fig 14: Who does segregation
1%3%
35%
56%
5%
Doctor
Nursing Assistant
Auxiliary staff
Nursing Assistant &Auxiliary staff both
NA
1.4.9: Knowledge about colour coding: The figure 15 shows that majority of the
respondents (85 per cent) were found to be aware about the usage of colour codes for the
disposal of the waste, while 15 per cent were not aware of the colour coding. After the
project intervention the knowledge of the respondents about the colour coding system had
slightly increased from 83 to 85 per cent but still there is a scope of improvement.
Fig 15: Knowledge about colour coding
85%
15%
YES %NO %
Hubli-Dharwad Sustainable Healthcare Waste
Management Project
13
1.4.10: Usage of colour coding: The figure 16 reveals that about 77 per cent and 83 per
cent of the respondents mentioned that their health care facilities were using the red and
blue colour bags/containers respectively for the disposal of waste, while about 66 and 58
per cent of the respondents said that their health care facilities were using the yellow and
black bags respectively. Whereas, about the usage of green bag for recyclables and white
bags only 43 per cent and 15per cent respondents in their health care facilities had
affirmative response.
Fig 16: Usage of Colour codes
77.282.5
14.9
65.857.9
43
22.817.5
85.1
34.242.1
57
0
20
40
60
80
100
Red BlueWhit
eYell
owBlac
k
Green/r
ecyc
ling
YES %NO %
1.4.11: Knowledge & practice about the colour-coded bags: The figure 17 shows that
about 65 per cent and 55 per cent of the respondents were found to be aware of the usage
of blue and red colour bags respectively, while about 44 percent and 43 per cent of the
respondents had the knowledge about the black and yellow bags respectively.
It was also observed that about 40 per cent of the facilities were found to be using the red
bag as well as blue bags correctly, while about 38 per cent and 26 per cent of the facilities
were using the black and yellow bags respectively in a correct way.
The findings reveal that there is a visible gap between the knowledge and practice about
the usage of colour coded bags. However, the knowledge level among the respondents
Hubli-Dharwad Sustainable Healthcare Waste
Management Project
14
about the colour-coded bags is comparatively better than that of the usage of the colour
coded bags in their health care facilities. It indicates that there is a need of emphasis on
the raising awareness among the staff members for the improved practice about the
colour-coded bags in their facilities.
Fig 17: Knowledge & practice about colour coding
43
55.3
64.9
43.9
26.3
40.4 40.4 37.7
0
20
40
60
80
100
Yellow bag Red bag Blue bag Back
Knowledge %Practice %
1.4.12: Labeling of bio hazards symbols: The figure 18 shows that only 33 per cent
respondent’s facilities were found to be having the labeling of bio hazards symbol on
infectious waste, while in remaining facilities, it needs to be initiated. Though the project
has improved the practice of labeling the biohazards symbols but still it needs the special
attention for further improvement.
Fig 18: labelling of bio hazards Symbol
33%
67%
YES %
NO %
Hubli-Dharwad Sustainable Healthcare Waste
Management Project
15
1.4.13: Availability of personal protective equipment (PPE): The figure 19 of the total
the availability of the personal protective equipments was not satisfactory. About 76 per
cent of the respondents mentioned that gloves are available in their health care facilities,
60 per cent said about mask, about 56 per cent had positive response about apron, 35 per
cent said boots, about 34 per cent said goggles and about 22 per cent responded that
trolley for bin are available in their facilities. The availability of the PPE in the health
care facility was not found to be satisfactory. It indicates that availability of the
equipments needs to be improved.
1.4.14: Availability of precautionary measures: The figure 20 shows that the level of
availability precautionary measures in the health care facilities was found to be very low
with respect to the ‘close lid containers’, ‘dedicated trolley for waste’, separate route
from that is used for clean, food materials and trolley for bins’.
Fig. 19 Availabilty of PPE
59.6
76.3
35.1
56.1
34.2
21.9
40.4
23.7
64.9
43.9
65.8
78.1
0
20
40
60
80
100
Mask Gloves Boots Apron Goggles Trolley forbins
YES %NO %
Hubli-Dharwad Sustainable Healthcare Waste
Management Project
16
Fig. 20: Availabilty of precautionary equipments
10.515.8
1.8
93
22.8
89.584.2
98.2
7
77.2
0
20
40
60
80
100
Close LidContainer
Dedicatedtrolley for
waste
Routeseparate fromthat used forclean, food
material
Timings Fixed(Note Timings)
Trolley for bins
YES %NO %
1.4.15: Availability of storage place: The figure 2 shows that of the total 114
respondents, 86 per cent mentioned that the dedicated storage points are available in their
facilities, while 14 per cent of the respondents did not have the dedicated storage point in
their health care facilities.
Fig 21: Avalabilty of decicated storage place
14%
86%
YES %
NO %
1.4.16: Availability of facilities for safe storage of waste: The figure 22 shows that 86
per cent of the respondents mentioned that basic facilities for usage storage of waste are
not available in their health care facilities. It indicates that there a need for the
improvement the facilities for the safe storage of waste.
Hubli-Dharwad Sustainable Healthcare Waste
Management Project
17
Fig. 22: Availability of facilities for safe storage of waste
12.3 14 14 147.9
1.8 0 0 06.1
86 86 86 86 86
0
20
40
60
80
100
Lock and key Location Accessible byvehicle.
Easilycleanable
Inaccessible toanimals and
pests
YES %NO %DK %
1.4.17: Duration of storage of waste in the facility: The figure 23 shows that 83 percent
of the respondents mentioned the duration of storage of waste is one day in their health
care facilities, 6 per cent said two days and 5 per cent said three days while, 5 per cent
respondents did not know about the duration of storage in the facilities.
Fig. 23: Duration of waste storage
83%
6%
5%6%
One dayTwo daysThree daysDo not know
Hubli-Dharwad Sustainable Healthcare Waste
Management Project
18
4.18: Waste collection from the facility: About 89 per cent of the respondents
mentioned that the waste is colleted separately and on a fixed timing in their facilities,
while about the different timing of waste collection from the patients visits about 99 per
cent respondents had negative response.
Fig.24: Waste collection practices
88.6 88.6
0.911.4 11.4
99.1
0
20
40
60
80
100
Waste collectedseparately
Fixed timing of wastecollection
Different timings frompatients visits
YES %NO %
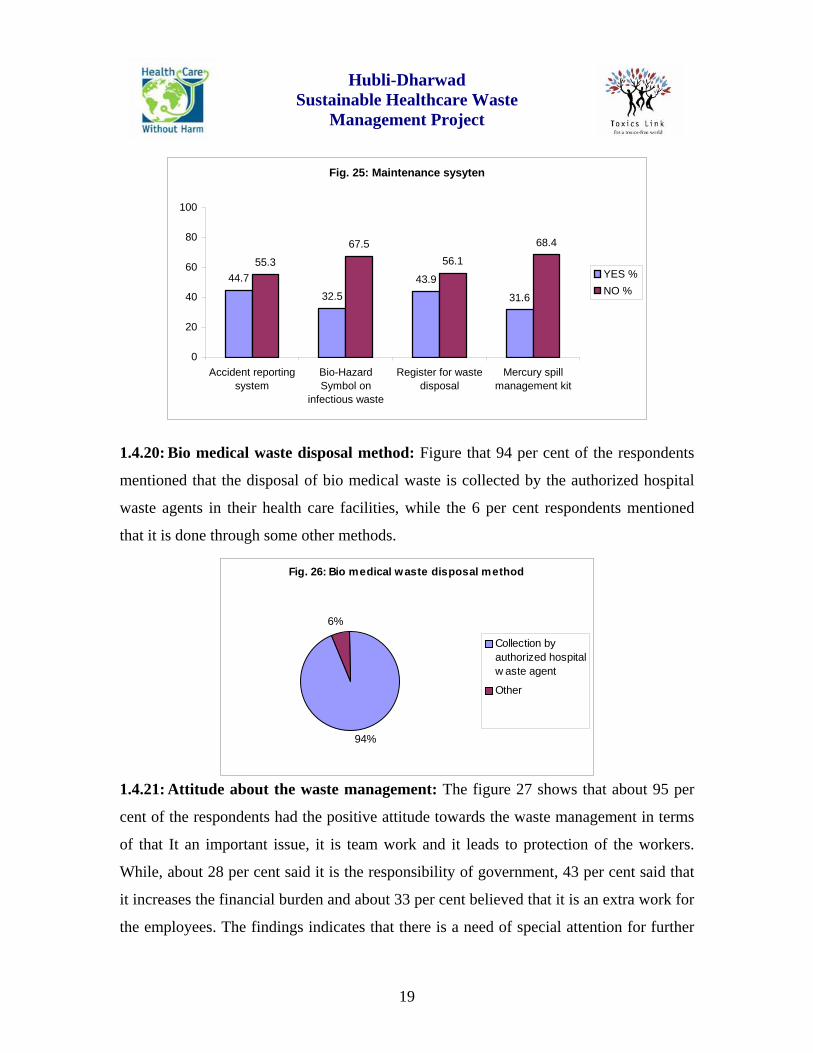
1.4.19: Record maintenance and availability of mercury spill management kit: About
45 per cent of the respondents made affirmative response regarding the existence of
accident reporting system in their health care facility, about 33 per cent respondents
stated that bio hazards symbol on infectious waste is being practised and about 44 per
cent of the respondents responded positively regarding the maintenance of register for
waste disposal in their health care facilities. Only 31 per cent of the respondents
responded in affirmative about the availability of the mercury spill management kit. The
findings show that on all the items of maintenance system health care facilities is not
satisfactory. It indicates that there is a need of further improvement with respect to record
maintenance and the availability of the mercury spell management kit in the facilities.
Hubli-Dharwad Sustainable Healthcare Waste
Management Project
19
Fig. 25: Maintenance sysyten
44.7
32.543.9
31.6
55.3
67.556.1
68.4
0
20
40
60
80
100
Accident reportingsystem
Bio-HazardSymbol on
infectious waste
Register for wastedisposal
Mercury spillmanagement kit
YES %NO %
1.4.20: Bio medical waste disposal method: Figure that 94 per cent of the respondents
mentioned that the disposal of bio medical waste is collected by the authorized hospital
waste agents in their health care facilities, while the 6 per cent respondents mentioned
that it is done through some other methods.
Fig. 26: Bio medical waste disposal method
94%
6%
Collection byauthorized hospitalw aste agent
Other
1.4.21: Attitude about the waste management: The figure 27 shows that about 95 per
cent of the respondents had the positive attitude towards the waste management in terms
of that It an important issue, it is team work and it leads to protection of the workers.
While, about 28 per cent said it is the responsibility of government, 43 per cent said that
it increases the financial burden and about 33 per cent believed that it is an extra work for
the employees. The findings indicates that there is a need of special attention for further
Hubli-Dharwad Sustainable Healthcare Waste
Management Project
20
improvement in the attitude of the staff members especially on the items, namely, it is not
important, it is government’s responsibility, it increases the financial burden and it is an
extra work.
1.4.22: Educational and training programme in the facility: The figure 28.shows that
only about 54 per cent of the respondents could attend the educational or training
programme on waste management. About 92 per cent of the respondents of the
respondents said that there id no facility annual educational & training programme in
their health care faculties. While about all of the respondents were interested to receive
the trainings on the waste management issues.
fig.27: Attitude about waste management
4.4
28.9
97.4
4333.3
96.594.7
71.1
2.6
53.566.7
2.60.9 0 0 3.5 0 0.90
20
40
60
80
100
It is
not i
mporta
nt
Govt's
resp
onsib
ility
It is t
eamwork
Iincre
ases
finan
cial b
urden
An extr
a work
Lead
s to p
rotec
tion
Agree %Disagree %No Comment %
Hubli-Dharwad Sustainable Healthcare Waste
Management Project
21
Fig. 28: Education & training in the facility
54.4
7.9
98.2
45.6
92.1
1.80
20
40
60
80
100
Any training program Any annual education onwaste management
Interest to receivetrainings
YES %NO %
1.4.23: Change in bio medical waste management practice: About 77 per cent of the
respondents admitted that there is an improvement in the bio medical waste management
practice in their health care facilities. While, still 23 per cent of the respondents did not
feel any change in their health care facilities.
Fig. 29: Change in practice about bio medical waste management
77%
23%
YES %
NO %
Hubli-Dharwad Sustainable Healthcare Waste
Management Project
22
1.4.24: Information about bio medical waste management: The figure 30 shows that
59 per cent of the respondents received the information about the bio medical waste
management i.e. either through project training or project person. It indicates that the
project has contributed as major factor in the awareness raising about bio medical waste
amongst the respondents.
Fig. 30: Media of receiving information on bio medical waste
2.6
27.2
0.9 0
50.9
6.01
51.8
8.8
97.4
72.8
99.1 100
49.1
93.9
48.2
91.2
0
50
100
Newsp
aper
Collea
gue
Televis
ionRad
io
Projec
t Trai
ning
Other tr
aining
Projec
t Pers
on
Govern
ment p
rojec
t
YES %NO %
Hubli-Dharwad Sustainable Healthcare Waste
Management Project
23
SECTION-II
2.0. Impact of the project on the Bio Medical Waste Management Aspects
With the view to assess the impact of the health care waste management project the
knowledge, attitude an practice about the about the some of the aspects of bio medical
waste management were in the HDMC and Non HDMC health care facilities were
studied. The staff of the HDMC hospitals have been given training by the project over
one year. The comparative findings of HDMC and Non HDMC health care facilities
have been discussed in the next few pages of this section.
2.1. Knowledge about the waste management policy:
The figure reveals that more number of respondents belonging to HDMC health care
facilities was found to be having correct knowledge about the legislation than that of the
respondents belonging to Non HDMC health care faculties. It indicates that the health
care waste management project in the HDMC health care facilities has improved the
knowledge about the bio medical waste management rules.
Knowledge about rules
98.3
44.1
27.1
52.7
5.5 3.60
25
50
75
100
Awareness ofLegislation
Knowledge ofname of Legislation
Knowledge aboutAct year
HDMC
Non-HDMC
Hubli-Dharwad Sustainable Healthcare Waste
Management Project
24
2.2. Knowledge about CTF:
Knowledge abour CTF
91.5100
23.6
87.3
0
25
50
75
100
CTF authorized by SPCB Waste Collection byauthorized facility
HDMCNon-HDMC
The above figure shows that the knowledge level of the respondents of HDMC health
care facilities about the functioning and the authorization of CTF was found to be higher
than that of the respondents of Non HDMC health care facilities.
2.3. Frequency of collection of waste from the facility
Frequency of waste collection
66.1
1.713.6 10.2 8.5
83.6
14.5
0 0 1.80
25
50
75
100
Daily Alternatedays
Twice aweek
Once aweek
Irregularly
HDMCNon-HDMC
Hubli-Dharwad Sustainable Healthcare Waste
Management Project
25
The collection of waste form the health care facility by the CTF on daily basis was found
to be higher in the Non HDMC health care facilities. It means the waste collection
practice still needs to be improved in the HDMC health care facilities.
2.4. Practice about segregation of waste:
Segregation of waste
93.2 96.4
0
25
50
75
100
Waste segregation is happening
HDMC
Non-HDMC
Almost all HDMC and Non HDMC health care facilities are segregating waste. But the
next graphs show lesser knowledge of the colour codes according to the Rules and
availability and use of correct bags so the segregation will need improvement. In these
aspects, the HDMC hospitals are better.
2.5. Knowledge about colour codes
Knowledge of Colour Codes
91.5
78.2
0
25
50
75
100
Knowledge usage of colour coding
HDMCNon-HDMC
Hubli-Dharwad Sustainable Healthcare Waste
Management Project
26
The knowledge about the usage of colour coded bags also found to be higher in HDMC
health care facilities than that of the respondents belonging to the Non-HDMC health
care facilities.
2.6. Usage of colour coded bags:
Usage Colour codes
74.6 76.3
11.9
59.3 64.4 67.880
89.1
18.2
72.7
50.9
16.4
0
25
50
75
100
Red BlueW
hite
Yellow
Black
Green/r
ecyc
ling
HDMCNon-HDMC
The above figure shows that the majority of the health care facilities were using the
correct colour codes for storing the waste. However, the usage of white colour code was
not found satisfactory. It means that the usage of colour codes still needs to be improved.
2.7. Knowledge about use of colour coded bags:
Knowledge of storage of waste into colour coded bags
45.8
72.9 74.667.8
40 36.4
54.5
18.2
0
25
50
75
100
Yellow bag Red bag Blue bag Black
HDMCNon-HDMC
The knowledge about the storage of waste into the coloured bags of the respondents of
HDMC health care facilities were found to be having better than that of the respondents
Hubli-Dharwad Sustainable Healthcare Waste
Management Project
27
of Non HDMC health care facilities on all the four colour codes. It indicates that the
project has improved the knowledge significantly, but still needs to be improved.
2.8. Practice about the storage of waste into the right colour coded bags:
Practice of storage of waste into colour coded bags
44.1
62.7 62.7 62.7
7.316.4 16.4
10.9
0
25
50
75
100
Yellow bag Red bag Blue bag Black
HDMCNon-HDMC
The findings shows that the practice about the category wise storage of waste into the
correct coded bins in the HDMC health care facilities was found to better than that of the
respondents of Non HDMC health care facilities. It indicates the project has improved the
storage practice significantly in the HDMC health care facilities.
2.9. Practice about the labeling of infectious waste:
Labeling of infectious waste
62.7
00
25
50
75
100
Labeling of infectious waste
HDMCNon-HDMC
Hubli-Dharwad Sustainable Healthcare Waste
Management Project
28
The findings show that the majority of the health care facilities were observed to be
labeling the infectious waste, where none of the Non-HDMC facilities were labeling the
infectious waste. It means that the project intervention has significantly improved the
practice of labeling the infectious waste. But still the practice about the labeling of
infectious waste needs to be improved.
2.10. Availability of storage place in the facility:
Storage Place100
29.1
0
25
50
75
100
Availability of decicated w aste storage place
HDMC
Non-HDMC
The above figure shows that all of the HDMC health care facilities were found to be
having the storage place, whereas, only about 29 per cent of the Non-HDMC facilities
were found to be having storage place for the bio medical waste.
2.11. Duration of storage of waste
Duration of waste storage
86.4
3.48.5
1.7
81.8
7.30
10.9
0
25
50
75
100
One day Two days Three days Do not know
HDMCNon-HDMC
Hubli-Dharwad Sustainable Healthcare Waste
Management Project
29
The above findings shows that about 86 per cent of the HDMC health care facilities were
not found to be storing their waste more than one day, while about 82 percent of Non
HDMC health care facilities were observed having the waste storage time ‘not more than
one day’.
2.12. Practice about collection of waste:
Important practices in facility
74.661
72.961
12.71.8
12.70
0
25
50
75
100
Accidentreportingsystem
Labeling ofinfectious
waste
Maintenanceof register
Availability ofMercury spill
kit
HDMCNon-HDMC
The above figure shows that the majority of the HDMC health care facilities were
observed doing the right practices i.e., accident reporting system, labeling of infectious
waste, maintenance of register and availability of mercury spill management kit. It
indicates that the project in the HDMC health care facilities has made a visible
improvement regarding the above said practices.
Hubli-Dharwad Sustainable Healthcare Waste
Management Project
30
SECTION-III
COMPARATIVE ANALYSIS OF KAP-I AND KAP-II
(PRE AND POST INTERVENTION STATUS)
3.1. Introduction
With the view to evaluate the impact of the project in terms of their knowledge, attitude
and practice (KAP) about the health care waste management, the findings of KAP-I and
KAP-II were compared. The first KAP survey was carried out before the initiation of the
project as baseline survey to understand the ground situation i.e. the need and problem to
be emphasized during the intervention. The second KAP survey was done after the 18
months of the initiation of the project. The respondents were chosen randomly from the
various health care facilities in the city. To assess the impact of the sustainable health
care waste management intervention, the findings of KAP-I (pre intervention) and KAP-
II (post intervention) were compared.
3.2. Findings and Discussion:
The comparative findings of pre and post intervention status about the knowledge,
attitude and practices about the different aspects of the bio medical waste have been
discussed in the next few pages.
3.2.1. Awareness about bio medical waste Rules:
Hubli-Dharwad Sustainable Healthcare Waste
Management Project
31
Fig. 1. Awareness about BMW Rules
25
76
10
25
0
20
40
60
80
100
Pre Post
Know about legislationKnow the name of rules
Figure 1 shows that of the total respondents only 25 per cent were aware of existence of
any legislation for biomedical waste management in India and only 10 percent of the
health care staff knew the name of the rules. However, after the project intervention about
76 per cent of the respondents were found to be aware of the bio medical waste
management rules, about 25 percent knew the name of the rules. Though, the knowledge
about the name of the rules among the respondents has increased from 10 per cent to 25
per cent but still needs to be improved.
3.2.2. Authorization by SPCB:
Figure 2 shows that in the pre intervention phase, only 23 per cent of the respondents had
the knowledge of authorization required by the health care facility from the state
pollution control board. Whereas in the post intervention scenario 59 per cent of the
respondents were found to be aware of the authorization of the facility by state pollution
control board for the treatment of bio medical waste by a centralized facility.
Hubli-Dharwad Sustainable Healthcare Waste
Management Project
32
Fig 2. Authorization by SPCB
23
59
0
20
40
60
80
100
Pre Post
Authorization by SPCB
3.2.3: Knowledge about waste management committee:
Fig 3. Know waste mangement committee
20
61
0
20
40
60
80
100
Pre Post
Know WMC
Figure 3 shows that only 20 per cent of health care staff had knowledge of existence of
waste management committee in their facility whereas, after the intervention 61 per cent
of the respondents responded positive about the waste management committee in the
health care facility.
3.2.4: Responsibility of health care waste management:
Figure 4 reveals that most of the respondents felt that head of the hospital and nursing
supervisor play a significant role in waste management and thus they should be
responsible for it. Whereas, after the project, the attitudes towards the responsibility of
the health care waste management has positively changed. The majority of the
Hubli-Dharwad Sustainable Healthcare Waste
Management Project
33
respondents felt that each staff member has crucial role to play in waste management and
feel that it is teamwork. The majority of the respondents felt that the waste management
should be responsibility of the all staff member. This indicates that the project has made
considerable improvement on the attitude towards the responsibility of the staff about
waste management.
Fig 4. Responsibilty of health care waste management
55
94
35
89
65
98
8
84
20
86
0
20
40
60
80
100
Pre Post
Head of the hospital
Department head
Nursing Superintendent
Pharmacist
Lab Supervisor
3.3.5: Frequency about waste disposal:
Fig. 5. Waste disposal frequency
6475
1885 78 55 5
0
20
40
60
80
100
Pre Post
DailyAlternate dayTwice a dayOnce a weekIrregular
Figure 5 shows that the majority of the respondents mentioned that waste disposal from
their health care facility takes place on daily basis (64 percent). Nearly 18 percent of
them said that their facilities dispose health care waste on alternative days. While after
the project the majority of the respondents (75 per cent) mentioned that collection of
Hubli-Dharwad Sustainable Healthcare Waste
Management Project
34
waste from their health care facility by centralized facility takes place on daily basis.
However, the number of the respondents mentioned that the collection of waste is taking
place in their health care facilities on daily basis has increased from 64 per cent to 75 per
cent but still there is a scope of improvement in the disposal of waste.
3.3.6: Treatment and disposal option utilized:
Fig. 6. Treatment & dispopsal option utilised
73
91
43
6678
91
0
20
40
60
80
100
Pre Post
Coloured containers
Chemical disinfectant
Collection by authorizedagents
Figure 6: shows that the project has increased the usage of all three treatment and
disposal options, namely ‘segregation of waste into coloured containers’ and ‘collection
of waste by authorized waste disposal agents’, ‘chemical disinfection’ and ‘collection by
authorized facility’.
3.3.7: Responsibility of segregation of waste:
Figure 7 shows that most of the respondents believed that the segregation of waste is the
main responsibility of nursing staff and auxiliary staff. However, after the intervention,
the majority of the respondents mentioned that the nursing staff & auxiliary staff in their
health care facilities do the segregation of waste and 35 per cent said that it is the
responsibility of the auxiliary staff only. It indicates the attitude of the respondents has
changed positively after the intervention
Hubli-Dharwad Sustainable Healthcare Waste
Management Project
35
Fig 7. Segregation responsibilty
55
2.6
68
35
0
56
0
20
40
60
80
100
Pre Post
Nursing assistant
Auxiliary staff
Both
3.3.8: Knowledge about colour codes:
Fig 8. Know colour codes
83 85
0
20
40
60
80
100
Pre Post
Knowledge of colourcodes
Figure 8 reveals that after the project the percentage of the respondents with the
knowledge about the colour coding system has also increased from 83 to 85 per cent that
can be further focused upon.
3.3.9: Knowledge about the colour coded bags:
Figure 9 shows that shows the project has positively affected the availability and usage of
colour coded bags. It indicates that the lack of proper practice of colour code scheme in
the facilities in the pre intervention phase. However, in the post intervention survey the
Hubli-Dharwad Sustainable Healthcare Waste
Management Project
36
majority of the respondents motioned that the different colour codes are being used for
the bio medical waste management
Fig 9. Availabilty of colour coded bags
75 77
50
83
7.5
85
45
86
38
58
0
20
40
60
80
100
Pre Post
RedBlueWhiteYellowBlack
3.3.10: Bio hazards symbols:
Figure 10 shows that only 25% of respondents knew about the bio-hazard symbol, which
is mandatory to be used as label under health care waste management. The knowledge
about the bio hazards symbols among the respondents has increased from 25 to 33 per
cent but still needs special attention.
Fig 10. Know biohazards Symbol
2533
0
20
40
60
80
100
Pre Post
Know biohazardsSymbol
Hubli-Dharwad Sustainable Healthcare Waste
Management Project
37
3.3.11: Maintenance of register:
Fig 11. Know about waste register
18
43
0
20
40
60
80
100
Pre Post
Know about w asteregister
Figure 11 shows that only 18 per cent of the respondents knew about the maintenance of
register for waste management before the project intervention and in the post intervention
scenario, 43 per cent of the respondents were found to be aware of the maintenance of
waste register. However, the number of the respondents having knowledge about the
register has increases but there is further need to be improved upon.
3.3.12: Attitude towards waste management:
Fig 12. Attitude towards waste management
33
4
33 29
100 97
60
4330 33
0
20
40
60
80
100
Pre Post
Not an important
Governmentresponsibility
Team w ork
Financial burden
Extra w ork
Figure 12 shows that the pre intervention scenario shows that 33 % respondents thought
that waste was not an important thing and that it was the responsibility of the government
and 30 per cent respondents disagreed that it was extra work. While, in the post
intervention status, only 4 per cent of the respondents believed that it was not an
Hubli-Dharwad Sustainable Healthcare Waste
Management Project
38
important and 97 per cent said that it is teamwork. It indicates that the project has
changed the attitude positively about the health care waste management
3.3.13: Information exposure through training:
Fig 13. Training attended
35
54
0
20
40
60
80
100
Pre Post
Training attended
Figure 13 shows that only 35 per cent of respondents could attend some medical waste
training before the project intervention. While, during the intervention the 54 per cent of
the respondents mentioned that they have attended the educational or training programme
on waste management. The project has only trained staff at HDMC hospitals, but still
this KAP survey shows real improvements in knowledge attitudes and practices.
In the future training will be expanded and future surveys will be conducted to show
more improvements.