CONTROL ENGINEERING LABORATORY Infotech Oulu and Department of Process Engineering Kappa number prediction based on cooking liquor measurements Antti Lemmetti Kauko Leiviskä Raimo Sutinen Report A No 5, May 1998
Transcript
CONTROL ENGINEERING LABORATORY Infotech Oulu and Department of Process
Engineering
Kappa number prediction based on cooking liquor measurements
Antti Lemmetti Kauko Leiviskä Raimo Sutinen
Report A No 5, May 1998
University of Oulu Control Engineering Laboratory Report A No 5, May 1998
Kappa number prediction based on cooking liquor measurements
Antti Lemmetti*, Kauko Leiviskä** and Raimo Sutinen* *ABB Industry, Pulp & Paper, Oulu **Control Engineering Laboratory
Abstract: CLA 2000 Cooking Liquor Analyzer gives on-line information on cooking reactions during a cook. Alkali, total dissolved solids and lignin contents are measured during individual cooks in a batch digester house and from several circulations in a continuous digester. Mill trials show good correlations between CLA 2000 measurements and laboratory analyses. Using these measurements it is possible to predict kappa number values before the end of the cook in a batch digester or to alter cooking conditions in a continuous digester to obtain desired kappa number. In addition to kappa number prediction CLA 2000 can be utilised in alkali dosage and residual alkali control. Keywords: Cooking model, cooking liquor analyser, Kappa number, alkali control ISBN 951-42-4964-X University of Oulu ISSN 1238-9390 Control Engineering Laboratory ISBN 951-42-7500-4 (PDF) Linnanmaa FIN -90570 Oulu
1. Introduction New available data from cooking can be measured with the CLA 2000 Cooking Liquor Analyzer developed by ABB. Alkali, total dissolved solids and lignin contents are measured on-line during individual cooks in a batch digester house and from several circulations in a continuous digester. Using these measurements it is possible to predict kappa number before the end of the cook in a batch digester or to control cooking conditions in a continuous digester to obtain desired kappa number. These cooking concentration measurements give also other valuable information from the cook. This report introduces mill trials with CLA 2000 both in continuous digester houses and batch digester houses. The report is a result of a co-operation project between ABB Industry and Control Engineering Laboratory, University of Oulu.
2 Chemical pulping Chemical pulping includes all methods of pulp manufacture in which materials containing cellulose fibres are treated with aqueous alkaline or acidic solutions. The aim of chemical pulping is to remove enough lignin so that the fibres are free and give them the required characteristics at the lowest possible cost. Two processes dominate chemical pulping: the sulphate or the Kraft and the sulphite processes. Each process is designed to produce pulp with specific characteristics. This paper concentrates only on the Kraft process applications. In sulphate pulping the cooking liquor is alkaline. The active chemicals are sodium hydroxide (NaOH) and sodium sulphide (Na2S). The process is named after sodium sulphate (Na2SO4), which is used to replace sodium and sulphur losses. There exist two main types of process equipment for cooking: batch and continuous cooking. Figure 1 shows the principles of batch and continuous cooking processes. In batch cooking a pressurised reactor is filled with chips and cooking liquor. The contents are heated under pressure according to a specified temperature-time programme (H-factor) and after that the digester is emptied. In continuous cooking chips and cooking liquor are fed into the top of the digester in an even flow. The digester is a large, vertical pressurised tube. The chip column is heated up by various circulation systems as it moves downwards. The cooked and partly washed pulp is fed out of the bottom in a uniform flow. In both cases the cooking processes are basically the same. The chips are impregnated with cooking liquor, heated under pressure and held at the certain temperature for some time. Then the pressure and thus the temperature are lowered and the cooked chips are blown or washed out of the digester. The chemical reactions which dissolve the lignin take place
2
mainly whilst the digester is at maximum pressure and the fibres are released. The pulp is then washed, screened, cleaned and dried or pumped over to the paper mill.
Steam
Chips
Pulp towashing
Liquorcirculation
Cookingliquor
Liquor toevaporators
Liquor circulation
Chips andcooking liquor
Pulp to washingWash liquor
A batch digester A continuous digester
Figure 1. Principles of batch and continuous cooking processes. 2.1 Batch digesters Basically there are two types of batch digesters: with direct steam heating and with indirect steam heating. The second type is equipped with forced liquor circulation and a heat exchanger in the circulation line. /1/ The simplest means of direct steam heating is the injection of steam into the bottom cone. Direct heating has the advantage of simplicity and rapid temperature rise. It is still traditionally practised in many pulping plants especially in North America despite the disadvantage of dilution of cooking liquor by condensate and non-uniform heating during a large part of the cook. Liquor dilution lowers the heat economy of the recovery system and temperature differences producing a non-uniform pulp of lower quality. /1/ Indirect heating through heat exchangers together with forced liquor circulation greatly improves the cooking uniformity of a batch digester and eliminates cooking liquor dilution with steam condensate. Indirect cooking units are used where uniformity, quality and heat economy are important. /1/
3
Modified batch cooking technology was developed to find ways to compete with continuous cooking on the energy economy side. At the same time the cooking chemistry was studied in order to find out ways to lower cooking kappa number without destroying the pulp strength or losing the yield. Commercial extended batch delignification systems have been emerged such as SuperBatch, Rapid Displacement Heating (RDH) and Enerbatch. /2, 3/ The RDH and SuperBatch systems are quite similar. These processes are carried out in seven basic steps: chip filling, warm liquor fill, hot liquor fill, bring-up, cooking, displacement and discharge. The differences between these two batch systems are subtle. The primary difference between the two systems is in the brown stock area with washers, screens, mixers, pumps and etc. Some difference between these systems is also in the control strategy. Figure 2 shows the cooking phases of the RDH process. /2, 3/
DisplacementCooking Reactions Are QuenchedDigester is CooledEmpty AnytimeContents Are Washed
7 Hot liquor fill
To Evap.
8 Warm liquor fill
5 Chip fill
4 Preheat white liquor
3 Cold blow
2 Displacement warm liquorWash filtrate
Wash filtrate1 Displacement hot liquor
9 Time at temp.
Steam
HWL
Dig.
Dig.
Dig.
B
Atank
White liquor8 Time at temp.
HWL
Chips
Time to / Time at TemperatureExtended Bulk DelignificationHigh Residual Alkali ConcentrationNo Lignin CondensationAble to Cook to Low Lignin Levels
Chip FillSteam PackingMinimized ChannellingGood UniformityAir Removed from Digester
Warm FillPreimpregnates ChipsNeutralizes and Removes Wood AcidsAccumulates Sulfur in LigninRemoves Hemicellulose
Hot FillRapid HeatingHigh Initial SulfidityDistributes White LiquorRemoves Hemicellulose
Dig.
Dig.
Dig.
Dig.
Dig.
A
BC
C
C B
Figure 2. Cooking phases of the RDH process. 2.2 Continuous digesters There are basically hydraulic digesters and steam-liquid phase digesters or so called vapour phase digesters but also several modifications exist. Hydraulic implies that the digester operates completely filled with cooking liquor without gas space. The hydraulic digester can be a one-vessel system or two-vessel system with a separate impregnation vessel. /1/ Modified continuous cooking (MCC) is based on two main principles. As compared with conventional cooking, the cook starts at a reduced concentration of effective alkali and ends at a higher concentration of effective alkali. The lignin concentration is reduced at the end of the cook. This is accomplished by splitting the alkali charge into different insertion points and by ending the cook in the countercurrent zone where the liquor flows into an opposite direction to the chips. In a typical MCC digester the cooking phase is divided into two
4
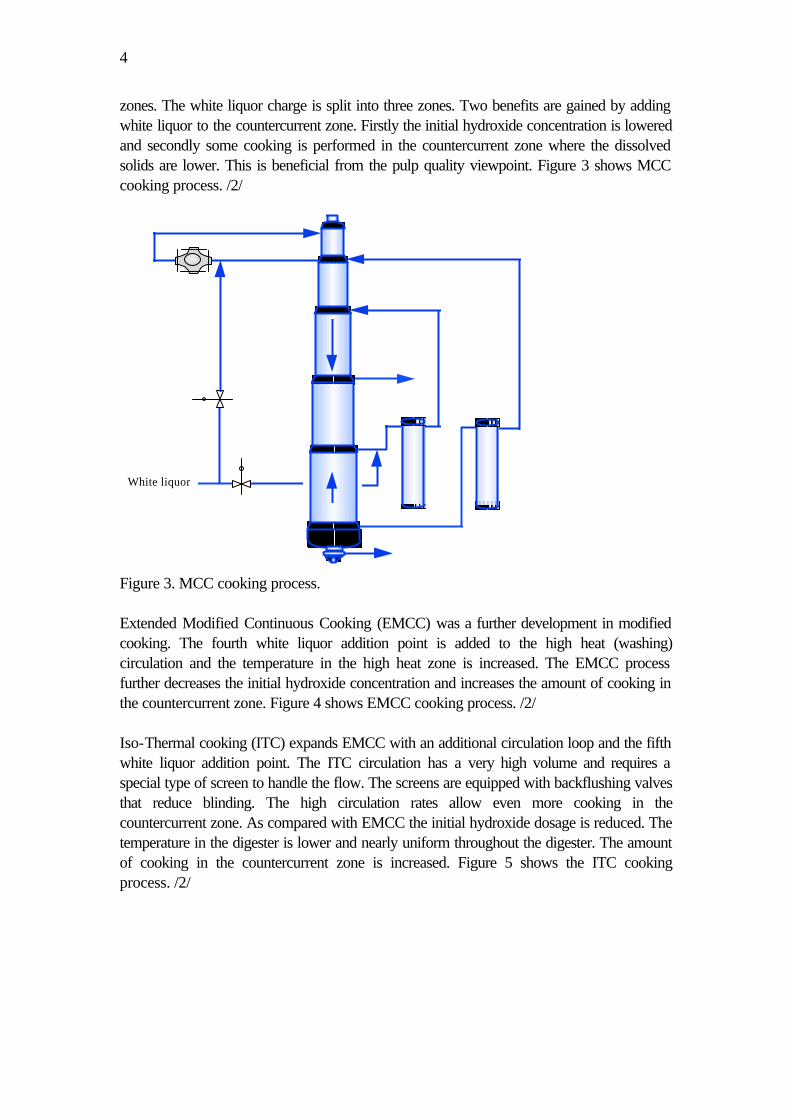
zones. The white liquor charge is split into three zones. Two benefits are gained by adding white liquor to the countercurrent zone. Firstly the initial hydroxide concentration is lowered and secondly some cooking is performed in the countercurrent zone where the dissolved solids are lower. This is beneficial from the pulp quality viewpoint. Figure 3 shows MCC cooking process. /2/
White liquor
Figure 3. MCC cooking process. Extended Modified Continuous Cooking (EMCC) was a further development in modified cooking. The fourth white liquor addition point is added to the high heat (washing) circulation and the temperature in the high heat zone is increased. The EMCC process further decreases the initial hydroxide concentration and increases the amount of cooking in the countercurrent zone. Figure 4 shows EMCC cooking process. /2/ Iso-Thermal cooking (ITC) expands EMCC with an additional circulation loop and the fifth white liquor addition point. The ITC circulation has a very high volume and requires a special type of screen to handle the flow. The screens are equipped with backflushing valves that reduce blinding. The high circulation rates allow even more cooking in the countercurrent zone. As compared with EMCC the initial hydroxide dosage is reduced. The temperature in the digester is lower and nearly uniform throughout the digester. The amount of cooking in the countercurrent zone is increased. Figure 5 shows the ITC cooking process. /2/
5
White liquor
Figure 4. EMCC cooking process.
White liquor
Figure 5. ITC cooking process.
6
As continuous digesters are pushed beyond their design capacity, the filtrate applied in the wash zone begins to impede the downward movement of the chip column. Typically a portion of the washer filtrate is diverted directly to evaporation in these digesters. A portion of the diverted flow, known as a cheater flow with a small amount of white liquor, was added to the upper circulation loop. The cheater flow allowed increased extraction and marginally improved washing. It has been expanded on the concept and added cheater flows to multiple circulation points called as Lo-Solids Cooking. It derives its name from the multiple extraction flows, which lower dissolved lignin and sodium concentrations. /2/ There exist also other types of continuous digesters for example ESCO and PANDIA. ESCO (IMPCO) digester was originally designed to provide an alternative upright download continuous Kraft cooker, which was simple in structure, easy to operate, versatile regarding feed and grades, and of high reliability, resulting in high availability. PANDIA digester consists of one or more horizontal tubes with internal screw conveyors tacked one above the other to provide retention time. PANDIA digesters are most common when cooking non-wood raw materials. /1, 2/ 2.3 Cooking In the digester cooking reactions start when chips are at the cooking temperature. The active chemicals in the cooking liquor react with lignin in chips and convert it chemically into the compounds that dissolve in the cooking liquor. Lignin is the bonding material in chips that holds individual fibres together. After dissolving the lignin, fibres are easily separated into the mass that is leaving the digester as pulp. Unfortunately the chemicals also react with fibrous material and break down the molecular bonds of them. These reactions are to be avoided as much as possible because they lead to losses in fibre yield and decrease the strength of pulp. Therefore cooking conditions that prefer lignin removal with the least effect to fibres must be applied. H-factor is regularly used in controlling the reaction end-point in batch digesting. It describes the combined effect of reaction temperature and reaction time. In practice it means that when longer reaction time is available the same cooking result can be obtained with a lower temperature. In the continuous digester the cooking time depends on the production rate and the constant H-factor is achieved by adjusting the cooking temperature. Equation (1) describes the delignification of Kraft pulping
kCLdt
dL −= (1)
where L is the lignin content of chips, C is the effective alkali concentration of the cooking liquor in the chips, k is the temperature dependent reaction rate constant and t is the cooking time. The temperature dependency of the reaction rate constant k is usually presented by the means of Arrhenius equation
7
RT
EB
oekk−
= (2)
where E is the activation energy, R is the universal gas constant, T is the absolute tem-perature and ko and B are constants. The parameters depend on wood species, cooking stage, etc. H-factor describes the joint effect of time and temperature and it is usually given as the following integral
dtkHt
t
r
o
∫= (3)
where to is the initial time for calculation, t is the actual time and kr is the relative reaction rate coefficient as defined by the following equation
Tr ek
1611320.43 −
= (4)
where T is the absolute temperature. This temperature must exceed 100oC for faster increase in the H-factor. The H-factor defined in Equation 3 does not include the effect of chemical concentrations and liquor/wood ratio. The parameters in Equation 4 depend on wood species. Equations 5 and 6 show a model including also the results from effective alkali measurement /5/. The model is composed of two differential equations
[ ] ff EALT
BA
dt
dL f
ff
βυα
−−= exp (5)
[ ] [ ] cfcf EALT
BA
dt
EAd cf
cfcf
βυα
−−= exp (6)
where L is the ratio of lignin to cellulose, EA is the concentration of effective alkali, A and B are constant defined already earlier, α is the rate constant and β and µ are the orders of primary and secondary reactions. There exist also some modifications of the basic H-factor where also the chemical concentration during the cook is taken into account.
3 CLA 2000 Cooking Liquor Analyzer CLA 2000 is an advanced measurement device developed to analyse chemical pulping processes. It is an analyser with a new advanced sampling technique and a serial array of robust sensors. CLA 2000 enables continuous analysis of alkali concentration and
8
concentrations of total dissolved solids and dissolved lignin during individual batches in a batch digester house or from several circulations in a continuous digester. This opens up a new window into the cooking process for monitoring inorganic and organic substances and makes it possible to supervise and control the cooking process in a responsive and effective way. In Kraft cooking on-line information given by CLA 2000 can be used to improve the calculation of the conventional cooking factor. The analysis of alkali and total dissolved solids at the beginning of the cook describes the true alkali charge and takes the most important factors in chip or liquor quality into account. In modern batch digester houses with cold blow, the concentrations of different liquor dosages and displacements can also be measured and controlled. As the cook progresses, all three measurements give information showing how the cooking factor compares with cooking reactions. With batch digester operation it is possible to terminate the cooking process just when the required cooking degree has been achieved, or to alter the final cooking conditions in continuous digesters to obtain the desired quality. CLA 2000 provides multifunctional kappa number control when combined with advanced digester house control systems. Figure 6 shows CLA 2000 based cooking monitoring. The basic application of CLA 2000 is in controlling the alkali dosage and profile. In Low Solids cooking the system can also be used to monitor and control the solids profile. The next step is to predict the blow line kappa number based on the cooking concentrations measured by CLA 2000. Further possibility is to use that information as estimating yield and strength properties of the pulp.
4 Accuracy of CLA 2000 measurements Accuracy of CLA 2000 measurements has been studied both in batch digester houses and in continuous digester houses. Accuracy studies included only concentration measurements for alkali and dissolved solids because typically there are no laboratory method and apparatus available for analysing dissolved lignin at the mills. This report gives a short summary of the results. Figure 7 shows effective alkali concentration as the function of conductivity and figure 8 shows total dissolved solids content as the function of refractive index. These trials have been done in the SuperBatch digester house in Metsä-Rauma, Finland. Other results of the accuracy trials are shown in appendices 1-5.
9
BATCH COOKING
CLA 2000
CLA 20002 x CLA 2000
Spiral filter
Sample lineswitch valve
Cookingcirculations
Extraction
CONTINUOUS COOKING
Figure 6. CLA 2000 analyser based cooking monitoring.
Figure 7. Effective alkali concentration as the function of conductivity.
10
Superbatch, cooking circulation
y = 344,62x - 454,48
R2 = 0,9583
11,0
12,0
13,0
14,0
15,0
16,0
17,0
18,0
19,0
20,0
21,0
22,0
23,0
1,355 1,359 1,363 1,367 1,371 1,375 1,379 1,383
CLA 2000 refractive index
Lab.
dry
sol
ids
%
Figure 8. Total dissolved solids content as the function of refractive index.
5 CLA 2000 data modelling A detailed mathematical model is based on a thorough understanding of the nature and behaviour of the actual process. It makes this approach laborious, costly and time consuming, and first of all this knowledge should be available. In many cases the process is too complicated and not completely understood. In these cases it is practical to use a different approach where available process measurements provide the necessary information. CLA 2000 analyser provides that kind of information during the cook, which can be used in modelling. Modelling has been done with data from indirect type of batch digesters, SuperBatch digesters and Kamyr continuous digesters. In modelling the least square fit was mainly applied. Artificial neural networks were also studied in modelling but they are a suitable method only for mills where also an on-line kappa number device can be used because in network training a lot of data is necessary. The most important thing in network training is the quality of data. Too noisy and insufficient data yields networks with poor results in generalisation. 5.1 Modelling methods 5.1.1 PLS method Partial least squares method is a multivariate regression method suited to studying the variation in large numbers of highly correlated process variables (xj) and relating them to a set of output variable (yj). ). If there is a number of data points (yi, x1i, x2i, …,xni; i = 1,M)
11
with one dependent variable, y, and many independent variables, xj, where j = 1,2, …, n, an equation can be written: y a a x a x a xn n= + + + +0 1 1 2 2 ... . (7)
Residual, R, can be written
( )( )R y f x x xi i i i nii
M2
1 21
2
= −=∑ , ,..., . (8)
One way of finding the minimum of the above expression is to calculate the derivative as to individual parameters. Parameters for the equation (2) can be solved from these equations. ∂∂
R
ai
= 0 (9)
5.1.2 Neural Networks The most popular neural network architecture is feedforward networks of sigmoid computing units. In the kappa number modelling back propagation networks with Levenberg-Marquardt algorithm were studied. Using neural networks it is essential that the number of parameters in the network is not too large compared with the number of training samples. The basic concept in understanding the operation of the network is separation of the number of weights in the network and the effective number of parameters in the network. In the beginning of the network training the weights invariably decrease near to zero producing almost linear mapping. During the training the weights grow and the operation points of the hidden units move to increasingly non-linear parts of the sigmoid functions producing more and more non-linear mapping or increasing the number of the effective parameters in the network. The question is to find out a procedure to obtain a model that contains a correct number of effective parameters and to yield good generalisation. In kappa number modelling good networks with used training sets were developed but the main problem remained in the generalisation ability. /4/ 5.2 Trials in batch digester houses In batch digester house tests kappa number prediction equations were formed using CLA 2000 measurements from one or two points during the cook. The idea behind this is the assumption that at each point of time measurements describe the current state of the cook, and how the cook has progressed. Using constructed equations the target H-factor for all cooks can be formed giving the desired kappa number target. In this way decreased kappa number deviation can be achieved resulting in better pulp quality and saving costs at the bleach plant.
12
5.2.1 SCA Packaging Obbola There are eight conventional, indirectly heated digesters and two CLA 2000 Measuring Units installed at Obbola Kraft mill. Both units measure from four different digesters from the bottom circulation line before the heat exchanger. Pulp is produced for the paperboard machines, so the kappa number in the cook is much higher than normally. Mixed softwood species, northern pine and spruce are cooked. The digesters perform quite identically based on the experiences during the test period. The digester house is equipped with Advant OCS-system and Autocook/B control. Cooking control is based on modified H-factor. CLA 2000 measurements are read from each cook at QHA-factor 104 and H-factor 100. QHA-factor is a similar time integral as H-factor. It is used when the measurements are taken at early phase of the cook, because H-factor calculation will be started later at quite high temperature. Autocook/B system controls the analyser to the correct timing when the measurements need to be read from each digester. The configuration of the system is shown in figure 9.
CLA 2000 No. 1Digester 1 - 4
CLA 2000 No. 2Digesters 5 - 8
CLA 2000ABB CLA 2000ABB
ABBAdvant OCS
Figure 9. CLA 2000 system installation at Obbola mill. The data collected from the Obbola mill during the test period included about 60 different cooks from two digesters. Approximately 10 cooks were removed due to erroneous looking data, leaving 48 cooks to fit in modelling. Data collected included in addition to CLA 2000 measurements also the other process information from all the cooks. An equation was formed for the target H-factor based on the kappa number target and CLA 2000 measurements. As described measurements were taken at two different points
13
of time from the cook. Because a static equation was formed with no explicit time dependence, the measurements must be taken each time at the same H-factor or QHA-factor value. The conditions in the digester have to be reasonably stable at the time of the measurements, and the last measurement must not be taken too late. Due to the requirement that the measurements are taken at specified points of time there must be some means to correct the values if the measurement time is not exactly as specified. Linear corrections for the effective alkali (EA) and UV measurements can be used in this case. The slope of the linear fit of RI values is so small that a correction is meaningless. The following corrections are used: EAmo = EAme + a(QHAme - QHAmo) (10) UVmo = UVme - b(QHAme -QHAmo) (11) EAMO = EAME + c(Hme - Hmo) (12) UVMO = UVME - d(Hme -Hmo) (13) Where EAmo, UVmo, EAMO, UVMO are corrected values, EAme, UVme, QHAme, Hme are measured values, QHAmo, Hmo are the constant values and a, b, c, d are coefficients. Using PLS methods in Matlab the following H-factor target model can be formed: Htarget = f(K, EAmo, RIMO) (14) where K = kappa number target. Figure 10 shows modelled H-factor target values versus the achieved H-factor. This CLA 2000 based H-factor model is now in use at the Obbola mill. During the test period kappa number standard deviation decreased 48.5 % when the CLA 2000 based model was compared to the conventional H-factor model. 5.2.2 Sunila Sunila Kraft mill has a quite old digester house and there are thirteen digesters and four CLA 2000 Measuring Units. One unit measures from three to four different digesters from an upper circulation line after the heat exchanger. Later a measurement point from the white liquor was added in one analyser system. Mixed softwood species, northern pine and spruce are cooked and the kappa number target is typically 25. The digesters are of different sizes and ages, and their performance vary to great extend which is typical in old digester houses. Figure 11 shows CLA 2000 system installation.
Figure 10. Modelled H-factor target vs. achieved H-factor at Obbola mill.
CLA 2000 No. 1Digesters 1 - 3
CLA 2000 No. 2Digesters 4 - 6
CLA 2000 No. 3Digesters 7 - 9
CLA 2000 No. 4Digesters 10 - 13
CLA 2000ABB CLA 2000ABB CLA 2000ABB CLA 2000ABB
DCS
Figure 11. CLA 2000 system installation at Sunila mill.
15
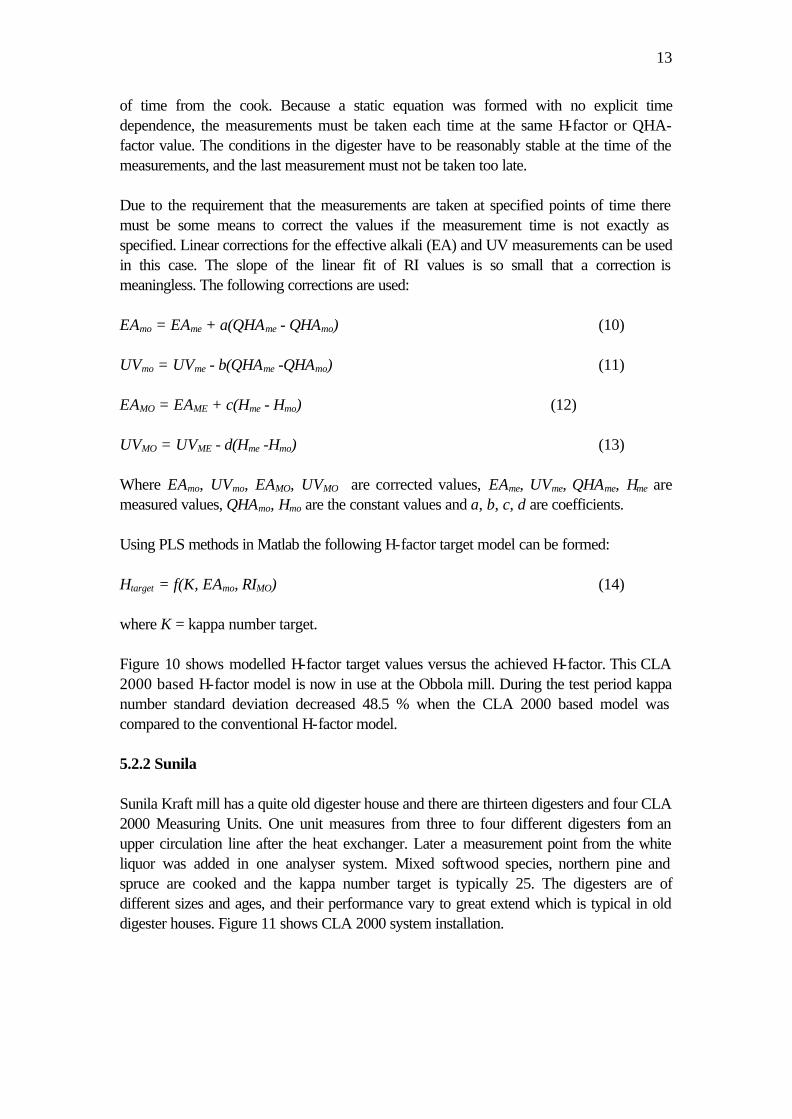
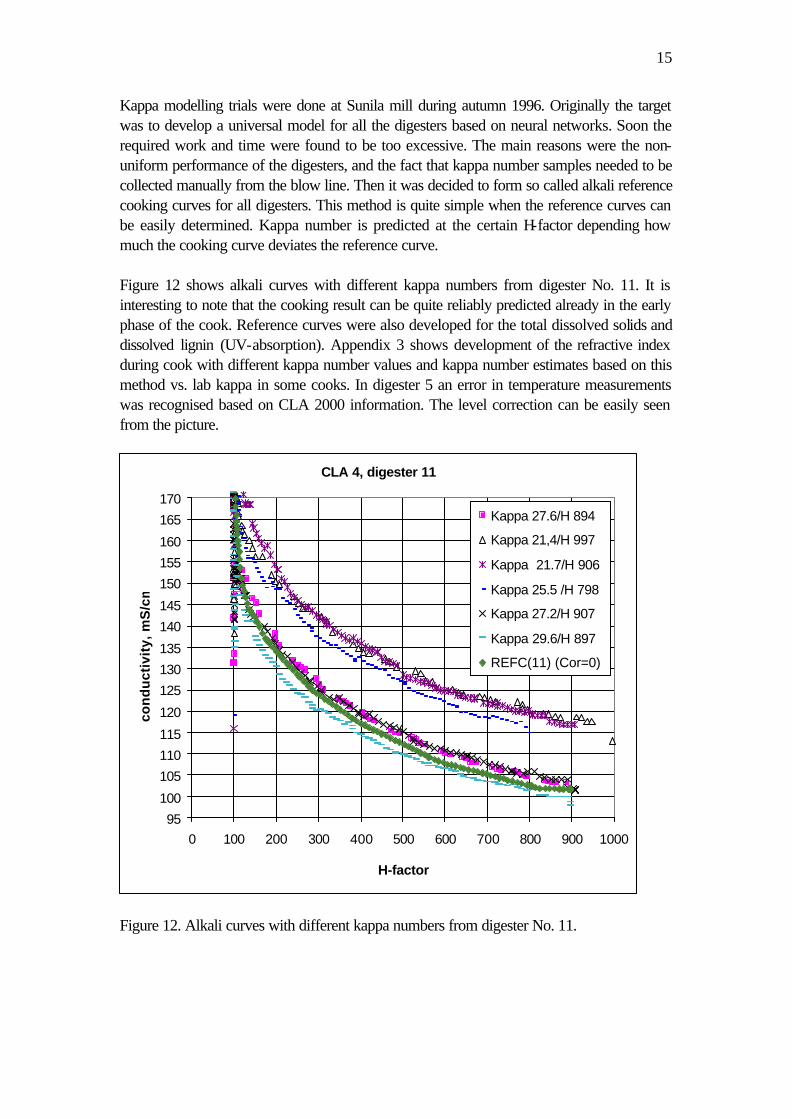
Kappa modelling trials were done at Sunila mill during autumn 1996. Originally the target was to develop a universal model for all the digesters based on neural networks. Soon the required work and time were found to be too excessive. The main reasons were the non-uniform performance of the digesters, and the fact that kappa number samples needed to be collected manually from the blow line. Then it was decided to form so called alkali reference cooking curves for all digesters. This method is quite simple when the reference curves can be easily determined. Kappa number is predicted at the certain H-factor depending how much the cooking curve deviates the reference curve. Figure 12 shows alkali curves with different kappa numbers from digester No. 11. It is interesting to note that the cooking result can be quite reliably predicted already in the early phase of the cook. Reference curves were also developed for the total dissolved solids and dissolved lignin (UV-absorption). Appendix 3 shows development of the refractive index during cook with different kappa number values and kappa number estimates based on this method vs. lab kappa in some cooks. In digester 5 an error in temperature measurements was recognised based on CLA 2000 information. The level correction can be easily seen from the picture.
CLA 4, digester 11
95
100
105
110
115
120
125
130
135
140
145
150
155
160
165
170
0 100 200 300 400 500 600 700 800 900 1000
H-factor
cond
uctiv
ity, m
S/c
m
Kappa 27.6/H 894
Kappa 21,4/H 997
Kappa 21.7/H 906
Kappa 25.5 /H 798
Kappa 27.2/H 907
Kappa 29.6/H 897
REFC(11) (Cor=0)
Figure 12. Alkali curves with different kappa numbers from digester No. 11.
16
5.2.3 Kaukas Kaukas is a modern SuperBatch plant cooking both hardwood and softwood. Mill trials were done at Kaukas mill during spring -97. Analyser measures from two digesters from the upper circulation line after the heat exchanger. Figure 13 shows the CLA 2000 system installation.
Cooking Liquor (2 digesters)
CLA 2000ABB
DCS
Figure 13. CLA 2000 system installation at Kaukas mill. Modelling was done with data from the softwood digester based on the same principle as in Obbola. The points of time for taking CLA 2000 measurements were at two H-factor values. The number of cooks collected was as much as ninety because an on-line kappa device was available. This made modelling easier but arouse also questions because manually collected samples seemed to be more reliable than those from the on-line analyser. The analyser takes three samples during one discharge but all the samples are not always representative. For example the last one can be taken too late. Figure 14 shows predicted kappa numbers according to the equation (15) as well as measured kappa number values from the analyser. A couple of points deviate quite a lot probably due to errors in kappa analysis. Kf =f(Hf, RI, C) (15) where K f = kappa final, Hf = H-factor final, RI = refractive index and C = conductivity, mS/cm.
17
Superbatch
15
20
25
30
35
40
45
50
0 20 40 60 80 100
Kap
pa
kappa
Kappa est.
Figure 14. Estimated and measured kappa numbers. 5.2.4 Metsä-Rauma Metsä-Rauma is also a modern SuperBatch cooking plant designed only for TCF-pulp. The digester house consists of eight 400 m3 digesters. The production capacity is 500 000 tons/year. Other design factors in the process are oxygen delignification and ozone stages and peroxide bleaching. This cooking plant is also the first one equipped with round-bottom digesters. Test trials at Rauma mill were done during summer -97. The analyser measured from one digester from the bottom circulation line. CLA 2000 readings during cooking phases are shown in figure 15 and 16. Figure 15 shows that CLA 2000 UV-absorbance values starts to reach a steady level at the end of the cook but total solids concentration still increases. It can be concluded that lignin does not dissolve significantly at the end of the cook.
18
Superbatch, cooking phases
1.5
1.7
1.9
2.1
2.3
2.5
2.7
2.9
3.1
3.3
3.5
3.7
3.9
4.1
4.30:
45:4
1
0:53
:12
1:00
:42
1:12
:13
1:19
:43
1:27
:44
1:39
:15
1:47
:15
1:58
:46
2:06
:46
2:14
:17
2:26
:17
2:33
:48
2:45
:49
2:53
:19
3:00
:50
3:12
:50
3:19
:51
3:27
:51
3:39
:22
3:47
:22
3:58
:53
Time (July 7, 1997)
CLA
200
0 U
V-a
bsor
banc
e
14.00
15.00
16.00
17.00
18.00
19.00
20.00
21.00
22.00
23.00
24.00
25.00
26.00
CLA
200
0 T
otal
sol
ids
%
UV-absorbance
total solids
Impregnation
Displacement
Bring-up & Cooking
Leveling
WhiteLiquorDosage
1st hot Black Liquorfilling
2nd hot BlackLiquor filling
Figure 15. CLA 2000 UV-absorbance and total solids content vs. cooking time.
Superbatch, cooking phases
5
10
15
20
25
30
35
40
45
50
55
60
65
70
75
80
0:45
:41
0:53
:12
1:00
:42
1:12
:13
1:19
:43
1:27
:44
1:39
:15
1:47
:15
1:58
:46
2:06
:46
2:14
:17
2:26
:17
2:33
:48
2:45
:49
2:53
:19
3:00
:50
3:12
:50
3:19
:51
3:27
:51
3:39
:22
3:47
:22
3:58
:53
Time (July 7, 1997)
CLA
200
0 R
esid
ual a
lkal
i g(N
aOH
)/l
alkali
Impregnation
Displacement
Bring-up & Cooking
Leveling
WhiteLiquorDosage
1st hot Black Liquorfilling
2nd hot BlackLiquorfilling
Figure 16. CLA 2000 residual alkali vs. cooking time.
19
The idea behind the modelling is the same as before. Pulp samples were collected manually during the discharge. The selected points of time taking CLA 2000 measurements were at two different H-factor values. Linear corrections for measurements at these points were formed as earlier. Number of cooks analysed including kappa number samples was 28. For a reliable model it is required that the ratio between the number of fitted parameters and the number of data points is small. Because the number of kappa number samples was quite small, only three parameters at maximum were used in modelling. The following equation was formed: Kf =f(RI, C, Hf) (16) Figure 17 shows estimated CLA 2000 based kappa number as the function of laboratory kappa number. As it can be seen the correlation is quite good (R2 = 0.85). Figure 18 shows laboratory kappa number as the function of H-factor, only. As figure shows R2 = 0.75 so an improvement in kappa number control can be achieved using CLA 2000 measurements. In a longer term when there are more cooks available with laboratory kappa numbers the improvement is expected to be even bigger.
Superbatch, est.kappa = f(CLA 2000 measurements, H factor)
Figure 17. Estimated kappa as function of laboratory kappa.
20
SuperBatch, estimated kappa = f(H-factor) R2=0.75
10111213141516171819202122232425262728
450 500 550 600 650 700 750 800 850 900 950 1000
H-factor
labo
rato
ry k
appa
Figure 18. Laboratory kappa as the function of H-factor. 5.3 Trials in continuous digester houses In a continuous digester house CLA 2000 can measure from several circulations. Normally it measures from extraction, transfer and trim (cooking) circulation but also counter-current and wash circulation can be measured. 5.3.1 UPM-Kymmene Kuusanniemi Preliminary tests using CLA 2000 measurements for kappa number prediction were done in Kuusanniemi Kamyr digester with the CLA 2000 prototype analyser. The digester is a dual vessel digester having the following circulations: impregnation, transfer, trim and washing circulations. Measurements were taken from all the circulations except the washing circulation and in addition from the extraction. The digester cooks only softwood. Blow-line kappa was recorded from an on-line analyser. The measurements from all the points succeeded well and measurement accuracy was as described earlier. Several kappa number predictions were done with different combinations of CLA 2000 measurements. Neural networks were used in modelling. Figure 19 shows an example of these models. In this figure about 50 % is training data and the rest is validation data.
21
Kappanumber vs. Lab. Kappa
20
25
30
35
40
1.2.19950:00
2.2.19950:00
3.2.19950:00
4.2.19950:00
5.2.19950:00
6.2.19950:00
7.2.19950:00
8.2.19950:00
9.2.19950:00
10.2.19950:00
11.2.19950:00
Time
Kap
pa
KappaNetwork(5)
Figure 19. Kappa number model compared to laboratory kappa number values. 5.3.2 Enso Fine Papers Oulu The continuous digester at Oulu was originally designed as a standard dual-vessel, vapour-phase digester for a capacity of 680 tons/d softwood. Now the digester has been modified as quite special having no circulation inside the digester at all. Two different wood species softwood and hardwood are cooked in the digester with capacities of 1200 tons/d and 1300 tons/d, respectively. CLA 2000 prototype analyser measures liquor from the extraction and transfer circulation. Kappa number level for softwood is 30 and for hardwood 19. Modelling was done from data during softwood cooking. Using CLA 2000 measurements and also extraction temperature measurements an equation (17) for kappa number was formed. Figure 20 shows the estimated kappa number and the measured kappa number from an on-line kappa number analyser at the same production rate. The issue is how to handle different production rates in modelling. kappa = f(ExtrT, ExtrRI, ExtrC) (17) where ExtrT = extraction temperature, C, ExtrRI = extraction refractive index and ExtrC = extraction conductivity, mS/cm.
22
Kamyr Digester
25
26
27
28
29
30
31
32
33
34
35
36
0 150 300 450 600 750 900 1050 1200
Kap
paKappaBF
Kappa est.
Figure 20. Estimated and measured kappa numbers in a continuous digester. Because both hardwood and softwood are cooked also measurement accuracy tests were carried out for the both species. The results are presented in appendix 3. It is noteworthy to see that the accuracy can be improved when different species are handled separately. It is not easily done with most of the conventional alkali measurements on the market. 5.3.3 Enso Kaukopää The continuous digester in Kaukopää is a conventional dual vessel, vapour phase digester cooking only hardwood (birch). Kappa number target is 18. CLA 2000 measures from the transfer and washing circulation and from the upper and lower extraction. At this writing the kappa number modelling has not been done. Measurement accuracy tests were done with good results (appendix 5). Figure 21 shows CLA 2000 system installation.
Summary CLA 2000 mill trials have been done in conventional batch digester houses (both paper grades and high yield pulps), SuperBatch digester houses as well as in continuous digesters of different designs. Both hardwood and softwood liquors were studied. All the mill trials show a high correlation between CLA 2000 conductivity measurement and the alkali concentration as well as CLA 2000 refractive index measurement and the dry solids concentration. For the UV measurement accuracy compared to actual lignin concentration is harder to verify due to typically lacking analysis methods and apparatus. Using CLA 2000 measurements empirical models for kappa number prediction already during the cooking phase can be built, that lead to a better cooking control as the result. Correlation between the predicted kappa number and analysed blow-line kappa number showed clearly better results than using conventional methods only. In addition to kappa number prediction CLA 2000 can be utilised in alkali dosage and residual alkali control.
24
REFERENCES 1 Kocurek, M.J., Pulp and Paper Manufacture:Alkaline pulping. Third edition. Quebec 1989, The Joint Textbook Committee of the Paper Industry. 637 p. 2 Headley, R.L., Pulp Cooking Developments Focus on Fiber Yield, Lower Chemical Use. Pulp & Paper 70(1996)10, p. 49-57. 3 Weckroth, R., Hiljanen, S., Superbatch Cooking from Innovation to Experience, Pori, Sunds Defibrator Pori Oy. 4 Lampinen, J., Advances in Neural Network Modeling. In:Yliniemi, L ., Juuso, E. (Editors). Proceedings of TOOLMET97 - Tool Environments and Development Methods for Intelligent Systems. Oulu 1997, Oulu University. p. 28 - 35. 5 Wells C.H., Effective alkali sensors for batch digester control. Tappi 73(3):181 (1990).
Figure 30. Solids content vs. CLA 2000 refractive index.
ISBN 951-42-4964-X ISSN 1238-9390 University of Oulu Control Engineering Laboratory
1. Yliniemi L., Alaimo L., Koskinen J., Development and Tuning of A Fuzzy Controller for A Rotary Dryer. December 1995. 2. Leiviskä K., Simulation in Pulp and Paper Industry. February 1996. 3. Yliniemi L., Lindfors J., Leiviskä K., Transfer of Hypermedia Material through Computer Networks. May 1996. 4. Yliniemi L., Juuso E., (editors), Proceedings of TOOLMET'96- Tool Environments and Development Methods for Intelligent Systems. May 1996. 5. Lemmetti A., Leiviskä K., Sutinen R., Kappa number prediction based on