Karanikolos, M; Khoshaba, B; Nolte, E; McKee, M (2013) Compar- ing population health. In: Health system comparison An agenda for policy, information and research. Open University Press, Maiden- head, pp. 127-156. Downloaded from: http://researchonline.lshtm.ac.uk/1366943/ DOI: Usage Guidelines Please refer to usage guidelines at http://researchonline.lshtm.ac.uk/policies.html or alterna- tively contact [email protected]. Available under license: http://creativecommons.org/licenses/by-nc-nd/2.5/
Transcript
Karanikolos, M; Khoshaba, B; Nolte, E; McKee, M (2013) Compar-ing population health. In: Health system comparison An agenda forpolicy, information and research. Open University Press, Maiden-head, pp. 127-156.
Marina Karanikolos, Bernadette Khoshaba, Ellen Nolte and Martin McKee
5.1 Why measure population health outcomes?
The 2000 World Health Report (WHR2000) identifi ed three fundamental goals for a health system: improving the health of the population it serves; responding to the reasonable expectations of that population; and collecting funds to do so in a way that is fair (WHO, 2000). In this chapter, we focus on the fi rst of these: improving population health. Before doing so, however, we summarize briefl y the work that has taken place on this issue so far.
The authors of the WHR2000 faced a challenge. They were required to esti-mate performance for all 191 of the WHO Member States, of which only about 60 had any data on causes of death. Consequently, the only measure of popu-lation health outcomes available to them was mortality, and even then it was necessary to produce estimates for many countries, based on empirical rela-tionships with other measures, such as economic status (McKee, 2010). This determined their chosen defi nition of the health system, which they decided would include “all activities, whose primary purpose is to promote, restore and maintain health”. The actual indicator used was disability-adjusted life years, which incorporated a measure of morbidity, but again this was estimated for most countries.
This approach was the only one possible given the need to include so many countries. Although controversial, it has served as a basis for many of the subsequent developments in assessing health systems performance. It was also consistent with a considerable body of previous research on the performance of countries worldwide that had also used mortality-based measures of health outcome (although more often infant and under-fi ve mortality), which are available from Demographic and Health Surveys for many countries without vital registration systems.
Book 1.indb 127Book 1.indb 127 12/04/2013 08:3712/04/2013 08:37
128 Health system performance comparison
Other research has focused on high-income countries where more data are available, creating the potential for more sophisticated analyses that take advantage of the availability of information on deaths by cause to develop indicators that more closely relate to the delivery of health care as opposed to broader social and economic factors (Arah et al., 2006). One use of these data is to measure avoidable mortality, defi ned as deaths that should not occur in the presence of timely and effective care (Nolte & McKee, 2004).
Although avoidable mortality is clearly an advance on all-cause mortality, it too has a number of limitations, in particular, attribution of outcomes to particular policies or interventions, as will be discussed later. It is also limited in its defi nition of avoidable deaths, as it tends to limit them to deaths occurring below a specifi ed age (now typically 75), thus denying the contribution of health care to reducing mortality at older ages. This is in large part because of the diffi culty of assigning a single cause of death for those dying at old age while suffering from multiple disorders. Its focus on mortality also disregards the role of health care in reducing disability and discomfort.
Other work takes advantage of data on the process of care and the outcomes of specifi c interventions, mostly drawn from the growing volume of adminis-trative data in some countries. An example is the OECD’s HCQI project (Kelley & Hurst, 2006).
We begin this chapter by exploring the differing defi nitions of a health system. We then describe contemporary usage of population health measures; the strengths and limitations of existing measures; and the methodological chal-lenges to employing them to assess health systems performance. We conclude by exploring potential areas for further research and, specifi cally, the scope for using the concept of avoidable mortality and tracer conditions, both of which offer a set of complementary mechanisms to compare health systems across countries and over time. Finally, we discuss what they cannot tell us about health systems and the potential unintended consequences of using them.
5.2 What is a health system?
The scope of what constitutes a ‘health system’ in a given setting varies. There are many activities contributing – directly or indirectly – to improving the population’s health that, in different countries, may or may not be included in what is considered to be the health system. For example, it is not always clear how much a health system can be held responsible for promoting healthy lifestyles and reducing the prevalence of risk factors in the general population. Policies that affect population health are often outside the direct control of the health system, such as tobacco and alcohol policies. In addition, the boundary with other sectors within a country can be indistinct. This is typically a problem with social care, with boundaries often being determined by diverse administrative arrangements. There are also differences in how areas such as medical education and research are dealt with in comparisons, although work on National Health Accounts seeks to address these issues.
Book 1.indb 128Book 1.indb 128 12/04/2013 08:3712/04/2013 08:37
Comparing population health 129
A further complication relates to the population covered by a given system. This may be determined by fi nancial and/or organizational arrangements exemplifi ed by multiple systems that vary in ownership. One example is the US health system, which represents a composite of multiple subsystems, comprising a mix of overlapping public and private elements, variously covering those in employment, older people (Medicare), those at the lower or no income scale (Medicaid), military personnel (Veterans Affairs), and others. Even in countries with nearly universal coverage, privately funded subsystems are common; for example, in the United Kingdom, about 10% of the British population have private insurance to supplement their coverage by the NHS (OECD, 2004).
Elsewhere, administrative territorial divisions within countries may also challenge the defi nition of what should be considered to be the health system. For example, following political devolution for the constituent countries of the United Kingdom in 1999, responsibility for the NHS in Northern Ireland, Scotland and Wales was transferred to subnational governments, while the Department of Health retained oversight of the NHS in England. This has led to increasingly diverging health systems in the four countries, while the Department of Health remains responsible for UK-wide health matters, such as the control of infectious diseases, and for representing UK health policy in international and European fora.
These issues add to the complexity of comparing health systems performance internationally and help to explain why WHR2000 adopted a broad defi nition of a health system, which includes “all activities and structures that impact or determine health in its broadest sense within a given society” (WHO, 2000). Arah et al. (2006) more specifi cally distinguished between the health system and health care system, with the former closely resembling the one adopted by WHR2000. In contrast, the health care system is defi ned as the “combined functioning of public health and personal health care services” that are under the “direct control of identifi able agents, especially ministries of health” (Arah et al., 2006) (see Chapter 2 for more details). A related issue concerns the boundaries with sectors such as social care, which are often determined by diverse administrative arrangements and thus may or may not be included in the defi nition of the health (care) system.
To some extent, the defi nition of the health (care) system will depend on the question being asked. While it is important to recognize the various distinctions, it is equally important to realize that, in practice, concepts are likely to mean different things to different actors and that the precise boundaries of health (care) systems remain diffi cult to defi ne, although it is important to keep in mind issues relating to sectoral boundaries, ownership and geography.
5.3 Broader determinants of population health
Variation in health outcomes such as mortality is often used to explain the success or failure of health systems. However, the reasons for diversity in health patterns between and within populations are multifaceted, refl ecting a complex interplay of factors, ranging from underlying economic and political circum-stances to more proximal risk factors, such as lifestyle-related determinants of
Book 1.indb 129Book 1.indb 129 12/04/2013 08:3712/04/2013 08:37
130 Health system performance comparison
health, with health care also playing a role, as identifi ed by the health fi eld concept advanced by Lalonde (Lalonde, 1974).
Irrespective of how narrow (or broad) our defi nition of a health system is, it is essential to begin with an understanding of the range of infl uences on population health. Figure 5.1 (WHO, 2009), which is itself a greatly simplifi ed representation of reality, indicates the complexity of interactions among different factors that contribute to the onset of, and ultimate mortality from, just one condition: ischaemic heart disease (IHD).
Some of these factors are clearly beyond the control of the health system, such as age and levels of income and education, although arguably health systems might indirectly exert infl uence to minimize the health impact of such factors through active engagement with other sectors in society with a more immediate impact on socioeconomic factors in particular. Similarly, changes in common behavioural risk factors for ill health, such as smoking, alcohol use and poor diet, through population-wide strategies tends to be outside the immediate control of health systems as they require close interaction and cooperation with other sectors (economy, education, etc.), although measures to address lifestyle factors such as smoking are usually, but not inevitably, initiated by
Figure 5.1 Major factors leading to ischaemic heart disease
Adapted from: WHO, 2009.
Book 1.indb 130Book 1.indb 130 12/04/2013 08:3712/04/2013 08:37
Comparing population health 131
the health sector. Health professionals can also advocate for increases in taxes on cigarettes, or a ban on smoking in public places. It is equally possible to identify both individual and population-based measures to tackle the other intermediate risk factors identifi ed in Figure 5.1.
Crucially, the health system, however broadly defi ned, cannot tackle these risk factors on its own; nor can it be held accountable for failure to reduce the resulting deaths that arise from a lack of action. This does not, however, absolve governments as a whole from responsibility, and it is possible to translate this model of disease causation into indicators of overall government performance on health. This is analogous to the way that commentators judge governments on their ability to achieve growth in gross national product (GNP); they are not expected to create growth directly by, for example, nationalizing manufacturing and services, but they are expected to create the conditions within which economic growth can take place. From this perspective, it is entirely appropriate to hold governments accountable for improvements in aggregate measures of health, such as life expectancy at birth, as well as for their implementation, or failure thereof, of evidence-based policies to reduce deaths from preventable causes and their corresponding risk factors. An obvious example of the latter is a ban on smoking in public places, which many European governments have introduced successfully, with rapid reductions in cardiovascular disease. However, this does not mean that a government must do everything itself. As the example in Box 5.1 shows, there is an important role for civil society, although ultimately, where others do not take action, governments must step in to advise, regulate or legislate where appropriate.
The implication of this brief discussion is that governments should be held to account for progress in the overall health of their populations, in exactly
Box 5.1 Sudden infant death syndrome prevention in the UK
In the United Kingdom, a national campaign to prevent sudden infant death syndrome (SIDS) was launched in 1991 by a voluntary organization, the Foundation for the Study of Infant Deaths, as a result of the Avon study. After attracting wide media publicity, the government responded by issuing a policy statement to health professionals, followed by a national leafl et accompanied by television and press advertising (McKee et al., 1996). Prior to this formal campaign, the Foundation for the Study of Infant Deaths had issued a press release about the Avon research (Fleming et al., 1990) showing the ninefold increase in the probability of prone sleeping among sudden infant deaths. This attracted considerable media attention and, together with the publication of research from the UK and other countries, some health professionals began to advise a change in sleeping position before the offi cial campaign (Scott et al., 1993). A combination of several factors (accumulation of research, active voluntary group, media coverage and capacity to review health policy) resulted in an almost threefold decrease in deaths attributed to SIDS in the UK between 1990 and 1991 (FSID, 2011).
Book 1.indb 131Book 1.indb 131 12/04/2013 08:3712/04/2013 08:37
132 Health system performance comparison
the same way as they are judged on economic progress. This must, however, be informed by an understanding of the locus of authority; there is little point in holding a national government to account for failure to implement policies that are, constitutionally, the responsibility of regional authorities.
In the next section we explore the strengths and weaknesses of various measures of population health as potential indicators of health system performance.
5.4 Common measures of population health
The most commonly used measures of population health, such as total mor-tality, life expectancy, premature or infant mortality, years of life lost, DALYs, capture generic information on population health. Although informative, these measures are unable to distinguish between the health care input and the con-tribution of other activities to population health status. This was circumvented by the adoption of a broad defi nition of a health system in WHR2000 (WHO, 2000). However, as noted above, this is not a satisfactory solution.
We begin, however, by reviewing the mortality-based measures most com-monly used in assessing population health. These measures have been cat-egorized into two groups: generic and disease/age-specifi c indicators. This is followed by a brief overview of morbidity and summary measures, and their current and potential use for international comparisons. Table 5.1 summarizes the most common measures of population health (including broader determi-nants of health and risk factors), and demonstrates examples of indicators, their key methodological issues and potential policy uses.
Generic indicators
Generic indicators are used to summarize the total mortality experience in a given population over a specifi c period of time. The most common examples are life expectancy and age-standardized death rates (SDRs). Other indicators include less informative crude mortality rates and standardized mortality ratios (SMRs). Their greatest advantage is the availability and relative reliability of data (at least in high-income countries), as well as ease of calculation and analysis. However, the absence of data on cause of death constrains the scope to infer the contribution of health care. These indicators do not show the direct link between health system performance and population health, as they are often crude and depend on numerous other factors (Anell & Willis, 2000). As these indicators mask contributions of specifi c causes of death and risk factors, caution is needed when seeking to attribute observed changes to health care.
Age/disease-specifi c indicators
Infant mortality rate (the number of deaths in children within the fi rst year of life per 1000 live births) is often used as an indicator of quality of health
Book 1.indb 132Book 1.indb 132 12/04/2013 08:3712/04/2013 08:37
Ta
ble
5.1
Com
mon
mea
sure
s of
pop
ula
tion
hea
lth
Mea
sure
men
t ca
tego
ryIn
dica
tors
(ex
ampl
es)
Dat
a an
d m
etho
dolo
gica
l iss
ues
Polic
y us
es
Mor
talit
yG
ener
ic m
orta
lity
-bas
ed
ind
icat
ors:
–
age-
stan
dar
diz
ed d
eath
rat
es
– li
fe e
xpec
tan
cy
• B
road
in
dic
ator
of
hea
lth
• M
ask
con
trib
uti
ons
of s
pec
ifi c
cau
ses
• Ex
clu
de
mor
bid
ity
• N
eed
fu
rth
er d
isag
greg
atio
n b
y ag
e an
d c
ause
Th
ese
are
broa
d i
nd
icat
ors
of h
ealt
h
serv
ice
del
iver
y an
d a
chie
vem
ent
of
des
ired
pop
ula
tion
hea
lth
ou
tcom
es.
Wh
ile
som
e re
fl ec
t ge
ner
ic p
opu
lati
on
hea
lth
sta
tus
(SD
Rs,
lif
e ex
pec
tan
cy,
DA
LYs)
, oth
ers
(per
inat
al m
orta
lity
, ca
use
-sp
ecifi
c m
orta
lity
, su
rviv
al,
amen
able
mor
tali
ty)
allo
w m
ore
det
aile
d
anal
ysis
of
spec
ifi c
ou
tcom
es o
f th
e q
ual
ity
of h
ealt
h c
are.
Sele
cted
mor
tali
ty-b
ased
in
dic
ator
s co
mbi
ned
wit
h s
up
ple
men
tary
te
chn
iqu
es (
such
as
trac
er m
eth
odol
ogy)
al
low
th
e ex
plo
rati
on o
f th
e in
div
idu
al
asp
ects
of
hea
lth
ser
vice
del
iver
y p
roce
ss
and
hig
hli
ght
pot
enti
al g
aps
and
w
eakn
esse
s.
Age
-sp
ecifi
c m
orta
lity
in
dic
ator
s:–
infa
nt,
per
inat
al m
orta
lity
• Su
scep
tibl
e to
var
iati
ons
in r
ecor
din
g an
d r
epor
tin
g p
ract
ices
• R
ely
on p
reci
se d
efi n
itio
ns
not
alw
ays
adh
ered
to
in
pra
ctic
e (p
erin
atal
mor
tali
ty)
• A
re i
nfl
uen
ced
by
fact
ors
outs
ide
of h
ealt
h s
yste
m
(in
fan
t m
orta
lity
)
• A
re b
ased
on
sm
all
nu
mbe
rs
• C
omp
lex
inte
rpre
tati
on o
f u
nd
erly
ing
cau
ses
Cau
se-s
pec
ifi c
mor
tali
ty
ind
icat
ors:
– ag
e-st
and
ard
ized
mor
tali
ty
from
sp
ecifi
c c
ause
s –
IHD
, ca
nce
r, e
tc.)
• D
ata
qu
alit
y an
d c
odin
g
• C
aptu
re i
nfl
uen
ce o
f br
oad
er h
ealt
h d
eter
min
ants
• N
eed
to
be i
nte
rpre
ted
in
con
text
of
risk
fac
tor
and
d
isea
se p
reva
len
ce, a
nd
pol
icie
s in
oth
er s
ecto
rs
5-ye
ar s
urv
ival
:–
can
cer
• V
aria
tion
s in
cov
erag
e an
d d
iagn
osti
c p
ract
ices
• Le
ad-t
ime
bias
• N
eed
to
acco
un
t fo
r st
agin
g
• H
as t
o be
vie
wed
alo
ngs
ide
mor
tali
ty a
nd
in
cid
ence
ra
tes
Sum
mar
y m
easu
res:
H
ALE
, DA
LYs,
YLL
*•
Con
trov
ersi
al m
eth
odol
ogy
(age
an
d d
isab
ilit
y w
eigh
tin
gs)
Am
enab
le m
orta
lity
• A
ggre
gate
mea
sure
req
uir
ing
furt
her
dis
aggr
egat
ion
• V
aria
tion
s in
lis
t of
am
enab
le c
ause
s an
d a
ge l
imit
s
• Ti
me
lags
for
ou
tcom
es o
f sp
ecifi
c i
nte
rven
tion
s(C
onti
nued
)
Book 1.indb 133Book 1.indb 133 12/04/2013 08:3712/04/2013 08:37
Mea
sure
men
t ca
tego
ryIn
dica
tors
(ex
ampl
es)
Dat
a an
d m
etho
dolo
gica
l iss
ues
Polic
y us
es
Mor
bidi
tyG
ener
al h
ealt
h:
– h
ealt
h s
urv
eys
dat
a•
Rep
orti
ng
bias
• N
on-s
pec
ifi c
to
hea
lth
care
in
terv
enti
ons
At
pre
sen
t, m
orbi
dit
y d
ata
are
of l
imit
ed
use
in
ass
essi
ng
the
con
trib
uti
on o
f h
ealt
h c
are
to p
opu
lati
on h
ealt
h (
see
dat
a an
d m
eth
odol
ogic
al i
ssu
es),
bu
t th
ere
are
grea
t em
ergi
ng
init
iati
ves
to
dev
elop
reg
istr
ies
for
spec
ifi c
con
dit
ion
s th
at f
ocu
s on
hea
lth
ou
tcom
es a
nd
se
rvic
e d
eliv
ery
asp
ects
.
Inci
den
ce:
– n
otifi
cat
ion
s•
Var
iati
ons
in n
otifi
cat
ion
req
uir
emen
ts a
nd
d
iagn
osti
c p
ract
ices
Prev
alen
ce:
– re
gist
ries
• C
over
age
• R
epre
sen
tati
ven
ess
Hea
lth
ser
vice
uti
liza
tion
:–
hos
pit
al s
tati
stic
s•
Dat
a q
ual
ity
(com
ple
ten
ess,
cod
ing,
rec
ord
ing)
• C
over
age
(oft
en e
xclu
des
pri
vate
sec
tor)
• R
epre
sen
tati
ven
ess
(on
ly s
how
s p
opu
lati
on w
ho
acce
ssed
hea
lth
ser
vice
)
Ris
k fa
ctor
sD
emog
rap
hic
, soc
ioec
onom
ic,
beh
avio
ura
l, e
nvi
ron
men
tal,
etc
.•
Com
ple
ten
ess
and
com
par
abil
ity
of d
ata
• N
ot a
lway
s p
ossi
ble
to m
easu
re e
xpos
ure
(e
nvi
ron
men
tal
risk
s)
• A
re n
ot u
nd
er d
irec
t co
ntr
ol o
f a
hea
lth
sys
tem
Th
ese
are
pre
dic
tors
of
futu
re p
opu
lati
on
hea
lth
, rat
her
th
an a
n i
nd
icat
or o
f h
ealt
h
syst
em p
erfo
rman
ce, a
s m
any
risk
fac
tors
ar
e a
pro
du
ct o
f w
ider
in
ters
ecto
ral
pol
icie
s.
DA
LYs:
dis
abil
ity-
adju
sted
lif
e ye
ars;
HA
LE: h
ealt
h-a
dju
sted
lif
e ex
pec
tan
cy; S
DR
: sta
nd
ard
ized
dea
th r
ates
; YLL
: yea
rs o
f li
fe l
ost.
Ta
ble
5.1
Com
mon
mea
sure
s of
pop
ula
tion
hea
lth
(C
onti
nued
)
Book 1.indb 134Book 1.indb 134 12/04/2013 08:3712/04/2013 08:37
Comparing population health 135
care. Worldwide, this is more widely available than all-age mortality (and thus life expectancy) as it is often taken from surveys (especially Demographic and Health Surveys). However, it is a poor measure of the contribution of health care as it combines neonatal and post-neonatal deaths, which have quite different causes. In the fi rst four weeks of life mortality is more sensitive to the quality of medical care, while post-neonatal mortality is more strongly associated with socioeconomic factors (Leon, Vågerö & Olausson, 1992), and does not necessarily refl ect the overall health system performance (Mathers, Salomon & Murray, 2003).The perinatal mortality rate (the number of stillbirths and deaths in the fi rst week of life per 1000 live and stillbirths) is also frequently used as an indicator of health systems performance. Problems affecting comparisons include: the varying application of the defi nition of a live birth (although supposedly standardized), especially at low birth weights; the increase in multiple births (which are at greater risk) as a consequence of new treatments for infertility; the need to consider differences in patterns of birth weight; the very small numbers of deaths now occurring in high-income countries (making rates unstable in small populations); and variation in the application of prenatal screening for congenital anomalies (often linked to policies on abortion) (Richardus et al., 1998; Garne et al., 2001; van der Pal-de Bruin et al., 2002), although one study suggested that the last of these had been of limited importance in a longitudinal study of perinatal mortality in Italy (Scioscia et al., 2007). The interpretation of apparent differences among countries and over time is therefore problematic (Nolte & McKee, 2004).
Turning to older ages, age-standardized mortality rates by cause are easy to calculate and reliable data are available for all high- and many middle-income countries. However, despite the existence of a standardized system of disease classifi cation (the International Classifi cation of Disease (ICD)), some caution is required in both longitudinal and cross-sectional studies. First, there may be differences in interpretation of coding rules, especially those involving the treatment of multiple causes. These can change during the course of an ICD version. Second, although the classifi cation is revised regularly, there may be interim changes, such as the introduction of codes for human immunodefi -ciency virus (HIV) disease during the 1980s when ICD-9 was used in most coun-tries. Finally, different countries switch to new versions at different times and there may be differences in the effects of change among countries, making it necessary to undertake bridge coding exercises whereby a set of death certifi -cates are coded using both old and new versions and then compared. Other issues include completeness of registration of deaths and, more often, of the population denominator, a growing problem with more mobile populations.
An example of a disorder that has been examined as an indicator of health care quality is IHD, one of the most frequent causes of premature mortality in industrialized countries (Nolte, Bain & McKee, 2009). It has been estimated that about 40–50% of the total reduction in IHD in Western countries can be attributed to improvements in specifi c medical interventions (Beaglehole, 1986; Kesteloot, Sans & Kromhout, 2006) with the remaining decline attributed to the decrease in prevalence of risk factors, such as smoking, high cholesterol and hypertension (some of which can also be attributed to medical intervention) (Bots & Grobbee, 1996; Ford et al., 2007). However, cross-national comparisons
Book 1.indb 135Book 1.indb 135 12/04/2013 08:3712/04/2013 08:37
136 Health system performance comparison
of mortality rates from IHD have to be interpreted in the context of policies in other sectors (such as agriculture, which infl uences traditional dietary patterns) and of cultural differences (in diet, for example), which infl uence the levels of prevalence and risk factors in specifi c populations (Box 5.2). Thus, the complex epidemiology of IHD means that this indicator on its own may not necessarily identify weaknesses in health care, but may also capture other environmental and socioeconomic factors. Persisting high levels of mortality from IHD usually indicate systematic problems that cover the entire course of the disease – from primary prevention and health promotion to treatment.
In those cases where there are data on incidence and mortality, it is possible to calculate disease-specifi c survival. This is the average length of time that individuals survive following diagnosis. Survival rates are most frequently applied to cancer and have been infl uential in international and longitudinal
B ox 5.2 Explaining differences in mortality trends from IHD
We have previously shown how the contribution of health care to changes in deaths from IHD remains contested and can be diffi cult to ascertain (Nolte, Bain & McKee, 2009). This can be illustrated by comparing research from the German Democratic Republic and Poland, both of which experienced substantial, and similar, declines in mortality in the 1990s (Nolte et al., 2002).
In Poland, this improvement has been largely attributed to changes in diet, with increasing intake of fresh fruit and vegetables, and reduced consumption of animal fat (Zatonski, McMicheal & Powles, 1998). The authors of that study judged the contribution of health care to be negligible. In contrast, the WHO MONICA project found a considerable increase in the intensity of treatment of acute coronary events in Poland between 1986–89 and the early 1990s (Tunstall-Pedoe et al., 2000). Yet a further complication is that a much higher proportion of deaths from IHD in Poland are sudden, compared with western European countries, so limiting the scope for health care to make a difference in the acute stage. This is a phenomenon that has also been noted in the neighbouring Baltic States and Russian Federation (Uusküla, Lamp & Väli, 1998; Tunstall-Pedoe et al., 1999) and has been related to binge drinking (McKee et al., 2001).
The eastern part of Germany also experienced a substantial decline in mortality from IHD but here research has focused more on health care. There is evidence of intensifi ed treatment of cardiovascular disease during the 1990s (for example, an increase in cardiac surgery of 530% between 1993 and 1997 (Brenner, Altenhofen & Boqumil, 2000). Although this may not necessarily translate into improved survival (Marques-Vidal et al., 1997), there has been a (non-signifi cant) increase in the prevalence of those with a history of myocardial infarction among east Germans aged 25–69 years between 1990–92 and 1997–98 which, given the accompanying decline in mortality from IHD, suggests that there has been improved survival (Wiesner, Grimm & Bittner, 1999).
Book 1.indb 136Book 1.indb 136 12/04/2013 08:3712/04/2013 08:37
Comparing population health 137
comparisons. However, there are a number of issues that must be taken into account. First, coverage by cancer registries is limited in many countries, either geographically (covering only certain regions in much of Europe (Coleman et al., 2008)) or in other ways (the American Surveillance Epidemiology and End Results (SEER) system systematically under-represents the African-American population with their poorer outcomes (Mariotto, Capocaccia & Verdecchia, 2002)). Second, calculation of survival is critically dependent on consistent approaches to diagnosis. Countries with extensive screening activities will inevitably detect cases earlier but, if this confers no survival benefi t (as with prostate cancer), the survival will seem longer although the time of death is unchanged (lead time bias) (Desai et al., 2010). Countries with weak linkage systems may have a high proportion of Death Certifi cate Only cases, in which fi rst registration takes place at death. This may artefactually shorten recorded survival. Ideally, stage at diagnosis is recorded to facilitate adjustment for some of these factors, but such data are often unavailable. Nonetheless, cancer survival data, if interpreted suitably cautiously, can offer insights into various aspects of cancer service quality: timeliness, technical competence and adherence to protocols (Jack et al., 2003).
International comparisons of cancer survival have shown substantial differences in performance among European countries (Verdecchia et al., 2007), suggesting variations in quality of care. However, this poses the question of why. Thus, it has been suggested that historically relatively poor cancer survival rates in the United Kingdom and Denmark may be because the gate-keeping function of primary care delays access to specialist investigation (Crawford, 2010) but also that there may be high levels of stoicism among the population, leading to late presentation (Anderson & Murtagh, 2007). This issue is not, however, resolved.
Dickman and Adami (2006) noted that, “in order to evaluate progress against cancer one must simultaneously interpret trends in incidence, mortality and survival” as none of the three measures is fully interpretable without knowledge of the other two. An example of combining this information is a recent study by Coleman et al. (2011), which shows how rapid improvements in survival following breast cancer in the United Kingdom, despite increasing incidence, are associated with an overall reduction in mortality (Figure 5.2).
Measuring morbidity
One of the principle limitations of the measures discussed above is their focus on mortality. One attempt to circumvent this was the work of Bunker, Frazier & Mosteller (1994) that assessed the “magnitude of relief in treated patients” with a range of conditions (unipolar depression, osteoarthritis, terminal cancers, asthma, cataract, etc.). They constructed a symptomatic measure of relief based on the incidence of each condition, the average age of those suffering from them, the number of treated patients, and the expected years of survival, into which they factored the years of disability prevented by therapeutic interven-tion (Bunker, 2001). The overall measure of improved physical or mental func-tion, or prevented pain and suffering, is expressed in “potential years of relief
Book 1.indb 137Book 1.indb 137 12/04/2013 08:3712/04/2013 08:37
138 Health system performance comparison
per 100 patients”. On average, the interventions achieved relief from approxi-mately fi ve years of poor quality of life per individual (Bunker, 2001). Although providing different and potentially useful results, this technique is based on the inventory approach for mortality described in the next section, and thus is subject to the same methodological problems (Nolte, Bain & McKee, 2009).
The main measures of morbidity are derived from self-reporting of perceived health status in population health surveys. Examples include the World Health Survey, European Core Health Interview Survey and various national surveys, such as the Health Survey for England and US National Health Interview Survey. These typically include a question on self-rated health (usually on a fi ve-point scale, but sometimes on a four-point scale) but the results are not specifi cally related to health care interventions. They are also subject to potential bias, as those with higher expectations of health often record their health as worse than those with lower expectations, even when they are similar on objective measures. This can, however, be addressed by the use of anchoring vignettes, in which
Figure 5.2 Breast cancer survival, incidence and mortality in Australia, Canada, Denmark, Norway, Sweden and the UK
Adapted from: Coleman et al., 2011.
Book 1.indb 138Book 1.indb 138 12/04/2013 08:3712/04/2013 08:37
Comparing population health 139
respondents are asked to allocate a health status to an imaginary subject with a specifi ed level of disability (King et al., 2004). While several countries have instituted regular surveys using relevant instruments, data are not necessarily comparable with similar surveys undertaken elsewhere, in particular when the data collection instrument cannot ensure cross-cultural equivalence. Where cross-national comparable instruments have been employed, these frequently tend to cover only a few countries, often building on small samples of uncertain representative power in participating countries. Elsewhere, surveys are not undertaken regularly, or perhaps only once, so data tend to become outdated (Nolte, 2010). Surveys also include a variety of disease-specifi c measures, some of which may be attributable to health care, such as blood pressure diagnosis and control. Within Europe, the New European Health Survey System (EHSS) promises to be a valuable source, while the Survey of Health, Ageing and Retirement in Europe (SHARE), along with the English Longitudinal Survey of Ageing, with which it is compatible, provide valuable data on older people. More detailed discussion of population-based surveys is provided in Chapters 7 and 11.
In some limited cases, the incidence of specifi c diseases may be useful in comparing health system performance. Thus, the OECD HCQI project includes the incidence of vaccine-preventable diseases (pertussis, measles, hepatitis B) in its set of indicators. The rationale for this is that the incidence of these diseases should be minimal in the presence of appropriate health care intervention (immunization). Variations in notifi cation requirements and prevention practices can affect incidence rates for these conditions.
Routinely collected data on health service utilization, such as inpatient admissions or number of general practitioner (GP) consultations, while often cited as measures of performance, have a limited value. They are often based on unrepresentative samples of activity; may say only a little about those in need of care but not receiving it; and take no account of whether the activity is necessary.
Finally, there are a number of population-based disease registries, although typically established within the framework of research projects. However, not all registries cover entire populations or all population groups (see cancer survival above). In some cases these may be part of international initiatives so that the data are, to some extent, comparable across countries. They may also be quite unrepresentative of the countries in which they are located as they are likely to be based on centres of excellence.
Summary measures
Death rates in industrialized countries have now fallen to historically low levels, giving rise to ageing populations, often with substantial levels of disability. This has led to efforts to combine mortality and disability, with measures such as health-adjusted life expectancy (HALE) and DALYs. The advantage of summary indicators is their ability to combine the key elements of adverse health outcomes – mortality, morbidity and disability. Typically, summary measures of health are divided into two broad categories: health expectancies and health gaps.
Book 1.indb 139Book 1.indb 139 12/04/2013 08:3712/04/2013 08:37
140 Health system performance comparison
Health expectancy is a measure of how long people can expect to live free of certain diseases or limitations to their normal activities (active life expectancy, disability-adjusted life expectancy, health-adjusted life expectancy, etc.). With this measure, less weight is assigned to years lived in less than full health. Healthy life expectancy has been used to establish the relationship between population health and health system inputs in 191 countries (Evans et al., 2001). A recent report of the Commonwealth Fund used healthy life expectancy at age 60 as one of three measures of productive and healthy lives in seven OECD countries (Australia, Canada, Germany, Netherlands, New Zealand, UK and the United States) as one of the measures demonstrating the ability of a health system to ensure long and healthy lives (Davis, Schoen & Stremikis, 2010).
Health gaps quantify the difference between a designated norm for the population (e.g. 75 years in good health) and actual levels of health. These are usually expressed as years of life lost (YLL), which do not include years lived with disability, or DALYs, which do.
The latter involve applying a weighting to years lived with disability so as to reduce their value. This is typically done in one of three ways. The fi rst is the time-trade-off, in which respondents are asked to choose between remaining in a state of ill health for a period of time or being restored to perfect health but with a shorter life expectancy. The second is the standard gamble, where they are asked to choose between remaining in a state of ill health for a period of time or choosing an intervention which may either restore them to perfect health or kill them. The third is the visual analogue scale, in which they are asked to rate a state of ill health on a scale from 0 to 100, with 0 representing death and 100 representing perfect health. Other refi nements include placing a higher value on a year of life lived at certain ages (typically between 10 and 55) and a lower value in childhood and old age. The advantage of this approach is “to combine information on mortality and non-fatal health outcomes to represent the health of a particular population as a single numerical index” (Murray & Salomon, 2002).
Key methodological issues facing those using summary measures of health status relate to conceptual differences in the approaches taken and data limitations (Etches et al., 2006). The defi nitions, measurement and weighting of disability as applied to particular health states are complex and have long been controversial. For example, some commentators have expressed ethical concerns about the way this methodology places a value on life (Gold, Stevenson & Fryback, 2002), exemplifi ed by its use in the Global Burden of Disease project (Lopez et al., 2006).
A further issue, when extended beyond high-income countries, is that mor-tality data may not be available. In these cases, health outcomes are modelled based on known associations between mortality and other, typically economic, variables. All of these mortality-based measures of population health provide valuable information on the overall progress of nations but say relatively little about the contribution of health care.
At present, comparable health status data are not available for all countries, so existing summary measures of population health are typically based on estimates of the prevalence of various health states (Mathers et al., 2003). This makes it diffi cult to assess trends over time, as any observed variation may
Book 1.indb 140Book 1.indb 140 12/04/2013 08:3712/04/2013 08:37
Comparing population health 141
simply refl ect changes in data used to generate estimates. Thus, where levels of health are modelled using equations incorporating economic measures, booms or busts can create artifi cial changes in estimates of life expectancy or disease burden. A New Global Burden of Disease (2010) Study aiming to provide more continuity at corporability to health data across the globe and addressing some of the issues raised in preceding versions were released at the end of 2012.
Most of the indicators mentioned above are available in the public domain, from the WHO (European Health for All database, Global Health Observatory, Global Mortality Database), World Bank (World Development Indicators) or European Commission (Eurostat) websites.
In summary, mortality-based measures of population health are attractive due to their availability and accuracy, particularly for high-income and most of the middle-income countries. The data needed to construct generic mortality indicators are readily accessible in high-income countries and indicators are easy to calculate. Age/disease-specifi c rates can potentially indicate weaknesses in the health system. Morbidity data are generally less widely available or con-sistent, often relying on self-reporting and over-representing those who actively seek care. Summary measures of population health combine both mortality and morbidity information; however, the methodology (DALY weightings of health states and age) and validity of measures of health system performance remain controversial. Thus, of the common measures of population health, such as mortality (infant, perinatal, total), life expectancy, morbidity, or summary derivatives, only a select few are able to distinguish the components of the overall burden of disease that are attributable to health systems and those which result from factors arising elsewhere, while disease-specifi c indicators, such as mortality from IHD or cancer survival rates, can only refl ect isolated elements of the overall service. Consequently, assessment of the performance of health care requires identifi cation of the indicators of population health that directly refl ect health care (see section 5.6). Differences in data collection and registration practices need to be understood when comparing these indicators across countries or time.
5.5 The contribution of health care to population health
There has been long-standing debate about whether health services make a meaningful contribution to population health (McKee, 1999). In the late 1970s, several authors argued that health care had contributed little to the observed decline in mortality that had occurred in industrialized countries over the preceding century or so. Among them was Thomas McKeown, who showed how much of the decline in mortality from tuberculosis (TB) in England and Wales between 1848–1854 to 1971 predated the introduction of immunization and effective chemotherapy (McKeown, 1979). He explained this decline by factors acting outside the health care sector, such as improvements in living conditions, behavioural change and, most importantly, changes in nutrition (McKinlay & McKinlay, 1977; Cochrane, St Leger & Moore, 1978; McKeown, 1979). Others, such as Illich, argued that developments in health care in the 1950s and 1960s were actually damaging to population health, introducing
Book 1.indb 141Book 1.indb 141 12/04/2013 08:3712/04/2013 08:37
142 Health system performance comparison
the term iatrogenesis (physician-produced disease) (Illich, 1976). Illich was especially concerned with the role of medicine as a form of social control.
Recent writers have taken a more nuanced approach. They have noted how there has been a revolution in the therapeutic armamentarium since the 1960s. Thus, Mackenbach showed how the rate of decline in infectious disease mortality doubled in the Netherlands after the introduction of antibiotics in 1946, while mortality rates from common surgical procedures and perinatal conditions improved markedly after the 1930s (Mackenbach, 1996). However, even McKeown’s example of TB has been revisited, with more recent work attributing part of the reduction in mortality that predated the introduction of antibiotics to public health interventions, such as the segregation of patients with active disease (Fairchild & Oppenheimer, 1998). Furthermore, a study of changes in age-specifi c mortality showed how, although the acceleration in the overall death rate was small, the fi rst 10 years after introducing chemotherapy (1945–1955) were marked by striking year-on-year reductions in TB mortality rates among young people in England and Wales (Nolte & McKee, 2004).
At present, therefore, there is a general consensus that, while McKeown and others were broadly correct in pointing to a relatively limited role of curative medical measures in mortality decline prior to the mid-20th century (Colgrove, 2002), the scope of health care and its contribution to population health has progressed dramatically since the mid-20th century. Advances in the pharmaceutical and technology sectors have transformed acute fatal diseases into treatable or manageable conditions (such as infectious diseases and type 1 diabetes). These developments, along with more effective ways of organizing health care (such as introducing multidisciplinary stroke units or integrated screening programmes) and the implementation of evidence-based medicine, have ensured a growing contribution of the health care sector to population health.
This raises the question of how to quantify the contribution of health care to reduced mortality. This is rarely straightforward. In some cases, the impact of health care is self-evident: examples include vaccine-preventable diseases, antibiotic treatment of acute infections and the introduction of insulin for type 1 diabetes. However, more often, the impact of health care is less easily quantifi able. Thus, in the last 30 years, there have been substantial reductions in mortality from many chronic diseases; while health care has contributed to these reductions, there have also been declines in exposure to many common risk factors and, thus, the incidence of disease.
We begin by examining the key approaches that seek to quantify the contribution of health care to population health. These are the inventory approach and the production function approach (Buck, Eastwood & Smith, 1999; Nolte & McKee, 2004). Two others – avoidable mortality and the use of tracers – are described in more detail later in this chapter.
The inventory methodology examines selected health services and their infl u-ence on the burden of disease in a target population. McKinlay and McKinlay (1977) noted that much of the decline in mortality in the United States between 1900 and the early 1970s was due to falling deaths from infectious disease, and that at least some of this must have been attributable to medical interven-tions such as antibiotics and vaccines. They then calculated, for 10 infections,
Book 1.indb 142Book 1.indb 142 12/04/2013 08:3712/04/2013 08:37
Comparing population health 143
the contribution to the overall mortality decline since 1900 made by reduc-tions in deaths from these infections occurring after the relevant interventions had been introduced. As most of these interventions came about when death rates had already fallen substantially, they estimated that the interventions had contributed only about 3.5% of the total mortality decline. They rejected the idea that there were interventions that might have contributed to falls in any chronic diseases. More recent work by Bunker et al. (1994) sought to quantify the contribution of individual medical interventions to life expectancy and quality of life in the United States between 1950 and 1989, combining pub-lished evidence on the effectiveness of specifi c clinical preventive and curative interventions and data on the prevalence of the corresponding diseases. They estimated that about half of the 7–7.5 year gain in life expectancy observed could be attributed to these activities (Bunker, 2001). A different methodology was adopted by Wright and Weinstein (1998), stratifying the population into those with average or elevated levels of disease risk and those with established disease, and then measuring the impact of preventive and therapeutic interven-tions on gains in life expectancy. For instance, they estimated that a reduction of cholesterol to 200 mg/dl would result in between 50 to 76 months’ gain in life expectancy in a 35-year-old person with elevated cholesterol (>300 mg/dl). In comparison, quitting smoking in a 35-year-old at average risk of cardiovas-cular disease would yield a 8 to 10 month gain in life expectancy. Cutler and McClellan (2001) looked at the cost of providing improved care, analysing the contribution of technology to fi ve selected conditions and fi nding that four of them (heart attack, low birth weight, depression, cataracts) had yielded net monetary benefi ts.
Analyses based on an inventory approach provide essential information about the potential contribution of health care to population health. However, they rest on the assumption that the health gains reported in clinical trials translate directly to the population level (Nolte et al., 2011). This is not necessarily the case (Britton et al., 1999) as trial participants are often highly selected groups, typically excluding elderly people and those with comorbidities, even though these groups often dominate the population that will require treatment. Also, evaluations of individual interventions fail to capture the combined effects of integrated individualized packages of care (Buck, Eastwood & Smith, 1999), or indeed of the entire system, on population health. These fi ndings thus provide only a partial insight into what health systems actually achieve in terms of health gain or how different systems compare (Nolte, Bain & McKee, 2009).
One other method is the production function approach. This typically uses regression analysis to examine how health care inputs (and other explanatory variables) affect a specifi c health measure (outputs). The fi ndings of such analyses have produced mixed results. Earlier work failed to identify strong and consistent relationships between health care indicators (such as health care expenditure or number of doctors) and health outcomes (such as infant mortality rate or life expectancy), but found socioeconomic factors to be powerful determinants of health outcomes (Martini et al., 1977; Kim & Moody, 1992; Babazono & Hillman, 1994). However, more recent work suggests alternative conclusions. Signifi cant inverse relationships have been established between health care
Book 1.indb 143Book 1.indb 143 12/04/2013 08:3712/04/2013 08:37
144 Health system performance comparison
expenditure and infant and premature mortality (Crémieux, Ouellette & Pilon, 1999; Or, 2000; Nixon & Ulmann, 2006), and between the number of doctors per capita and premature and infant mortality, as well as life expectancy at age 65 (Or, 2001).
A related methodology involves comparisons of the ways in which health care systems are organized. A study by Elola, Daponte and Navarro (1995) categorized 17 health systems in Europe into National Health Service (NHS) systems (such as Denmark, Ireland, Italy, Spain and the United Kingdom) and social security systems (such as Germany, Austria and the Netherlands). This analysis concluded that countries with NHS systems achieve lower infant mortality rates than those with social security systems at similar levels of gross domestic product (GDP) and health care expenditure. On the other hand, van der Zee and Kroneman (2007) conducted a longitudinal analysis of trends in Europe from 1970 onwards. Their results suggest that the relative performance of the two types of system changed over time and that social security systems have achieved slightly better outcomes (in terms of total mortality and life expectancy) since 1980, when inter-country differences in infant mortality became negligible. The myriad of other factors involved makes such analyses almost impossible to interpret.
All these approaches have obvious limitations arising from data availabil-ity and reliability. However, the production function approach also fails to take account of lagged relationships, as noted by, for example, Gravelle and Blackhouse (1987). An obvious example is cancer mortality, where death rates often refl ect treatments undertaken up to fi ve years previously. Their cross-sectional nature is ill-equipped to address causality adequately, and such models often lack any theoretical basis that might indicate what causal pathways may exist (Buck, Eastwood & Smith, 1999). The complex pathway between increased inputs and health outcomes also means that there are likely to be many unrec-ognized confounders. Analyses undertaken so far tend to lack a sound theoreti-cal basis and, in particular, provide little insight into the mechanisms involved. However, the greatest problem is that the majority of studies of this type employ indicators of population health (for example, life expectancy and total mortality) that are infl uenced by many factors outside the health care sector. These include policies in sectors such as education, housing and employment, where the production of health is a secondary goal. This raises concern that the observed relationships are due to confounding. An example of the potential pit-falls is provided by the fall in infant mortality in the two formerly divided parts of Germany in the 1990s that, on closer inspection, can be seen to be due to a fall in neonatal mortality in the east (most likely due in large part to improved health care) and in post-neonatal mortality in the west (which has different causes) (Nolte et al., 2000).
5.6 A way forward
The reason why the measures discussed in the previous sections are so often used for performance measurement is because they are available. It is important to ensure that any new performance indicators are driven by what is theoretically
Book 1.indb 144Book 1.indb 144 12/04/2013 08:3712/04/2013 08:37
Comparing population health 145
meaningful, rather than simply available. As has been noted previously, the fundamental role of performance measurement is to provide the necessary information to support health system improvement (Smith, 2009). Capturing the differences in health system performance in a systematic and comparable way requires other approaches.
The next section of the chapter will discuss two complementary approaches – avoidable mortality and tracers, which have been used in recent years to capture information on different aspects of health systems.
Avoidable mortality
The concept of avoidable mortality was initially developed by Rutstein in the 1970s. It is based on a notion that certain deaths should not occur in the presence of timely and effective medical care (Rutstein et al., 1976). Later, Charlton et al. (1983) proposed a list of specifi c conditions amenable to health care. In time, this evolved to refl ect new epidemiological research and advances in medical care. The concept was adopted by a wide range of researchers in Europe in the 1980s and early 1990s, as it was seen as a potential tool to assess the performance of health systems. The publication of the European Community Atlas of Avoidable Deaths and its subsequent editions in 1988, 1991 and 1997 served as a major stimulus for a series of analyses at national level across many of the high-income countries (Nolte & McKee, 2004).
This is, however, an area where there has been some confusion about terminology (Kamarudeen, 2010). Avoidable mortality, in its broadest sense, includes deaths considered to be avoidable by appropriate and timely medical care, as well as those preventable by population-based interventions. ‘Amenable mortality’ is often considered to be a subset of avoidable mortality, including only those conditions directly amenable to health care, “from which it is reasonable to expect death to be averted even after the condition develops” (Nolte & McKee, 2004). In contrast, ‘preventable’ deaths are usually taken to include deaths from conditions that can be prevented by population-based interventions but where the contribution of health care may be limited once the condition has developed. Examples include lung cancer, alcoholic liver disease and suicides. These can, however, be used as an indicator of overall government performance, as noted above.
In 2004, Nolte and McKee undertook a systematic review of the work on avoidable mortality then available, revised the list of causes of death consid-ered to be amenable to health care, and applied this to 12 EU countries (Nolte & McKee, 2004). They adopted a defi nition of a health system that covered primary and hospital care, as well as primary and secondary prevention (includ-ing immunization and screening). The objective was to investigate the impact of health care on changing patterns of mortality and life expectancy in the 1980s and 1990s. Since the 1980s, all countries examined had experienced an increase in life expectancy, although the pace of improvement varied. For most of these countries, the greatest reductions in amenable mortality were achieved in the 1980s. During the 1990s, the decline slowed, particularly in the coun-tries where mortality from amenable causes was already low, as in Northern
Book 1.indb 145Book 1.indb 145 12/04/2013 08:3712/04/2013 08:37
146 Health system performance comparison
Europe. However, even there, amenable mortality still continued to fall, albeit at a slower pace.
Newey et al. (2004) demonstrated similar results for the older members of the EU. Notably, most of the countries that had joined the EU in 2004 experienced relatively small reductions in amenable mortality in the 1990s, at a time when their health systems were undergoing major reconfi guration, but the authors (correctly) predicted that several would begin to close the gap in the 2000s, once the major structural and economic reforms had become embedded.
In a subsequent analysis of 19 industrialized countries between 1997–1998 and 2002–2003 (Nolte & McKee, 2008), the largest reductions in amenable mortality were seen in many of the countries with the highest initial levels. However, the United States experienced hardly any reduction from its initial high level, so that it increasingly lagged behind other industrialized countries.
Other research by the same authors has shown how the USSR lagged increasingly far behind western Europe from the mid-1960s onwards, refl ecting its failure to modernize its health care system to address the rising tide of chronic diseases (Andreev et al., 2003), while another study showed the acceleration in the rate of improvement of amenable mortality in China, Taiwan following the introdu ction of national health insurance in the 1990s (Lee et al., 2010). The importance of health care was also apparent from an analysis of trends in amenable mortality in New Zealand (Tobias & Yeh, 2009). This concluded that, over the preceding 25 years, improvements in health care contributed approximately one-third to the overall improvement in life expectancy. Together, these fi ndings support the notion that improvements in access to effective care have a measurable impact in industrialized countries, and that the concept of amenable mortality may provide a valuable indicator of health system performance overall.
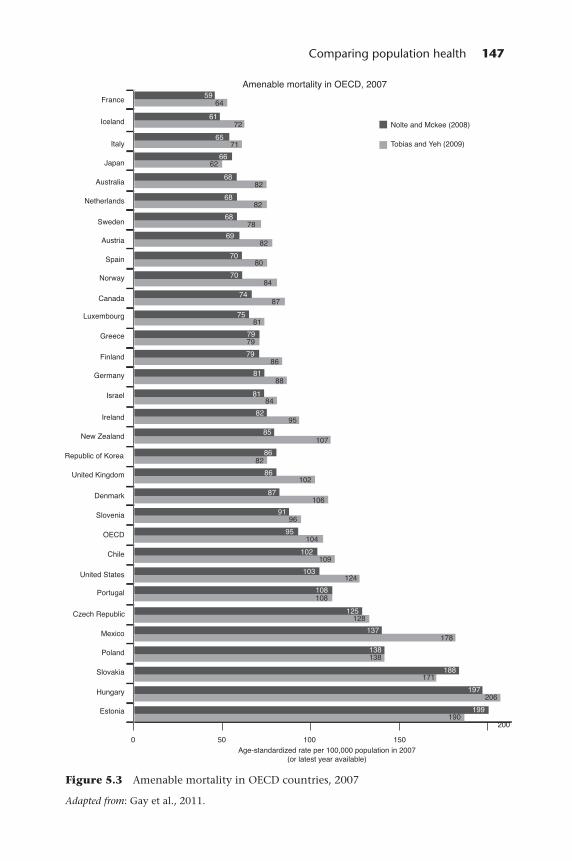
The precise composition of lists of causes deemed amenable to health care may not be of great importance. This is the conclusion of a recent report by the OECD (Gay et al., 2011) that compares the impact of two slightly different lists, by Nolte and McKee (2008) and Tobias and Yeh (2009). As Figure 5.3 shows, both produce similar results.
Amenable mortality does, however, suffer from a number of limitations. As an aggregate measure, it summarizes a wide range of causes of death, each refl ecting different aspects of the health system. It is therefore necessary to break down the overall fi gures by cause and age to understand what is driving any change. This may be diffi cult where there are small numbers in particular groupings, as will be the case in all but the largest countries. Indeed, this is an increasingly important problem as deaths from many causes in those aged under 75 reach very low levels.
Second, aggregate data conceal variations within populations, which can be divided according to geographic, ethnic, socioeconomic and other parameters. Improvements for one group may conceal deteriorations for others (Nolte & McKee, 2008).
There are, however, some more fundamental problems with the concept that must be addressed (Nolte & McKee, 2004). One is the variable lag between
Book 1.indb 146Book 1.indb 146 12/04/2013 08:3712/04/2013 08:37
Comparing population health 147
Figure 5.3 Amenable mortality in OECD countries, 2007
Adapted from: Gay et al., 2011.
Book 1.indb 147Book 1.indb 147 12/04/2013 08:3712/04/2013 08:37
148 Health system performance comparison
medical intervention and mortality. In some cases this will be instantaneous, as in the case of resuscitation following cardiac arrest. Here, the outcome can reasonably be attributed to intervention in the same year. However, cancer survival is measured after fi ve years and, while there is often a sharp reduction in survival at the time of treatment, there is a slower decline over several years. Thus, a death may be attributable to treatment decisions up to fi ve years previously. In other cases the lag may be much longer. Helicobacter eradication therapy in a young person may save them from dying from stomach cancer several decades later.
Another concern is the changing incidence of disease. Deaths from amenable causes will decline if the incidence is falling regardless of any change in health care, and vice versa.
The original list of amenable causes included causes of death that could be prevented entirely by health care as well as those from which some deaths would be inevitable but this number could be minimized. The former is exemplifi ed by vaccine-preventable diseases such as measles; the latter by IHD, where even in the best performing health care system, there will be some sudden and unobserved deaths. However, there are also many causes of death not considered to be amenable where, in some circumstances, health care can be life-saving. This is true of many cancers for which a small proportion may be identifi ed early making curative treatment possible. An example is cancer of the pancreas. This begs the question what pro-portion of deaths from a specifi c cause should be preventable in order for the cause to be considered amenable. This issue has previously been addressed only implicitly.
One approach to doing so is to determine what has led to a reduction in avoidable deaths. In some cases, there will have been a single intervention. The term ‘magic bullet’ recalls the dramatic benefi ts of penicillin when it was fi rst given to patients with severe staphylococcal infections in the 1940s. More often, health care will prevent deaths through a combination of interventions introduced incrementally, perhaps over decades. In these cases, it is necessary to look at changes in death rates over considerable time, introducing the problem of attribution as it is necessary to exclude other explanations for observed changes. This is, however, complicated by the limited evidence available. As noted above, randomized controlled trials often have limited external validity, as they frequently exclude both children and older people; those with comor-bidities; and, historically, women. Hence, it will often be necessary to draw on natural experiments where it is possible to determine when new treatments were introduced. An example is the introduction of highly active antiretrovi-ral therapy (HAART) for patients with acquired immunodefi ciency syndrome (AIDS), where death rates fell very rapidly. In other cases, even where detailed data are unavailable, it may be possible to infer the impact of health care where there has been wider system change. An example is the political transition in Eastern Europe around 1990. The opening of borders to modern pharmaceu-ticals and ideas of evidence-based medicine made it possible to provide treat-ment that had been previously denied to sufferers from many chronic diseases. Thus, in countries such as Estonia, there was a rapid decline in mortality from stroke, almost certainly as a result of better treatment of hypertension, at a time
Book 1.indb 148Book 1.indb 148 12/04/2013 08:3712/04/2013 08:37
Comparing population health 149
when such deaths were increasing in the neighbouring Russian Federation. It may also be necessary to look at historical evidence: conditions such as acute appendicitis became amenable to health care once the introduction of asepsis and anaesthesia made intra-peritoneal surgery possible in the late 19th century. The treatment of hypertension has a shorter history but has still been possible since the late 1950s.
In all previous studies, the defi nition of amenable deaths has had an upper age limit, refl ecting the view that “everyone must die of something”. The age limit has increased over time, from 65 to 75, but this creates certain problems. The fi rst is that it is explicitly ageist, as it devalues curative care for those aged over 75. The second is empirical: life expectancy in some countries now exceeds this fi gure and also there is growing evidence that many types of health care are very effective in older people. If, however, the defi nition of an amenable cause is one where health care can reduce the death rate by 50% or more, then there is no intrinsic reason to have an upper age limit. However, while conceptually attractive, this also poses problems of obtaining evidence, fi rstly because older patients are often excluded from trials and, second, because the absence of an observed decline in mortality at older ages at a time when an intervention was being introduced may simply mean that this population was not offered treatment.
Amenable mortality is a dynamic concept. Although most defi nitions still include infectious diseases such as measles, the numbers of deaths in high-income countries are negligible. In other words, success in tackling causes of death amenable to health care renders these causes obsolete as indicators of future progress. At the same time, new treatments are discovered that render once untreatable conditions treatable, justifying their inclusion in a new categorization. This clearly poses problems for longitudinal analyses.
Finally, the scope for reducing rates of avoidable mortality is greatest in the countries where initial levels are high. As a consequence, the ability to compare health system performance among developed countries is likely to be limited in the future, as the differences will be relatively small. Also, changes in coding of cause of death and in ICD versions may create artefactual discontinuities. It is also necessary to take account of changes in the incidence of underly-ing disease. For all these reasons, superfi cial comparisons of amenable mortal-ity may be misleading (Desai et al., 2011). Yet, despite these limitations, the concept of avoidable mortality provides a potentially useful indicator of health system performance. It is, however, important to recognize that high levels should not be taken as defi nite evidence of ineffective health care, but rather as an indicator of potential weaknesses that require further investigation. These, and some of the earlier problems noted, can be illustrated by reference to renal cancer. In some countries, death rates are increasing and yet, paradoxically, data from cancer registries suggest that fi ve-year survival rates are improving. Several factors must be considered. As this is a smoking-related cancer, the inci-dence is continuing to increase among women. There have also been advances in treatment, although of uncertain benefi t. Finally, reported cancer survival is subject to lead-time bias as the greater use of abdominal imaging techniques in place of barium studies for intestinal problems is identifying many more early tumours.
Book 1.indb 149Book 1.indb 149 12/04/2013 08:3712/04/2013 08:37
150 Health system performance comparison
The tracer concept
Many of the aggregate indicators discussed above say little about what must be done to improve the outcomes of health care so the policy implications are often unclear (Walshe, 2003).The challenge is to develop techniques that can capture performance in a systematic and comparable way. The use of tracer conditions is based on the premise that carefully selected health problems can provide insights into the performance of different elements within the overall health system (Nolte, Bain & McKee, 2006, 2009).
The concept was proposed initially by Kessner, who set out the six criteria for a condition to be used as a tracer (Kessner, Kalk & Singer, 1973):
1. functional impact, i.e. requires specifi c treatment, otherwise resulting in functional impairment;
2. well defi ned and easy to diagnose; 3. suffi cient prevalence in the population to permit collection of adequate data; 4. natural history which varies with utilization and effectiveness of health care; 5. available techniques of medical management which are well defi ned for at least
one of the following: prevention, diagnosis, treatment, or rehabilitation;6. known epidemiology.
Over the past 30 years, the application of the tracer methodology has expanded slowly, as it has the potential to identify strengths and limitations of the entire health system. It is important to note that this approach does not assess the quality of care per se, but rather identifi es potential strengths and weaknesses of the system’s response to tracer conditions.
The process involves the collection of data from a variety of sources, including surveys and interviews with patients, providers and policy-makers. The assessment focuses on the inputs of care (physical, such as facilities and pharmaceuticals; human, such as trained health workers and empowered patients; knowledge, such as evidence-based guidelines; and social, such as social support and communication systems) and their integration.
The selection of health problems suitable for the tracer concept depends on the specifi c health system features requiring assessment. Thus, public health policies at the system level can be evaluated using vaccine-preventable conditions, while neonatal mortality can be adopted as a possible measure for assessing access to health care (Koupilová, McKee & Holcik, 1998; Nolte et al., 2000).
The increasing burden of chronic diseases, along with their complexity, makes then especially suitable for use as tracers, given that they require the coordinated input of multiple elements of the health system. Various studies have now used diabetes mellitus to evaluate health system performance mea-surement in high-, middle- and low-income settings (Hopkinson et al., 2004; Beran, Yudkin & de Courten, 2005; Nolte, Bain & McKee, 2006). Diabetes fi ts the criteria for a tracer condition, as it is well defi ned, fairly easy to diagnose (WHO, 1999) and common. Diabetes outcomes refl ect a range of aspects of health system performance.
Crucially, albeit with some caution, the identifi cation of failings in the provision of care for one chronic disorder can often highlight failings affecting
Book 1.indb 150Book 1.indb 150 12/04/2013 08:3712/04/2013 08:37
Comparing population health 151
many others. McColl and Gulliford (1993) classify deaths from diabetes among young people as “sentinel health events” that should raise questions about the quality of health care delivery. Effective treatment prevents complications and disability, which is clearly illustrated by the countries with limited access to insulin (Yudkin & Beran, 2003) and by countries where health systems have collapsed (Telishevka et al., 2001).
Despite the availability of effective treatment for diabetes for almost a century, with an extensive evidence base for managing this disorder, there remains substantial variation across health systems in the standards of care people with diabetes receive. Examining a measure based on the ratio of mortality to incidence of diabetes in young people, Nolte, Bain & McKee (2006) found a 10-fold difference among 29 high- and middle-income countries.
A number of instruments are now available for use in tracer studies. The Rapid Assessment Protocol for Insulin Access (RAPIA) has been developed by the International Insulin Foundation as a functional evaluation tool (Yudkin & Beran, 2003). It provides a multilevel assessment of the different elements that infl uence access to insulin of patients in a given country. Beran, Yudkin and de Courten’s 2005 analysis using the RAPIA protocol in Mozambique and Zambia showed that, although insulin supplies were suffi cient in these countries, their health systems did not permit appropriate distribution according to need, nor did they ensure adequate provision of additional equipment or the existence of training programmes for health care workers, all factors that increased the risk of misdiagnosis or failure to detect diabetes.
A similar approach was taken in Kyrgyzstan (Hopkinson et al., 2004) and Georgia (Balabanova et al., 2009). These studies identifi ed key failings in inte-gration (ineffective insulin distribution system, lack of necessary equipment, complex pathways) that prevented the delivery of quality care for diabetes patients despite the existing provision of the essential services (insulin supply, training of health professionals, fi nanced care packages).
While these studies have obvious practical implications for the management of diabetes, the use of the tracer approach shows how, even though many inputs may be in place, there can still be critical gaps and a failure to integrate different aspects of the system. Although such studies focus on a single tracer, the problems they identify are often generic. Thus, diabetes can be seen as representative of a much larger group of complex chronic diseases that require long-term treatment by multidisciplinary teams and the active involvement of informed and empowered patients (Nolte et al., 2011).
5.7 Conclusion
Many of the existing measures of population health fail to distinguish the contribution of health care from extraneous factors and those that do suffer from a number of methodological problems. Some of these problems may be insurmountable; however, what is important is to understand them and take them into account when interpreting data, particularly in the context of comparing health systems. Thus, age-standardized mortality from selected causes, coupled with additional information on disease prevalence, incidence
Book 1.indb 151Book 1.indb 151 12/04/2013 08:3712/04/2013 08:37
152 Health system performance comparison
and survival, can identify areas that justify in-depth investigation. However, such investigations must respect the many caveats that can affect cross-national comparability.
The concept of amenable mortality is no more than an indicator of potential problems. In international comparisons, it is subject to many methodological limitations and depends on achieving consensus on defi nitions and the choice of conditions included for analysis. It is a starting point; an accurate diagnosis and conclusions will require much more detailed and iterative examination of the data that contribute to it. The use of the tracer methodology may be part of this further enquiry.
References
Anderson, W.J. and Murtagh, C. (2007) Cancer survival statistics should be viewed with caution, The Lancet Oncology, 8(12): 1052–3; author reply 1053–4.
Andreev, E.M. et al. (2003) The evolving pattern of avoidable mortality in Russia, International Journal of Epidemiology, 32(3): 437–46.
Anell, A. and Willis, M. (2000) International comparison of health care systems using resource profi les, Bulletin of the World Health Organization, 78(6): 770–8.
Arah, O.A. et al. (2006) A conceptual framework for the OECD Health Care Quality Indicators project, International Journal for Quality in Health Care, 18(Suppl): 5–13.
Babazono, A. and Hillman, A.L. (1994) A comparison of international health outcomes and health care spending, International Journal of Technology Assessment in Health Care, 10(3): 376–81.
Balabanova, D. et al. (2009) Navigating the health system: diabetes care in Georgia, Health Policy Plan, 24(1): 46–54.
Beaglehole, R. (1986) Medical management and the decline in mortality from coronary heart disease, BMJ (Clinical Research Edition), 292(6512): 33–5.
Beran, D., Yudkin, J.S. and de Courten, M. (2005) Access to care for patients with insulin-requiring diabetes in developing countries: case studies of Mozambique and Zambia, Diabetes Care, 28(9): 2136–40.
Bots, M.L. and Grobbee, D.E. (1996) Decline of coronary heart disease mortality in The Netherlands from 1978 to 1985: contribution of medical care and changes over time in presence of major cardiovascular risk factors, Journal of Cardiovascular Risk, 3(3): 271–6.
Brenner, G., Altenhofen, L. and Boqumil, W. (2000) Gesundheitszustand und ambulante medizinische Versorgung der Bevölkerung in Deutschland im Ost-West-vergleich. Köln: Zentralinstitut für die kassenärztliche Versorgung.
Britton, A. et al. (1999) Threats to applicability of randomized trials: exclusions and selective participation, Journal of Health Services Research and Policy, 4(2): 112–21.
Buck, D., Eastwood, A. and Smith, P.C. (1999) Can we measure the social importance of health care? International Journal of Technology Assessment in Health Care, 15(1): 89–107.
Bunker, J.P. (2001) The role of medical care in contributing to health improvements within societies, International Journal of Epidemiology, 30(6): 1260–3.
Bunker, J.P., Frazier, H.S. and Mosteller, F. (1994) Improving health: measuring effects of medical care, The Millbank Quarterly, 72(2): 225–58.
Charlton, J.R. et al. (1983) Geographical variation in mortality from conditions amenable to medical intervention in England and Wales, The Lancet, 1(8326 Pt 1): 691–6.
Book 1.indb 152Book 1.indb 152 12/04/2013 08:3712/04/2013 08:37
Comparing population health 153
Cochrane, A.L., St Leger, A.S. and Moore, F. (1978) Health service ‘input’ and mortality ‘output’ in developed countries, Journal of Epidemiology and Community Health, 32(3): 200–5.
Coleman, M.P. et al. (2008) Cancer survival in fi ve continents: a worldwide population-based study (CONCORD), The Lancet Oncology, 9(8): 730–56.
Coleman, M.P. et al. (2011) Cancer survival in Australia, Canada, Denmark, Norway, Sweden, and the UK, 1995–2007 (the International Cancer Benchmarking Partnership): an analysis of population-based cancer registry data, The Lancet, 377(9760): 127–38.
Colgrove, J. (2002) The McKeown thesis: a historical controversy and its enduring infl uence, American Journal of Public Health, 92(5): 725–9.
Crawford, S.M. (2010) UK cancer survival statistics. Refl ect NHS clinical realities, BMJ, 341: c5134.
Crémieux, P.Y., Ouellette, P. and Pilon, C. (1999) Health care spending as determinants of health outcomes, Health Economics, 8(7): 627–39.
Cutler, D.M. and McClellan, M. (2001) Is technological change in medicine worth it? Health Affairs (Millwood), 20(5): 11–29.
Davis, K., Schoen, C., Stremikis, K. (2010) Mirror, Mirror on the Wall: How the performance of the U.S. health care system compares internationally, 2010 update. T.C. Fund. New York: The Commonwealth Fund (http://www.commonwealthfund.org/Publications/Fund-Reports/2010/Jun/Mirror-Mirror-Update.aspx?page=all, accessed 8 October 2012).
Desai, M. et al. (2010) Two countries divided by a common language: health systems in the UK and USA, Journal of the Royal Society of Medicine, 103(7): 283–7.
Desai, M. et al. (2011) Measuring NHS performance 1990–2009 using amenable mortality: interpret with care, Journal of the Royal Society of Medicine, 104(9): 370–9.
Dickman, P.W. and Adami, H.O. (2006) Interpreting trends in cancer patient survival, Journal of Internal Medicine, 260(2): 103–17.
Elola, J., Daponte, A. and Navarro, V. (1995) Health indicators and the organization of health care systems in western Europe, American Journal of Public Health, 85(10): 1397–401.
Etches, V. et al. (2006) Measuring population health: a review of indicators, Annual Review of Public Health, 27: 29–55.
Evans, D.B. et al. (2001) Comparative effi ciency of national health systems: cross national econometric analysis, BMJ, 323(7308): 307–10.
Fairchild, A.L. and Oppenheimer, G.M. (1998) Public health nihilism vs pragmatism: history, politics, and the control of tuberculosis, American Journal of Public Health, 88(7): 1105–17.
Fleming, P.J. et al. (1990) Interaction between bedding and sleeping position in the sudden infant death syndrome: a population based case-control study, BMJ, 301(6743): 85–9.
Ford, E.S. et al. (2007) Explaining the decrease in U.S. deaths from coronary disease, 1980–2000, New Engand Journal of Medicine, 356(23): 2388–98.
FSID (2011) Factfi le 2: Research background to the reduce the risk of cot death advice. Foundation for the Study of Infant Deaths (fsid.org.uk/document.doc?id=42, accessed 16 October 2012).
Garne, E. et al. (2001) Different policies on prenatal ultrasound screening programmes and induced abortions explain regional variations in infant mortality with congenital malformations, Fetal Diagnosis and Therapy, 16(3): 153–7.
Gay, J. et al. (2011) Mortality amenable to health care in 31 OECD countries: estimates and methodological issues. Paris: Organisation for Economic Co-operation and Development Publishing (OECD Health Working Papers, no. 55).
Book 1.indb 153Book 1.indb 153 12/04/2013 08:3712/04/2013 08:37
154 Health system performance comparison
Gold, M.R., Stevenson, D. and Fryback, D.G. (2002) HALYs and QALYs and DALYs, Oh My: similarities and differences in summary measures of population health, Annual Review of Public Health, 23: 115–34.
Gravelle, H. and Blackhouse, M. (1987) International cross-section analysis of the determination of mortality, Social Science and Medicine, 25(5): 427–41.
Hopkinson, B. et al. (2004) The human perspective on health care reform: coping with diabetes in Kyrgyzstan, International Journal of Health Planning and Management, 19(1): 43–61.
Illich, I. (1976) Limits to medicine: Medical nemesis, the expropriation of health. London: Marion Boyars Publishing.
Jack, R.H. et al. (2003) Geographical inequalities in lung cancer management and survival in South East England: evidence of variation in access to oncology services? British Journal of Cancer, 88(7): 1025–31.
Kamarudeen, S. (2010) Amenable mortality as an indicator of healthcare quality – a literature review. Newport: Offi ce for National Statistics.
Kelley, E. and Hurst, J. (2006) Health Care Quality Indicators project: Conceptual framework paper. Paris: Organisation for Economic Co-operation and Development Publishing (OECD Health Working Paper, no. 23).
Kessner, D.M., Kalk, C.E. and Singer, J. (1973) Assessing health quality – the case for tracers, New England Journal of Medicine, 288(4): 189–94.
Kesteloot, H., Sans, S. and Kromhout, D. (2006) Dynamics of cardiovascular and all-cause mortality in Western and Eastern Europe between 1970 and 2000, European Heart Journal, 27(1): 107–13.
Kim, K. and Moody, P.M. (1992) More resources better health? A cross-national perspective, Social Science and Medicine, 34(8): 837–42.
King, G. et al. (2004) Enhancing the validity and cross-cultural comparability of measurement in survey research, American Political Science Review, 98(1): 191–207.
Koupilová, I., McKee, M. and Holcík, J. (1998) Neonatal mortality in the Czech Republic during the transition, Health Policy, 46(1): 43–52.
Lalonde, M. (1974) A new perspective on the health of Canadians; a working document. Ottawa: Department of National Health and Welfare.
Lee, Y.C. et al. (2010) The impact of universal National Health Insurance on population health: the experience of Taiwan, BMC Health Services Research, 10: 225.
Leon, D.A., Vågerö, D. and Olausson, P.O. (1992) Social class differences in infant mortality in Sweden: comparison with England and Wales, BMJ, 305(6855): 687–91.
Lopez, A.D. et al. (eds) (2006) Global burden of disease and risk factors. New York: Oxford University Press and World Bank.
Mackenbach, J.P. (1996) The contribution of medical care to mortality decline: McKeown revisited, Journal of Clinical Epidemiology, 49(11): 1207–13.
Mariotto, A., Capocaccia, R. and Verdecchia, A. (2002) Projecting SEER cancer survival rates to the US: an ecological regression approach, Cancer Causes and Control, 13(2): 101–11.
Marques-Vidal, P. et al. (1997) Trends in coronary heart disease morbidity and mortality and acute coronary care and case fatality from 1985–1989 in southern Germany and south-western France, European Heart Journal, 18(5): 816–21.
Martini, C.J. et al. (1977) Health indexes sensitive to medical care variation, International Journal of Health Services, 7(2): 293–309.
Mathers, C., Salomon, J. and Murray, C. (2003) Infant mortality is not an adequate summary measure of population health, Journal of Epidemiology and Community Health, 57: 319.
Mathers, C. et al. (2003) Alternative summary measures of average population health, in C.J.L. Murray and D.B. Evans (eds) Health Systems Performance Assessment: Debates, methods and empiricism. Geneva: World Health Organization.
Book 1.indb 154Book 1.indb 154 12/04/2013 08:3712/04/2013 08:37
Comparing population health 155
McColl, A. and Gulliford, M. (1993) Population health outcome indicators for the NHS. A feasibility study. London: Faculty of Public Health Medicine and the Department of Public Health Medicine, United Medical and Dental Schools of Guy’s and St Thomas’ Hospitals.
McKee, M. (1999) For debate – Does health care save lives? Croatian Medical Journal, 40(2): 123–8.
McKee, M. (2010) The World Health Report 2000: 10 years on, Health Policy and Planning, 25(5): 346–8.
McKee, M., Shkolnikov, V. and Leon, D.A. (2001) Alcohol is implicated in the fl uctuations in cardiovascular disease in Russia since the 1980s, Annals of Epidemiology, 11(1): 1–6.
McKee, M. et al. (1996) Preventing sudden infant deaths – the slow diffusion of an idea, Health Policy, 37(2): 117–35.
McKeown, T. (1979) The role of medicine: dream, mirage or nemesis. Oxford: Blackwell.McKinlay, J.B. and McKinlay, S.M. (1977) The questionable contribution of medical
measures to the decline of mortality in the United States in the twentieth century, The Milbank Memorial Fund Quarterly: Health and Society, 55(3): 405–28.
Murray, C. et al. (eds) (2002) Summary measures of population health. Concepts, ethics, measurement and applications. Geneva: World Health Organization.
Newey, C. et al. (2004) Avoidable mortality in the enlarged European Union. Paris: Institut des Sciences de la Santé.
Nixon, J. and Ulmann, P. (2006) The relationship between health care expenditure and health outcomes. Evidence and caveats for a causal link, European Journal of Health Economics, 7(1): 7–18.
Nolte, E. (2010) International benchmarking of healthcare quality: A review of literature. RAND Europe (http://www.rand.org/content/dam/rand/pubs/technical_reports/2010/RAND_TR738.pdf, accessed 8 October 2012).
Nolte, E. and McKee, M. (2004) Does healthcare save lives? Avoidable mortality revisited. London: The Nuffi eld Trust (http://www.nuffi eldtrust.org.uk/sites/fi les/nuffi eld/publication/does-healthcare-save-lives-mar04.pdf, accessed 8 October 2012).
Nolte, E. and McKee, M. (2008) Measuring the health of nations: updating an earlier analysis, Health Affairs (Millwood), 27(1): 58–71.
Nolte, E., Bain, C. and McKee, M. (2006) Diabetes as a tracer condition in international benchmarking of health systems, Diabetes Care, 29(5): 1007–11.
Nolte, E., Bain, C. and McKee, M. (2009) Population health, in P.C. Smith et al. (eds) Performance measurement for health systems improvement: Experiences, challenges and prospects. Cambridge: Cambridge University Press.
Nolte, E., et al. (2000) Neonatal and postneonatal mortality in Germany since unifi cation, Journal of Epidemiology and Community Health, 54(2): 84–90.
Nolte, E., et al. (2002) The contribution of medical care to changing life expectancy in Germany and Poland, Social Science and Medicine, 55(11): 1905–21.
Nolte, E. et al. (2011) Saving lives? The contribution of health care to population health, in J. Figueras, et al.(eds) Health Systems, Health, Wealth and Societal Well-being: Assessing the case for investing in health systems. Buckingham: Open University Press (European Observatory on Health Systems and Policies Series).
OECD (2004) Private health insurance in OECD countries. The OECD Health Project, OECD Publishing (http://www.oecd-ilibrary.org/social-issues-migration-health/private-health-insurance-in-oecd-countries_9789264007451-en, accessed 8 October 2012).
Or, Z. (2000) Determinants of health outcomes in industrialized countries: a pooled, cross-country, time-series analysis, OECD Economic Studies, 30: 53–77.
Or, Z. (2001) Exploring the effects of health care on mortality across OECD countries. Paris: Organisation for Economic Co-operation and Development (Labour Market and Social Policy Occasional Paper, no.46).
Book 1.indb 155Book 1.indb 155 12/04/2013 08:3712/04/2013 08:37
156 Health system performance comparison
Richardus, J.H. et al. (1998) The perinatal mortality rate as an indicator of quality of care in international comparisons, Medical Care, 36(1): 54–66.
Rutstein, D.D. et al. (1976) Measuring the quality of medical care. A clinical method, New England Journal of Medicine, 294(11): 582–8.
Scioscia, M. et al. (2007) A critical analysis on Italian perinatal mortality in a 50-year span, European Journal of Obstetrics and Gynecology and Reproductive Biology, 130(1): 60–5.
Scott, A., Campbell, H. and Gorman, D. (1993) Sudden infant death in Scotland, BMJ, 306(6871): 211–12.
Smith, P.C. et al. (eds) (2009) Performance measurement for health system improvement: Experiences, challenges and prospects. Cambridge: Cambridge University Press.
Telishevka, M., Chenett, L. and McKee, M. (2001) Towards an understanding of the high death rate among young people with diabetes in Ukraine, Diabetic Medicine, 18(1): 3–9.
Tobias, M. and Yeh, L.C. (2009) How much does health care contribute to health gain and to health inequality? Trends in amenable mortality in New Zealand 1981–2004, Australian and New Zealand Journal of Public Health, 33(1): 70–8.
Tunstall-Pedoe, H. et al. (1999) Contribution of trends in survival and coronary-event rates to changes in coronary heart disease mortality: 10-year results from 37 WHO MONICA project populations. Monitoring trends and determinants in cardiovascular disease, The Lancet, 353(9164): 1547–57.
Tunstall-Pedoe, H. et al. (2000) Estimation of contribution of changes in coronary care to improving survival, event rates, and coronary heart disease mortality across the WHO MONICA Project populations, The Lancet, 355(9205): 688–700.
Uusküla, M., Lamp, K. and Väli, M. (1998) An age-related difference in the ratio of sudden coronary death over acute myocardial infarction in Estonian males, Journal of Clinical Epidemiology, 51(7): 577–80.
van der Pal-de Bruin, K.M. et al. (2002) The infl uence of prenatal screening and termination of pregnancy on perinatal mortality rates, Prenatal Diagnosis, 22(11): 966–72.
Van der Zee, J. and Kroneman, M.W. (2007) Bismark or Beveridge: a beauty contest between dinosaurs, BMC Health Services Research, 7: 94.
Verdecchia, A. et al. (2007) Recent cancer survival in Europe: a 2000–02 period analysis of EUROCARE-4 data, The Lancet Oncology, 8(9): 784–96.
Walshe, K. (2003) International comparisons of the quality of health care: what do they tell us? Quality and Safety in Health Care, 12(1): 4–5.
WHO (1999) Defi nition, diagnosis and classifi cation of diabetes mellitus and its complications. Part 1: diagnosis and classifi cation of diabetes mellitus. Geneva: World Health Organization.
WHO (2000) The World Health Report 2000 – Health systems: improving performance. Geneva: World Health Organization.
WHO (2009) Global health risks: mortality and burden of disease attributable to selected major risks. Geneva: World Health Organization.
Wiesner, G., Grimm, J. and Bittner, E. (1999) Zum Herzinfarktgeschehen in der Bundesrepublik Deutschland: Prävalenz, Inzidenz, Trend, Ost-West-Vergleich, Gesundheitswesen, 61(Suppl 2): 72–8.
Wright, J.C. and Weinstein, M.C. (1998) Gains in life expectancy from medical inter-ventions – standardizing data on outcomes, New England Journal of Medicine, 339(6): 380–6.
Yudkin, J.S. and Beran D. (2003) Prognosis of diabetes in the developing world, The Lancet, 362(9393): 1420–1.
Zatonski, W.A., McMichael, A.J. and Powles, J.W. (1998) Ecological study of reasons for sharp decline in mortality from ischaemic heart disease in Poland since 1991, BMJ, 316(7137): 1047–51.
Book 1.indb 156Book 1.indb 156 12/04/2013 08:3712/04/2013 08:37