62
Karen Jonscher, PhD Director, SBCF/TATC Proteomics Core Facility UCD, School of Medicine, Department of Anesthesiology

Karen Jonscher, PhDDirector, SBCF/TATC Proteomics Core FacilityUCD, School of Medicine, Department of Anesthesiology

BS in Engineering Physics, CU Boulder MS, PhD in Applied Physics, Caltech Thesis work – building nanospray and MALDI
sources as well as hybrid quadrupole ion trap MS, Lee Hood/John Yates
PostDoc, National Jewish, phosphoprotein analysis CU Boulder, Katheryn Resing, methods
development for shotgun proteomics, data validation
UCD, Associate Professor, Proteomics Core Director, SBCF/TATC Mass Spectrometry Core Facility

Identify the elements of the proteomics workflowSample preparation basics Separations HPLC Affinity
Mass spectrometry basics Ionization Elements of a spectrum Isotopes Information content
How can mass spec be used?
Inlet Ion source Mass analyzer Detector Software

What is my protein (i.e. protein ID)? How does the amount of my protein(s)
change in a healthy cell vs. a diseased cell (or tissue or blood or…)?
Does my protein interact with other proteins? Do any chemical changes happen to my
protein that might affect how it functions?
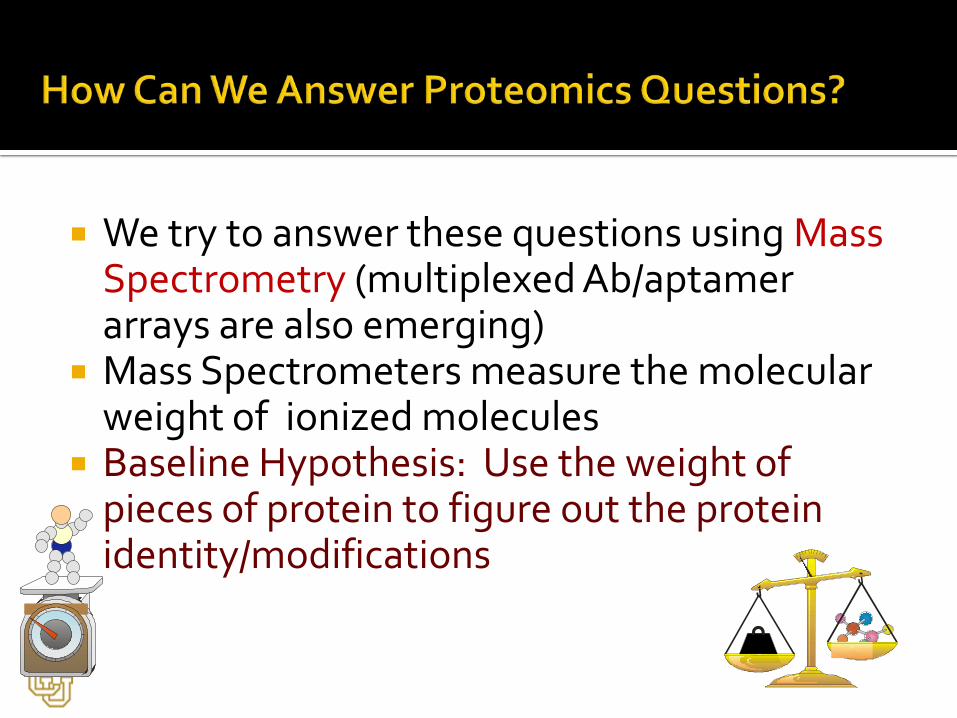
We try to answer these questions using Mass Spectrometry (multiplexed Ab/aptamerarrays are also emerging)
Mass Spectrometers measure the molecular weight of ionized molecules
Baseline Hypothesis: Use the weight of pieces of protein to figure out the protein identity/modifications
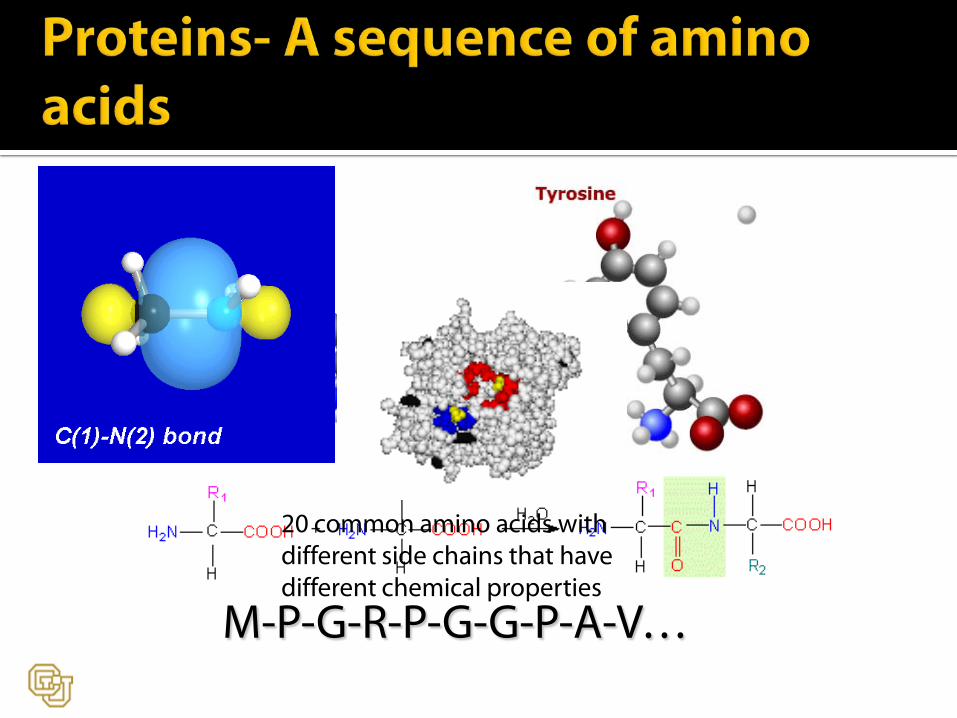
M-P-G-R-P-G-G-P-A-V…
20 common amino acids with different side chains that have different chemical properties

>sp|P68871|HBB_HUMAN Hemoglobin beta subunit (Hemoglobin beta chain) (Beta-globin) - Homo sapiens (Human). VHLTPEEKSAVTALWGKVNVDEVGGEALGRLLVVYPWTQRFFESFGDLSTPDAVMGNPKVKAHGKKVLGAFSDGLAHLDNLKGTFATLSELHCDKLHVDPENFRLLNVLVCVLAHHFGKEFTPPVQAAYQKVVAGVANALAHKYH
Hemoglobin has 2 alpha and 2 beta chains. These chains interact and form a 4 unit structure.
Sickle Cell Anemia results when valine is substituted for glutamic acid in both beta chains. This causes the mutant hemoglobins to stick to other mutant hemoglobins, forming a polymer. The result is misshapen cells that cannot transfer oxygen through small blood vessels.

Sickle Cell Normal CellAffects transport of oxygen to organs and muscles – leads to
pain, anemia (weakness), infection, sometimes death.

Sample Preparation
Mass Spectrometric Analysis
Data Analysis and Mining

Separation Fractionate by solubility (cytoplasmic/nuclear) Fractionate by organelle (mitochondria, Golgi,
etc) Fractionate by protein (size, charge, affinity)
Enzymatic digestion Separation Fractionate by peptide (size, charge)

The Importance of Separation

Peptide level
Protein level
Due to signal suppression, mass spectrometers can only analyze a limited number of ions at a time
Gel-based approach
Use polyacrylamide gels, isoelectric focusing to separate proteins
Use HPLC to simplify complex mixtures Size (gel filtration, reverse phase)
Affinity (immunodepletion)
Hydrophobicity (reverse phase)
Basicity (cation/anion exchange, SCX)


Concentration 10% 20% 40% 60%

422.0607.5
842.8
0.00.51.01.52.02.5
6x10
Intens.
400 600 800 1000 1200 1400 1600 1800 2000 m/z
594.6
736.6
798.6
899.0
963.61020.6
1141.6
1402.8012345x10
Intens.
400 600 800 1000 1200 1400 1600 1800 2000 m/z

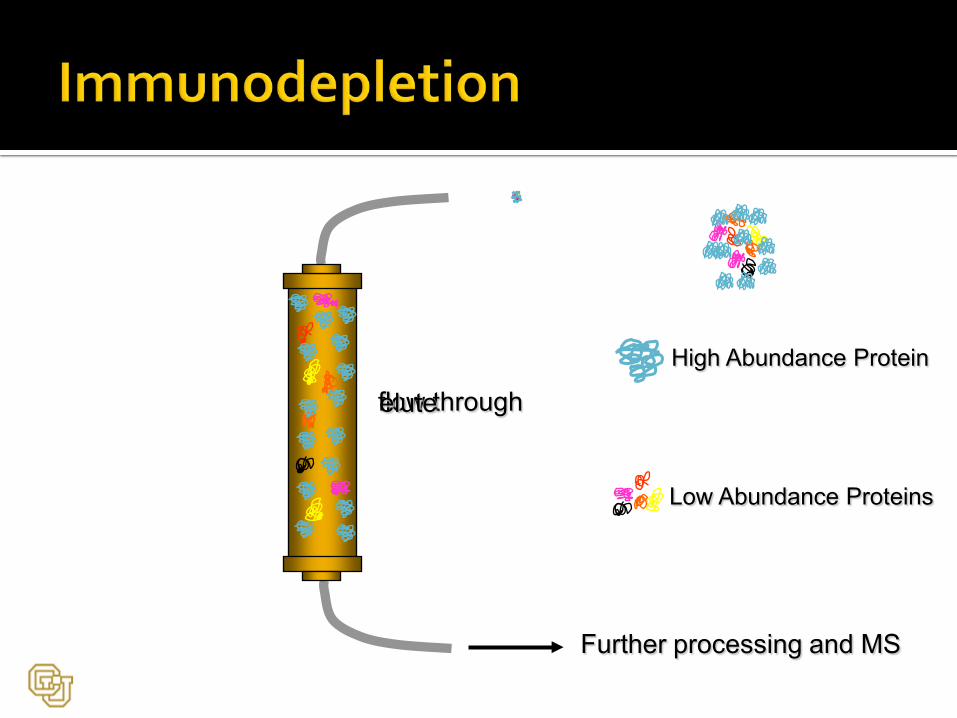
Low Abundance Proteins
High Abundance Protein
flow through
Further processing and MS
elute

Flow Through(Low Abundance)
Eluate(High
Abundance)
Fractionate the fractions!

High Abundance Flowthru 1 Flowthru 2
Albumin288
Albumin0
Albumin0

FT.D: BPC 100-2200 +All MS
0.0
0.5
1.0
1.5
2.0
8x10Intens.
20 40 60 80 100 120 Time [min]
Use information from gel as well as MS data to identify proteins
Need to have multiple hits to identify proteins.
Shotgun ProteomicsMulti-Dimensional LCMudPIT
2DGEDIGE
The sample (fractionated/immunodepleted/immuno-enriched) is ready for proteomics – now what?
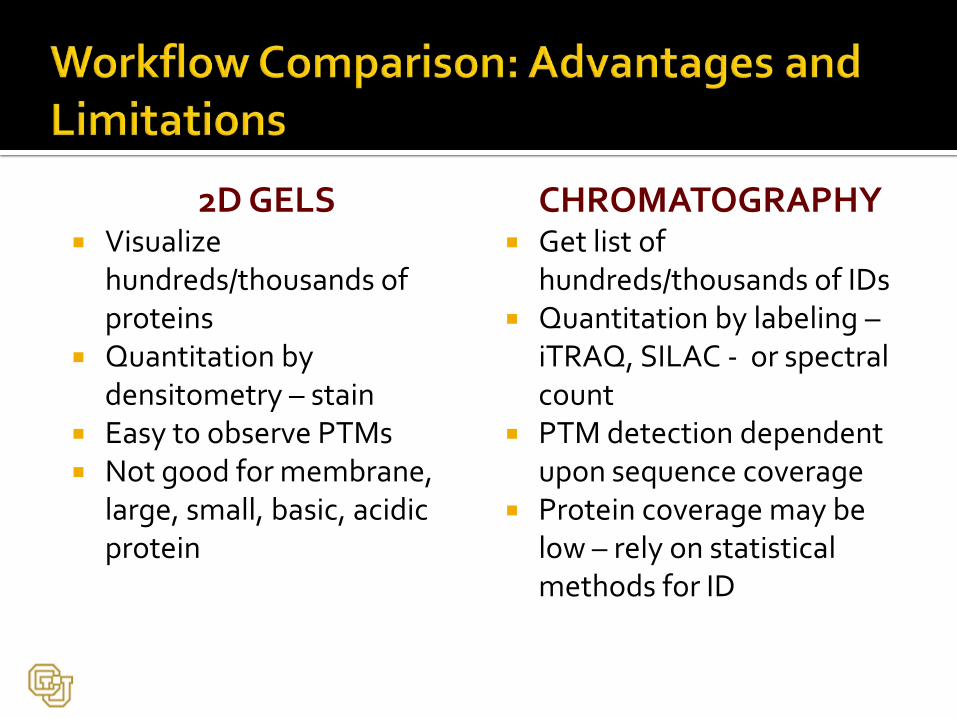
2D GELS Visualize
hundreds/thousands of proteins
Quantitation by densitometry – stain
Easy to observe PTMs Not good for membrane,
large, small, basic, acidic protein
CHROMATOGRAPHY Get list of
hundreds/thousands of IDs Quantitation by labeling –
iTRAQ, SILAC - or spectral count
PTM detection dependent upon sequence coverage
Protein coverage may be low – rely on statistical methods for ID

Ion Source Mass Analyzer Detector
ESI
MALDI
EI
CIAPCI
APPI
DIOS
FAB
LSIMS
Fourier Transform
Time-of-Flight
Ion Trap
Quadrupole
Electron Multiplier
Multichannel Plate
Photomultiplier
Inlet
HPLC
Probe
Plate
Syringe
GC
Vial

Ion Source Mass Analyzer Detector
ESI
MALDI
Fourier Transform
Time-of-Flight
Ion Trap
Quadrupole
Electron Multiplier
Multichannel Plate
Photomultiplier
Inlet
HPLC
Plate
NSI

1. An ion is an electrically charged molecule.
2. An ion can be positively (+) charged or negatively (-) charged.Consider the poles on a battery.
3. Molecules must be charged to be measured by a mass spectrometer.
4. A mass spectrometer "weighs" molecules electronically by attracting and repelling ions. Consider magnets. Opposites attract. Like charges repel.
- +

Removing an electron (EI/CI)Adding a proton (ESI/NSI/MALDI)
Adding a cation (Na)
Removing a proton (negative ions)
Capturing an electron (EC)

Charged Droplet
Stainless steel capillary50 mm fused-silica capillary
MS
HV (-ve)
+ ++ ++
++ + +
+
Taylor Cone
Monodisperse drops
• extremely gentle ionization technique• generates multiply-charged ions• ideal for macromolecules
atmosphere
5-20 ml/min
3-4 kV
N2
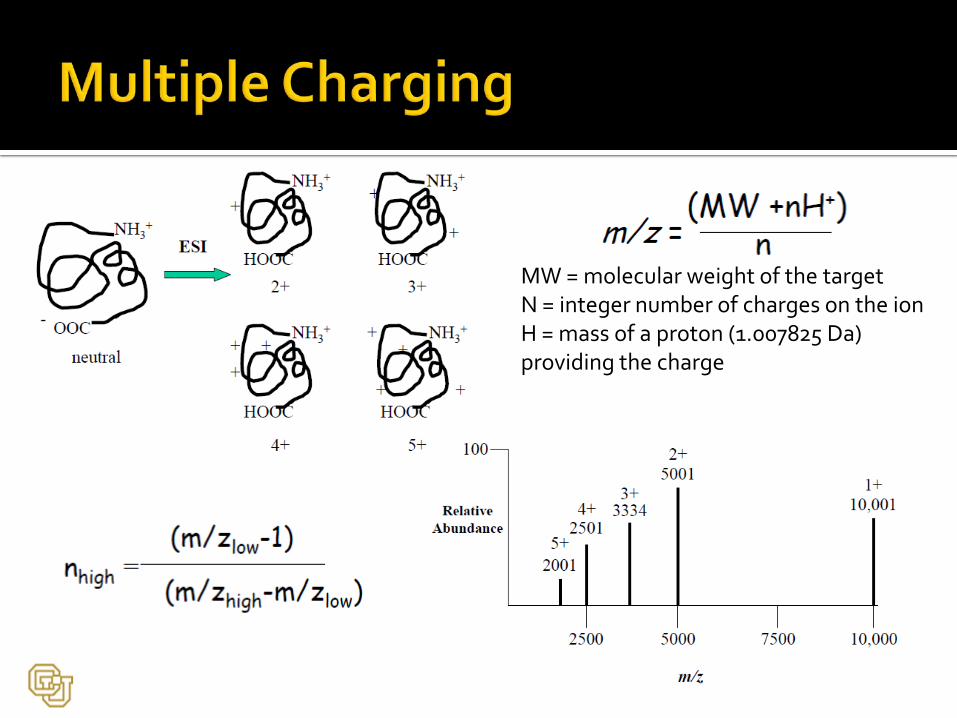
MW = molecular weight of the targetN = integer number of charges on the ionH = mass of a proton (1.007825 Da) providing the charge

Resources for nanospray at www.newobjective.com

10-400 nl/min flow rate Droplets many times smaller than
conventional ESI 2-3 times higher ion current than ESI
at a given concentration Smaller tip close to inlet – better ion
transfer No nebulization 100X improvement in efficiency Works for high polarity solvents like
pure water Tolerates salts better than ESI Static vs. dynamic nanospray Pioneering work: Wilm and Mann,
Anal Chem, 68 (1996) 1-8.New Objective

Peptides, proteins, oligonucleotides, carbohydrates, natural products, lipids

H+ Uex
Mass Analyzer
MatrixCation (e.g. Na+)AnalyteNa+
Laser – 337 nm
Extraction Voltage – 25 kV

Isolate and encase the analyte molecules (analogous to a solvent shell) Absorb the laser energy via electronic or vibrational coupling/excitation Facile desorption from the condensed phase WITH the analyte
molecules but WITHOUT destructive heating of the analyte molecules (“softness”)
Efficient ionization of analyte molecules
Karas et al. J. Mass Spectrom. 2000, 35, 1-12.K. Dreisewerd Chem. Rev. 2003, 103, 395-425
= Analyte
= Matrix
Photons= “Excited” Matrix

MALDI
Electrospray
1000 1500 2000m/z
100
75
50
25
066,000 67,000
Molecular Weight
reconstruct(%)
66,400
30+32+
34+
36+
38+
41+45+
47+
49+
51+
53+
bovine serum albumin
Mass Range vs. m/z range

ESI Benefits ESI Detractors
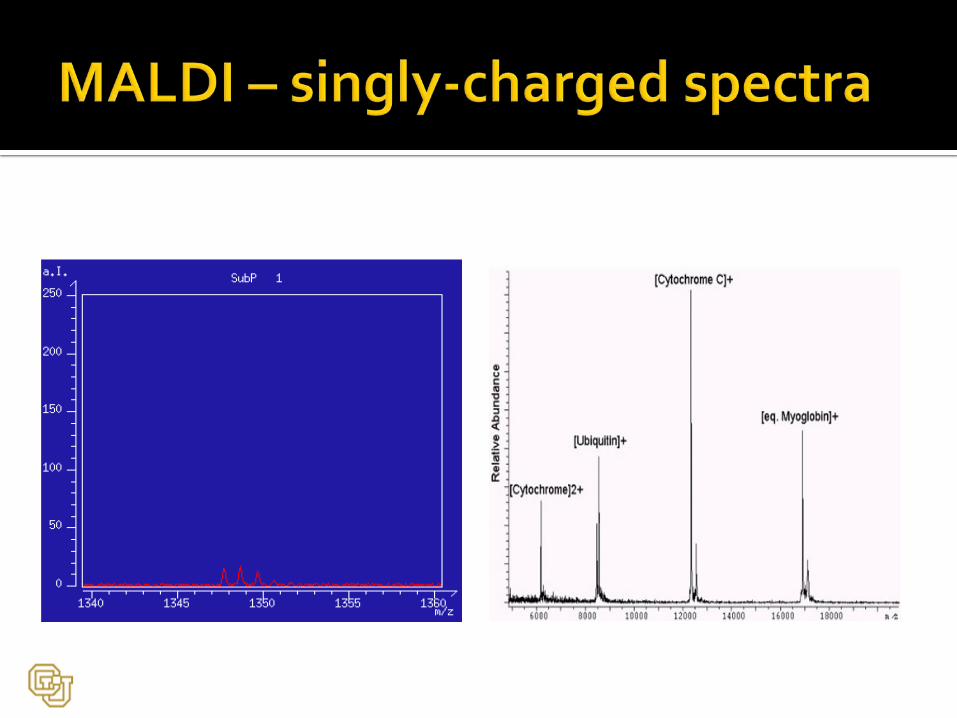
MALDI Benefits
MALDI Detractors
Multiply chargedMultiply charged ions difficult to
interpretSingly charged Singly charged ions
difficult to dissociate
Salts disrupt signal
Tolerate salts
No matrix interferenceMatrix causes
background at m/z <700
Can interface directly to LC
Slow analytical throughput
Quick analytical throughput
Signal suppression limits mixture complexity

Ion Source Mass Analyzer DetectorInlet
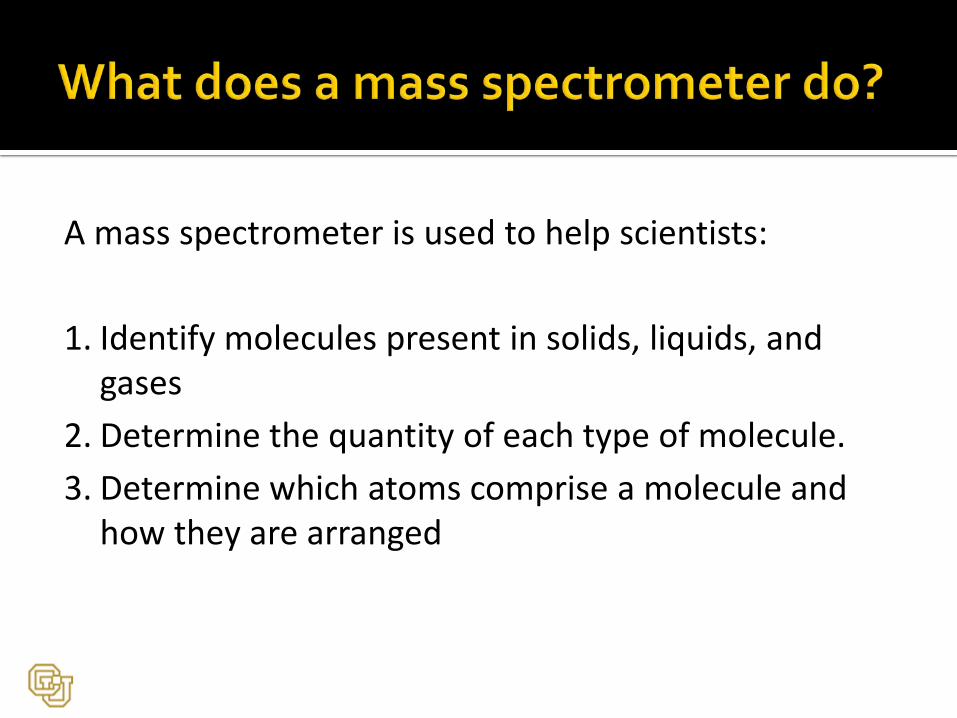
A mass spectrometer is used to help scientists:
1. Identify molecules present in solids, liquids, and gases
2. Determine the quantity of each type of molecule.3. Determine which atoms comprise a molecule and
how they are arranged

500 1000 1500 2000 2500m/z
Rel
ativ
e Abu
ndan
ce The number of components in a sample The mass-to-charge of each component in a sample The relative abundance of each species The structure of each component in a sample

ionization
mass analysis
detection
10-4 – 10-9 torr
Atm – 10-6 torr 10-6 – 10-9 torr
m/z
Animated graphic courtesy of ionsource.com
Separating the ions

•Pocket change (mixture of coins)•Penny, dime, nickel, quarter, half $•Sorting change by value or size
•Mixture of molecules•Molecules of different weight, size•Separation by mass spectrum
3
8
5
4
2
dime penny nickel quarter half $
Size (m/z)
Qua
ntit
y (A
bund
ance
)

From Gross
m/z 12.0000 -> C, 1 u = 1/12 12C1 u increments -> loss of H12 + 4 = 16 = C + 4H = CH4

Exact mass = 46.04Full mass = 46.07?


StandardAtomic Weight
IsotopicComposition
RelativeAtomic MassIsotope
Coursey, J. S., Schwab, D. J., and Dragoset, R. A. (2001). Atomic Weights and Isotopic Compositions(version 2.3), [Online]. Available: http://physics.nist.gov/Comp [2002, April 22]. National Institute of Standards and Technology, Gaithersburg, MD.
0.205(14) 17.999 160 4(9) 18
0.038(1) 16.999 131 50(22) 17
15.9994(3) 99.757(16) 15.994 914 6221(15) 16 O
N
0.368(7) 15.000 108 8984(9) 15
14.0067(2) 99.632(7) 14.003 074 0052(9) 14
14.003 241 988(4) 14
1.07(8) 13.003 354 8378(10) 13
12.0107(8) 98.93(8) 12.000 000 0(0) 12 C

http://www.ionsource.com/tutorial/isotopes

Resolving power => Ability of a mass spectrometer to distinguish between ions of different mass-to-charge ratios.
R=M/∆M M=m/z ∆M=full width of the peak at half
maximum Mass accuracy ∆M/M
500/1=500

Blue: ∆m = 3.48 R = 1000, 1000 ppmRed: ∆m = 1.161 R = 3000, 333 ppmGreen: ∆m = 0.348 R = 10,000, 99 ppmBlack: ∆m = 0.116 R = 30,000, 33 ppm
R = m/∆m
Where a monoisotopic peak can be identified, mass accuracy follows resolution. For some instruments, increased
resolution comes at the price of sensitivity.http://www.matrixscience.com/help/mass_accuracy_help.html

For a compound with a mass of 1000 Daltons:
1000 ± 2.0 Da (or ± 2000 ppm)
1000 ± 0.5 Da (or ± 500 ppm)
1000 ± 0.1 Da (or ± 100 ppm)
1000 ± 0.01 Da (or ± 10 ppm)
1000 ± 0.002 Da (or ± 2 ppm)
ESI-TOF
MALDI-TOF
3D Trap

Mass Accuracy # of Candidate Proteins in DB
1 Da 1000
0.1 Da 100
0.01 Da 10
Consider the peptide with sequence EAGPEMADQK
In proteomics, it’s all about the database search
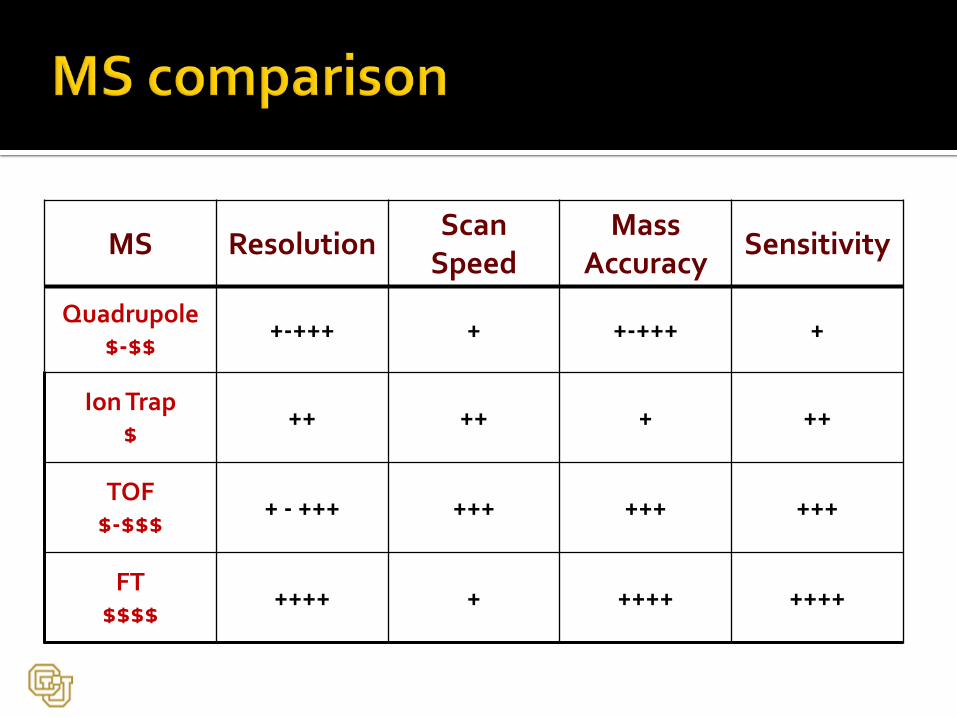
MS ResolutionScan
SpeedMass
AccuracySensitivity
Quadrupole$-$$
+-+++ + +-+++ +
Ion Trap$
++ ++ + ++
TOF$-$$$
+ - +++ +++ +++ +++
FT$$$$
++++ + ++++ ++++

Two mass spectrometers joined by a chamber that breaks apart molecules.This definition is appropriate for tandem-in-space but not for tandem-in-time.
Puzzle Analogy
MS #1Fragmentation
Chamber MS #2
Sorting molecules
Breaking molecules Sorting pieces
1
1
2
1
2
1

Words
Comprised of letters.
Arrangement of letters gives
words meaning.
Special groups of letters make
syllables.
Common endings = suffixes.Talking
Writing
Playing
Use a computer to search for the string "ing" and it displays all words containing "ing“ in a certain document.
Molecules
Comprised of atoms.
Arrangement of atoms gives
molecules function.
Special groups of atoms
make functional groups.
Common side chains = esters.
H2NCH2COOC4H9
H2NCH(CH2)COOC4H9
H2NCH(C6H5)COOC4H9
Use a NL scan function to detect only molecules in your plasma sample that lose a butylformate function group weighing 102 Da

-2 kV
Signal
15 kV
Electron Multiplier
Conversion Dynode
MicrochannelPlate
Photocathode
Scintillator
Anode
Photomultiplier

A. High sensitivity• Ability to detect very small amounts
B. High selectivity• Ability to tell molecules apart in a mixture
C. High time resolutionD. Low CostE. I have no idea

Metals, Glass, Ceramics and Composites
Electronic Materials and Devices
Energy System Diagnostics: Solar, Fossil, Fission and Fusion
On-Line Monitoring and Process Control
Air and Water Monitoring
Agriculture and Food Science
Defining grain boundaries at ppm concentrations
Ion beam milling (0.2 mm) and etching
Coal and Petroleum Research
Food and brewing industry
Biological Warfare Detection, Spacecraft
Herbicides, insecticides and fungicides

a doctor, a lawyer and a mass spectrometrist

Magnetic Resonance Imaging (NMR)
Positron Emission Tomography
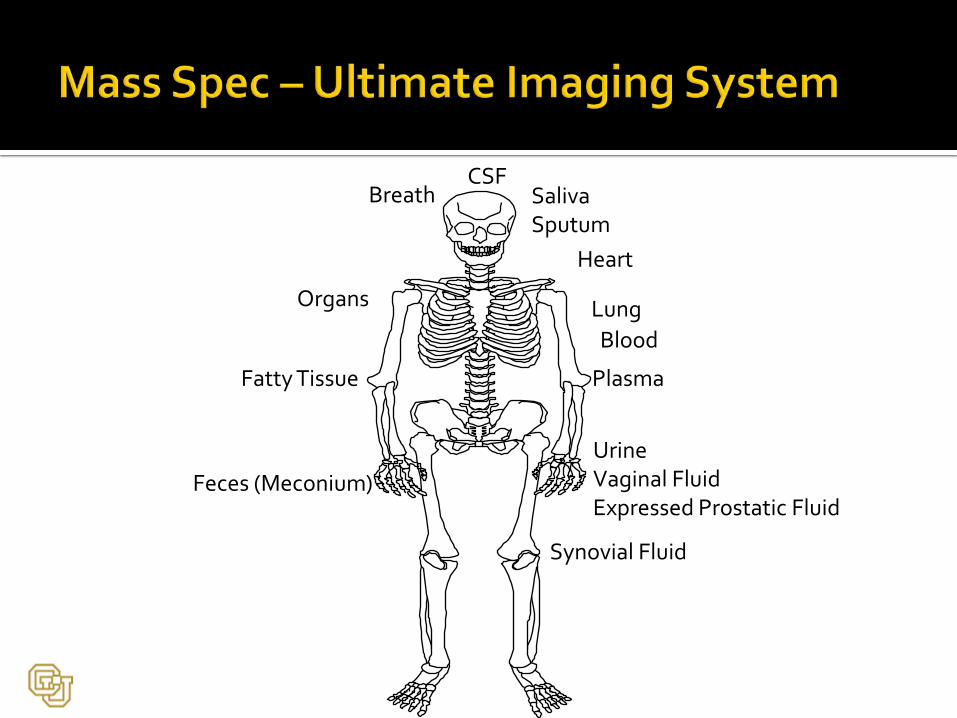
Hair
SalivaSputum
Breath
Blood
UrineVaginal FluidExpressed Prostatic Fluid
Feces (Meconium)
Lung
Heart
Brain
Fatty Tissue Plasma
Organs
CSF
Synovial Fluid

SampleIntroduction
Mass Analyzer
IonizationMethod
Direct InfusionDirect Probe
GCGC/GC
LCCE
2DLC
EICI
ESIMALDIPDMS
Spark SourceICP
Laser MicroprobeSIMSFAB
Field IonizationPyrolysis
ThermosprayAPCIAPPIDESI
DARTMALDESI
l-TOFr-TOF
l-QuadQIT
Magnetic SectorFT-ICR
Orbitrap
Tandem-MS(in-space)
QQQQIT-TOFQ-FTICRTOF-TOF
(in-time)FTICR
QIT

Problem

Identify the elements of the proteomics workflowSample preparation basics Separations HPLC Affinity
Mass spectrometry basics Ionization Elements of a spectrum Isotopes Information content
How can mass spec be used?
Inlet Ion source Mass analyzer Detector Software


