OUTLOOK FOR LONG-TERM SUPPLY AND DEMND FOR FOREST PRODUCTS ON THE EUROPEAN FOREST SECTOR OUTLOOK STUDIES. Kari Kangas and Anders Baudin. EFSOS – the European Forest Sector Outlook studies Part of the activities of the Timber Committe. - PowerPoint PPT Presentation
21
Seminar on Strategies for the sound use of wood, Poiana Brasov, Romania, March 24-27 2003 European Forest Sector Outlook Studies (EFSOS) OUTLOOK FOR LONG-TERM SUPPLY AND DEMND FOR FOREST PRODUCTS ON THE EUROPEAN FOREST SECTOR OUTLOOK STUDIES Kari Kangas and Anders Baudin
Transcript
Seminar on Strategies for the sound use of wood, Poiana Brasov, Romania, March 24-27 2003
European Forest Sector Outlook Studies (EFSOS)
OUTLOOK FOR LONG-TERM SUPPLY AND DEMND FOR FOREST
PRODUCTS ON THE EUROPEAN
FOREST SECTOR OUTLOOK STUDIES
Kari Kangas and Anders Baudin
Seminar on Strategies for the sound use of wood, Poiana Brasov, Romania, March 24-27 2003
European Forest Sector Outlook Studies (EFSOS)
EFSOS – the European Forest Sector Outlook studies
Part of the activities of the Timber Committe
A next step taken from the European Timber Trends Studies (ETTS) - a history from 1953
to 1996
Seminar on Strategies for the sound use of wood, Poiana Brasov, Romania, March 24-27 2003
European Forest Sector Outlook Studies (EFSOS)
General objectives
A tool for policy analysis, forest management and industrial decision making
(i) To present the outlook for European demand for forest products
(ii) To present the outlook for supply of roundwood from European forests
(iii) to present the outlook for the balance between timber supply and demand
Seminar on Strategies for the sound use of wood, Poiana Brasov, Romania, March 24-27 2003
European Forest Sector Outlook Studies (EFSOS)
Methodologies
Seminar on Strategies for the sound use of wood, Poiana Brasov, Romania, March 24-27 2003
European Forest Sector Outlook Studies (EFSOS)Two Approaches to the Analysis of Demand and
Supply (a) a multiple equation model of demand (two equations) and supply (one equation), estimated for the countries that are the larger markets and/or major producers of forest products in Europe (Group I)
(b) two single-equation models of demand (apparent consumption), estimated for the other countries in west/central Europe (Group II) and two single-equation models estimated for former east bloc countries (Group III). A time series cross section approach
Seminar on Strategies for the sound use of wood, Poiana Brasov, Romania, March 24-27 2003
European Forest Sector Outlook Studies (EFSOS)
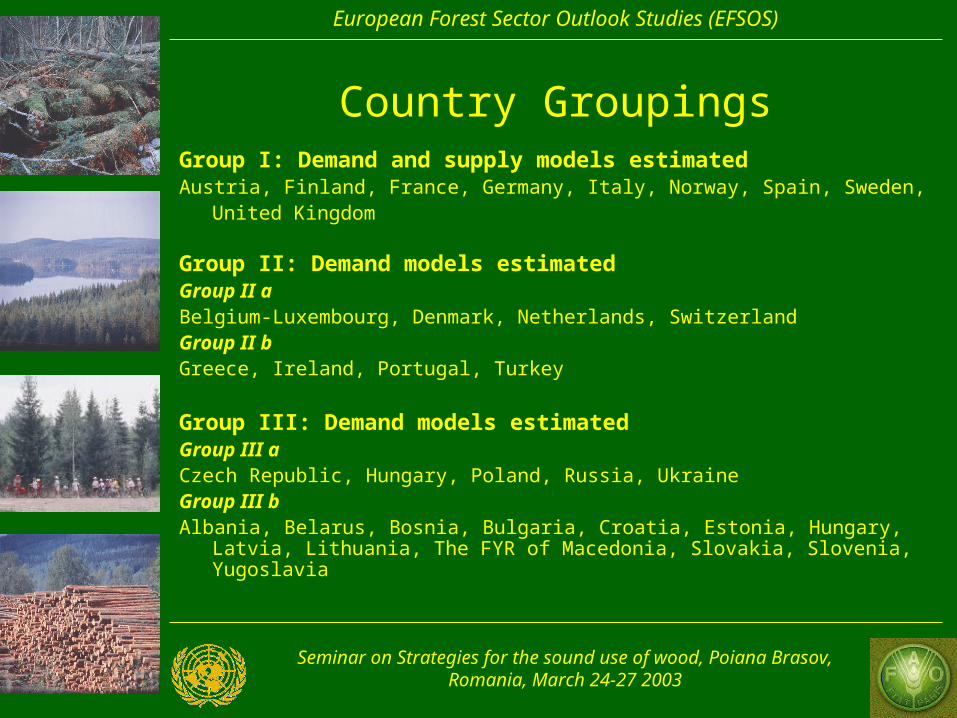
Country GroupingsGroup I: Demand and supply models estimatedAustria, Finland, France, Germany, Italy, Norway, Spain, Sweden,
United Kingdom
Group II: Demand models estimatedGroup II aBelgium-Luxembourg, Denmark, Netherlands, SwitzerlandGroup II bGreece, Ireland, Portugal, Turkey
Group III: Demand models estimatedGroup III aCzech Republic, Hungary, Poland, Russia, UkraineGroup III bAlbania, Belarus, Bosnia, Bulgaria, Croatia, Estonia, Hungary, Latvia,
Lithuania, The FYR of Macedonia, Slovakia, Slovenia, Yugoslavia
Seminar on Strategies for the sound use of wood, Poiana Brasov, Romania, March 24-27 2003
European Forest Sector Outlook Studies (EFSOS)
Product groups
SawnwoodConiferous Non-coniferous
Wood-based panelsPlywood Particleboard Fibreboard
Pulp and paperPulpRecycled paper Wood pulp
PaperNewsprint Printing & writing paper Other paper & board
Seminar on Strategies for the sound use of wood, Poiana Brasov, Romania, March 24-27 2003
European Forest Sector Outlook Studies (EFSOS)
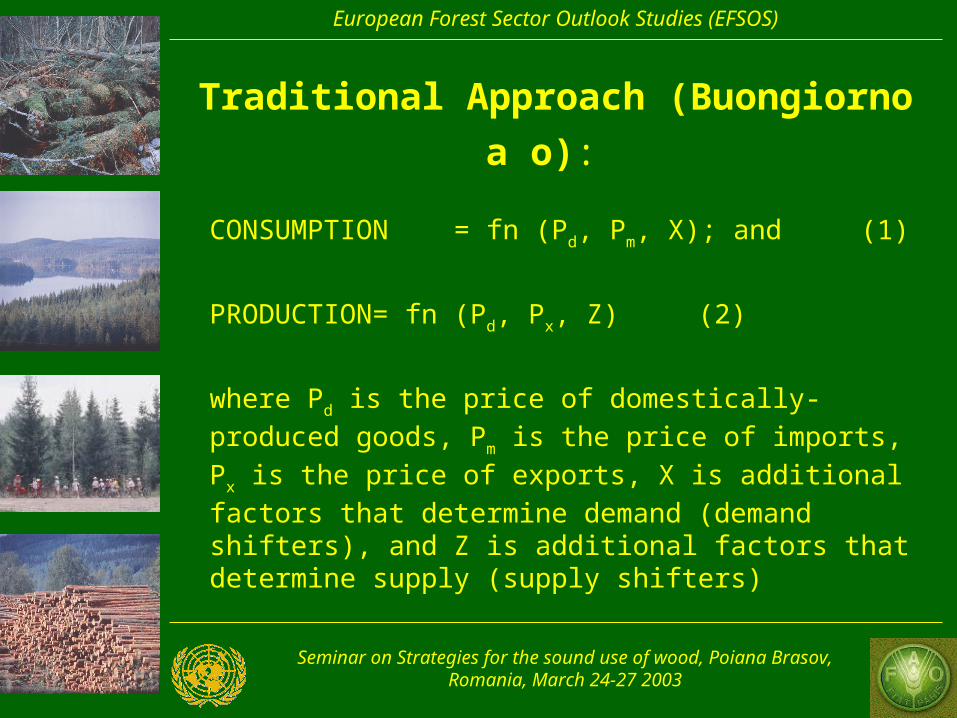
Traditional Approach (Buongiorno a
o):
CONSUMPTION = fn (Pd, Pm, X); and (1)
PRODUCTION = fn (Pd, Px, Z) (2)
where Pd is the price of domestically-produced goods, Pm is the price of imports, Px is the price of exports, X is additional factors that determine demand (demand shifters), and Z is additional factors that determine supply (supply shifters)
Seminar on Strategies for the sound use of wood, Poiana Brasov, Romania, March 24-27 2003
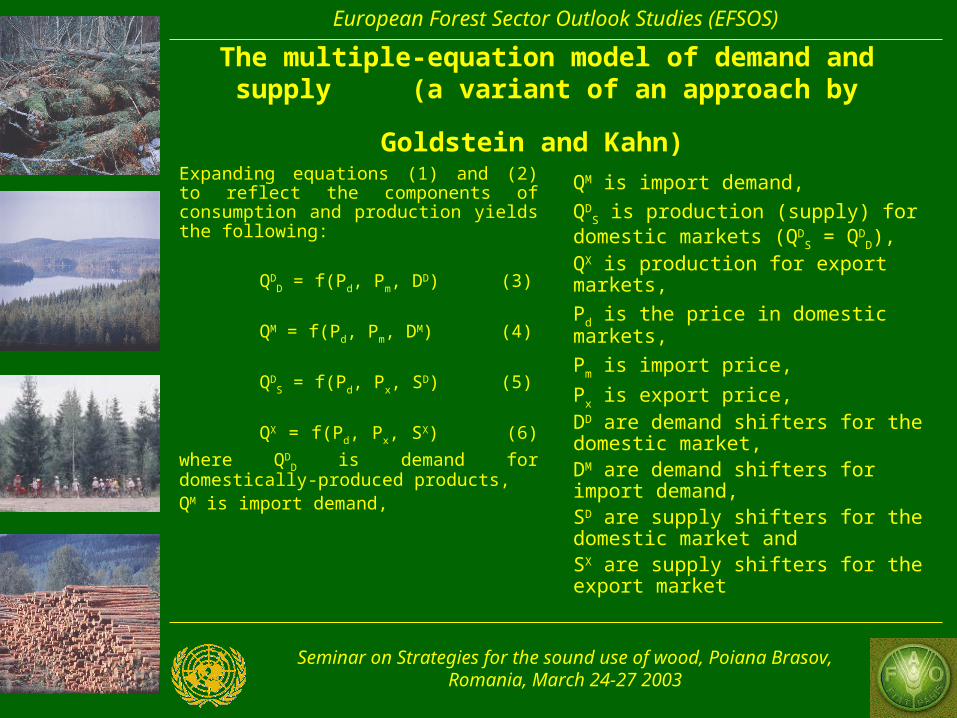
European Forest Sector Outlook Studies (EFSOS) The multiple-equation model of demand and
supply (a variant of an approach by Goldstein
and Kahn) Expanding equations (1) and (2) to reflect the components of consumption and production yields the following:
QDD = f(Pd, Pm, DD) (3)
QM = f(Pd, Pm, DM) (4)
QDS = f(Pd, Px, S
D) (5)
QX = f(Pd, Px, SX) (6)
where QDD is demand for
domestically-produced products, QM is import demand,
QM is import demand,
QDS is production (supply) for
domestic markets (QDS = QD
D), QX is production for export markets,
Pd is the price in domestic markets,
Pm is import price,
Px is export price, DD are demand shifters for the domestic market, DM are demand shifters for import demand, SD are supply shifters for the domestic market and SX are supply shifters for the export market
Seminar on Strategies for the sound use of wood, Poiana Brasov, Romania, March 24-27 2003
European Forest Sector Outlook Studies (EFSOS)
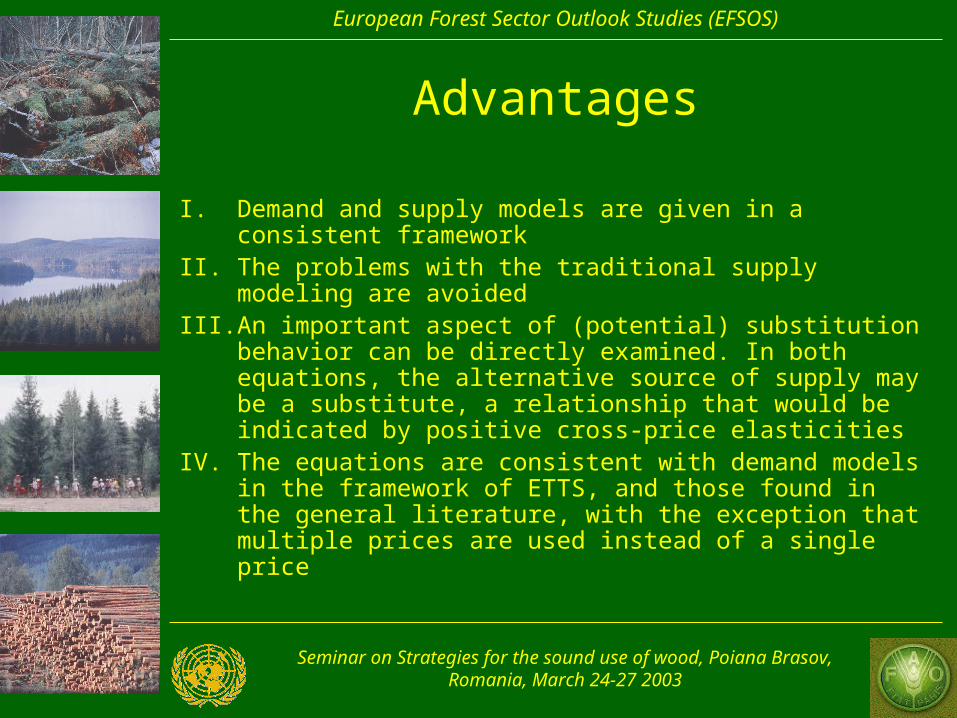
Advantages
I. Demand and supply models are given in a consistent framework
II. The problems with the traditional supply modeling are avoided
III. An important aspect of (potential) substitution behavior can be directly examined. In both equations, the alternative source of supply may be a substitute, a relationship that would be indicated by positive cross-price elasticities
IV. The equations are consistent with demand models in the framework of ETTS, and those found in the general literature, with the exception that multiple prices are used instead of a single price
Seminar on Strategies for the sound use of wood, Poiana Brasov, Romania, March 24-27 2003
European Forest Sector Outlook Studies (EFSOS)
Advantages
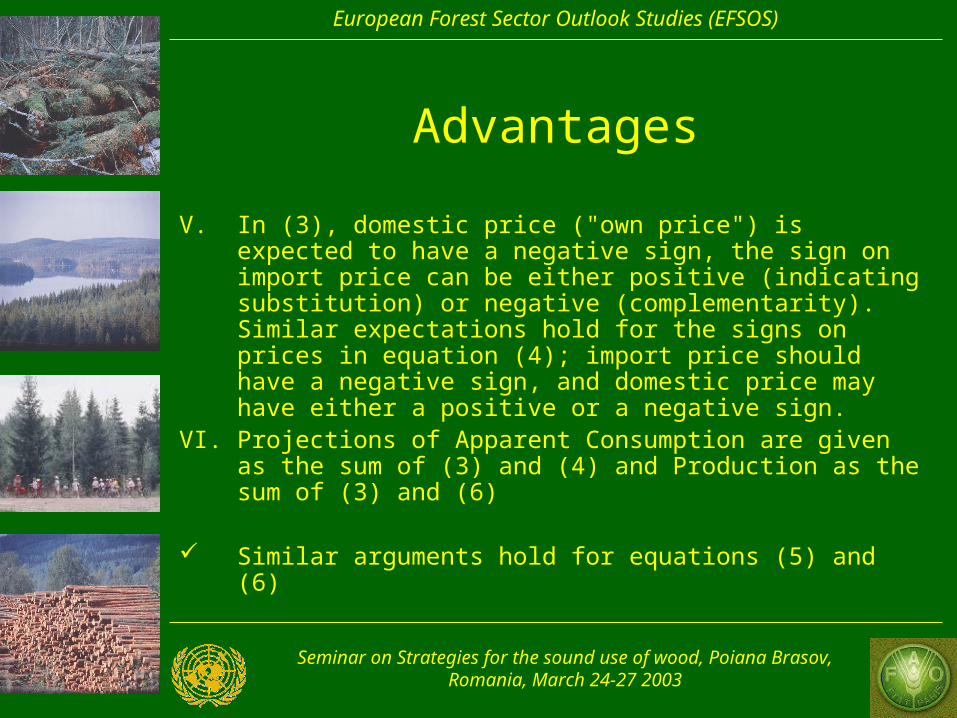
V. In (3), domestic price ("own price") is expected to have a negative sign, the sign on import price can be either positive (indicating substitution) or negative (complementarity). Similar expectations hold for the signs on prices in equation (4); import price should have a negative sign, and domestic price may have either a positive or a negative sign.
VI. Projections of Apparent Consumption are given as the sum of (3) and (4) and Production as the sum of (3) and (6)
Similar arguments hold for equations (5) and (6)
Seminar on Strategies for the sound use of wood, Poiana Brasov, Romania, March 24-27 2003
European Forest Sector Outlook Studies (EFSOS)
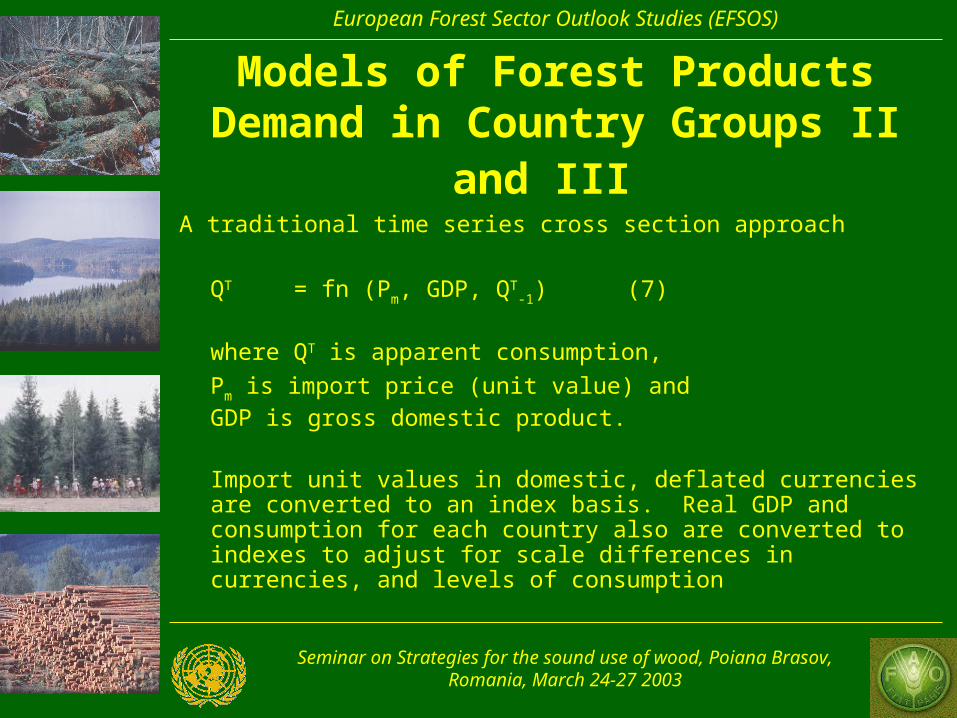
Models of Forest Products Demand in Country Groups II
and III A traditional time series cross section approach
QT = fn (Pm, GDP, QT-1) (7)
where QT is apparent consumption,
Pm is import price (unit value) and GDP is gross domestic product.
Import unit values in domestic, deflated currencies are converted to an index basis. Real GDP and consumption for each country also are converted to indexes to adjust for scale differences in currencies, and levels of consumption
Seminar on Strategies for the sound use of wood, Poiana Brasov, Romania, March 24-27 2003
European Forest Sector Outlook Studies (EFSOS)
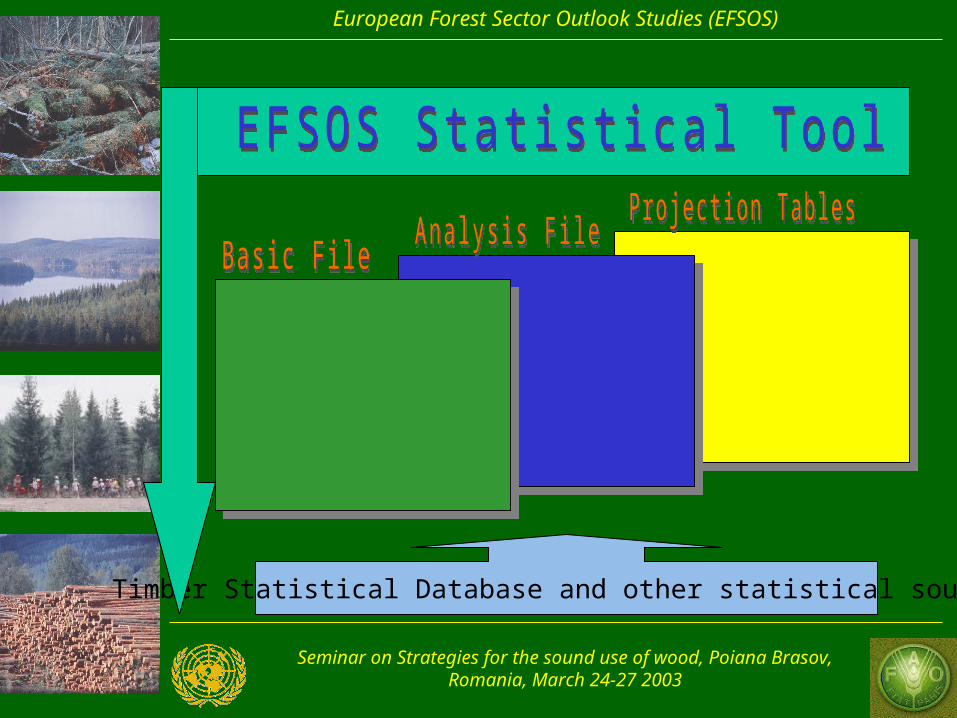
Timber Statistical Database and other statistical sources
Seminar on Strategies for the sound use of wood, Poiana Brasov, Romania, March 24-27 2003
European Forest Sector Outlook Studies (EFSOS)
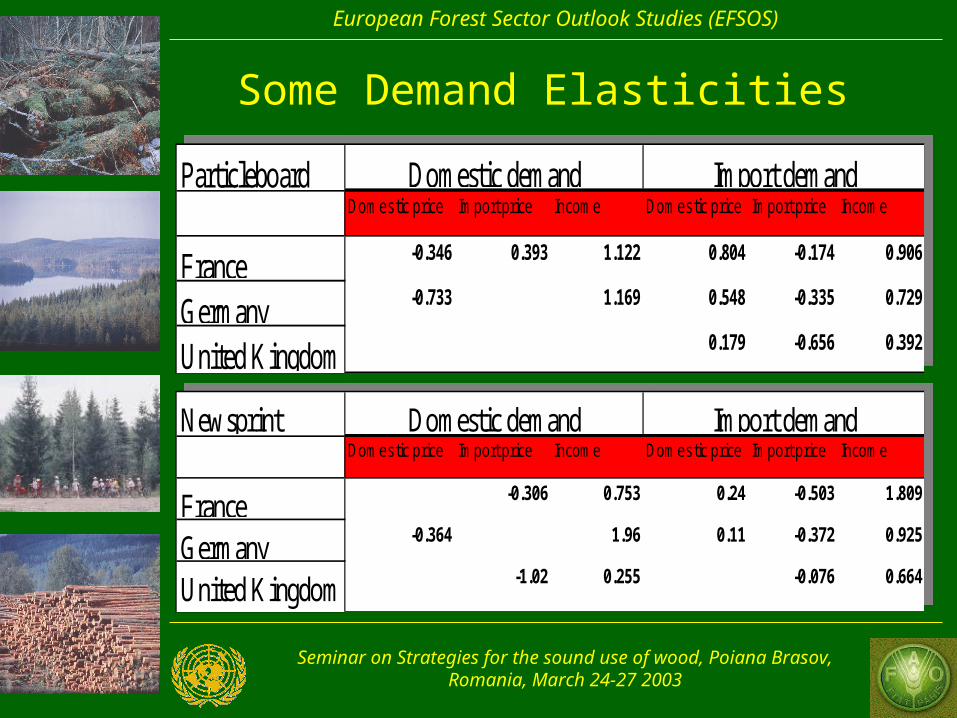
Some Demand Elasticities
NewsprintDomestic price Import price Income Domestic price Import price Income
France -0.306 0.753 0.24 -0.503 1.809
Germany -0.364 1.96 0.11 -0.372 0.925
United Kingdom -1.02 0.255 -0.076 0.664
Domestic demand Import demandNewsprintDomestic price Import price Income Domestic price Import price Income
France -0.306 0.753 0.24 -0.503 1.809
Germany -0.364 1.96 0.11 -0.372 0.925
United Kingdom -1.02 0.255 -0.076 0.664
Domestic demand Import demand
ParticleboardDomestic price Import price Income Domestic price Import price Income
France -0.346 0.393 1.122 0.804 -0.174 0.906
Germany -0.733 1.169 0.548 -0.335 0.729
United Kingdom 0.179 -0.656 0.392
Domestic demand Import demandParticleboardDomestic price Import price Income Domestic price Import price Income
France -0.346 0.393 1.122 0.804 -0.174 0.906
Germany -0.733 1.169 0.548 -0.335 0.729
United Kingdom 0.179 -0.656 0.392
Domestic demand Import demand
Seminar on Strategies for the sound use of wood, Poiana Brasov, Romania, March 24-27 2003
European Forest Sector Outlook Studies (EFSOS)
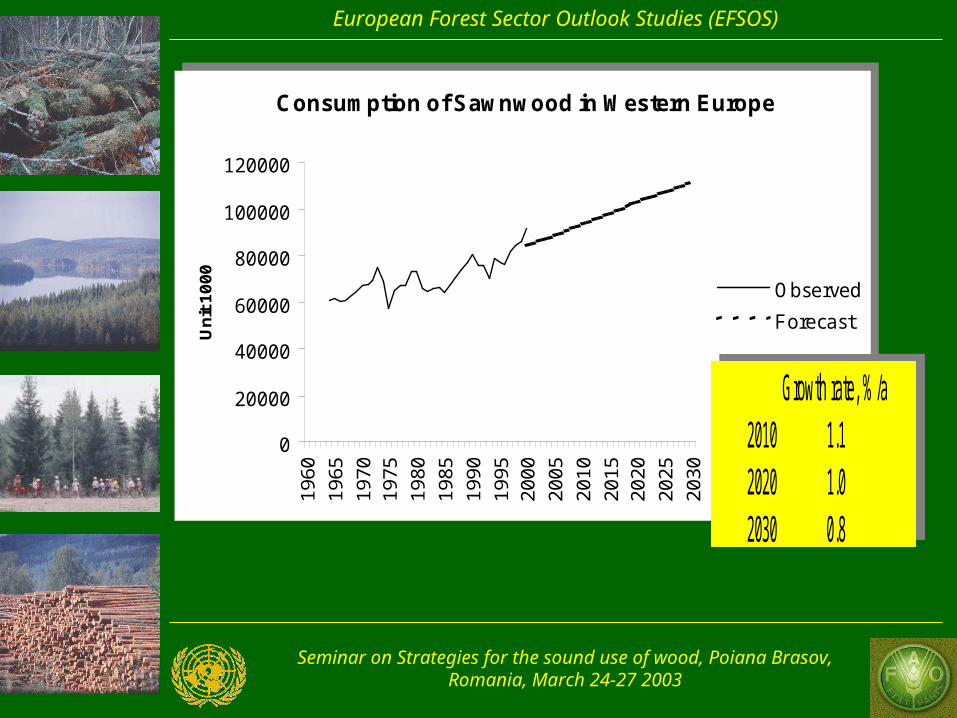
Consumption of Sawnwood in Western Europe
0
20000
40000
60000
80000
100000
120000
1960
1965
1970
1975
1980
1985
1990
1995
2000
2005
2010
2015
2020
2025
2030
Un
it 1
00
0
Observed
Forecast
Consumption of Sawnwood in Western Europe
0
20000
40000
60000
80000
100000
120000
1960
1965
1970
1975
1980
1985
1990
1995
2000
2005
2010
2015
2020
2025
2030
Un
it 1
00
0
Observed
Forecast
Growth rate, %/a2010 1.12020 1.02030 0.8
Growth rate, %/a2010 1.12020 1.02030 0.8
Seminar on Strategies for the sound use of wood, Poiana Brasov, Romania, March 24-27 2003
European Forest Sector Outlook Studies (EFSOS)
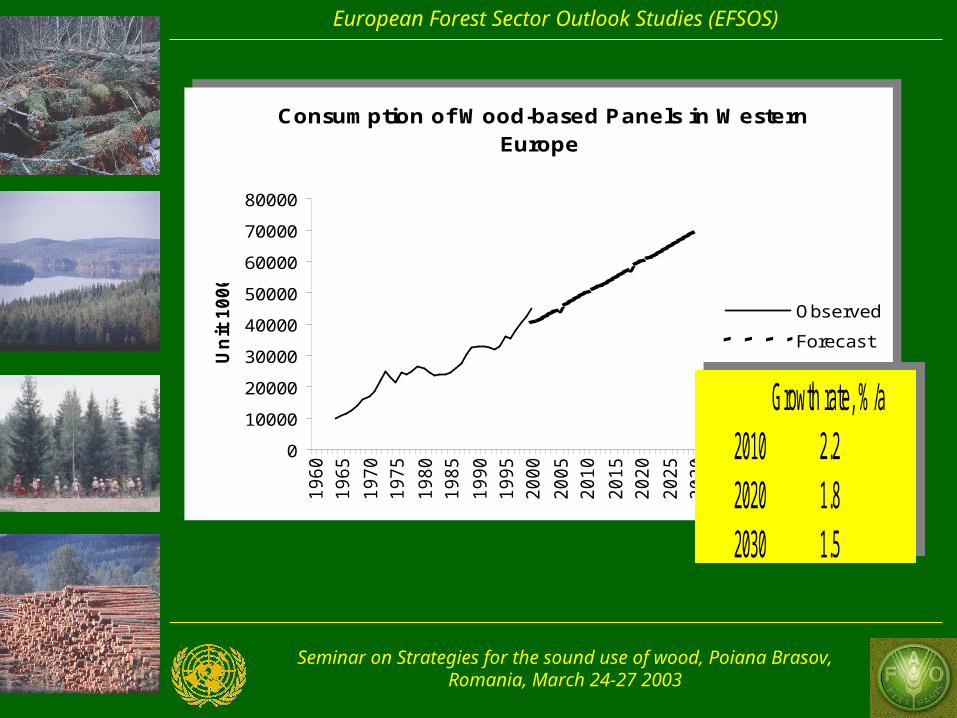
Consumption of Wood-based Panels in Western Europe
0
10000
20000
30000
40000
50000
60000
70000
80000
19
60
19
65
19
70
19
75
19
80
19
85
19
90
19
95
20
00
20
05
20
10
20
15
20
20
20
25
20
30
Un
it 1
00
0
Observed
Forecast
Consumption of Wood-based Panels in Western Europe
0
10000
20000
30000
40000
50000
60000
70000
80000
19
60
19
65
19
70
19
75
19
80
19
85
19
90
19
95
20
00
20
05
20
10
20
15
20
20
20
25
20
30
Un
it 1
00
0
Observed
Forecast
Growth rate, %/a2010 2.22020 1.82030 1.5
Growth rate, %/a2010 2.22020 1.82030 1.5
Seminar on Strategies for the sound use of wood, Poiana Brasov, Romania, March 24-27 2003
European Forest Sector Outlook Studies (EFSOS)
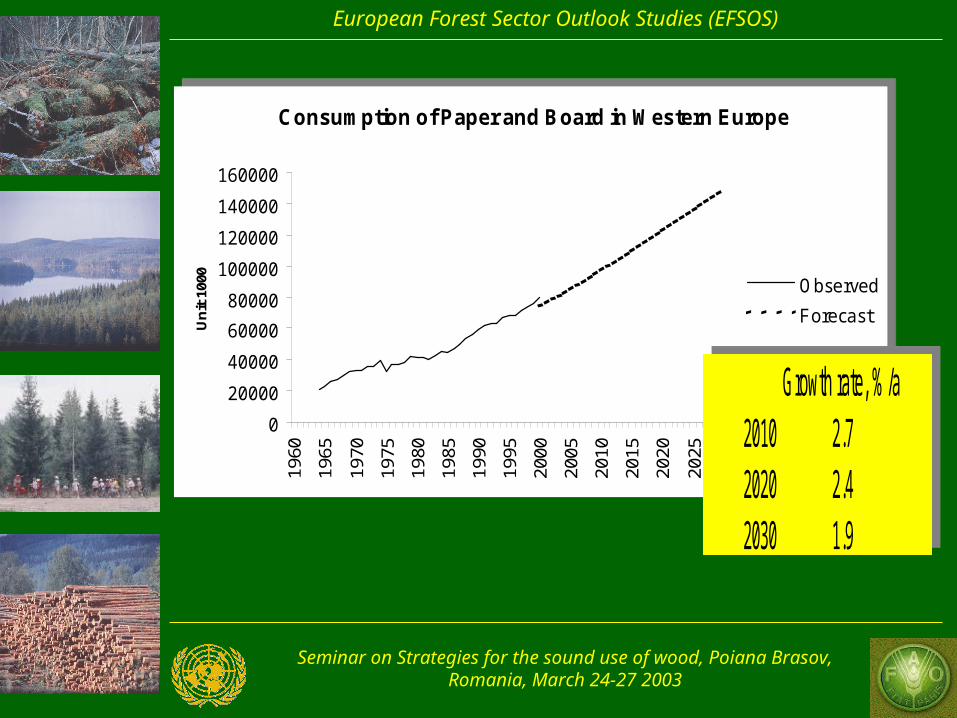
Consumption of Paper and Board in Western Europe
0
20000
40000
60000
80000
100000
120000
140000
160000
1960
1965
1970
1975
1980
1985
1990
1995
2000
2005
2010
2015
2020
2025
2030
Un
it 1
000
Observed
Forecast
Consumption of Paper and Board in Western Europe
0
20000
40000
60000
80000
100000
120000
140000
160000
1960
1965
1970
1975
1980
1985
1990
1995
2000
2005
2010
2015
2020
2025
2030
Un
it 1
000
Observed
Forecast
Growth rate, %/a2010 2.72020 2.42030 1.9
Growth rate, %/a2010 2.72020 2.42030 1.9
Seminar on Strategies for the sound use of wood, Poiana Brasov, Romania, March 24-27 2003
European Forest Sector Outlook Studies (EFSOS)
Three scenarios
- Baseline scenario (based on forecast input from NOBE)
- Alternative scenario I: Increasing conservation, environmental regulation and public awareness
- Alternative scenario II: European integration and market liberalisation
Seminar on Strategies for the sound use of wood, Poiana Brasov, Romania, March 24-27 2003
European Forest Sector Outlook Studies (EFSOS)
The baseline scenario
Projections taking into consideration:- General economic development
- Demographic deveolpment- Construction
- Paper recovery
Seminar on Strategies for the sound use of wood, Poiana Brasov, Romania, March 24-27 2003
European Forest Sector Outlook Studies (EFSOS)
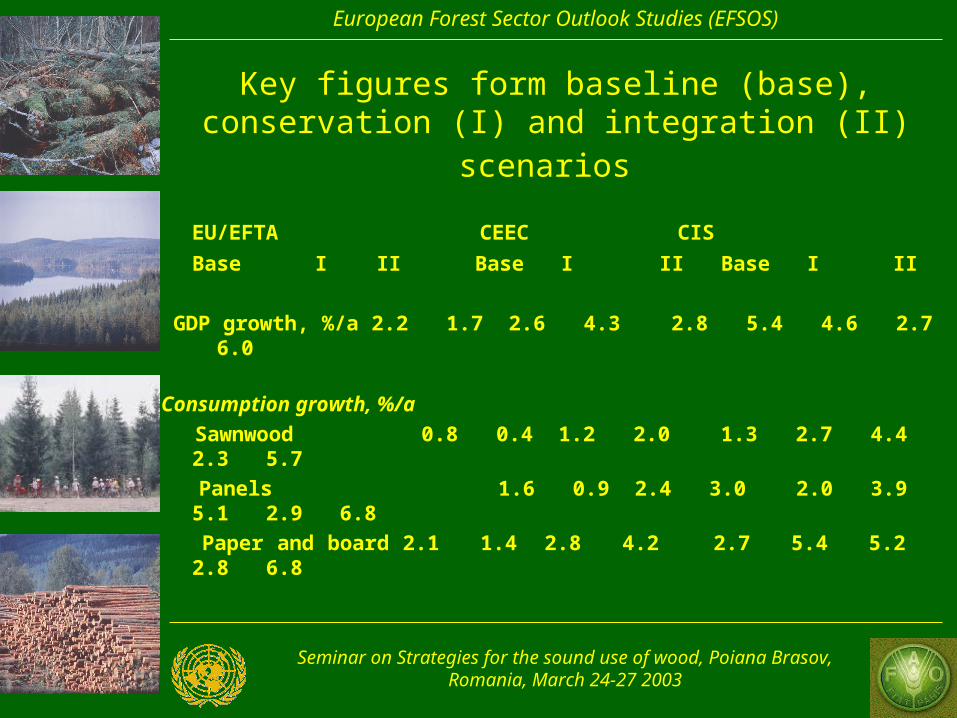
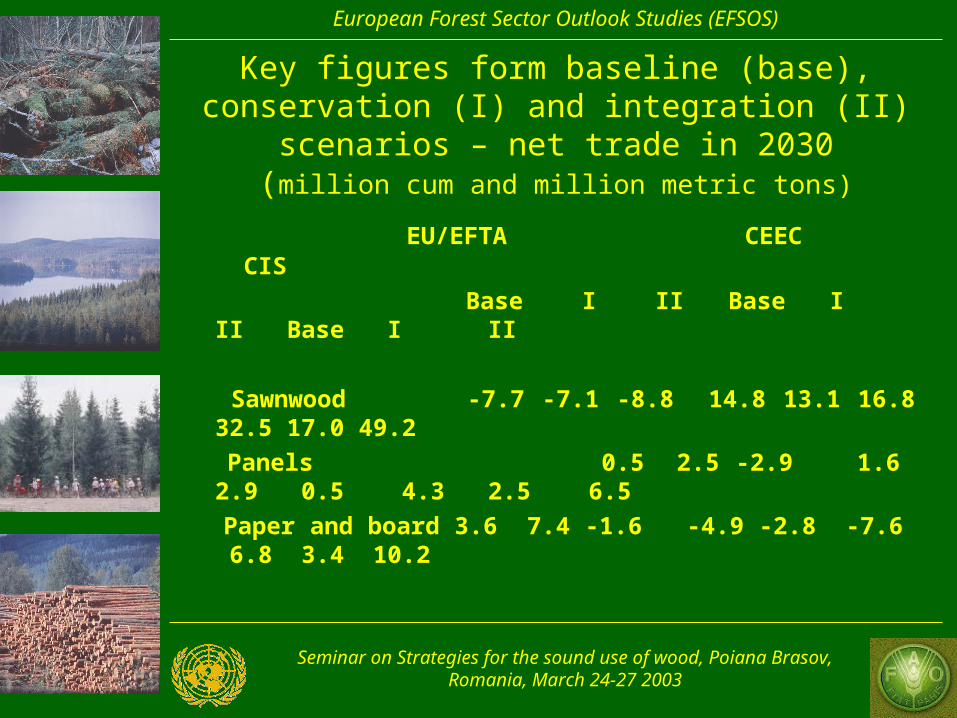
Key figures form baseline (base), conservation (I) and integration (II) scenarios
EU/EFTA CEEC CIS
Base I II Base I II Base I II GDP growth, %/a 2.2 1.7 2.6 4.3 2.8 5.4 4.6 2.7 6.0