Page 1
Methods for the resolution of completely co-eluting components in
mass spectrometry data
Katharine M. Mullen
Biophysics Group, Department of Physics and Astronomy
Vrije Universiteit Amsterdam, The Netherlands
[email protected]
13 August, 2008
Page 2
[ Talk overview ]
Introduction
Instrumentation
Data
Component resolution problem
Algorithms for component resolution
Peak-based
MCR-ALS
Global analysis
Resolution of completely co-eluting components
Initial example
Robustness of result
Conclusions
Page 3
[ Mass spectrometer ]
device to introduce sample
detector
computer
source to produce ions from sample
analyzer(s) to separate ions by m/z
35 65 95 125 155 185m/z
Page 4
[ Liquid and gas chromatography ]
Page 5
[ GC-MS, LC-MS ]
can use a liquid or gas chromatography column to send sample to the mass spectrometer
resulting measurement is mass-to-charge ratio resolved with respect to time:
5720
5740
5760
57805800
100
200
300
400
0e+0
0
2e+0
5
4e+0
5
6e+0
5
8e+0
5
timem/z
Page 6
[ Component resolution problem ]
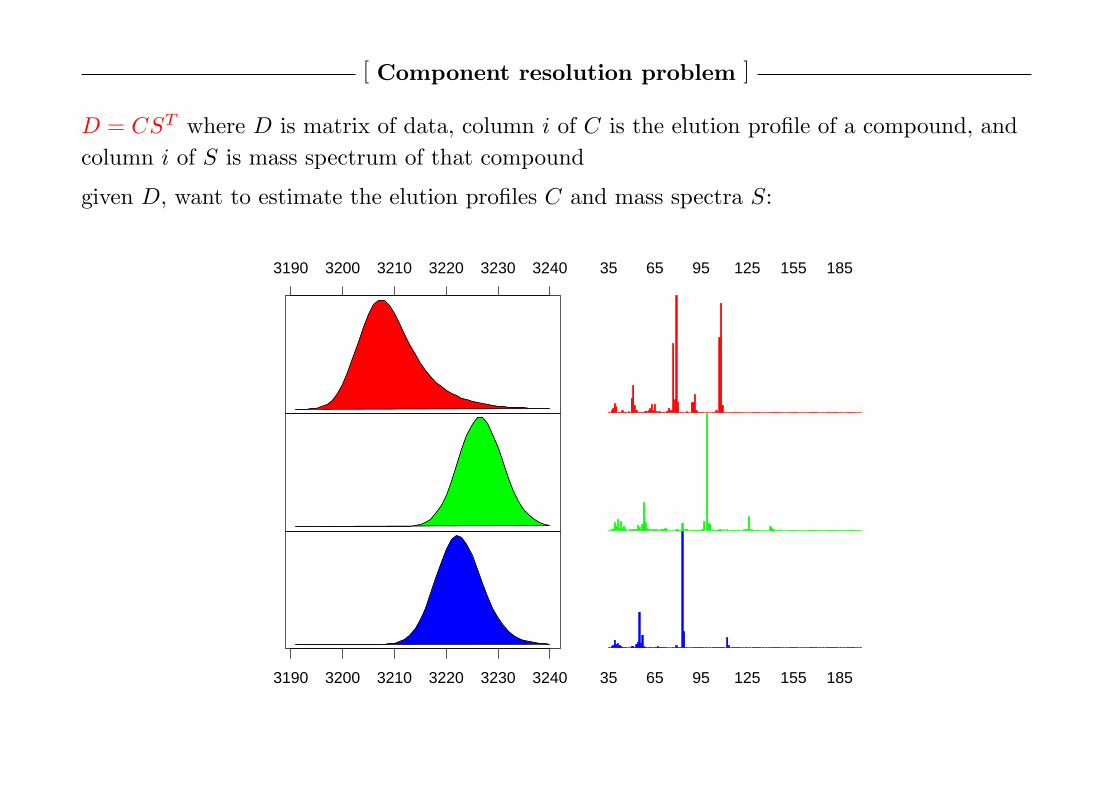
D = CST where D is matrix of data, column i of C is the elution profile of a compound, and
column i of S is mass spectrum of that compound
given D, want to estimate the elution profiles C and mass spectra S:
3190 3200 3210 3220 3230 3240 35 65 95 125 155 185
3190 3200 3210 3220 3230 3240 35 65 95 125 155 185
Page 7
[ Component resolution problem ]
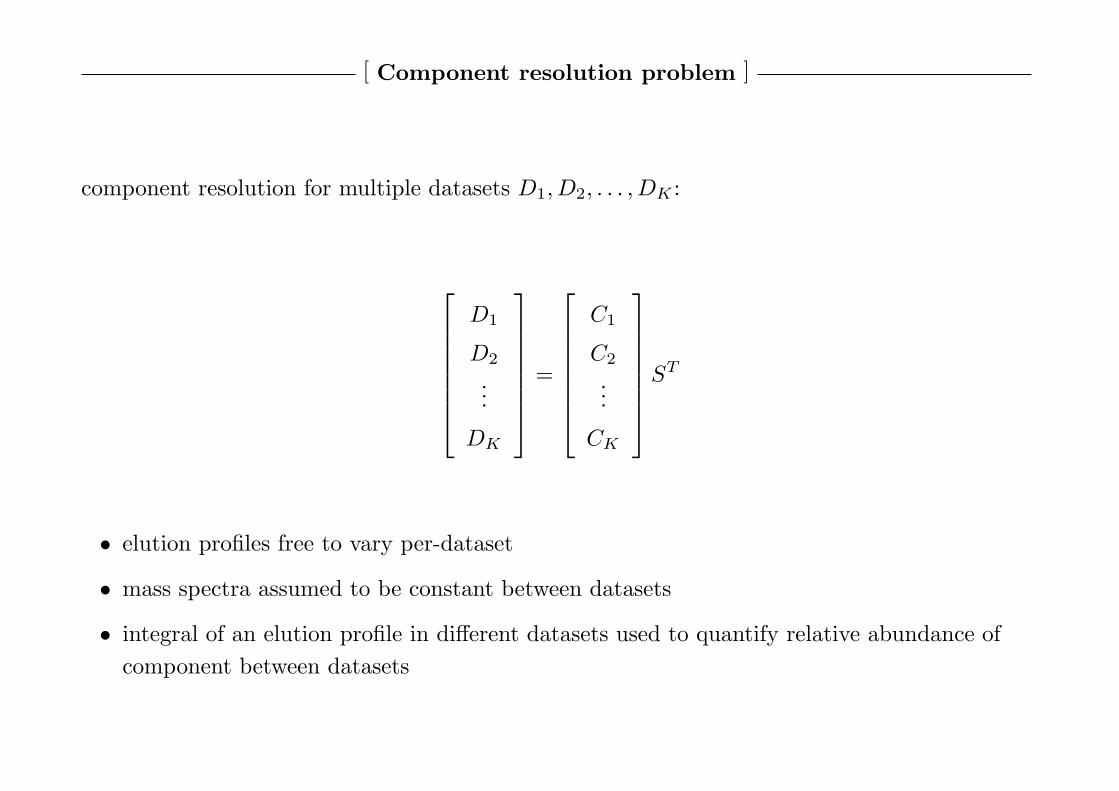
component resolution for multiple datasets D1, D2, . . . , DK :
D1
D2
...
DK
=
C1
C2
...
CK
ST
• elution profiles free to vary per-dataset
• mass spectra assumed to be constant between datasets
• integral of an elution profile in different datasets used to quantify relative abundance of
component between datasets
Page 8
[ Component resolution problem ]
Given estimates for mass spectra/retention times, match this information against those of
compounds in library (e.g. NIST 05 database) and identify chemical constituents of the sample
quantify similarity of estimated spectrum to that of spectrum in database via a matching factor
function, e.g., the normalized dot product matching factor:
MF (u, s) =u · s
‖u‖ ‖s‖=
u1s1 + u2s2 + . . .√
u21 + u2
2 + . . .√
s21 + s2
2 + . . .
Page 9
[ Peak-based ]
peak-based methods for component resolution:
• examine the chromatogram at each m/z value for peaks
• examine the total ion chromatogram (TIC) for peaks
• use heuristics to decide which peaks represent components / infer the shape of components
• thereby determine C, from which S can be determined by linear regression from D = CST
Automated mass spectral deconvolution and identification system (AMDIS) of Stein and
collaborators is an example:
Page 10
[ MCR-ALS ]
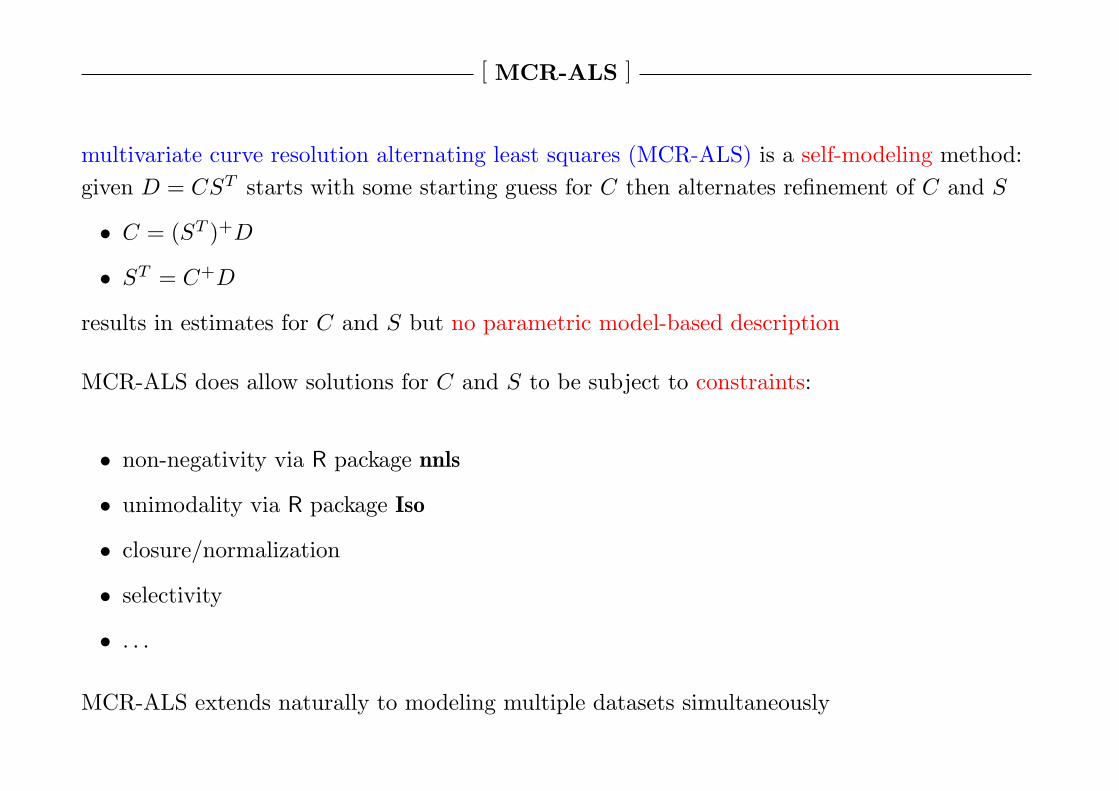
multivariate curve resolution alternating least squares (MCR-ALS) is a self-modeling method:
given D = CST starts with some starting guess for C then alternates refinement of C and S
• C = (ST )+D
• ST = C+D
results in estimates for C and S but no parametric model-based description
MCR-ALS does allow solutions for C and S to be subject to constraints:
• non-negativity via R package nnls
• unimodality via R package Iso
• closure/normalization
• selectivity
• . . .
MCR-ALS extends naturally to modeling multiple datasets simultaneously
Page 11
[ MCR-ALS ]
Implementation of MCR-ALS:
• available as the new R package ALS
• all important constraints included
• on CRAN
Motivation:
• facilitate a systematic comparison of the component resolution abilities of global analysis
and MCR-ALS for data in which underlying elution profiles are completely overlapping
Page 12
[ Global analysis ]
Global analysis:
• elution profiles are described with a parametric model C(θ)
• starting values for θ are improved and estimates for mass spectra S are obtained by
solution of a separable nonlinear least squares problem
• mass spectra and amplitude parameters of elution profiles subject to non-negativity
constraints
• like MCR-ALS, is well-suited to modeling multiple datasets
parametric model for elution profile: exponentially modified Gaussian (EMG)
amplitude location
decay rate
width
Page 13
[ Global analysis ]
idea of global analysis:
• formulate parametric model for elution profiles C(θ)
• set starting values θ0
• θ0 allows solving for mass spectra as ST = C+D
• this allows determination of residuals as D − C(θ0)ST = D − C(θ0)C
+D
• residuals are iteratively minimized with respect to θ
• this is instance of separable nonlinear least squares
model for D is completely determined via relatively small number of parameters
Page 14
[ Global analysis ]
TIMP is a package for fitting separable nonlinear models that has been applied to
measurements arising in
• time (and/or temperature, polarization, pH)-resolved spectroscopy
• fluorescence lifetime imaging microscopy (FLIM)
New options for fitting mass spectroscopy data have been recently added to TIMP:
address outliers, baseline correction/estimation, saturation
Page 15
[ Comparison of methods ]
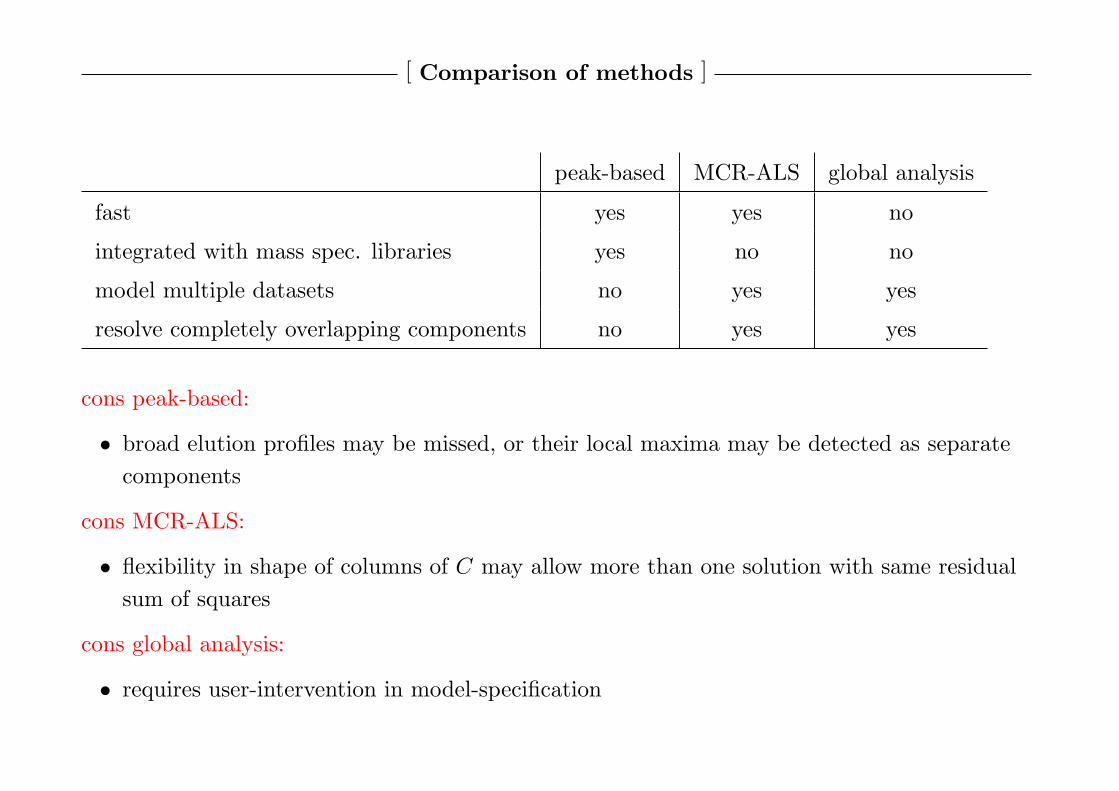
peak-based MCR-ALS global analysis
fast yes yes no
integrated with mass spec. libraries yes no no
model multiple datasets no yes yes
resolve completely overlapping components no yes yes
cons peak-based:
• broad elution profiles may be missed, or their local maxima may be detected as separate
components
cons MCR-ALS:
• flexibility in shape of columns of C may allow more than one solution with same residual
sum of squares
cons global analysis:
• requires user-intervention in model-specification
Page 16
[ Resolution of completely co-eluting components ]
plots in color depict contributing elution profiles
peak matching / MCR-ALS / global analysis can be used for component resolution when
elution profiles are not completely overlapping (top row)
either MCR-ALS or global analysis make possible resolution of completely overlapping
components (bottom row)
Page 17
[ Resolution of completely co-eluting components ]
simulate data with Poisson noise, using elution profiles and mass spectra shown below
50 80 140 200 260 320 380 440
50 80 140 200 260 320 380 440
EMG parameters for elution profiles:
component 1 component 2
location 5754 5755
FWHM 7 7
rate 1 1
amplitude, dataset 1 1 2
amplitude, dataset 2 1.5 2
Page 18
[ Resolution of completely co-eluting components ]
1 31 91 151 211 271 331 391 1 31 91 151 211 271 331 391
1 31 91 151 211 271 331 391 1 31 91 151 211 271 331 391
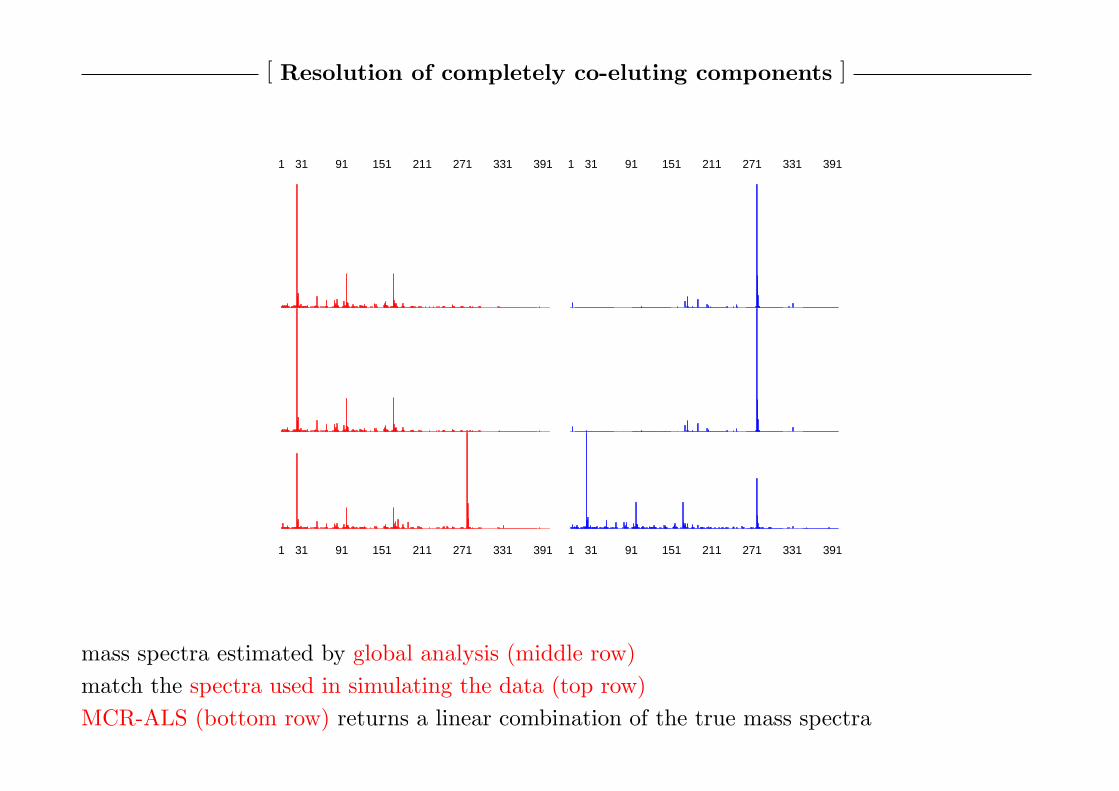
mass spectra estimated by global analysis (middle row)
match the spectra used in simulating the data (top row)
MCR-ALS (bottom row) returns a linear combination of the true mass spectra
Page 19
[ Resolution of completely co-eluting components ]
can examine many other problems with varying overlap of the elution profiles, from starting
values for C that are slightly shifted versions of the values used in simulating the data:
Page 20
[ Resolution of completely co-eluting components ]
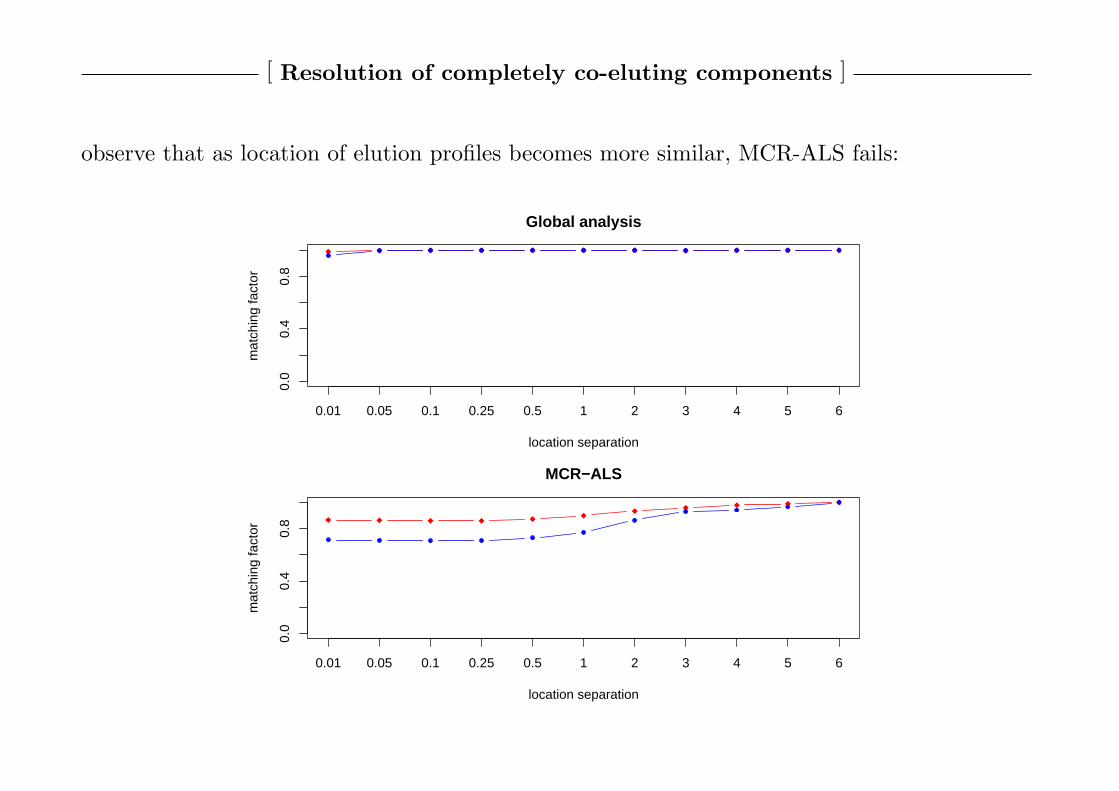
observe that as location of elution profiles becomes more similar, MCR-ALS fails:
0.0
0.4
0.8
Global analysis
location separation
mat
chin
g fa
ctor
0.01 0.05 0.1 0.25 0.5 1 2 3 4 5 6
0.0
0.4
0.8
MCR−ALS
location separation
mat
chin
g fa
ctor
0.01 0.05 0.1 0.25 0.5 1 2 3 4 5 6
Page 21
[ Resolution of completely co-eluting components ]
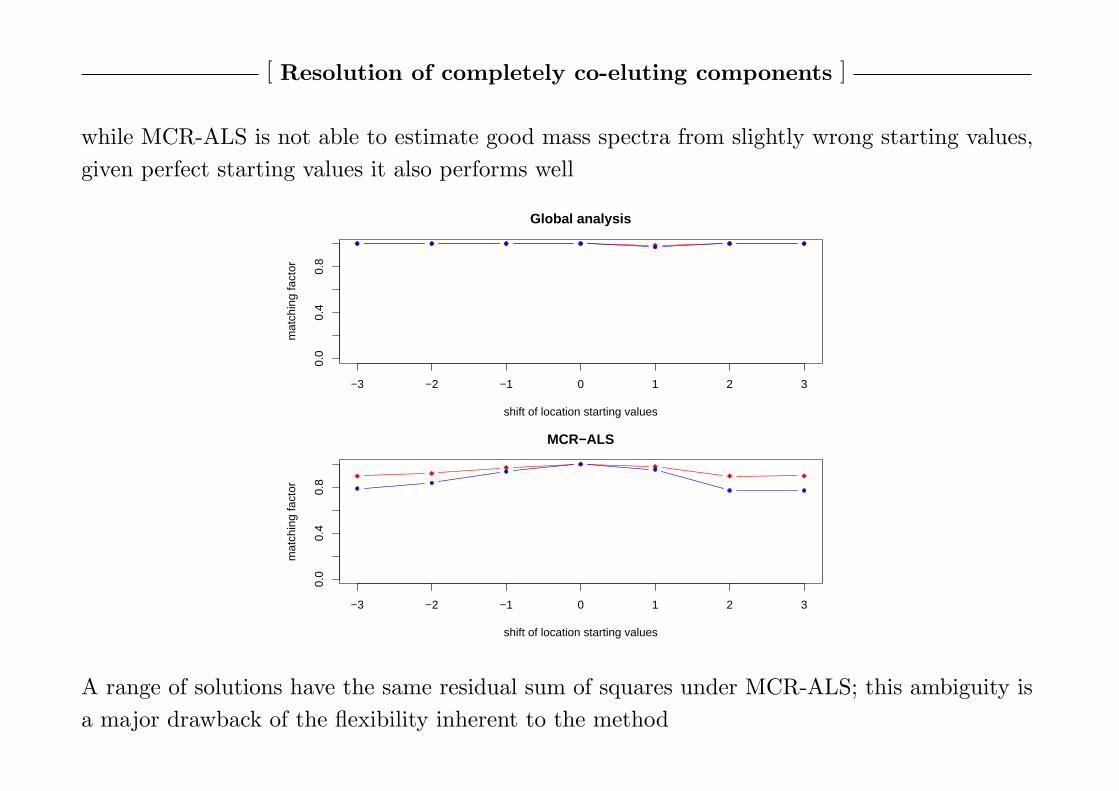
while MCR-ALS is not able to estimate good mass spectra from slightly wrong starting values,
given perfect starting values it also performs well
0.0
0.4
0.8
Global analysis
shift of location starting values
mat
chin
g fa
ctor
−3 −2 −1 0 1 2 3
0.0
0.4
0.8
MCR−ALS
shift of location starting values
mat
chin
g fa
ctor
−3 −2 −1 0 1 2 3
A range of solutions have the same residual sum of squares under MCR-ALS; this ambiguity is
a major drawback of the flexibility inherent to the method
Page 22
[ Conclusions ]
Conclusions:
• component resolution problems in GC/MS and LC/MS data possible to address via
– parametric global analysis: R package TIMP
– non-parametric MCR-ALS: R package ALS
• both methods can deal with completely co-eluting components
• in certain situations global analysis returns better estimates of the mass spectra than
MCR-ALS
Future work:
• a significant disadvantage of global analysis is run-time and user-intervention needed for
model specification; for high-throughput deployment, more automation is necessary
• develop criteria to identify regions of data that would benefit from global analysis
Page 23
[ Acknowledgments: ]
Ivo van Stokkum (Vrije Universiteit Amsterdam, Biophysics)
Linda Switzar (Vrije Universiteit Amsterdam, Analytical chemistry)
Filipe Lopes (Vrije Universiteit Amsterdam, Analytical chemistry)