41
Kaweah Basin Water Quality Association Sediment Discharge and Erosion Assessment Report Tulare County, California • February 2015 Prepared for: Prepared by:
| Date post: | 06-Mar-2018 |
| Category: |
Documents |
| Upload: | trinhthuan |
| View: | 218 times |
| Download: | 3 times |

Kaweah Basin Water Quality Association
Sediment Discharge and Erosion Assessment ReportTulare County, California • February 2015
Prepared for: Prepared by:

Kaweah Basin Water Quality Association
Sediment Discharge and Erosion Assessment Report Tulare County, California February 7, 2015
Prepared for: Kaweah Basin Water Quality Association
Post Office Box 2840 • Visalia, California 93279
Prepared by: Provost & Pritchard Consulting Group
Visalia, California

CERTIFICATIONS
This Sediment Discharge and Erosion Assessment Report is signed by the following certified professionals:
Provost & Pritchard Consulting Group
PROJECT TEAM
This Sediment Discharge and Erosion Assessment Report was prepared by the following project team members:
Provost & Pritchard Consulting Group
• Hilary Armstrong Reinhard, PE
• Tom Glover, PE
• Jason Thomas
COPYRIGHT 2015 by PROVOST & PRITCHARD CONSULTING GROUP ALL RIGHTS RESERVED
Provost & Pritchard Consulting Group expressly reserves its common law copyright and other applicable property rights to this document. This document is not to be reproduced, changed, or copied in any form or manner whatsoever, nor are they to be assigned to a third party without first obtaining the written permission and consent of Provost & Pritchard Consulting Group In the event of unauthorized reuse of the information contained herein by a third party, the third party shall hold the firm of Provost & Pritchard Consulting Group harmless, and shall bear the cost of Provost & Pritchard Consulting Group's legal fees associated with defending and enforcing these rights.

Table of Contents List of Figures .................................................................................................................................... iii
List of Tables ..................................................................................................................................... iii
Abbreviations ................................................................................................................................... iv
1 Introduction ...........................................................................................................................1-1
1.1 Background ............................................................................................................................... 1-1
1.1.1 Kaweah Basin Water Quality Association ............................................................................ 1-1
1.1.2 Waste Discharge Requirements ........................................................................................... 1-2
1.2 Objectives of the Sediment Discharge and Erosion Assessment Report.................................. 1-2
1.3 Kaweah Sub-basin..................................................................................................................... 1-2
1.4 Kaweah Watershed .................................................................................................................. 1-3
1.4.1 General Characteristics ........................................................................................................ 1-3
1.4.2 Climate ................................................................................................................................. 1-3
1.4.3 KBWQA Soils ......................................................................................................................... 1-4
1.4.4 KBWQA Agriculture .............................................................................................................. 1-4
1.4.5 Surface slope ........................................................................................................................ 1-4
2 Soil Erosion Factors .................................................................................................................2-1
2.1 Precipitation ............................................................................................................................. 2-1
2.2 Soil ............................................................................................................................................ 2-2
2.3 Topography ............................................................................................................................... 2-2
2.4 Land Use ................................................................................................................................... 2-2
3 Methodology ..........................................................................................................................3-1
3.1 Universal Soil Loss Equation (USLE) .......................................................................................... 3-1
3.2 Revised Universal Soil Loss Equation (RUSLE) .......................................................................... 3-2
3.3 Proximity to Waterways ........................................................................................................... 3-2
3.4 Management Factors ................................................................................................................ 3-2
3.5 Data Sources ............................................................................................................................. 3-2
4 Results ....................................................................................................................................4-1
4.1 Erosivity (R) Factor .................................................................................................................... 4-1
4.2 Soil Erodibility (K) Factor .......................................................................................................... 4-1
4.3 Slope Length and Steepness (LS) Factor ................................................................................... 4-1
4.4 Combined Sediment Risk Factor (LS*R*K) ................................................................................ 4-2
Provost & Pritchard Consulting Group • February 2015 i

4.5 Waterways ................................................................................................................................ 4-2
4.6 Potential Sediment Dischargers ............................................................................................... 4-3
4.7 Potential Sediment Discharger Requirements ......................................................................... 4-3
5 Bibliography/References .........................................................................................................5-1
Provost & Pritchard Consulting Group • February 2015 ii

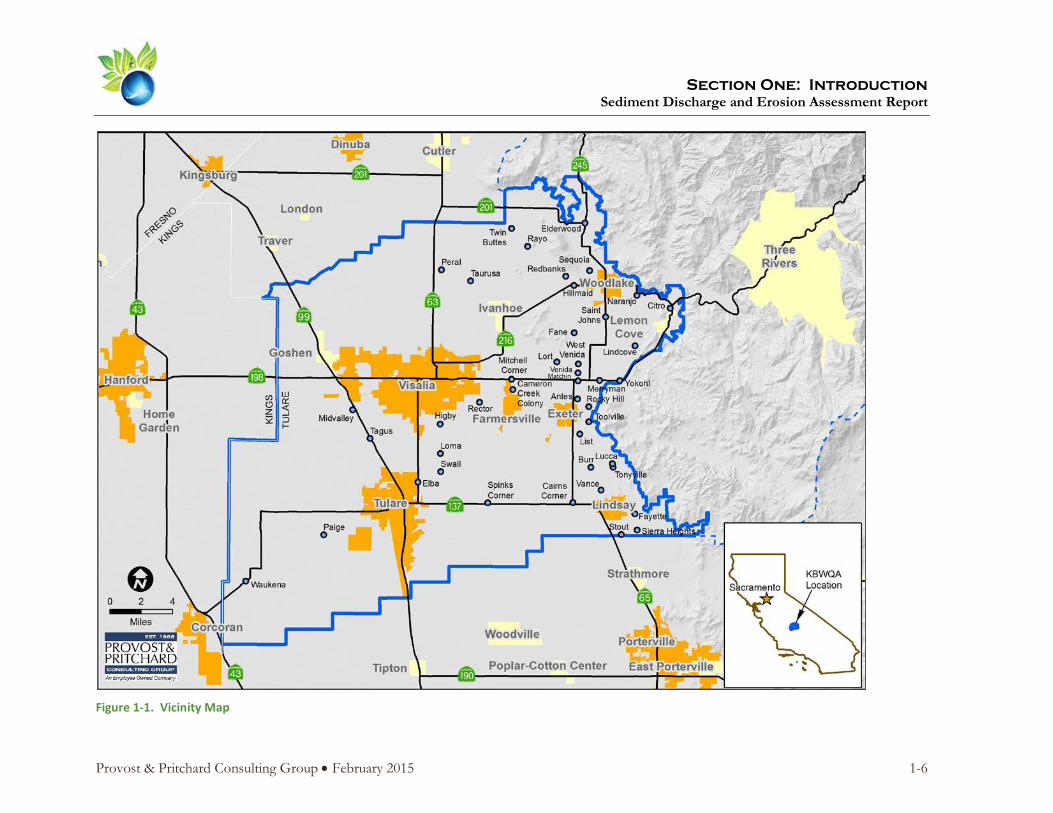
List of Figures Figure 1-1. Vicinity Map ............................................................................................................................ 1-6
Figure 1-2. KBWQA Boundary Map ........................................................................................................... 1-7
Figure 1-3. Groundwater Basins................................................................................................................ 1-8
Figure 1-4. Major Hydrology ..................................................................................................................... 1-9
Figure 1-5. Soil Texture ........................................................................................................................... 1-11
Figure 1-6. Soil Type ................................................................................................................................ 1-12
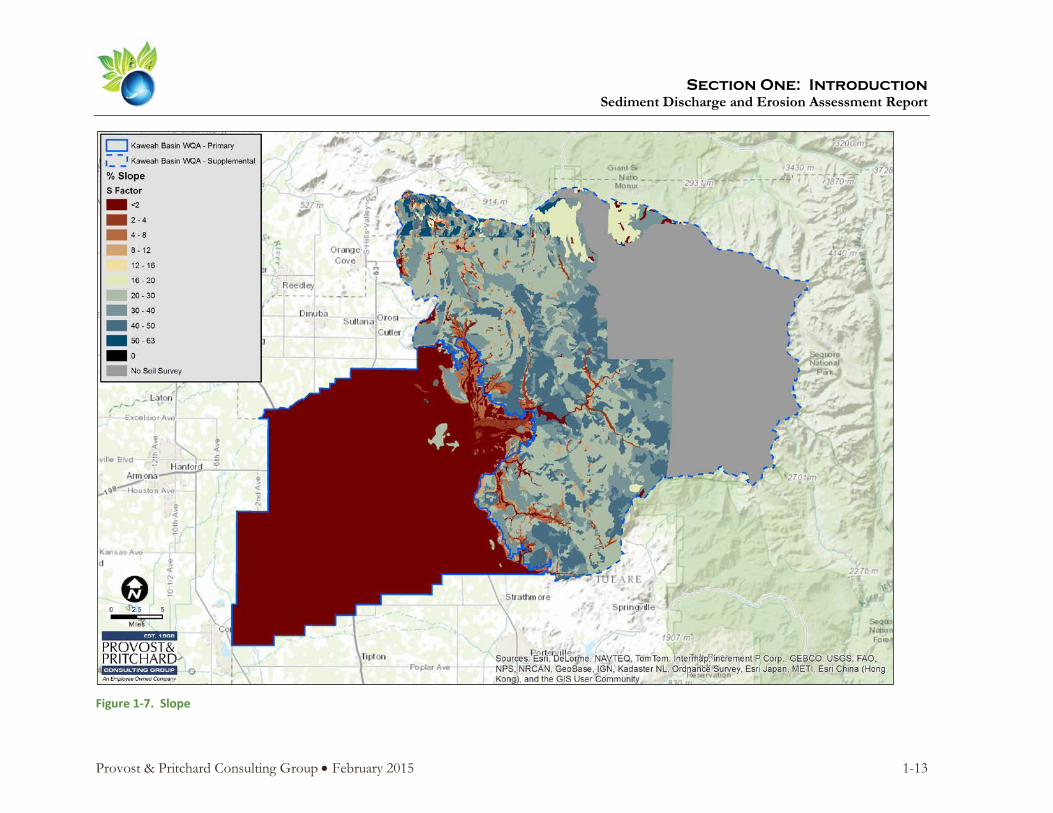
Figure 1-7. Slope ..................................................................................................................................... 1-13
Figure 4-1. KBWQA Erosivity (R) Factor .................................................................................................... 4-5
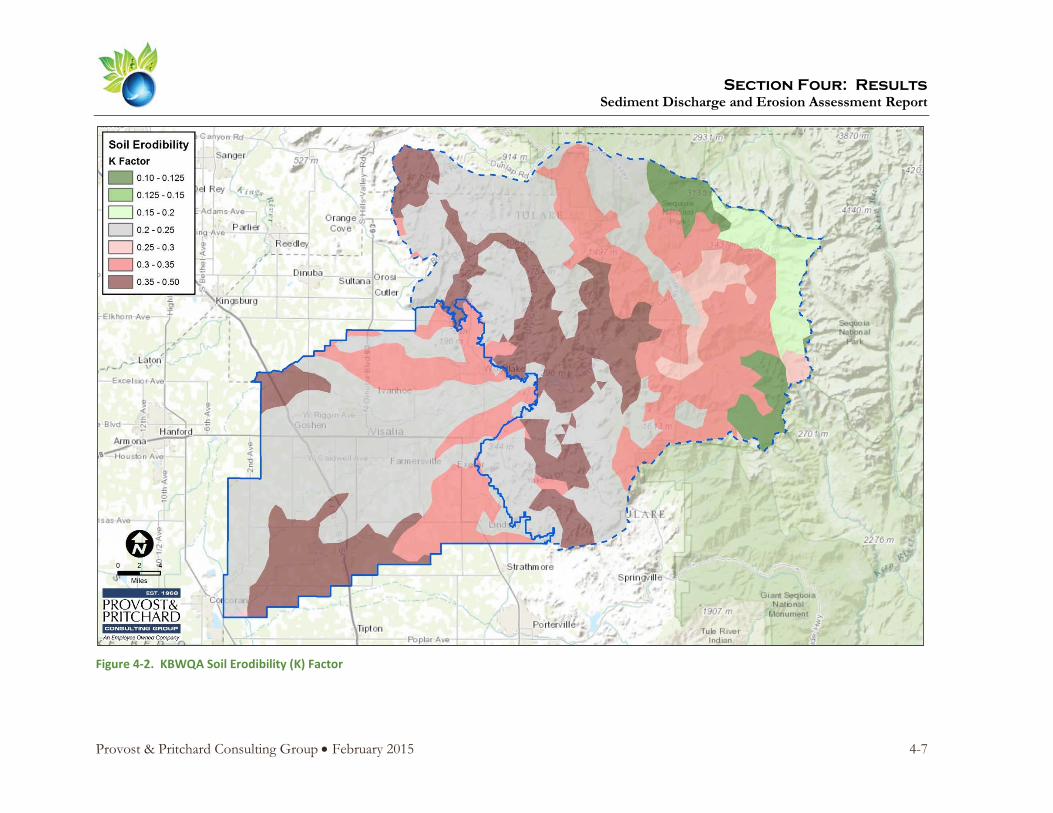
Figure 4-2. KBWQA Soil Erodibility (K) Factor ........................................................................................... 4-7
Figure 4-3. KBWQA Slope Length and Steepness (LS) Factor.................................................................... 4-8
Figure 4-4. KBWQA Combined Sediment Risk Factor (LS*R*K) ................................................................ 4-9
Figure 4-5. KBWQA Streams and Artificial Water Ways ......................................................................... 4-10
Figure 4-6. KBWQA Identified Potential Sediment Discharge and Erosion Parcels ................................ 4-11
List of Tables Table 1-1. Primary Area Temperature and Precipitation Summary ........................................................ 1-10
Table 4-1. Typical Soil Erodibility (K) Factors for Various Soil Types ......................................................... 4-6
Table 4-2. KBWQA Potential Sediment Discharge and Erosion Parcel Summary ................................... 4-12
Provost & Pritchard Consulting Group • February 2015 iii

Abbreviations A factor .................................................................................................. Long-term Average Annual Soil Loss
Central Valley ....................................................................................................... Central Valley of California
C factor ............................................................................................................ Cropping Management factor
Coalition ......................................................................................... Kaweah Basin Water Quality Association
CPSEC ...................................................................... Certified Professional in Erosion and Sediment Control
CPSWQ ................................................................................... Certified Professional in Storm Water Quality
CVRWQCB ................................................................... Central Valley Regional Water Quality Control Board
General Order .................................................................................................. General Order R5-2013-0120
GIS .............................................................................................................. Geographic Information Systems
ILRP......................................................................................................... Irrigated Lands Regulatory Program
KBWQA ........................................................................................... Kaweah Basin Water Quality Association
KCWD ................................................................................................................. Kings County Water District
KDWCD ........................................................................................ Kaweah Delta Water Conservation District
K factor .....................................................................................................................................Soil Properties
KSJRA ............................................................................................. Kaweah and St. John’s Rivers Association
LS factor .......................................................................................................................... Topographic effects
MRP ........................................................................................................ Monitoring and Reporting Program
NHD ................................................................................................................ National Hydrography Dataset
NICET .......................................................... National Institute for Certification in Engineering Technologies
NRCS .................................................................................... USDA National Resources Conservation Service
NOA ............................................................................................................................. Notice of Applicability
P factor .............................................................................................................. Conservation Practice factor
Regional Board ............................................................ Central Valley Regional Water Quality Control Board
R factor ................................................................................................................................. Rainfall Erosivity
RUSLE .................................................................................................... Revised Universal Soil Loss Equation
SCID ................................................................................................................. Stone Corral Irrigation District
SDEAR .......................................................................... Sediment Discharge and Erosion Assessment Report
SECP ........................................................................................................ Sediment and Erosion Control Plan
SSJVWQC .................................................................... Southern San Joaquin Valley Water Quality Coalition
SWRCB ................................................................................ California State Water Resources Control Board
Provost & Pritchard Consulting Group • February 2015 iv

Third-party ........................................................................................................................................ Coalition
TID ............................................................................................................................ Tulare Irrigation District
Tons/ac-yr ......................................................................................................................... Tons per acre-year
UCCE ...................................................................................... University of California Cooperative Extension
USLE ................................................................................................................... Universal Soil Loss Equation
USDA ............................................................................................. United States Department of Agriculture
USDA-SCS ............................................................ U.S. Department of Agriculture Soil Conservation Service
WDRs .............................................................................................................. Waste Discharge Requirement
Provost & Pritchard Consulting Group • February 2015 v

Section One: Introduction
Sediment Discharge and Erosion Assessment Report
1 Introduction This Sediment Discharge and Erosion Assessment Report (SDEAR) was prepared on behalf of the Kaweah Basin Water Quality Association (KBWQA or Coalition), in compliance with “Waste Discharge Requirements (WDRs) General Order (General Order or R5-2013-0120) for Growers within the Tulare Lake Basin Area that are Members of a Third-Party Group” adopted by the Central Valley Regional Water Quality Control Board (CVRWQCB or Regional Board) on September 19, 2013. The WDRs apply to irrigated lands that are located in the Tulare Lake Basin. The KBWQA is one of six Coalitions within the Tulare Lake General Order and is located in the Northern portion of the County of Tulare (Figure 1-1, Figure 1-2).
1.1 Background
The Tulare Lake Basin General Order requires any irrigated land having the potential to discharge wastes to surface water or groundwater to comply with the requirements set forth by the CVRWQCB. The CVRWQCB defines irrigated land as “land irrigated to produce crops or pasture used for commercial purposes including lands that are planted to commercial crops that are not yet marketable (e.g. vineyards and tree crops). Irrigated lands also include nurseries, and privately and publicly managed wetlands. Compliance with the General Order includes either membership in a Coalition (third-party) or by obtaining coverage through the CVRWQCB under an Individual Order (Order R5-2013-0100).
The third-party option provides the ability for growers to work together as a group and share resources to minimize redundant efforts and to reduce overall costs. Some investigations and evaluations could require extensive expertise and costs that could be difficult for the average grower to complete on their own.
1.1.1 Kaweah Basin Water Quality Association
The Kaweah and St. John’s Rivers Association (KSJRA) was formed in 2002 as a sub-watershed of the Southern San Joaquin Valley Water Quality Coalition (SSJVWQC) to address surface water issues within the Kaweah Basin. The SSJVWQC addresses water quality issues common to the sub-watersheds in the Tulare Lake Basin Area. KBWQA was formed in October 2013 as a California non-profit mutual benefit corporation as the successor organization to the KSJRA, with the purpose of implementing the General Order Irrigated Lands Regulatory Program (ILRP) for its grower members. The KBWQA was approved by the Water Board as the third-party group to represent growers within its service area by the Notice of Applicability (NOA) received on February 7, 2014.
The KBWQA covers the Kaweah River watershed from the Sierra Nevada Mountains to the valley floor in northern Tulare County within the Tulare Lake Basin. The Tulare Lake Basin is a closed-basin, separated from the Sacramento-San Joaquin Bay-Delta system. The KBWQA is comprised of the valley floor area as its Primary Area with a majority of the irrigated agricultural activity, while the foothill and mountain regions considered as the Supplemental Area due to significantly reduced agricultural activity.
The northern boundary roughly follows the Kaweah Delta Water Conservation District (KDWCD) northern border, but has been extended further north to include Stone Corral Irrigation District (SCID) and portions of Cottonwood Creek. The western boundary generally follows the Kings County Water
Provost & Pritchard Consulting Group • February 2015 1-1

Section One: Introduction
Sediment Discharge and Erosion Assessment Report
District (KCWD) and Tulare Irrigation District (TID) borders. The southern boundary generally follows the KDWCD southern border, but approximately follows the Avenue 212 alignment as it heads towards the foothills. The Kaweah River watershed area is approximately 630 square miles above the foothill line in Tulare County. The Terminus Reservoir on Lake Kaweah, located about 20 miles east of Visalia, collects the majority of the tributary drainage area of about 560 square miles and produces about 95 percent of the total runoff of the watershed. In total, the KBWQA’s coverage area encompasses approximately 950,000 acres.
1.1.2 Waste Discharge Requirements
The NOA approval date (February 7, 2014) began the timeline for several requirements outlined in the WDRs, including Section IV.A in Attachment B, Monitoring and Reporting Program (MRP), to the General Order. In accordance with the MRP, the due date for submittal of the SDEAR is one year after the issuance of the NOA to the KBWQA, February 7, 2015.
1.2 Objectives of the Sediment Discharge and Erosion Assessment Report
The primary objective of this SDEAR is to determine which irrigated agricultural areas within the KBWQA are subject to erosion and could possibly discharge sediment that may degrade surface waters. The SDEAR is also to determine which member operations are within such areas, and need to develop a Sediment and Erosion Control Plan. The SDEAR must be developed to achieve these objectives and provide a description of the sediment and erosion areas as a series of ArcGIS shapefiles with a discussion of methodologies utilized to develop the SDEAR.
1.3 Kaweah Sub-basin
The Kaweah sub-basin is located on the east side of the south-central portion of the San Joaquin Valley within the Tulare Lake Basin (Figure 1-3). The San Joaquin Valley, which is the southerly part of the Central Valley of California (Central Valley), extends about 250 miles from the Sacramento-San Joaquin Delta area at the north end to the Tehachapi Mountains at the south end. In the vicinity of the KBWQA, the Central Valley is approximately 65 miles wide. The Central Valley is bordered on the east by the Sierra Nevada Mountains, which range in elevation from about 1,000 feet to more than 14,000 feet above sea level. The Coast Range, which borders the Central Valley on the west, rises to about 6,000 feet above sea level. The southern end of the San Joaquin Valley, also known as the Tulare Lake Basin, is a closed feature separated from the Sacramento-San Joaquin Bay-Delta system and without external surface drainage.
The Tulare Lake Basin is bounded by the crest of the Sierra Nevada Mountain Range to the east, the San Joaquin River to the north, the Westlands Coalition and the crest of the Southern Coast Ranges to the west, and the crest of the San Emigdio and Tehachapi Mountains to the south. Tributary streams drain to depressions, the largest of which is the Tulare Lake bed located to the west of the KBWQA boundary. The Kings, Kaweah, and Tule Rivers and, on occasion, the Kern River, discharge into the Tulare Lake Basin including the beds of the former Tulare, Buena Vista, and Kern Lakes at times when flows exceed the capacity of foothill reservoirs and of the irrigation diversion systems.
Provost & Pritchard Consulting Group • February 2015 1-2
Section One: Introduction
Sediment Discharge and Erosion Assessment Report
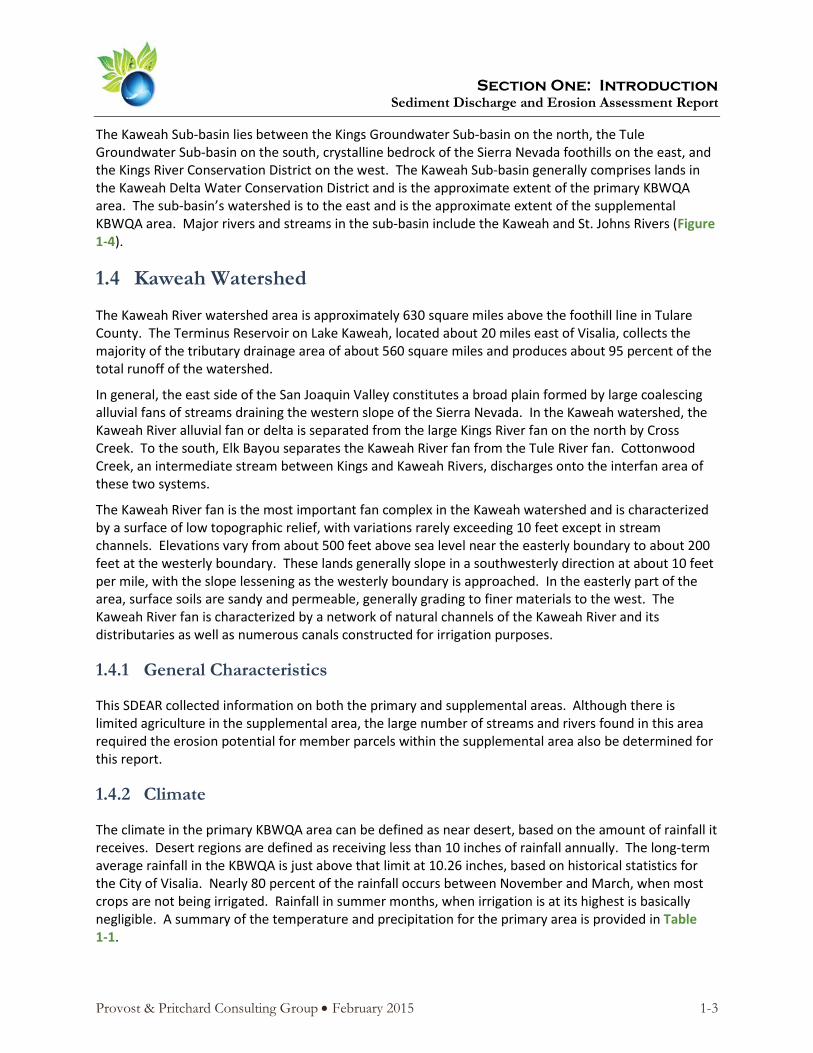
The Kaweah Sub-basin lies between the Kings Groundwater Sub-basin on the north, the Tule Groundwater Sub-basin on the south, crystalline bedrock of the Sierra Nevada foothills on the east, and the Kings River Conservation District on the west. The Kaweah Sub-basin generally comprises lands in the Kaweah Delta Water Conservation District and is the approximate extent of the primary KBWQA area. The sub-basin’s watershed is to the east and is the approximate extent of the supplemental KBWQA area. Major rivers and streams in the sub-basin include the Kaweah and St. Johns Rivers (Figure 1-4).
1.4 Kaweah Watershed
The Kaweah River watershed area is approximately 630 square miles above the foothill line in Tulare County. The Terminus Reservoir on Lake Kaweah, located about 20 miles east of Visalia, collects the majority of the tributary drainage area of about 560 square miles and produces about 95 percent of the total runoff of the watershed.
In general, the east side of the San Joaquin Valley constitutes a broad plain formed by large coalescing alluvial fans of streams draining the western slope of the Sierra Nevada. In the Kaweah watershed, the Kaweah River alluvial fan or delta is separated from the large Kings River fan on the north by Cross Creek. To the south, Elk Bayou separates the Kaweah River fan from the Tule River fan. Cottonwood Creek, an intermediate stream between Kings and Kaweah Rivers, discharges onto the interfan area of these two systems.
The Kaweah River fan is the most important fan complex in the Kaweah watershed and is characterized by a surface of low topographic relief, with variations rarely exceeding 10 feet except in stream channels. Elevations vary from about 500 feet above sea level near the easterly boundary to about 200 feet at the westerly boundary. These lands generally slope in a southwesterly direction at about 10 feet per mile, with the slope lessening as the westerly boundary is approached. In the easterly part of the area, surface soils are sandy and permeable, generally grading to finer materials to the west. The Kaweah River fan is characterized by a network of natural channels of the Kaweah River and its distributaries as well as numerous canals constructed for irrigation purposes.
1.4.1 General Characteristics
This SDEAR collected information on both the primary and supplemental areas. Although there is limited agriculture in the supplemental area, the large number of streams and rivers found in this area required the erosion potential for member parcels within the supplemental area also be determined for this report.
1.4.2 Climate
The climate in the primary KBWQA area can be defined as near desert, based on the amount of rainfall it receives. Desert regions are defined as receiving less than 10 inches of rainfall annually. The long-term average rainfall in the KBWQA is just above that limit at 10.26 inches, based on historical statistics for the City of Visalia. Nearly 80 percent of the rainfall occurs between November and March, when most crops are not being irrigated. Rainfall in summer months, when irrigation is at its highest is basically negligible. A summary of the temperature and precipitation for the primary area is provided in Table 1-1.
Provost & Pritchard Consulting Group • February 2015 1-3

Section One: Introduction
Sediment Discharge and Erosion Assessment Report
Storm intensities are generally insufficient to induce large runoff, except from impervious surfaces such as roads and parking lots typical of urban infrastructure. On the Valley floor, average monthly rainfall during the wettest month of the year is only 1.94 inches, or an average of just over 0.06 inches per day. While rainfall intensities can vary, it is clear that generally, rainfall on the valley floor does not generate sufficient runoff volumes to be of concern.
Temperature in the primary area can be classified as hot summer months with mild to cool winter months. Irrigation is at its peak during the summer months when temperatures can easily surpass 100°F during the day and crop evapotranspiration is at its highest. Winter months are generally fairly mild, but temperature can drop below freezing during nights, which can become problematic for citrus growers in the KBWQA.
The climate in the supplemental area can be divided into the foothill and mountain areas. Foothill temperatures near Three Rivers tend to be somewhat cooler than the valley floor with a yearly average precipitation of 21.71 inches. The higher elevation mountain areas near Lodgepole in the Sequoia National Forest are typically the coldest in the region with normal winter lows down to 16°F and summer highs up to 73°F. The mountain area yearly precipitation averages 44.53 inches with the highest average precipitation occurring in January. Much of the winter precipitation occurs in the form of snow, due to freezing temperatures. This precipitation remains in the state of ice; until temperatures increase causing the snow to melt, increasing flows in rivers and streams.
1.4.3 KBWQA Soils
The predominant soil texture in the primary KBWQA area is loam at approximately 52 percent . Fine sandy loam (22 percent) and sandy loam (13 percent) located near streams and channels make up another 35 percent. The remaining 13 percent includes more course grained soils, and finer grained materials located along the eastern, north central, and south central boundaries as illustrated in Figure 1-5. These textures can be further defined by soil type as detailed in Figure 1-6. In general, the areas to the east are more subject to hardpan with coarser soils along the riverbeds atop the alluvial fan and clay deposits off to either side of the fan.
1.4.4 KBWQA Agriculture
Irrigated agriculture and dairies are the primary land use for the area within the KBWQA Primary Area. In the eastern portion of the area, citrus crops dominate the land use. The center of the KBWQA has deciduous fruit and nut crops as the primary crops with urban areas also located in the vicinity. In the western half of the study area, dairies and dairy cropland (primarily forage crops) dominate the land use.
1.4.5 Surface slope
Background slope information was obtained from the USDA Natural Resources Conservation Service (NRCS) soil survey for the Primary and Supplemental areas (Figure 1-7). In general, the steepest portion of the KBWQA is in the Supplemental Area. The land surface becomes flatter as the foothills transition to the valley floor with the Primary Area having little slope and topography.
The Supplemental Area has a portion of segment along the eastern boundary that is not covered by a soil survey. However, the majority of the area does have slope information available. The slopes in the
Provost & Pritchard Consulting Group • February 2015 1-4

Section One: Introduction
Sediment Discharge and Erosion Assessment Report
Supplemental Area are generally between 20 percent and 50 percent, with some areas of lesser slopes in the northern portion and along streams and rivers.
The Primary Area shows a transition from the mountains and foothills to the valley floor. The area along the eastern boundary of the Primary Area is steeper than the remainder with slopes as steep as 40 percent. The steeper slopes transition to the generally flat valley floor area with slopes of 2 to 4 percent.
Provost & Pritchard Consulting Group • February 2015 1-5
Section One: Introduction
Sediment Discharge and Erosion Assessment Report
Figure 1-1. Vicinity Map
Provost & Pritchard Consulting Group • February 2015 1-6

Section One: Introduction
Sediment Discharge and Erosion Assessment Report
Figure 1-2. KBWQA Boundary Map
Provost & Pritchard Consulting Group • February 2015 1-7

Section One: Introduction
Sediment Discharge and Erosion Assessment Report
Figure 1-3. Groundwater Basins
Provost & Pritchard Consulting Group • February 2015 1-8

Section One: Introduction
Sediment Discharge and Erosion Assessment Report
Figure 1-4. Major Hydrology
Provost & Pritchard Consulting Group • February 2015 1-9

Section One: Introduction
Sediment Discharge and Erosion Assessment Report
Table 1-1. Primary Area Temperature and Precipitation Summary
Primary Area Temperature and Precipitation Summary Visalia, California
Month Maximum Temperature
Minimum Temperature
Precipitation (in)
January 55.1 38.6 2.01 February 61.7 42.2 1.95 March 67.7 46.0 1.81 April 73.8 49.5 1.02 May 81.9 55.7 0.38 June 89.3 61.6 0.13 July 94.2 66.3 0.01 August 93.1 64.8 0.01 September 87.7 60.0 0.14 October 77.9 52.5 0.55 November 62.8 42.5 1.15 December 55.1 38.2 1.79
Annual Average/Total: 75.03 51.5 11.0
Provost & Pritchard Consulting Group • February 2015 1-10

Section One: Introduction
Sediment Discharge and Erosion Assessment Report
Figure 1-5. Soil Texture
Provost & Pritchard Consulting Group • February 2015 1-11

Section One: Introduction
Sediment Discharge and Erosion Assessment Report
Figure 1-6. Soil Type
Provost & Pritchard Consulting Group • February 2015 1-12
Section One: Introduction
Sediment Discharge and Erosion Assessment Report
Figure 1-7. Slope
Provost & Pritchard Consulting Group • February 2015 1-13

Section Two: Soil Erosion Factors
Sediment Discharge and Erosion Assessment Report
2 Soil Erosion Factors Sediment discharge from erosion on irrigated lands is caused by direct impact from raindrops and from overland flow runoff and the rate of erosions is related to several factors. These factors include rainfall intensity, land surface slope grade and length, and soil properties including particle size, organic matter content, soil structure and permeability. Additionally, management factors such as crop cover, terraces, berms and other methods of reducing runoff and erosion affect the amount of soil erosion a property experiences.
Excessive erosion can cause problems including fouling of streams, impairment of spawning grounds, production of sediment that can move pollutants, removal of topsoil, and recontouring of the land surface. Additionally on farmland, excessive erosion can cause loss in productivity, reduction in soil organic matter and a reduction in soil nutrients. The objective of the SDEAR is to develop a methodology to assess member parcels and determine which parcels are more likely to experience sediment discharge.
Studies on soil erosion have found that soil erosion generally falls into two types: rill and inter-rill erosion. A rill is a small channel cut into the land surface by the erosive action of flowing water. Soil detachment in a rill occurs if the sediment in the flow is below the amount the load can transport and if the flow exceeds the soil's resistance to detachment. As detachment continues or flow increases, rills will become wider and deeper. Inter-rill erosion is caused by raindrops striking exposed soil that causes soil particles to detach and splashes them into the air and into shallow overland flows. Raindrops striking these shallow flows enhance the flow's turbulence and help to transport more of the detached sediment to a nearby rill or flow concentration.
Research on soil erosion by the United States Department of Agriculture (USDA) and NRCS have been used to develop empirical formulas that estimate the soil loss and sediment yield from land. The intrinsic properties used in the formulas have been developed for most of California and can be used to determine the relative amounts of potential erosion from parcels.
2.1 Precipitation
The amount of soil lost to erosion caused by rain events is directly related to the rainfall intensity and duration. Rainfall intensity includes the amount of precipitation that occurs within a specific period of time and the size of the raindrops. As rainfall intensity increases so does the diameter of each raindrop. And, as raindrop size increases, the amount of energy transferred to the soil when it hits the soil surface also increases. The more energy a raindrop possesses, the greater its erosive potential.
The duration of rainfall also affects the amount of erosion that occurs. As the soil surface becomes saturated and runoff occurs, rill erosion begins to further erode the land surface as small channels develop. These number and size of the small channels and the velocity of the water within the channels is partially dependant on the duration of the rainfall event and the amount of runoff that is occurring from the area.
Provost & Pritchard Consulting Group • February 2015 2-1

Section Two: Soil Erosion Factors
Sediment Discharge and Erosion Assessment Report
2.2 Soil
The major soil factors affecting the erosion rate are the soil texture, organic matter content, structure, and permeability.
The soil texture is a significant contributor to the amount of erosion from the land surface. The soil texture affects the likelihood that a soil particle will detach from the soil surface and be transported some distance from its initial position. The relative rate of soil erodibility from various soil textures is provided below:
i. Clay – generally resistant to detachment except in expansive clay soils which have high runoff potential;
ii. Sand – easily detached with low runoff potential, large particles are easy to detach, but difficult to transport;
iii. Loam – moderate detachment potential, moderate transportation potential; and,
iv. Silt – high detachment potential, high transportation potential.
In addition to the soil texture, the soils with higher organic content and blocky structures tend to have lower erosion rates. These factors are combined into a soil erosivity factor developed by soil scientists and provided in the NRCS Soil Survey.
2.3 Topography
The topography of the land surface has an effect on the amount of soil erosion and deposition. The steepness, length of slope and hill topography all influence the amount of soil erosion that occurs. In general, long, steep slopes that allow for overland flow conditions increase the potential for soil erosion.
The land slope has a greater impact on rill erosion than it does on inter-rill erosion because inter-rill erosion is caused by raindrop impact. Rill erosion, however, increases as the slope increases. The overland slope length is the distance from where the origin of the overland flow begins to the concentrated flow area.
In addition to the steepness of the land surface, the slope shape or the spatial variation of steepness along the slope also affects erosion. The location of the steepness along the hillslope greatly affects erosion. Erosion is greatest for convex slopes that are steep near the end of the slope length where runoff is greatest. Erosion is least for concave slopes where the upper end of the slope is steep and runoff is least. Deposition occurs on concave slopes where transport capacity of the runoff is significantly reduced as the slope flattens. Sediment yield from these slopes is less than the amount of sediment produced by erosion.
2.4 Land Use
Land use for the area has a significant impact on the amount of erosion that occurs at a site. The two factors that affect the rate of soil erosion are cover management and supporting practices.
Cover management includes planting and cultivating vegetation. The canopy provided by the plant growth reduces the impact of raindrops on the soil surface. The canopy intercepts the rainfall and reduces the velocity before the rain hits the soil surface. This reduces the amount of soil that is
Provost & Pritchard Consulting Group • February 2015 2-2

Section Two: Soil Erosion Factors
Sediment Discharge and Erosion Assessment Report
displaced by raindrop impact. The amount of reduction is tied to the percentage of ground covered by the canopy and the height of the canopy. Canopies that cover more of the ground surface, closer to the ground will achieve the greatest reduction in erositivity.
In addition to the canopy, other factors related to vegetations affect on soil erosion. Below ground biomass including roots will also have an effect on soil erosion. Vegetation that has significant quantities of live and dead roots will help hold the soil onsite and reduce erosion. These roots mechanically hold the soil in place.
In addition to vegetation, the random roughness of the soil profile will also affect the amount of soil erosion. Soil preparations that increase the random soil roughness will reduce the velocity of overland flow and thereby reduce the amount of soil eroded. In addition, random roughness creates depressions which increase infiltration and slow runoff velocity thereby reducing both soil detachment and transport capacity. Random roughness is a function of soil tillage activities, soil texture and soil biomass.
Provost & Pritchard Consulting Group • February 2015 2-3

Section Three: Methodology
Sediment Discharge and Erosion Assessment Report
3 Methodology Based on discussions between the CVRWQCB and the coalitions, a preferred method for determining the relative potential of erosion from parcels was determined. Although determining the potential soil loss rates from irrigated lands is new to the Regional Board’s requirements; the Regional Board has been requiring construction sites to determine their relative threat to discharge sediment laden storm water for a number of years. The factors the Regional Board provides to construction stormwater applicants will be used to determine the relative threat of sediment discharge from irrigated lands within the KBWQA boundary.
In addition to the potential discharge results, the proximity of the parcels to waterways was also considered. Only parcels located within a certain distance from waterways that have potential sediment discharge rates over the threshold will be required to submit Sediment and Erosion Control Plan (SECP).
3.1 Universal Soil Loss Equation (USLE)
The Universal Soil Loss Equation (USLE) is a mathematical formula that predicts the amount of soil erosion. The USLE was developed using soil erosion information collected by the U.S. Department of Agriculture Soil Conservation Service (USDA-SCS). The agency is now referred to as the NRCS. The original version of this model has been used for conservation planning both in the United States, where it originated, and around the world.
The USLE was developed from erosion plot and rainfall simulator experiments. The USLE is composed of six factors to predict the long-term average annual soil loss (A). The equation includes the rainfall erosivity factor (R), the soil erodibility factor (K), the topographic factors (L and S), and the cropping management factors (C and P). The USLE equation takes the simple product form:
A = R ×K ×L × S ×C ×P
The USLE has developed this equation based on experiments using the unit plot concept. The unit plot is defined as the standard plot condition to determine the soil's erodibility. The unit plot is defined as a land surface with an LS factor = 1 (slope = 9 percent and length = 72.6 feet), where the plot is fallow, and tillage is up and down slope, and no conservation practices are applied (CP=1). The USLE calculations were developed based on experiments performed on this standard. In this state:
𝐾 = 𝐴𝑅
A simpler method to predict K is available that includes the particle size of the soil, organic matter content, soil structure, and profile permeability. The soil erodibility factor K can be approximated from a nomograph if this information is known. The LS factors can easily be determined from a slope effect chart by knowing the length and gradient of the slope. The cropping management factor (C) and conservation practices factor (P) are more difficult to obtain and must be determined empirically from plot data.
Provost & Pritchard Consulting Group • February 2015 3-1

Section Three: Methodology
Sediment Discharge and Erosion Assessment Report
3.2 Revised Universal Soil Loss Equation (RUSLE)
The Revised Universal Soil Loss Equation (RUSLE) is the most recent version of the USLE. This version incorporates quantification of soil loss from both rill and inter-rill erosion. The RUSLE can be used to approximate soil loss across larger areas by using sample points and calculating the soil loss for each sample point. The loss is then aggregated into an estimate of soil loss across the entire area. Estimates are made on a daily basis and summed to estimate the annual sediment yield.
RUSLE2 is similar to the RUSLE, but incorporates sediment detachment/deposition dynamics which includes the rate of fall of soil particles in still water, overland flow rate per unit width of flow, transport capacity and sediment load. RUSLE2 improves the handling of several classes of soil particles and the method used to solve the equations when compared to RUSLE and USLE. These improvements increase the accuracy of the soil loss estimate.
RUSLE and RUSLE2 are used by numerous government agencies and private organizations and individuals to assess the degree of rill and inter-rill erosion, identify situations where erosion is serious, and guide development of conservation plans to control erosion. RUSLE and RUSLE2 have been applied to cropland, rangeland, disturbed forest lands, landfills, construction sites, mining sites, reclaimed lands, military training lands, parks, land disposal of waste, and other land uses where mineral soil material is exposed to the erosive forces of raindrop impact and overland flow.
3.3 Proximity to Waterways
In addition to the factors affecting the quantity of soil that is eroded from the land surface, the proximity of the farm to waterways also affects the amount of soil that can migrate to waterways. Sediment laden water that flows into waterways can impact the suitability of the water for fish and other aquatic habitat, degrade spawning ground and allow pollutant laden soil to enter waterways. Therefore, land that is close to the waterways and has high erosion characteristics has been given priority in this analysis.
3.4 Management Factors
As previously mentioned in Section 2, management factors and surface drainage characteristics can also influence the potential for sediment discharge. These factors will be addressed in the SECP for parcels identified as having the potential to discharge sediment to waterways.
Parcels identified as having the potential to discharge will be required to prepare the SECP. This plan will provide information and documentation of the management and surface drainage characteristics employed that will mitigate sediment discharge from the respective parcels. This SDEAR identifies the parcels that are required to prepare SECP’s and implement sediment control measures to mitigate the discharge of sediment to waterways.
3.5 Data Sources
The State Water Resources Control Board (SWRCB) has developed, and made available through their website, geographic information systems (GIS) spatial datasets of the rainfall erosivity (R factor), soil
Provost & Pritchard Consulting Group • February 2015 3-2

Section Three: Methodology
Sediment Discharge and Erosion Assessment Report
erodibility based on soil properties (K factor), and the topographic effects (LS factor). These intrinsic factors were used in the equation provided in the Sediment Risk Factor Worksheet that the SWRCB has developed for the calculation of construction site sediment risk. The equation results in a potential sediment discharge in tons/year. It is understood that the resulting predicted discharge is much higher than what will actually be experienced from irrigated farmland; however, the results of this equation provide a method for determining the relative risk of sediment discharge from parcels. The preliminary potential sediment discharge threshold that will be used to determine lands requiring SECPs will be 5 tons/year; the NRCS’s sediment risk potential threshold.
In addition to the potential discharge results, the proximity of the parcels to waterways has also been taken into consideration. Only parcels located within 500 meters from waterways that have potential sediment discharge rates over the threshold will be required to submit SECPs.
Provost & Pritchard Consulting Group • February 2015 3-3

Section Four: Results
Sediment Discharge and Erosion Assessment Report
4 Results Using the information provided by the SWRCB, the intrinsic RUSLE factors were mapped using GIS. The factors were then combined to calculate a combined sediment risk factor. The combined sediment risk factor map was then overlaid with the waterway buffer. Parcels identified to have the potential to degrade surface waters, a combined sediment risk factor greater than 5 tons per year and greater and at least 50 percent within the waterway buffer were identified.
4.1 Erosivity (R) Factor
The erosivity (R) factor for California was derived from precipitation records, placed on an isoerodent map, and published on the SWRCB website. Local R values can be taken directly from isoerodent maps or from GIS data.
Local variations in rainfall erosivity (+5 percent) are generally represented with a single R value. R values can be calculated for specific locations from rainfall intensity data. However, this is a very time and labor-intensive process requiring erodibility index (EI) calculations for each storm event greater than 0.5 inches for each rain gauge over a period of years. The R values given through this method provide an estimate of precipitation’s affect on the erosion rate on an annual basis.
R values are directly proportional to the amount of energy and potential runoff caused by storms. The erosivity found in the KBWQA area is generally low in the Primary Area and increases as they transition to the more mountainous Supplemental Area. A map of the R factor for the KRWCA is provided on Figure 4-1.
4.2 Soil Erodibility (K) Factor
The soil erodibility (K) factor represents the susceptibility of the soil to erosion and the amount and rate of runoff. Factors affecting the K value include soil texture, organic matter, structure, and permeability. Typical K values for various soil types are presented in Table 4-1. A map of the K factor for the KBWQA is provided on Figure 4-2.
The K factors for the study area vary depending upon location as seen on Figure 4-2. Soils near the center of the Primary Area have moderate soil erodibility with higher erodibility factors in the northern and southern portion of the Primary Area. In the Secondary Area, the soil erodibility is highly variable with portions of the area with high erodibility and some with low erodibility.
4.3 Slope Length and Steepness (LS) Factor
The Slope Length and Steepness (LS) factor represents erodibility due to combinations of slope length and steepness relative to a standard unit plot. L is the slope length factor, representing the effect of slope length on erosion. It is the ratio of soil loss from the field slope length to that from a 72.6-foot length on the same soil type and gradient. Slope length is the distance from the origin of overland flow along its flow path to the location of either concentrated flow or deposition.
S is the slope steepness. This represents the effect of slope steepness on the rate of erosion. Soil loss increases more rapidly with slope steepness than it does with slope length. It is the ratio of soil loss
Provost & Pritchard Consulting Group • February 2015 4-1

Section Four: Results
Sediment Discharge and Erosion Assessment Report
from the field gradient to that from a 9 percent slope under identical conditions. The relation of soil loss to gradient is influenced by density of vegetative cover and soil particle size.
The L factor and S factor are combined into the LS factor. The LS factor includes the slope length factor L’s effect of slope length on erosion, and the affect of the slope steepness factor S has on erosion. Values of both L and S equal 1 for the unit plot conditions of 72.6 ft. length and 9 percent slope steepness. Values of L and S are relative and represent how erodible the particular slope length and steepness is relative to the unit plot. Therefore, L and S values can range from less than 1 to values greater than 1.
The LS factor for the study area was mapped and is provided on Figure 4-3. The LS factor for the Primary Area is dominated by low LS factors. As the topography changes along the boundary between the Primary and Supplemental Areas where the valley floor transitions to the foothills, the LS factor also increases. The LS factors are highest in the Supplemental Area in the mountainous region.
4.4 Combined Sediment Risk Factor (LS*R*K)
The LS, R and K factors were combined to determine the Combined Sediment Risk Factor (Figure 4-4). This factor determines the annual erosion potential in tons per acre-year (tons/ac-yr). This calculation assumes the maximum soil erosion potential that could potentially occur if the land was bare. The actual erosion that would occur from the farmed soils is substantially less than the calculated value. Actual soil erosion is expected to be significantly less than the values presented on Figure 4-4, however, these values can be used to assess the relative erosion potential across the study area.
In general, the Primary Area is dominated by combined sediment risk factors that are less than 5 tons/ac-yr. These areas have a very low threat of discharging sediment to nearby waterways. Greater combined sediment risk factors are found on the boundary areas of the Primary and Supplemental Area and in the Supplemental Area. These are primarily attributed to the higher LS factors found in these areas due to the transition from valley floor to foothills and mountainous regions. .
4.5 Waterways
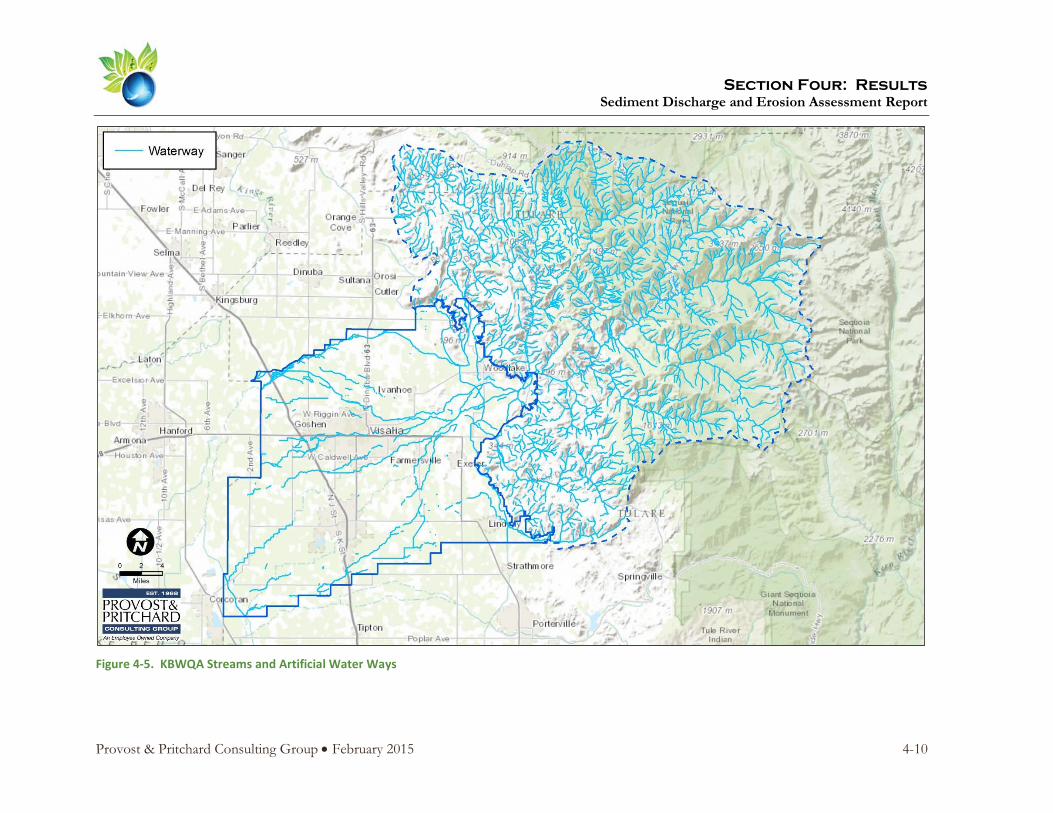
In addition to the combined sediment risk factor, the proximity of the member parcels to waterways also affects the potential for sediment discharge and pollution potential. The location of waterways was determined using the National Hydrography Dataset (NHD). All streams and artificial paths were mapped for the Primary and Supplemental Areas (Figure 4-5). To determine the parcels that are located near the waterways, a 500 meter offset from centerline of these waterways was created using GIS.
The Supplemental Area has a large number of small streams. Many of these feed into rivers that discharge through the mountains into the valley. The large number of streams in the Supplemental Area means that virtually the entire Supplemental Area is within 500 meters of a waterway.
The Primary Area has significantly less waterways than the Supplemental Area. Some of these waterways are small, historical streams that are unconnected to major waterways. Most of these are historical streams have been altered due to land leveling and development, and are not visible on aerial photos.
Provost & Pritchard Consulting Group • February 2015 4-2

Section Four: Results
Sediment Discharge and Erosion Assessment Report
4.6 Potential Sediment Dischargers
To determine the parcels and fields that have the potential to discharge sediment that may degrade surface waters, the parcels with erosion potential factors greater than 5 tons/ac-yr and are located within 500 meter of a stream or artificial path were identified using GIS (Figure 4-6).
To further refine the GIS results, the results were overlaid with the aerial photo and topographic maps. Parcels that were not likely to discharge to the nearby waterway due to land surface sloping away from the waterway, or that had an impediment to stormwater flow that would prevent water from entering the stream were removed from the dataset.
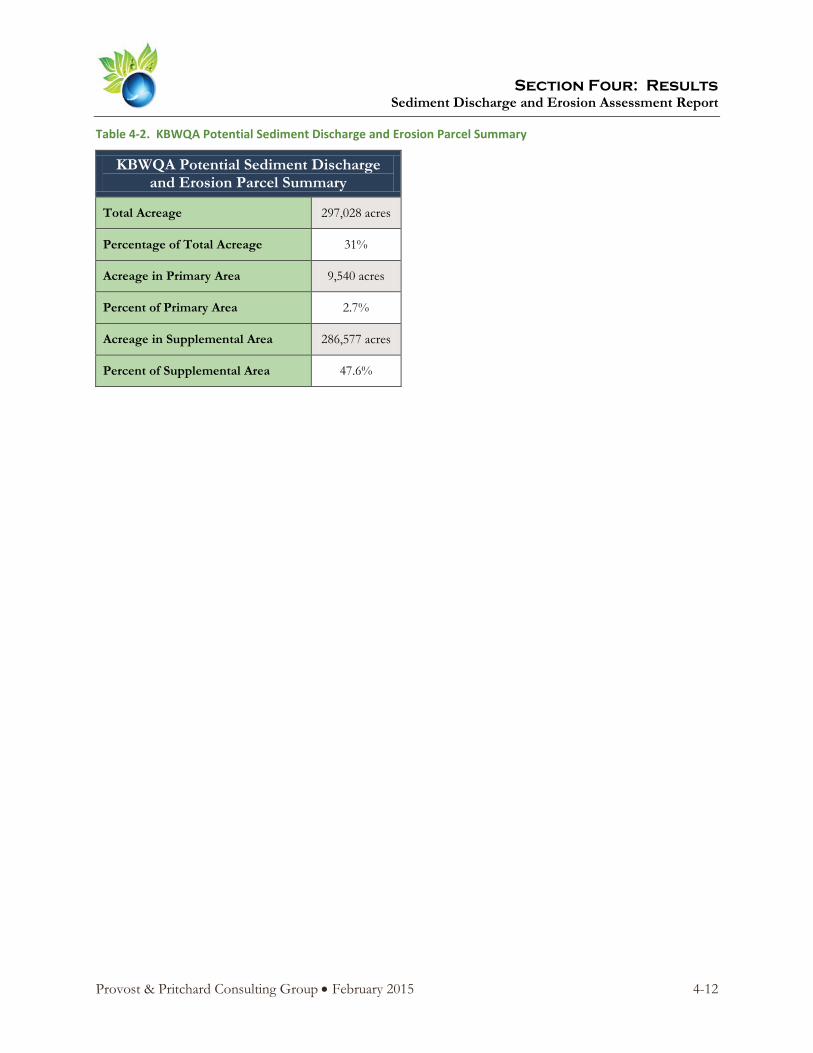
Additionally, parcels that had less than 50 percent of their land surface located within the 500 meter buffer area, or within the greater than 5 tons/ac-yr potential sediment discharge class were also removed from the dataset. The analysis results and indentified parcels that have the potential for sediment discharge and erosion to potentially affect surface waters are presented on Figure 4-6. Approximately 9,375 irrigated acres (6 percent of membership acreages) in the KBWQA area was identified to have the potential for sediment discharge and erosion to potentially affect surface waters. A summary of the parcels identified in the analysis is provided in Table 4-2.
4.7 Potential Sediment Discharger Requirements
Parcels identified as having the potential to discharge sediment that may degrade surface waters will be required to develop a SECP. The respective Member(s) are required to use the SECP Template provided by the Executive Officer, or equivalent. The SECP must be prepared in one of the following ways:
• The SECP must adhere to the site-specific recommendation from the NRCS, NRCS technical service provider, the University of California Cooperative Extension (UCCE), the local Resource Conservation District; or conform to a local county ordinance applicable to erosion and sediment control on agricultural lands. The Member must retain written documentation of the recommendation provided and certify that they are implementing the recommendation; or has completed a training program that the Executive Officer concurs provides necessary training for sediment and erosion control plan development; or,
• The SECP must be written, amended, and certified by a Qualified Sediment and Erosion Control Plan Developer possessing one of the following registrations or certifications, and appropriate experience with erosion issues on irrigated agricultural lands: California registered professional civil engineer, geologist, engineering geologist, landscape architect; professional hydrologist registered through the American Institute of Hydrology; certified soil scientist registered through the American Society of Agronomy; Certified Professional in Erosion and Sediment Control (CPSEC)™/Certified Professional in Storm Water Quality (CPSWQ)™ registered through EnviroCert International, Inc.; professional in erosion and sediment control registered through the National Institute for Certification in Engineering Technologies (NICET); or,
• The SECP must be prepared and certified in an alternative manner approved by the Executive Officer. Such approval will be provided based on the Executive Officer’s
Provost & Pritchard Consulting Group • February 2015 4-3

Section Four: Results
Sediment Discharge and Erosion Assessment Report
determination that the alternative method for preparing the SECP meets the objectives and requirements of this Order.
The plan shall be maintained and updated as conditions change. A copy of the SECP shall be maintained at the farming operations headquarters or primary place of business; and must be produced by the Member, if requested, should CVRWQCB staff, or an authorized representative, conduct an inspection of the Member’s irrigated lands operation.
For members with small farming operations, within one year of the Executive Officer approving the third party’s SDEAR, Members must complete and implement a SECP. For all other members, within 180 days of the Executive Officer approving the third party’s SDEAR, Members must complete and implement a SECP.
Provost & Pritchard Consulting Group • February 2015 4-4

Section Four: Results
Sediment Discharge and Erosion Assessment Report
Figure 4-1. KBWQA Erosivity (R) Factor
Provost & Pritchard Consulting Group • February 2015 4-5

Section Four: Results
Sediment Discharge and Erosion Assessment Report
Table 4-1. Typical Soil Erodibility (K) Factors for Various Soil Types
Typical Soil Erodibility (K) Factors for Various Soil Types
Soil Type Erodibility K Value Range
Clay High 0.05-0.15 Silt High 0.05-0.20
Loam Moderate 0.25-0.45 Sand Low 0.45-0.65
Provost & Pritchard Consulting Group • February 2015 4-6
Section Four: Results
Sediment Discharge and Erosion Assessment Report
Figure 4-2. KBWQA Soil Erodibility (K) Factor
Provost & Pritchard Consulting Group • February 2015 4-7

Section Four: Results
Sediment Discharge and Erosion Assessment Report
Figure 4-3. KBWQA Slope Length and Steepness (LS) Factor
Provost & Pritchard Consulting Group • February 2015 4-8

Section Four: Results
Sediment Discharge and Erosion Assessment Report
Figure 4-4. KBWQA Combined Sediment Risk Factor (LS*R*K)
Provost & Pritchard Consulting Group • February 2015 4-9
Section Four: Results
Sediment Discharge and Erosion Assessment Report
Figure 4-5. KBWQA Streams and Artificial Water Ways
Provost & Pritchard Consulting Group • February 2015 4-10

Section Four: Results
Sediment Discharge and Erosion Assessment Report
Figure 4-6. KBWQA Identified Potential Sediment Discharge and Erosion Parcels
Provost & Pritchard Consulting Group • February 2015 4-11
Section Four: Results
Sediment Discharge and Erosion Assessment Report
Table 4-2. KBWQA Potential Sediment Discharge and Erosion Parcel Summary
KBWQA Potential Sediment Discharge and Erosion Parcel Summary
Total Acreage 297,028 acres
Percentage of Total Acreage 31%
Acreage in Primary Area 9,540 acres
Percent of Primary Area 2.7%
Acreage in Supplemental Area 286,577 acres
Percent of Supplemental Area 47.6%
Provost & Pritchard Consulting Group • February 2015 4-12

Section Five: Bibliography/References
Sediment Discharge and Erosion Assessment Report
5 Bibliography/References California Department of Water Resources. “Tulare County Land Use Survey Data, 2007.” State of California, Land and Water Use Data Collections. http://www.water.ca.gov/landwateruse/lusrvymain.cfm.
California Department of Water Resources. California Irrigation Management Information System. http://wwwcimis.water.ca.gov
California Department of Water Resources. California’s Groundwater, Bulletin 118, Update 2003. http://www.water.ca.gov/groundwater/bulletin118/report2003.cfm
National Agriculture Imagery Program. “2012 USDA NAIP Imagery.” U.S. Department of Agriculture. http://datagateway.nrcs.usda.gov.
Natural Resources Conservation Service. Soil Survey data, Tulare County. United States Department of Agriculture. http://www.nrcs.usda.gov/wps/portal/nrcs/soilsurvey/soils/survey/state/
State Water Resources Control Board. Storm Water Program, 2009-0009-DWQ Construction General Permit, Appendix 1, Sediment Risk Factor Assessment Worksheet. California Environmental Protection Agency. http://www.waterboards.ca.gov/water_issues/programs/stormwater/constpermits.shtml
State Water Resources Control Board. Storm Water Program, Risk Assessment factor calculations and data. California Environmental Protection Agency. FTP directory ftp://swrcb2a.waterboards.ca.gov/pub/swrcb/dwq/cgp/Risk/
Tulare County Agricultural Commissioner/Sealer. Tulare County Agricultural Crop and Livestock Report, 2012. Prepared for the California Department of Food and Agriculture. June 2013.
Tulare County Resource Management Agency. “Water Supplier Database.” Provided by Mike Hickey, 2014.
United States Geological Survey. US Topographic Maps dataset. U. S. Department of the Interior. http://www.usgs.gov/
Unites States Geological Survey. “National Hydrography Dataset and Watershed Boundary Dataset.” U.S. Department of the Interior. http://nhd.usgs.gov/index.html.
Unites States Geological Survey. National Elevation Dataset.” National Map, U.S. Department of the Interior. http://nationalmap.gov/elevation.html.
Provost & Pritchard Consulting Group • February 2015 5-1

www.kaweahbasin.org


