39
Kazan Smart City – a new Business Hub in Russia
| Date post: | 13-Jan-2015 |
| Category: |
Economy & Finance |
| Upload: | infotropic-media |
| View: | 168 times |
| Download: | 3 times |

Kazan Smart City – a new Business Hub in Russia

PROJECT DIRECTION VISION
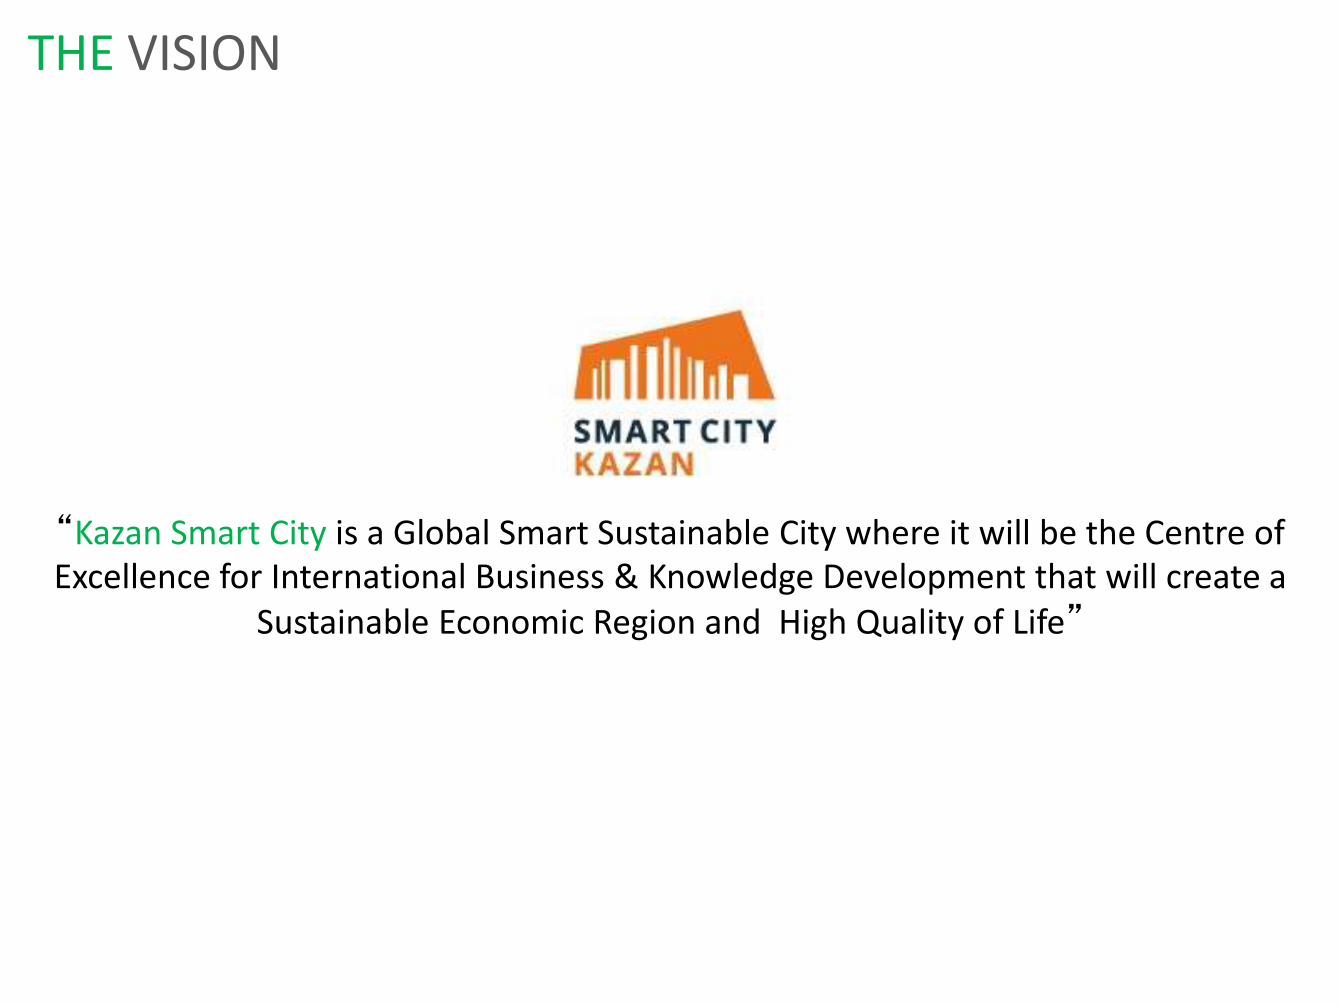
THE VISION
“Kazan Smart City is a Global Smart Sustainable City where it will be the Centre of Excellence for International Business & Knowledge Development that will create a
Sustainable Economic Region and High Quality of Life”
ONE VISION A TRANSFORMATION

CONTEMPORARY KAZAN
.

Kazan
LOCATION
• Tatarstan is in the center of Russia’s industrial heartland, roughly 800 kilometers east of Moscow at the confluence of the Volga and Kama rivers.
• Kazan Smart City – 3 km away from Airport and 15 km away from the city of Kazan.
• High speed train connects Kazan Smart City to center of Kazan and Kazan International Airport.
• Transport: Federal Highway R-239, and access
road of Stolbische township.

KSC TODAY Site Locality
.

VISION TRANSFORMATION
.
“A Transformation - Kazan International Business Hub Gateway To Russia”

KSC DESIGN PRINCIPLES
. . .
ECO URBANISM 1 SMART
GROWTH 2 SMART LOCATION 3 LOW
CARBON 4 INCLUSIVE & IDENTITY 5
• KSC urban development will co-
exist with natural environment.
• Natural vegetation will
be preserved
• To ensure high environmental quality that will be embedded
into the KSC
• KSC will adopt a Smart Growth principle.
• To be designed with
varying intensities
• To encourage mixed use development that will
be integrated with transportation.
• KSC is a catalytic development creating
high impacts to the regional and local
economy.
• To create clusters of economic activities that
will benefit the local business as well as
provide opportunities for the emergence of
new economies.
• KSC township design shall emphasis on
design solutions that will reduce the
emission of carbon
• To ensure the Environment,
Transportation, Infrastructure and
Buildings are all designed to reduce carbon emission.
• KSC shall provide for inclusivity, where the township will provide
for employment opportunities, choice in housing, access to
education and community facilities
• KSC shall place great
emphasis on local identity

DYNAMIC EMERGING ECONOMIC REGION

KSC DRIVERS & ENABLERS

Medicine Biomedicine, hospital,
medical research center
High technology Special economic zone,
clean industry.
Complex system
development
DEVELOPMENT CLUSTERS OF THE PROJECT
Tourism Business, medical,
educational and urban tourism
Education International schools and
universities, research centers

ECONOMIC DRIVERS & DEVELOPMENT PRECINCT
Central Business Precinct
CBP is envisage to be the next commercial hub after Kazan City Center. With the master plan in place, it will create a catalytic impact to businesses and provide an international business platform for the MNC’s within the region.
Special Economic Zone Precinct
A major catalytic precinct for attracting clean-technology-oriented industry, investment and research to Kazan ensuring that the local business community is benefited along the way.
Metropolitan Park Precinct By preserving the existing river corridor and vegetation, the metropolitan park is designed to provide a platform for social integration for Kazan region, cultural experience and environmental sustainability.
Knowledge & Education Precinct A visionary precinct that will transform Tatarstan into one of Russia’s premier destinations for education, research and related industry over the next 10 years. These activities shall allow a platform to retain and nurture talents.
Development Precinct

CREATING CATALYTIC ECONOMIC DRIVER
MULTIPLIER IMPACTS OF CATALYST DEVELOPMENT IN KSC
The catalysts are expected to generate about 34,500 direct jobs and 10,300 indirect or induced jobs, giving a total of 44,800 jobs in the City.
Indirect & Induced Jobs: 10,300 Total Jobs Created: 44,800 Population Threshold : 157,640
Total Population : 72,400 Threshold Direct Jobs: 34,500 E-P Ratio : 1.4 :1
Northern Sub Precinct Direct Employment : 4,033 jobs
Indirect Employment : 1,061 jobs Total : 5,094 jobs creation
Central Sub Precinct Direct Employment : 8,950 jobs
Indirect Employment : 4,013 jobs Total : 12,963 jobs creation
Southern Sub Precinct Direct Employment : 730 jobs Indirect Employment : 178jobs
Total : 908 jobs creation
Eastern Sub Precinct Direct Employment : 9,141jobs
Indirect Employment : 2,233 jobs Total : 11,374 jobs creation
Western Sub Precinct Direct Employment : 3,803 jobs Indirect Employment : 928 jobs
Total : 4,731 jobs creation
SEZ/Enterprise Precinct Direct Employment : 7,848 jobs
Indirect Employment : 1,915 jobs Total : 9,763 jobs creation

Special Economic Zone Precinct High Technology Zone Next to Airport
QUICK FACTS Precinct Area: 102 ha Developable Area: 80 ha (80%) Gross Density: 1.5 Estimated GFA: 1.3 M sq.m. Estimated Dwelling Units: - Estimated Population: - Transient Population: 5,000 Population density: - Building Height: 1 – 5 levels
Combined Heat & Power Plant
ECONOMIC DRIVERS & DEVELOPMENT PRECINCT
Clean & Green Technology Outlet
Customs & Immigration
SEZ Administration Building

ECONOMIC DRIVERS & DEVELOPMENT PRECINCT
Special Economic Zone Precinct High Technology Zone Next to Airport

Central Business Precinct A Vibrant Aerotropolis where Great Businesses Converge
ECONOMIC DRIVERS & DEVELOPMENT PRECINCT
QUICK FACTS Precinct Area: 225.07 ha Developable Area: 146 ha (65%) Gross Density (FAR) : 3.55 Estimated GFA: 5.3 M sq.m. Estimated Dwelling Units: 10,000 Estimated Population: 39,000 Transient Population: 15,000 Population Density: 175 / ha Building Height: 8 – 40 levels
Regional Shopping Mall
Business Park District Park
Central Commercial Core
Convention & Exhibition Centre
Transit Oriented Neighborhood
Transit Hotel Aero Express
Station

46,000 sq. m. Convention &
Exhibition Centre
State-of-Art 1.2 M Passenger
Capacity Transit Terminal
1.1 Million sq. m. of Grade A & B
Business Premises
3
1 2 3
1
2
2
4
2
1
Legend
Transit Terminal
Financial District / Office
Convention & Exhibition
Centre
Transit Hotel
Shopping Mall
Service Apartments
3
4
5
6
2
2
2 2
5
5 6
CITY CENTRE COMMERCIAL

KSC CONVENTION & EXHIBITION CENTRE
Convention & Exhibition Centre
Aero Express Station
Transit Hotel
QUICK FACTS Precinct Area: City Centre Plot No : CB-01 Land Area : 7.64 ha Total GFA: 45,858 sq.m. FAR : 0.6 Retail : 4586 sq.m. Enterprise : 41,272 sq.m. 5 star-
Hotel

KNOWLEDGE & EDUCATION PRECINCT The Best of Kazan Talent Pool
ECONOMIC DRIVERS & DEVELOPMENT PRECINCT
QUICK FACTS Precinct Area: 228.11 ha Developable Area: 158 ha (75%) Gross Density (FAR): 3.0 Estimated GFA: 4.8 M sq.m. Estimated Dwelling Units: 13,800 Estimated Population: 56,600 Transient Population: 11,000 Population density: 270 / ha Building Height: 4 – 18 storey
Purpose Built Office
Town Center
Natural Preservation
Campus
Transit Oriented Neighborhood
Business Park
Neighborhood
Science Park
Hospitality School

MULTI VARSITY CAMPUS
Integrated Sports
Arena
Science Park creates
6,000 jobs
Multi Varsity Campus of 623,567
sq.m. for 18,000 students
1 9 3
4
1
9 6 6
5
3
7 8
2
1
Legend
Administrative Building
Faculty Building
Sports Arena
Provisional Station
Residential Block
Commercial Center
Medical Center
Hospitality School
Science Park
3
4
5
6
7
8
9
2 2
5

22ND CENTURY QUALITY URBAN LIVING
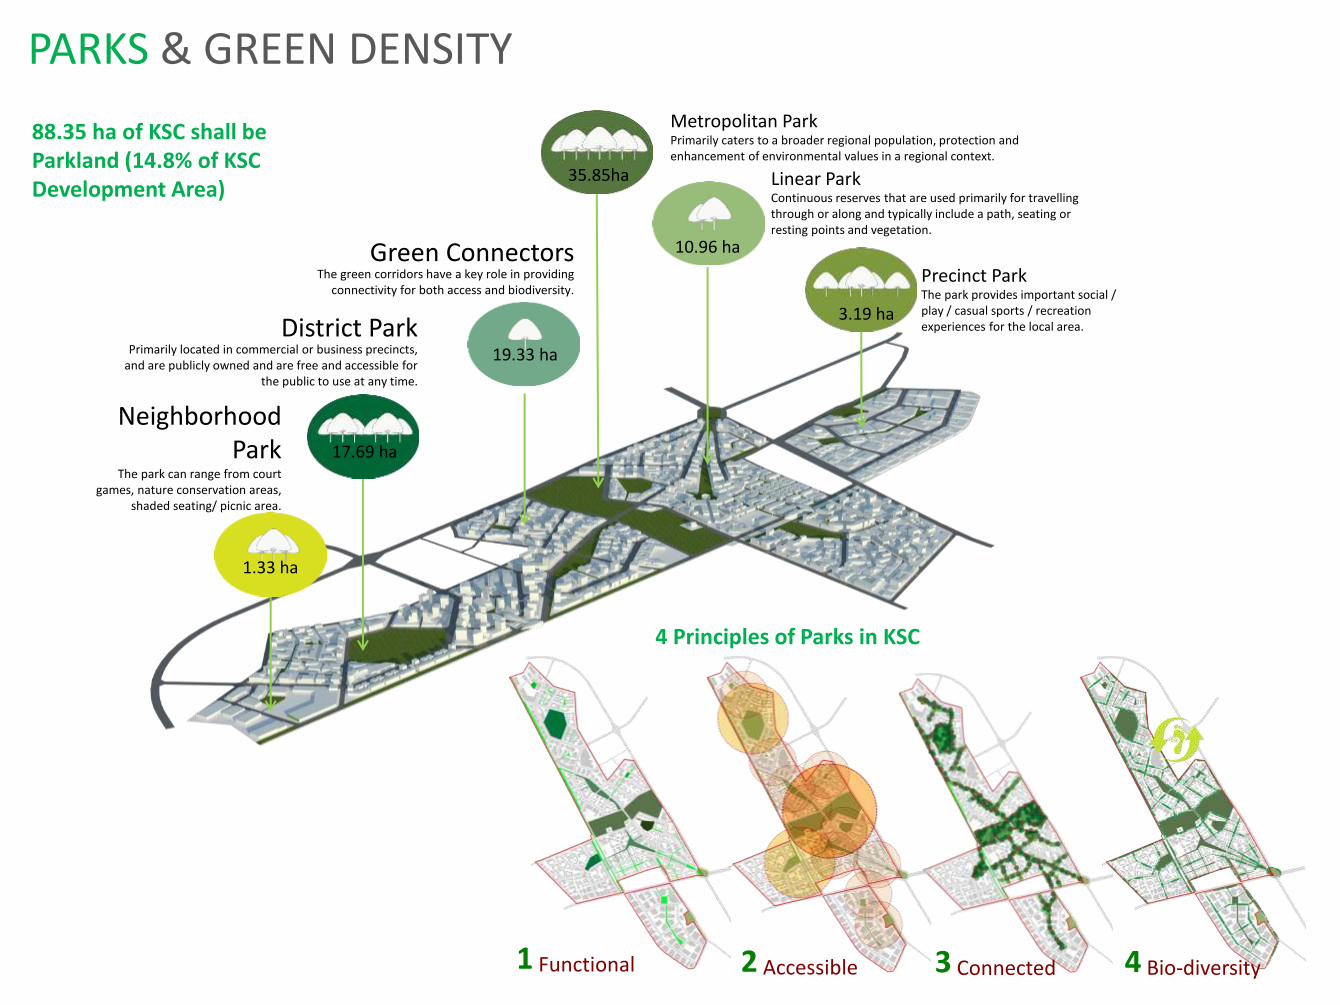
Metropolitan Park Primarily caters to a broader regional population, protection and enhancement of environmental values in a regional context.
District Park Primarily located in commercial or business precincts,
and are publicly owned and are free and accessible for the public to use at any time.
Precinct Park The park provides important social / play / casual sports / recreation experiences for the local area.
Linear Park Continuous reserves that are used primarily for travelling through or along and typically include a path, seating or resting points and vegetation.
Green Connectors The green corridors have a key role in providing
connectivity for both access and biodiversity.
35.85ha
10.96 ha
19.33 ha
17.69 ha
3.19 ha
1.33 ha
Neighborhood Park
The park can range from court games, nature conservation areas,
shaded seating/ picnic area.
PARKS & GREEN DENSITY
88.35 ha of KSC shall be Parkland (14.8% of KSC Development Area)
1 Functional
4 Principles of Parks in KSC
2 Accessible 3 Connected 4 Bio-diversity

METROPOLITAN PARK PRECINCT Experience Nature in an Urban area
QUICK FACTS Precinct Area: 35.85 ha Components: Parkland and park amenities, Religious facilities, Arts & Cultural Facilities, Green Infrastructure
Natural Trail
Cultural Complex
Plaza
METROPOLITAN PARK

Metropolitan Park during the dawn
METROPOLITAN PARK

Wellness and Religious Centre The wellness and religious centre is being designed to accommodate the needs of residents in adjacent high-rise residential buildings.
Iconic Cultural Centre and Civic Centre The cultural centre has transforming the vicinity area into a vibrant public space teeming with civic life.
Urban Park The park have an open major parkland facility accessible by public and close to integrated public transport hub. The park consists of art & cultural, performance and recreational activities on dedicated areas.
The Neighborhood Centre The Park had to be accessible on a 24 hour basis for the enjoyment and recreation of all.
Active and Sport Park The park is located close to the education centre and where a green oasis in contrast to the surrounding hardscape of the City Centre, with the ability to accommodate a range of changing outdoor seasonal events.
Avenue Park The park presents an opportunity to create outdoor spaces which can increase the quality of life of the residents and positively affects their lifestyle.
Grand Plaza The park within the neighbourhood areas is forms a flexible space consigned to establish a platform good enough for the urban situation to enjoys as well as a daily use of the equipped urban garden and a structure that provides space for cultural expressions.
Metropolitan Park The park provide unique experience across the city. The park also intended to meet the needs of the community for better access to open space and recreation opportunities.
SPACES FOR PEOPLE
Parks as Community, Arts & Cultural Venue
SMART LIVING CITY

KSC SMART INITIATIVE
KSC SMART POSITIONING
SMART PEOPLE (Human Capital)
SMART GOVERNANCE (Participation)
SMART ENVIRONMENT (Natural Resources)
SMART LIVING (Quality of Life)
SMART ECONOMY (Competitiveness)
SMART CONNECTIVITY (Transport & ICT)
Smart Transport Coordination + Integration
Live Travel Information Monitoring Demand
Information Points
Smart Utilities Integrated Resources
Storm Water Management Real Time Monitoring Resource Monitoring
Smart Living Smart Communities
Security, Health Education, Emergency
Management
Smart Building Remote Access
Real Time Pricing Real Time Information
Smart Management System
MEETING GLOBAL SUSTAINABLE STANDARDS

Tow
ard
s R
ed
uce
d C
arb
on
Fo
otp
rin
t
KSC SUSTAINABLE STANDARDS
SUSTAINABILITY PRINCIPLES
Carbon Reduction
Comprehensive, low-impact development. Biodiversity restoration and conservation
Waste Reduction
Reduce, reuse and recycle (30%-50% of waste reductions)
Save 1.2 tons of carbon dioxide annually. Sustainable Transport
Innovative transportation, pedestrian-friendly, walkable scale and 100% neighborhood permeability.
Sustainable Buildings •Energy efficient building design • Sensitive site planning and construction. •Reduce Electricity Demand by 30-50% savings
Sustainable Water Water consumption by reducing 15-30% of potable
water consumption per house To maintain and enhance surface water quality
Balance Earthworks & Green Density Maximizing cut and fill Balance to minimize the
carbon footprint. 80% reduction of earthwork volume.
CARBON REDUCTION TARGETS
15% - 30% REDUCTION on potable water consumption per house
30% - 50% WASTE REDUCTION (Household Waste)
15% - 30% SAVINGS on electricity demand
80% REDUCTION Earthwork Volume
12 sq. meter Green Space / Person
100% NEIGHBOURHOOD PERMEABILITY
50% PUBLIC TRANSPORT USERS
15% - 20% CARBON REDUCTION
REDUCE Waste (Reducing waste and emissions and increasing efficiency.)
REDUCE Water Consumption (Safe Freshwater & Avoid Discharge)
REDUCE Energy Consumption (Energy Efficiency & Renewable Source)
BALANCE Earthworks & Green Density (No import & Export)
.
Lo
w C
arb
on
Cit
y w
ith
a H
igh
Qu
alit
y o
f Li
fe

KSC LEEDS CERTIFICATION
TODAY’S COMPLIANCE
.
KSC has achieve a minimum LEED certified points of 61 points. This means that at the Concept Master Plan stage, KSC has secured the GOLD Certification.
Criteria Max. Point Level of Compliance
Pt. 1 Smart Location and Linkages (SLL)
P1 Smart Location Required Yes
P2 Imperilled Species and Ecological Communities Required Yes
P3 Wetland and Water Body Conservation Required Yes
P5 Floodplain Avoidance Required Yes
C1 Preferred Location 10 10
C3 Location With Reduced Automobile Dependence 7 7
C4 Bicycle Network & Storage 1 1
C5 Housing and Jobs Proximity 3 3
C6 Steep Slope Protection1 1 1
C7 Site Design for Habitat or Wetland and Water Body Conservation 1 1
C8 Restoration of Habitat/ Wetland & Water Bodies 1 1
C9 Long-Term Conservation Management of Habitat or Wetlands and Water Bodies 1 1
Pt. 2 Neighborhood Pattern & Design (NPD)
P1/C1 Walkable Streets 12 12
P2/C2 Compact Development 6 6
P3/C3 Mixed-use Neighborhood Centers 4 4
C5 Reduced Parking Footprint 1 1
C7 Transit Facilities 1 1
C9 Access to Civic & Public Spaces 1 1
C10 Access to Recreation Facilities 1 1
C14 Tree-Lined and Shaded Streets 2 2
C15 Neighborhood Schools 1 1
Pt. 3 Green Infrastructure & buildings (GIB)
P3/C3 Building Water Efficiency 1 1
C4 Water-efficient Landscaping 1 1
C8 Stormwater Management 4 2
C13 Infrastructure Energy Efficiency 1 1
C14 Wastewater Management 2 1
C16 Solid Waste Management Infrastructure 1 1
TOTAL 61
Legislative Local Standard Best Practices
Aspiration For Carbon Footprint Reduction
Benchmarking
Design Process Guide Principles Capitalized Natural Attributes
Relevance
Rating Tools Conceptual Target Environmental Stewardship
Driver
Vision
Design
Overview
Approach
+ Energy + Waste + Urban Form
+ Biodiversity + Water + Mobility
1. Smart Location & Linkage
2. Neighborhood Pattern & Design
3. Green Infrastructure & Building
LEED SCORE POINTS Certified: 40–49 points
Silver: 50–59 points Gold: 60–79 points
Platinum: 80 points and above

KSC SUSTAINABILITY GLOBAL POSITIONING
.
Location, Country
Bedzed, London
Kronsberg, Hannover
Dongtan, China
KLIFD, Kuala Lumpur
Songdo, Incheon
KAZAN SMART CITY Russia
Masdar, Abu Dhabi
Status Established Established Progressive Planning + Design Progressive Planning + Design Progressive
Size
1.7 Hectares 82 houses
160 hectares 3,000 houses
8,600 hectares 50,000 houses
30 hectares 600 hectares 598.30 hectares 600 hectares 50,000 houses
Type Housing development
Township Township Urban Development Mixed Use
Urban Development Mixed Use
Urban Development Mixed Use
Township
Transport
No use of fossil fuels Green Transport – pedestrian & cycling
Green Transport – pedestrian, cycling, zero GHG emission transit
Green Transport – pedestrian, cycling, zero GHG emission transit
100% of the site is within 800m from transit stations
26km Bicycle lanes Electric Car charging stations
Bicycle Lanes 250 walking distance fr Transit Public Transport – Rail and Bus
Car Free City Zero carbon emission
Waste Waste recycled
Reduce household waste by 50%:
80% solid waste recycled
70% of waste is diverted from landfill
Waste collected by vaccum, 100% incinerator
Waste collected by central system
Zero Waste
Energy 100% renewable energy use
Reduce household energy consumption by 60-80%
Reduce energy consumption by 66%
40% reduction in carbon emmision
30% reduction in carbon emission PV and Wind Power
Reduce energy consumption by 60%
Waste to Energy Solar panels for renewable energy source
Water Reduce treated potable water demand by 50%
Rainwater Harvesting & Recycled water
Water consumption down by 43%
Potable water consumption reduced by 40%
Waste water recycling
Waste water recyling for irrigation
80% recycled water (desalinated water)
Neighourhood Size
NA 500m walking catchment
800m walking catchment
400m walking catchment
Smart + Connected 250m to 400m Walking Neighbourhood
200m walking catchment
I D E A L G O O D B E S T

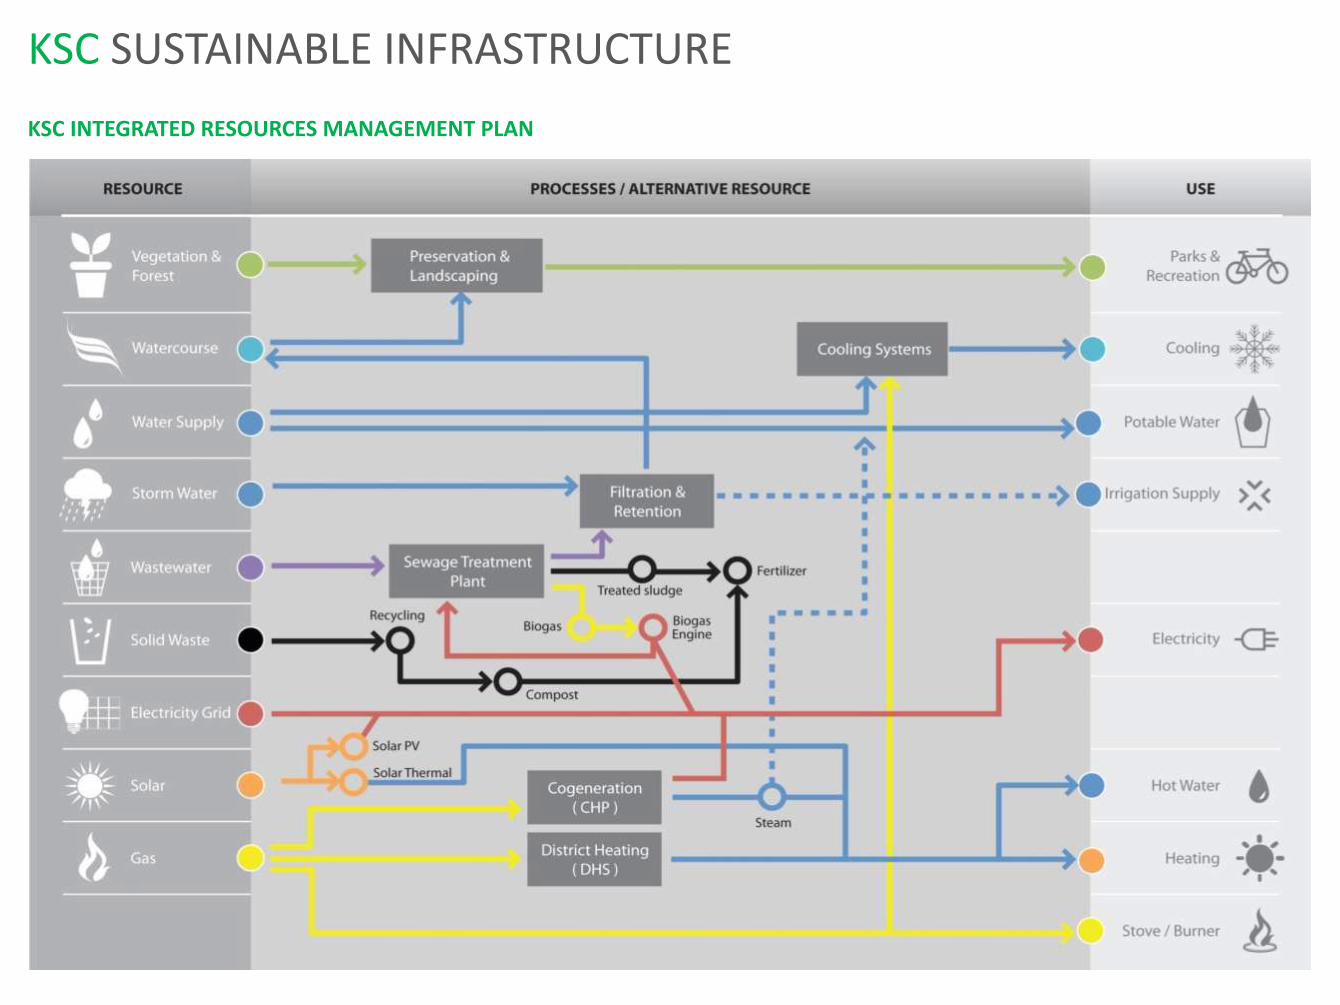
SUSTAINABLE INFRASTRUCTURE

KSC SUSTAINABLE INFRASTRUCTURE
KSC has been planned for full capacity of infrastructure and utilities to meet the City’s ultimate needs
Comprehensive Internal & External Roads Drainage & Stormwater Water Supply Sewerage
Power Supply Gas Supply Common Utility Tunnel
KSC SUSTAINABLE INFRASTRUCTURE
KSC INTEGRATED RESOURCES MANAGEMENT PLAN

WAY FORWARD
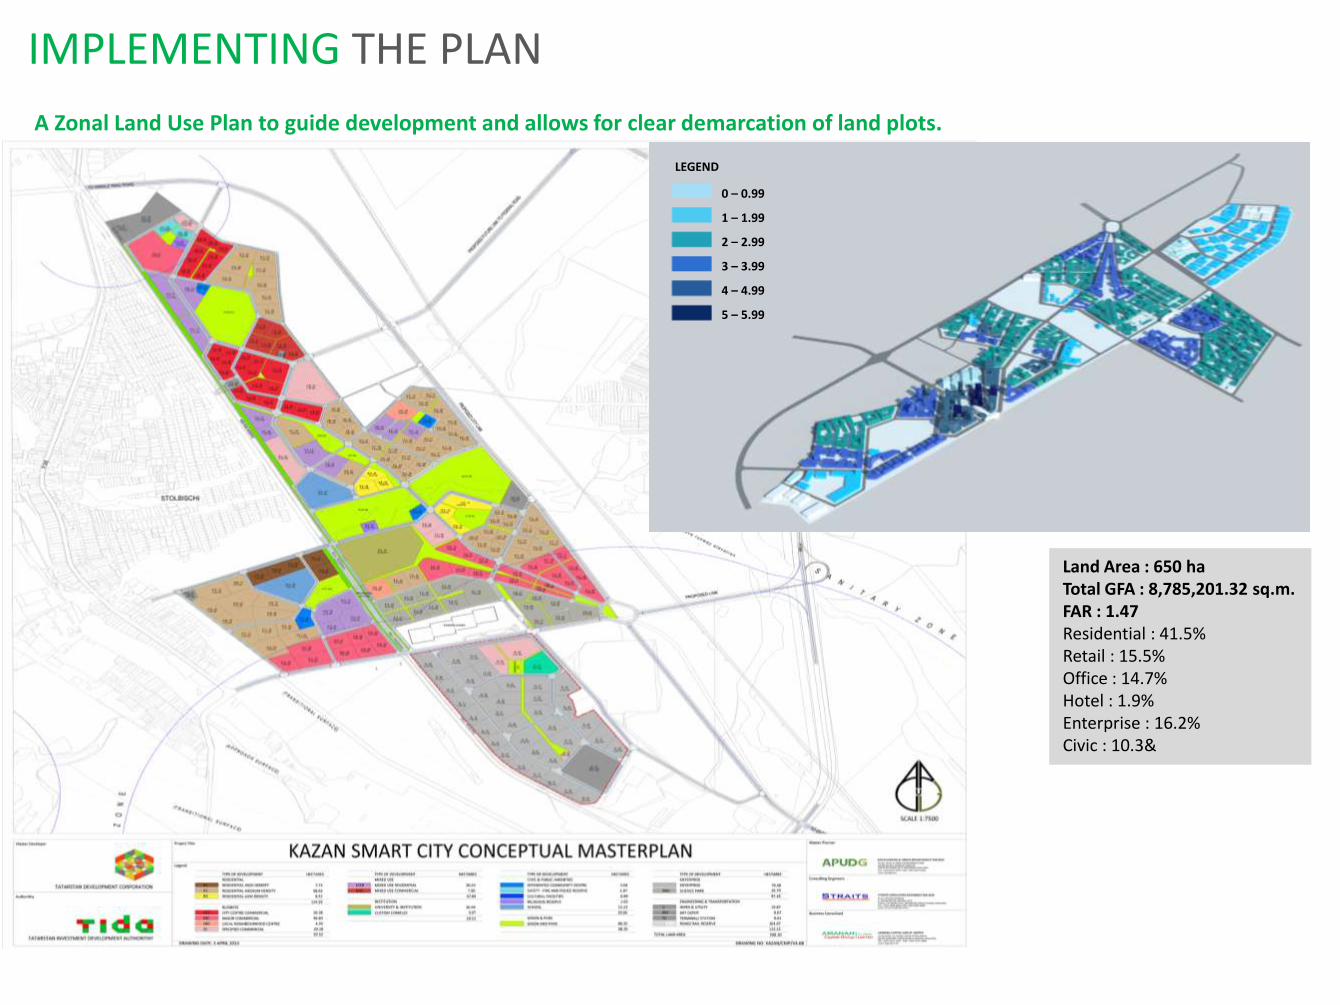
A Zonal Land Use Plan to guide development and allows for clear demarcation of land plots.
0 – 0.99
1 – 1.99
2 – 2.99
3 – 3.99
4 – 4.99
5 – 5.99
LEGEND
Land Area : 650 ha Total GFA : 8,785,201.32 sq.m. FAR : 1.47 Residential : 41.5% Retail : 15.5% Office : 14.7% Hotel : 1.9% Enterprise : 16.2% Civic : 10.3&
IMPLEMENTING THE PLAN
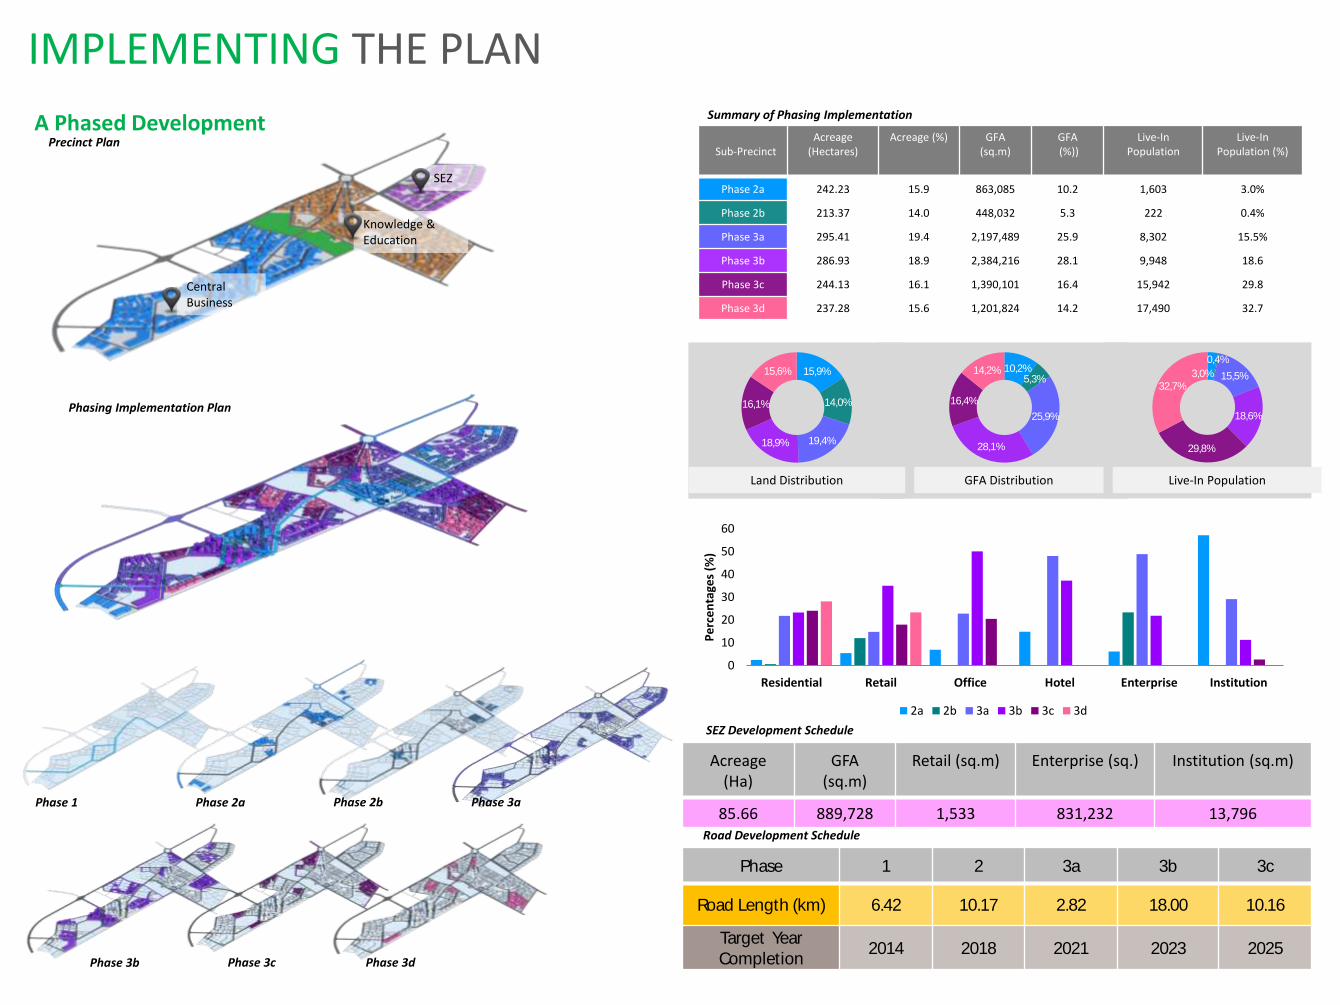
Knowledge & Education
SEZ
Central Business
Precinct Plan Sub-Precinct
Acreage (Hectares)
Acreage (%) GFA (sq.m)
GFA (%))
Live-In Population
Live-In Population (%)
Phase 2a 242.23 15.9 863,085 10.2 1,603 3.0%
Phase 2b 213.37 14.0 448,032 5.3 222 0.4%
Phase 3a 295.41 19.4 2,197,489 25.9 8,302 15.5%
Phase 3b 286.93 18.9 2,384,216 28.1 9,948 18.6
Phase 3c 244.13 16.1 1,390,101 16.4 15,942 29.8
Phase 3d 237.28 15.6 1,201,824 14.2 17,490 32.7
15,9%
14,0%
19,4% 18,9%
16,1%
15,6% 10,2% 5,3%
25,9%
28,1%
16,4%
14,2% 3,0%
0,4%
15,5%
18,6%
29,8%
32,7%
0
10
20
30
40
50
60
Residential Retail Office Hotel Enterprise Institution
Pe
rce
nta
ges
(%)
2a 2b 3a 3b 3c 3d
Phasing Implementation Plan
Land Distribution GFA Distribution Live-In Population
Summary of Phasing Implementation A Phased Development
Phase 1 2 3a 3b 3c
Road Length (km) 6.42 10.17 2.82 18.00 10.16
Target Year Completion
2014 2018 2021 2023 2025
Acreage (Ha)
GFA (sq.m)
Retail (sq.m) Enterprise (sq.) Institution (sq.m)
85.66 889,728 1,533 831,232 13,796
SEZ Development Schedule
Road Development Schedule
Phase 1 Phase 2a Phase 2b Phase 3a
Phase 3b Phase 3c Phase 3d
IMPLEMENTING THE PLAN

Thank you for your attention!


