125
Semi-annual report as at 31st March 2013 KBC RENTA Investment Company with Variable Capital (SICAV) Luxembourg R.C.S. Luxembourg B 23 669
Semi-annual report as at 31st March 2013
KBC RENTA Investment Company with Variable Capital (SICAV) Luxembourg
R.C.S. Luxembourg B 23 669

The report is the English translation of the report in French. In case of a discrepancy of content and/or meaning between the French and English versions, the French version shall prevail. No subscription can be received on the basis of this financial report. Subscriptions are only valid if made on the basis of the current issue prospectus and the key investor information document ("KIID") accompanied by the subscription form, the latest annual report and the most recent semi-annual report, if published thereafter.
KBC RENTA
Contents
1
Organisation ..................................................................................................................................................... 4
General information ......................................................................................................................................... 8
Additional information for the investors in Germany, in Austria and in Belgium ..................................... 9
Financial climate ............................................................................................................................................. 10
Consolidated statement of net assets .......................................................................................................... 16
KBC Renta Decarenta .................................................................................................................................... 17 Investment policy and outlook ...................................................................................................................... 17 Statement of net assets ................................................................................................................................ 18 Statistical information .................................................................................................................................... 19 Statement of investments and other net assets ........................................................................................... 20
KBC Renta Eurorenta ..................................................................................................................................... 21 Investment policy and outlook ...................................................................................................................... 21 Statement of net assets ................................................................................................................................ 22 Statistical information .................................................................................................................................... 23 Statement of investments and other net assets ........................................................................................... 24
KBC Renta Sekarenta ..................................................................................................................................... 25 Investment policy and outlook ...................................................................................................................... 25 Statement of net assets ................................................................................................................................ 26 Statistical information .................................................................................................................................... 27 Statement of investments and other net assets ........................................................................................... 28
KBC Renta Dollarenta .................................................................................................................................... 29 Investment policy and outlook ...................................................................................................................... 29 Statement of net assets ................................................................................................................................ 30 Statistical information .................................................................................................................................... 31 Statement of investments and other net assets ........................................................................................... 32
KBC Renta Yenrenta ...................................................................................................................................... 33 Investment policy and outlook ...................................................................................................................... 33 Statement of net assets ................................................................................................................................ 34 Statistical information .................................................................................................................................... 35 Statement of investments and other net assets ........................................................................................... 36
KBC Renta Canarenta .................................................................................................................................... 37 Investment policy and outlook ...................................................................................................................... 37 Statement of net assets ................................................................................................................................ 38 Statistical information .................................................................................................................................... 39 Statement of investments and other net assets ........................................................................................... 40
KBC Renta Sterlingrenta ................................................................................................................................ 41 Investment policy and outlook ...................................................................................................................... 41 Statement of net assets ................................................................................................................................ 42 Statistical information .................................................................................................................................... 43 Statement of investments and other net assets ........................................................................................... 44
KBC Renta Swissrenta ................................................................................................................................... 45 Investment policy and outlook ...................................................................................................................... 45 Statement of net assets ................................................................................................................................ 46 Statistical information .................................................................................................................................... 47 Statement of investments and other net assets ........................................................................................... 48
KBC Renta Emurenta ..................................................................................................................................... 49 Investment policy and outlook ...................................................................................................................... 49 Statement of net assets ................................................................................................................................ 50 Statistical information .................................................................................................................................... 51
KBC RENTA
Contents (continued)
2
Statement of investments and other net assets ........................................................................................... 52
KBC Renta Czechrenta .................................................................................................................................. 53 Investment policy and outlook ...................................................................................................................... 53 Statement of net assets ................................................................................................................................ 54 Statistical information .................................................................................................................................... 55 Statement of investments and other net assets ........................................................................................... 56
KBC Renta AUD-Renta ................................................................................................................................... 57 Investment policy and outlook ...................................................................................................................... 57 Statement of net assets ................................................................................................................................ 58 Statistical information .................................................................................................................................... 59 Statement of investments and other net assets ........................................................................................... 60
KBC Renta NZD-Renta ................................................................................................................................... 61 Investment policy and outlook ...................................................................................................................... 61 Statement of net assets ................................................................................................................................ 62 Statistical information .................................................................................................................................... 63 Statement of investments and other net assets ........................................................................................... 64
KBC Renta Short EUR .................................................................................................................................... 65 Investment policy and outlook ...................................................................................................................... 65 Statement of net assets ................................................................................................................................ 66 Statistical information .................................................................................................................................... 67 Statement of investments and other net assets ........................................................................................... 68
KBC Renta Medium EUR ................................................................................................................................ 69 Investment policy and outlook ...................................................................................................................... 69 Statement of net assets ................................................................................................................................ 70 Statistical information .................................................................................................................................... 71 Statement of investments and other net assets ........................................................................................... 72
KBC Renta Long EUR .................................................................................................................................... 73 Investment policy and outlook ...................................................................................................................... 73 Statement of net assets ................................................................................................................................ 74 Statistical information .................................................................................................................................... 75 Statement of investments and other net assets ........................................................................................... 76
KBC Renta Zlotyrenta .................................................................................................................................... 77 Investment policy and outlook ...................................................................................................................... 77 Statement of net assets ................................................................................................................................ 78 Statistical information .................................................................................................................................... 79 Statement of investments and other net assets ........................................................................................... 80
KBC Renta Forintrenta ................................................................................................................................... 81 Investment policy and outlook ...................................................................................................................... 81 Statement of net assets ................................................................................................................................ 82 Statistical information .................................................................................................................................... 83 Statement of investments and other net assets ........................................................................................... 84
KBC Renta Slovakrenta ................................................................................................................................. 85 Investment policy and outlook ...................................................................................................................... 85 Statement of net assets ................................................................................................................................ 86 Statistical information .................................................................................................................................... 87 Statement of investments and other net assets ........................................................................................... 88
KBC Renta Nokrenta ...................................................................................................................................... 89 Investment policy and outlook ...................................................................................................................... 89 Statement of net assets ................................................................................................................................ 90 Statistical information .................................................................................................................................... 91 Statement of investments and other net assets ........................................................................................... 92
KBC RENTA
Contents (continued)
3
KBC Renta TRY-Renta ................................................................................................................................... 93 Investment policy and outlook ...................................................................................................................... 93 Statement of net assets ................................................................................................................................ 94 Statistical information .................................................................................................................................... 95 Statement of investments and other net assets ........................................................................................... 96
KBC Renta Short USD .................................................................................................................................... 97 Investment policy and outlook ...................................................................................................................... 97 Statement of net assets ................................................................................................................................ 98 Statistical information .................................................................................................................................... 99 Statement of investments and other net assets ......................................................................................... 100
KBC Renta Long Term Dedicated 1 ............................................................................................................ 101 Investment policy and outlook .................................................................................................................... 101 Statement of net assets .............................................................................................................................. 102 Statistical information .................................................................................................................................. 103 Statement of investments and other net assets ......................................................................................... 104
KBC Renta Long Term Dedicated 2 ............................................................................................................ 105 Investment policy and outlook .................................................................................................................... 105 Statement of net assets .............................................................................................................................. 106 Statistical information .................................................................................................................................. 107 Statement of investments and other net assets ......................................................................................... 108
KBC Renta Strategic Accents 1 .................................................................................................................. 109 Statement of net assets .............................................................................................................................. 109 Statistical information .................................................................................................................................. 110 Statement of investments and other net assets ......................................................................................... 111
Notes to the financial statements ............................................................................................................... 114
KBC RENTA
4
Organisation
Registered office 11, rue Aldringen L-1118 LUXEMBOURG Board of Directors Chairman Wouter VANDEN EYNDE Managing Director KBC ASSET MANAGEMENT S.A. 2, avenue du Port B-1080 BRUSSELS Directors Karel DE CUYPER Head of KBC ASSET MANAGEMENT S.A. 5, place de la Gare L-1616 LUXEMBOURG
Rafik FISCHER Director KBL EUROPEAN PRIVATE BANKERS S.A. 43, boulevard Royal L-2955 LUXEMBOURG Frank JANSEN Senior Fund Manager KBC ASSET MANAGEMENT S.A. 5, place de la Gare L-1616 LUXEMBOURG Management Company KBC ASSET MANAGEMENT S.A. 5, place de la Gare L-1616 LUXEMBOURG Board of Directors of the Management Company Chairman Luc GIJSENS Managing Director KBC GROUP S.A. 2, avenue du Port B-1080 BRUSSELS (since 1st January 2013) Danny DE RAYMAEKER Managing Director KBC GROUP S.A. 2, avenue du Port B-1080 BRUSSELS (until 31st December 2012)
KBC RENTA
Organisation (continued)
5
Directors Ivo BAUWENS General Manager KBC GROUP RE S.A. 5, place de la Gare L-1616 LUXEMBOURG Dirk MAMPAEY President of the Executive Committee KBC ASSET MANAGEMENT S.A. 2, avenue du Port B-1080 BRUSSELS (since 1st January 2013) Christiaan STERCKX Managing Director KBC ASSET MANAGEMENT S.A. 2, avenue du Port B-1080 BRUSSELS Wouter VANDEN EYNDE Managing Director KBC ASSET MANAGEMENT S.A. 2, avenue du Port B-1080 BRUSSELS Johan LEMA President of the Executive Committee KBC ASSET MANAGEMENT S.A. 2, avenue du Port B-1080 BRUSSELS (until 31st December 2012) Conducting officers of the Management Company Karel DE CUYPER Dirk MAMPAEY (since 1st January 2013) Wouter VANDEN EYNDE Johan LEMA (until 31st December 2012) Central administration KBC ASSET MANAGEMENT S.A. 5, place de la Gare L-1616 LUXEMBOURG Delegated central administration KREDIETRUST LUXEMBOURG S.A. 11, rue Aldringen L-2960 LUXEMBOURG
KBC RENTA
Organisation (continued)
6
Investment managers for the following sub-funds: KBC Renta Czechrenta CSOB ASSET MANAGEMENT A.S. Perlova 37115, 11000 Praha 1 CZECH REPUBLIC KBC Renta Zlotyrenta KBC TFI S.A. Chmielna 85/87 PL-00-805 WARSAW KBC Renta Forintrenta K & H BEFEKTETÉSI ALAPKEZELO Zrt. Vigado téer 1 H-1051 BUDAPEST Socially responsible investment adviser for the following sub-funds: KBC Renta Decarenta KBC Renta Sekarenta KBC Renta Canarenta KBC Renta Sterlingrenta KBC Renta AUD-Renta KBC Renta NZD-Renta KBC Renta Nokrenta KBC ASSET MANAGEMENT S.A. 2, avenue du Port B-1080 BRUSSELS Custodian and principal paying agent KBL EUROPEAN PRIVATE BANKERS S.A. 43, boulevard Royal L-2955 LUXEMBOURG Independent auditor DELOITTE Audit Société à responsabilité limitée 560, rue de Neudorf L-2220 LUXEMBOURG Financial services and paying agents In Austria ERSTE BANK DER ÖSTERREICHISCHEN SPARKASSEN AG Graben 21 A-1010 VIENNA

KBC RENTA
Organisation (continued)
7
In Belgium CBC BANQUE S.A. 5, Grand’Place B-1000 BRUSSELS CENTEA S.A. 180, Mechelsesteenweg B-2018 ANTWERP KBC BANK S.A. 2, avenue du Port B-1080 BRUSSELS In Czech Republic ČESKOSLOVENSKÁ OBCHODNÍ BANKA, A.S. Praha 5, Radlická 333/150 CZ-15057 PRAGUE 5 In France CM-CIC Securities 6, avenue de Provence F-75009 PARIS In Germany KBC BANK DEUTSCHLAND AG Wachtstrasse 16 D-28195 BREMEN In Luxembourg KBL EUROPEAN PRIVATE BANKERS S.A. 43, boulevard Royal L-2955 LUXEMBOURG In the Netherlands KBC BANK NEDERLAND N.V. Westersignel 87-88 NL-3015 LC ROTTERDAM In Slovakia CSOB ASSET MANAGEMENT, sprav. Spol. A.S. Medená 22 SK-811 02 BRATISLAVA Legal representatives In Czech Republic ČSOB INVESTIČNÍ SPOLEČNOST, A.S. člen skupiny ČSOB Praha 5, Radlická 333/150 CZ-15057 PRAGUE 5 In Slovakia CSOB ASSET MANAGEMENT, sprav. Spol. A.S. Medená 22 SK-811 02 BRATISLAVA
KBC RENTA
8
General information
KBC RENTA (hereafter the "SICAV") is a Luxembourg Société d'Investissement à Capital Variable ("SICAV") established for an unlimited period at Luxembourg on 6th January 1986. The SICAV is governed by part I of the amended law of 17th December 2010 relating to undertakings for Collective Investment and to the Council Directive 2009/65/EC as amended. The articles of incorporation of the SICAV were published in the "Mémorial, Recueil des Sociétés et Associations" and have been filed with the "Registre de Commerce et des Sociétés de Luxembourg", where copies are available. Distribution policy Within each sub-fund of the SICAV, all shares issued are either distribution shares or capitalisation shares. Within each category of shares, some sub-categories of shares can be created, characterized by their currency, their fees or by any other characteristic. Distribution shares entitle their holder to a dividend, whereas the share of the results attributable to capitalisation shares is not paid out but is accumulated. The latest annual and semi-annual reports, the complete prospectus, the KIID and the articles of Incorporation may be obtained free of charge from the SICAV’s registered office, from the institutions responsible for providing financial services, from the paying agents and from the legal representatives. At the date of the report, the following sub-funds are offered: - KBC Renta Decarenta in DKK - KBC Renta Eurorenta in EUR - KBC Renta Sekarenta in SEK - KBC Renta Dollarenta in USD - KBC Renta Yenrenta in JPY - KBC Renta Canarenta in CAD - KBC Renta Sterlingrenta in GBP - KBC Renta Swissrenta in CHF - KBC Renta Emurenta in EUR - KBC Renta Czechrenta in CZK - KBC Renta AUD-Renta in AUD - KBC Renta NZD-Renta in NZD - KBC Renta Short EUR in EUR - KBC Renta Medium EUR in EUR - KBC Renta Long EUR in EUR - KBC Renta Zlotyrenta in PLN - KBC Renta Forintrenta in HUF - KBC Renta Slovakrenta in EUR - KBC Renta Nokrenta in NOK - KBC Renta TRY-Renta in TRY - KBC Renta Short USD in USD - KBC Renta Long Term Dedicated 1 In EUR - KBC Renta Long Term Dedicated 2
(launched on 16th November 2012) in EUR
- KBC Renta Strategic Accents 1 (launched on 28th December 2012)
in EUR
KBC RENTA
9
Additional information for the investors in Germany, in Austria and in Belgium
Additional information for the investors in Germany The fiscal data concerning all the Shares and the categories of Shares of the sub-funds of the SICAV are available within four months following the year-end of the SICAV and may be directly visualised on the following internet site of KBC BANK DEUTSCHLAND AG www.kbcfonds.de. The statement of changes in the investment portfolio for the period in reference to the report is available free of charge at the German paying and information agent, KBC BANK DEUTSCHLAND AG, Wachtstrasse 16, D-28195 BREMEN. Moreover, the complete prospectus, the KIID, the articles of incorporation of the SICAV, the semi-annual and annual reports in paper form are available there free of charge. In supplement, copies of the following documents may be inspected there during usual business hours on any bank business day:
- the domiciliation agreement; - the agreement of appointment of the Management Company; - the custodian agreement; - the paying agent agreement.
Furthermore the subscription, conversion and redemption prices are available at the information agent. Supplementary information for the investors in Austria Place where the shareholders ("investors") may obtain the prescribed documents and information in reference to §§ 34, 35 and 38 InvFG: ERSTE BANK DER ÖSTERREICHISCHEN SPARKASSEN AG, Graben 21, A-1010 VIENNA, phone 0043 (0) 50100 12139, fax 0043 (0) 50100 9 12139. The complete prospectus, the KIID, the articles of incorporation of the SICAV, the semi-annual and annual reports as well as the prices of subscriptions and redemptions are available and other data and documents may be consulted there. Supplementary information for the investors in Belgium In Belgium, the financial services for the SICAV are provided by: - KBC Bank S.A., 2, avenue du Port, B-1080 BRUSSELS, - CBC Banque S.A., 5, Grand’Place B-1000 BRUSSELS, - CENTEA S.A., 180, Mechelsesteenweg, B-2018 ANTWERP. The investors may contact any of these institutions’ branches to obtain the prospectus, subscribe to shares in the SICAV, redeem their shares or obtain payment on their coupons. The investors are asked to refer to the Belgian appendix of the prospectus, which explains all the terms and conditions that apply to them.
KBC RENTA
10
Financial climate
General investment climate 1st April 2012 - 31st March 2013 Doubts about the sustainability of the economic recovery continued to dominate the investment climate in the past period under review. In Europe the debt crisis continued to make its impact felt, even if the ECB was able to convince the market that it could control the crisis. In the US the federal budget was reformed step by step, deadline by deadline. Fortunately, this was offset by the boom in Asia. Slower growth or economic slump? Although more jobs have been created than lost in the US since 2010, the rate of employment growth has remained on the low side. Wages also increased very little. Household purchasing power consequently hardly rose and provided little support for economic growth, which remained extremely lacklustre (+1.6% y-o-y in 2012). Real GDP in the EMU contracted by an annualised 0.9%. The austerity programme and credit restrictions pushed Southern Europe into a deep recession. Germany played its traditional role as European economic engine to a lesser extent than in the recent past. Greater divergence within Europe resulted primarily in a further decline in unemployment in Germany and an alarmingly rapid rise in unemployment in countries such as Greece, Spain and Portugal. Belgium was closer to the strong core of the euro area. The weak growth in the industrialised Western economies was not without its impact on the export performance in emerging countries. In recent years, however, domestic demand (due to a rapidly growing middle class with a high consumption ratio) and inter-regional trade within Asia have been playing an increasingly important role. The region is better armed to deal with financial crises than it was in the past. Public finances are healthy, the balance of payments is generally neutral (China actually has an astronomical surplus) and the internal savings buffer is high. Asia’s economic development no longer depends on fickle foreign capital. Thanks to the contribution by the ‘new world’ the growth of world GDP held up in 2012 (estimated at 2-2.5%). Stemming the euro crisis There have been no significant bankruptcies in the business sector in recent years. The solvency and liquidity of non-financial companies have seldom been as strong as they are at present. A new feature of this cycle is that government paper, which had previously been seen as entirely risk-free, also started to be tainted with a degree of credit risk. Greece, Ireland, Portugal and Cyprus were no longer able to finance their bond debts via the usual channels and are under the curatorship of the troika (ECB, EU and IMF). Private bondholders were obliged to accept a rescheduling of the Greek government debt. In Cyprus deposit holders are being required to help defray the cost of cleaning up the banking landscape. France had to cope with a rating downgrade, and Spain and Italy were often in the firing line. Spain has already applied for European support for the recapitalisation of its banks. During all these storms the euro leaders have tried to reform the rules of the game of the currency union, but it takes a lot of time and effort to get 17 parties singing from the same hymn sheet. The ESM support mechanism became operational after much delay. The new budget treaty, which came into force on 1st January 2013, is already being questioned. The competitiveness pact does not include any hard commitments. The formation of the banking union is progressing slowly. No wonder that the sustainability of the currency union is being called into question. As traditionally faithful investors in government bonds, the European banks were oversensitive to the consequences of the euro crisis and the write-downs on their bond portfolios as they had seen their capital base seriously eroded in the 2008/09 credit crisis. The euro crisis could therefore
KBC RENTA
Financial climate (continued)
11
easily end up as a systemic crisis. That was something the European Central Bank (ECB) wanted to avoid at any cost. It therefore intervened, at first buying largely Spanish and Italian sovereign paper (August 2011). After Draghi took over from Trichet at the ECB, the heavy artillery was brought in. In December 2011 and in February 2012 the ECB launched two LTRO programmes under which banks were able to borrow on extremely favourable conditions for a term of 36 months. Funds totalling 1,000.00 billion euros were borrowed, which were invested primarily in Spanish and Italian bonds. The ECB deployed its bazooka in September 2012: OMT (Outright Monetary Transactions). The ECB has expressed its willingness to buy up troubled government debt with maturities of up to three years for an unlimited period and in unlimited quantities, provided a number of conditions have been met. The most important of these is that the government in question submits a formal request for a bailout under the ESM. That at once explains why the OMT programme has not so far been started up. The financial markets have not however been disturbed by this. For them the setting up of the European bazooka was enough in itself to regard the euro crisis as having been definitively averted. At least for the present. Public finances have gone off the rails not only in the EMU, but also in the UK and the US. The budget debate in the US had become mired in a political impasse. The ideological divisions between Republicans and Democrats long prevented a compromise. Decisions were postponed, and so 31st December 2012 became an important deadline. A whole series of tax cuts and other temporary support measures from the past would then lapse. In total these involved a sum of 550 billion USD. Extending all the measures again was not feasible in budgetary terms, while allowing them all to die out was economic suicide. The fiscal cliff was averted on 1st January 2013 by means of an agreement in Congress: half the stimulus measures were made permanent in nature or were extended for a further period of 12 months, while the other half expired. This is not the only measure involving budgetary tightening: on 1st March automatic spending cuts came into effect under which Federal expenditure will be pruned by 85 billion USD each year for a period of 10 years. Since no budget has been voted in the current financial year, the federal administrations have only been assigned budgets equal to the expenditure in the previous financial year. That too is automatically leading to more frugal management. New record for corporate earnings The recovery in corporate earnings as from Q4 2009 was just as impressive as the decline in earnings during the recession. So although the economic recovery in the West may be modest, the same was certainly not true of corporate earnings. After going from negative to positive in the last quarter of 2009, earnings per share of the S&P 500 companies as a whole rose by an average 48% in 2010, by 14% in 2011 and by 4.8% in 2012. The lacklustre economic situation in the West was not an obstacle to a strong increase in turnover. The emerging economies, which are booming, are becoming an increasingly significant market outlet for Western companies. However, the improved earnings were due more to a sharp reduction in (wage) cost pressure than to increased turnover, at least until the first quarter of 2012. Expensive commodities: more than a gauge of the economic recovery The Arab spring and the war in Libya caused the oil price to surge in spring 2011. The price of a barrel of Brent crude stood at 126 USD at the end of April 2011. When the US and Europe reduced their strategic stocks in a joint action in June 2011, the trend was broken but not fundamentally reversed. Tension surrounding Iran’s nuclear programme led to upward pressure on prices in early 2012. At the end of March 2013 the price of a barrel of crude oil was 111 USD. The steep price rises on most other commodity markets had already come to an end earlier. The prices of many industrial metals and agricultural products peaked around mid-February 2011. This was followed by a correction of 15-20%. This too could be interpreted as a sign of increasing doubts about the economy.
KBC RENTA
Financial climate (continued)
12
Inflation cooled. In the US the annual increase in the consumer price index fell from a peak of 3.9% in September 2011 to 1.7% in February 2013. Inflation in the EMU dipped from 3% to 2% in the same period. VAT increases and higher charges for government services in a number of euro-area countries prevented a sharper decline in inflation. A policy of (almost) free money and other unconventional measures The US central bank (the Fed) had already cut its key rate very early on in the crisis. Since December 2008 the rate has been a symbolic 0.25%. The European Central Bank waited considerably longer before cutting interest rates. When Mario Draghi took the helm at the ECB on 1st November 2011, the die was cast in favour of monetary easing. Its key rate is 0.75% at present. That interest rate policy was not capable of placing the economic recovery on a sustainable basis. The Fed therefore explored the scope for other measures, intervening directly on the bond markets and buying up large amounts of debt paper in an attempt to keep the long-term rate low, as well. The ECB dragged its feet, and only followed the Fed’s example much later. The intensification of the euro crisis in fact left the ECB no other choice. Consolidation of the stock-market rally The initial phase of the economic recovery went hand in hand with a fine stock-market rally, resulting in the S&P 500 being 75% higher at the end of April 2010 than its low point on 9th March 2009. Since then, the equity markets have struggled to find fresh impetus. The euro crisis and fear that the European banking sector would collapse naturally continued to cast a dark cloud over the market. On top of this, the stock markets were affected by vacillating sentiment about the economic situation. This has also been true in recent months. In the first three months of 2012 the markets were buoyed up by relative economic optimism. In April/May the markets lost steam but from early June there was a further fine rally that disregarded the deteriorating economic signals. On 31st March 2013 the MSCI All Countries (the broadest global index) was 13.8% higher in euro terms than a year before. In the case of the traditional markets, Western Europe (return index of the MSCI Europe over the same period: +13.5%) managed to keep pace with the world index despite the threat of the euro crisis. As a result the underperformance built up since the outbreak of the crisis in autumn 2009 was extended, but neither reduced nor expanded. Nevertheless the problems continued to mount in the EMU: the Greek debt rescheduling, the fall of the Cypriot banks, the undercapitalisation of the Spanish banks and the political impasse in Italy. The valuation gap has however probably become sufficiently large to absorb negative news concerning the euro problem. Wall Street closed the year substantially higher on balance (S&P500: +10.1%, Dow Jones: +9.9%). In the case of the European investor we need to deduct the 3.7% rise in the dollar (MSCI USA return in euros: +16.7%). The BEL 20 rose by 10.8%, more or less in line with the performance of other European markets. The Belgian bank shares KBC and Ageas recorded the strongest performances. UCB and AB InBev, which has taken over the Mexican market leader Modelo, were also once again star performers. Belgacom, Mobistar and Nyrstar were the main disappointments during this reporting period. The return on the Japanese stock exchange (+9.3%) was positive but hardly convincing by world standards. Over the past years (and indeed decades) the Japanese market has lost much of its attraction. Domestic investors are sceptical about the country’s economic and political stability. Foreign investors, who previously capitalised on growth in Asia via the Tokyo stock exchange, now have better (direct) alternatives.
KBC RENTA
Financial climate (continued)
13
The Asian emerging markets (+10.8%) lagged behind somewhat and were unable to cash in on their role as the growth pole of the world economy. In mid-2012 the confidence indicators began to decline, breaking through barriers that pointed to a serious economic slowdown. That failed to materialise but the slowdown was sufficient to keep alive the doubts concerning the growth story in the region. Stock-market valuations remain favourable, especially given the high growth forecasts, sound macroeconomic balance and a banking sector that was barely – if at all – affected by the credit crisis. Latin America (-2.3%) was however hit by an economic slowdown. The link to the commodity markets is always at the fore in this region. Eastern Europe (-2.6%) was also a disappointment. Russia did not prove immune to the weakness of the European economy and account began to be taken of lower oil prices in the valuation of oil stocks. There were major differences in the returns for the various sectors. The best performing sectors included Financials, Pharmaceuticals and Consumer Staples. Materials, Energy and Technology lagged behind. The outperformance of the Banks may be attributed to the quantitative easing programmes undertaken by the central banks. By this we mean the Fed’s QE3 programme, and especially the announcement by the ECB of its OMT programme, which took the heat out of the euro crisis. Pharmaceuticals had been shunned for a long time due to a lack of product innovation, patent expiry and the reforms to healthcare insurance in the US. In recent months, however, investors began to focus on the sector’s response to these challenges: restructuring operations and the sell-off of non-strategic divisions. Few other sectors are benefiting as much from growth in the emerging markets as Food, Drink and Tobacco. In many cases, those markets account for 50–70% of profit growth. The emergence of a huge new middle class has not gone unnoticed by players in this sector. Each quarter, these businesses succeed in generating excellent profits. They seem immune to slower economic growth, as revenues continue to rise and profit margins are holding up well. Miners lost ground on excessive expectations concerning commodity prices. A failed stock market flotation by Facebook and the giant leaps made by Apple meant that price trends in the Technology sector differed from what might have been expected on the basis of the fundamentals. The oil companies suffered from the vagaries of the oil market, the political instability in the Middle East and frequent accidents. Real estate (+23.0%) managed to make good the underperformance of 2011. The financial turbulence in 2007/08 forced real estate companies to clean up their balance sheets. This accordingly provided the sector with a sound base to make the most of the recovery. The traditional discount against the intrinsic value at which the sector normally trades consequently disappeared. Outlook The US and European barometers measuring confidence among business leaders peaked in spring 2011 at record levels, but have slipped heavily over the past two years. In the US they found themselves in mid-2012 in the twilight zone between recession and expansion, but in recent months have been picking up again. In Europe they remain below freezing point. We are expecting US growth to remain positive but modest (around 2% y-o-y in the coming quarters) as pay increases are barely keeping pace with inflation and budgetary policy has now finally (and probably for many years) struck down the path of austerity. The fragile recovery of the housing market and corporate investment could be sustained. How strong the growth proves to be will depend largely on the dynamic of the labour market. In recent months employment in the US has grown each month by around 200,000.00 new jobs. This will need to be sustained in order to achieve a 2% growth in 2013. In Europe the budgetary plans, tighter lending policy of the banks and major uncertainty among consumers and producers will continue to weigh on growth. The first half of the year could
KBC RENTA
Financial climate (continued)
14
therefore see a contraction of European GDP. Recovery is not anticipated until the second half of the year. Deflation or depression scenarios, which are currently dominating bond market sentiment, are not however justified. The foundations for more sustainable growth in 2014 and beyond have been laid in recent years. US households have trimmed back their debt level significantly, the savings rate has already increased considerably and loan servicing (instalments and interest payments combined) now accounts for only 9% of household budgets (the lowest level in fifteen years – it was at 14% three years ago). Households are gradually moving towards a position where they can spend more of their money on consumption. The explosive growth in earnings between 2009 and 2012 bolstered companies’ already substantial cash positions. During the crisis investments were scaled back heavily, with the foundations being laid for a catch-up process. In the US Republicans and Democrats may have totally different views about the required budgetary policy, but a common thread throughout the negotiations following the elections of November 2012 has been that the federal finances need to be reformed step by step and that a tighter budgetary policy than in the recent past will need to be implemented in the coming months. These measures will also be more restrictive than those implemented on average in the EMU. As a counterweight an extremely accommodating monetary policy is being conducted. The Fed is making unprecedented cash injections with its programme for purchasing government bonds and other debt paper. In doing so the Fed wants to prevent the banks from being preoccupied with their own solvency and hence imposing unduly strict lending conditions, which would undermine economic growth. These cash injections will either find their way into the real economy or generate inflationary expectations. In any case they will keep long rates low and banish any fears of deflation. Economic growth in Europe will remain below par. The mountainous unemployment and the euro crisis are undermining consumer confidence and the banks’ willingness to provide ready access to credit. The ECB’s monetary policy is also much less aggressive than that of the Fed. In contrast, real wage rises (however limited) are somewhat higher in Europe than in the US. Today’s world is one of two-speed economies. The mature industrialised economies (US, Europe, Japan) still find themselves in a low-growth environment, with no underlying inflationary pressure, persistently low interest rates and runaway public finances. The picture in the ‘new world’ is altogether different. The strong economic growth has already created inflationary pressure in Asia. A tailored monetary policy is accordingly required: sometimes restrictive (as in 2011) and at other times stimulatory (as at present). Monetary policy in China and elsewhere in Asia is highly geared to preventing asset-price inflation. This did not just involve the interest-rate weapon; there was also active intervention in the credit market and the foreign exchange market. One of the major challenges for this decade will be the further development of consumption in China and the rest of Asia. That could help bring about a more balanced economic world order: it will not only reduce the region’s dependence on exports but, at least as importantly, will have an effect on international capital flows. More consumption in China will mean lower savings and higher imports, including from the US and Europe. That will help the West to ‘grow out’ of its debt problems. Time is of the essence for the euro area. Everyone knows that the EMU is not a perfect monetary union. In its twelve-year history, little has been done to improve its internal operation. National autonomy was off-limits. The crisis brought the realisation that economic governance, as it is now called in Eurospeak, needs to be tackled as a matter of urgency. In concrete terms, this involves measures such as supranational supervision of banks (scheduled to be in place by March 2014), strict monitoring and sanctioning of budgetary policy (a huge challenge given the emergence of austerity fatigue), monitoring of pay policy and harmonising European taxation (a big taboo).
KBC RENTA
Financial climate (continued)
15
The capital base of the banks will need to be strengthened further to ensure the stability of the financial system, so that there is a sufficient buffer to offset provisions and unforeseen write-downs. That will be just as important in 2013 – and probably after that too – as it was in 2011 or 2012. All the measures required to achieve this are being taken. Examples include the almost 2,000.00 billion euros that were set aside in the space of two years in order to ensure the smooth funding of European governments, the introduction of stress tests to establish whether the banks have sufficient capital to cope with a new and serious crisis, the gradual introduction of new and/or stricter capital requirements under Basel III and making the reserves of the ESM available for direct loans to ailing European banks. Maintaining a (virtually) zero money market rate also fits with this. There is no urgent macroeconomic reason to adopt a more restrictive policy so long as the economic situation in the West remains weak and there is no sign of any real inflationary pressure. Thanks to the continued strong growth in the emerging markets, the global economy could post growth of 2.5–3% in 2013 and in 2014. This is one of the reasons why corporate earnings could continue to grow in the coming quarters at a rate of 5–10%. It seems paradoxical that companies have emerged as the winners from the 2008/09 crisis. They are now reaping the benefits of the considerable restructuring measures pushed through during the recession. Cost controls go beyond (one-off and in some cases spectacular) restructuring measures and have now become an integral part of business culture. The recession of 2008/09 caused companies to be even more aware of risks (i.e. money, and hence costs). Investment projects are subject to a more thorough profitability study. A combination of debt reduction and low interest rates has resulted in a steep drop in financial charges. Globalisation (pressure of relocation) and ongoing high unemployment have made employees powerless to demand high pay increases. Maintaining purchasing power is now about all that is on offer. There is no question of real wage rises. In brief, every cent increase in revenue goes (almost) entirely to the capital factor.
The money market rate won’t increase rapidly and bond yields are close to historical lows. Everything seems to point to shares being the most attractive investment option for the months ahead. The lack of alternatives is not, of course, sufficient reason to increase the market valuation. For that to happen, investors will need to be more predisposed to taking risk. The current valuation of equities continues to discount a number of very pessimistic scenarios. Based on forecast earnings for 2013, the price-earnings ratio is 14.7 for the S&P 500 and 12.0 for the MSCI Europe. That is 25-30% lower than the historical average. Equities are certainly dirt-cheap compared with bonds. The earnings yield – the inverse of the price/earnings ratio – is currently 8.3% for the MSCI Europe, an unprecedented premium of some 700 basis points above German bond yields. Luxembourg, 17th April 2013 The Board of Directors Note: The information in this report represents historical data and is not an indication of future results.
KBC RENTA
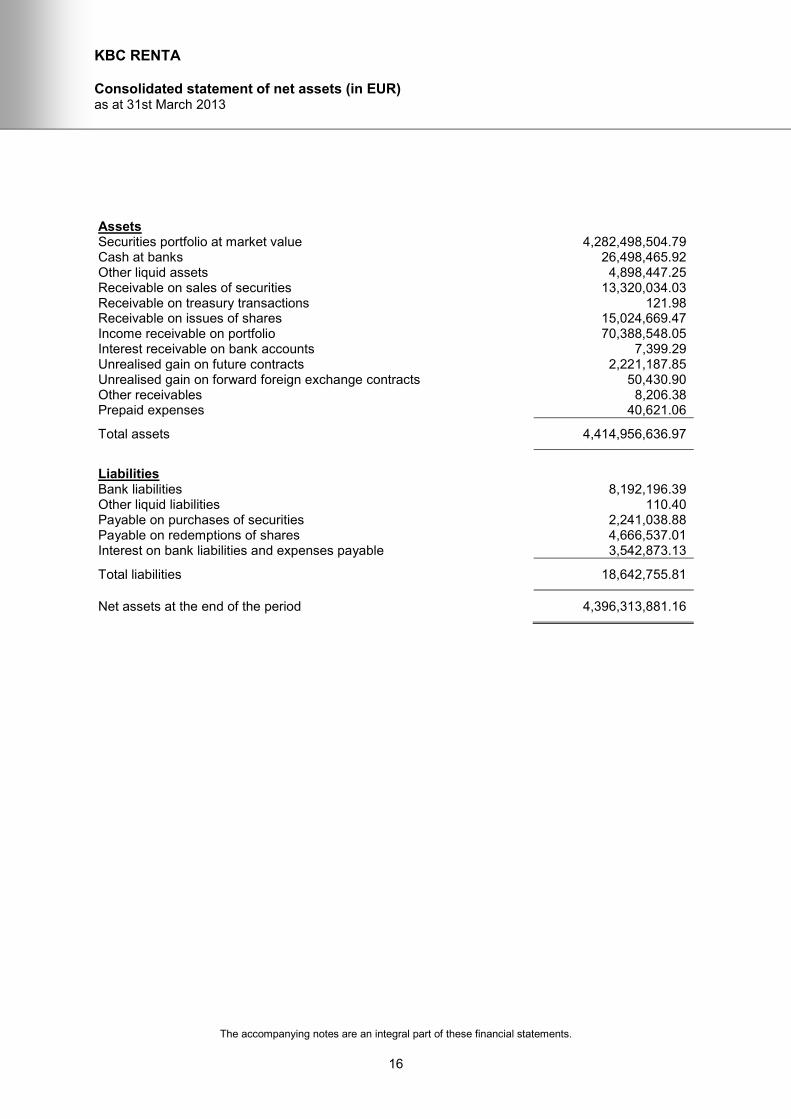
Consolidated statement of net assets (in EUR) as at 31st March 2013
The accompanying notes are an integral part of these financial statements.
16
Assets Securities portfolio at market value 4,282,498,504.79 Cash at banks 26,498,465.92 Other liquid assets 4,898,447.25 Receivable on sales of securities 13,320,034.03 Receivable on treasury transactions 121.98 Receivable on issues of shares 15,024,669.47 Income receivable on portfolio 70,388,548.05 Interest receivable on bank accounts 7,399.29 Unrealised gain on future contracts 2,221,187.85 Unrealised gain on forward foreign exchange contracts 50,430.90 Other receivables 8,206.38 Prepaid expenses 40,621.06
Total assets 4,414,956,636.97
Liabilities Bank liabilities 8,192,196.39 Other liquid liabilities 110.40 Payable on purchases of securities 2,241,038.88 Payable on redemptions of shares 4,666,537.01 Interest on bank liabilities and expenses payable 3,542,873.13
Total liabilities 18,642,755.81
Net assets at the end of the period 4,396,313,881.16
KBC Renta Decarenta
Investment policy and outlook from 1st October 2012 to 31st March 2013
17
This sub-fund invests in Danish government paper. The fund maintains a relatively neutral exposure to interest rates and aims to deliver a return close to the benchmark, with low tracking error. The overall interest rate environment is one of low interest rates, a situation we expect to continue for the near future. In July 2012, the Danish central bank cut its interest rates to record lows, taking its lending rate to 0.2% and its deposit rate to -0.2%. These measures were the result of strong capital inflows into Denmark, one of the few remaining economies with a AAA rating and therefore viewed by investors as a safe haven in the midst of the turmoil engulfing Europe. They also reflect the willingness of the Danish Central Bank to maintain a stable exchange rate between the EUR and DKK, and therefore to prevent their currency from appreciating too much and putting the Danish economy at risk. After spending most of 2012 trying to weaken the DKK in response to capital inflows spurred by investor flight from the euro crisis, the Danish central bank had to intervene regularly in the foreign exchange markets from October 2012 to January 2013 to buy DKK in order to maintain its peg to the EUR, as weaker demand for safe haven assets and negative policy rates left their mark on the exchange rate. It then raised its benchmark interest rate to 0.3% (from 0.2%) and its deposit rate to -0.1% (from -0.2%) on 24th January 2013. Renewed problems within the euro area (Cyprus, for instance) seem to have removed the possibility of a further rate hike any time soon as demand for safe haven assets increased again. The economic situation remains challenging for Denmark. The economy underperformed in 2012 and is expected to remain flat in 2013. Note: The information in this report represents historical data and is not an indication of future results.
KBC Renta Decarenta
Statement of net assets (in DKK) as at 31st March 2013
The accompanying notes are an integral part of these financial statements.
18
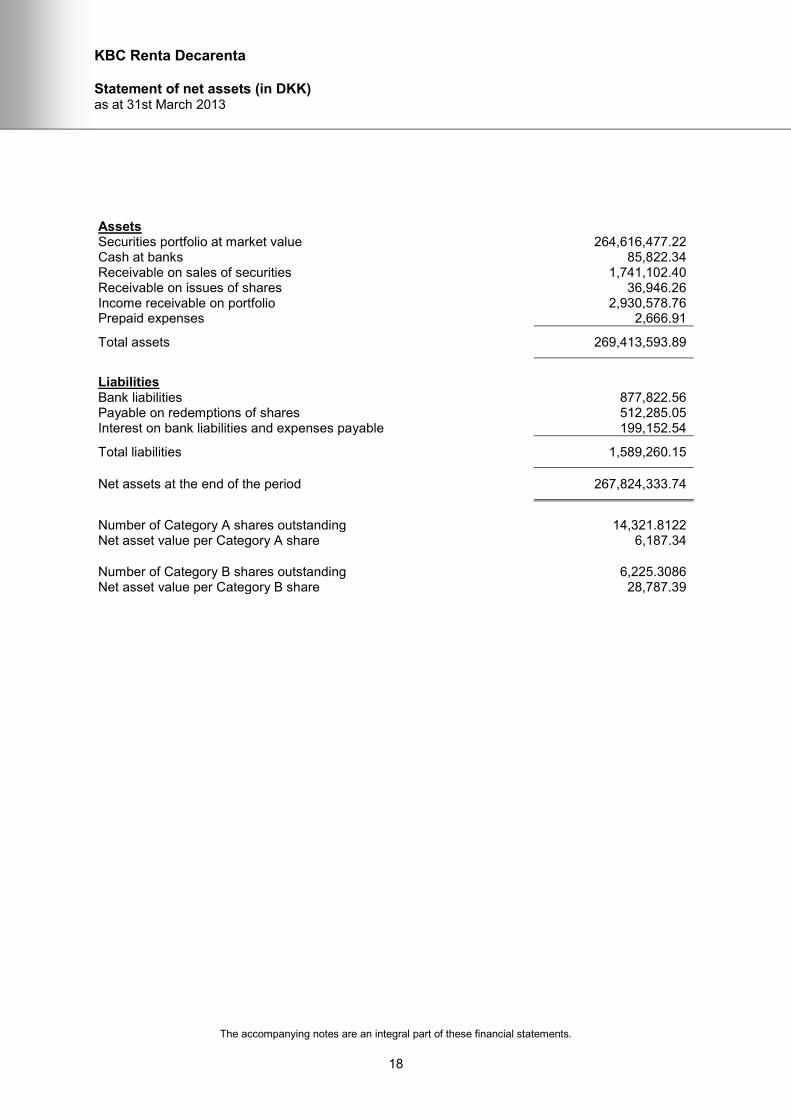
Assets Securities portfolio at market value 264,616,477.22 Cash at banks 85,822.34 Receivable on sales of securities 1,741,102.40 Receivable on issues of shares 36,946.26 Income receivable on portfolio 2,930,578.76 Prepaid expenses 2,666.91
Total assets 269,413,593.89
Liabilities Bank liabilities 877,822.56 Payable on redemptions of shares 512,285.05 Interest on bank liabilities and expenses payable 199,152.54
Total liabilities 1,589,260.15
Net assets at the end of the period 267,824,333.74
Number of Category A shares outstanding 14,321.8122 Net asset value per Category A share 6,187.34
Number of Category B shares outstanding 6,225.3086 Net asset value per Category B share 28,787.39

KBC Renta Decarenta
Statistical information (in DKK) as at 31st March 2013
The accompanying notes are an integral part of these financial statements.
19
Total net assets
- as at 31.03.2013 267,824,333.74 - as at 30.09.2012 291,566,641.29 - as at 30.09.2011 964,896,602.43
Number of Category A shares
- outstanding at the beginning of the period 14,674.6061 - issued 842.1967 - redeemed -1,194.9906
- outstanding at the end of the period 14,321.8122
Net asset value per Category A share
- as at 31.03.2013 6,187.34 - as at 30.09.2012 6,279.53 - as at 30.09.2011 6,105.92
Dividend paid
Ex-dividend date 01.10.2012 Dividend per share 130.00 Shares outstanding at dividend date 14,674.6061
Number of Category B shares
- outstanding at the beginning of the period 6,970.4161 - issued 131.2138 - redeemed -876.3213
- outstanding at the end of the period 6,225.3086
Net asset value per Category B share
- as at 31.03.2013 28,787.39 - as at 30.09.2012 28,609.06 - as at 30.09.2011 26,953.45
KBC Renta Decarenta
Statement of investments and other net assets (in DKK) as at 31st March 2013
The accompanying notes are an integral part of these financial statements.
20
Currency Number / nominal value
Description Cost Market value % of total net assets
Investments in securities
Transferable securities admitted to an official stock exchange listing
Bonds
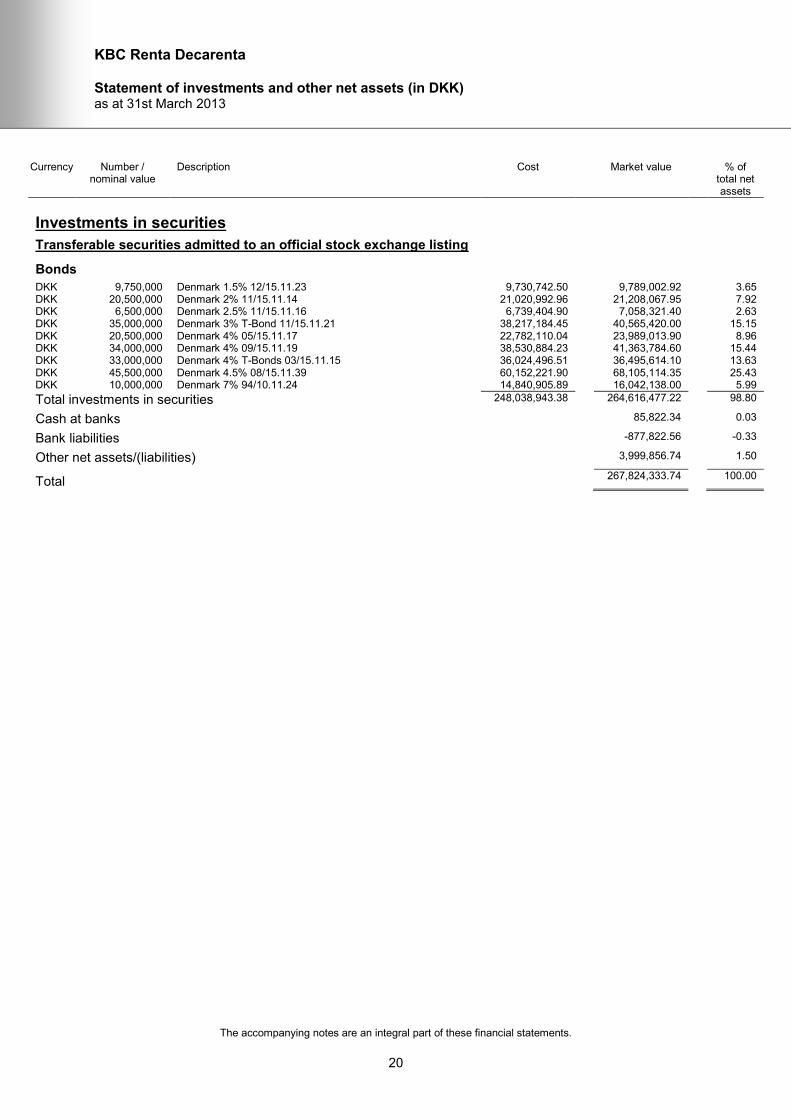
DKK 9,750,000 Denmark 1.5% 12/15.11.23 9,730,742.50 9,789,002.92 3.65 DKK 20,500,000 Denmark 2% 11/15.11.14 21,020,992.96 21,208,067.95 7.92 DKK 6,500,000 Denmark 2.5% 11/15.11.16 6,739,404.90 7,058,321.40 2.63 DKK 35,000,000 Denmark 3% T-Bond 11/15.11.21 38,217,184.45 40,565,420.00 15.15 DKK 20,500,000 Denmark 4% 05/15.11.17 22,782,110.04 23,989,013.90 8.96 DKK 34,000,000 Denmark 4% 09/15.11.19 38,530,884.23 41,363,784.60 15.44 DKK 33,000,000 Denmark 4% T-Bonds 03/15.11.15 36,024,496.51 36,495,614.10 13.63 DKK 45,500,000 Denmark 4.5% 08/15.11.39 60,152,221.90 68,105,114.35 25.43 DKK 10,000,000 Denmark 7% 94/10.11.24 14,840,905.89 16,042,138.00 5.99
Total investments in securities 248,038,943.38 264,616,477.22 98.80
Cash at banks 85,822.34 0.03
Bank liabilities -877,822.56 -0.33
Other net assets/(liabilities) 3,999,856.74 1.50
Total 267,824,333.74 100.00
KBC Renta Eurorenta
Investment policy and outlook from 1st October 2012 to 31st March 2013
21
Economic growth in Europe remained extremely weak in the first six months of this financial year, and was negative in several countries. Actions taken everywhere to reduce budget deficits took their toll. Southern European countries suffered particularly acutely under the measures imposed on them. Fortunately, the ECB president’s statement at the end of August had the necessary effect: he declared that the bank would do whatever it takes to defend the euro, following which spreads between ‘core’ countries like Germany and the European periphery narrowed significantly. The result was a general decline in bond yields across Europe. Economic activity remained highly depressed, leaving little scope for higher interest rates, while diminished fear of investing in more risk-exposed countries also meant that yields tended to fall as demand rose. This situation is mirrored in the fund. The duration was held around 95%, based on the very low level of yields, while holdings of peripheral European countries were brought back in line with the benchmark. Once it became clear that the rally on the periphery was not just a flash in the pan, holdings of Italian government bonds were also slightly overweighted once more to benefit from the rate spread. Neither the problems in Cyprus nor the unstable political situation in Italy after the February elections seemed to temper the market’s appetite for higher-yielding securities. We do not expect any fundamental shifts in the market in the months ahead. Interest rates in the core countries have reached such low levels that it is not unreasonable to suppose that this cannot continue. Such a view is not supported, however, by the latest economic figures. Periphery spreads have been tightening but higher volatility remains a possibility as headlines are expected to keep blowing hot and cold. In short, a cautious investment policy seems the most appropriate Note: The information in this report represents historical data and is not an indication of future results.
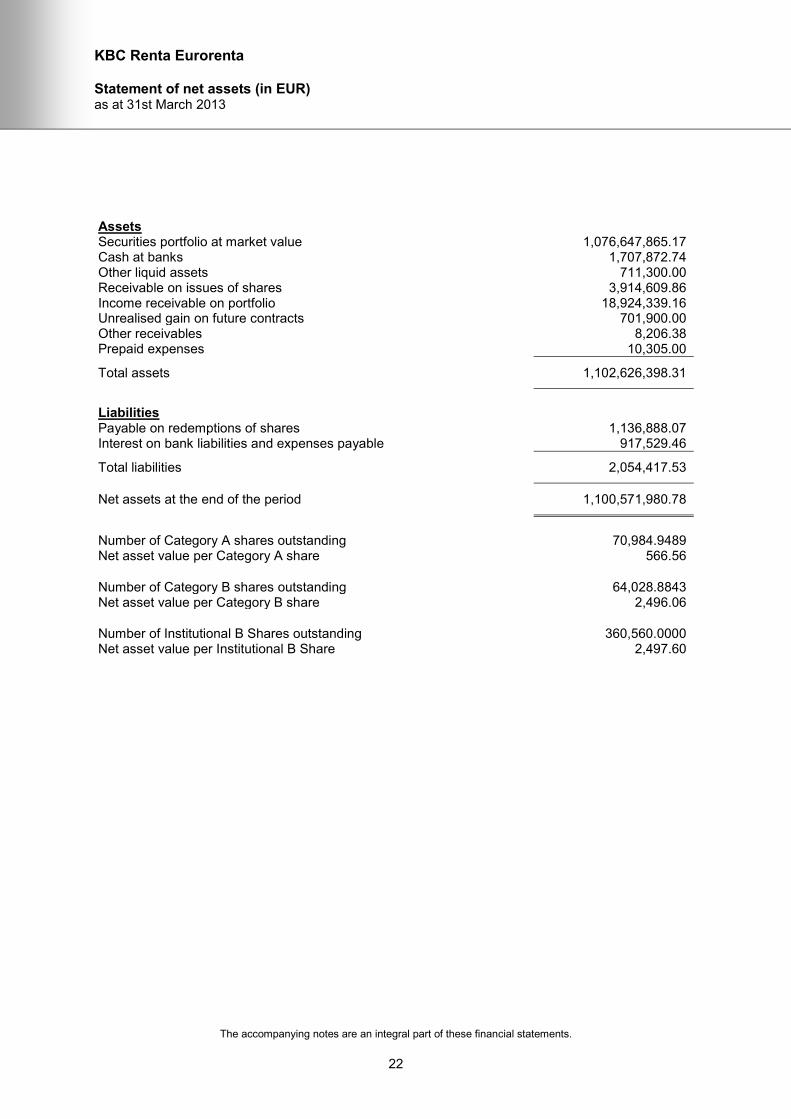
KBC Renta Eurorenta
Statement of net assets (in EUR) as at 31st March 2013
The accompanying notes are an integral part of these financial statements.
22
Assets Securities portfolio at market value 1,076,647,865.17 Cash at banks 1,707,872.74 Other liquid assets 711,300.00 Receivable on issues of shares 3,914,609.86 Income receivable on portfolio 18,924,339.16 Unrealised gain on future contracts 701,900.00 Other receivables 8,206.38 Prepaid expenses 10,305.00
Total assets 1,102,626,398.31
Liabilities Payable on redemptions of shares 1,136,888.07 Interest on bank liabilities and expenses payable 917,529.46
Total liabilities 2,054,417.53
Net assets at the end of the period 1,100,571,980.78
Number of Category A shares outstanding 70,984.9489 Net asset value per Category A share 566.56
Number of Category B shares outstanding 64,028.8843 Net asset value per Category B share 2,496.06
Number of Institutional B Shares outstanding 360,560.0000 Net asset value per Institutional B Share 2,497.60

KBC Renta Eurorenta
Statistical information (in EUR) as at 31st March 2013
The accompanying notes are an integral part of these financial statements.
23
Total net assets
- as at 31.03.2013 1,100,571,980.78 - as at 30.09.2012 1,066,581,553.74 - as at 30.09.2011 503,732,951.35
Number of Category A shares
- outstanding at the beginning of the period 73,659.0617 - issued 325.8035 - redeemed -2,999.9163
- outstanding at the end of the period 70,984.9489
Net asset value per Category A share
- as at 31.03.2013 566.56 - as at 30.09.2012 569.62 - as at 30.09.2011 559.11
Dividend paid
Ex-dividend date 01.10.2012 Dividend per share 18.00 Shares outstanding at dividend date 73,659.0617
Number of Category B shares
- outstanding at the beginning of the period 66,889.8471 - issued 6,522.5756 - redeemed -9,383.5384
- outstanding at the end of the period 64,028.8843
Net asset value per Category B share
- as at 31.03.2013 2,496.06 - as at 30.09.2012 2,430.15 - as at 30.09.2011 2,304.76
Number of Institutional B Shares
- outstanding at the beginning of the period 354,592.0000 - issued 339,579.0000 - redeemed -333,611.0000
- outstanding at the end of the period 360,560.0000
Net asset value per Institutional B Share
- as at 31.03.2013 2,497.60 - as at 30.09.2012 2,431.17 - as at 30.09.2011 -
KBC Renta Eurorenta
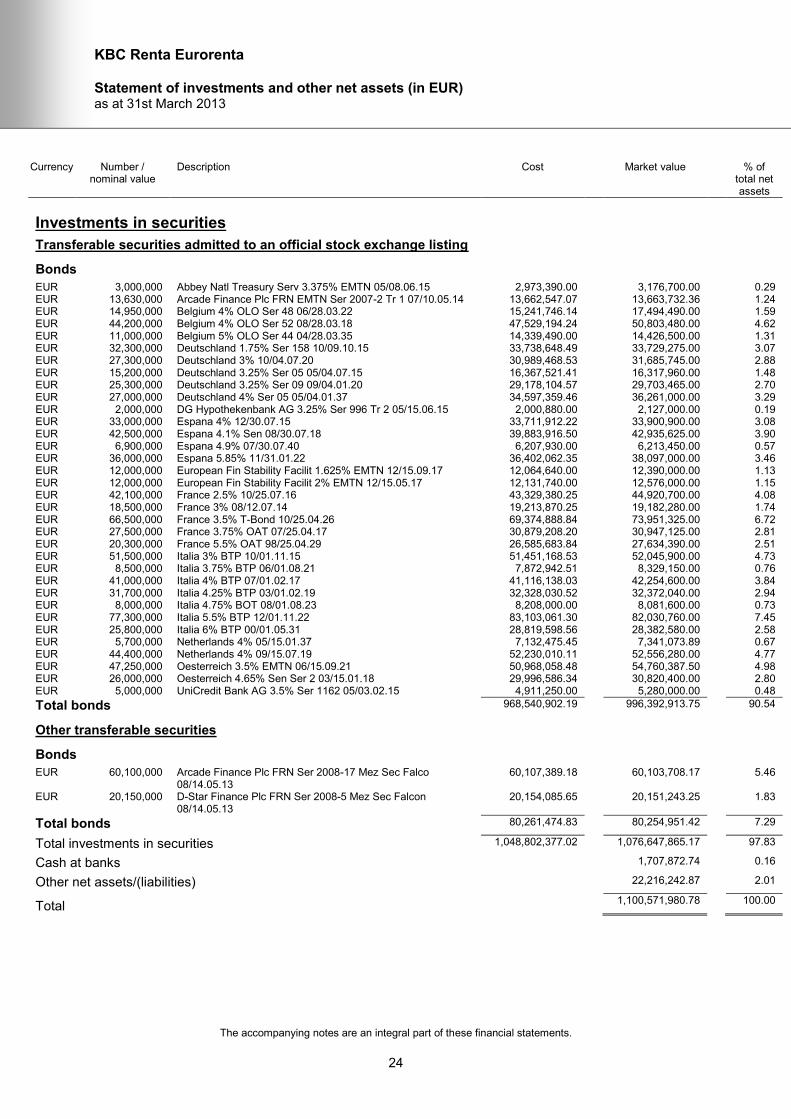
Statement of investments and other net assets (in EUR) as at 31st March 2013
The accompanying notes are an integral part of these financial statements.
24
Currency Number / nominal value
Description Cost Market value % of total net assets
Investments in securities
Transferable securities admitted to an official stock exchange listing
Bonds
EUR 3,000,000 Abbey Natl Treasury Serv 3.375% EMTN 05/08.06.15 2,973,390.00 3,176,700.00 0.29 EUR 13,630,000 Arcade Finance Plc FRN EMTN Ser 2007-2 Tr 1 07/10.05.14 13,662,547.07 13,663,732.36 1.24 EUR 14,950,000 Belgium 4% OLO Ser 48 06/28.03.22 15,241,746.14 17,494,490.00 1.59 EUR 44,200,000 Belgium 4% OLO Ser 52 08/28.03.18 47,529,194.24 50,803,480.00 4.62 EUR 11,000,000 Belgium 5% OLO Ser 44 04/28.03.35 14,339,490.00 14,426,500.00 1.31 EUR 32,300,000 Deutschland 1.75% Ser 158 10/09.10.15 33,738,648.49 33,729,275.00 3.07 EUR 27,300,000 Deutschland 3% 10/04.07.20 30,989,468.53 31,685,745.00 2.88 EUR 15,200,000 Deutschland 3.25% Ser 05 05/04.07.15 16,367,521.41 16,317,960.00 1.48 EUR 25,300,000 Deutschland 3.25% Ser 09 09/04.01.20 29,178,104.57 29,703,465.00 2.70 EUR 27,000,000 Deutschland 4% Ser 05 05/04.01.37 34,597,359.46 36,261,000.00 3.29 EUR 2,000,000 DG Hypothekenbank AG 3.25% Ser 996 Tr 2 05/15.06.15 2,000,880.00 2,127,000.00 0.19 EUR 33,000,000 Espana 4% 12/30.07.15 33,711,912.22 33,900,900.00 3.08 EUR 42,500,000 Espana 4.1% Sen 08/30.07.18 39,883,916.50 42,935,625.00 3.90 EUR 6,900,000 Espana 4.9% 07/30.07.40 6,207,930.00 6,213,450.00 0.57 EUR 36,000,000 Espana 5.85% 11/31.01.22 36,402,062.35 38,097,000.00 3.46 EUR 12,000,000 European Fin Stability Facilit 1.625% EMTN 12/15.09.17 12,064,640.00 12,390,000.00 1.13 EUR 12,000,000 European Fin Stability Facilit 2% EMTN 12/15.05.17 12,131,740.00 12,576,000.00 1.15 EUR 42,100,000 France 2.5% 10/25.07.16 43,329,380.25 44,920,700.00 4.08 EUR 18,500,000 France 3% 08/12.07.14 19,213,870.25 19,182,280.00 1.74 EUR 66,500,000 France 3.5% T-Bond 10/25.04.26 69,374,888.84 73,951,325.00 6.72 EUR 27,500,000 France 3.75% OAT 07/25.04.17 30,879,208.20 30,947,125.00 2.81 EUR 20,300,000 France 5.5% OAT 98/25.04.29 26,585,683.84 27,634,390.00 2.51 EUR 51,500,000 Italia 3% BTP 10/01.11.15 51,451,168.53 52,045,900.00 4.73 EUR 8,500,000 Italia 3.75% BTP 06/01.08.21 7,872,942.51 8,329,150.00 0.76 EUR 41,000,000 Italia 4% BTP 07/01.02.17 41,116,138.03 42,254,600.00 3.84 EUR 31,700,000 Italia 4.25% BTP 03/01.02.19 32,328,030.52 32,372,040.00 2.94 EUR 8,000,000 Italia 4.75% BOT 08/01.08.23 8,208,000.00 8,081,600.00 0.73 EUR 77,300,000 Italia 5.5% BTP 12/01.11.22 83,103,061.30 82,030,760.00 7.45 EUR 25,800,000 Italia 6% BTP 00/01.05.31 28,819,598.56 28,382,580.00 2.58 EUR 5,700,000 Netherlands 4% 05/15.01.37 7,132,475.45 7,341,073.89 0.67 EUR 44,400,000 Netherlands 4% 09/15.07.19 52,230,010.11 52,556,280.00 4.77 EUR 47,250,000 Oesterreich 3.5% EMTN 06/15.09.21 50,968,058.48 54,760,387.50 4.98 EUR 26,000,000 Oesterreich 4.65% Sen Ser 2 03/15.01.18 29,996,586.34 30,820,400.00 2.80 EUR 5,000,000 UniCredit Bank AG 3.5% Ser 1162 05/03.02.15 4,911,250.00 5,280,000.00 0.48
Total bonds 968,540,902.19 996,392,913.75 90.54
Other transferable securities
Bonds
EUR 60,100,000 Arcade Finance Plc FRN Ser 2008-17 Mez Sec Falco 08/14.05.13
60,107,389.18 60,103,708.17 5.46
EUR 20,150,000 D-Star Finance Plc FRN Ser 2008-5 Mez Sec Falcon 08/14.05.13
20,154,085.65 20,151,243.25 1.83
Total bonds 80,261,474.83 80,254,951.42 7.29
Total investments in securities 1,048,802,377.02 1,076,647,865.17 97.83
Cash at banks 1,707,872.74 0.16
Other net assets/(liabilities) 22,216,242.87 2.01
Total 1,100,571,980.78 100.00
KBC Renta Sekarenta
Investment policy and outlook from 1st October 2012 to 31st March 2013
25
This sub-fund chiefly invests in Swedish government paper supplemented by semi-government issues and high-value Eurobonds. Financial-market turbulence eased in the period under review thanks to European Central Bank intervention. The strong Swedish krona kept inflation low, but also depressed economic growth. This prompted the Riksbank to cut its key rate to 1% to kick-start growth. Swedish ten-year rates rose in the period under review, peaking in February. Various maturity policies were followed in the fund during the reporting period. Note: The information in this report represents historical data and is not an indication of future results.
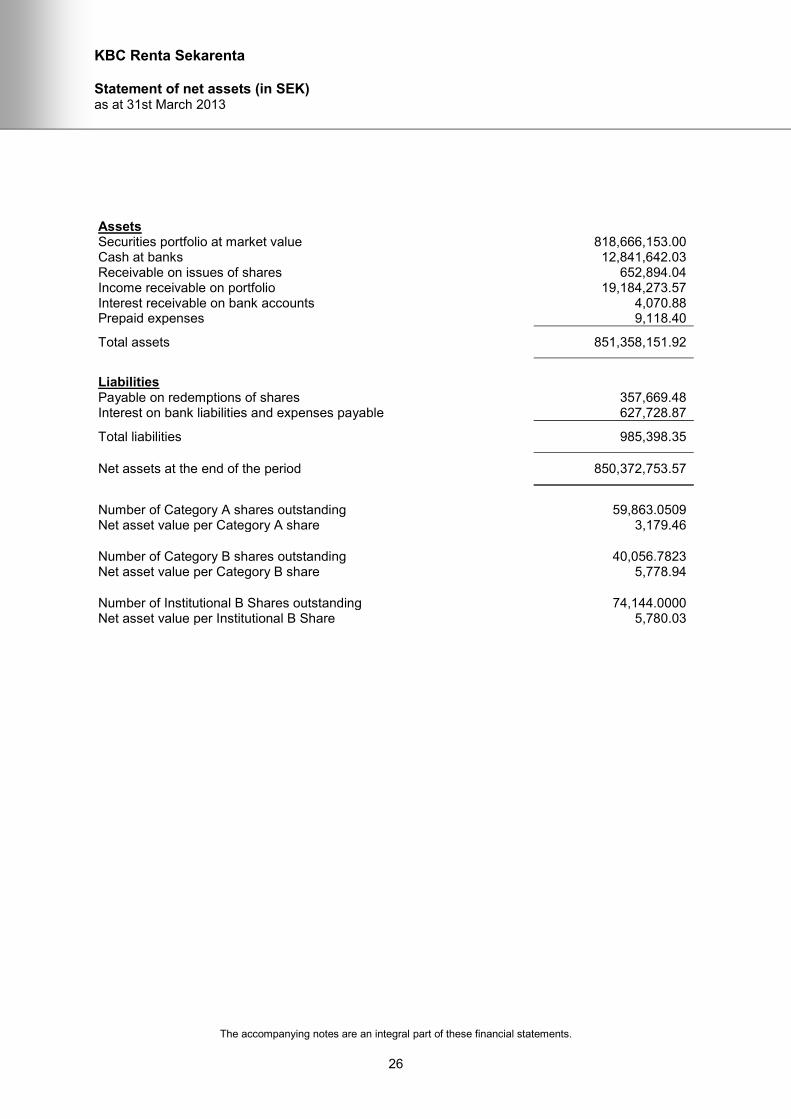
KBC Renta Sekarenta
Statement of net assets (in SEK) as at 31st March 2013
The accompanying notes are an integral part of these financial statements.
26
Assets Securities portfolio at market value 818,666,153.00 Cash at banks 12,841,642.03 Receivable on issues of shares 652,894.04 Income receivable on portfolio 19,184,273.57 Interest receivable on bank accounts 4,070.88 Prepaid expenses 9,118.40
Total assets 851,358,151.92
Liabilities Payable on redemptions of shares 357,669.48 Interest on bank liabilities and expenses payable 627,728.87
Total liabilities 985,398.35
Net assets at the end of the period 850,372,753.57
Number of Category A shares outstanding 59,863.0509 Net asset value per Category A share 3,179.46
Number of Category B shares outstanding 40,056.7823 Net asset value per Category B share 5,778.94
Number of Institutional B Shares outstanding 74,144.0000 Net asset value per Institutional B Share 5,780.03

KBC Renta Sekarenta
Statistical information (in SEK) as at 31st March 2013
The accompanying notes are an integral part of these financial statements.
27
Total net assets
- as at 31.03.2013 850,372,753.57 - as at 30.09.2012 833,234,885.37 - as at 30.09.2011 1,581,416,929.41
Number of Category A shares
- outstanding at the beginning of the period 56,502.5282 - issued 7,672.7511 - redeemed -4,312.2284
- outstanding at the end of the period 59,863.0509
Net asset value per Category A share
- as at 31.03.2013 3,179.46 - as at 30.09.2012 3,296.79 - as at 30.09.2011 3,275.46
Dividend paid
Ex-dividend date 01.10.2012 Dividend per share 70.00 Shares outstanding at dividend date 56,502.5282
Number of Category B shares
- outstanding at the beginning of the period 45,977.9507 - issued 3,548.5867 - redeemed -9,469.7551
- outstanding at the end of the period 40,056.7823
Net asset value per Category B share
- as at 31.03.2013 5,778.94 - as at 30.09.2012 5,864.66 - as at 30.09.2011 5,666.47
Number of Institutional B Shares
- outstanding at the beginning of the period 64,337.0000 - issued 67,173.0000 - redeemed -57,366.0000
- outstanding at the end of the period 74,144.0000
Net asset value per Institutional B Share
- as at 31.03.2013 5,780.03 - as at 30.09.2012 5,864.64 - as at 30.09.2011 -

KBC Renta Sekarenta
Statement of investments and other net assets (in SEK) as at 31st March 2013
The accompanying notes are an integral part of these financial statements.
28
Currency Number / nominal value
Description Cost Market value % of total net assets
Investments in securities
Transferable securities admitted to an official stock exchange listing
Bonds
SEK 12,000,000 EIB 4% EMTN Sen 11/12.07.16 12,355,800.00 12,820,200.00 1.51 SEK 19,000,000 EIB 4.5% EMTN Sen 07/12.08.17 19,931,000.00 20,922,800.00 2.46 SEK 31,000,000 KFW AG 4.75% Reg-S EMTN 08/12.08.15 33,686,296.78 33,329,650.00 3.92 SEK 55,500,000 Sweden 1.5% Reg S 144A-1057 12/13.11.23 54,111,810.00 53,992,065.00 6.35 SEK 17,500,000 Sweden 2.25% Ser 1056 11/01.06.32 17,772,386.96 17,365,075.00 2.04 SEK 54,100,000 Sweden 3% Ser 1050 05/12.07.16 57,646,027.02 57,438,511.00 6.75 SEK 106,100,000 Sweden 3.5% Ser 1054 10/01.06.22 121,891,393.54 122,254,786.00 14.38 SEK 58,000,000 Sweden 3.5% T-Bonds Ser 1053 09/30.03.39 69,201,433.03 68,379,100.00 8.04 SEK 66,000,000 Sweden 3.75% T-Bonds Ser 1051 06/12.08.17 73,524,143.67 73,261,320.00 8.62 SEK 90,000,000 Sweden 4.25% Ser 1052 07/12.03.19 104,027,115.76 104,708,700.00 12.31 SEK 64,500,000 Sweden 4.5% Ser 1049 04/12.08.15 70,922,031.96 69,742,560.00 8.20 SEK 68,600,000 Sweden 5% Ser 1047 04/01.12.20 85,367,579.80 85,487,948.00 10.05 SEK 93,100,000 Sweden 6.75% Ser 1041 97/05.05.14 104,203,226.27 98,963,438.00 11.64
Total investments in securities 824,640,244.79 818,666,153.00 96.27
Cash at banks 12,841,642.03 1.51
Other net assets/(liabilities) 18,864,958.54 2.22
Total 850,372,753.57 100.00
KBC Renta Dollarenta
Investment policy and outlook from 1st October 2012 to 31st March 2013
29
Investors were chiefly looking for returns in the period under review, so the first part of the reporting period was relatively problem-free: US economic numbers were strong and Latin America and Asia did not disappoint either. At the same time, the crisis in Europe became less acute. This favourable climate persisted until the Italian elections, which produced an unexpected political stalemate that briefly panicked investors. The markets recovered quickly, however, and confidence returned. The crisis in Cyprus tested confidence again. Investors responded with less equanimity and subordinated bank bonds had a particularly tough time. In the meantime, the economic news from the US deteriorated and automatic spending cuts were triggered to the tune of 85 billion dollars. Investors are worried that this will undermine further growth. US ten-year yields fell 40 basis points at the beginning of the period under review to 2%. Uncertainty at the end of the reporting period pushed yields down again sharply, almost to the low levels at the beginning of October. The US central bank kept its key rate very low and indicated that this will remain the case for some time yet. Other central banks endorsed the rhetoric coming out of the Fed. The duration was six years. The yield averaged 1.5%. Against this backdrop of extremely low policy rates, low economic growth and stable inflation there will probably be little change in the US yield curve. The fund’s average term to maturity is six years. We will maintain that positioning in the months ahead. Note: The information in this report represents historical data and is not an indication of future results.

KBC Renta Dollarenta
Statement of net assets (in USD) as at 31st March 2013
The accompanying notes are an integral part of these financial statements.
30
Assets Securities portfolio at market value 58,264,859.64 Cash at banks 984,901.26 Other liquid assets 108,343.04 Receivable on issues of shares 6,074.93 Income receivable on portfolio 318,065.42 Unrealised gain on future contracts 77,991.91 Unrealised gain on forward foreign exchange contracts 51,125.40 Prepaid expenses 609.21
Total assets 59,811,970.81
Liabilities Bank liabilities 4.55 Other liquid liabilities 0.09 Payable on redemptions of shares 30,308.99 Interest on bank liabilities and expenses payable 49,154.24
Total liabilities 79,467.87
Net assets at the end of the period 59,732,502.94
Number of Category A shares outstanding 23,509.5229 Net asset value per Category A share 526.13
Number of Category B shares outstanding 28,944.9900 Net asset value per Category B share 1,078.74
Number of Institutional B Shares outstanding 14,952.0000 Net asset value per Institutional B Share 1,079.42

KBC Renta Dollarenta
Statistical information (in USD) as at 31st March 2013
The accompanying notes are an integral part of these financial statements.
31
Total net assets
- as at 31.03.2013 59,732,502.94 - as at 30.09.2012 56,013,959.89 - as at 30.09.2011 747,717,064.50
Number of Category A shares
- outstanding at the beginning of the period 25,717.9762 - issued 522.0000 - redeemed -2,730.4533
- outstanding at the end of the period 23,509.5229
Net asset value per Category A share
- as at 31.03.2013 526.13 - as at 30.09.2012 541.11 - as at 30.09.2011 539.47
Dividend paid
Ex-dividend date 01.10.2012 Dividend per share 11.00 Shares outstanding at dividend date 25,717.9762
Number of Category B shares
- outstanding at the beginning of the period 29,314.9901 - issued 3,542.2510 - redeemed -3,912.2511
- outstanding at the end of the period 28,944.9900
Net asset value per Category B share
- as at 31.03.2013 1,078.74 - as at 30.09.2012 1,086.87 - as at 30.09.2011 1,056.40
Number of Institutional B Shares
- outstanding at the beginning of the period 9,414.0000 - issued 6,637.0000 - redeemed -1,099.0000
- outstanding at the end of the period 14,952.0000
Net asset value per Institutional B Share
- as at 31.03.2013 1,079.42 - as at 30.09.2012 1,087.35 - as at 30.09.2011 -
KBC Renta Dollarenta
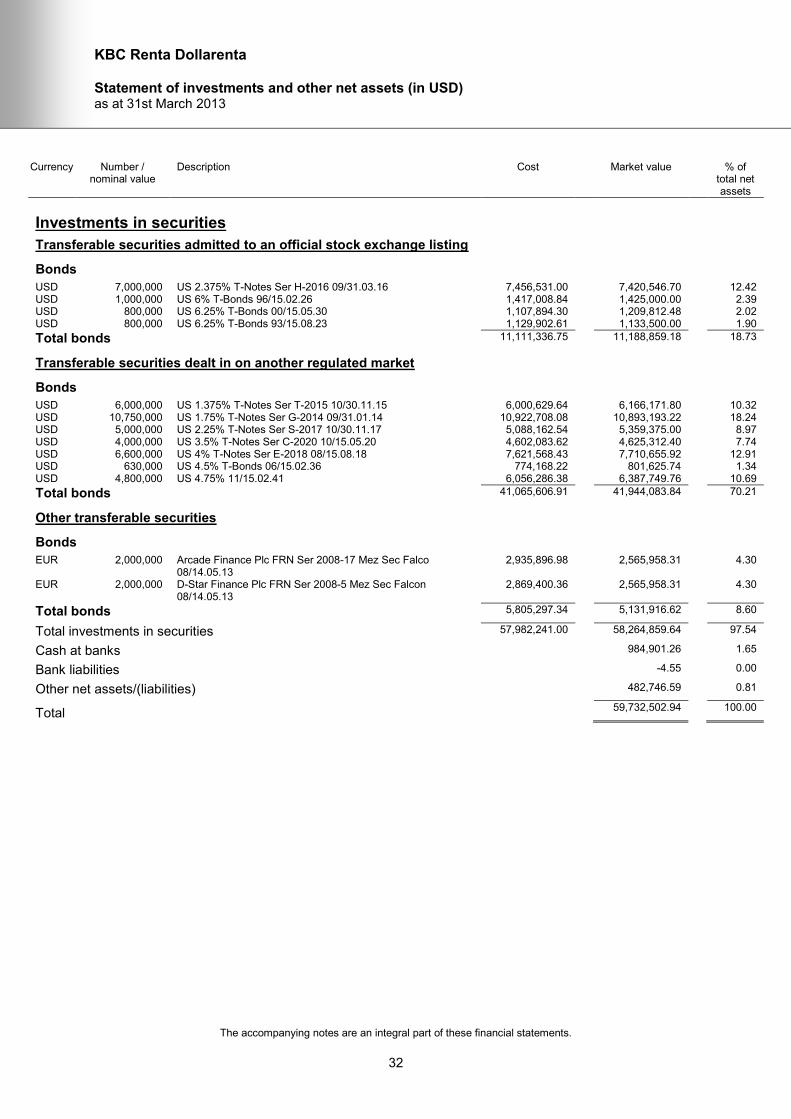
Statement of investments and other net assets (in USD) as at 31st March 2013
The accompanying notes are an integral part of these financial statements.
32
Currency Number / nominal value
Description Cost Market value % of total net assets
Investments in securities
Transferable securities admitted to an official stock exchange listing
Bonds
USD 7,000,000 US 2.375% T-Notes Ser H-2016 09/31.03.16 7,456,531.00 7,420,546.70 12.42 USD 1,000,000 US 6% T-Bonds 96/15.02.26 1,417,008.84 1,425,000.00 2.39 USD 800,000 US 6.25% T-Bonds 00/15.05.30 1,107,894.30 1,209,812.48 2.02 USD 800,000 US 6.25% T-Bonds 93/15.08.23 1,129,902.61 1,133,500.00 1.90
Total bonds 11,111,336.75 11,188,859.18 18.73
Transferable securities dealt in on another regulated market
Bonds
USD 6,000,000 US 1.375% T-Notes Ser T-2015 10/30.11.15 6,000,629.64 6,166,171.80 10.32 USD 10,750,000 US 1.75% T-Notes Ser G-2014 09/31.01.14 10,922,708.08 10,893,193.22 18.24 USD 5,000,000 US 2.25% T-Notes Ser S-2017 10/30.11.17 5,088,162.54 5,359,375.00 8.97 USD 4,000,000 US 3.5% T-Notes Ser C-2020 10/15.05.20 4,602,083.62 4,625,312.40 7.74 USD 6,600,000 US 4% T-Notes Ser E-2018 08/15.08.18 7,621,568.43 7,710,655.92 12.91 USD 630,000 US 4.5% T-Bonds 06/15.02.36 774,168.22 801,625.74 1.34 USD 4,800,000 US 4.75% 11/15.02.41 6,056,286.38 6,387,749.76 10.69
Total bonds 41,065,606.91 41,944,083.84 70.21
Other transferable securities
Bonds
EUR 2,000,000 Arcade Finance Plc FRN Ser 2008-17 Mez Sec Falco 08/14.05.13
2,935,896.98 2,565,958.31 4.30
EUR 2,000,000 D-Star Finance Plc FRN Ser 2008-5 Mez Sec Falcon 08/14.05.13
2,869,400.36 2,565,958.31 4.30
Total bonds 5,805,297.34 5,131,916.62 8.60
Total investments in securities 57,982,241.00 58,264,859.64 97.54
Cash at banks 984,901.26 1.65
Bank liabilities -4.55 0.00
Other net assets/(liabilities) 482,746.59 0.81
Total 59,732,502.94 100.00
KBC Renta Yenrenta
Investment policy and outlook from 1st October 2012 to 31st March 2013
33
Investors were chiefly looking for returns in the period under review, so the first part of the reporting period was relatively problem-free: US economic numbers were strong and Latin America and Asia did not disappoint either. At the same time, the crisis in Europe became less acute. Central banks kept policy rates low. The new government in Japan kept its campaign promise and approved an economic support package worth 10,000.00 billion yen (78 billion euros), half of which is to be funded through additional borrowing. The new prime minister, Shinzo Abe, has made it his goal to lead Japan out of recession. He received support from the Bank of Japan, which eased its monetary policy sharply and launched a substantial programme to buy government bonds. The yield curve responded to these events by flattening out significantly by Japanese standards. The announced purchases triggered an especially sharp fall at the long end of the curve, with 20-year yields dipping 50 basis points to 1.4%. Ten-year rates finished at 0.6% and two-year rates at 0.05%. The fund’s average term to maturity was eight years. We will maintain this positioning in the months ahead. Note: The information in this report represents historical data and is not an indication of future results.
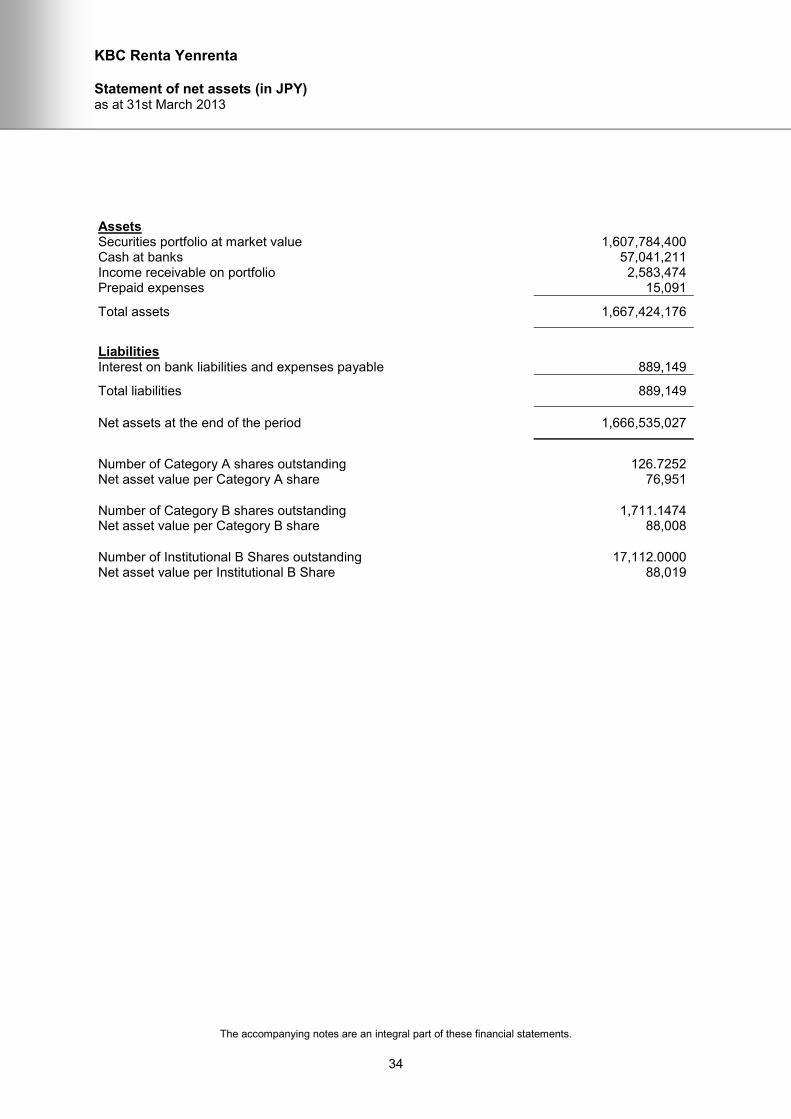
KBC Renta Yenrenta
Statement of net assets (in JPY) as at 31st March 2013
The accompanying notes are an integral part of these financial statements.
34
Assets Securities portfolio at market value 1,607,784,400 Cash at banks 57,041,211 Income receivable on portfolio 2,583,474 Prepaid expenses 15,091
Total assets 1,667,424,176
Liabilities Interest on bank liabilities and expenses payable 889,149
Total liabilities 889,149
Net assets at the end of the period 1,666,535,027
Number of Category A shares outstanding 126.7252 Net asset value per Category A share 76,951
Number of Category B shares outstanding 1,711.1474 Net asset value per Category B share 88,008
Number of Institutional B Shares outstanding 17,112.0000 Net asset value per Institutional B Share 88,019

KBC Renta Yenrenta
Statistical information (in JPY) as at 31st March 2013
The accompanying notes are an integral part of these financial statements.
35
Total net assets
- as at 31.03.2013 1,666,535,027 - as at 30.09.2012 53,190,814 - as at 30.09.2011 10,087,612,908
Number of Category A shares
- outstanding at the beginning of the period 224.7252 - issued 0.0000 - redeemed -98.0000
- outstanding at the end of the period 126.7252
Net asset value per Category A share
- as at 31.03.2013 76,951 - as at 30.09.2012 76,037 - as at 30.09.2011 72,179
Dividend paid
Ex-dividend date 01.10.2012 Dividend per share 925 Shares outstanding at dividend date 224.7252
Number of Category B shares
- outstanding at the beginning of the period 420.3008 - issued 1,623.8468 - redeemed -333.0002
- outstanding at the end of the period 1,711.1474
Net asset value per Category B share
- as at 31.03.2013 88,008 - as at 30.09.2012 85,899 - as at 30.09.2011 80,412
Number of Institutional B Shares
- outstanding at the beginning of the period 0.0000 - issued 18,729.0000 - redeemed -1,617.0000
- outstanding at the end of the period 17,112.0000
Net asset value per Institutional B Share
- as at 31.03.2013 88,019 - as at 30.09.2012 - - as at 30.09.2011 -
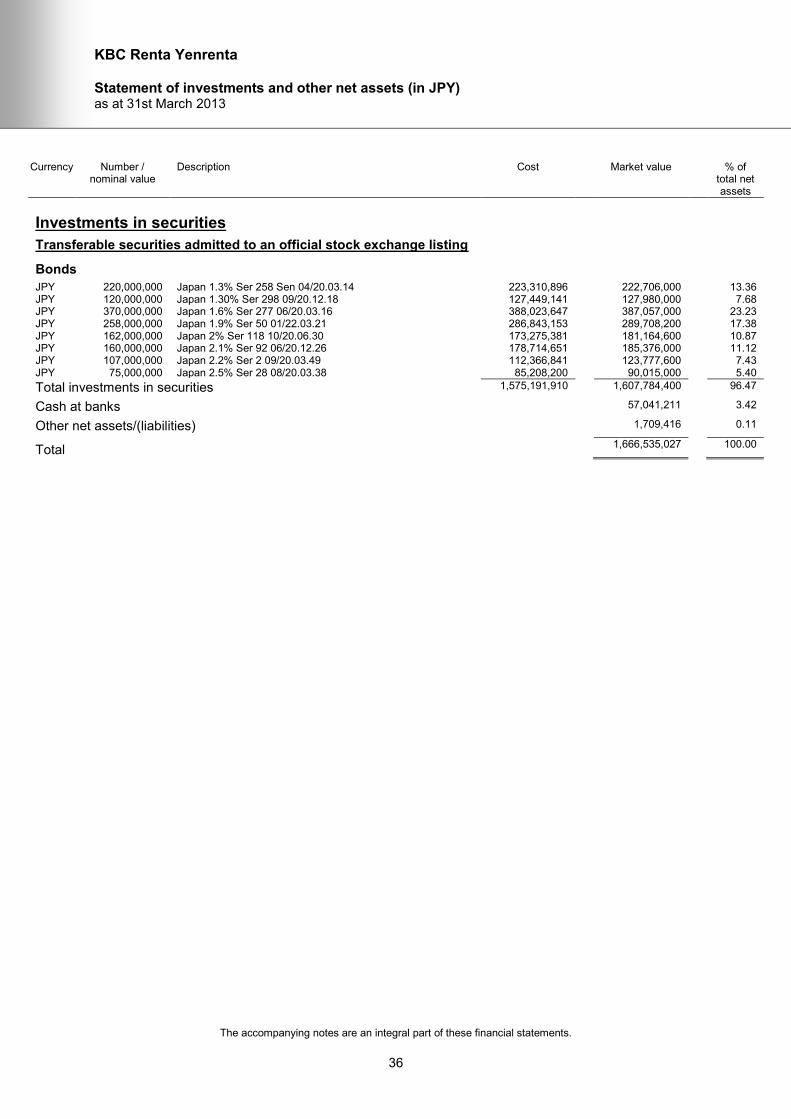
KBC Renta Yenrenta
Statement of investments and other net assets (in JPY) as at 31st March 2013
The accompanying notes are an integral part of these financial statements.
36
Currency Number / nominal value
Description Cost Market value % of total net assets
Investments in securities
Transferable securities admitted to an official stock exchange listing
Bonds
JPY 220,000,000 Japan 1.3% Ser 258 Sen 04/20.03.14 223,310,896 222,706,000 13.36 JPY 120,000,000 Japan 1.30% Ser 298 09/20.12.18 127,449,141 127,980,000 7.68 JPY 370,000,000 Japan 1.6% Ser 277 06/20.03.16 388,023,647 387,057,000 23.23 JPY 258,000,000 Japan 1.9% Ser 50 01/22.03.21 286,843,153 289,708,200 17.38 JPY 162,000,000 Japan 2% Ser 118 10/20.06.30 173,275,381 181,164,600 10.87 JPY 160,000,000 Japan 2.1% Ser 92 06/20.12.26 178,714,651 185,376,000 11.12 JPY 107,000,000 Japan 2.2% Ser 2 09/20.03.49 112,366,841 123,777,600 7.43 JPY 75,000,000 Japan 2.5% Ser 28 08/20.03.38 85,208,200 90,015,000 5.40
Total investments in securities 1,575,191,910 1,607,784,400 96.47
Cash at banks 57,041,211 3.42
Other net assets/(liabilities) 1,709,416 0.11
Total 1,666,535,027 100.00
KBC Renta Canarenta
Investment policy and outlook from 1st October 2012 to 31st March 2013
37
This sub-fund chiefly invests in Canadian government paper supplemented by a limited number of semi-government bonds and high-value Eurobonds. The Canadian economy continued to grow steadily in the first half of the financial year, underpinned by strong domestic demand. The strength of the Canadian dollar, however, continued to weigh on exports. As a result, the central bank held its key rate at 1%. Bond yields therefore tended to mark time. The sub-fund was nevertheless able to benefit from the positive spread between government paper and semi-government bonds and Eurobonds. Having appreciated substantially against the euro in previous financial years, the Canadian dollar depreciated slightly, which was to the disadvantage of European investors. As for the coming financial year, we expect the central bank to await further recovery in the US before raising its key rate. Both short and long rates could therefore remain low for some time yet, and we only expect a slight increase toward the end of the financial year. The positive spread between government bonds and semi-government paper/Eurobonds ought to contribute, however, to the return over the financial year as a whole. Note: The information in this report represents historical data and is not an indication of future results.
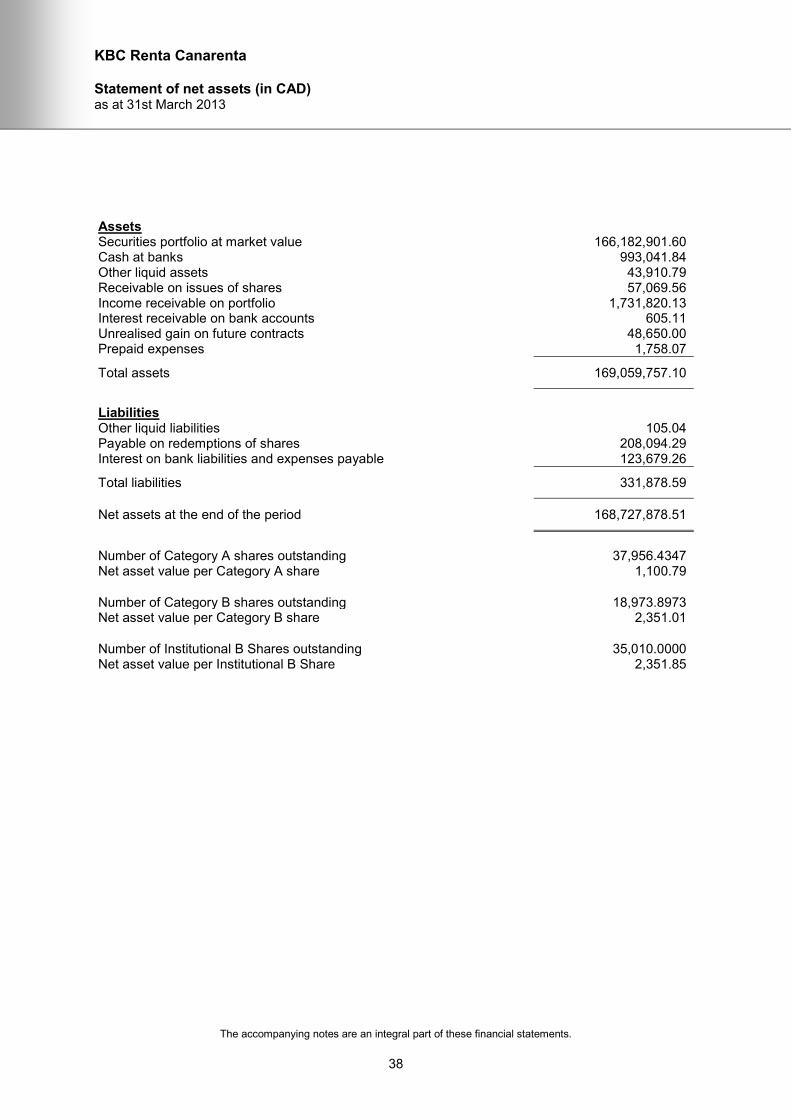
KBC Renta Canarenta
Statement of net assets (in CAD) as at 31st March 2013
The accompanying notes are an integral part of these financial statements.
38
Assets Securities portfolio at market value 166,182,901.60 Cash at banks 993,041.84 Other liquid assets 43,910.79 Receivable on issues of shares 57,069.56 Income receivable on portfolio 1,731,820.13 Interest receivable on bank accounts 605.11 Unrealised gain on future contracts 48,650.00 Prepaid expenses 1,758.07
Total assets 169,059,757.10
Liabilities Other liquid liabilities 105.04 Payable on redemptions of shares 208,094.29 Interest on bank liabilities and expenses payable 123,679.26
Total liabilities 331,878.59
Net assets at the end of the period 168,727,878.51
Number of Category A shares outstanding 37,956.4347 Net asset value per Category A share 1,100.79
Number of Category B shares outstanding 18,973.8973 Net asset value per Category B share 2,351.01
Number of Institutional B Shares outstanding 35,010.0000 Net asset value per Institutional B Share 2,351.85
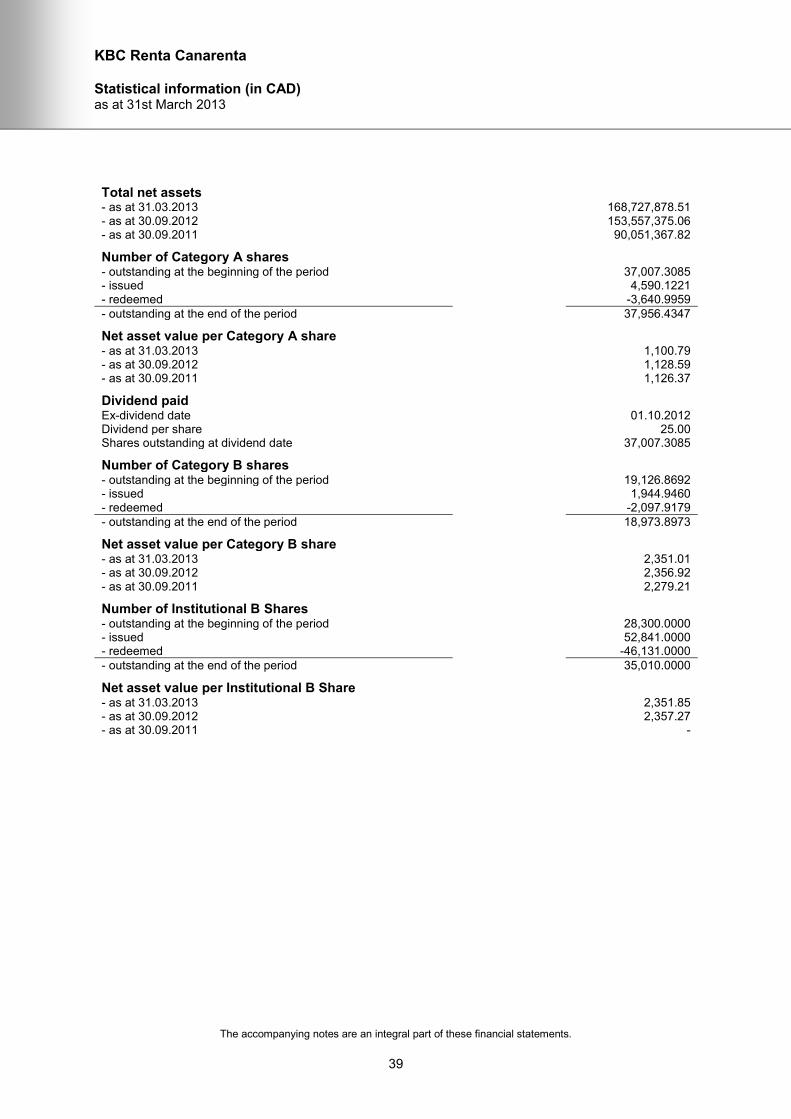
KBC Renta Canarenta
Statistical information (in CAD) as at 31st March 2013
The accompanying notes are an integral part of these financial statements.
39
Total net assets
- as at 31.03.2013 168,727,878.51 - as at 30.09.2012 153,557,375.06 - as at 30.09.2011 90,051,367.82
Number of Category A shares
- outstanding at the beginning of the period 37,007.3085 - issued 4,590.1221 - redeemed -3,640.9959
- outstanding at the end of the period 37,956.4347
Net asset value per Category A share
- as at 31.03.2013 1,100.79 - as at 30.09.2012 1,128.59 - as at 30.09.2011 1,126.37
Dividend paid
Ex-dividend date 01.10.2012 Dividend per share 25.00 Shares outstanding at dividend date 37,007.3085
Number of Category B shares
- outstanding at the beginning of the period 19,126.8692 - issued 1,944.9460 - redeemed -2,097.9179
- outstanding at the end of the period 18,973.8973
Net asset value per Category B share
- as at 31.03.2013 2,351.01 - as at 30.09.2012 2,356.92 - as at 30.09.2011 2,279.21
Number of Institutional B Shares
- outstanding at the beginning of the period 28,300.0000 - issued 52,841.0000 - redeemed -46,131.0000
- outstanding at the end of the period 35,010.0000
Net asset value per Institutional B Share
- as at 31.03.2013 2,351.85 - as at 30.09.2012 2,357.27 - as at 30.09.2011 -
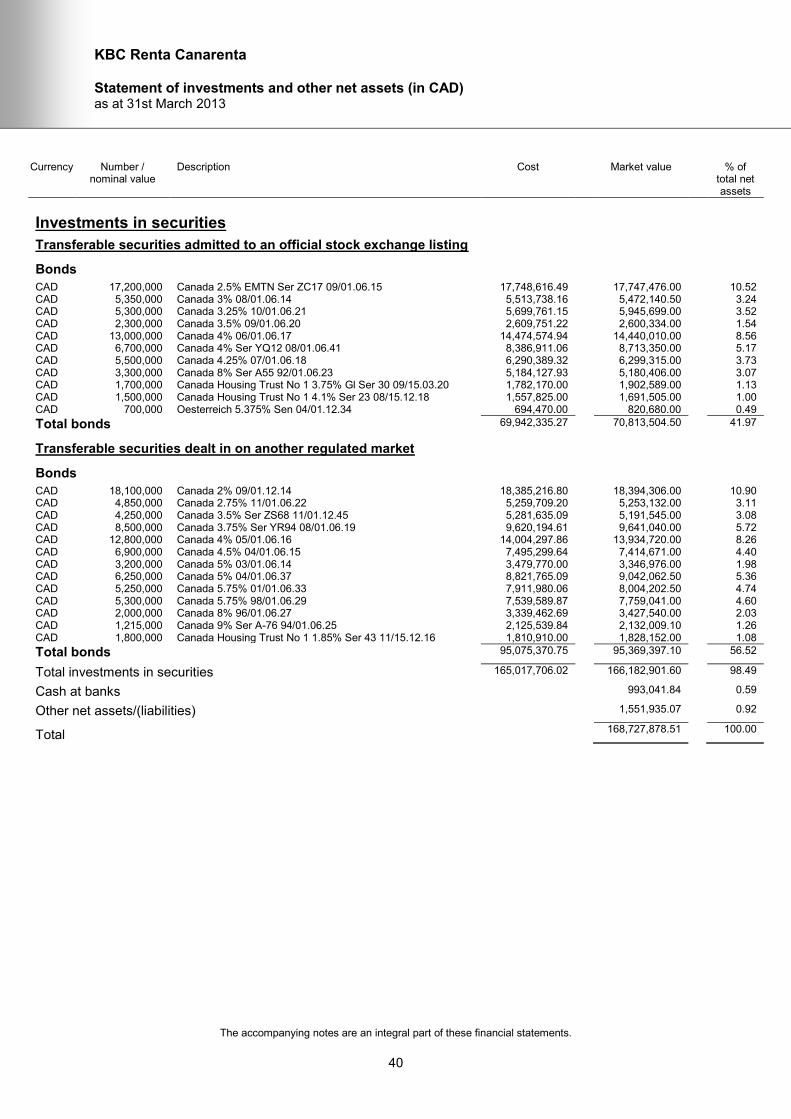
KBC Renta Canarenta
Statement of investments and other net assets (in CAD) as at 31st March 2013
The accompanying notes are an integral part of these financial statements.
40
Currency Number / nominal value
Description Cost Market value % of total net assets
Investments in securities
Transferable securities admitted to an official stock exchange listing
Bonds
CAD 17,200,000 Canada 2.5% EMTN Ser ZC17 09/01.06.15 17,748,616.49 17,747,476.00 10.52 CAD 5,350,000 Canada 3% 08/01.06.14 5,513,738.16 5,472,140.50 3.24 CAD 5,300,000 Canada 3.25% 10/01.06.21 5,699,761.15 5,945,699.00 3.52 CAD 2,300,000 Canada 3.5% 09/01.06.20 2,609,751.22 2,600,334.00 1.54 CAD 13,000,000 Canada 4% 06/01.06.17 14,474,574.94 14,440,010.00 8.56 CAD 6,700,000 Canada 4% Ser YQ12 08/01.06.41 8,386,911.06 8,713,350.00 5.17 CAD 5,500,000 Canada 4.25% 07/01.06.18 6,290,389.32 6,299,315.00 3.73 CAD 3,300,000 Canada 8% Ser A55 92/01.06.23 5,184,127.93 5,180,406.00 3.07 CAD 1,700,000 Canada Housing Trust No 1 3.75% Gl Ser 30 09/15.03.20 1,782,170.00 1,902,589.00 1.13 CAD 1,500,000 Canada Housing Trust No 1 4.1% Ser 23 08/15.12.18 1,557,825.00 1,691,505.00 1.00 CAD 700,000 Oesterreich 5.375% Sen 04/01.12.34 694,470.00 820,680.00 0.49
Total bonds 69,942,335.27 70,813,504.50 41.97
Transferable securities dealt in on another regulated market
Bonds
CAD 18,100,000 Canada 2% 09/01.12.14 18,385,216.80 18,394,306.00 10.90 CAD 4,850,000 Canada 2.75% 11/01.06.22 5,259,709.20 5,253,132.00 3.11 CAD 4,250,000 Canada 3.5% Ser ZS68 11/01.12.45 5,281,635.09 5,191,545.00 3.08 CAD 8,500,000 Canada 3.75% Ser YR94 08/01.06.19 9,620,194.61 9,641,040.00 5.72 CAD 12,800,000 Canada 4% 05/01.06.16 14,004,297.86 13,934,720.00 8.26 CAD 6,900,000 Canada 4.5% 04/01.06.15 7,495,299.64 7,414,671.00 4.40 CAD 3,200,000 Canada 5% 03/01.06.14 3,479,770.00 3,346,976.00 1.98 CAD 6,250,000 Canada 5% 04/01.06.37 8,821,765.09 9,042,062.50 5.36 CAD 5,250,000 Canada 5.75% 01/01.06.33 7,911,980.06 8,004,202.50 4.74 CAD 5,300,000 Canada 5.75% 98/01.06.29 7,539,589.87 7,759,041.00 4.60 CAD 2,000,000 Canada 8% 96/01.06.27 3,339,462.69 3,427,540.00 2.03 CAD 1,215,000 Canada 9% Ser A-76 94/01.06.25 2,125,539.84 2,132,009.10 1.26 CAD 1,800,000 Canada Housing Trust No 1 1.85% Ser 43 11/15.12.16 1,810,910.00 1,828,152.00 1.08
Total bonds 95,075,370.75 95,369,397.10 56.52
Total investments in securities 165,017,706.02 166,182,901.60 98.49
Cash at banks 993,041.84 0.59
Other net assets/(liabilities) 1,551,935.07 0.92
Total 168,727,878.51 100.00
KBC Renta Sterlingrenta
Investment policy and outlook from 1st October 2012 to 31st March 2013
41
This sub-fund chiefly invests in British government paper supplemented by a limited number of high-value Eurobonds. The British economy has been badly affected by the crisis in the euro area. This obliged the Bank of England to hold its key rate low and to continue its policy of quantitative easing, despite high inflation. Sterling depreciated against the euro the period under review (-5.7%). The British bond market generated a small positive return (+0.29%). A neutral maturity strategy was pursued in the fund in view of weak economic growth. Note: The information in this report represents historical data and is not an indication of future results.
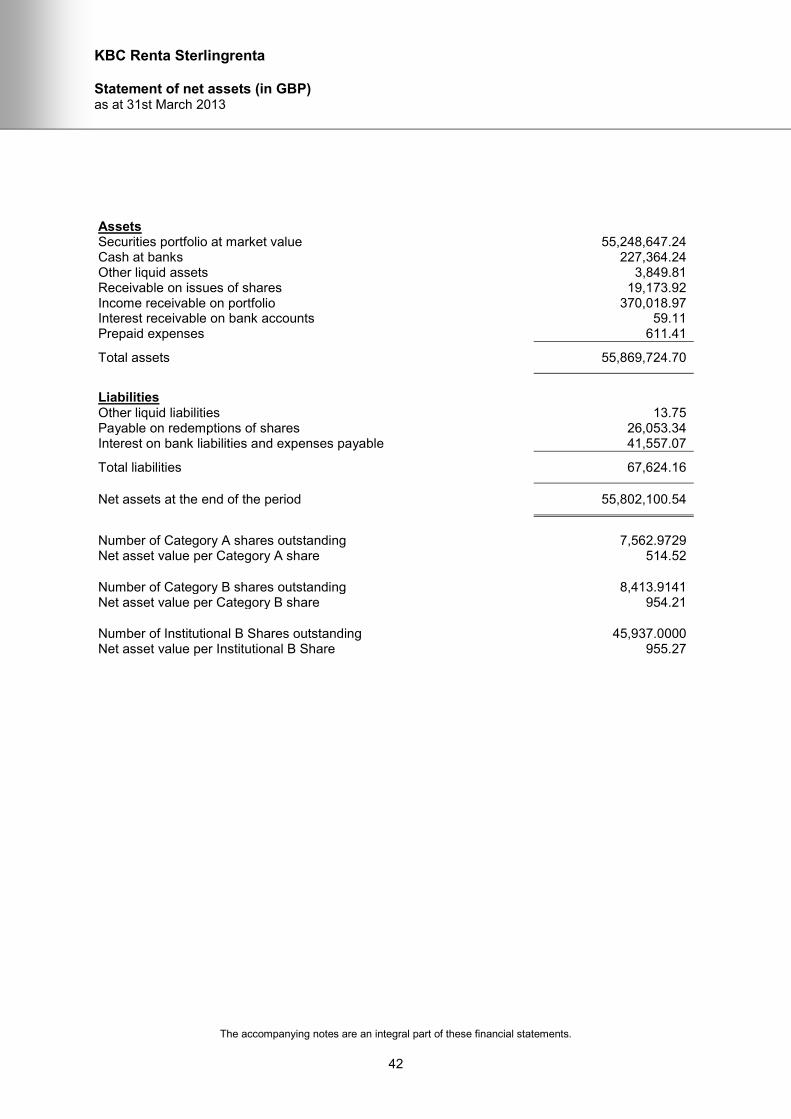
KBC Renta Sterlingrenta
Statement of net assets (in GBP) as at 31st March 2013
The accompanying notes are an integral part of these financial statements.
42
Assets Securities portfolio at market value 55,248,647.24 Cash at banks 227,364.24 Other liquid assets 3,849.81 Receivable on issues of shares 19,173.92 Income receivable on portfolio 370,018.97 Interest receivable on bank accounts 59.11 Prepaid expenses 611.41
Total assets 55,869,724.70
Liabilities Other liquid liabilities 13.75 Payable on redemptions of shares 26,053.34 Interest on bank liabilities and expenses payable 41,557.07
Total liabilities 67,624.16
Net assets at the end of the period 55,802,100.54
Number of Category A shares outstanding 7,562.9729 Net asset value per Category A share 514.52
Number of Category B shares outstanding 8,413.9141 Net asset value per Category B share 954.21
Number of Institutional B Shares outstanding 45,937.0000 Net asset value per Institutional B Share 955.27
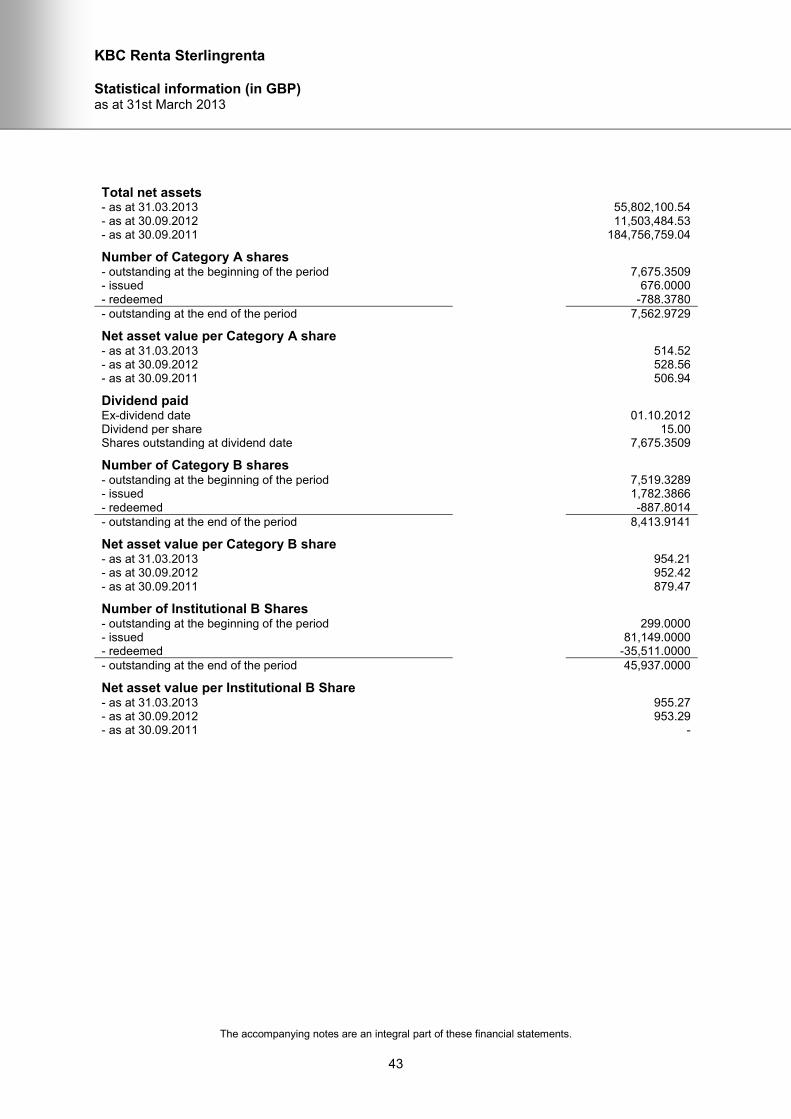
KBC Renta Sterlingrenta
Statistical information (in GBP) as at 31st March 2013
The accompanying notes are an integral part of these financial statements.
43
Total net assets
- as at 31.03.2013 55,802,100.54 - as at 30.09.2012 11,503,484.53 - as at 30.09.2011 184,756,759.04
Number of Category A shares
- outstanding at the beginning of the period 7,675.3509 - issued 676.0000 - redeemed -788.3780
- outstanding at the end of the period 7,562.9729
Net asset value per Category A share
- as at 31.03.2013 514.52 - as at 30.09.2012 528.56 - as at 30.09.2011 506.94
Dividend paid
Ex-dividend date 01.10.2012 Dividend per share 15.00 Shares outstanding at dividend date 7,675.3509
Number of Category B shares
- outstanding at the beginning of the period 7,519.3289 - issued 1,782.3866 - redeemed -887.8014
- outstanding at the end of the period 8,413.9141
Net asset value per Category B share
- as at 31.03.2013 954.21 - as at 30.09.2012 952.42 - as at 30.09.2011 879.47
Number of Institutional B Shares
- outstanding at the beginning of the period 299.0000 - issued 81,149.0000 - redeemed -35,511.0000
- outstanding at the end of the period 45,937.0000
Net asset value per Institutional B Share
- as at 31.03.2013 955.27 - as at 30.09.2012 953.29 - as at 30.09.2011 -
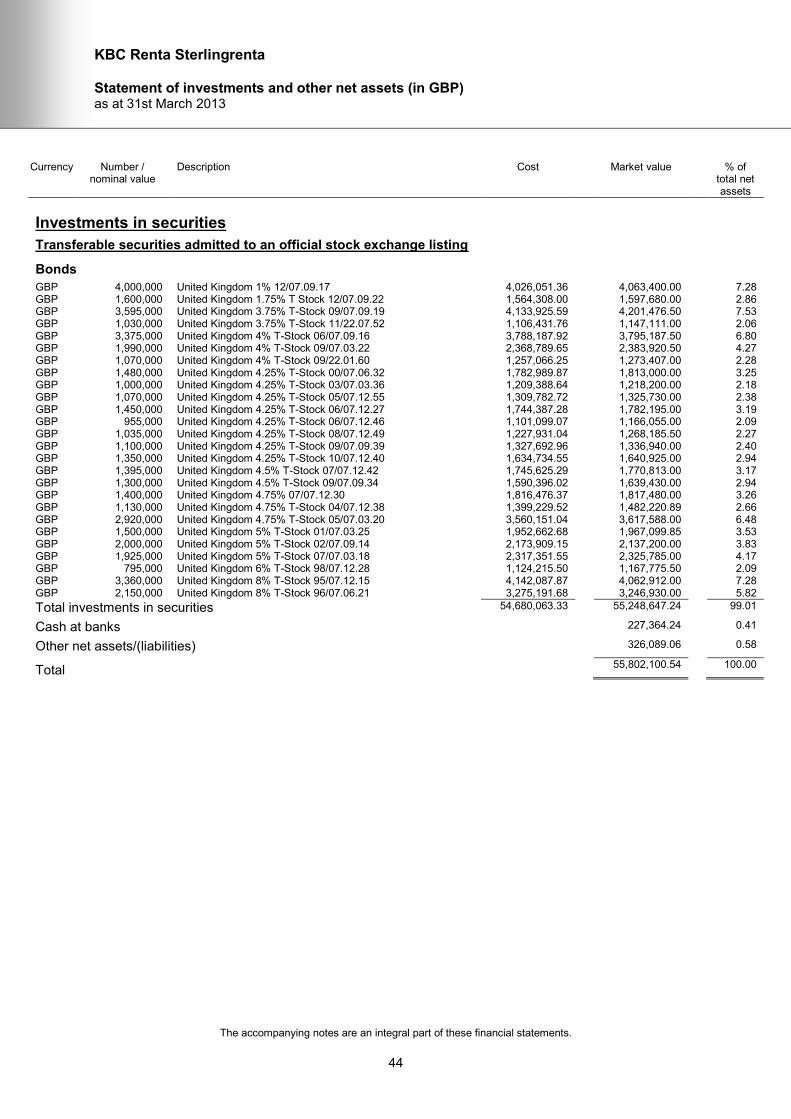
KBC Renta Sterlingrenta
Statement of investments and other net assets (in GBP) as at 31st March 2013
The accompanying notes are an integral part of these financial statements.
44
Currency Number / nominal value
Description Cost Market value % of total net assets
Investments in securities
Transferable securities admitted to an official stock exchange listing
Bonds
GBP 4,000,000 United Kingdom 1% 12/07.09.17 4,026,051.36 4,063,400.00 7.28 GBP 1,600,000 United Kingdom 1.75% T Stock 12/07.09.22 1,564,308.00 1,597,680.00 2.86 GBP 3,595,000 United Kingdom 3.75% T-Stock 09/07.09.19 4,133,925.59 4,201,476.50 7.53 GBP 1,030,000 United Kingdom 3.75% T-Stock 11/22.07.52 1,106,431.76 1,147,111.00 2.06 GBP 3,375,000 United Kingdom 4% T-Stock 06/07.09.16 3,788,187.92 3,795,187.50 6.80 GBP 1,990,000 United Kingdom 4% T-Stock 09/07.03.22 2,368,789.65 2,383,920.50 4.27 GBP 1,070,000 United Kingdom 4% T-Stock 09/22.01.60 1,257,066.25 1,273,407.00 2.28 GBP 1,480,000 United Kingdom 4.25% T-Stock 00/07.06.32 1,782,989.87 1,813,000.00 3.25 GBP 1,000,000 United Kingdom 4.25% T-Stock 03/07.03.36 1,209,388.64 1,218,200.00 2.18 GBP 1,070,000 United Kingdom 4.25% T-Stock 05/07.12.55 1,309,782.72 1,325,730.00 2.38 GBP 1,450,000 United Kingdom 4.25% T-Stock 06/07.12.27 1,744,387.28 1,782,195.00 3.19 GBP 955,000 United Kingdom 4.25% T-Stock 06/07.12.46 1,101,099.07 1,166,055.00 2.09 GBP 1,035,000 United Kingdom 4.25% T-Stock 08/07.12.49 1,227,931.04 1,268,185.50 2.27 GBP 1,100,000 United Kingdom 4.25% T-Stock 09/07.09.39 1,327,692.96 1,336,940.00 2.40 GBP 1,350,000 United Kingdom 4.25% T-Stock 10/07.12.40 1,634,734.55 1,640,925.00 2.94 GBP 1,395,000 United Kingdom 4.5% T-Stock 07/07.12.42 1,745,625.29 1,770,813.00 3.17 GBP 1,300,000 United Kingdom 4.5% T-Stock 09/07.09.34 1,590,396.02 1,639,430.00 2.94 GBP 1,400,000 United Kingdom 4.75% 07/07.12.30 1,816,476.37 1,817,480.00 3.26 GBP 1,130,000 United Kingdom 4.75% T-Stock 04/07.12.38 1,399,229.52 1,482,220.89 2.66 GBP 2,920,000 United Kingdom 4.75% T-Stock 05/07.03.20 3,560,151.04 3,617,588.00 6.48 GBP 1,500,000 United Kingdom 5% T-Stock 01/07.03.25 1,952,662.68 1,967,099.85 3.53 GBP 2,000,000 United Kingdom 5% T-Stock 02/07.09.14 2,173,909.15 2,137,200.00 3.83 GBP 1,925,000 United Kingdom 5% T-Stock 07/07.03.18 2,317,351.55 2,325,785.00 4.17 GBP 795,000 United Kingdom 6% T-Stock 98/07.12.28 1,124,215.50 1,167,775.50 2.09 GBP 3,360,000 United Kingdom 8% T-Stock 95/07.12.15 4,142,087.87 4,062,912.00 7.28 GBP 2,150,000 United Kingdom 8% T-Stock 96/07.06.21 3,275,191.68 3,246,930.00 5.82
Total investments in securities 54,680,063.33 55,248,647.24 99.01
Cash at banks 227,364.24 0.41
Other net assets/(liabilities) 326,089.06 0.58
Total 55,802,100.54 100.00
KBC Renta Swissrenta
Investment policy and outlook from 1st October 2012 to 31st March 2013
45
This sub-fund invests in CHF-denominated paper from high-quality issuers. The fund maintains a relatively neutral exposure to interest rates and aims to deliver a return close to the benchmark, with low tracking error. The overall interest rate environment is one of low interest rates, a situation we expect to continue for the near future. The benchmark interest rate is set at 0.00%, with a target range between 0.00% and 0.25%. At the same time, the Swiss National Bank is holding the ceiling at 1.20 CHF per EUR and remains committed to preventing any appreciation of the CHF, which would pose a very substantial threat to the economy and spark off the risk of deflation. Inflation is still not a threat, but economic growth, both globally and in Switzerland, remains rather weak. The GDP forecasts by the Swiss National Bank for 2013 are in the 1.0% to 1.5% range. The countercyclical requirement for lenders to hold large capital buffers for residential mortgage loans was activated on 13th February 2013. The measure is intended to strengthen banks’ resilience and to counter imbalances on the mortgage and real estate markets. The continuing strong momentum in the Swiss housing market remains a source of concern for financial stability. Note: The information in this report represents historical data and is not an indication of future results.
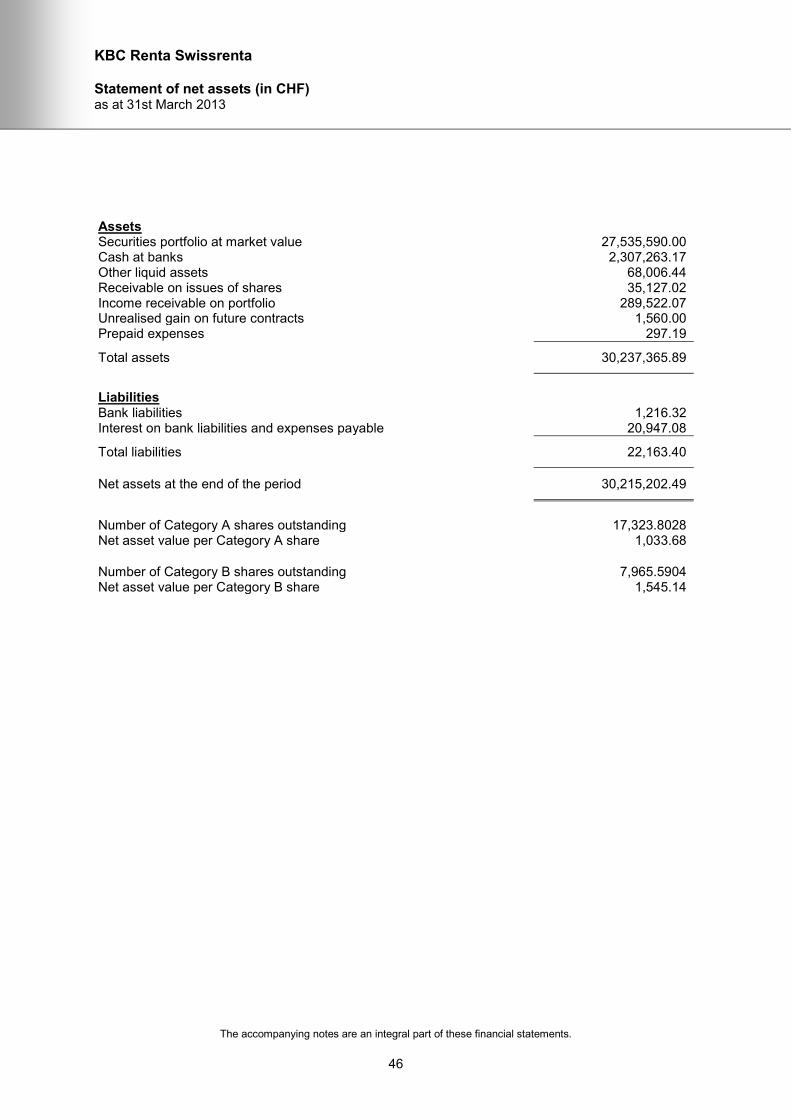
KBC Renta Swissrenta
Statement of net assets (in CHF) as at 31st March 2013
The accompanying notes are an integral part of these financial statements.
46
Assets Securities portfolio at market value 27,535,590.00 Cash at banks 2,307,263.17 Other liquid assets 68,006.44 Receivable on issues of shares 35,127.02 Income receivable on portfolio 289,522.07 Unrealised gain on future contracts 1,560.00 Prepaid expenses 297.19
Total assets 30,237,365.89
Liabilities Bank liabilities 1,216.32 Interest on bank liabilities and expenses payable 20,947.08
Total liabilities 22,163.40
Net assets at the end of the period 30,215,202.49
Number of Category A shares outstanding 17,323.8028 Net asset value per Category A share 1,033.68
Number of Category B shares outstanding 7,965.5904 Net asset value per Category B share 1,545.14

KBC Renta Swissrenta
Statistical information (in CHF) as at 31st March 2013
The accompanying notes are an integral part of these financial statements.
47
Total net assets
- as at 31.03.2013 30,215,202.49 - as at 30.09.2012 25,576,795.67 - as at 30.09.2011 24,801,256.60
Number of Category A shares
- outstanding at the beginning of the period 13,954.1482 - issued 4,005.4075 - redeemed -635.7529
- outstanding at the end of the period 17,323.8028
Net asset value per Category A share
- as at 31.03.2013 1,033.68 - as at 30.09.2012 1,054.89 - as at 30.09.2011 1,037.14
Dividend paid
Ex-dividend date 01.10.2012 Dividend per share 15.00 Shares outstanding at dividend date 13,954.1482
Number of Category B shares
- outstanding at the beginning of the period 6,984.5859 - issued 1,425.4704 - redeemed -444.4659
- outstanding at the end of the period 7,965.5904
Net asset value per Category B share
- as at 31.03.2013 1,545.14 - as at 30.09.2012 1,554.37 - as at 30.09.2011 1,498.78
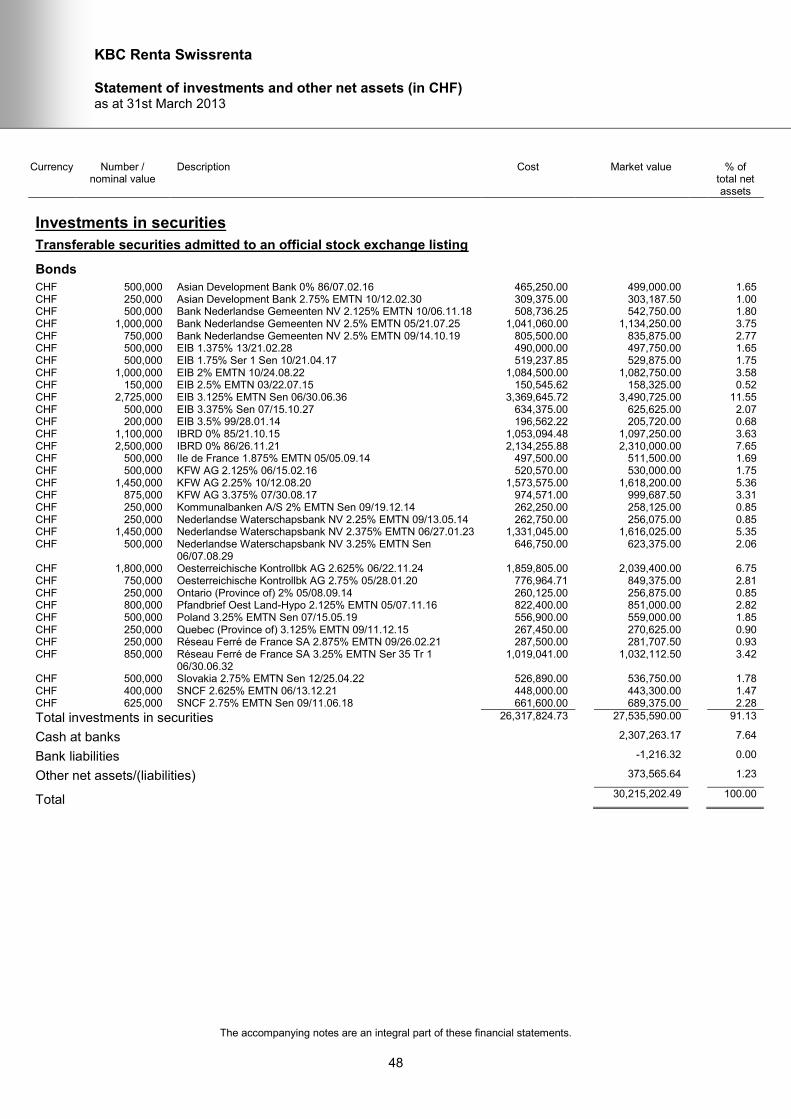
KBC Renta Swissrenta
Statement of investments and other net assets (in CHF) as at 31st March 2013
The accompanying notes are an integral part of these financial statements.
48
Currency Number / nominal value
Description Cost Market value % of total net assets
Investments in securities
Transferable securities admitted to an official stock exchange listing
Bonds
CHF 500,000 Asian Development Bank 0% 86/07.02.16 465,250.00 499,000.00 1.65 CHF 250,000 Asian Development Bank 2.75% EMTN 10/12.02.30 309,375.00 303,187.50 1.00 CHF 500,000 Bank Nederlandse Gemeenten NV 2.125% EMTN 10/06.11.18 508,736.25 542,750.00 1.80 CHF 1,000,000 Bank Nederlandse Gemeenten NV 2.5% EMTN 05/21.07.25 1,041,060.00 1,134,250.00 3.75 CHF 750,000 Bank Nederlandse Gemeenten NV 2.5% EMTN 09/14.10.19 805,500.00 835,875.00 2.77 CHF 500,000 EIB 1.375% 13/21.02.28 490,000.00 497,750.00 1.65 CHF 500,000 EIB 1.75% Ser 1 Sen 10/21.04.17 519,237.85 529,875.00 1.75 CHF 1,000,000 EIB 2% EMTN 10/24.08.22 1,084,500.00 1,082,750.00 3.58 CHF 150,000 EIB 2.5% EMTN 03/22.07.15 150,545.62 158,325.00 0.52 CHF 2,725,000 EIB 3.125% EMTN Sen 06/30.06.36 3,369,645.72 3,490,725.00 11.55 CHF 500,000 EIB 3.375% Sen 07/15.10.27 634,375.00 625,625.00 2.07 CHF 200,000 EIB 3.5% 99/28.01.14 196,562.22 205,720.00 0.68 CHF 1,100,000 IBRD 0% 85/21.10.15 1,053,094.48 1,097,250.00 3.63 CHF 2,500,000 IBRD 0% 86/26.11.21 2,134,255.88 2,310,000.00 7.65 CHF 500,000 Ile de France 1.875% EMTN 05/05.09.14 497,500.00 511,500.00 1.69 CHF 500,000 KFW AG 2.125% 06/15.02.16 520,570.00 530,000.00 1.75 CHF 1,450,000 KFW AG 2.25% 10/12.08.20 1,573,575.00 1,618,200.00 5.36 CHF 875,000 KFW AG 3.375% 07/30.08.17 974,571.00 999,687.50 3.31 CHF 250,000 Kommunalbanken A/S 2% EMTN Sen 09/19.12.14 262,250.00 258,125.00 0.85 CHF 250,000 Nederlandse Waterschapsbank NV 2.25% EMTN 09/13.05.14 262,750.00 256,075.00 0.85 CHF 1,450,000 Nederlandse Waterschapsbank NV 2.375% EMTN 06/27.01.23 1,331,045.00 1,616,025.00 5.35 CHF 500,000 Nederlandse Waterschapsbank NV 3.25% EMTN Sen
06/07.08.29 646,750.00 623,375.00 2.06
CHF 1,800,000 Oesterreichische Kontrollbk AG 2.625% 06/22.11.24 1,859,805.00 2,039,400.00 6.75 CHF 750,000 Oesterreichische Kontrollbk AG 2.75% 05/28.01.20 776,964.71 849,375.00 2.81 CHF 250,000 Ontario (Province of) 2% 05/08.09.14 260,125.00 256,875.00 0.85 CHF 800,000 Pfandbrief Oest Land-Hypo 2.125% EMTN 05/07.11.16 822,400.00 851,000.00 2.82 CHF 500,000 Poland 3.25% EMTN Sen 07/15.05.19 556,900.00 559,000.00 1.85 CHF 250,000 Quebec (Province of) 3.125% EMTN 09/11.12.15 267,450.00 270,625.00 0.90 CHF 250,000 Réseau Ferré de France SA 2.875% EMTN 09/26.02.21 287,500.00 281,707.50 0.93 CHF 850,000 Réseau Ferré de France SA 3.25% EMTN Ser 35 Tr 1
06/30.06.32 1,019,041.00 1,032,112.50 3.42
CHF 500,000 Slovakia 2.75% EMTN Sen 12/25.04.22 526,890.00 536,750.00 1.78 CHF 400,000 SNCF 2.625% EMTN 06/13.12.21 448,000.00 443,300.00 1.47 CHF 625,000 SNCF 2.75% EMTN Sen 09/11.06.18 661,600.00 689,375.00 2.28
Total investments in securities 26,317,824.73 27,535,590.00 91.13
Cash at banks 2,307,263.17 7.64
Bank liabilities -1,216.32 0.00
Other net assets/(liabilities) 373,565.64 1.23
Total 30,215,202.49 100.00
KBC Renta Emurenta
Investment policy and outlook from 1st October 2012 to 31st March 2013
49
Economic growth in Europe remained extremely weak in the first six months of this financial year, and was negative in several countries. Actions taken everywhere to reduce budget deficits took their toll. Southern European countries suffered particularly acutely under the measures imposed on them. Fortunately, the ECB president’s statement at the end of August had the necessary effect: he declared that the bank would do whatever it takes to defend the euro, following which spreads between ‘core’ countries like Germany and the European periphery narrowed significantly. The result was a general decline in bond yields across Europe. Economic activity remained highly depressed, leaving little scope for higher interest rates, while diminished fear of investing in more risk-exposed countries also meant that yields tended to fall as demand rose. This situation is mirrored in the fund. The duration was held around 95%, based on the very low level of yields, while holdings of peripheral European countries were brought back in line with the benchmark. Once it became clear that the rally on the periphery was not just a flash in the pan, holdings of Italian government bonds were also slightly overweighted once more to benefit from the rate spread. Neither the problems in Cyprus nor the unstable political situation in Italy after the February elections seemed to temper the market’s appetite for higher-yielding securities. We do not expect any fundamental shifts in the market in the months ahead. Interest rates in the core countries have reached such low levels that it is not unreasonable to suppose that this cannot continue. Such a view is not supported, however, by the latest economic figures. Periphery spreads have been tightening but higher volatility remains a possibility as headlines are expected to keep blowing hot and cold. In short, a cautious investment policy seems the most appropriate. Note: The information in this report represents historical data and is not an indication of future results.
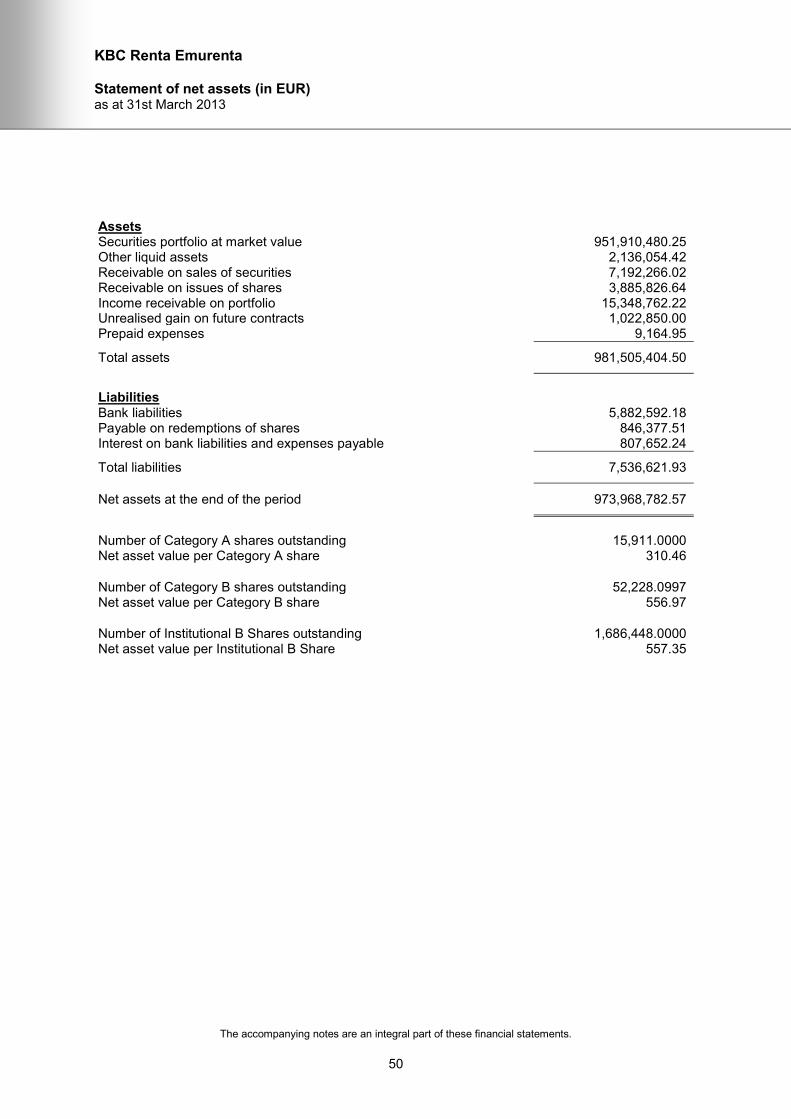
KBC Renta Emurenta
Statement of net assets (in EUR) as at 31st March 2013
The accompanying notes are an integral part of these financial statements.
50
Assets Securities portfolio at market value 951,910,480.25 Other liquid assets 2,136,054.42 Receivable on sales of securities 7,192,266.02 Receivable on issues of shares 3,885,826.64 Income receivable on portfolio 15,348,762.22 Unrealised gain on future contracts 1,022,850.00 Prepaid expenses 9,164.95
Total assets 981,505,404.50
Liabilities Bank liabilities 5,882,592.18 Payable on redemptions of shares 846,377.51 Interest on bank liabilities and expenses payable 807,652.24
Total liabilities 7,536,621.93
Net assets at the end of the period 973,968,782.57
Number of Category A shares outstanding 15,911.0000 Net asset value per Category A share 310.46
Number of Category B shares outstanding 52,228.0997 Net asset value per Category B share 556.97
Number of Institutional B Shares outstanding 1,686,448.0000 Net asset value per Institutional B Share 557.35
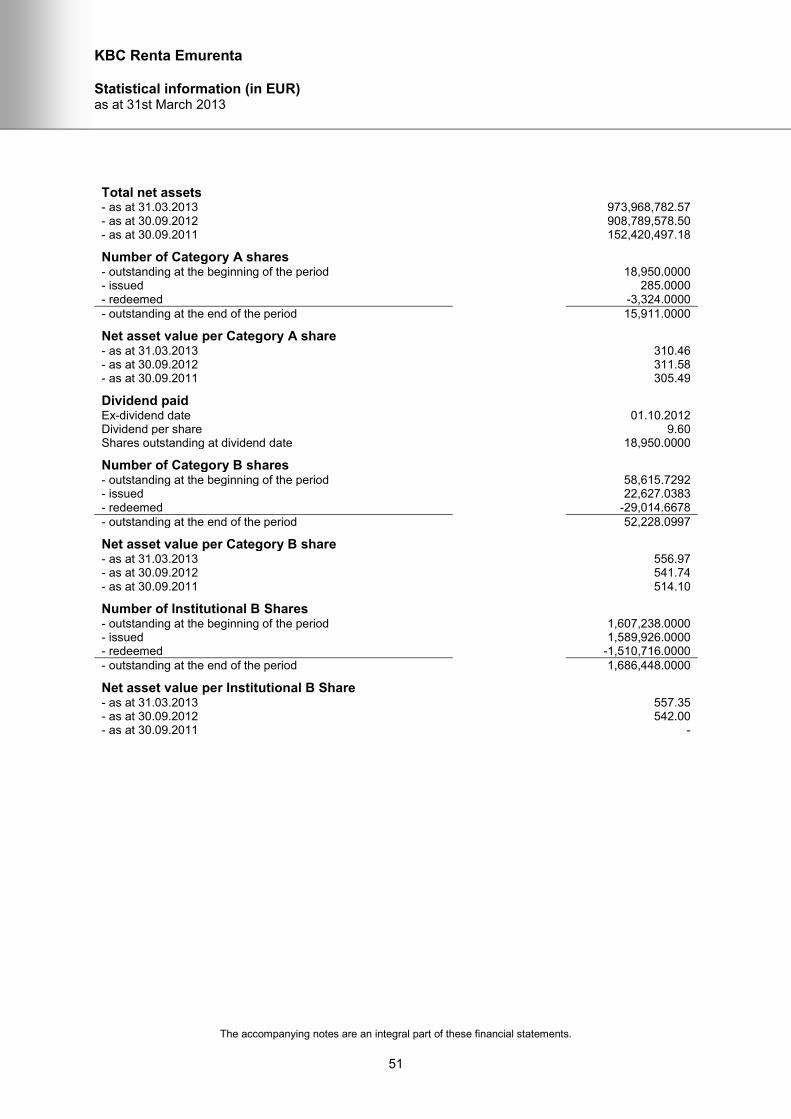
KBC Renta Emurenta
Statistical information (in EUR) as at 31st March 2013
The accompanying notes are an integral part of these financial statements.
51
Total net assets
- as at 31.03.2013 973,968,782.57 - as at 30.09.2012 908,789,578.50 - as at 30.09.2011 152,420,497.18
Number of Category A shares
- outstanding at the beginning of the period 18,950.0000 - issued 285.0000 - redeemed -3,324.0000
- outstanding at the end of the period 15,911.0000
Net asset value per Category A share
- as at 31.03.2013 310.46 - as at 30.09.2012 311.58 - as at 30.09.2011 305.49
Dividend paid
Ex-dividend date 01.10.2012 Dividend per share 9.60 Shares outstanding at dividend date 18,950.0000
Number of Category B shares
- outstanding at the beginning of the period 58,615.7292 - issued 22,627.0383 - redeemed -29,014.6678
- outstanding at the end of the period 52,228.0997
Net asset value per Category B share
- as at 31.03.2013 556.97 - as at 30.09.2012 541.74 - as at 30.09.2011 514.10
Number of Institutional B Shares
- outstanding at the beginning of the period 1,607,238.0000 - issued 1,589,926.0000 - redeemed -1,510,716.0000
- outstanding at the end of the period 1,686,448.0000
Net asset value per Institutional B Share
- as at 31.03.2013 557.35 - as at 30.09.2012 542.00 - as at 30.09.2011 -
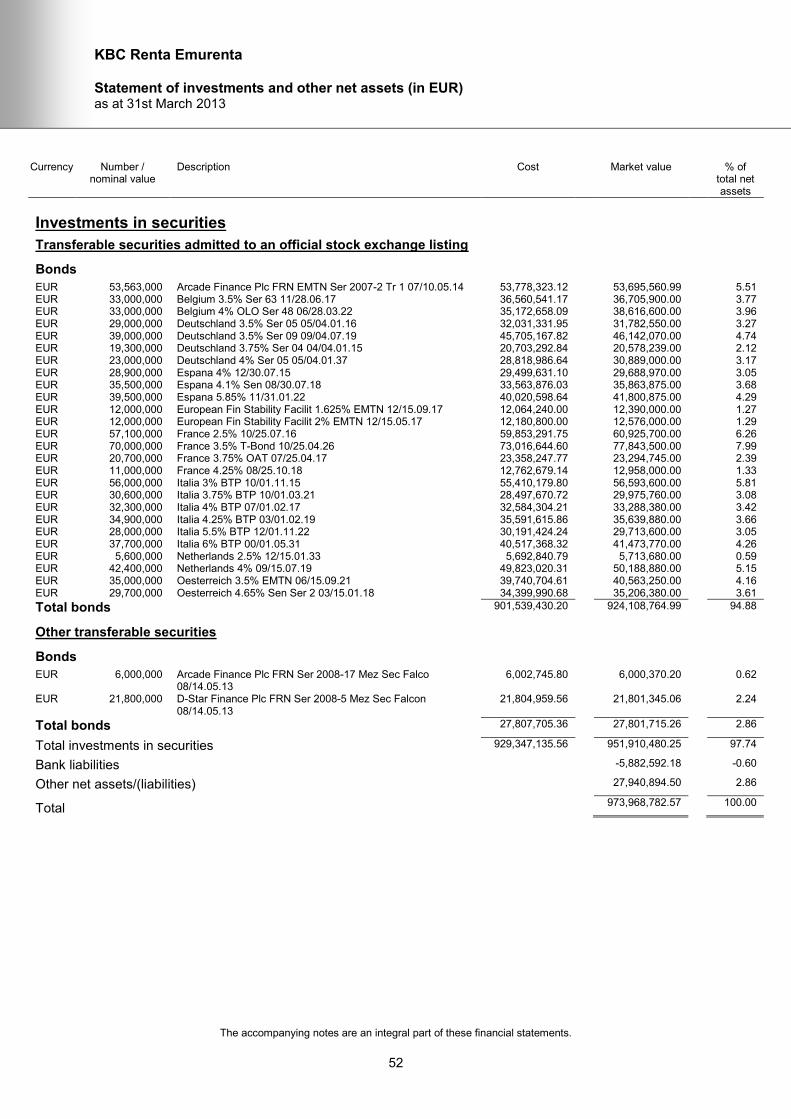
KBC Renta Emurenta
Statement of investments and other net assets (in EUR) as at 31st March 2013
The accompanying notes are an integral part of these financial statements.
52
Currency Number / nominal value
Description Cost Market value % of total net assets
Investments in securities
Transferable securities admitted to an official stock exchange listing
Bonds
EUR 53,563,000 Arcade Finance Plc FRN EMTN Ser 2007-2 Tr 1 07/10.05.14 53,778,323.12 53,695,560.99 5.51 EUR 33,000,000 Belgium 3.5% Ser 63 11/28.06.17 36,560,541.17 36,705,900.00 3.77 EUR 33,000,000 Belgium 4% OLO Ser 48 06/28.03.22 35,172,658.09 38,616,600.00 3.96 EUR 29,000,000 Deutschland 3.5% Ser 05 05/04.01.16 32,031,331.95 31,782,550.00 3.27 EUR 39,000,000 Deutschland 3.5% Ser 09 09/04.07.19 45,705,167.82 46,142,070.00 4.74 EUR 19,300,000 Deutschland 3.75% Ser 04 04/04.01.15 20,703,292.84 20,578,239.00 2.12 EUR 23,000,000 Deutschland 4% Ser 05 05/04.01.37 28,818,986.64 30,889,000.00 3.17 EUR 28,900,000 Espana 4% 12/30.07.15 29,499,631.10 29,688,970.00 3.05 EUR 35,500,000 Espana 4.1% Sen 08/30.07.18 33,563,876.03 35,863,875.00 3.68 EUR 39,500,000 Espana 5.85% 11/31.01.22 40,020,598.64 41,800,875.00 4.29 EUR 12,000,000 European Fin Stability Facilit 1.625% EMTN 12/15.09.17 12,064,240.00 12,390,000.00 1.27 EUR 12,000,000 European Fin Stability Facilit 2% EMTN 12/15.05.17 12,180,800.00 12,576,000.00 1.29 EUR 57,100,000 France 2.5% 10/25.07.16 59,853,291.75 60,925,700.00 6.26 EUR 70,000,000 France 3.5% T-Bond 10/25.04.26 73,016,644.60 77,843,500.00 7.99 EUR 20,700,000 France 3.75% OAT 07/25.04.17 23,358,247.77 23,294,745.00 2.39 EUR 11,000,000 France 4.25% 08/25.10.18 12,762,679.14 12,958,000.00 1.33 EUR 56,000,000 Italia 3% BTP 10/01.11.15 55,410,179.80 56,593,600.00 5.81 EUR 30,600,000 Italia 3.75% BTP 10/01.03.21 28,497,670.72 29,975,760.00 3.08 EUR 32,300,000 Italia 4% BTP 07/01.02.17 32,584,304.21 33,288,380.00 3.42 EUR 34,900,000 Italia 4.25% BTP 03/01.02.19 35,591,615.86 35,639,880.00 3.66 EUR 28,000,000 Italia 5.5% BTP 12/01.11.22 30,191,424.24 29,713,600.00 3.05 EUR 37,700,000 Italia 6% BTP 00/01.05.31 40,517,368.32 41,473,770.00 4.26 EUR 5,600,000 Netherlands 2.5% 12/15.01.33 5,692,840.79 5,713,680.00 0.59 EUR 42,400,000 Netherlands 4% 09/15.07.19 49,823,020.31 50,188,880.00 5.15 EUR 35,000,000 Oesterreich 3.5% EMTN 06/15.09.21 39,740,704.61 40,563,250.00 4.16 EUR 29,700,000 Oesterreich 4.65% Sen Ser 2 03/15.01.18 34,399,990.68 35,206,380.00 3.61
Total bonds 901,539,430.20 924,108,764.99 94.88
Other transferable securities
Bonds
EUR 6,000,000 Arcade Finance Plc FRN Ser 2008-17 Mez Sec Falco 08/14.05.13
6,002,745.80 6,000,370.20 0.62
EUR 21,800,000 D-Star Finance Plc FRN Ser 2008-5 Mez Sec Falcon 08/14.05.13
21,804,959.56 21,801,345.06 2.24
Total bonds 27,807,705.36 27,801,715.26 2.86
Total investments in securities 929,347,135.56 951,910,480.25 97.74
Bank liabilities -5,882,592.18 -0.60
Other net assets/(liabilities) 27,940,894.50 2.86
Total 973,968,782.57 100.00
KBC Renta Czechrenta
Investment policy and outlook from 1st October 2012 to 31st March 2013
53
Macroeconomic and fixed-income developments During the last six months, the Czech economy continued to decelerate, following the general trend of European economies. In the fourth quarter of 2012, GDP declined by 1.7% y-o-y. Over the six-month period from September 2012 to March 2013, consumer price inflation slowed from 3.4% to 1.7% y-o-y. The consumer price index fell below the Czech National Bank's target of 2.0% after a prolonged period at higher levels due to the disappearance of a number of administrative price increases from the yearly figure. There was nothing new to report on the net inflation trend, which remained firmly in negative territory. In September and November 2012, the Czech National Bank delivered two interest rate cuts, taking its benchmark rate to an all-time low of 0.05%, primarily due to the fragile economic outlook and benign inflationary prospects. The rate is now lower than the official ECB rate. Yields at the short end of the local yield curve decreased significantly during the past six months, reflecting a fall in the six-month interbank rate from 1.04% to 0.59% in response to the policy rate cuts. The Czech government yield curve flattened over the last six months as ten-year government bond yields fell by approximately 50 bps, compared with a decline of 30 bps in two-year bond yields. Investment strategy and asset allocation The Fund invests mainly in Czech government bonds, as well as in CZK and EUR-denominated Eurobonds. These instruments offer good accessibility and liquidity. The currency risk stemming from investments in EUR-denominated securities is fully hedged. During the last six months, the Fund’s modified duration oscillated between 5.0 and 5.5 years. Outlook We expect the Czech economy to start rebounding in 2013, with y-o-y GDP growth of -0.5% in the second quarter and 0.0% in the third quarter. We think consumer price inflation will remain around or slightly below the Czech National Bank’s target of 2.0% over the next six months. The Czech National Bank is expected to keep its official interest rate at the current level of 0.05% for the rest of 2013. As regards long-term yields, we expect these to rise gradually during 2013 as the Czech economy stabilises. We intend to keep the modified duration of the portfolio at around the benchmark-neutral level during the next six months, with the option of shortening it if the Czech economy should rebound more strongly than expected. Note: The information in this report represents historical data and is not an indication of future results.
KBC Renta Czechrenta
Statement of net assets (in CZK) as at 31st March 2013
The accompanying notes are an integral part of these financial statements.
54
Assets Securities portfolio at market value 1,806,505,777.25 Cash at banks 72,440,205.62 Receivable on issues of shares 567,070.38 Income receivable on portfolio 22,117,382.55 Prepaid expenses 18,992.77
Total assets 1,901,649,428.57
Liabilities Payable on redemptions of shares 4,856,504.26 Interest on bank liabilities and expenses payable 1,950,758.14
Total liabilities 6,807,262.40
Net assets at the end of the period 1,894,842,166.17
Number of Category A shares outstanding 1,846.3841 Net asset value per Category A share 21,070.70
Number of Category B shares outstanding 19,910.9672 Net asset value per Category B share 37,671.99
Number of Institutional B Shares outstanding 29,336.0000 Net asset value per Institutional B Share 37,696.06

KBC Renta Czechrenta
Statistical information (in CZK) as at 31st March 2013
The accompanying notes are an integral part of these financial statements.
55
Total net assets
- as at 31.03.2013 1,894,842,166.17 - as at 30.09.2012 2,394,235,969.82 - as at 30.09.2011 2,824,464,784.81
Number of Category A shares
- outstanding at the beginning of the period 1,910.0000 - issued 124.3842 - redeemed -188.0001
- outstanding at the end of the period 1,846.3841
Net asset value per Category A share
- as at 31.03.2013 21,070.70 - as at 30.09.2012 21,108.77 - as at 30.09.2011 20,611.16
Dividend paid
Ex-dividend date 01.10.2012 Dividend per share 680.00 Shares outstanding at dividend date 1,910.0000
Number of Category B shares
- outstanding at the beginning of the period 19,950.4923 - issued 7,019.4110 - redeemed -7,058.9361
- outstanding at the end of the period 19,910.9672
Net asset value per Category B share
- as at 31.03.2013 37,671.99 - as at 30.09.2012 36,520.55 - as at 30.09.2011 34,477.76
Number of Institutional B Shares
- outstanding at the beginning of the period 44,485.0000 - issued 11,521.0000 - redeemed -26,670.0000
- outstanding at the end of the period 29,336.0000
Net asset value per Institutional B Share
- as at 31.03.2013 37,696.06 - as at 30.09.2012 36,536.25 - as at 30.09.2011 -
KBC Renta Czechrenta
Statement of investments and other net assets (in CZK) as at 31st March 2013
The accompanying notes are an integral part of these financial statements.
56
Currency Number / nominal value
Description Cost Market value % of total net assets
Investments in securities
Transferable securities admitted to an official stock exchange listing
Bonds
CZK 15,000,000 BNP Paribas SA FRN EMTN Sen 13/25.01.18 15,000,000.00 15,000,000.00 0.79 CZK 15,000,000 Citigroup Inc 3.25% EMTN 10/20.10.14 15,000,000.00 15,402,741.00 0.81 CZK 20,000,000 Commerzbank AG 0% EMTN Sen Ser 407 01/21.11.16 9,592,000.00 18,331,568.00 0.97 CZK 15,000,000 Credit Agricole Corp Inv Bk 3.81% EMTN 11/04.05.16 15,000,000.00 16,048,092.00 0.85 CZK 100,000,000 Czech Republic 0.5% Ser 77 13/28.07.16 99,240,000.00 98,869,210.00 5.22 CZK 155,000,000 Czech Republic 1.5% Ser 6Y 13/29.10.19 154,852,000.00 153,821,364.50 8.12 CZK 310,000,000 Czech Republic 3.75% Ser 46 05/12.09.20 300,645,853.33 357,123,100.00 18.85 CZK 180,000,000 Czech Republic 3.85% Ser 61 10/29.09.21 195,351,000.00 209,521,800.00 11.06 CZK 130,000,000 Czech Republic 4% Ser 51 07/11.04.17 141,126,444.44 145,993,900.00 7.70 CZK 80,000,000 Czech Republic 4.6% Ser 41 03/18.08.18 93,229,473.69 94,202,400.00 4.97 CZK 100,000,000 Czech Republic 4.7% Ser 52 07/12.09.22 109,187,500.00 124,852,000.00 6.59 CZK 180,000,000 Czech Republic 5.7% Ser 58 09/25.05.24 212,826,771.42 244,057,500.00 12.88 CZK 100,000,000 Czech Republic FRN EMTN 11/22.09.18 100,000,000.00 100,128,710.00 5.28 CZK 16,000,000 Erste Group Bank AG 2.53% EMTN 10/13.09.13 16,000,000.00 16,133,440.00 0.85 CZK 30,000,000 General Electric Capital Corp FRN EMTN Sen 13/05.02.18 30,000,000.00 29,962,050.00 1.58 CZK 20,000,000 ING Bank NV FRN EMTN Ser 5310 12/30.11.17 20,000,000.00 20,023,412.00 1.06 CZK 60,000,000 KBC Ifima NV 3.87% EMTN Sub 05/18.05.16 60,012,000.00 59,357,076.00 3.13 CZK 37,500,000 Lloyds TSB Bank Plc FRN EMTN Sen 10/15.04.13 37,500,000.00 37,477,413.75 1.98
Total bonds 1,624,563,042.88 1,756,305,777.25 92.69
Bonds in default of payment
CZK 25,000,000 Landsbanki Islands HF 4.4% EMTN Ser 74 Tr 1 04/03.11.09 26,192,500.00 375,000.00 0.02
Total bonds in default of payment 26,192,500.00 375,000.00 0.02
Transferable securities dealt in on another regulated market
Bonds
CZK 50,000,000 Czech Republic 2.5% Ser 78 13/25.08.28 47,850,000.00 49,825,000.00 2.63
Total bonds 47,850,000.00 49,825,000.00 2.63
Total investments in securities 1,698,605,542.88 1,806,505,777.25 95.34
Cash at banks 72,440,205.62 3.82
Other net assets/(liabilities) 15,896,183.30 0.84
Total 1,894,842,166.17 100.00
KBC Renta AUD-Renta
Investment policy and outlook from 1st October 2012 to 31st March 2013
57
This sub-fund chiefly invests in Australian government paper supplemented by semi-government issues and high-value Eurobonds. The Australian economy maintained near-trend growth in the first half of the financial year. All the same the strong Australian dollar and falling commodity prices gave the central bank scope to cut its policy rate once again from 3.5% to 3%. The bond markets had, however, already priced this in well in advance, and yields rose overall since October. This had a negative impact on the price of Australian sovereign paper. The sub-fund was nevertheless able to benefit from the positive spread between government paper and Eurobonds, which limited negative returns. Having appreciated substantially against the euro in previous financial years, the Australian dollar held relatively steady and so had little impact on the final return for European investors. We expect the central bank to adopt a more cautious stance in the second half of the financial year and will not change its policy rate. Bond yields are therefore more likely to mark time. The positive spread between government bonds and Eurobonds ought to contribute, however, to a positive return over the financial year as a whole. Note: The information in this report represents historical data and is not an indication of future results.
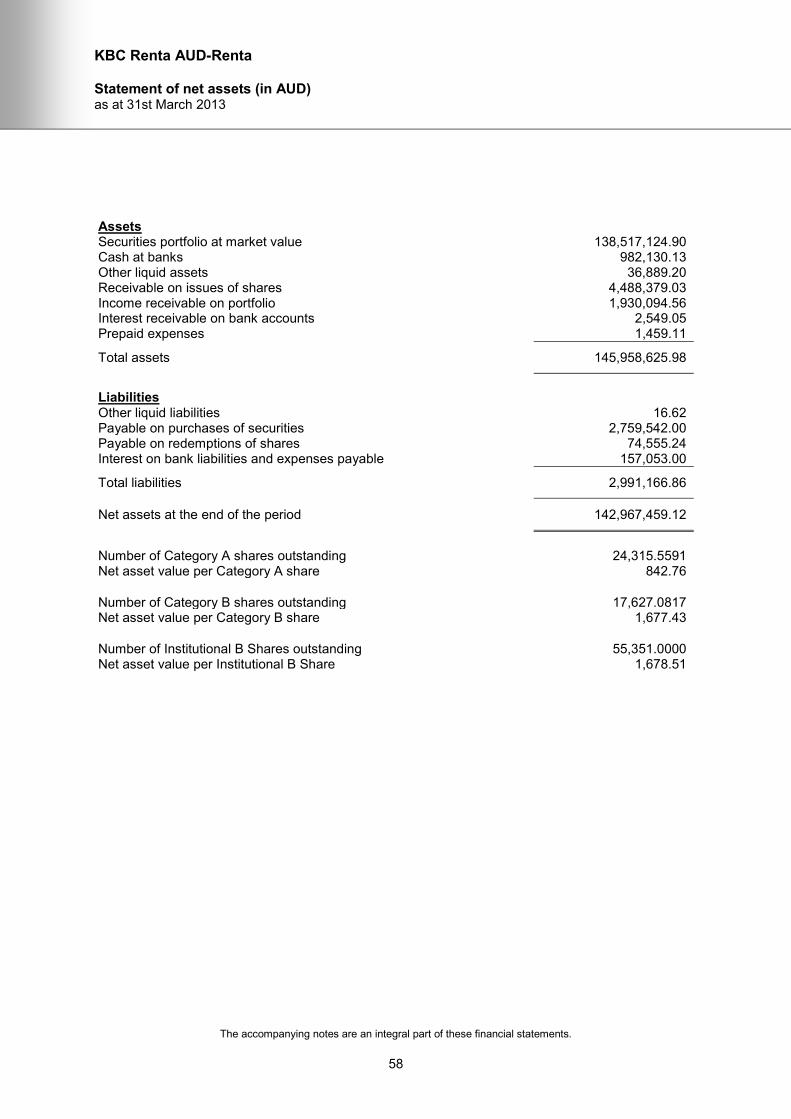
KBC Renta AUD-Renta
Statement of net assets (in AUD) as at 31st March 2013
The accompanying notes are an integral part of these financial statements.
58
Assets Securities portfolio at market value 138,517,124.90 Cash at banks 982,130.13 Other liquid assets 36,889.20 Receivable on issues of shares 4,488,379.03 Income receivable on portfolio 1,930,094.56 Interest receivable on bank accounts 2,549.05 Prepaid expenses 1,459.11
Total assets 145,958,625.98
Liabilities Other liquid liabilities 16.62 Payable on purchases of securities 2,759,542.00 Payable on redemptions of shares 74,555.24 Interest on bank liabilities and expenses payable 157,053.00
Total liabilities 2,991,166.86
Net assets at the end of the period 142,967,459.12
Number of Category A shares outstanding 24,315.5591 Net asset value per Category A share 842.76
Number of Category B shares outstanding 17,627.0817 Net asset value per Category B share 1,677.43
Number of Institutional B Shares outstanding 55,351.0000 Net asset value per Institutional B Share 1,678.51

KBC Renta AUD-Renta
Statistical information (in AUD) as at 31st March 2013
The accompanying notes are an integral part of these financial statements.
59
Total net assets
- as at 31.03.2013 142,967,459.12 - as at 30.09.2012 81,344,146.89 - as at 30.09.2011 67,076,729.78
Number of Category A shares
- outstanding at the beginning of the period 26,040.7329 - issued 1,556.8302 - redeemed -3,282.0040
- outstanding at the end of the period 24,315.5591
Net asset value per Category A share
- as at 31.03.2013 842.76 - as at 30.09.2012 886.28 - as at 30.09.2011 861.08
Dividend paid
Ex-dividend date 01.10.2012 Dividend per share 35.00 Shares outstanding at dividend date 26,040.7329
Number of Category B shares
- outstanding at the beginning of the period 19,037.3894 - issued 6,195.0301 - redeemed -7,605.3378
- outstanding at the end of the period 17,627.0817
Net asset value per Category B share
- as at 31.03.2013 1,677.43 - as at 30.09.2012 1,694.37 - as at 30.09.2011 1,566.15
Number of Institutional B Shares
- outstanding at the beginning of the period 15,343.0000 - issued 69,452.0000 - redeemed -29,444.0000
- outstanding at the end of the period 55,351.0000
Net asset value per Institutional B Share
- as at 31.03.2013 1,678.51 - as at 30.09.2012 1,695.13 - as at 30.09.2011 -

KBC Renta AUD-Renta
Statement of investments and other net assets (in AUD) as at 31st March 2013
The accompanying notes are an integral part of these financial statements.
60
Currency Number / nominal value
Description Cost Market value % of total net assets
Investments in securities
Transferable securities admitted to an official stock exchange listing
Bonds
AUD 4,000,000 Australia 3,759,079.00 3,722,679.60 2.60 AUD 2,600,000 Australia 3.25% Ser 138 12/21.04.29 2,444,232.00 2,388,100.00 1.67 AUD 3,200,000 Australia 4.5% Ser 126 09/15.04.20 3,498,311.05 3,457,296.00 2.42 AUD 10,500,000 Australia 4.75% 10/15.06.16 10,928,137.68 11,095,402.50 7.76 AUD 3,900,000 Australia 4.75% Ser 136 11/21.04.27 4,359,401.12 4,311,547.50 3.02 AUD 10,200,000 Australia 5.25% 06/15.03.19 11,042,244.76 11,376,417.00 7.96 AUD 9,080,000 Australia 5.5% Ser 132 10/21.01.18 10,034,266.79 10,071,172.80 7.05 AUD 8,700,000 Australia 5.5% Ser 133 11/21.04.23 10,247,812.30 10,235,637.00 7.16 AUD 10,100,000 Australia 5.75% Ser 124 07/15.05.21 11,806,413.20 11,844,421.50 8.29 AUD 10,000,000 Australia 5.75% Ser 128 10/15.07.22 11,662,883.77 11,885,500.00 8.31 AUD 11,650,000 Australia 6% Ser 217 04/15.02.17 13,158,721.06 12,957,188.25 9.06 AUD 11,950,000 Australia 6.25% 08/15.06.14 12,583,371.64 12,427,701.25 8.69 AUD 14,100,000 Australia 6.25% Ser 415 02/15.04.15 15,171,577.93 15,041,809.50 10.52 AUD 3,600,000 EIB 6% MTN 10/06.08.20 3,638,736.00 3,917,880.00 2.74 AUD 2,250,000 EIB 6.125% MTN 07/23.01.17 2,161,585.59 2,432,362.50 1.70 AUD 4,800,000 Eurofima 5.5% EMTN 05/30.06.20 4,474,656.47 5,041,056.00 3.53 AUD 3,350,000 KFW AG 6% 07/28.03.17 3,455,314.00 3,634,448.50 2.54 AUD 2,600,000 Oesterreich 5.75% Sen 04/15.09.14 2,513,992.67 2,676,505.00 1.87
Total investments in securities 136,940,737.03 138,517,124.90 96.89
Cash at banks 982,130.13 0.69
Other net assets/(liabilities) 3,468,204.09 2.42
Total 142,967,459.12 100.00
KBC Renta NZD-Renta
Investment policy and outlook from 1st October 2012 to 31st March 2013
61
This sub-fund chiefly invests in New Zealand government paper supplemented by semi-government issues. The economic recovery in New Zealand continued in the first half of the financial year, driven chiefly by the construction sector, while the strength of the New Zealand dollar weighed on exports. Against that backdrop, the central bank held its key rate at the historically low level of 2.5%. Bond yields therefore tended to mark time. The sub-fund was nevertheless able to benefit from the positive spread between government paper and semi-government bonds. Having appreciated substantially against the euro in previous financial years, the New Zealand dollar held relatively steady and so had little impact on the final return for European investors. We expect the central bank to hold its key rate unchanged for some time yet in the coming financial year. Concern about the sharp rise in real-estate prices is easing, while the strength of the New Zealand dollar will probably stand in the way of a policy rate hike. We therefore expect bond yields to mark time. The positive spread between government bonds and semi-government paper ought to contribute, however, to a positive return over the financial year as a whole. Note: The information in this report represents historical data and is not an indication of future results.
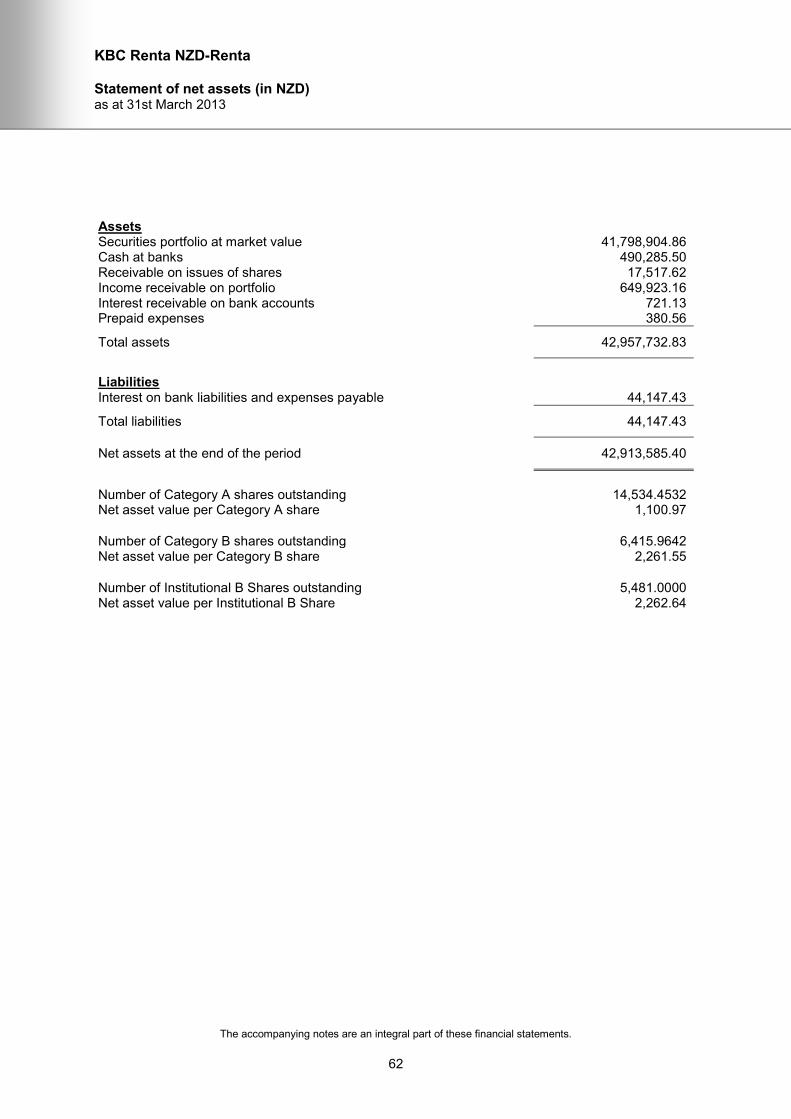
KBC Renta NZD-Renta
Statement of net assets (in NZD) as at 31st March 2013
The accompanying notes are an integral part of these financial statements.
62
Assets Securities portfolio at market value 41,798,904.86 Cash at banks 490,285.50 Receivable on issues of shares 17,517.62 Income receivable on portfolio 649,923.16 Interest receivable on bank accounts 721.13 Prepaid expenses 380.56
Total assets 42,957,732.83
Liabilities Interest on bank liabilities and expenses payable 44,147.43
Total liabilities 44,147.43
Net assets at the end of the period 42,913,585.40
Number of Category A shares outstanding 14,534.4532 Net asset value per Category A share 1,100.97
Number of Category B shares outstanding 6,415.9642 Net asset value per Category B share 2,261.55
Number of Institutional B Shares outstanding 5,481.0000 Net asset value per Institutional B Share 2,262.64

KBC Renta NZD-Renta
Statistical information (in NZD) as at 31st March 2013
The accompanying notes are an integral part of these financial statements.
63
Total net assets
- as at 31.03.2013 42,913,585.40 - as at 30.09.2012 38,083,149.29 - as at 30.09.2011 23,486,513.37
Number of Category A shares
- outstanding at the beginning of the period 15,131.1164 - issued 734.9022 - redeemed -1,331.5654
- outstanding at the end of the period 14,534.4532
Net asset value per Category A share
- as at 31.03.2013 1,100.97 - as at 30.09.2012 1,138.92 - as at 30.09.2011 1,109.77
Dividend paid
Ex-dividend date 01.10.2012 Dividend per share 45.00 Shares outstanding at dividend date 15,131.1164
Number of Category B shares
- outstanding at the beginning of the period 6,767.3072 - issued 321.2785 - redeemed -672.6215
- outstanding at the end of the period 6,415.9642
Net asset value per Category B share
- as at 31.03.2013 2,261.55 - as at 30.09.2012 2,247.00 - as at 30.09.2011 2,085.02
Number of Institutional B Shares
- outstanding at the beginning of the period 2,511.0000 - issued 3,170.0000 - redeemed -200.0000
- outstanding at the end of the period 5,481.0000
Net asset value per Institutional B Share
- as at 31.03.2013 2,262.64 - as at 30.09.2012 2,247.66 - as at 30.09.2011 -
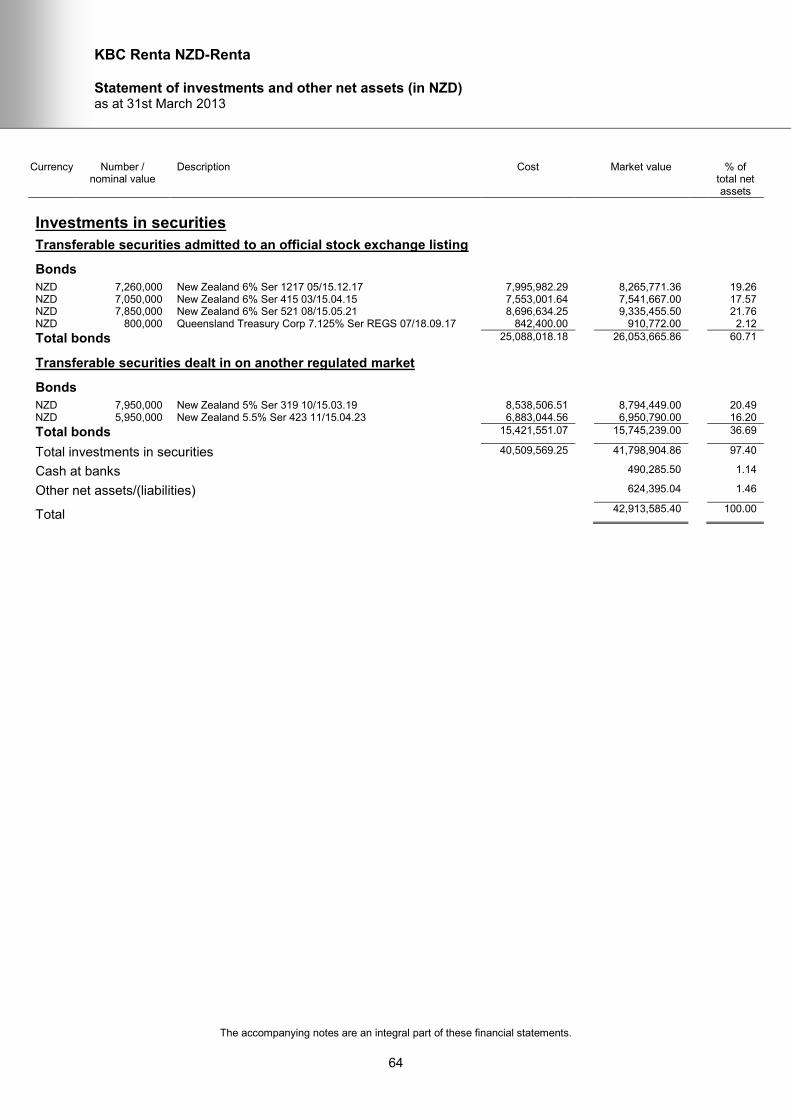
KBC Renta NZD-Renta
Statement of investments and other net assets (in NZD) as at 31st March 2013
The accompanying notes are an integral part of these financial statements.
64
Currency Number / nominal value
Description Cost Market value % of total net assets
Investments in securities
Transferable securities admitted to an official stock exchange listing
Bonds
NZD 7,260,000 New Zealand 6% Ser 1217 05/15.12.17 7,995,982.29 8,265,771.36 19.26 NZD 7,050,000 New Zealand 6% Ser 415 03/15.04.15 7,553,001.64 7,541,667.00 17.57 NZD 7,850,000 New Zealand 6% Ser 521 08/15.05.21 8,696,634.25 9,335,455.50 21.76 NZD 800,000 Queensland Treasury Corp 7.125% Ser REGS 07/18.09.17 842,400.00 910,772.00 2.12
Total bonds 25,088,018.18 26,053,665.86 60.71
Transferable securities dealt in on another regulated market
Bonds
NZD 7,950,000 New Zealand 5% Ser 319 10/15.03.19 8,538,506.51 8,794,449.00 20.49 NZD 5,950,000 New Zealand 5.5% Ser 423 11/15.04.23 6,883,044.56 6,950,790.00 16.20
Total bonds 15,421,551.07 15,745,239.00 36.69
Total investments in securities 40,509,569.25 41,798,904.86 97.40
Cash at banks 490,285.50 1.14
Other net assets/(liabilities) 624,395.04 1.46
Total 42,913,585.40 100.00

KBC Renta Short EUR
Investment policy and outlook from 1st October 2012 to 31st March 2013
65
This sub-fund invests in government bonds from the euro area with maturities of between one and three years. Over the reporting period, the overall duration was held at around 100% of the benchmark duration. The portfolio holdings in Italian government bonds were increased during the reporting period to an overweight of 0.5% relative to the benchmark weights, while remaining at the benchmark weights for Spanish government bonds. Our other positions are overweight relative to the benchmark for Austria and Belgium and underweight in Germany. We have relatively neutral weightings in other countries. The Southern European countries once again brought up the rear in terms of performance in the third quarter, while the core countries did well. The ECB calmed the markets by announcing its willingness in principle to make unlimited purchases of government bonds if the country in question agrees to make binding economic reforms. These ’Outright Monetary Transactions’ (OMTs) by the ECB are an attempt to take out the risk of ‘euro convertibility’. ECB President Mario Draghi stated specifically that the ECB would do '“whatever it takes” to protect EMU from collapse. This statement gave European bond markets a credible backstop, thanks to the unlimited resources of the Central Bank. The renewed confidence in the market resulted in a shift in demand from core countries to peripheral countries. The increased demand for Italian and Spanish government bonds was translated into lower yields for these two countries. At the same time, German ten-year government bond yields rose slightly, as expected. That said, the market remained volatile as economic growth stayed muted (and in some countries even turned negative). And although the situation has improved over the last six months, the market remains uncertain, as illustrated by the situation in Cyprus, which prompted a new wave of tensions in Europe and another flight to the core countries, reversing the increase in ten-year German government bond yields. European politicians are working towards greater European policy integration and harmonisation, with reforms including the introduction of European banking supervision and fiscal consolidation. It will take some time for these measures to take effect, however, and we consequently continue to advocate a cautious investment policy for the coming months. Note: The information in this report represents historical data and is not an indication of future results.
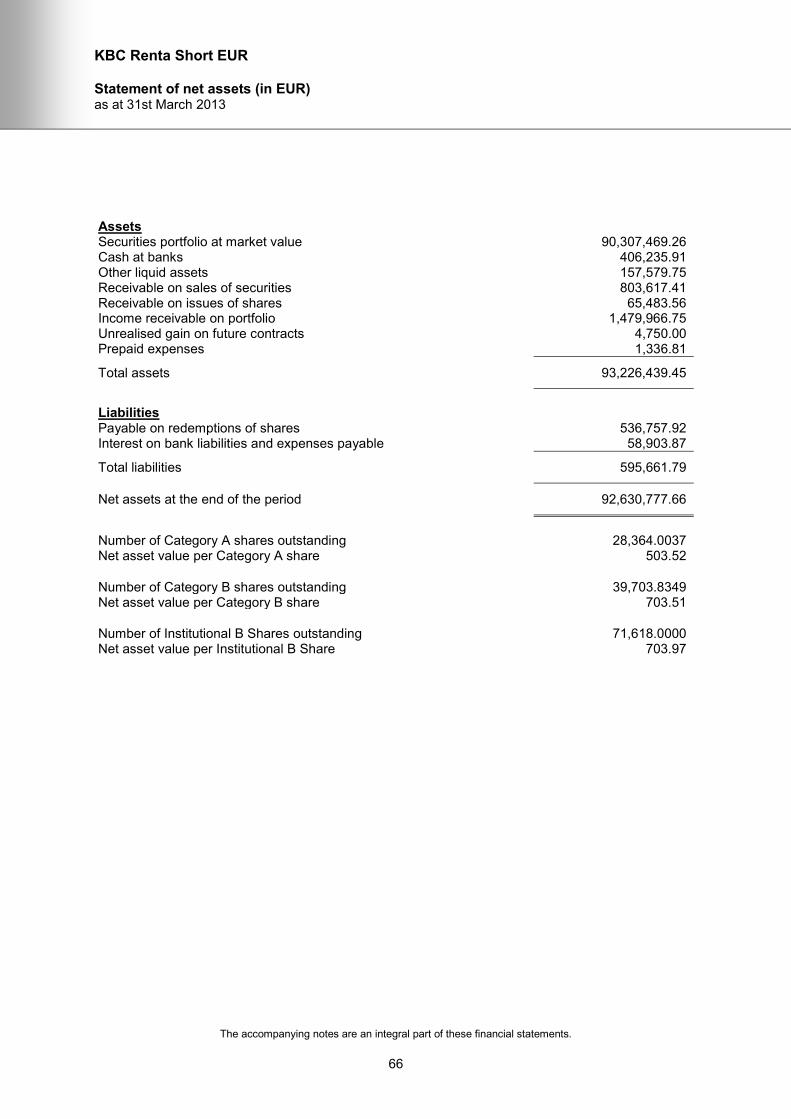
KBC Renta Short EUR
Statement of net assets (in EUR) as at 31st March 2013
The accompanying notes are an integral part of these financial statements.
66
Assets Securities portfolio at market value 90,307,469.26 Cash at banks 406,235.91 Other liquid assets 157,579.75 Receivable on sales of securities 803,617.41 Receivable on issues of shares 65,483.56 Income receivable on portfolio 1,479,966.75 Unrealised gain on future contracts 4,750.00 Prepaid expenses 1,336.81
Total assets 93,226,439.45
Liabilities Payable on redemptions of shares 536,757.92 Interest on bank liabilities and expenses payable 58,903.87
Total liabilities 595,661.79
Net assets at the end of the period 92,630,777.66
Number of Category A shares outstanding 28,364.0037 Net asset value per Category A share 503.52
Number of Category B shares outstanding 39,703.8349 Net asset value per Category B share 703.51
Number of Institutional B Shares outstanding 71,618.0000 Net asset value per Institutional B Share 703.97

KBC Renta Short EUR
Statistical information (in EUR) as at 31st March 2013
The accompanying notes are an integral part of these financial statements.
67
Total net assets
- as at 31.03.2013 92,630,777.66 - as at 30.09.2012 247,187,515.20 - as at 30.09.2011 192,026,585.29
Number of Category A shares
- outstanding at the beginning of the period 33,982.3142 - issued 886.0000 - redeemed -6,504.3105
- outstanding at the end of the period 28,364.0037
Net asset value per Category A share
- as at 31.03.2013 503.52 - as at 30.09.2012 507.26 - as at 30.09.2011 503.34
Dividend paid
Ex-dividend date 01.10.2012 Dividend per share 10.00 Shares outstanding at dividend date 33,982.3142
Number of Category B shares
- outstanding at the beginning of the period 45,212.6975 - issued 6,265.2455 - redeemed -11,774.1081
- outstanding at the end of the period 39,703.8349
Net asset value per Category B share
- as at 31.03.2013 703.51 - as at 30.09.2012 694.76 - as at 30.09.2011 674.31
Number of Institutional B Shares
- outstanding at the beginning of the period 285,637.0000 - issued 39,686.0000 - redeemed -253,705.0000
- outstanding at the end of the period 71,618.0000
Net asset value per Institutional B Share
- as at 31.03.2013 703.97 - as at 30.09.2012 695.07 - as at 30.09.2011 -

KBC Renta Short EUR
Statement of investments and other net assets (in EUR) as at 31st March 2013
The accompanying notes are an integral part of these financial statements.
68
Currency Number / nominal value
Description Cost Market value % of total net assets
Investments in securities
Transferable securities admitted to an official stock exchange listing
Bonds
EUR 1,000,000 Arcade Finance Plc FRN EMTN Ser 2007-2 Tr 1 07/10.05.14 1,003,693.03 1,002,474.86 1.08 EUR 2,500,000 Belgium 3.75% OLO Ser 46 05/28.09.15 2,733,250.00 2,715,062.50 2.93 EUR 2,500,000 Belgium 8% Ser 23 OLO 95/28.03.15 2,966,575.00 2,885,437.50 3.12 EUR 2,500,000 Deutschland 2.25% Ser 157 10/10.04.15 2,643,175.00 2,615,000.00 2.82 EUR 7,500,000 Deutschland 3.25% Ser 05 05/04.07.15 8,150,700.00 8,051,625.00 8.69 EUR 3,500,000 Espana 3% 10/30.04.15 3,406,354.68 3,533,950.00 3.82 EUR 2,000,000 Espana 3.15% 05/31.01.16 1,992,000.00 2,009,300.00 2.17 EUR 1,500,000 Espana 3.75% 12/31.10.15 1,525,512.27 1,532,325.00 1.65 EUR 2,700,000 Espana 4.4% T Bond 04/31.01.15 2,786,347.15 2,804,625.00 3.03 EUR 4,000,000 Espana 4.75% 98/30.07.14 4,184,883.13 4,151,400.00 4.48 EUR 1,000,000 Finland 4.25% T-Bonds 04/04.07.15 1,122,390.00 1,094,200.00 1.18 EUR 2,000,000 France 2% BTAN 10/12.07.15 2,093,200.00 2,081,700.00 2.24 EUR 7,000,000 France 2.5% BTAN 10/15.01.15 7,330,804.09 7,296,450.00 7.88 EUR 5,000,000 France 3% OAT 05/25.10.15 5,376,707.50 5,349,500.00 5.78 EUR 6,250,000 France 3.5% OAT 05/25.04.15 6,746,312.50 6,680,000.00 7.21 EUR 2,000,000 Italia 2.5% BTP 12/01.03.15 1,925,733.64 2,014,400.00 2.17 EUR 650,000 Italia 3% BTP 10/15.04.15 635,245.00 659,815.00 0.71 EUR 2,500,000 Italia 3% T-Bonds 10/15.06.15 2,412,175.00 2,527,500.00 2.73 EUR 2,500,000 Italia 3.75% BTP 05/01.08.15 2,563,625.00 2,570,500.00 2.78 EUR 3,850,000 Italia 4.25% BTP 04/01.02.15 3,953,761.23 4,002,075.00 4.32 EUR 1,200,000 Italia 4.5 BTP 12/15.07.15 1,202,928.00 1,253,880.00 1.35 EUR 6,850,000 Italia 6% BPT 11/15.11.14 7,398,849.40 7,290,455.00 7.87 EUR 2,250,000 Netherlands 0.75% EMTN 12/15.04.15 2,276,814.37 2,278,012.50 2.46 EUR 2,000,000 Netherlands 2.75% 09/15.01.15 2,119,677.50 2,095,200.00 2.26 EUR 1,000,000 Netherlands 3.25% 05/15.07.15 1,087,200.00 1,069,800.00 1.16 EUR 1,000,000 Oesterreich 3.4% 09/20.10.14 1,069,870.00 1,050,850.00 1.13 EUR 2,500,000 Oesterreich 3.5% EMTN 05/15.07.15 2,718,311.11 2,691,500.00 2.91
Total bonds 83,426,094.60 83,307,037.36 89.93
Other transferable securities
Bonds
EUR 3,500,000 Arcade Finance Plc FRN Ser 2008-17 Mez Sec Falco 08/14.05.13
3,500,671.88 3,500,215.95 3.78
EUR 3,500,000 D-Star Finance Plc FRN Ser 2008-5 Mez Sec Falcon 08/14.05.13
3,501,769.36 3,500,215.95 3.78
Total bonds 7,002,441.24 7,000,431.90 7.56
Total investments in securities 90,428,535.84 90,307,469.26 97.49
Cash at banks 406,235.91 0.44
Other net assets/(liabilities) 1,917,072.49 2.07
Total 92,630,777.66 100.00
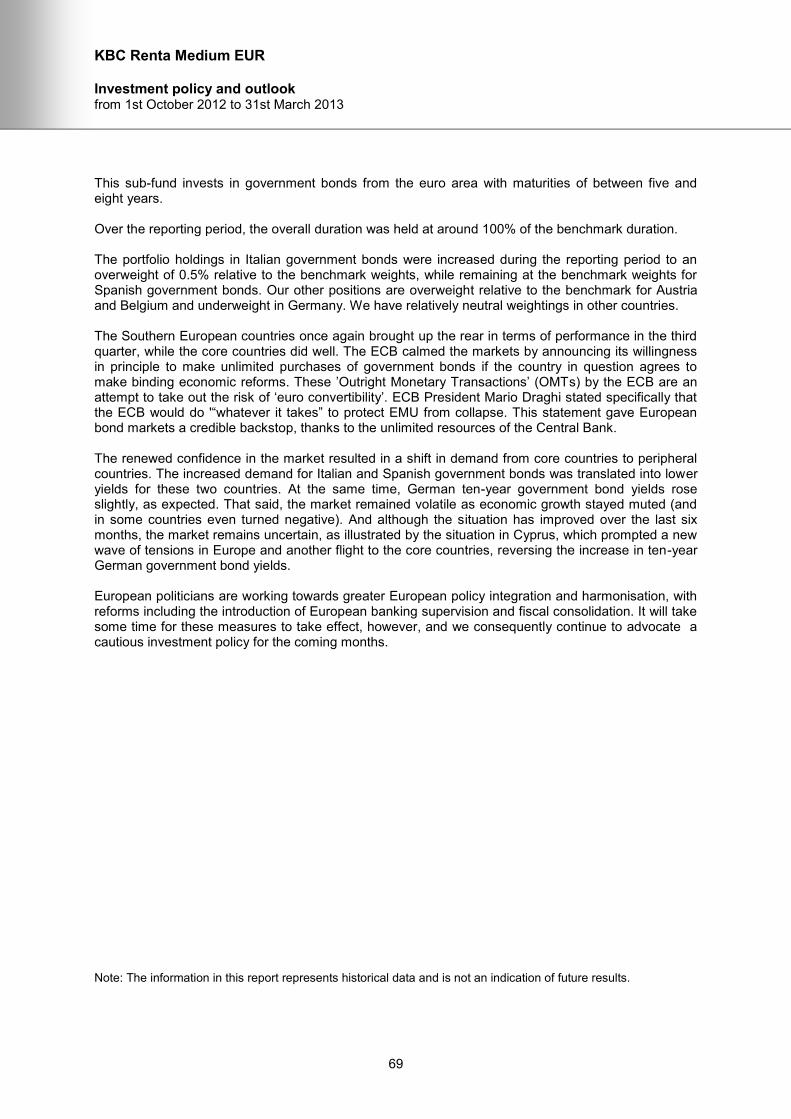
KBC Renta Medium EUR
Investment policy and outlook from 1st October 2012 to 31st March 2013
69
This sub-fund invests in government bonds from the euro area with maturities of between five and eight years. Over the reporting period, the overall duration was held at around 100% of the benchmark duration. The portfolio holdings in Italian government bonds were increased during the reporting period to an overweight of 0.5% relative to the benchmark weights, while remaining at the benchmark weights for Spanish government bonds. Our other positions are overweight relative to the benchmark for Austria and Belgium and underweight in Germany. We have relatively neutral weightings in other countries. The Southern European countries once again brought up the rear in terms of performance in the third quarter, while the core countries did well. The ECB calmed the markets by announcing its willingness in principle to make unlimited purchases of government bonds if the country in question agrees to make binding economic reforms. These ’Outright Monetary Transactions’ (OMTs) by the ECB are an attempt to take out the risk of ‘euro convertibility’. ECB President Mario Draghi stated specifically that the ECB would do '“whatever it takes” to protect EMU from collapse. This statement gave European bond markets a credible backstop, thanks to the unlimited resources of the Central Bank. The renewed confidence in the market resulted in a shift in demand from core countries to peripheral countries. The increased demand for Italian and Spanish government bonds was translated into lower yields for these two countries. At the same time, German ten-year government bond yields rose slightly, as expected. That said, the market remained volatile as economic growth stayed muted (and in some countries even turned negative). And although the situation has improved over the last six months, the market remains uncertain, as illustrated by the situation in Cyprus, which prompted a new wave of tensions in Europe and another flight to the core countries, reversing the increase in ten-year German government bond yields. European politicians are working towards greater European policy integration and harmonisation, with reforms including the introduction of European banking supervision and fiscal consolidation. It will take some time for these measures to take effect, however, and we consequently continue to advocate a cautious investment policy for the coming months. Note: The information in this report represents historical data and is not an indication of future results.
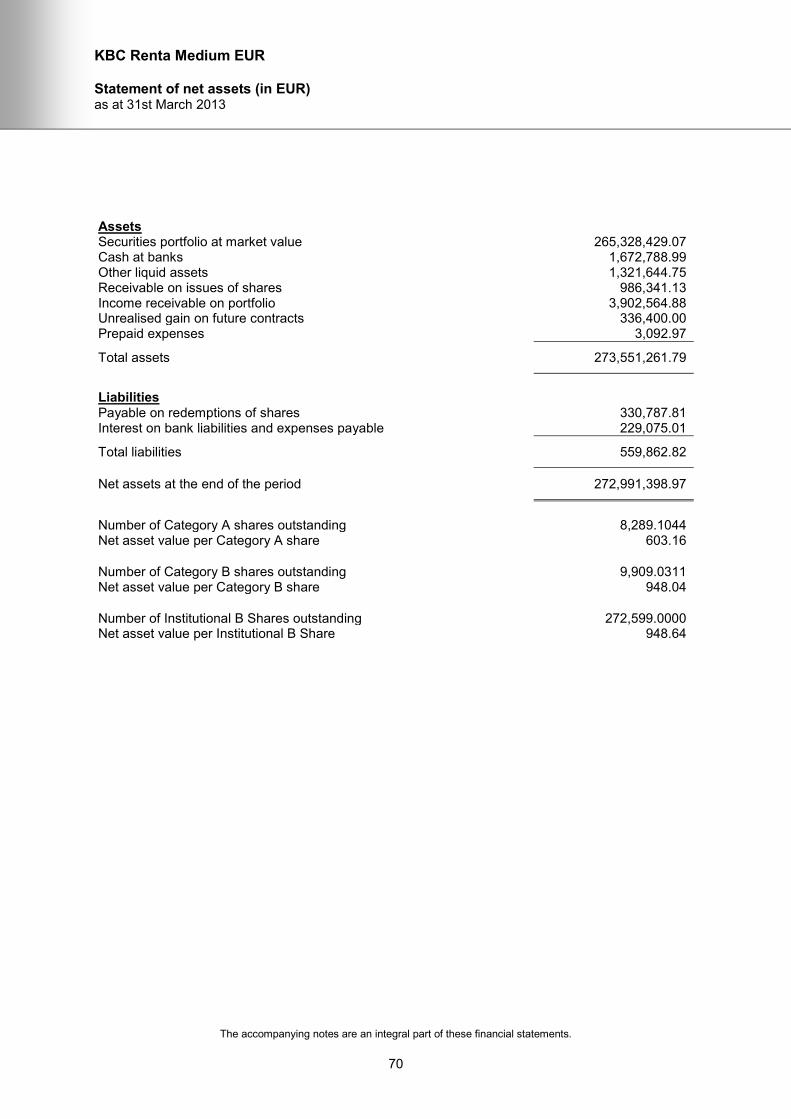
KBC Renta Medium EUR
Statement of net assets (in EUR) as at 31st March 2013
The accompanying notes are an integral part of these financial statements.
70
Assets Securities portfolio at market value 265,328,429.07 Cash at banks 1,672,788.99 Other liquid assets 1,321,644.75 Receivable on issues of shares 986,341.13 Income receivable on portfolio 3,902,564.88 Unrealised gain on future contracts 336,400.00 Prepaid expenses 3,092.97
Total assets 273,551,261.79
Liabilities Payable on redemptions of shares 330,787.81 Interest on bank liabilities and expenses payable 229,075.01
Total liabilities 559,862.82
Net assets at the end of the period 272,991,398.97
Number of Category A shares outstanding 8,289.1044 Net asset value per Category A share 603.16
Number of Category B shares outstanding 9,909.0311 Net asset value per Category B share 948.04
Number of Institutional B Shares outstanding 272,599.0000 Net asset value per Institutional B Share 948.64

KBC Renta Medium EUR
Statistical information (in EUR) as at 31st March 2013
The accompanying notes are an integral part of these financial statements.
71
Total net assets
- as at 31.03.2013 272,991,398.97 - as at 30.09.2012 274,262,727.72 - as at 30.09.2011 203,412,902.94
Number of Category A shares
- outstanding at the beginning of the period 8,881.9720 - issued 855.1044 - redeemed -1,447.9720
- outstanding at the end of the period 8,289.1044
Net asset value per Category A share
- as at 31.03.2013 603.16 - as at 30.09.2012 599.01 - as at 30.09.2011 576.50
Dividend paid
Ex-dividend date 01.10.2012 Dividend per share 18.00 Shares outstanding at dividend date 8,881.9720
Number of Category B shares
- outstanding at the beginning of the period 10,152.2496 - issued 7,676.0733 - redeemed -7,919.2918
- outstanding at the end of the period 9,909.0311
Net asset value per Category B share
- as at 31.03.2013 948.04 - as at 30.09.2012 913.17 - as at 30.09.2011 849.94
Number of Institutional B Shares
- outstanding at the beginning of the period 284,238.0000 - issued 476,395.0000 - redeemed -488,034.0000
- outstanding at the end of the period 272,599.0000
Net asset value per Institutional B Share
- as at 31.03.2013 948.64 - as at 30.09.2012 913.57 - as at 30.09.2011 -
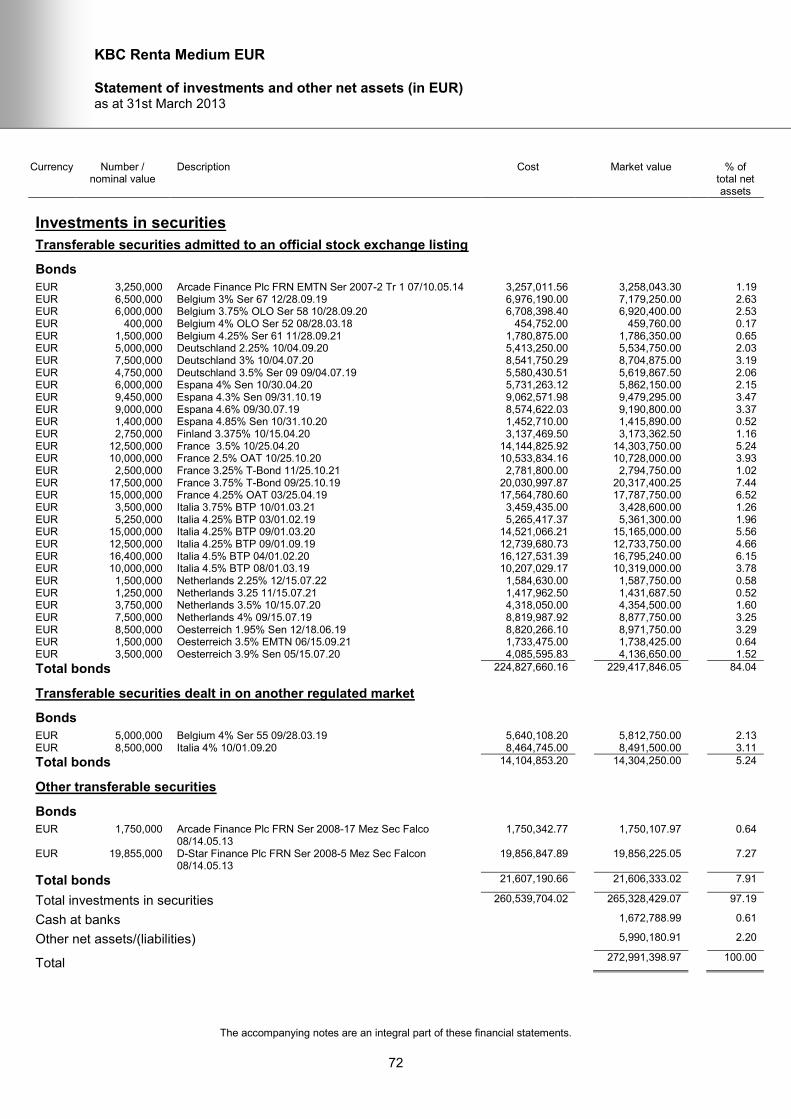
KBC Renta Medium EUR
Statement of investments and other net assets (in EUR) as at 31st March 2013
The accompanying notes are an integral part of these financial statements.
72
Currency Number / nominal value
Description Cost Market value % of total net assets
Investments in securities
Transferable securities admitted to an official stock exchange listing
Bonds
EUR 3,250,000 Arcade Finance Plc FRN EMTN Ser 2007-2 Tr 1 07/10.05.14 3,257,011.56 3,258,043.30 1.19 EUR 6,500,000 Belgium 3% Ser 67 12/28.09.19 6,976,190.00 7,179,250.00 2.63 EUR 6,000,000 Belgium 3.75% OLO Ser 58 10/28.09.20 6,708,398.40 6,920,400.00 2.53 EUR 400,000 Belgium 4% OLO Ser 52 08/28.03.18 454,752.00 459,760.00 0.17 EUR 1,500,000 Belgium 4.25% Ser 61 11/28.09.21 1,780,875.00 1,786,350.00 0.65 EUR 5,000,000 Deutschland 2.25% 10/04.09.20 5,413,250.00 5,534,750.00 2.03 EUR 7,500,000 Deutschland 3% 10/04.07.20 8,541,750.29 8,704,875.00 3.19 EUR 4,750,000 Deutschland 3.5% Ser 09 09/04.07.19 5,580,430.51 5,619,867.50 2.06 EUR 6,000,000 Espana 4% Sen 10/30.04.20 5,731,263.12 5,862,150.00 2.15 EUR 9,450,000 Espana 4.3% Sen 09/31.10.19 9,062,571.98 9,479,295.00 3.47 EUR 9,000,000 Espana 4.6% 09/30.07.19 8,574,622.03 9,190,800.00 3.37 EUR 1,400,000 Espana 4.85% Sen 10/31.10.20 1,452,710.00 1,415,890.00 0.52 EUR 2,750,000 Finland 3.375% 10/15.04.20 3,137,469.50 3,173,362.50 1.16 EUR 12,500,000 France 3.5% 10/25.04.20 14,144,825.92 14,303,750.00 5.24 EUR 10,000,000 France 2.5% OAT 10/25.10.20 10,533,834.16 10,728,000.00 3.93 EUR 2,500,000 France 3.25% T-Bond 11/25.10.21 2,781,800.00 2,794,750.00 1.02 EUR 17,500,000 France 3.75% T-Bond 09/25.10.19 20,030,997.87 20,317,400.25 7.44 EUR 15,000,000 France 4.25% OAT 03/25.04.19 17,564,780.60 17,787,750.00 6.52 EUR 3,500,000 Italia 3.75% BTP 10/01.03.21 3,459,435.00 3,428,600.00 1.26 EUR 5,250,000 Italia 4.25% BTP 03/01.02.19 5,265,417.37 5,361,300.00 1.96 EUR 15,000,000 Italia 4.25% BTP 09/01.03.20 14,521,066.21 15,165,000.00 5.56 EUR 12,500,000 Italia 4.25% BTP 09/01.09.19 12,739,680.73 12,733,750.00 4.66 EUR 16,400,000 Italia 4.5% BTP 04/01.02.20 16,127,531.39 16,795,240.00 6.15 EUR 10,000,000 Italia 4.5% BTP 08/01.03.19 10,207,029.17 10,319,000.00 3.78 EUR 1,500,000 Netherlands 2.25% 12/15.07.22 1,584,630.00 1,587,750.00 0.58 EUR 1,250,000 Netherlands 3.25 11/15.07.21 1,417,962.50 1,431,687.50 0.52 EUR 3,750,000 Netherlands 3.5% 10/15.07.20 4,318,050.00 4,354,500.00 1.60 EUR 7,500,000 Netherlands 4% 09/15.07.19 8,819,987.92 8,877,750.00 3.25 EUR 8,500,000 Oesterreich 1.95% Sen 12/18.06.19 8,820,266.10 8,971,750.00 3.29 EUR 1,500,000 Oesterreich 3.5% EMTN 06/15.09.21 1,733,475.00 1,738,425.00 0.64 EUR 3,500,000 Oesterreich 3.9% Sen 05/15.07.20 4,085,595.83 4,136,650.00 1.52
Total bonds 224,827,660.16 229,417,846.05 84.04
Transferable securities dealt in on another regulated market
Bonds
EUR 5,000,000 Belgium 4% Ser 55 09/28.03.19 5,640,108.20 5,812,750.00 2.13 EUR 8,500,000 Italia 4% 10/01.09.20 8,464,745.00 8,491,500.00 3.11
Total bonds 14,104,853.20 14,304,250.00 5.24
Other transferable securities
Bonds
EUR 1,750,000 Arcade Finance Plc FRN Ser 2008-17 Mez Sec Falco 08/14.05.13
1,750,342.77 1,750,107.97 0.64
EUR 19,855,000 D-Star Finance Plc FRN Ser 2008-5 Mez Sec Falcon 08/14.05.13
19,856,847.89 19,856,225.05 7.27
Total bonds 21,607,190.66 21,606,333.02 7.91
Total investments in securities 260,539,704.02 265,328,429.07 97.19
Cash at banks 1,672,788.99 0.61
Other net assets/(liabilities) 5,990,180.91 2.20
Total 272,991,398.97 100.00
KBC Renta Long EUR
Investment policy and outlook from 1st October 2012 to 31st March 2013
73
This sub-fund invests in government bonds from the euro area with maturities of between nine and 11 years. Over the reporting period, the overall duration was held at around 100% of the benchmark duration. The portfolio holdings in Italian government bonds were increased during the reporting period to an overweight of 0.5% relative to the benchmark weights, while remaining at the benchmark weights for Spanish government bonds. Our other positions are overweight relative to the benchmark for Austria and Belgium and underweight in Germany. We have relatively neutral weightings in other countries. The Southern European countries once again brought up the rear in terms of performance in the third quarter, while the core countries did well. The ECB calmed the markets by announcing its willingness in principle to make unlimited purchases of government bonds if the country in question agrees to make binding economic reforms. These ’Outright Monetary Transactions’ (OMTs) by the ECB are an attempt to take out the risk of ‘euro convertibility’. ECB President Mario Draghi stated specifically that the ECB would do '“whatever it takes” to protect EMU from collapse. This statement gave European bond markets a credible backstop, thanks to the unlimited resources of the Central Bank. The renewed confidence in the market resulted in a shift in demand from core countries to peripheral countries. The increased demand for Italian and Spanish government bonds was translated into lower yields for these two countries. At the same time, German ten-year government bond yields rose slightly, as expected. That said, the market remained volatile as economic growth stayed muted (and in some countries even turned negative). And although the situation has improved over the last six months, the market remains uncertain, as illustrated by the situation in Cyprus, which prompted a new wave of tensions in Europe and another flight to the core countries, reversing the increase in ten-year German government bond yields. European politicians are working towards greater European policy integration and harmonisation, with reforms including the introduction of European banking supervision and fiscal consolidation. It will take some time for these measures to take effect, however, and we consequently continue to advocate a cautious investment policy for the coming months. Note: The information in this report represents historical data and is not an indication of future results.
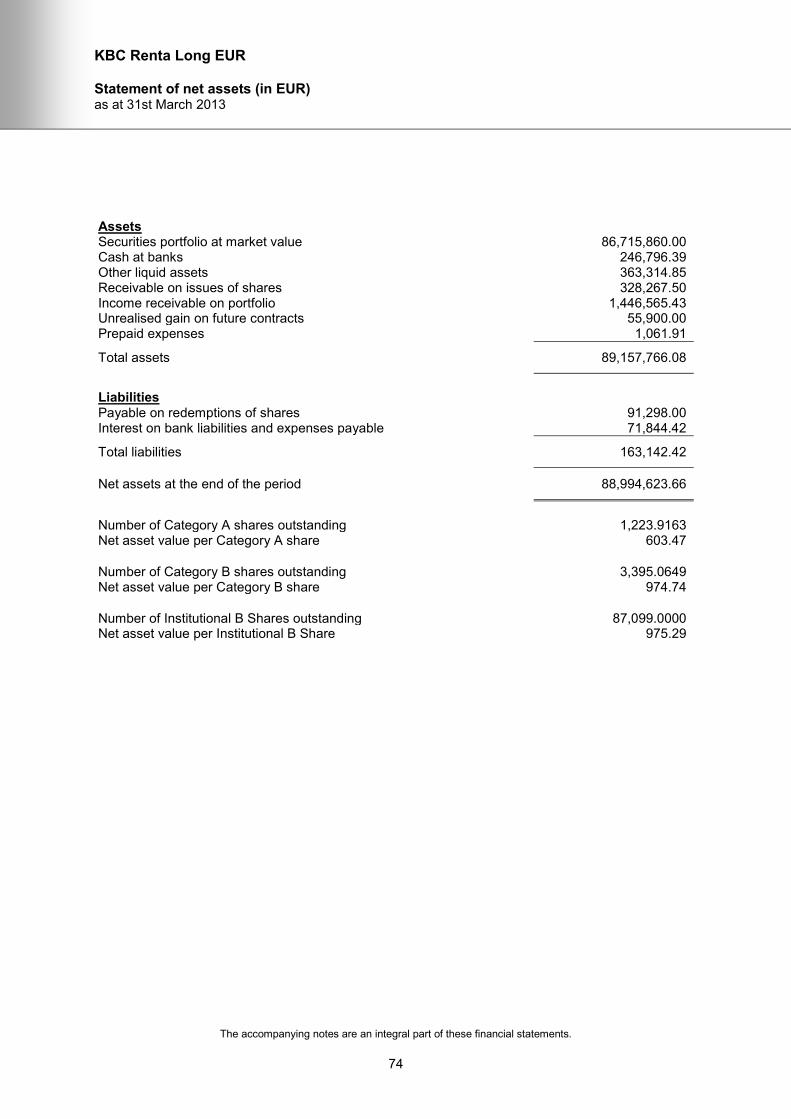
KBC Renta Long EUR
Statement of net assets (in EUR) as at 31st March 2013
The accompanying notes are an integral part of these financial statements.
74
Assets Securities portfolio at market value 86,715,860.00 Cash at banks 246,796.39 Other liquid assets 363,314.85 Receivable on issues of shares 328,267.50 Income receivable on portfolio 1,446,565.43 Unrealised gain on future contracts 55,900.00 Prepaid expenses 1,061.91
Total assets 89,157,766.08
Liabilities Payable on redemptions of shares 91,298.00 Interest on bank liabilities and expenses payable 71,844.42
Total liabilities 163,142.42
Net assets at the end of the period 88,994,623.66
Number of Category A shares outstanding 1,223.9163 Net asset value per Category A share 603.47
Number of Category B shares outstanding 3,395.0649 Net asset value per Category B share 974.74
Number of Institutional B Shares outstanding 87,099.0000 Net asset value per Institutional B Share 975.29
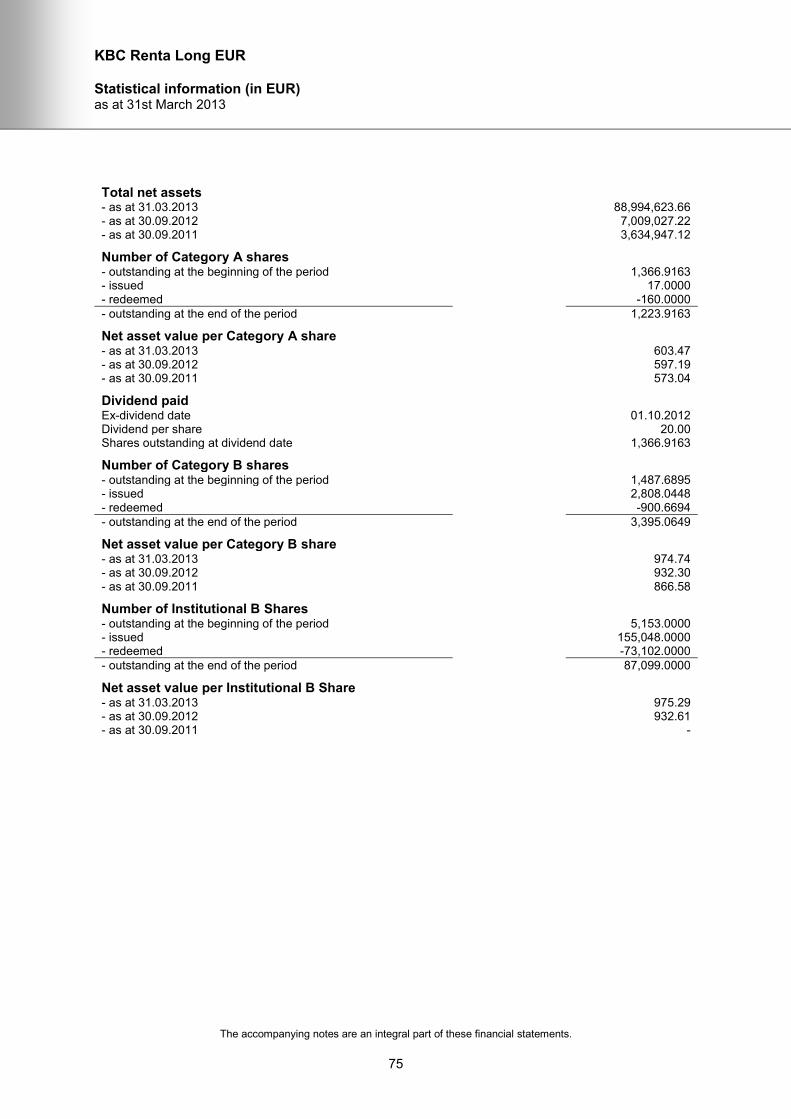
KBC Renta Long EUR
Statistical information (in EUR) as at 31st March 2013
The accompanying notes are an integral part of these financial statements.
75
Total net assets
- as at 31.03.2013 88,994,623.66 - as at 30.09.2012 7,009,027.22 - as at 30.09.2011 3,634,947.12
Number of Category A shares
- outstanding at the beginning of the period 1,366.9163 - issued 17.0000 - redeemed -160.0000
- outstanding at the end of the period 1,223.9163
Net asset value per Category A share
- as at 31.03.2013 603.47 - as at 30.09.2012 597.19 - as at 30.09.2011 573.04
Dividend paid
Ex-dividend date 01.10.2012 Dividend per share 20.00 Shares outstanding at dividend date 1,366.9163
Number of Category B shares
- outstanding at the beginning of the period 1,487.6895 - issued 2,808.0448 - redeemed -900.6694
- outstanding at the end of the period 3,395.0649
Net asset value per Category B share
- as at 31.03.2013 974.74 - as at 30.09.2012 932.30 - as at 30.09.2011 866.58
Number of Institutional B Shares
- outstanding at the beginning of the period 5,153.0000 - issued 155,048.0000 - redeemed -73,102.0000
- outstanding at the end of the period 87,099.0000
Net asset value per Institutional B Share
- as at 31.03.2013 975.29 - as at 30.09.2012 932.61 - as at 30.09.2011 -
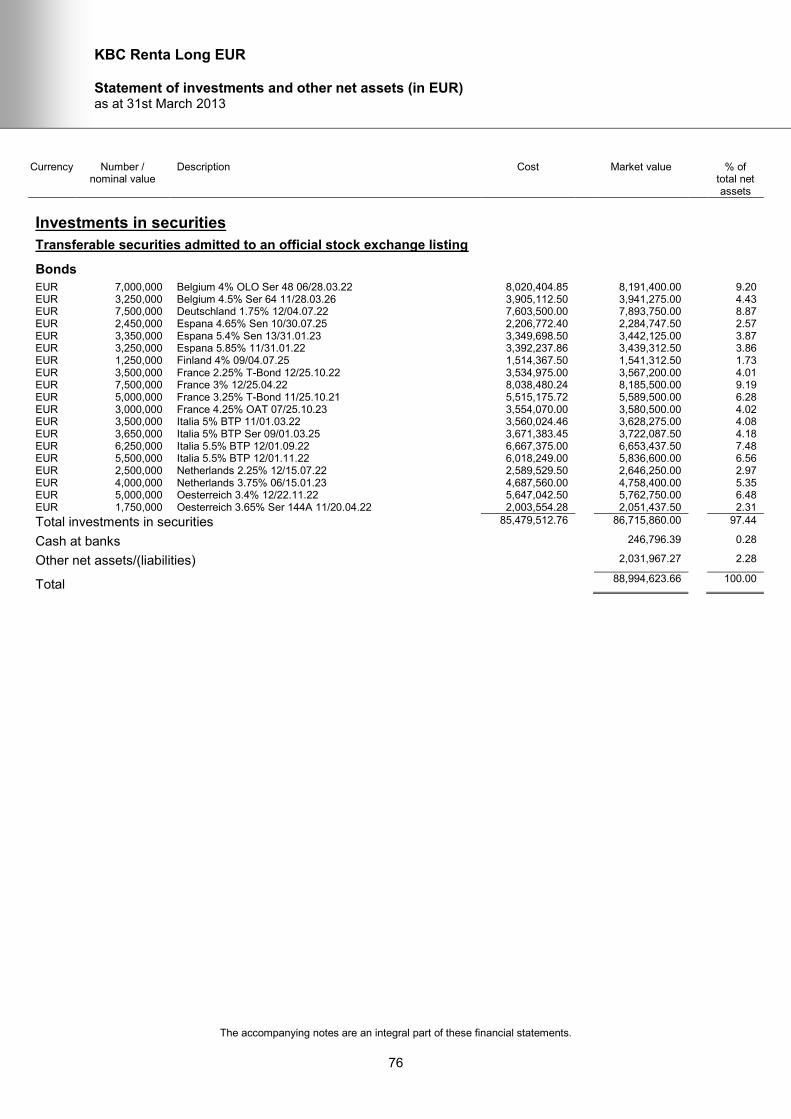
KBC Renta Long EUR
Statement of investments and other net assets (in EUR) as at 31st March 2013
The accompanying notes are an integral part of these financial statements.
76
Currency Number / nominal value
Description Cost Market value % of total net assets
Investments in securities
Transferable securities admitted to an official stock exchange listing
Bonds
EUR 7,000,000 Belgium 4% OLO Ser 48 06/28.03.22 8,020,404.85 8,191,400.00 9.20 EUR 3,250,000 Belgium 4.5% Ser 64 11/28.03.26 3,905,112.50 3,941,275.00 4.43 EUR 7,500,000 Deutschland 1.75% 12/04.07.22 7,603,500.00 7,893,750.00 8.87 EUR 2,450,000 Espana 4.65% Sen 10/30.07.25 2,206,772.40 2,284,747.50 2.57 EUR 3,350,000 Espana 5.4% Sen 13/31.01.23 3,349,698.50 3,442,125.00 3.87 EUR 3,250,000 Espana 5.85% 11/31.01.22 3,392,237.86 3,439,312.50 3.86 EUR 1,250,000 Finland 4% 09/04.07.25 1,514,367.50 1,541,312.50 1.73 EUR 3,500,000 France 2.25% T-Bond 12/25.10.22 3,534,975.00 3,567,200.00 4.01 EUR 7,500,000 France 3% 12/25.04.22 8,038,480.24 8,185,500.00 9.19 EUR 5,000,000 France 3.25% T-Bond 11/25.10.21 5,515,175.72 5,589,500.00 6.28 EUR 3,000,000 France 4.25% OAT 07/25.10.23 3,554,070.00 3,580,500.00 4.02 EUR 3,500,000 Italia 5% BTP 11/01.03.22 3,560,024.46 3,628,275.00 4.08 EUR 3,650,000 Italia 5% BTP Ser 09/01.03.25 3,671,383.45 3,722,087.50 4.18 EUR 6,250,000 Italia 5.5% BTP 12/01.09.22 6,667,375.00 6,653,437.50 7.48 EUR 5,500,000 Italia 5.5% BTP 12/01.11.22 6,018,249.00 5,836,600.00 6.56 EUR 2,500,000 Netherlands 2.25% 12/15.07.22 2,589,529.50 2,646,250.00 2.97 EUR 4,000,000 Netherlands 3.75% 06/15.01.23 4,687,560.00 4,758,400.00 5.35 EUR 5,000,000 Oesterreich 3.4% 12/22.11.22 5,647,042.50 5,762,750.00 6.48 EUR 1,750,000 Oesterreich 3.65% Ser 144A 11/20.04.22 2,003,554.28 2,051,437.50 2.31
Total investments in securities 85,479,512.76 86,715,860.00 97.44
Cash at banks 246,796.39 0.28
Other net assets/(liabilities) 2,031,967.27 2.28
Total 88,994,623.66 100.00
KBC Renta Zlotyrenta
Investment policy and outlook from 1st October 2012 to 31st March 2013
77
The last six months can be broadly divided into three periods. In the first, between October 2012 and the end of December 2012, prices of Polish bonds were rising. Yields on benchmark securities decreased as follows: two-year maturities - from 4.05% to 3.12%, five-year - from 4.19% to 3.22%,ten-year - from 4.68% to 3.73%. In the second period between December 2012 and the beginning of March 2013, domestic debt had an impact on prices. Yields increased to 3.56% (two-year maturities), 3.70% (five-year) and 4.11% (ten-year). The third and final period (March 2013) was good, with two-year, five-year and ten-year yields falling to 3.15%, 3.45% and 3.92%, respectively. Over the whole six-month period, i.e. the fourth quarter of 2012 and the first quarter of 2013, bond yields overall. Two-year bonds dropped most, by around 90 basis points, while five and ten-year bond yields each felly some 75 basis points. Factors that influenced investors' decisions can be divided into two categories: external and internal. The biggest external factor driving debt market sentiment was the global investment climate. In the first period there was a deterioration in sentiment towards bonds in the global markets, chiefly because of the good macroeconomic data coming from the USA in particular. Internal factors were related to Polish economic data, especially inflation and the interest rate policy as set by the National Bank of Poland’s Monetary Policy Council. The macroeconomic data published during the period were negative and thus supported the demand for Polish bonds. PMI manufacturing in 4Q 2012 was the weakest for three years. CPI fell year-on-year from 3.8% at the beginning of period to 1.3% at the end of the first quarter of 2013. Industrial production and retail sales were also disappointing. The weaker data prompted a change in the rhetoric coming from the MPC. Between November 2012 and March 2013 the MPC cut interest rates five times by a total of 150 basis points. Polish government bonds were the largest component in the portfolio. Corporate bonds accounted for a very small percentage of just 0.52% From October to December 2012, the KBC Renta Zloty portfolio was slightly overweight in comparison to the benchmark. At the end of 2012 the duration was adjusted to bring it into line with the benchmark. Between January and February the portfolio duration was still balanced around the benchmark, but was increased in the second half of March to around 110%. The selection generated moderately positive results. The portfolio consisted mostly of instruments at the long end of the yield curve. The most overweight maturity segments were 7- 10 years and 10-20 years. This proved to be a good move; although the yield curve became steeper in the short term, in January and February, the change was small. The result for the two quarters under review (Q4 2012 and Q1 2013) was slightly below that of the benchmark. The difference, calculated as unit value and cost-adjusted benchmark was 0,05. However, the results both at the end of 2012 and at the end of Q1 2013 were above the benchmark (0.16 and 0.02, respectively). We are maintaining our positive view of the market. Recent increases in bond prices in Europe will support the Polish debt market. Yields on ten-year German bonds dropped from 1.46% at the beginning of March to 1.28% at the end of the month. The fiscal position in Poland remains stable. More than 60% of the government's borrowing requirements for this year are currently covered, partly due to pre-financing in 2012. Poland should still perform above the average for Europe, and especially Southern Europe. The main risk to our scenario could be a bigger than expected slowdown. That could spark foreign investors’ concerns regarding the public finance deficit and lead to increased sales of bonds at the long end of the yield curve. The weakening of the Polish zloty could also hit sentiment. The zloty lost around 0.75% against the euro in March, though taken over the period October 2012 - March 2013, the zloty strengthened by around 1.5% against the euro. Note: The information in this report represents historical data and is not an indication of future results.
KBC Renta Zlotyrenta
Statement of net assets (in PLN) as at 31st March 2013
The accompanying notes are an integral part of these financial statements.
78
Assets Securities portfolio at market value 602,319,877.60 Cash at banks 6,746,005.73 Receivable on treasury transactions 509.59 Receivable on issues of shares 125,511.25 Income receivable on portfolio 9,429,354.80 Interest receivable on bank accounts 3,273.57 Prepaid expenses 6,426.44
Total assets 618,630,958.98
Liabilities Payable on redemptions of shares 409,209.34 Interest on bank liabilities and expenses payable 679,013.29
Total liabilities 1,088,222.63
Net assets at the end of the period 617,542,736.35
Number of Category A shares outstanding 68,466.5858 Net asset value per Category A share 2,003.16
Number of Category B shares outstanding 47,428.7155 Net asset value per Category B share 3,003.65
Number of Institutional B Shares outstanding 112,435.0000 Net asset value per Institutional B Share 3,005.59

KBC Renta Zlotyrenta
Statistical information (in PLN) as at 31st March 2013
The accompanying notes are an integral part of these financial statements.
79
Total net assets
- as at 31.03.2013 617,542,736.35 - as at 30.09.2012 363,143,198.55 - as at 30.09.2011 875,472,284.10
Number of Category A shares
- outstanding at the beginning of the period 71,020.2917 - issued 8,369.4952 - redeemed -10,923.2011
- outstanding at the end of the period 68,466.5858
Net asset value per Category A share
- as at 31.03.2013 2,003.16 - as at 30.09.2012 2,008.37 - as at 30.09.2011 1,948.68
Dividend paid
Ex-dividend date 01.10.2012 Dividend per share 95.00 Shares outstanding at dividend date 71,020.2917
Number of Category B shares
- outstanding at the beginning of the period 32,487.2617 - issued 20,211.5812 - redeemed -5,270.1274
- outstanding at the end of the period 47,428.7155
Net asset value per Category B share
- as at 31.03.2013 3,003.65 - as at 30.09.2012 2,868.84 - as at 30.09.2011 2,640.19
Number of Institutional B Shares
- outstanding at the beginning of the period 44,356.0000 - issued 68,079.0000 - redeemed 0.0000
- outstanding at the end of the period 112,435.0000
Net asset value per Institutional B Share
- as at 31.03.2013 3,005.59 - as at 30.09.2012 2,870.13 - as at 30.09.2011 -
KBC Renta Zlotyrenta
Statement of investments and other net assets (in PLN) as at 31st March 2013
The accompanying notes are an integral part of these financial statements.
80
Currency Number / nominal value
Description Cost Market value % of total net assets
Investments in securities
Transferable securities admitted to an official stock exchange listing
Bonds
PLN 1,000,000 General Electric Capital Corp 5.36% EMTN Sen 07/10.05.17 936,368.93 1,066,880.00 0.17 PLN 1,634,000 LB Hessen-Thueringen GZ 11% EMTN Sen 01/11.07.16 2,032,696.00 1,967,172.60 0.32 PLN 30,000,000 Poland 0% Ser 0114 11/25.01.14 27,586,200.00 29,262,000.00 4.74 PLN 29,000,000 Poland 0% Ser 713 11/25.07.13 27,292,944.00 28,733,200.00 4.65 PLN 10,000,000 Poland 0% Ser OK0714 12/25.07.14 9,046,000.00 9,617,500.00 1.56 PLN 126,000,000 Poland 4% Ser DS1023 12/25.10.23 126,975,250.00 126,819,000.00 20.54 PLN 110,000,000 Poland 4.75% Ser 1016 11/25.10.16 114,551,709.53 115,425,200.00 18.69 PLN 15,000,000 Poland 5% Ser 1013 02/24.10.13 15,116,000.00 15,155,250.00 2.45 PLN 57,000,000 Poland 5.25% Ser 1017 06/25.10.17 61,509,500.00 61,488,750.00 9.96 PLN 5,000,000 Poland 5.25% Ser 1020 09/25.10.20 5,524,500.00 5,519,500.00 0.89 PLN 800,000 Poland 5.75% Ser 0429 08/25.04.29 824,029.88 951,600.00 0.15 PLN 99,000,000 Poland 5.75% Ser 1021 11/25.10.21 113,206,500.00 112,978,800.00 18.30 PLN 23,500,000 Poland 5.75% Ser WS0922 02/23.09.22 26,631,623.43 26,934,525.00 4.36 PLN 35,000,000 Poland 6.25% Ser DS1015 04/24.10.15 37,611,000.00 37,618,000.00 6.09 PLN 29,000,000 Poland FRN Ser 0121 10/25.01.21 28,604,951.43 28,782,500.00 4.66
Total investments in securities 597,449,273.20 602,319,877.60 97.53
Cash at banks 6,746,005.73 1.09
Other net assets/(liabilities) 8,476,853.02 1.38
Total 617,542,736.35 100.00
KBC Renta Forintrenta
Investment policy and outlook from 1st October 2012 to 31st March 2013
81
Principal market developments in the past six months The Monetary Council of the Central Bank of Hungary has cut interest rates eight times since August 2012, by 25 bp each time, taking the base cut from 7% to 5%. These rate cuts prompted a rally on the Hungarian government bond market over the same period, with yields rising by around 150-200 bps at the short end of the yield curve and some 100 bps at the long end. Ten-year government bonds recently touched the 5.6% level. The main domestic drivers behind the market rally were the interest rate cuts and the strict budget policy pursued by central government: the budget deficit amounted to 2.1% of GDP in 2012. The international market climate was also supportive of Hungarian assets as central banks continued their stimulus measures and investors continued to seek higher yields on the markets. In the meantime, non-resident holdings of Hungarian government bonds rose from HUF 3,800 billion (January 2012) to over HUF 5,000 billion in Q1 2013. Positioning of the Fund Given the market uncertainty regarding the replacement of the Central Bank Governor and the introduction of unorthodox monetary policy measures, we remained cautious and positioned the Fund close to the benchmark throughout the reporting period, despite the supportive international market environment. Outlook for the coming months The continuing yield-hunting by international investors is expected to be a supportive factor for Hungarian government bonds in the coming period. The short end of the yield curve is pricing in anticipated further rate cuts by the Central Bank’s Monetary Council, with the market expecting a further 100 bps rate cut. We also expect to see further fiscal consolidation measures being announced as part of the convergence plan, as the government’s budget deficit target of 2.7% of GDP does not yet seem assured. Continuation of the strict budget policy may support Hungarian assets in the coming months, however, we do not anticipate that the European Commission will end the Excessive Deficit Procedure in Q2, but may well delay its decision regarding the EDP until autumn. In the light of the above factors, we will keep the Fund slightly overweight relative to the benchmark in the coming period. Note: The information in this report represents historical data and is not an indication of future results.
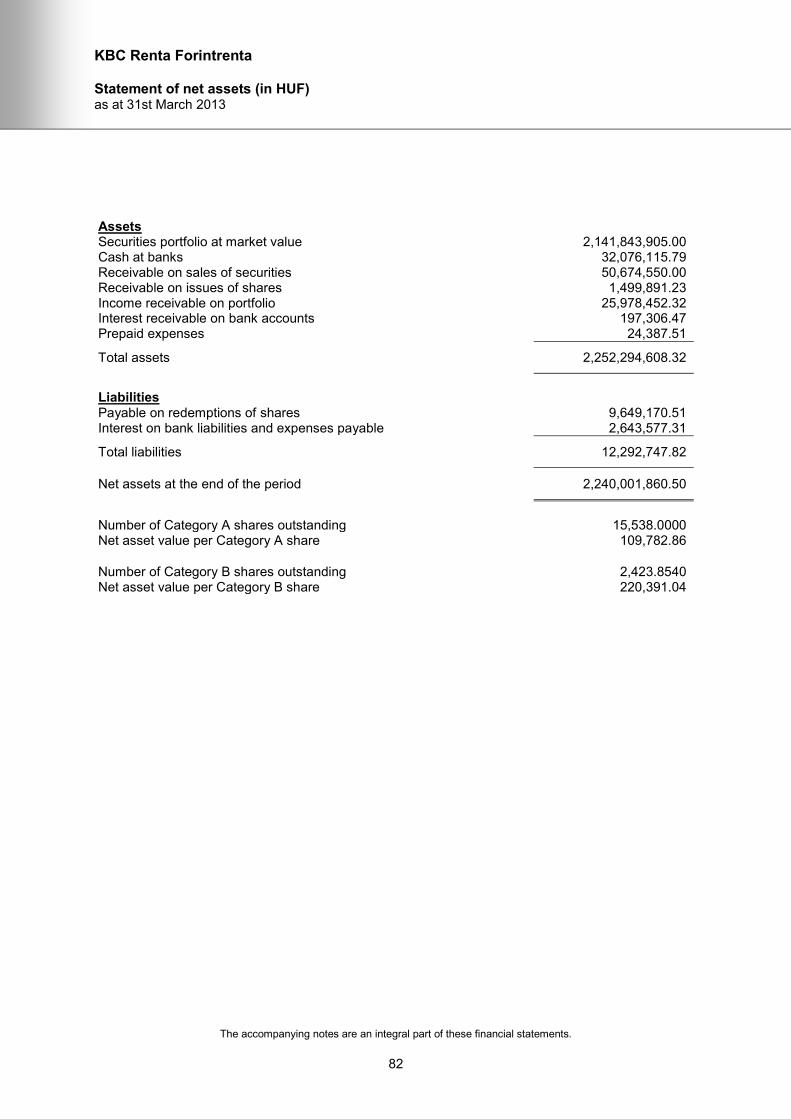
KBC Renta Forintrenta
Statement of net assets (in HUF) as at 31st March 2013
The accompanying notes are an integral part of these financial statements.
82
Assets Securities portfolio at market value 2,141,843,905.00 Cash at banks 32,076,115.79 Receivable on sales of securities 50,674,550.00 Receivable on issues of shares 1,499,891.23 Income receivable on portfolio 25,978,452.32 Interest receivable on bank accounts 197,306.47 Prepaid expenses 24,387.51
Total assets 2,252,294,608.32
Liabilities Payable on redemptions of shares 9,649,170.51 Interest on bank liabilities and expenses payable 2,643,577.31
Total liabilities 12,292,747.82
Net assets at the end of the period 2,240,001,860.50
Number of Category A shares outstanding 15,538.0000 Net asset value per Category A share 109,782.86
Number of Category B shares outstanding 2,423.8540 Net asset value per Category B share 220,391.04
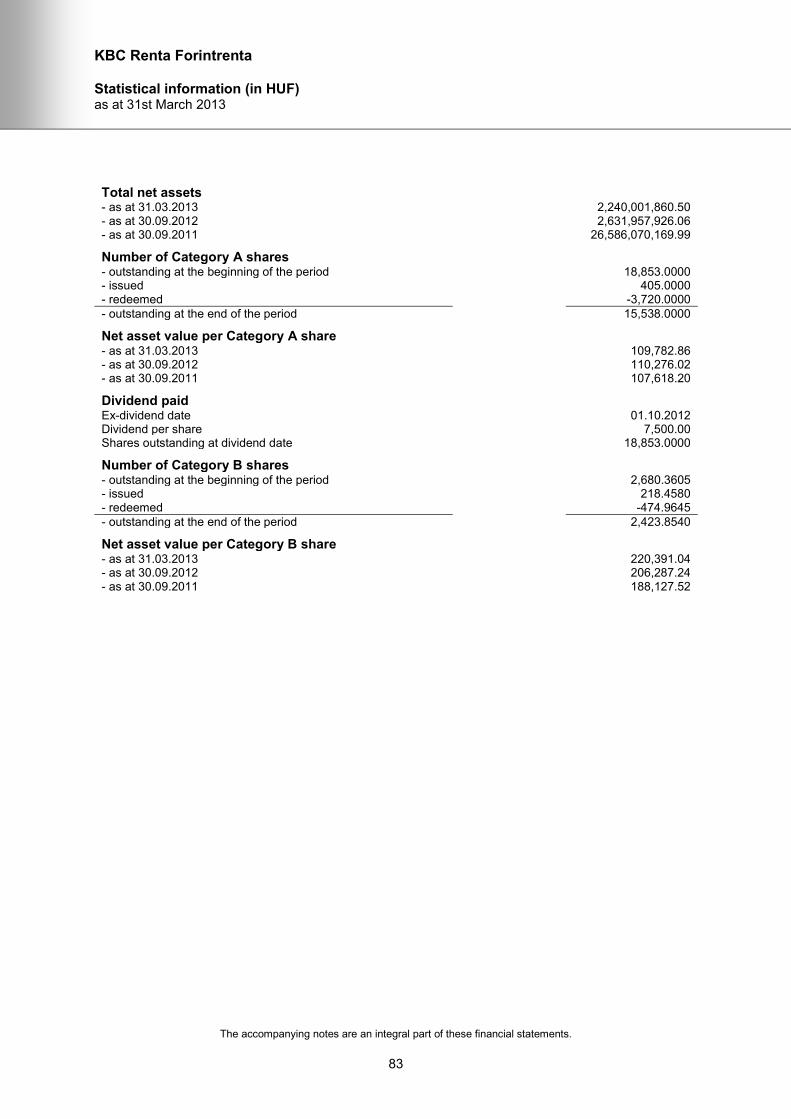
KBC Renta Forintrenta
Statistical information (in HUF) as at 31st March 2013
The accompanying notes are an integral part of these financial statements.
83
Total net assets
- as at 31.03.2013 2,240,001,860.50 - as at 30.09.2012 2,631,957,926.06 - as at 30.09.2011 26,586,070,169.99
Number of Category A shares
- outstanding at the beginning of the period 18,853.0000 - issued 405.0000 - redeemed -3,720.0000
- outstanding at the end of the period 15,538.0000
Net asset value per Category A share
- as at 31.03.2013 109,782.86 - as at 30.09.2012 110,276.02 - as at 30.09.2011 107,618.20
Dividend paid
Ex-dividend date 01.10.2012 Dividend per share 7,500.00 Shares outstanding at dividend date 18,853.0000
Number of Category B shares
- outstanding at the beginning of the period 2,680.3605 - issued 218.4580 - redeemed -474.9645
- outstanding at the end of the period 2,423.8540
Net asset value per Category B share
- as at 31.03.2013 220,391.04 - as at 30.09.2012 206,287.24 - as at 30.09.2011 188,127.52
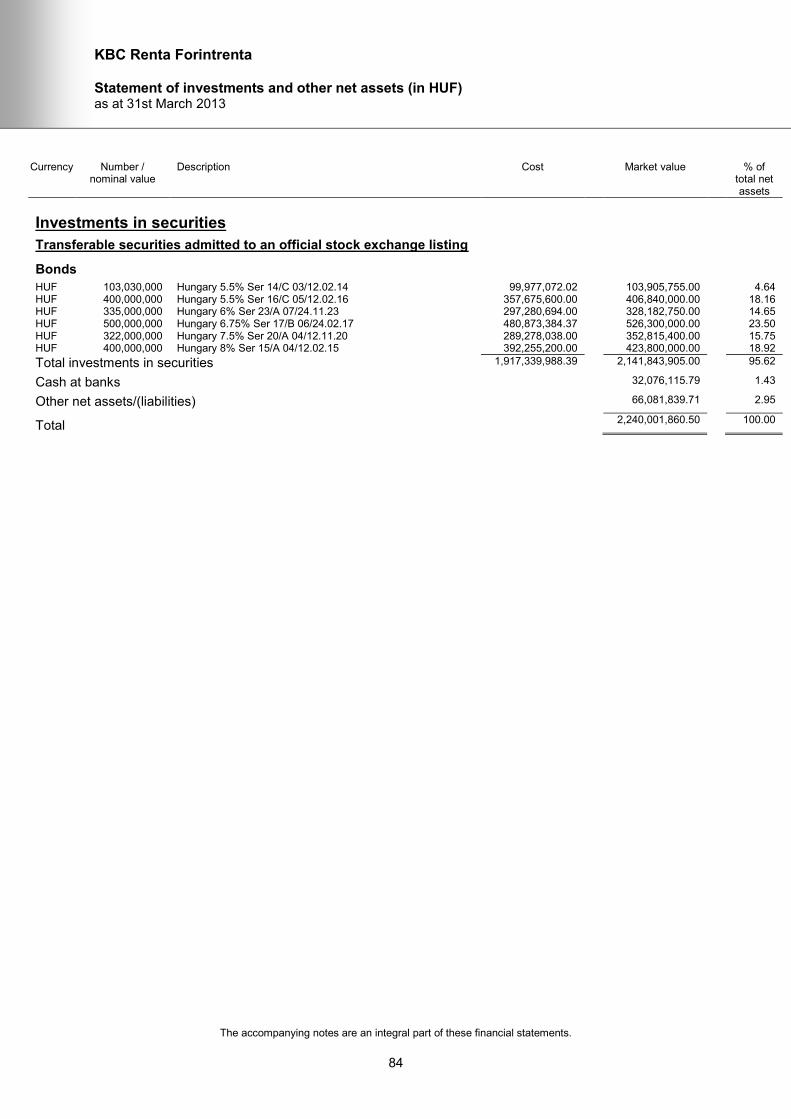
KBC Renta Forintrenta
Statement of investments and other net assets (in HUF) as at 31st March 2013
The accompanying notes are an integral part of these financial statements.
84
Currency Number / nominal value
Description Cost Market value % of total net assets
Investments in securities
Transferable securities admitted to an official stock exchange listing
Bonds
HUF 103,030,000 Hungary 5.5% Ser 14/C 03/12.02.14 99,977,072.02 103,905,755.00 4.64 HUF 400,000,000 Hungary 5.5% Ser 16/C 05/12.02.16 357,675,600.00 406,840,000.00 18.16 HUF 335,000,000 Hungary 6% Ser 23/A 07/24.11.23 297,280,694.00 328,182,750.00 14.65 HUF 500,000,000 Hungary 6.75% Ser 17/B 06/24.02.17 480,873,384.37 526,300,000.00 23.50 HUF 322,000,000 Hungary 7.5% Ser 20/A 04/12.11.20 289,278,038.00 352,815,400.00 15.75 HUF 400,000,000 Hungary 8% Ser 15/A 04/12.02.15 392,255,200.00 423,800,000.00 18.92
Total investments in securities 1,917,339,988.39 2,141,843,905.00 95.62
Cash at banks 32,076,115.79 1.43
Other net assets/(liabilities) 66,081,839.71 2.95
Total 2,240,001,860.50 100.00
KBC Renta Slovakrenta
Investment policy and outlook from 1st October 2012 to 31st March 2013
85
This sub-fund chiefly invests in Slovakian government paper supplemented by a limited number of high-value Eurobonds. The Slovakian economy recorded positive growth in the period under review, driven primarily by exports, as domestic demand remained low. New fiscal measures by the government are intended to hold the budget deficit within the 3% norm. Uncertain economic conditions meant that a neutral maturity strategy was pursued in the fund. Note: The information in this report represents historical data and is not an indication of future results.
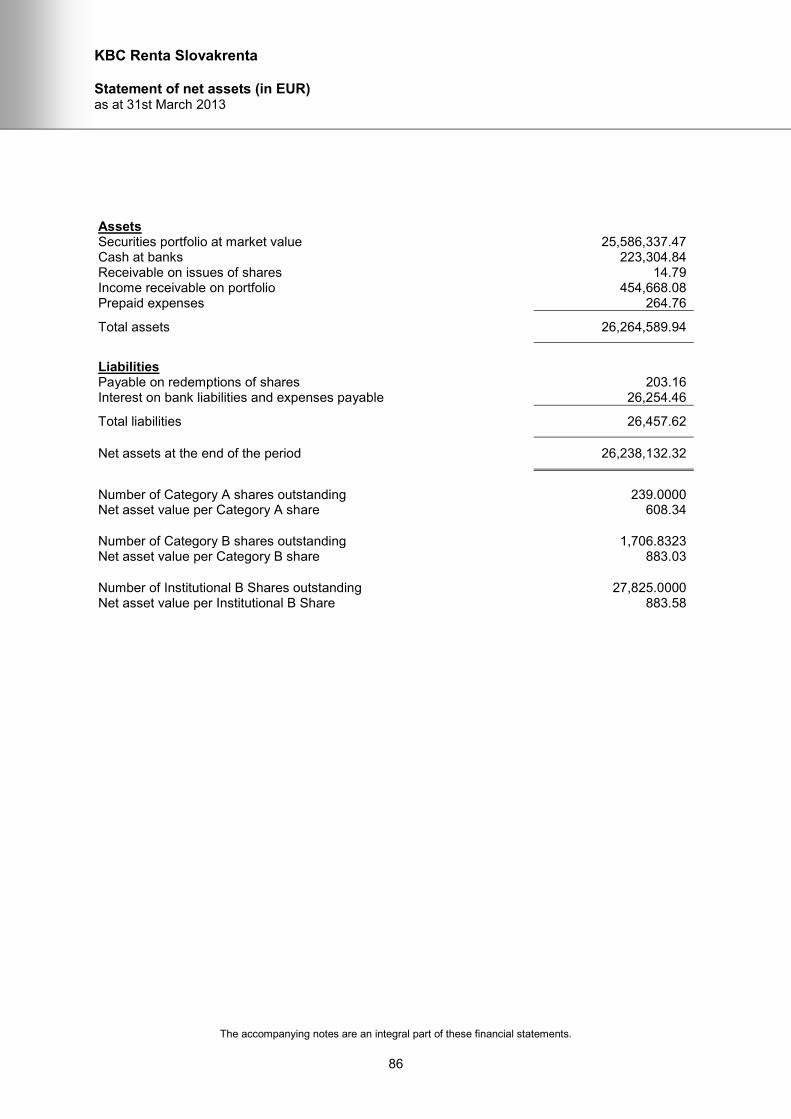
KBC Renta Slovakrenta
Statement of net assets (in EUR) as at 31st March 2013
The accompanying notes are an integral part of these financial statements.
86
Assets Securities portfolio at market value 25,586,337.47 Cash at banks 223,304.84 Receivable on issues of shares 14.79 Income receivable on portfolio 454,668.08 Prepaid expenses 264.76
Total assets 26,264,589.94
Liabilities Payable on redemptions of shares 203.16 Interest on bank liabilities and expenses payable 26,254.46
Total liabilities 26,457.62
Net assets at the end of the period 26,238,132.32
Number of Category A shares outstanding 239.0000 Net asset value per Category A share 608.34
Number of Category B shares outstanding 1,706.8323 Net asset value per Category B share 883.03
Number of Institutional B Shares outstanding 27,825.0000 Net asset value per Institutional B Share 883.58

KBC Renta Slovakrenta
Statistical information (in EUR) as at 31st March 2013
The accompanying notes are an integral part of these financial statements.
87
Total net assets
- as at 31.03.2013 26,238,132.32 - as at 30.09.2012 25,856,320.31 - as at 30.09.2011 24,961,307.74
Number of Category A shares
- outstanding at the beginning of the period 239.0000 - issued 2.0000 - redeemed -2.0000
- outstanding at the end of the period 239.0000
Net asset value per Category A share
- as at 31.03.2013 608.34 - as at 30.09.2012 619.80 - as at 30.09.2011 598.23
Dividend paid
Ex-dividend date 01.10.2012 Dividend per share 19.50 Shares outstanding at dividend date 239.0000
Number of Category B shares
- outstanding at the beginning of the period 1,671.3392 - issued 315.3935 - redeemed -279.9004
- outstanding at the end of the period 1,706.8323
Net asset value per Category B share
- as at 31.03.2013 883.03 - as at 30.09.2012 871.22 - as at 30.09.2011 811.53
Number of Institutional B Shares
- outstanding at the beginning of the period 27,825.0000 - issued 0.0000 - redeemed 0.0000
- outstanding at the end of the period 27,825.0000
Net asset value per Institutional B Share
- as at 31.03.2013 883.58 - as at 30.09.2012 871.59 - as at 30.09.2011 -
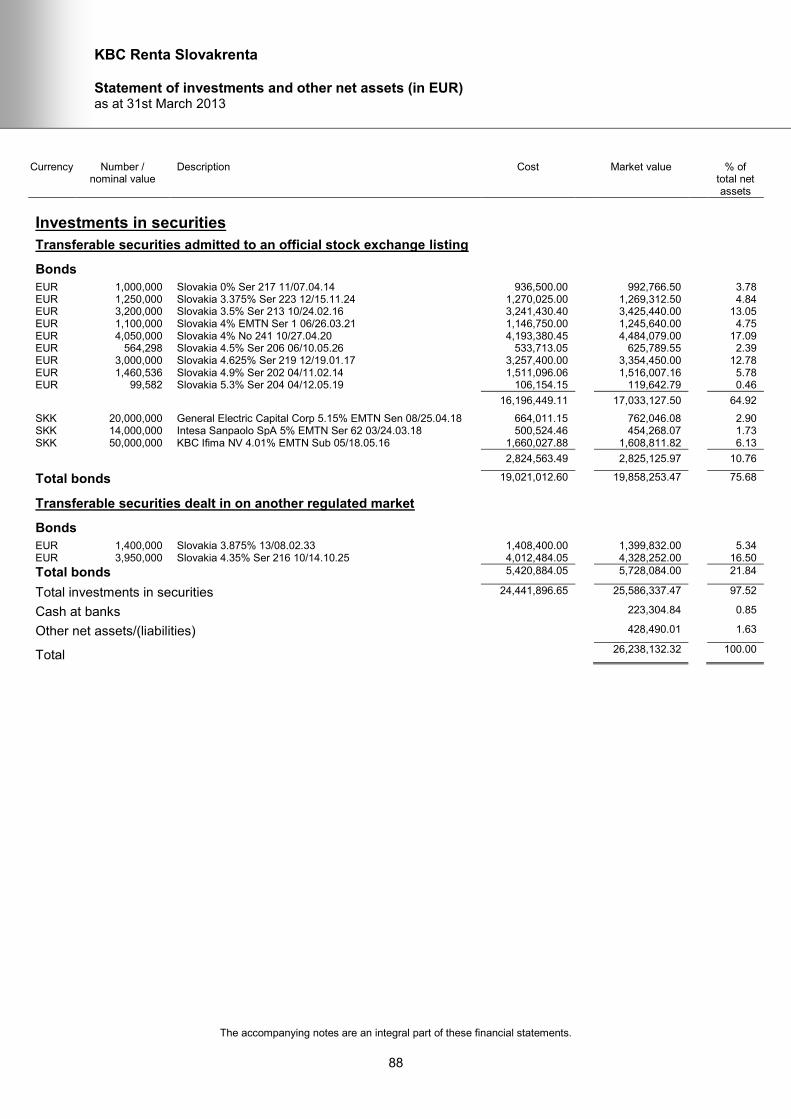
KBC Renta Slovakrenta
Statement of investments and other net assets (in EUR) as at 31st March 2013
The accompanying notes are an integral part of these financial statements.
88
Currency Number / nominal value
Description Cost Market value % of total net assets
Investments in securities
Transferable securities admitted to an official stock exchange listing
Bonds
EUR 1,000,000 Slovakia 0% Ser 217 11/07.04.14 936,500.00 992,766.50 3.78 EUR 1,250,000 Slovakia 3.375% Ser 223 12/15.11.24 1,270,025.00 1,269,312.50 4.84 EUR 3,200,000 Slovakia 3.5% Ser 213 10/24.02.16 3,241,430.40 3,425,440.00 13.05 EUR 1,100,000 Slovakia 4% EMTN Ser 1 06/26.03.21 1,146,750.00 1,245,640.00 4.75 EUR 4,050,000 Slovakia 4% No 241 10/27.04.20 4,193,380.45 4,484,079.00 17.09 EUR 564,298 Slovakia 4.5% Ser 206 06/10.05.26 533,713.05 625,789.55 2.39 EUR 3,000,000 Slovakia 4.625% Ser 219 12/19.01.17 3,257,400.00 3,354,450.00 12.78 EUR 1,460,536 Slovakia 4.9% Ser 202 04/11.02.14 1,511,096.06 1,516,007.16 5.78 EUR 99,582 Slovakia 5.3% Ser 204 04/12.05.19 106,154.15 119,642.79 0.46
16,196,449.11 17,033,127.50 64.92
SKK 20,000,000 General Electric Capital Corp 5.15% EMTN Sen 08/25.04.18 664,011.15 762,046.08 2.90 SKK 14,000,000 Intesa Sanpaolo SpA 5% EMTN Ser 62 03/24.03.18 500,524.46 454,268.07 1.73 SKK 50,000,000 KBC Ifima NV 4.01% EMTN Sub 05/18.05.16 1,660,027.88 1,608,811.82 6.13
2,824,563.49 2,825,125.97 10.76
Total bonds 19,021,012.60 19,858,253.47 75.68
Transferable securities dealt in on another regulated market
Bonds
EUR 1,400,000 Slovakia 3.875% 13/08.02.33 1,408,400.00 1,399,832.00 5.34 EUR 3,950,000 Slovakia 4.35% Ser 216 10/14.10.25 4,012,484.05 4,328,252.00 16.50
Total bonds 5,420,884.05 5,728,084.00 21.84
Total investments in securities 24,441,896.65 25,586,337.47 97.52
Cash at banks 223,304.84 0.85
Other net assets/(liabilities) 428,490.01 1.63
Total 26,238,132.32 100.00
KBC Renta Nokrenta
Investment policy and outlook from 1st October 2012 to 31st March 2013
89
This sub-fund chiefly invests in Norwegian government paper supplemented by semi-government issues and high-value Eurobonds. Financial-market turbulence eased in the period under review thanks to European Central Bank intervention. All the same, economic growth in Norway was weak, due primarily to slack external demand and a strong krone. This kept inflation down, enabling the central bank to maintain its loose monetary policy. The Norwegian krone depreciated in the period under review. Ten-year rates rose on the Norwegian bond market, peaking at 2.65% in February, before slipping back to the level at the beginning of the financial year. Note: The information in this report represents historical data and is not an indication of future results.
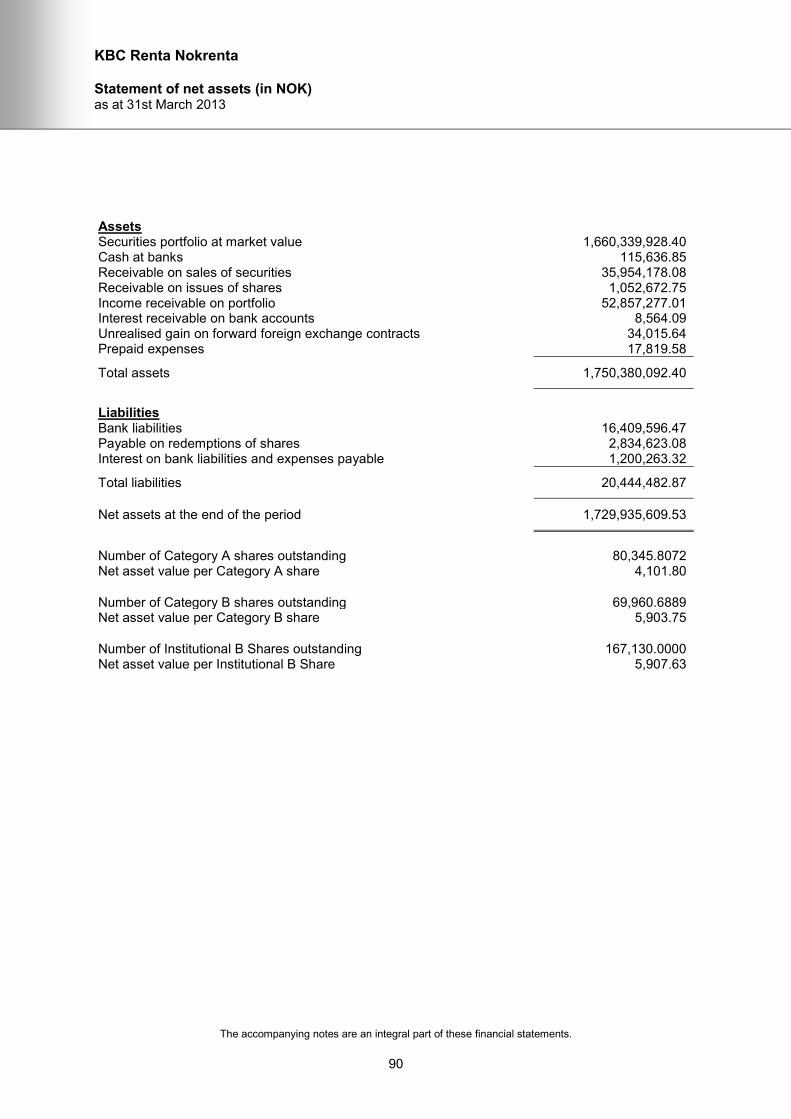
KBC Renta Nokrenta
Statement of net assets (in NOK) as at 31st March 2013
The accompanying notes are an integral part of these financial statements.
90
Assets Securities portfolio at market value 1,660,339,928.40 Cash at banks 115,636.85 Receivable on sales of securities 35,954,178.08 Receivable on issues of shares 1,052,672.75 Income receivable on portfolio 52,857,277.01 Interest receivable on bank accounts 8,564.09 Unrealised gain on forward foreign exchange contracts 34,015.64 Prepaid expenses 17,819.58
Total assets 1,750,380,092.40
Liabilities Bank liabilities 16,409,596.47 Payable on redemptions of shares 2,834,623.08 Interest on bank liabilities and expenses payable 1,200,263.32
Total liabilities 20,444,482.87
Net assets at the end of the period 1,729,935,609.53
Number of Category A shares outstanding 80,345.8072 Net asset value per Category A share 4,101.80
Number of Category B shares outstanding 69,960.6889 Net asset value per Category B share 5,903.75
Number of Institutional B Shares outstanding 167,130.0000 Net asset value per Institutional B Share 5,907.63

KBC Renta Nokrenta
Statistical information (in NOK) as at 31st March 2013
The accompanying notes are an integral part of these financial statements.
91
Total net assets
- as at 31.03.2013 1,729,935,609.53 - as at 30.09.2012 1,299,905,697.14 - as at 30.09.2011 1,755,731,798.86
Number of Category A shares
- outstanding at the beginning of the period 80,725.1806 - issued 6,387.0504 - redeemed -6,766.4238
- outstanding at the end of the period 80,345.8072
Net asset value per Category A share
- as at 31.03.2013 4,101.80 - as at 30.09.2012 4,218.30 - as at 30.09.2011 4,266.21
Dividend paid
Ex-dividend date 01.10.2012 Dividend per share 140.00 Shares outstanding at dividend date 80,725.1806
Number of Category B shares
- outstanding at the beginning of the period 70,699.7828 - issued 6,015.3923 - redeemed -6,754.4862
- outstanding at the end of the period 69,960.6889
Net asset value per Category B share
- as at 31.03.2013 5,903.75 - as at 30.09.2012 5,869.45 - as at 30.09.2011 5,740.99
Number of Institutional B Shares
- outstanding at the beginning of the period 92,711.0000 - issued 122,184.0000 - redeemed -47,765.0000
- outstanding at the end of the period 167,130.0000
Net asset value per Institutional B Share
- as at 31.03.2013 5,907.63 - as at 30.09.2012 5,872.16 - as at 30.09.2011 -
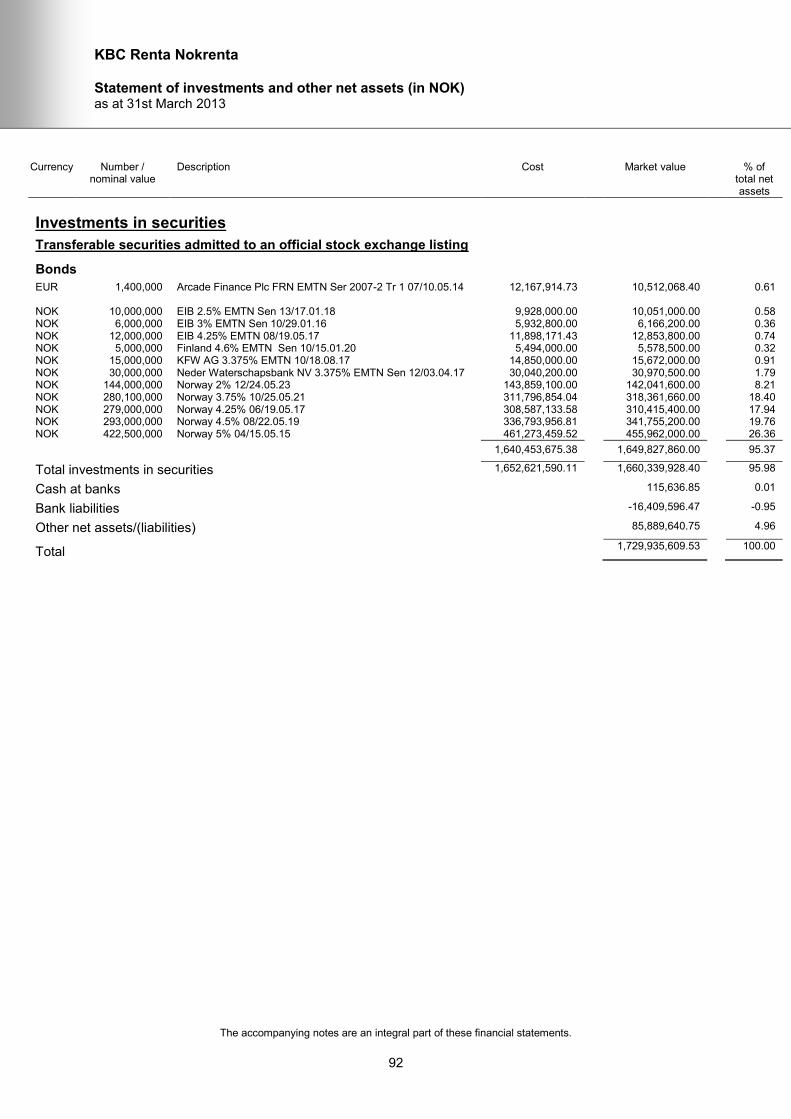
KBC Renta Nokrenta
Statement of investments and other net assets (in NOK) as at 31st March 2013
The accompanying notes are an integral part of these financial statements.
92
Currency Number / nominal value
Description Cost Market value % of total net assets
Investments in securities
Transferable securities admitted to an official stock exchange listing
Bonds
EUR 1,400,000 Arcade Finance Plc FRN EMTN Ser 2007-2 Tr 1 07/10.05.14 12,167,914.73 10,512,068.40 0.61 NOK 10,000,000 EIB 2.5% EMTN Sen 13/17.01.18 9,928,000.00 10,051,000.00 0.58 NOK 6,000,000 EIB 3% EMTN Sen 10/29.01.16 5,932,800.00 6,166,200.00 0.36 NOK 12,000,000 EIB 4.25% EMTN 08/19.05.17 11,898,171.43 12,853,800.00 0.74 NOK 5,000,000 Finland 4.6% EMTN Sen 10/15.01.20 5,494,000.00 5,578,500.00 0.32 NOK 15,000,000 KFW AG 3.375% EMTN 10/18.08.17 14,850,000.00 15,672,000.00 0.91 NOK 30,000,000 Neder Waterschapsbank NV 3.375% EMTN Sen 12/03.04.17 30,040,200.00 30,970,500.00 1.79 NOK 144,000,000 Norway 2% 12/24.05.23 143,859,100.00 142,041,600.00 8.21 NOK 280,100,000 Norway 3.75% 10/25.05.21 311,796,854.04 318,361,660.00 18.40 NOK 279,000,000 Norway 4.25% 06/19.05.17 308,587,133.58 310,415,400.00 17.94 NOK 293,000,000 Norway 4.5% 08/22.05.19 336,793,956.81 341,755,200.00 19.76 NOK 422,500,000 Norway 5% 04/15.05.15 461,273,459.52 455,962,000.00 26.36
1,640,453,675.38 1,649,827,860.00 95.37
Total investments in securities 1,652,621,590.11 1,660,339,928.40 95.98
Cash at banks 115,636.85 0.01
Bank liabilities -16,409,596.47 -0.95
Other net assets/(liabilities) 85,889,640.75 4.96
Total 1,729,935,609.53 100.00
KBC Renta TRY-Renta
Investment policy and outlook from 1st October 2012 to 31st March 2013
93
This sub-fund chiefly invests in Turkish government paper supplemented by a limited number of high-value Eurobonds. The Turkish economy grew in the period under review. The Turkish central bank lowered its key rate to 5.5%, and took a number of prudential measures to temper credit growth and strong domestic demand for foreign products. The aim was to counter any sharp appreciation on the lira’s part. The Turkish currency fell slightly against the euro (-0.38%) and the country’s bond market delivered an attractive positive return. Various maturity policies were followed in the fund during the reporting period. Note: The information in this report represents historical data and is not an indication of future results.
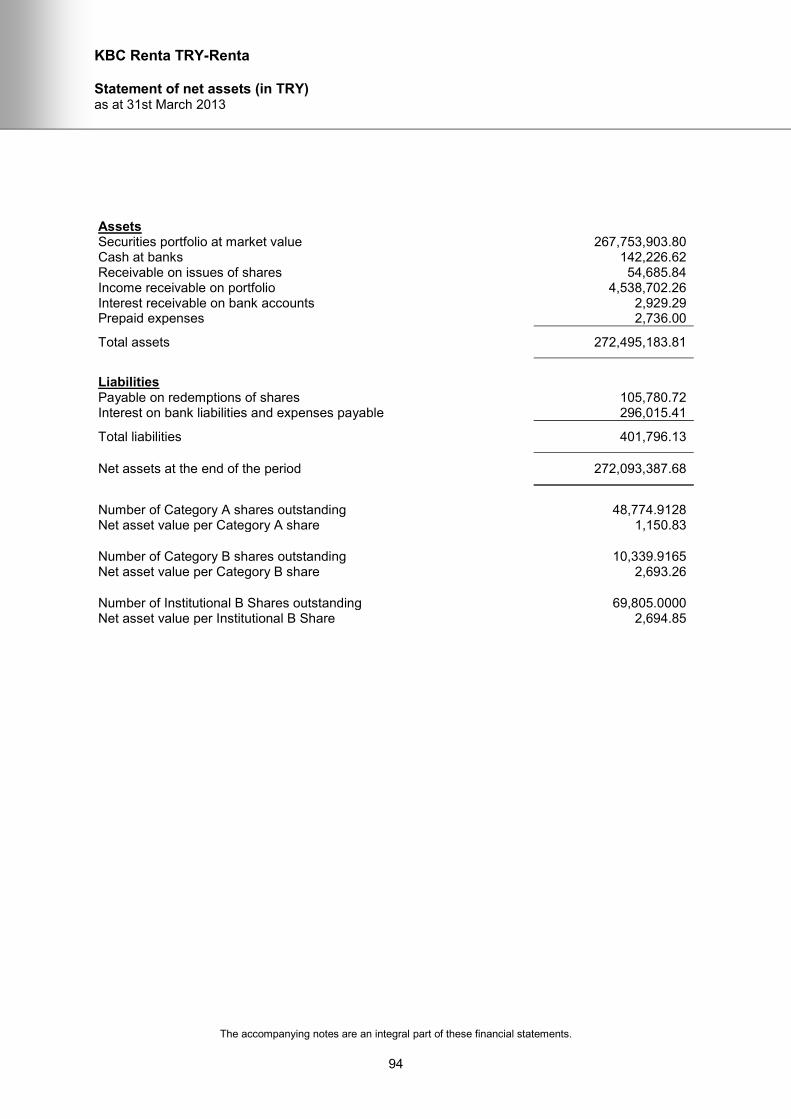
KBC Renta TRY-Renta
Statement of net assets (in TRY) as at 31st March 2013
The accompanying notes are an integral part of these financial statements.
94
Assets Securities portfolio at market value 267,753,903.80 Cash at banks 142,226.62 Receivable on issues of shares 54,685.84 Income receivable on portfolio 4,538,702.26 Interest receivable on bank accounts 2,929.29 Prepaid expenses 2,736.00
Total assets 272,495,183.81
Liabilities Payable on redemptions of shares 105,780.72 Interest on bank liabilities and expenses payable 296,015.41
Total liabilities 401,796.13
Net assets at the end of the period 272,093,387.68
Number of Category A shares outstanding 48,774.9128 Net asset value per Category A share 1,150.83
Number of Category B shares outstanding 10,339.9165 Net asset value per Category B share 2,693.26
Number of Institutional B Shares outstanding 69,805.0000 Net asset value per Institutional B Share 2,694.85

KBC Renta TRY-Renta
Statistical information (in TRY) as at 31st March 2013
The accompanying notes are an integral part of these financial statements.
95
Total net assets
- as at 31.03.2013 272,093,387.68 - as at 30.09.2012 172,586,554.43 - as at 30.09.2011 128,239,740.52
Number of Category A shares
- outstanding at the beginning of the period 41,818.6801 - issued 10,626.2975 - redeemed -3,670.0648
- outstanding at the end of the period 48,774.9128
Net asset value per Category A share
- as at 31.03.2013 1,150.83 - as at 30.09.2012 1,180.40 - as at 30.09.2011 1,163.95
Dividend paid
Ex-dividend date 01.10.2012 Dividend per share 91.00 Shares outstanding at dividend date 41,818.6801
Number of Category B shares
- outstanding at the beginning of the period 11,910.4551 - issued 8,167.0014 - redeemed -9,737.5400
- outstanding at the end of the period 10,339.9165
Net asset value per Category B share
- as at 31.03.2013 2,693.26 - as at 30.09.2012 2,549.32 - as at 30.09.2011 2,317.27
Number of Institutional B Shares
- outstanding at the beginning of the period 36,411.0000 - issued 33,399.0000 - redeemed -5.0000
- outstanding at the end of the period 69,805.0000
Net asset value per Institutional B Share
- as at 31.03.2013 2,694.85 - as at 30.09.2012 2,550.33 - as at 30.09.2011 -
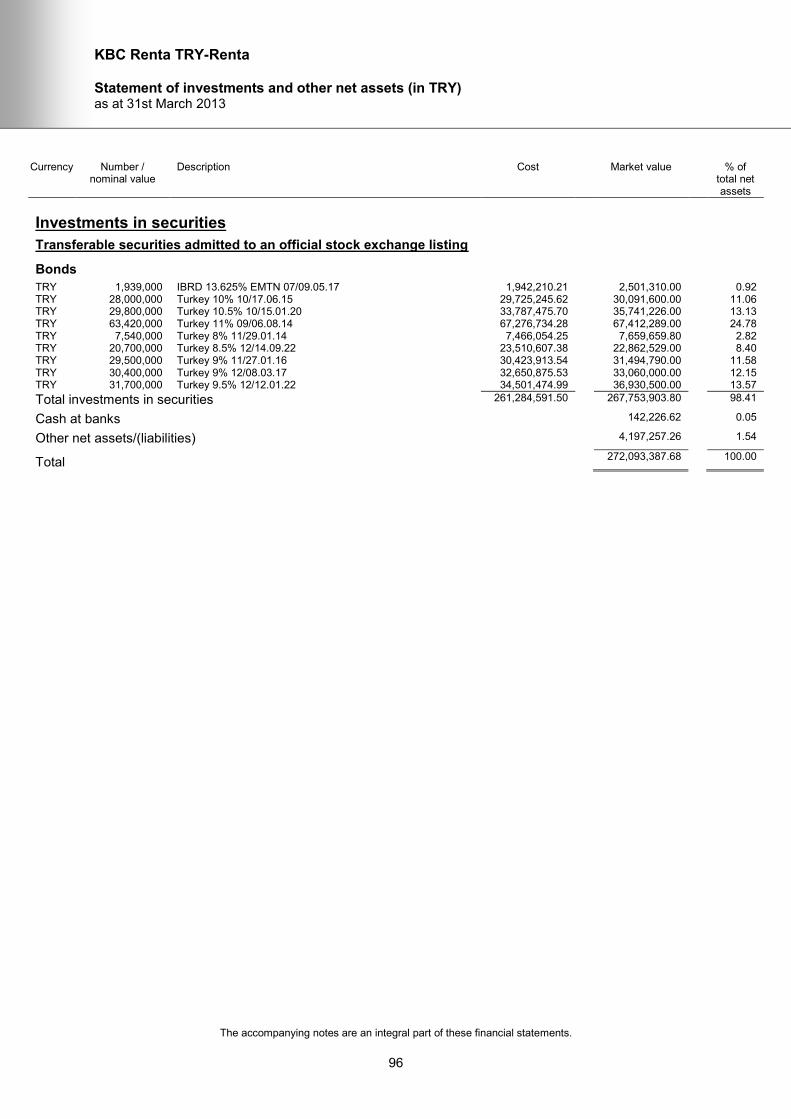
KBC Renta TRY-Renta
Statement of investments and other net assets (in TRY) as at 31st March 2013
The accompanying notes are an integral part of these financial statements.
96
Currency Number / nominal value
Description Cost Market value % of total net assets
Investments in securities
Transferable securities admitted to an official stock exchange listing
Bonds
TRY 1,939,000 IBRD 13.625% EMTN 07/09.05.17 1,942,210.21 2,501,310.00 0.92 TRY 28,000,000 Turkey 10% 10/17.06.15 29,725,245.62 30,091,600.00 11.06 TRY 29,800,000 Turkey 10.5% 10/15.01.20 33,787,475.70 35,741,226.00 13.13 TRY 63,420,000 Turkey 11% 09/06.08.14 67,276,734.28 67,412,289.00 24.78 TRY 7,540,000 Turkey 8% 11/29.01.14 7,466,054.25 7,659,659.80 2.82 TRY 20,700,000 Turkey 8.5% 12/14.09.22 23,510,607.38 22,862,529.00 8.40 TRY 29,500,000 Turkey 9% 11/27.01.16 30,423,913.54 31,494,790.00 11.58 TRY 30,400,000 Turkey 9% 12/08.03.17 32,650,875.53 33,060,000.00 12.15 TRY 31,700,000 Turkey 9.5% 12/12.01.22 34,501,474.99 36,930,500.00 13.57
Total investments in securities 261,284,591.50 267,753,903.80 98.41
Cash at banks 142,226.62 0.05
Other net assets/(liabilities) 4,197,257.26 1.54
Total 272,093,387.68 100.00

KBC Renta Short USD
Investment policy and outlook from 1st October 2012 to 31st March 2013
97
Investors were chiefly looking for returns in the period under review, so the first part of the reporting period was relatively problem-free: US economic numbers were strong and Latin America and Asia did not disappoint either. At the same time, the crisis in Europe became less acute. This favourable climate persisted until the Italian elections, which produced an unexpected political stalemate that briefly panicked investors. The markets recovered quickly, however, and confidence returned. The crisis in Cyprus tested confidence again. Investors responded with less equanimity and subordinated bank bonds had a particularly tough time. In the meantime, the economic news from the US deteriorated and automatic spending cuts were triggered to the tune of 85 billion dollars. Investors are worried that this will undermine further growth. US two-year yields fell 10 basis points at the beginning of the period under review to 0.3%. Uncertainty at the end of the reporting period pushed yields down again, to below the levels at the beginning of October. The US central bank kept its key rate very low and indicated that this will remain the case for some time yet. Other central banks endorsed the rhetoric coming out of the Fed. The duration was two years. The yield averaged 0.25%. Against this backdrop of extremely low policy rates, low economic growth and stable inflation there will probably be little change in the US yield curve. The fund’s average term to maturity is two years. We will maintain that positioning in the months ahead. Note: The information in this report represents historical data and is not an indication of future results.
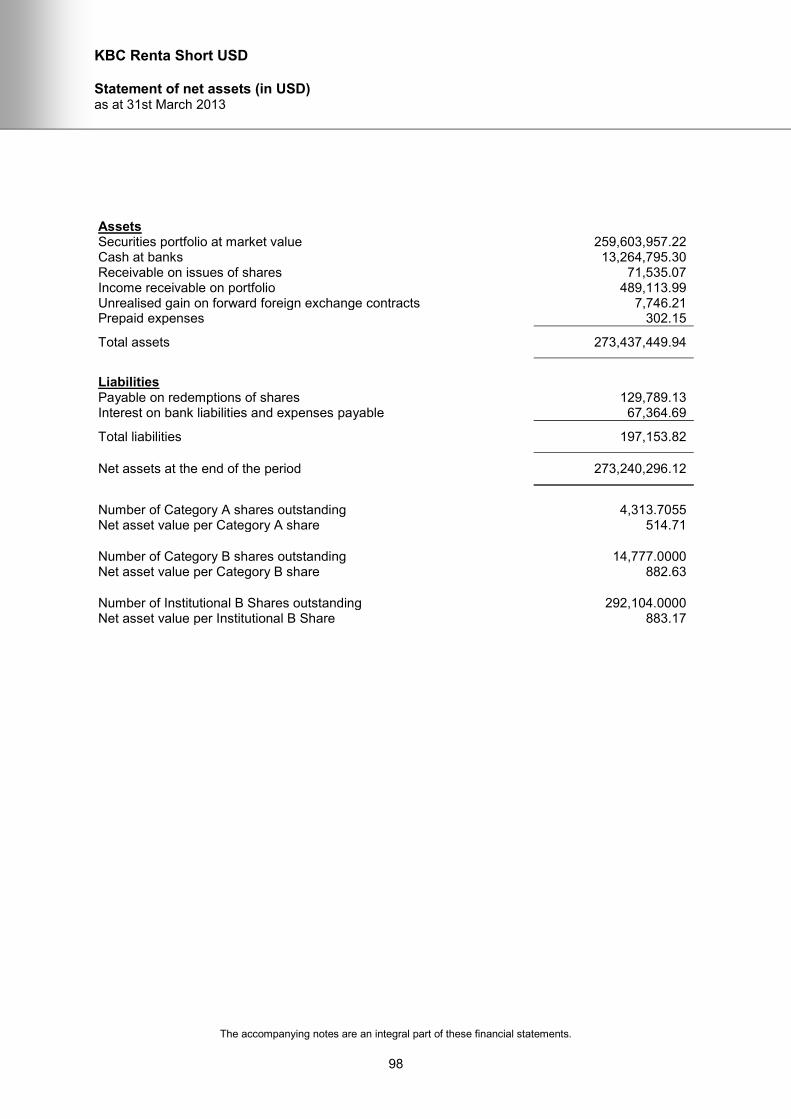
KBC Renta Short USD
Statement of net assets (in USD) as at 31st March 2013
The accompanying notes are an integral part of these financial statements.
98
Assets Securities portfolio at market value 259,603,957.22 Cash at banks 13,264,795.30 Receivable on issues of shares 71,535.07 Income receivable on portfolio 489,113.99 Unrealised gain on forward foreign exchange contracts 7,746.21 Prepaid expenses 302.15
Total assets 273,437,449.94
Liabilities Payable on redemptions of shares 129,789.13 Interest on bank liabilities and expenses payable 67,364.69
Total liabilities 197,153.82
Net assets at the end of the period 273,240,296.12
Number of Category A shares outstanding 4,313.7055 Net asset value per Category A share 514.71
Number of Category B shares outstanding 14,777.0000 Net asset value per Category B share 882.63
Number of Institutional B Shares outstanding 292,104.0000 Net asset value per Institutional B Share 883.17

KBC Renta Short USD
Statistical information (in USD) as at 31st March 2013
The accompanying notes are an integral part of these financial statements.
99
Total net assets
- as at 31.03.2013 273,240,296.12 - as at 30.09.2012 22,460,648.10 - as at 30.09.2011 27,851,297.51
Number of Category A shares
- outstanding at the beginning of the period 2,077.7055 - issued 2,608.0000 - redeemed -372.0000
- outstanding at the end of the period 4,313.7055
Net asset value per Category A share
- as at 31.03.2013 514.71 - as at 30.09.2012 517.50 - as at 30.09.2011 521.51
Dividend paid
Ex-dividend date 01.10.2012 Dividend per share 2.50 Shares outstanding at dividend date 2,077.7055
Number of Category B shares
- outstanding at the beginning of the period 8,798.5000 - issued 6,520.0000 - redeemed -541.5000
- outstanding at the end of the period 14,777.0000
Net asset value per Category B share
- as at 31.03.2013 882.63 - as at 30.09.2012 883.09 - as at 30.09.2011 882.31
Number of Institutional B Shares
- outstanding at the beginning of the period 15,412.0000 - issued 278,967.0000 - redeemed -2,275.0000
- outstanding at the end of the period 292,104.0000
Net asset value per Institutional B Share
- as at 31.03.2013 883.17 - as at 30.09.2012 883.44 - as at 30.09.2011 -
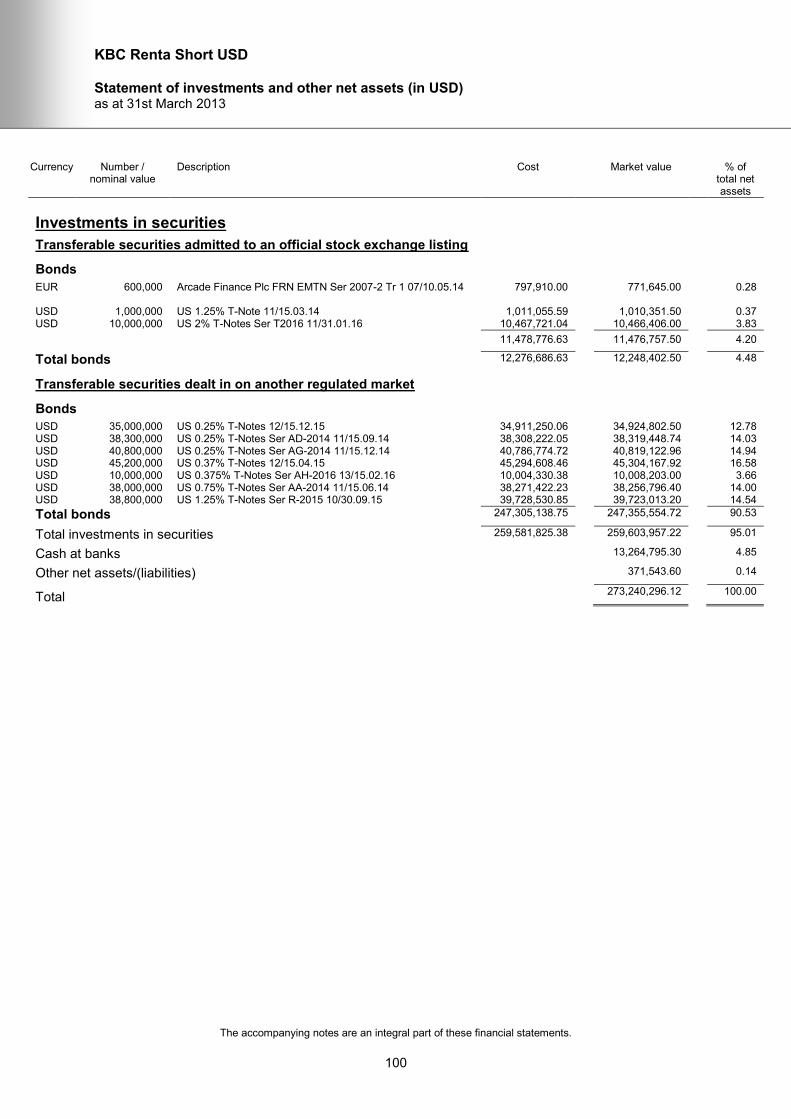
KBC Renta Short USD
Statement of investments and other net assets (in USD) as at 31st March 2013
The accompanying notes are an integral part of these financial statements.
100
Currency Number / nominal value
Description Cost Market value % of total net assets
Investments in securities
Transferable securities admitted to an official stock exchange listing
Bonds
EUR 600,000 Arcade Finance Plc FRN EMTN Ser 2007-2 Tr 1 07/10.05.14 797,910.00 771,645.00 0.28 USD 1,000,000 US 1.25% T-Note 11/15.03.14 1,011,055.59 1,010,351.50 0.37 USD 10,000,000 US 2% T-Notes Ser T2016 11/31.01.16 10,467,721.04 10,466,406.00 3.83
11,478,776.63 11,476,757.50 4.20
Total bonds 12,276,686.63 12,248,402.50 4.48
Transferable securities dealt in on another regulated market
Bonds
USD 35,000,000 US 0.25% T-Notes 12/15.12.15 34,911,250.06 34,924,802.50 12.78 USD 38,300,000 US 0.25% T-Notes Ser AD-2014 11/15.09.14 38,308,222.05 38,319,448.74 14.03 USD 40,800,000 US 0.25% T-Notes Ser AG-2014 11/15.12.14 40,786,774.72 40,819,122.96 14.94 USD 45,200,000 US 0.37% T-Notes 12/15.04.15 45,294,608.46 45,304,167.92 16.58 USD 10,000,000 US 0.375% T-Notes Ser AH-2016 13/15.02.16 10,004,330.38 10,008,203.00 3.66 USD 38,000,000 US 0.75% T-Notes Ser AA-2014 11/15.06.14 38,271,422.23 38,256,796.40 14.00 USD 38,800,000 US 1.25% T-Notes Ser R-2015 10/30.09.15 39,728,530.85 39,723,013.20 14.54
Total bonds 247,305,138.75 247,355,554.72 90.53
Total investments in securities 259,581,825.38 259,603,957.22 95.01
Cash at banks 13,264,795.30 4.85
Other net assets/(liabilities) 371,543.60 0.14
Total 273,240,296.12 100.00
KBC Renta Long Term Dedicated 1
Investment policy and outlook from 1st October 2012 to 31st March 2013
101
This sub-fund was launched in August 2012. It is structured as a cash-flow matching portfolio and therefore invests in high-grade liquid government bonds from the euro area. It is managed in such a way that future liabilities are matched by the portfolio’s assets, income and redemptions. Note: The information in this report represents historical data and is not an indication of future results.
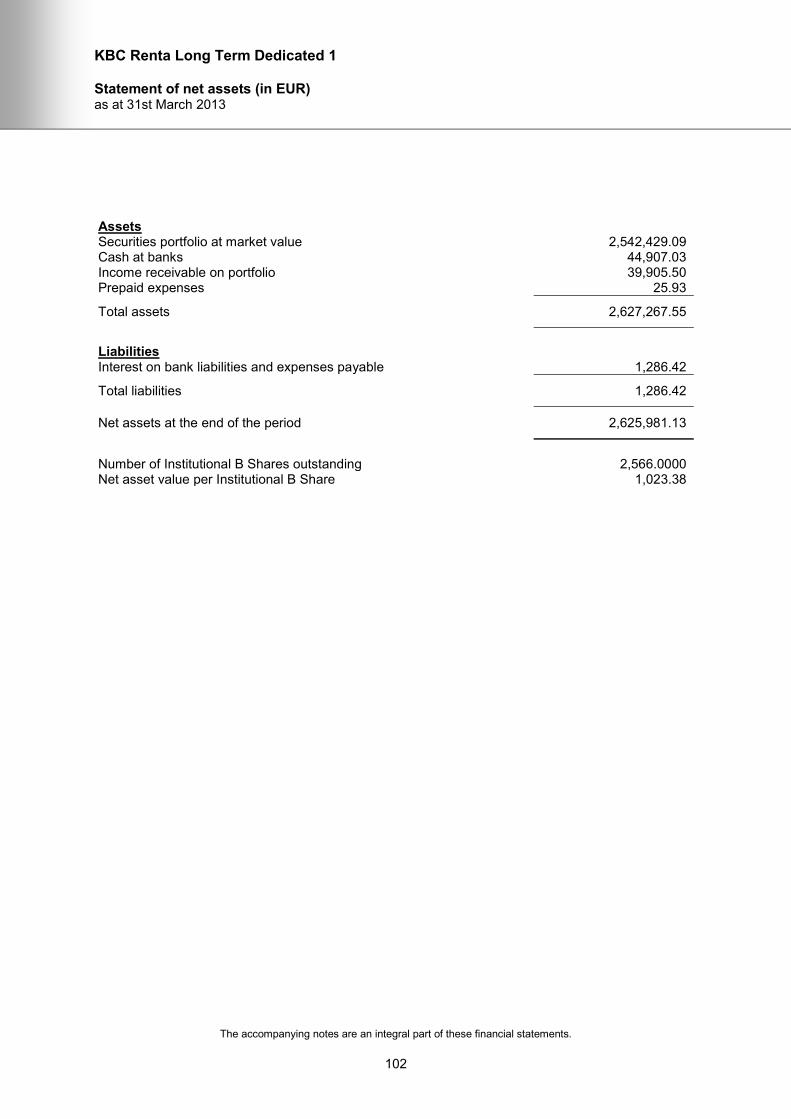
KBC Renta Long Term Dedicated 1
Statement of net assets (in EUR) as at 31st March 2013
The accompanying notes are an integral part of these financial statements.
102
Assets Securities portfolio at market value 2,542,429.09 Cash at banks 44,907.03 Income receivable on portfolio 39,905.50 Prepaid expenses 25.93
Total assets 2,627,267.55
Liabilities Interest on bank liabilities and expenses payable 1,286.42
Total liabilities 1,286.42
Net assets at the end of the period 2,625,981.13
Number of Institutional B Shares outstanding 2,566.0000 Net asset value per Institutional B Share 1,023.38
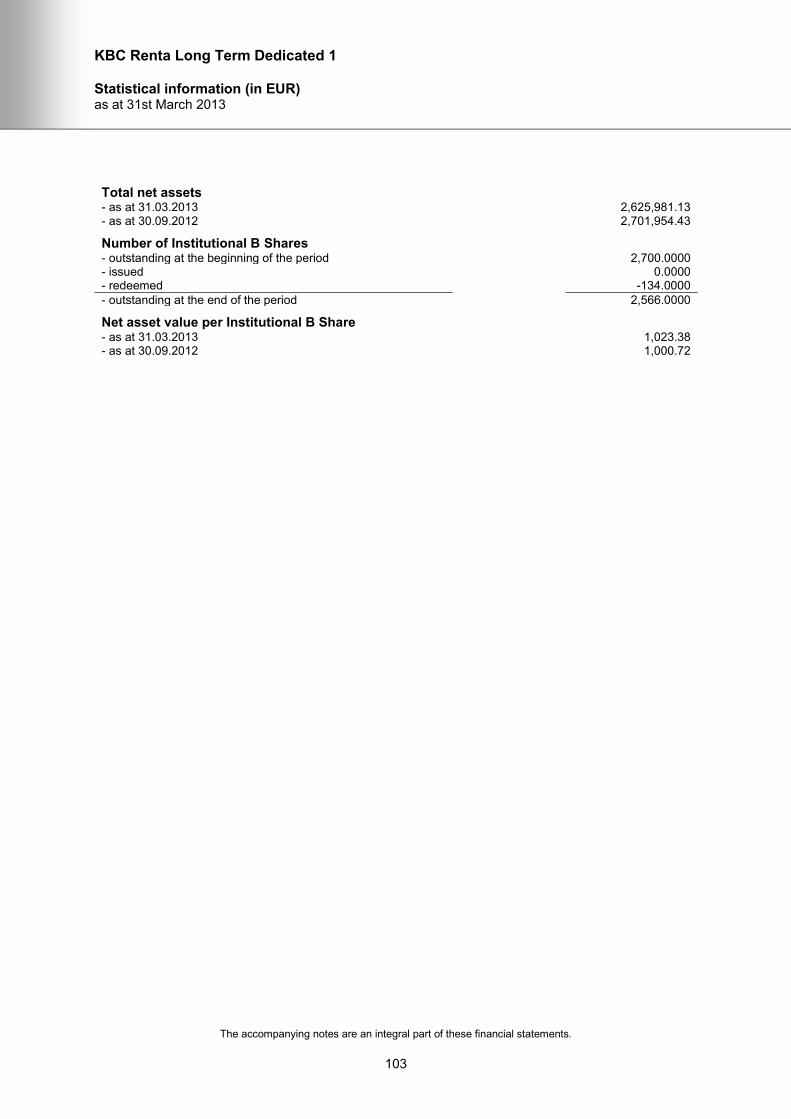
KBC Renta Long Term Dedicated 1
Statistical information (in EUR) as at 31st March 2013
The accompanying notes are an integral part of these financial statements.
103
Total net assets
- as at 31.03.2013 2,625,981.13 - as at 30.09.2012 2,701,954.43
Number of Institutional B Shares
- outstanding at the beginning of the period 2,700.0000 - issued 0.0000 - redeemed -134.0000
- outstanding at the end of the period 2,566.0000
Net asset value per Institutional B Share
- as at 31.03.2013 1,023.38 - as at 30.09.2012 1,000.72
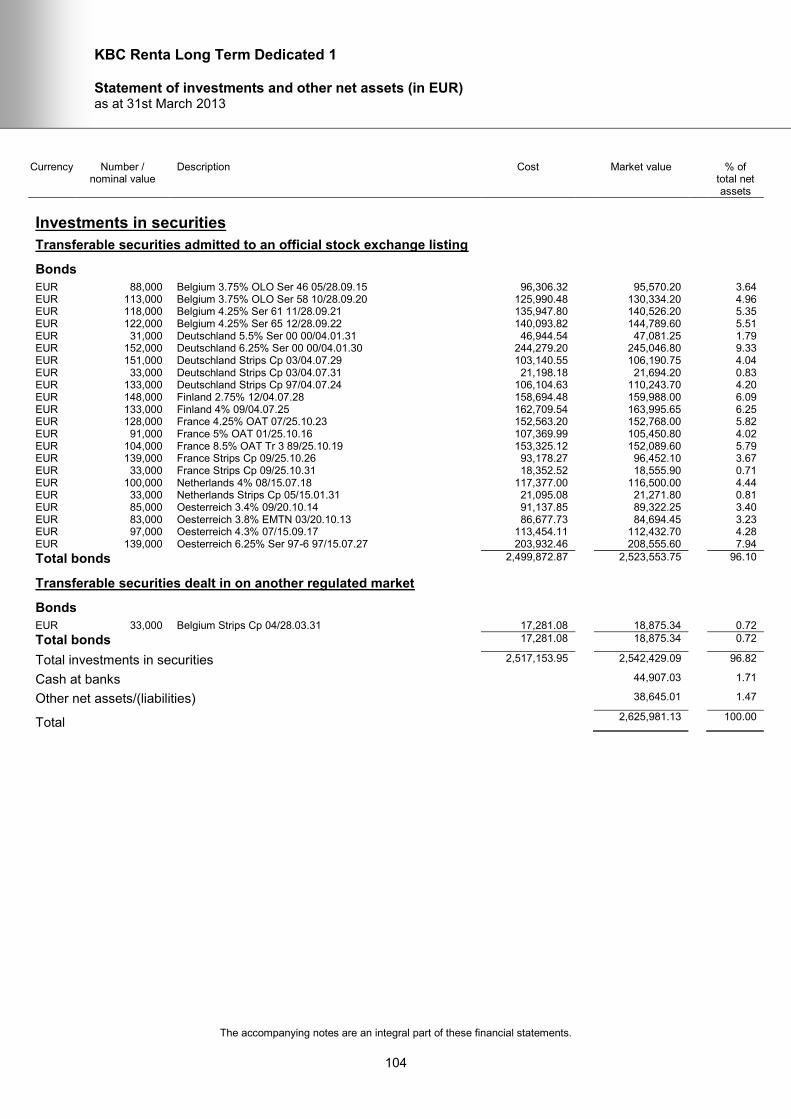
KBC Renta Long Term Dedicated 1
Statement of investments and other net assets (in EUR) as at 31st March 2013
The accompanying notes are an integral part of these financial statements.
104
Currency Number / nominal value
Description Cost Market value % of total net assets
Investments in securities
Transferable securities admitted to an official stock exchange listing
Bonds
EUR 88,000 Belgium 3.75% OLO Ser 46 05/28.09.15 96,306.32 95,570.20 3.64 EUR 113,000 Belgium 3.75% OLO Ser 58 10/28.09.20 125,990.48 130,334.20 4.96 EUR 118,000 Belgium 4.25% Ser 61 11/28.09.21 135,947.80 140,526.20 5.35 EUR 122,000 Belgium 4.25% Ser 65 12/28.09.22 140,093.82 144,789.60 5.51 EUR 31,000 Deutschland 5.5% Ser 00 00/04.01.31 46,944.54 47,081.25 1.79 EUR 152,000 Deutschland 6.25% Ser 00 00/04.01.30 244,279.20 245,046.80 9.33 EUR 151,000 Deutschland Strips Cp 03/04.07.29 103,140.55 106,190.75 4.04 EUR 33,000 Deutschland Strips Cp 03/04.07.31 21,198.18 21,694.20 0.83 EUR 133,000 Deutschland Strips Cp 97/04.07.24 106,104.63 110,243.70 4.20 EUR 148,000 Finland 2.75% 12/04.07.28 158,694.48 159,988.00 6.09 EUR 133,000 Finland 4% 09/04.07.25 162,709.54 163,995.65 6.25 EUR 128,000 France 4.25% OAT 07/25.10.23 152,563.20 152,768.00 5.82 EUR 91,000 France 5% OAT 01/25.10.16 107,369.99 105,450.80 4.02 EUR 104,000 France 8.5% OAT Tr 3 89/25.10.19 153,325.12 152,089.60 5.79 EUR 139,000 France Strips Cp 09/25.10.26 93,178.27 96,452.10 3.67 EUR 33,000 France Strips Cp 09/25.10.31 18,352.52 18,555.90 0.71 EUR 100,000 Netherlands 4% 08/15.07.18 117,377.00 116,500.00 4.44 EUR 33,000 Netherlands Strips Cp 05/15.01.31 21,095.08 21,271.80 0.81 EUR 85,000 Oesterreich 3.4% 09/20.10.14 91,137.85 89,322.25 3.40 EUR 83,000 Oesterreich 3.8% EMTN 03/20.10.13 86,677.73 84,694.45 3.23 EUR 97,000 Oesterreich 4.3% 07/15.09.17 113,454.11 112,432.70 4.28 EUR 139,000 Oesterreich 6.25% Ser 97-6 97/15.07.27 203,932.46 208,555.60 7.94
Total bonds 2,499,872.87 2,523,553.75 96.10
Transferable securities dealt in on another regulated market
Bonds
EUR 33,000 Belgium Strips Cp 04/28.03.31 17,281.08 18,875.34 0.72
Total bonds 17,281.08 18,875.34 0.72
Total investments in securities 2,517,153.95 2,542,429.09 96.82
Cash at banks 44,907.03 1.71
Other net assets/(liabilities) 38,645.01 1.47
Total 2,625,981.13 100.00

KBC Renta Long Term Dedicated 2
Investment policy and outlook from 16th November 2012 to 31st March 2013
105
This sub-fund was launched in November 2012. It is structured as a cash-flow matching portfolio and therefore invests in high-grade liquid government bonds from the euro area. It is managed in such a way that future liabilities are matched by the portfolio’s assets, income and redemptions. Note: The information in this report represents historical data and is not an indication of future results.
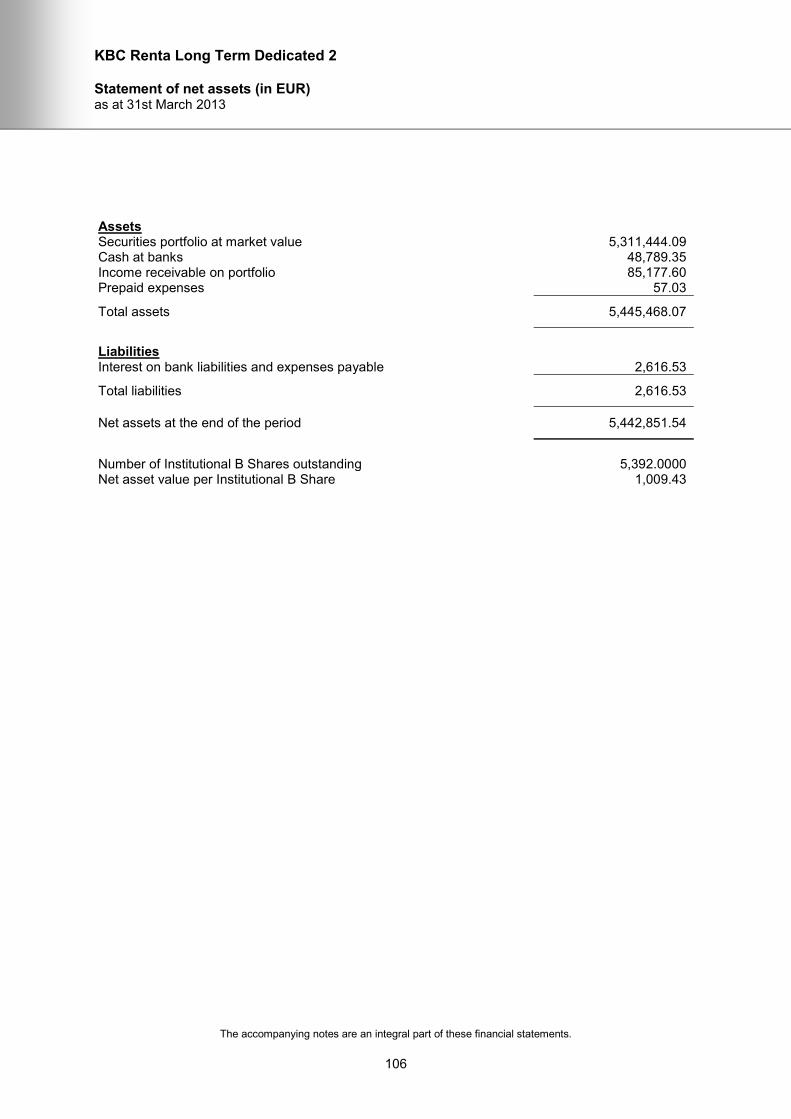
KBC Renta Long Term Dedicated 2
Statement of net assets (in EUR) as at 31st March 2013
The accompanying notes are an integral part of these financial statements.
106
Assets Securities portfolio at market value 5,311,444.09 Cash at banks 48,789.35 Income receivable on portfolio 85,177.60 Prepaid expenses 57.03
Total assets 5,445,468.07
Liabilities Interest on bank liabilities and expenses payable 2,616.53
Total liabilities 2,616.53
Net assets at the end of the period 5,442,851.54
Number of Institutional B Shares outstanding 5,392.0000 Net asset value per Institutional B Share 1,009.43
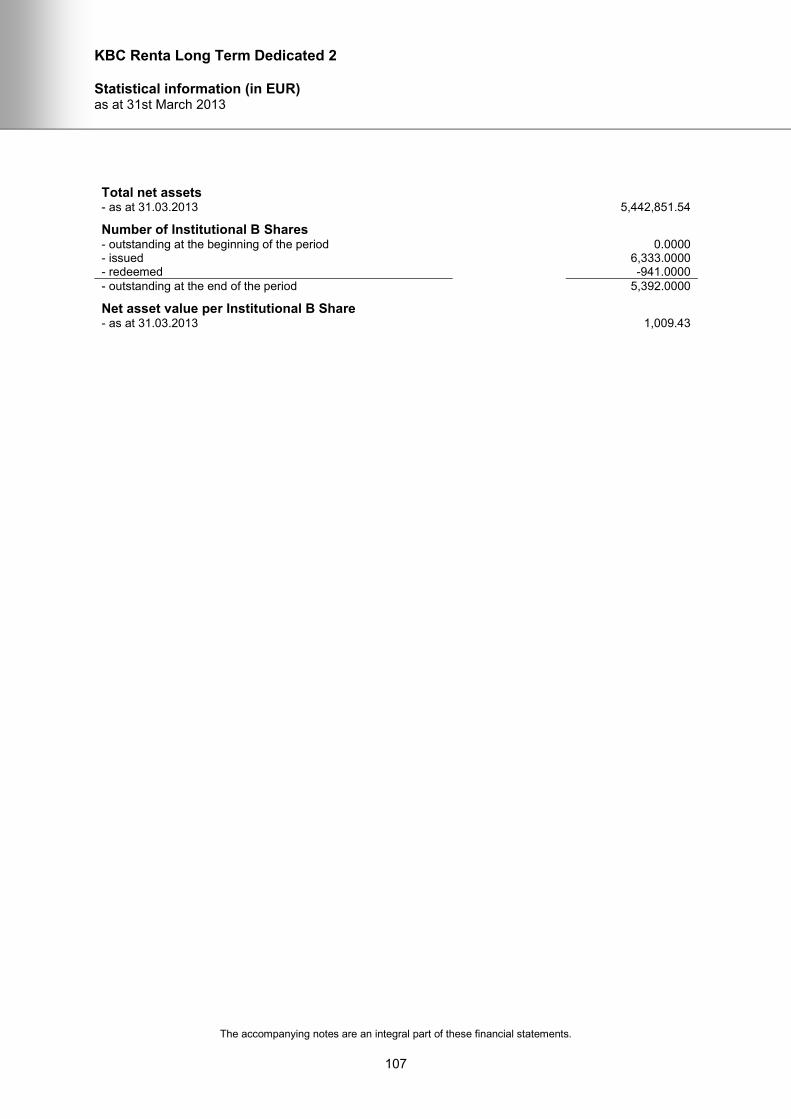
KBC Renta Long Term Dedicated 2
Statistical information (in EUR) as at 31st March 2013
The accompanying notes are an integral part of these financial statements.
107
Total net assets
- as at 31.03.2013 5,442,851.54
Number of Institutional B Shares
- outstanding at the beginning of the period 0.0000 - issued 6,333.0000 - redeemed -941.0000
- outstanding at the end of the period 5,392.0000
Net asset value per Institutional B Share
- as at 31.03.2013 1,009.43
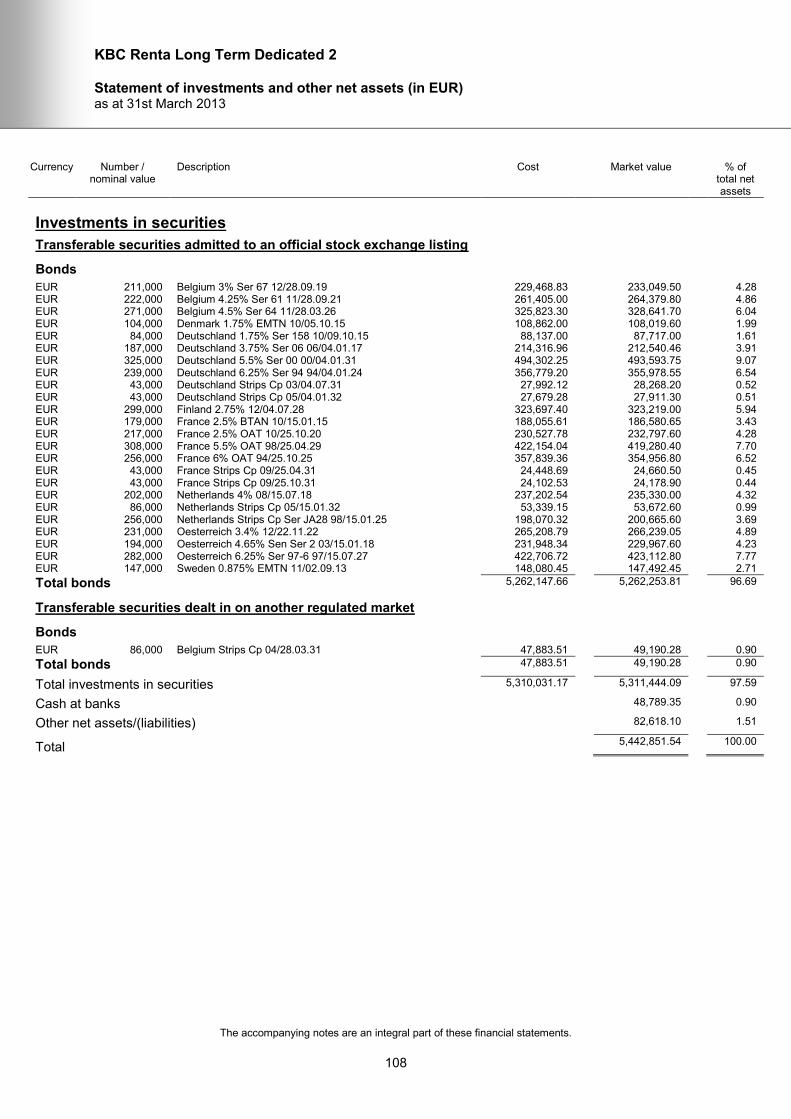
KBC Renta Long Term Dedicated 2
Statement of investments and other net assets (in EUR) as at 31st March 2013
The accompanying notes are an integral part of these financial statements.
108
Currency Number / nominal value
Description Cost Market value % of total net assets
Investments in securities
Transferable securities admitted to an official stock exchange listing
Bonds
EUR 211,000 Belgium 3% Ser 67 12/28.09.19 229,468.83 233,049.50 4.28 EUR 222,000 Belgium 4.25% Ser 61 11/28.09.21 261,405.00 264,379.80 4.86 EUR 271,000 Belgium 4.5% Ser 64 11/28.03.26 325,823.30 328,641.70 6.04 EUR 104,000 Denmark 1.75% EMTN 10/05.10.15 108,862.00 108,019.60 1.99 EUR 84,000 Deutschland 1.75% Ser 158 10/09.10.15 88,137.00 87,717.00 1.61 EUR 187,000 Deutschland 3.75% Ser 06 06/04.01.17 214,316.96 212,540.46 3.91 EUR 325,000 Deutschland 5.5% Ser 00 00/04.01.31 494,302.25 493,593.75 9.07 EUR 239,000 Deutschland 6.25% Ser 94 94/04.01.24 356,779.20 355,978.55 6.54 EUR 43,000 Deutschland Strips Cp 03/04.07.31 27,992.12 28,268.20 0.52 EUR 43,000 Deutschland Strips Cp 05/04.01.32 27,679.28 27,911.30 0.51 EUR 299,000 Finland 2.75% 12/04.07.28 323,697.40 323,219.00 5.94 EUR 179,000 France 2.5% BTAN 10/15.01.15 188,055.61 186,580.65 3.43 EUR 217,000 France 2.5% OAT 10/25.10.20 230,527.78 232,797.60 4.28 EUR 308,000 France 5.5% OAT 98/25.04.29 422,154.04 419,280.40 7.70 EUR 256,000 France 6% OAT 94/25.10.25 357,839.36 354,956.80 6.52 EUR 43,000 France Strips Cp 09/25.04.31 24,448.69 24,660.50 0.45 EUR 43,000 France Strips Cp 09/25.10.31 24,102.53 24,178.90 0.44 EUR 202,000 Netherlands 4% 08/15.07.18 237,202.54 235,330.00 4.32 EUR 86,000 Netherlands Strips Cp 05/15.01.32 53,339.15 53,672.60 0.99 EUR 256,000 Netherlands Strips Cp Ser JA28 98/15.01.25 198,070.32 200,665.60 3.69 EUR 231,000 Oesterreich 3.4% 12/22.11.22 265,208.79 266,239.05 4.89 EUR 194,000 Oesterreich 4.65% Sen Ser 2 03/15.01.18 231,948.34 229,967.60 4.23 EUR 282,000 Oesterreich 6.25% Ser 97-6 97/15.07.27 422,706.72 423,112.80 7.77 EUR 147,000 Sweden 0.875% EMTN 11/02.09.13 148,080.45 147,492.45 2.71
Total bonds 5,262,147.66 5,262,253.81 96.69
Transferable securities dealt in on another regulated market
Bonds
EUR 86,000 Belgium Strips Cp 04/28.03.31 47,883.51 49,190.28 0.90
Total bonds 47,883.51 49,190.28 0.90
Total investments in securities 5,310,031.17 5,311,444.09 97.59
Cash at banks 48,789.35 0.90
Other net assets/(liabilities) 82,618.10 1.51
Total 5,442,851.54 100.00
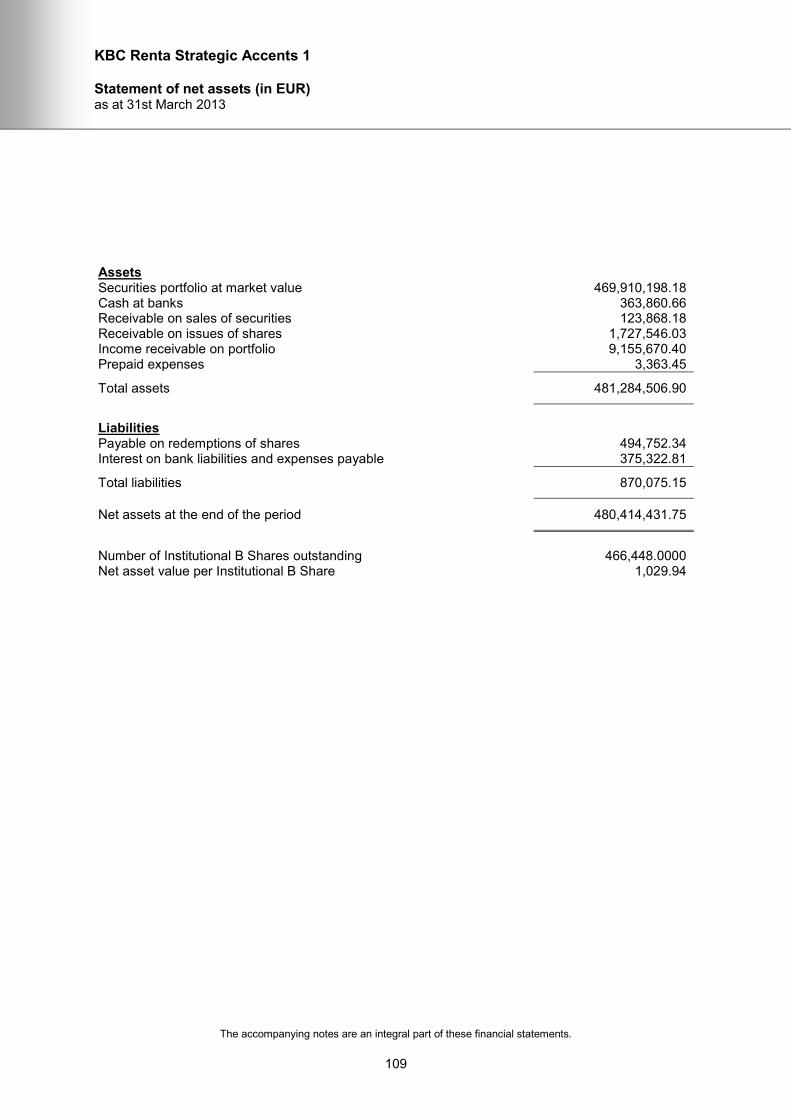
KBC Renta Strategic Accents 1
Statement of net assets (in EUR) as at 31st March 2013
The accompanying notes are an integral part of these financial statements.
109
Assets Securities portfolio at market value 469,910,198.18 Cash at banks 363,860.66 Receivable on sales of securities 123,868.18 Receivable on issues of shares 1,727,546.03 Income receivable on portfolio 9,155,670.40 Prepaid expenses 3,363.45
Total assets 481,284,506.90
Liabilities Payable on redemptions of shares 494,752.34 Interest on bank liabilities and expenses payable 375,322.81
Total liabilities 870,075.15
Net assets at the end of the period 480,414,431.75
Number of Institutional B Shares outstanding 466,448.0000 Net asset value per Institutional B Share 1,029.94

KBC Renta Strategic Accents 1
Statistical information (in EUR) as at 31st March 2013
The accompanying notes are an integral part of these financial statements.
110
Total net assets
- as at 31.03.2013 480,414,431.75
Number of Institutional B Shares
- outstanding at the beginning of the period 0.0000 - issued 702,244.0000 - redeemed -235,717.0000
- outstanding at the end of the period 466,448.0000
Net asset value per Institutional B Share
- as at 31.03.2013 1,029.94
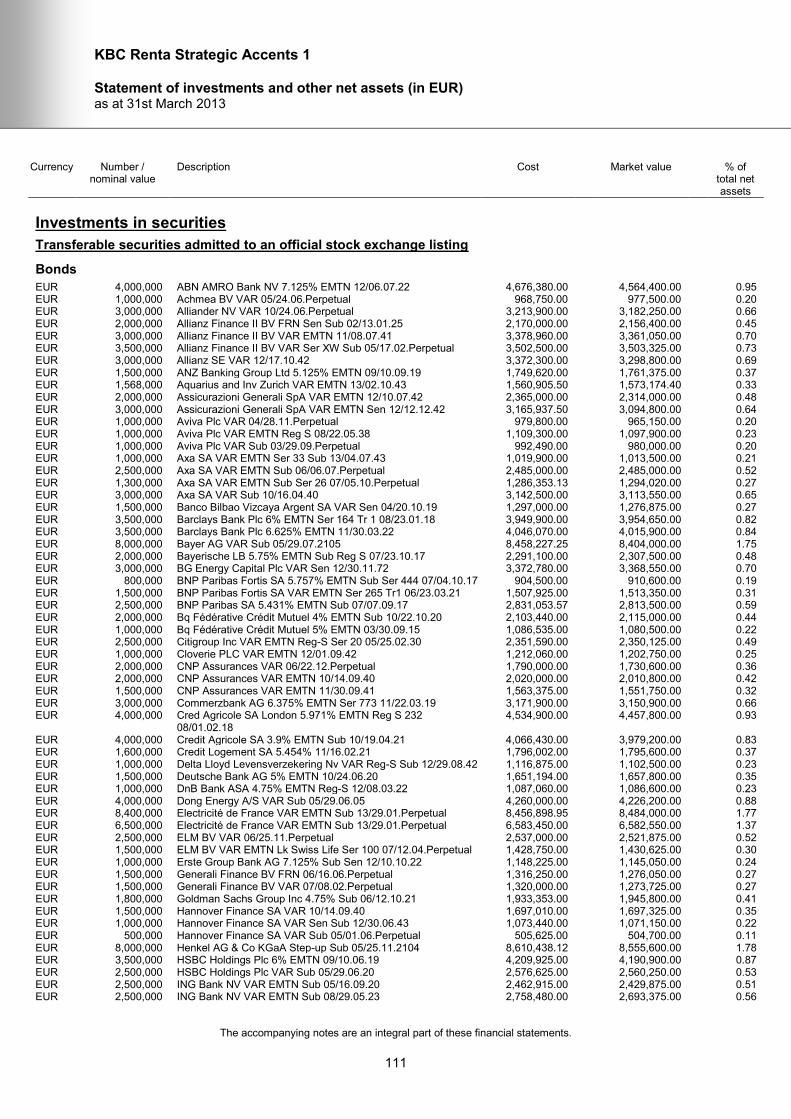
KBC Renta Strategic Accents 1
Statement of investments and other net assets (in EUR) as at 31st March 2013
The accompanying notes are an integral part of these financial statements.
111
Currency Number / nominal value
Description Cost Market value % of total net assets
Investments in securities
Transferable securities admitted to an official stock exchange listing
Bonds
EUR 4,000,000 ABN AMRO Bank NV 7.125% EMTN 12/06.07.22 4,676,380.00 4,564,400.00 0.95 EUR 1,000,000 Achmea BV VAR 05/24.06.Perpetual 968,750.00 977,500.00 0.20 EUR 3,000,000 Alliander NV VAR 10/24.06.Perpetual 3,213,900.00 3,182,250.00 0.66 EUR 2,000,000 Allianz Finance II BV FRN Sen Sub 02/13.01.25 2,170,000.00 2,156,400.00 0.45 EUR 3,000,000 Allianz Finance II BV VAR EMTN 11/08.07.41 3,378,960.00 3,361,050.00 0.70 EUR 3,500,000 Allianz Finance II BV VAR Ser XW Sub 05/17.02.Perpetual 3,502,500.00 3,503,325.00 0.73 EUR 3,000,000 Allianz SE VAR 12/17.10.42 3,372,300.00 3,298,800.00 0.69 EUR 1,500,000 ANZ Banking Group Ltd 5.125% EMTN 09/10.09.19 1,749,620.00 1,761,375.00 0.37 EUR 1,568,000 Aquarius and Inv Zurich VAR EMTN 13/02.10.43 1,560,905.50 1,573,174.40 0.33 EUR 2,000,000 Assicurazioni Generali SpA VAR EMTN 12/10.07.42 2,365,000.00 2,314,000.00 0.48 EUR 3,000,000 Assicurazioni Generali SpA VAR EMTN Sen 12/12.12.42 3,165,937.50 3,094,800.00 0.64 EUR 1,000,000 Aviva Plc VAR 04/28.11.Perpetual 979,800.00 965,150.00 0.20 EUR 1,000,000 Aviva Plc VAR EMTN Reg S 08/22.05.38 1,109,300.00 1,097,900.00 0.23 EUR 1,000,000 Aviva Plc VAR Sub 03/29.09.Perpetual 992,490.00 980,000.00 0.20 EUR 1,000,000 Axa SA VAR EMTN Ser 33 Sub 13/04.07.43 1,019,900.00 1,013,500.00 0.21 EUR 2,500,000 Axa SA VAR EMTN Sub 06/06.07.Perpetual 2,485,000.00 2,485,000.00 0.52 EUR 1,300,000 Axa SA VAR EMTN Sub Ser 26 07/05.10.Perpetual 1,286,353.13 1,294,020.00 0.27 EUR 3,000,000 Axa SA VAR Sub 10/16.04.40 3,142,500.00 3,113,550.00 0.65 EUR 1,500,000 Banco Bilbao Vizcaya Argent SA VAR Sen 04/20.10.19 1,297,000.00 1,276,875.00 0.27 EUR 3,500,000 Barclays Bank Plc 6% EMTN Ser 164 Tr 1 08/23.01.18 3,949,900.00 3,954,650.00 0.82 EUR 3,500,000 Barclays Bank Plc 6.625% EMTN 11/30.03.22 4,046,070.00 4,015,900.00 0.84 EUR 8,000,000 Bayer AG VAR Sub 05/29.07.2105 8,458,227.25 8,404,000.00 1.75 EUR 2,000,000 Bayerische LB 5.75% EMTN Sub Reg S 07/23.10.17 2,291,100.00 2,307,500.00 0.48 EUR 3,000,000 BG Energy Capital Plc VAR Sen 12/30.11.72 3,372,780.00 3,368,550.00 0.70 EUR 800,000 BNP Paribas Fortis SA 5.757% EMTN Sub Ser 444 07/04.10.17 904,500.00 910,600.00 0.19 EUR 1,500,000 BNP Paribas Fortis SA VAR EMTN Ser 265 Tr1 06/23.03.21 1,507,925.00 1,513,350.00 0.31 EUR 2,500,000 BNP Paribas SA 5.431% EMTN Sub 07/07.09.17 2,831,053.57 2,813,500.00 0.59 EUR 2,000,000 Bq Fédérative Crédit Mutuel 4% EMTN Sub 10/22.10.20 2,103,440.00 2,115,000.00 0.44 EUR 1,000,000 Bq Fédérative Crédit Mutuel 5% EMTN 03/30.09.15 1,086,535.00 1,080,500.00 0.22 EUR 2,500,000 Citigroup Inc VAR EMTN Reg-S Ser 20 05/25.02.30 2,351,590.00 2,350,125.00 0.49 EUR 1,000,000 Cloverie PLC VAR EMTN 12/01.09.42 1,212,060.00 1,202,750.00 0.25 EUR 2,000,000 CNP Assurances VAR 06/22.12.Perpetual 1,790,000.00 1,730,600.00 0.36 EUR 2,000,000 CNP Assurances VAR EMTN 10/14.09.40 2,020,000.00 2,010,800.00 0.42 EUR 1,500,000 CNP Assurances VAR EMTN 11/30.09.41 1,563,375.00 1,551,750.00 0.32 EUR 3,000,000 Commerzbank AG 6.375% EMTN Ser 773 11/22.03.19 3,171,900.00 3,150,900.00 0.66 EUR 4,000,000 Cred Agricole SA London 5.971% EMTN Reg S 232
08/01.02.18 4,534,900.00 4,457,800.00 0.93
EUR 4,000,000 Credit Agricole SA 3.9% EMTN Sub 10/19.04.21 4,066,430.00 3,979,200.00 0.83 EUR 1,600,000 Credit Logement SA 5.454% 11/16.02.21 1,796,002.00 1,795,600.00 0.37 EUR 1,000,000 Delta Lloyd Levensverzekering Nv VAR Reg-S Sub 12/29.08.42 1,116,875.00 1,102,500.00 0.23 EUR 1,500,000 Deutsche Bank AG 5% EMTN 10/24.06.20 1,651,194.00 1,657,800.00 0.35 EUR 1,000,000 DnB Bank ASA 4.75% EMTN Reg-S 12/08.03.22 1,087,060.00 1,086,600.00 0.23 EUR 4,000,000 Dong Energy A/S VAR Sub 05/29.06.05 4,260,000.00 4,226,200.00 0.88 EUR 8,400,000 Electricité de France VAR EMTN Sub 13/29.01.Perpetual 8,456,898.95 8,484,000.00 1.77 EUR 6,500,000 Electricité de France VAR EMTN Sub 13/29.01.Perpetual 6,583,450.00 6,582,550.00 1.37 EUR 2,500,000 ELM BV VAR 06/25.11.Perpetual 2,537,000.00 2,521,875.00 0.52 EUR 1,500,000 ELM BV VAR EMTN Lk Swiss Life Ser 100 07/12.04.Perpetual 1,428,750.00 1,430,625.00 0.30 EUR 1,000,000 Erste Group Bank AG 7.125% Sub Sen 12/10.10.22 1,148,225.00 1,145,050.00 0.24 EUR 1,500,000 Generali Finance BV FRN 06/16.06.Perpetual 1,316,250.00 1,276,050.00 0.27 EUR 1,500,000 Generali Finance BV VAR 07/08.02.Perpetual 1,320,000.00 1,273,725.00 0.27 EUR 1,800,000 Goldman Sachs Group Inc 4.75% Sub 06/12.10.21 1,933,353.00 1,945,800.00 0.41 EUR 1,500,000 Hannover Finance SA VAR 10/14.09.40 1,697,010.00 1,697,325.00 0.35 EUR 1,000,000 Hannover Finance SA VAR Sen Sub 12/30.06.43 1,073,440.00 1,071,150.00 0.22 EUR 500,000 Hannover Finance SA VAR Sub 05/01.06.Perpetual 505,625.00 504,700.00 0.11 EUR 8,000,000 Henkel AG & Co KGaA Step-up Sub 05/25.11.2104 8,610,438.12 8,555,600.00 1.78 EUR 3,500,000 HSBC Holdings Plc 6% EMTN 09/10.06.19 4,209,925.00 4,190,900.00 0.87 EUR 2,500,000 HSBC Holdings Plc VAR Sub 05/29.06.20 2,576,625.00 2,560,250.00 0.53 EUR 2,500,000 ING Bank NV VAR EMTN Sub 05/16.09.20 2,462,915.00 2,429,875.00 0.51 EUR 2,500,000 ING Bank NV VAR EMTN Sub 08/29.05.23 2,758,480.00 2,693,375.00 0.56
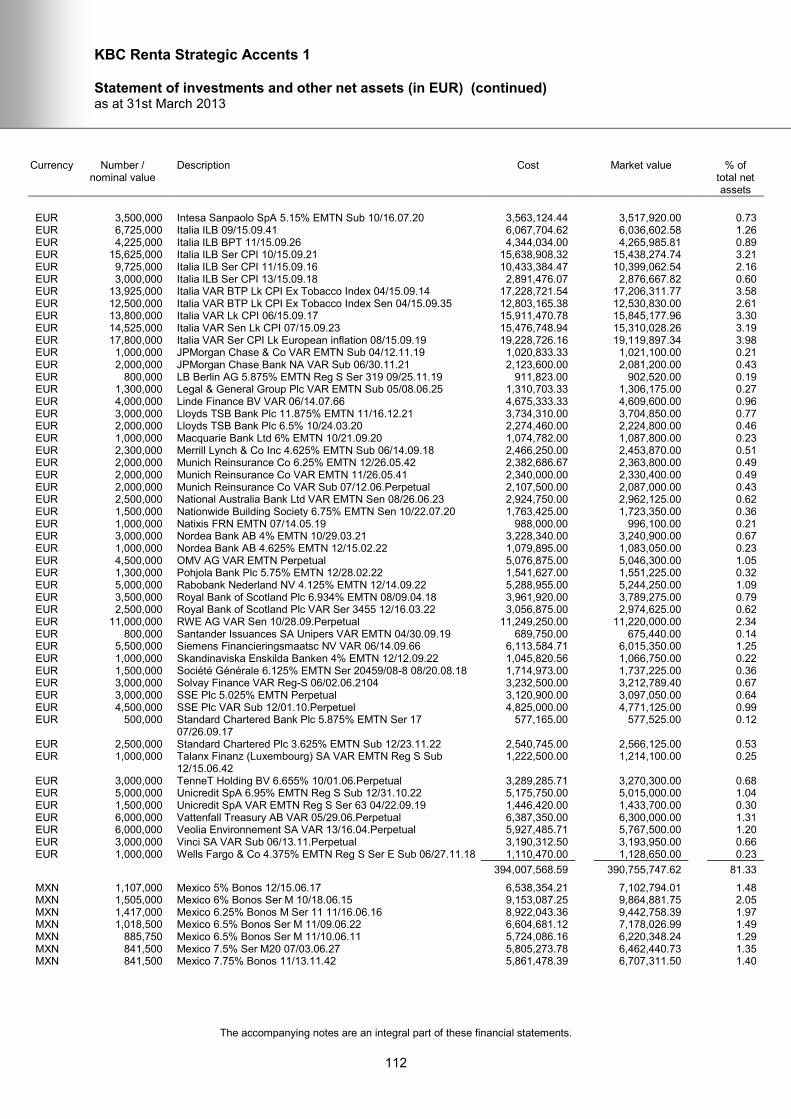
KBC Renta Strategic Accents 1
Statement of investments and other net assets (in EUR) (continued) as at 31st March 2013
The accompanying notes are an integral part of these financial statements.
112
Currency Number / nominal value
Description Cost Market value % of total net assets
EUR 3,500,000 Intesa Sanpaolo SpA 5.15% EMTN Sub 10/16.07.20 3,563,124.44 3,517,920.00 0.73 EUR 6,725,000 Italia ILB 09/15.09.41 6,067,704.62 6,036,602.58 1.26 EUR 4,225,000 Italia ILB BPT 11/15.09.26 4,344,034.00 4,265,985.81 0.89 EUR 15,625,000 Italia ILB Ser CPI 10/15.09.21 15,638,908.32 15,438,274.74 3.21 EUR 9,725,000 Italia ILB Ser CPI 11/15.09.16 10,433,384.47 10,399,062.54 2.16 EUR 3,000,000 Italia ILB Ser CPI 13/15.09.18 2,891,476.07 2,876,667.82 0.60 EUR 13,925,000 Italia VAR BTP Lk CPI Ex Tobacco Index 04/15.09.14 17,228,721.54 17,206,311.77 3.58 EUR 12,500,000 Italia VAR BTP Lk CPI Ex Tobacco Index Sen 04/15.09.35 12,803,165.38 12,530,830.00 2.61 EUR 13,800,000 Italia VAR Lk CPI 06/15.09.17 15,911,470.78 15,845,177.96 3.30 EUR 14,525,000 Italia VAR Sen Lk CPI 07/15.09.23 15,476,748.94 15,310,028.26 3.19 EUR 17,800,000 Italia VAR Ser CPI Lk European inflation 08/15.09.19 19,228,726.16 19,119,897.34 3.98 EUR 1,000,000 JPMorgan Chase & Co VAR EMTN Sub 04/12.11.19 1,020,833.33 1,021,100.00 0.21 EUR 2,000,000 JPMorgan Chase Bank NA VAR Sub 06/30.11.21 2,123,600.00 2,081,200.00 0.43 EUR 800,000 LB Berlin AG 5.875% EMTN Reg S Ser 319 09/25.11.19 911,823.00 902,520.00 0.19 EUR 1,300,000 Legal & General Group Plc VAR EMTN Sub 05/08.06.25 1,310,703.33 1,306,175.00 0.27 EUR 4,000,000 Linde Finance BV VAR 06/14.07.66 4,675,333.33 4,609,600.00 0.96 EUR 3,000,000 Lloyds TSB Bank Plc 11.875% EMTN 11/16.12.21 3,734,310.00 3,704,850.00 0.77 EUR 2,000,000 Lloyds TSB Bank Plc 6.5% 10/24.03.20 2,274,460.00 2,224,800.00 0.46 EUR 1,000,000 Macquarie Bank Ltd 6% EMTN 10/21.09.20 1,074,782.00 1,087,800.00 0.23 EUR 2,300,000 Merrill Lynch & Co Inc 4.625% EMTN Sub 06/14.09.18 2,466,250.00 2,453,870.00 0.51 EUR 2,000,000 Munich Reinsurance Co 6.25% EMTN 12/26.05.42 2,382,686.67 2,363,800.00 0.49 EUR 2,000,000 Munich Reinsurance Co VAR EMTN 11/26.05.41 2,340,000.00 2,330,400.00 0.49 EUR 2,000,000 Munich Reinsurance Co VAR Sub 07/12.06.Perpetual 2,107,500.00 2,087,000.00 0.43 EUR 2,500,000 National Australia Bank Ltd VAR EMTN Sen 08/26.06.23 2,924,750.00 2,962,125.00 0.62 EUR 1,500,000 Nationwide Building Society 6.75% EMTN Sen 10/22.07.20 1,763,425.00 1,723,350.00 0.36 EUR 1,000,000 Natixis FRN EMTN 07/14.05.19 988,000.00 996,100.00 0.21 EUR 3,000,000 Nordea Bank AB 4% EMTN 10/29.03.21 3,228,340.00 3,240,900.00 0.67 EUR 1,000,000 Nordea Bank AB 4.625% EMTN 12/15.02.22 1,079,895.00 1,083,050.00 0.23 EUR 4,500,000 OMV AG VAR EMTN Perpetual 5,076,875.00 5,046,300.00 1.05 EUR 1,300,000 Pohjola Bank Plc 5.75% EMTN 12/28.02.22 1,541,627.00 1,551,225.00 0.32 EUR 5,000,000 Rabobank Nederland NV 4.125% EMTN 12/14.09.22 5,288,955.00 5,244,250.00 1.09 EUR 3,500,000 Royal Bank of Scotland Plc 6.934% EMTN 08/09.04.18 3,961,920.00 3,789,275.00 0.79 EUR 2,500,000 Royal Bank of Scotland Plc VAR Ser 3455 12/16.03.22 3,056,875.00 2,974,625.00 0.62 EUR 11,000,000 RWE AG VAR Sen 10/28.09.Perpetual 11,249,250.00 11,220,000.00 2.34 EUR 800,000 Santander Issuances SA Unipers VAR EMTN 04/30.09.19 689,750.00 675,440.00 0.14 EUR 5,500,000 Siemens Financieringsmaatsc NV VAR 06/14.09.66 6,113,584.71 6,015,350.00 1.25 EUR 1,000,000 Skandinaviska Enskilda Banken 4% EMTN 12/12.09.22 1,045,820.56 1,066,750.00 0.22 EUR 1,500,000 Société Générale 6.125% EMTN Ser 20459/08-8 08/20.08.18 1,714,973.00 1,737,225.00 0.36 EUR 3,000,000 Solvay Finance VAR Reg-S 06/02.06.2104 3,232,500.00 3,212,789.40 0.67 EUR 3,000,000 SSE Plc 5.025% EMTN Perpetual 3,120,900.00 3,097,050.00 0.64 EUR 4,500,000 SSE Plc VAR Sub 12/01.10.Perpetuel 4,825,000.00 4,771,125.00 0.99 EUR 500,000 Standard Chartered Bank Plc 5.875% EMTN Ser 17
07/26.09.17 577,165.00 577,525.00 0.12
EUR 2,500,000 Standard Chartered Plc 3.625% EMTN Sub 12/23.11.22 2,540,745.00 2,566,125.00 0.53 EUR 1,000,000 Talanx Finanz (Luxembourg) SA VAR EMTN Reg S Sub
12/15.06.42 1,222,500.00 1,214,100.00 0.25
EUR 3,000,000 TenneT Holding BV 6.655% 10/01.06.Perpetual 3,289,285.71 3,270,300.00 0.68 EUR 5,000,000 Unicredit SpA 6.95% EMTN Reg S Sub 12/31.10.22 5,175,750.00 5,015,000.00 1.04 EUR 1,500,000 Unicredit SpA VAR EMTN Reg S Ser 63 04/22.09.19 1,446,420.00 1,433,700.00 0.30 EUR 6,000,000 Vattenfall Treasury AB VAR 05/29.06.Perpetual 6,387,350.00 6,300,000.00 1.31 EUR 6,000,000 Veolia Environnement SA VAR 13/16.04.Perpetual 5,927,485.71 5,767,500.00 1.20 EUR 3,000,000 Vinci SA VAR Sub 06/13.11.Perpetual 3,190,312.50 3,193,950.00 0.66 EUR 1,000,000 Wells Fargo & Co 4.375% EMTN Reg S Ser E Sub 06/27.11.18 1,110,470.00 1,128,650.00 0.23
394,007,568.59 390,755,747.62 81.33
MXN 1,107,000 Mexico 5% Bonos 12/15.06.17 6,538,354.21 7,102,794.01 1.48 MXN 1,505,000 Mexico 6% Bonos Ser M 10/18.06.15 9,153,087.25 9,864,881.75 2.05 MXN 1,417,000 Mexico 6.25% Bonos M Ser 11 11/16.06.16 8,922,043.36 9,442,758.39 1.97 MXN 1,018,500 Mexico 6.5% Bonos Ser M 11/09.06.22 6,604,681.12 7,178,026.99 1.49 MXN 885,750 Mexico 6.5% Bonos Ser M 11/10.06.11 5,724,086.16 6,220,348.24 1.29 MXN 841,500 Mexico 7.5% Ser M20 07/03.06.27 5,805,273.78 6,462,440.73 1.35 MXN 841,500 Mexico 7.75% Bonos 11/13.11.42 5,861,478.39 6,707,311.50 1.40
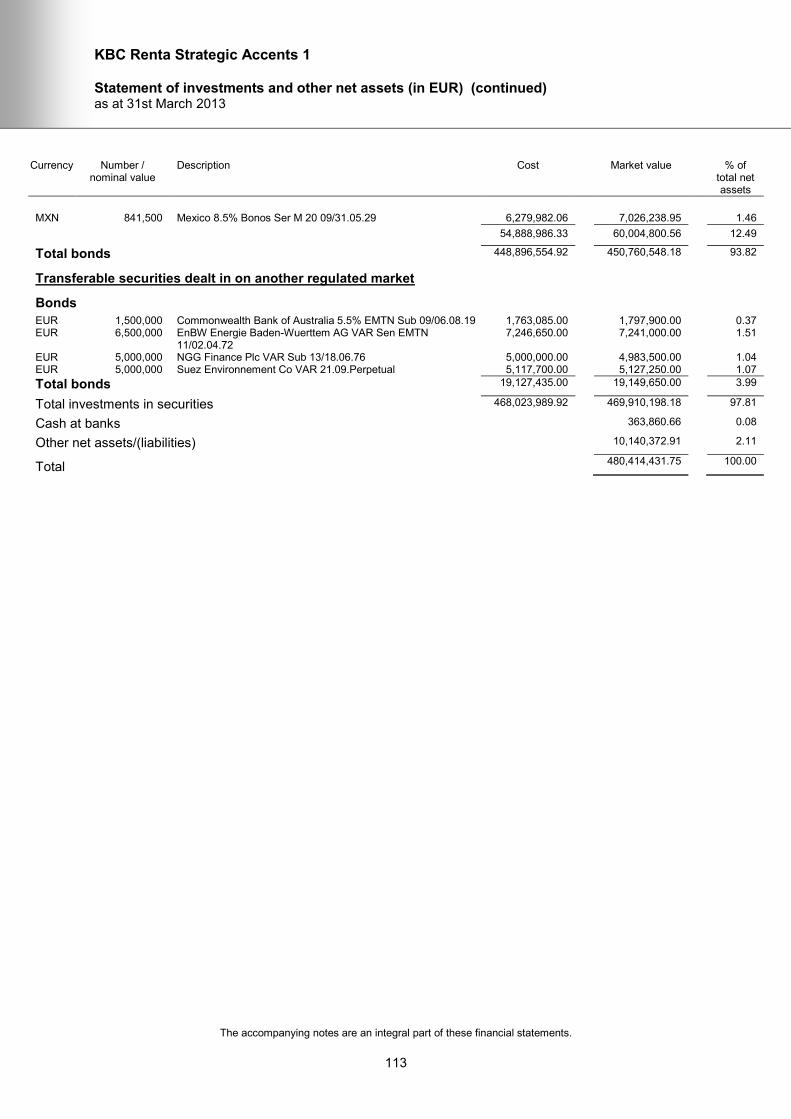
KBC Renta Strategic Accents 1
Statement of investments and other net assets (in EUR) (continued) as at 31st March 2013
The accompanying notes are an integral part of these financial statements.
113
Currency Number / nominal value
Description Cost Market value % of total net assets
MXN 841,500 Mexico 8.5% Bonos Ser M 20 09/31.05.29 6,279,982.06 7,026,238.95 1.46
54,888,986.33 60,004,800.56 12.49
Total bonds 448,896,554.92 450,760,548.18 93.82
Transferable securities dealt in on another regulated market
Bonds
EUR 1,500,000 Commonwealth Bank of Australia 5.5% EMTN Sub 09/06.08.19 1,763,085.00 1,797,900.00 0.37 EUR 6,500,000 EnBW Energie Baden-Wuerttem AG VAR Sen EMTN
11/02.04.72 7,246,650.00 7,241,000.00 1.51
EUR 5,000,000 NGG Finance Plc VAR Sub 13/18.06.76 5,000,000.00 4,983,500.00 1.04 EUR 5,000,000 Suez Environnement Co VAR 21.09.Perpetual 5,117,700.00 5,127,250.00 1.07
Total bonds 19,127,435.00 19,149,650.00 3.99
Total investments in securities 468,023,989.92 469,910,198.18 97.81
Cash at banks 363,860.66 0.08
Other net assets/(liabilities) 10,140,372.91 2.11
Total 480,414,431.75 100.00
KBC RENTA
Notes to the financial statements as at 31st March 2013
114
Note 1 - Significant accounting policies a) Presentation of the financial statements The financial statements of the SICAV are established in accordance with the legal and regulatory requirements in force in Luxembourg concerning undertakings for collective investment. The financial statements were drawn up on basis of the net asset value of 28th March 2013 using the last available prices on 28th March 2013. b) Valuation of assets
1) The value of cash in hand or on deposit, of bills and demand notes, of accounts receivable, of pre-paid expenses and of dividends and interest announced or payable and not yet collected is formed by the market value of such assets, unless it appears unlikely that the full value can be received at maturity, in which case the value will be determined by making such deduction as the Board of Directors considers appropriate to reflect the fair value thereof.
2) The value of all transferable securities and money market instruments listed on a stock
exchange or traded on a regulated market is determined on the basis of the last available price unless this price is not representative.
3) The value of all transferable securities and money market instruments traded on another
regulated market is determined according to the last available price.
4) The value of transferable securities and money market instruments in portfolio on the valuation day that are not traded or listed on a stock exchange or other regulated market, and of securities and money market instruments traded or listed on a stock exchange or other regulated market where the price determined according to the stipulations of the above indents is not representative of the fair value of such transferable securities and money market instruments, will be determined on the basis of the foreseeable sale price, as estimated by the Board of Directors prudently and in good faith.
5) If, as a result of special circumstances or features, valuation on the basis of the rules set out
above becomes impracticable or inaccurate, other generally accepted, verifiable valuation criteria will be applied to obtain a fair value. These criteria shall be determined prudently by the Board of Directors, based on information or other market data. In such circumstances, these assets will be valued according to mathematical or financial models or other alternative valuation methods in order that their fair value on the valuation day may be recorded in the financial statements.
c) Acquisition cost of securities in the portfolio The acquisition cost of the securities held by each sub-fund that are denominated in a currency other than the reference currency of the sub-fund is converted to this currency at the exchange rate prevailing on the date of purchase. d) Net realised gain (loss) on sales of securities The realised gains and losses on sales of securities are determined on the basis of the average acquisition cost. e) Investment income Interest income accrued and payable are recorded, net of any withholding tax.
KBC RENTA
Notes to the financial statements (continued) as at 31st March 2013
115
f) Valuation of forward foreign exchange contracts Forward foreign exchange contracts are valued at forward market rates for the remaining period from valuation date to the maturity of the contracts. g) Valuation of futures contracts Futures contracts are posted off-balance sheet and valued at the last settlement or close price on the stock exchanges or regulated markets. h) Formation expenses Formation expenses were amortised on a straight line basis over a period of 5 years. i) Conversion of foreign currencies Bank balances, other net assets and the valuation of the securities in portfolio expressed in currencies other than the currency of the sub-fund are converted into this currency at the exchange rate prevailing on the date of the report. Income and expenses expressed in currencies other than the currency of the sub-fund are converted into this currency at the exchange rate prevailing on the date of the transaction. j) Consolidation The consolidated financial statements of the SICAV are expressed in EUR and are equal to the sum of the corresponding captions in the financial statements of each sub-fund converted into this currency at the exchange rates prevailing at the date of the report. At the date of the report, the consolidation exchange rates are the following: 1 EUR = 1.2313673 AUD Australian Dollar 1.3038754 CAD Canadian Dollar 1.2163175 CHF Swiss Franc 25.7689710 CZK Czech koruna 7.4544829 DKK Danish Krona 0.8451808 GBP Pound Sterling 304.3872430 HUF Hungarian Forint 120.6823988 JPY Japanese Yen 7.4900833 NOK Norwegian Krona 1.5321868 NZD New Zealand Dollar 4.1775714 PLN Polish zloty 8.3431477 SEK Swedish Krona 2.3223056 TRY New Turkish Lira
(1 TRY=1,000,000 TRL) 1.2829000 USD US Dollar k) Receivable / Payable on treasury transactions The caption "Receivable on treasury transactions" comprises maturities of time deposits, new loans or foreign exchange transactions not yet recorded under the caption "Cash at banks". The caption "Payable on treasury transactions" comprises new time deposits, maturities of loans or foreign exchange transactions not yet recorded under the caption "Cash at banks". At a sub-fund level "Receivable and payable on treasury transactions" are disclosed net in the statement of net assets.
KBC RENTA
Notes to the financial statements (continued) as at 31st March 2013
116
Note 2 - Commission for management, distribution and risk management and supplementary fee The Board of Directors of the SICAV is responsible for the general investment policy. In respect of the contract which entered into force on 1st May 2006, the SICAV has appointed KBC ASSET MANAGEMENT S.A. as Management Company within the meaning of Chapter 15 of the amended law of 17th December 2010 relating to Undertakings for Collective Investment. In consideration of services provided concerning management, distribution and risk management, the Management Company receives an annual fee payable monthly on the average net assets of the sub-funds to the effective rates of: Sub-Funds Effective rates - KBC Renta Decarenta 0.60% - KBC Renta Eurorenta 0.70% - KBC Renta Sekarenta 0.60% - KBC Renta Dollarenta 0.70% - KBC Renta Yenrenta 0.40% - KBC Renta Canarenta 0.60% - KBC Renta Sterlingrenta 0.60% - KBC Renta Swissrenta 0.50% - KBC Renta Emurenta 0.70% - KBC Renta Czechrenta 1.00% - KBC Renta AUD-Renta 1.10% - KBC Renta NZD-Renta 1.10% - KBC Renta Short EUR 0.40% - KBC Renta Medium EUR 0.70% - KBC Renta Long EUR 0.70% - KBC Renta Zlotyrenta 1.10% - KBC Renta Forintrenta 1.10% - KBC Renta Slovakrenta 1.00% - KBC Renta Nokrenta 0.60% - KBC Renta TRY-Renta 1.10% - KBC Renta Short USD 0.20% - KBC Renta Long Term Dedicated 1 0.40% - KBC Renta Long Term Dedicated 2 (launched on 16th November 2012) 0.40% - KBC Renta Strategic Accents 1 (launched on 28th December 2012) 0.95% The Management Company delegates the management of the sub-funds KBC Renta Czechrenta, KBC Renta Zlotyrenta and KBC Renta Forintrenta to CSOB ASSET MANAGEMENT A.S., KBC TFI S.A. and K & H BEFEKTETESI ALAPKEZELO Zrt. respectively and bears their remuneration. At the date of the report no performance fee was recorded. Note 3 - Custodian and central administration fees The custodian and central administration fees are paid according to a variable annual rate of commission specified in a fee agreement.
KBC RENTA
Notes to the financial statements (continued) as at 31st March 2013
117
Note 4 - Subscription duty "Taxe d’abonnement" The SICAV is governed by Luxembourg law. Pursuant to the legislation and regulations which are prevailing, the SICAV is subject to an annual subscription duty ("taxe d’abonnement") of 0.05% which is payable quarterly and calculated on the basis of the net assets of each sub-fund on the last day of each quarter. The sub-category "Institutional B Share" benefits from the reduced tax of 0.01% in conformity with Article174 (2) of the amended law of 17th December 2010. Pursuant to the Article 175 (a) of the amended law of 17th December 2010 the net assets invested in collective investment undertakings already subject to the "taxe d’abonnement" are exempt from this tax. Note 5 - Belgian annual tax The Belgian regulation (the inheritance tax code, tome II bis) imposes to Undertakings for Collective Investment which were authorised to market their shares publicly in Belgium, the payment of an annual tax. This tax amounts to 0.08% on the total of the net sums invested in Belgium at 31st December of the previous year, starting from their registration with the "Financial Services and Markets Authority” ("FSMA"). The SICAV pays the tax, at the latest, at 31st March each year. Note 6 - Subscription, redemption and conversion fees
a) Subscription fee in favour of the financial intermediaries At the end of the initial subscription period, the shares, except the ones of the sub-category “Institutional B Shares”, are issued at a price corresponding to the net asset value per share, plus a subscription fee up to 2.50% payable by the subscriber in favour of the financial intermediaries.
b) Redemption, conversion fee in favour of the sub-funds of the SICAV
All shares submitted to redemption, except the ones of the sub-category “Institutional B Shares”, will be redeemed at the net asset value per share at the date of the redemption order receipt subject to deduction of a fee up to 1.00% payable by the seller in favour of the SICAV.
Currently, there is no redemption fee in Belgium and Luxembourg. Whereas within one or more sub-funds, distribution shares and capitalisation shares are issued and in circulation, the shareholders will be entitled to convert all or part of them at a price equal to the respective net asset values at the date of the conversion order receipt, less a conversion fee in favour of the respective sub-funds. No fee is currently applied in case of conversion of shares between the different sub-funds of the SICAV.
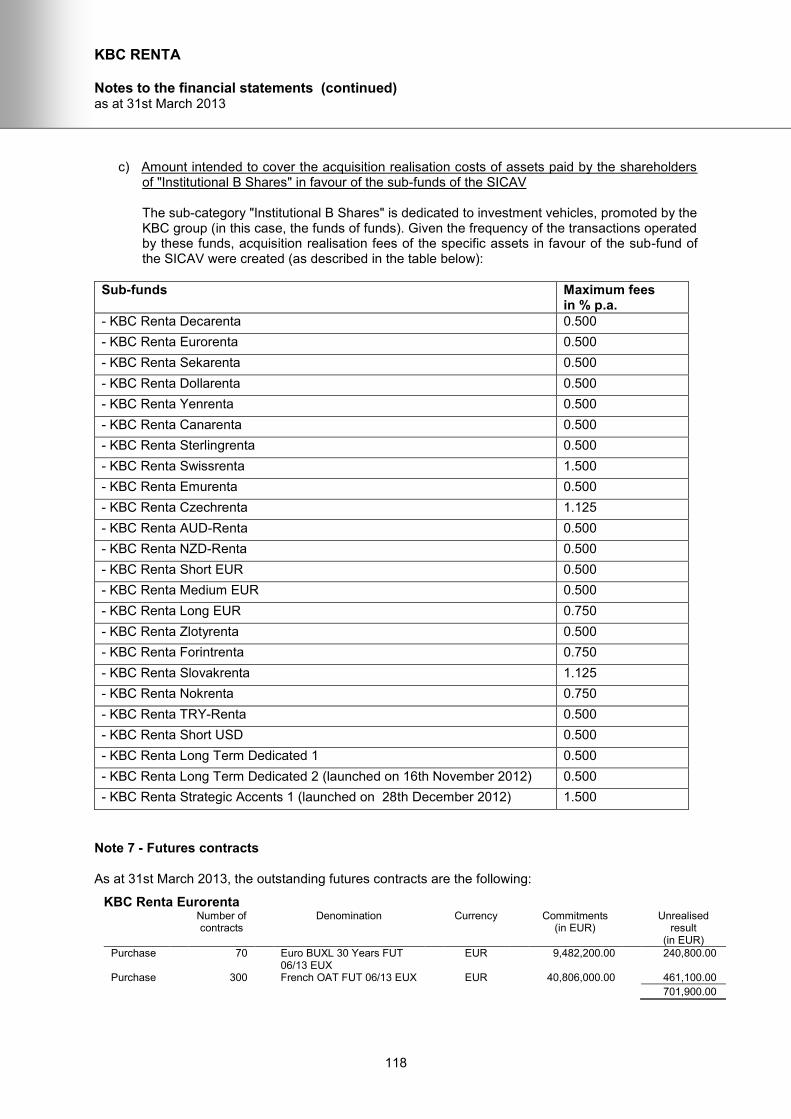
KBC RENTA
Notes to the financial statements (continued) as at 31st March 2013
118
c) Amount intended to cover the acquisition realisation costs of assets paid by the shareholders of "Institutional B Shares" in favour of the sub-funds of the SICAV The sub-category "Institutional B Shares" is dedicated to investment vehicles, promoted by the KBC group (in this case, the funds of funds). Given the frequency of the transactions operated by these funds, acquisition realisation fees of the specific assets in favour of the sub-fund of the SICAV were created (as described in the table below):
Sub-funds Maximum fees in % p.a.
- KBC Renta Decarenta 0.500
- KBC Renta Eurorenta 0.500
- KBC Renta Sekarenta 0.500
- KBC Renta Dollarenta 0.500
- KBC Renta Yenrenta 0.500
- KBC Renta Canarenta 0.500
- KBC Renta Sterlingrenta 0.500
- KBC Renta Swissrenta 1.500
- KBC Renta Emurenta 0.500
- KBC Renta Czechrenta 1.125
- KBC Renta AUD-Renta 0.500
- KBC Renta NZD-Renta 0.500
- KBC Renta Short EUR 0.500
- KBC Renta Medium EUR 0.500
- KBC Renta Long EUR 0.750
- KBC Renta Zlotyrenta 0.500
- KBC Renta Forintrenta 0.750
- KBC Renta Slovakrenta 1.125
- KBC Renta Nokrenta 0.750
- KBC Renta TRY-Renta 0.500
- KBC Renta Short USD 0.500
- KBC Renta Long Term Dedicated 1 0.500
- KBC Renta Long Term Dedicated 2 (launched on 16th November 2012) 0.500
- KBC Renta Strategic Accents 1 (launched on 28th December 2012) 1.500
Note 7 - Futures contracts As at 31st March 2013, the outstanding futures contracts are the following:
KBC Renta Eurorenta Number of
contracts Denomination Currency Commitments
(in EUR) Unrealised
result (in EUR)
Purchase 70 Euro BUXL 30 Years FUT 06/13 EUX
EUR 9,482,200.00 240,800.00
Purchase 300 French OAT FUT 06/13 EUX EUR 40,806,000.00 461,100.00
701,900.00
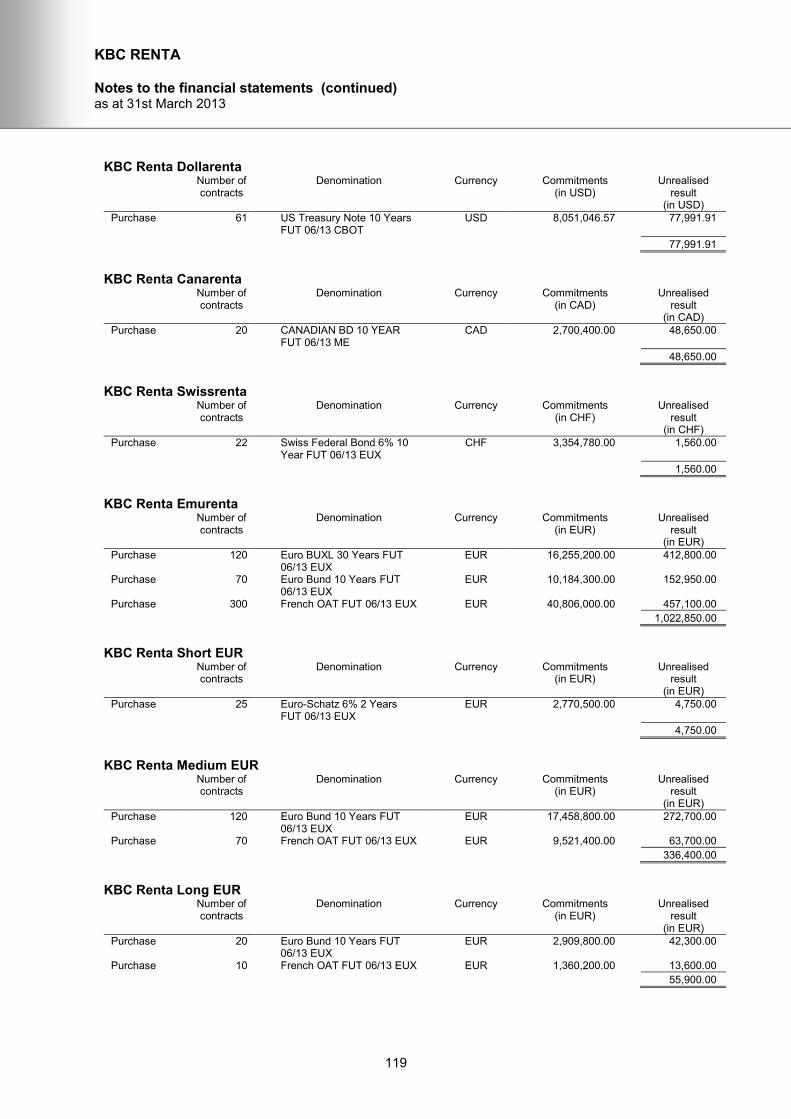
KBC RENTA
Notes to the financial statements (continued) as at 31st March 2013
119
KBC Renta Dollarenta Number of
contracts Denomination Currency Commitments
(in USD) Unrealised
result (in USD)
Purchase 61 US Treasury Note 10 Years FUT 06/13 CBOT
USD 8,051,046.57 77,991.91
77,991.91
KBC Renta Canarenta Number of
contracts Denomination Currency Commitments
(in CAD) Unrealised
result (in CAD)
Purchase 20 CANADIAN BD 10 YEAR FUT 06/13 ME
CAD 2,700,400.00 48,650.00
48,650.00
KBC Renta Swissrenta Number of
contracts Denomination Currency Commitments
(in CHF) Unrealised
result (in CHF)
Purchase 22 Swiss Federal Bond 6% 10 Year FUT 06/13 EUX
CHF 3,354,780.00 1,560.00
1,560.00
KBC Renta Emurenta Number of
contracts Denomination Currency Commitments
(in EUR) Unrealised
result (in EUR)
Purchase 120 Euro BUXL 30 Years FUT 06/13 EUX
EUR 16,255,200.00 412,800.00
Purchase 70 Euro Bund 10 Years FUT 06/13 EUX
EUR 10,184,300.00 152,950.00
Purchase 300 French OAT FUT 06/13 EUX EUR 40,806,000.00 457,100.00
1,022,850.00
KBC Renta Short EUR Number of
contracts Denomination Currency Commitments
(in EUR) Unrealised
result (in EUR)
Purchase 25 Euro-Schatz 6% 2 Years FUT 06/13 EUX
EUR 2,770,500.00 4,750.00
4,750.00
KBC Renta Medium EUR Number of
contracts Denomination Currency Commitments
(in EUR) Unrealised
result (in EUR)
Purchase 120 Euro Bund 10 Years FUT 06/13 EUX
EUR 17,458,800.00 272,700.00
Purchase 70 French OAT FUT 06/13 EUX EUR 9,521,400.00 63,700.00
336,400.00
KBC Renta Long EUR Number of
contracts Denomination Currency Commitments
(in EUR) Unrealised
result (in EUR)
Purchase 20 Euro Bund 10 Years FUT 06/13 EUX
EUR 2,909,800.00 42,300.00
Purchase 10 French OAT FUT 06/13 EUX EUR 1,360,200.00 13,600.00
55,900.00
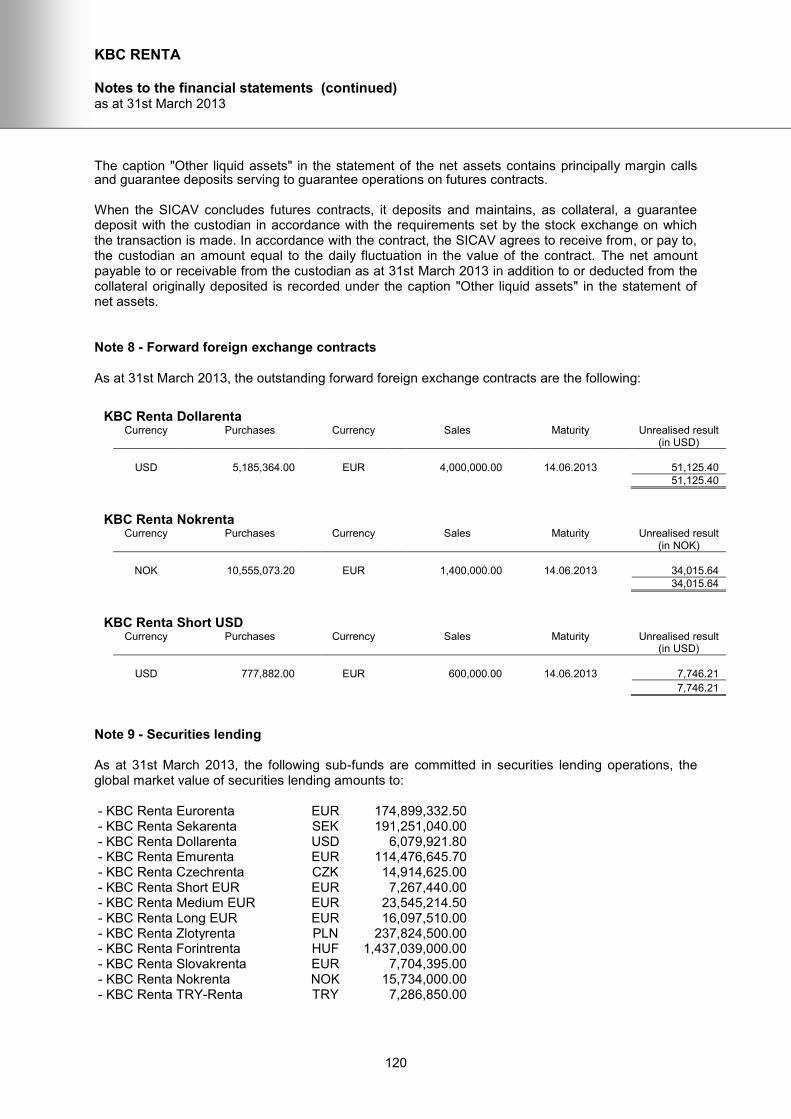
KBC RENTA
Notes to the financial statements (continued) as at 31st March 2013
120
The caption "Other liquid assets" in the statement of the net assets contains principally margin calls and guarantee deposits serving to guarantee operations on futures contracts. When the SICAV concludes futures contracts, it deposits and maintains, as collateral, a guarantee deposit with the custodian in accordance with the requirements set by the stock exchange on which the transaction is made. In accordance with the contract, the SICAV agrees to receive from, or pay to, the custodian an amount equal to the daily fluctuation in the value of the contract. The net amount payable to or receivable from the custodian as at 31st March 2013 in addition to or deducted from the collateral originally deposited is recorded under the caption "Other liquid assets" in the statement of net assets. Note 8 - Forward foreign exchange contracts As at 31st March 2013, the outstanding forward foreign exchange contracts are the following:
KBC Renta Dollarenta Currency Purchases Currency Sales Maturity Unrealised result
(in USD)
USD 5,185,364.00 EUR 4,000,000.00 14.06.2013 51,125.40
51,125.40
KBC Renta Nokrenta Currency Purchases Currency Sales Maturity Unrealised result
(in NOK)
NOK 10,555,073.20 EUR 1,400,000.00 14.06.2013 34,015.64
34,015.64
KBC Renta Short USD Currency Purchases Currency Sales Maturity Unrealised result
(in USD)
USD 777,882.00 EUR 600,000.00 14.06.2013 7,746.21
7,746.21
Note 9 - Securities lending As at 31st March 2013, the following sub-funds are committed in securities lending operations, the global market value of securities lending amounts to: - KBC Renta Eurorenta EUR 174,899,332.50 - KBC Renta Sekarenta SEK 191,251,040.00 - KBC Renta Dollarenta USD 6,079,921.80 - KBC Renta Emurenta EUR 114,476,645.70 - KBC Renta Czechrenta CZK 14,914,625.00 - KBC Renta Short EUR EUR 7,267,440.00 - KBC Renta Medium EUR EUR 23,545,214.50 - KBC Renta Long EUR EUR 16,097,510.00 - KBC Renta Zlotyrenta PLN 237,824,500.00 - KBC Renta Forintrenta HUF 1,437,039,000.00 - KBC Renta Slovakrenta EUR 7,704,395.00 - KBC Renta Nokrenta NOK 15,734,000.00 - KBC Renta TRY-Renta TRY 7,286,850.00
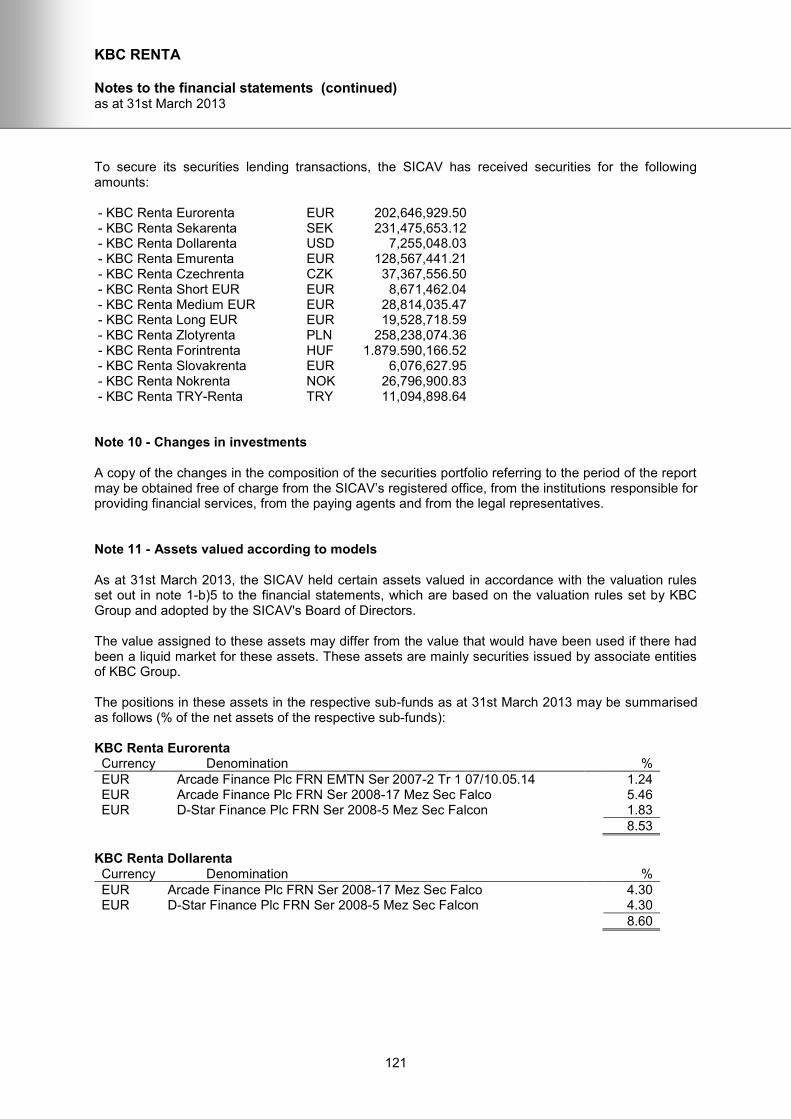
KBC RENTA
Notes to the financial statements (continued) as at 31st March 2013
121
To secure its securities lending transactions, the SICAV has received securities for the following amounts: - KBC Renta Eurorenta EUR 202,646,929.50 - KBC Renta Sekarenta SEK 231,475,653.12 - KBC Renta Dollarenta USD 7,255,048.03 - KBC Renta Emurenta EUR 128,567,441.21 - KBC Renta Czechrenta CZK 37,367,556.50 - KBC Renta Short EUR EUR 8,671,462.04 - KBC Renta Medium EUR EUR 28,814,035.47 - KBC Renta Long EUR EUR 19,528,718.59 - KBC Renta Zlotyrenta PLN 258,238,074.36 - KBC Renta Forintrenta HUF 1.879.590,166.52 - KBC Renta Slovakrenta EUR 6,076,627.95 - KBC Renta Nokrenta NOK 26,796,900.83 - KBC Renta TRY-Renta TRY 11,094,898.64 Note 10 - Changes in investments A copy of the changes in the composition of the securities portfolio referring to the period of the report may be obtained free of charge from the SICAV’s registered office, from the institutions responsible for providing financial services, from the paying agents and from the legal representatives. Note 11 - Assets valued according to models As at 31st March 2013, the SICAV held certain assets valued in accordance with the valuation rules set out in note 1-b)5 to the financial statements, which are based on the valuation rules set by KBC Group and adopted by the SICAV's Board of Directors. The value assigned to these assets may differ from the value that would have been used if there had been a liquid market for these assets. These assets are mainly securities issued by associate entities of KBC Group. The positions in these assets in the respective sub-funds as at 31st March 2013 may be summarised as follows (% of the net assets of the respective sub-funds): KBC Renta Eurorenta Currency Denomination %
EUR Arcade Finance Plc FRN EMTN Ser 2007-2 Tr 1 07/10.05.14 1.24 EUR Arcade Finance Plc FRN Ser 2008-17 Mez Sec Falco 5.46 EUR D-Star Finance Plc FRN Ser 2008-5 Mez Sec Falcon 1.83
8.53
KBC Renta Dollarenta Currency Denomination %
EUR Arcade Finance Plc FRN Ser 2008-17 Mez Sec Falco 4.30 EUR D-Star Finance Plc FRN Ser 2008-5 Mez Sec Falcon 4.30
8.60
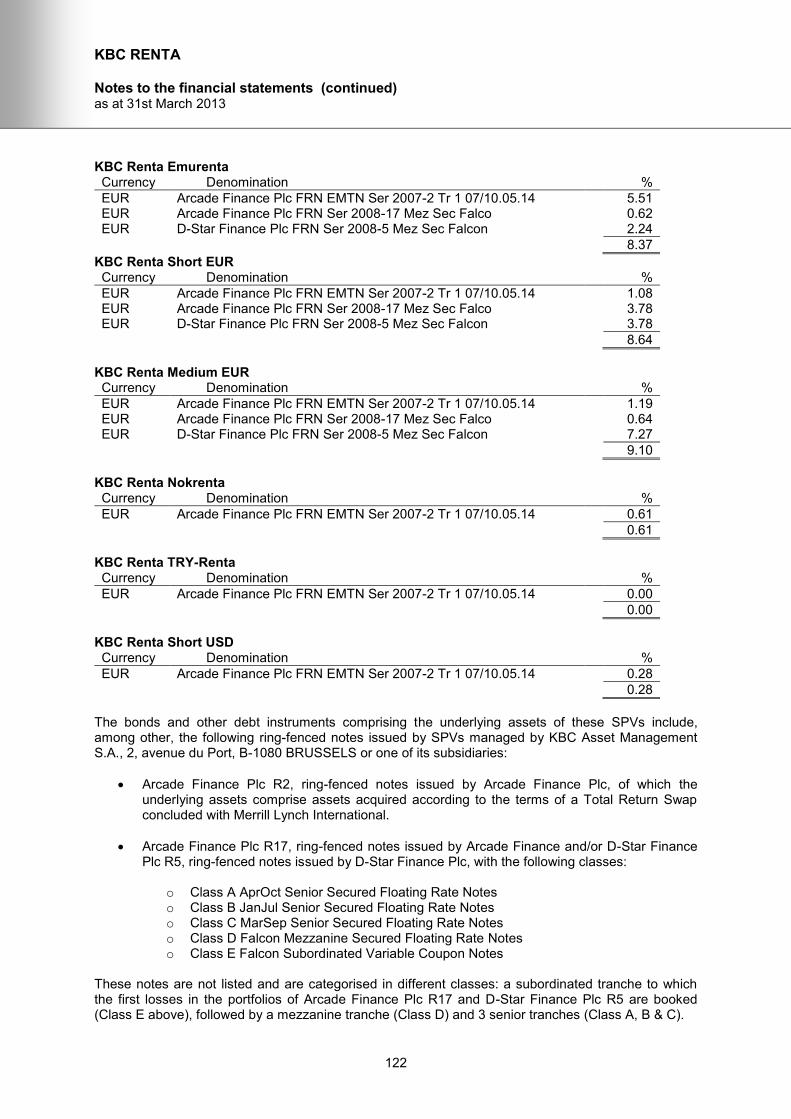
KBC RENTA
Notes to the financial statements (continued) as at 31st March 2013
122
KBC Renta Emurenta Currency Denomination %
EUR Arcade Finance Plc FRN EMTN Ser 2007-2 Tr 1 07/10.05.14 5.51 EUR Arcade Finance Plc FRN Ser 2008-17 Mez Sec Falco 0.62 EUR D-Star Finance Plc FRN Ser 2008-5 Mez Sec Falcon 2.24
8.37
KBC Renta Short EUR Currency Denomination %
EUR Arcade Finance Plc FRN EMTN Ser 2007-2 Tr 1 07/10.05.14 1.08 EUR Arcade Finance Plc FRN Ser 2008-17 Mez Sec Falco 3.78 EUR D-Star Finance Plc FRN Ser 2008-5 Mez Sec Falcon 3.78
8.64
KBC Renta Medium EUR Currency Denomination %
EUR Arcade Finance Plc FRN EMTN Ser 2007-2 Tr 1 07/10.05.14 1.19 EUR Arcade Finance Plc FRN Ser 2008-17 Mez Sec Falco 0.64 EUR D-Star Finance Plc FRN Ser 2008-5 Mez Sec Falcon 7.27
9.10
KBC Renta Nokrenta Currency Denomination %
EUR Arcade Finance Plc FRN EMTN Ser 2007-2 Tr 1 07/10.05.14 0.61
0.61
KBC Renta TRY-Renta Currency Denomination %
EUR Arcade Finance Plc FRN EMTN Ser 2007-2 Tr 1 07/10.05.14 0.00
0.00
KBC Renta Short USD Currency Denomination %
EUR Arcade Finance Plc FRN EMTN Ser 2007-2 Tr 1 07/10.05.14 0.28
0.28
The bonds and other debt instruments comprising the underlying assets of these SPVs include, among other, the following ring-fenced notes issued by SPVs managed by KBC Asset Management S.A., 2, avenue du Port, B-1080 BRUSSELS or one of its subsidiaries:
Arcade Finance Plc R2, ring-fenced notes issued by Arcade Finance Plc, of which the underlying assets comprise assets acquired according to the terms of a Total Return Swap concluded with Merrill Lynch International.
Arcade Finance Plc R17, ring-fenced notes issued by Arcade Finance and/or D-Star Finance Plc R5, ring-fenced notes issued by D-Star Finance Plc, with the following classes:
o Class A AprOct Senior Secured Floating Rate Notes o Class B JanJul Senior Secured Floating Rate Notes o Class C MarSep Senior Secured Floating Rate Notes o Class D Falcon Mezzanine Secured Floating Rate Notes o Class E Falcon Subordinated Variable Coupon Notes
These notes are not listed and are categorised in different classes: a subordinated tranche to which the first losses in the portfolios of Arcade Finance Plc R17 and D-Star Finance Plc R5 are booked (Class E above), followed by a mezzanine tranche (Class D) and 3 senior tranches (Class A, B & C).

KBC RENTA
Notes to the financial statements (continued) as at 31st March 2013
123
As at 31st March 2013, Arcade Finance Plc R17 and D-Star Finance Plc R5 invested in shares of N-Vest Fund - 1, a sub-fund of N-Vest Fund, a Luxembourg Specialised Investment Fund (FIS). As at 31st March 2013, N-Vest Fund - 1 invested in a portfolio of money market instruments, bonds, other debt instruments and financial derivatives. These bonds comprise a Tier 1 loan issued by KBC Bank S.A. (KBC 8% 29/05/2049) and ring-fenced notes issued by Arcade Finance Plc R1 and bond issued by Home Loan Invest of which the underlying assets comprise of mortgage loans. The N-Vest Fund 1 portfolio is valued on a held to maturity basis in accordance with the provisions of the prospectus.


