KBL European Private Bankers S.A. 43, boulevard Royal L-2955 Luxembourg R.C.S. Luxembourg: B 006.395 Consolidated accounts, Report of the independent auditor and Consolidated management report as at 31 December 2016
Transcript
KBL European Private Bankers S.A.43, boulevard RoyalL-2955 Luxembourg
R.C.S. Luxembourg: B 006.395
Consolidated accounts, Report of the independent auditorand Consolidated management report as at 31 December 2016
- 2 -
Table of contents
Unqualified certification of the independent auditor ........................................................................................ 4Consolidated income statement .................................................................................................................... 6Consolidated statement of comprehensive income ........................................................................................ 7Consolidated balance sheet .......................................................................................................................... 8Consolidated statement of changes in equity................................................................................................. 9Consolidated cash flow statement ............................................................................................................... 10Notes to the consolidated accounts ............................................................................................................. 11
Note 1 – General ........................................................................................................................................ 11
Note 2a – Statement of compliance ............................................................................................................. 12
Note 2b – Changes in accounting policies since the previous annual publication that may impact KBLepb ............................................................................................................................................................. 12
Note 3a – Segment reporting by business segment ..................................................................................... 29
Note 3b – Operating segments by geographic sector .................................................................................. 30
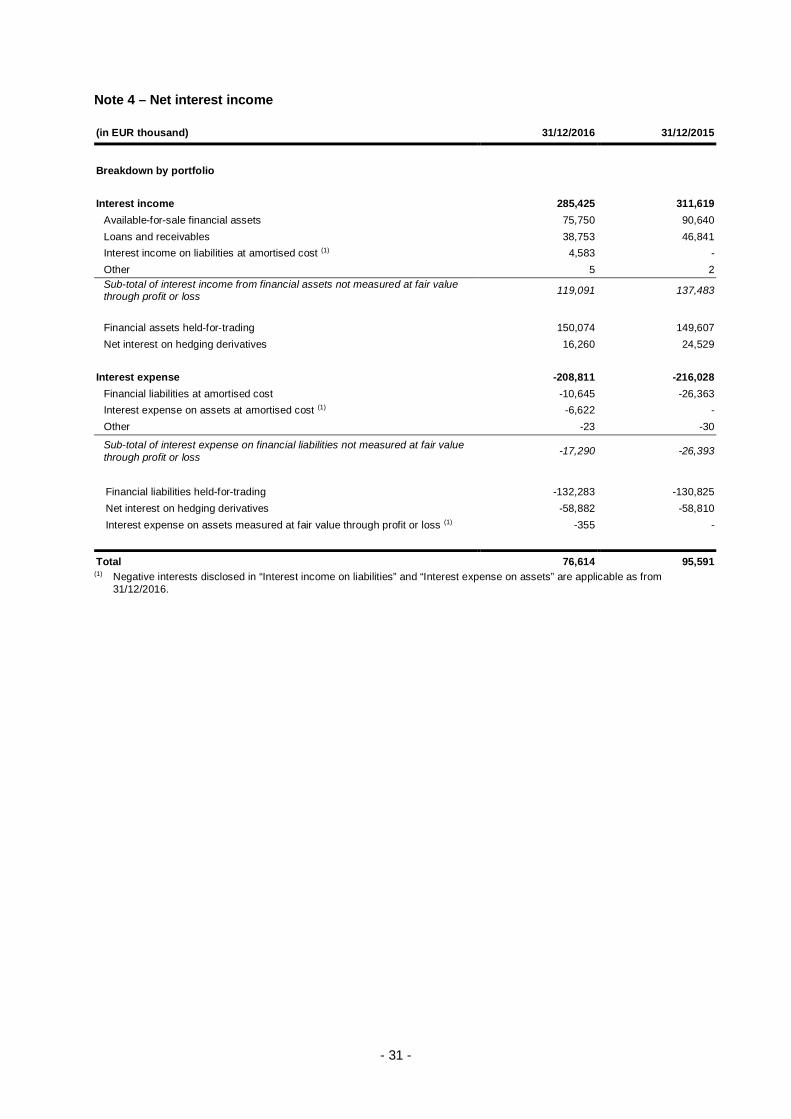
Note 4 – Net interest income ....................................................................................................................... 31
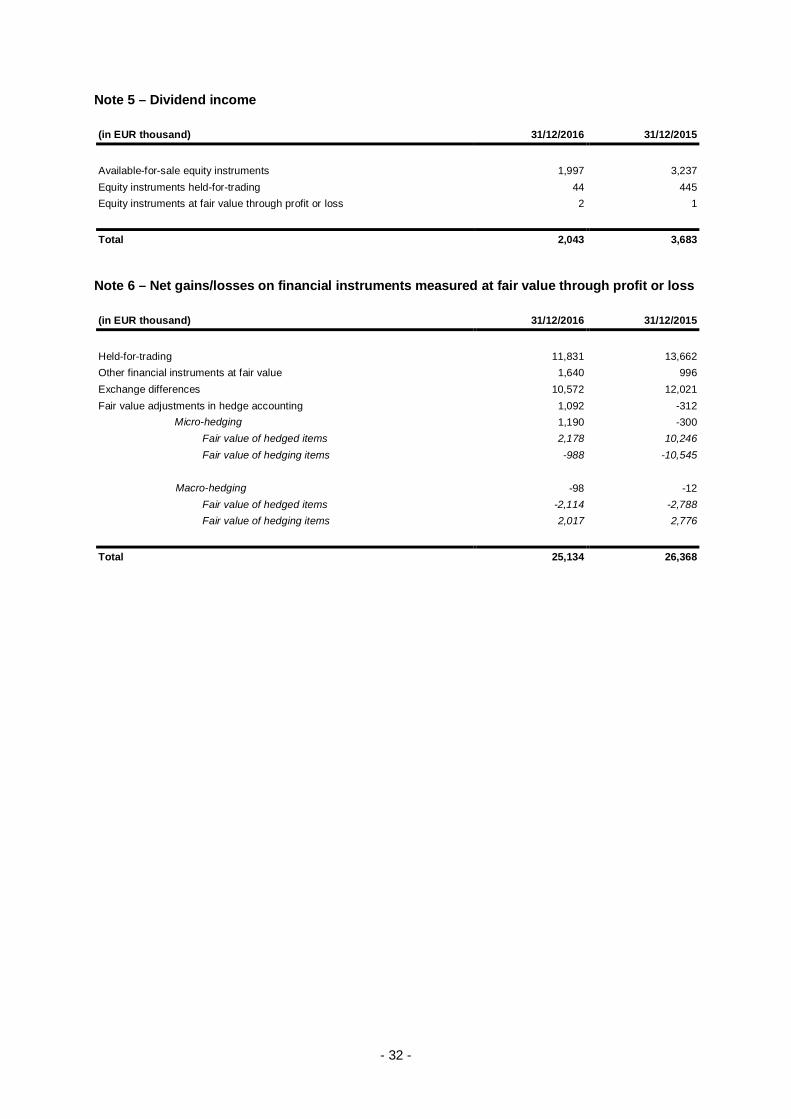
Note 5 – Dividend income ........................................................................................................................... 32
Note 6 – Net gains/losses on financial instruments measured at fair value through profit or loss .................. 32
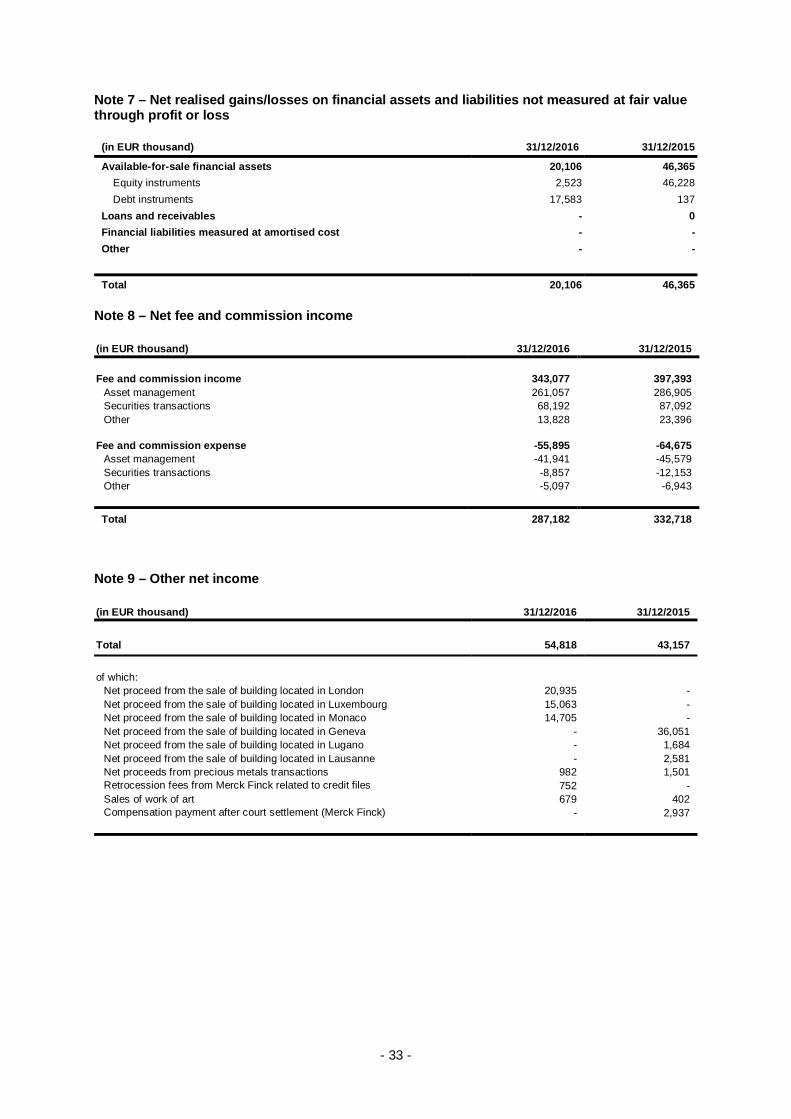
Note 7 – Net realised gains/losses on financial assets and liabilities not measured at fair value throughprofit or loss ................................................................................................................................................ 33
Note 8 – Net fee and commission income ................................................................................................... 33
Note 9 – Other net income .......................................................................................................................... 33
Note 41 – Information country by country .................................................................................................... 91
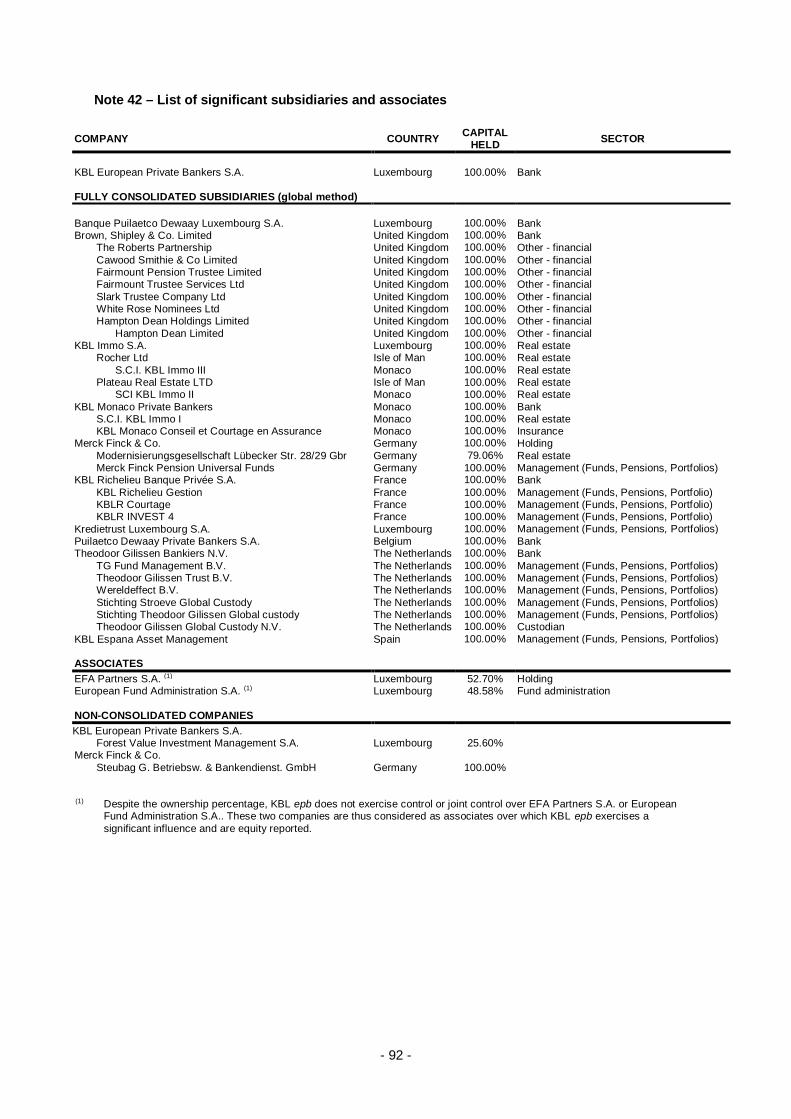
Note 42 – List of significant subsidiaries and associates .............................................................................. 92
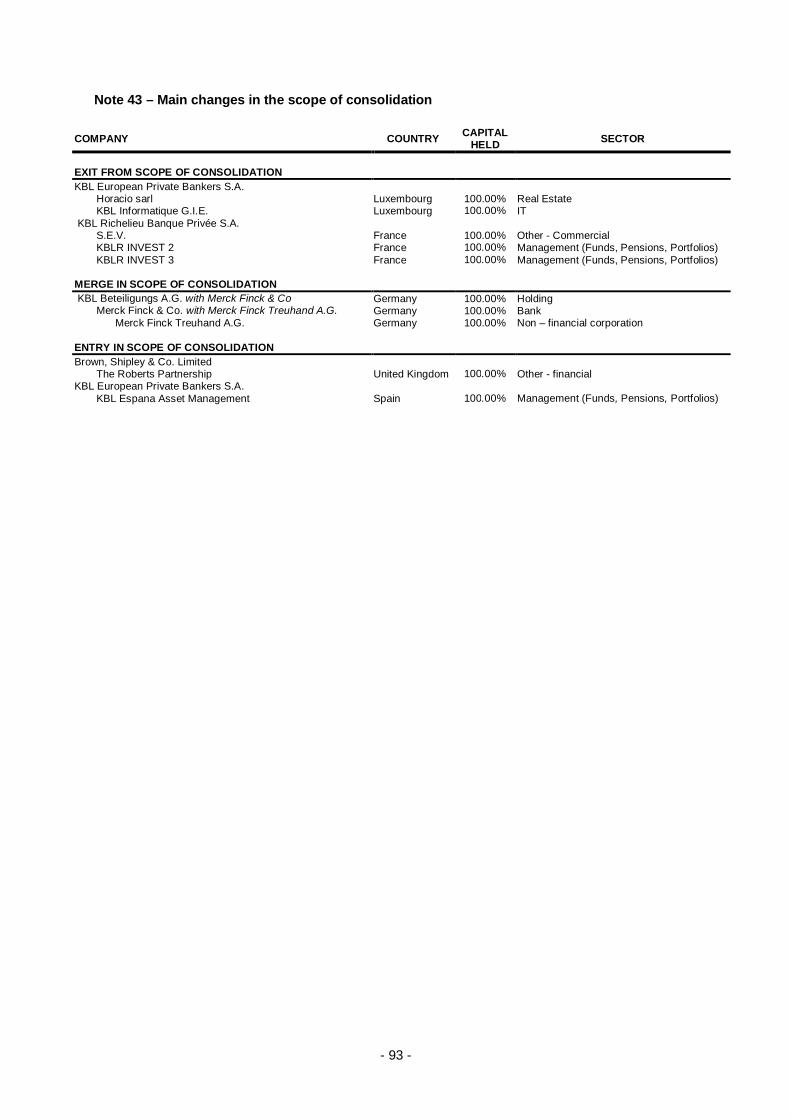
Note 43 – Main changes in the scope of consolidation ................................................................................ 93
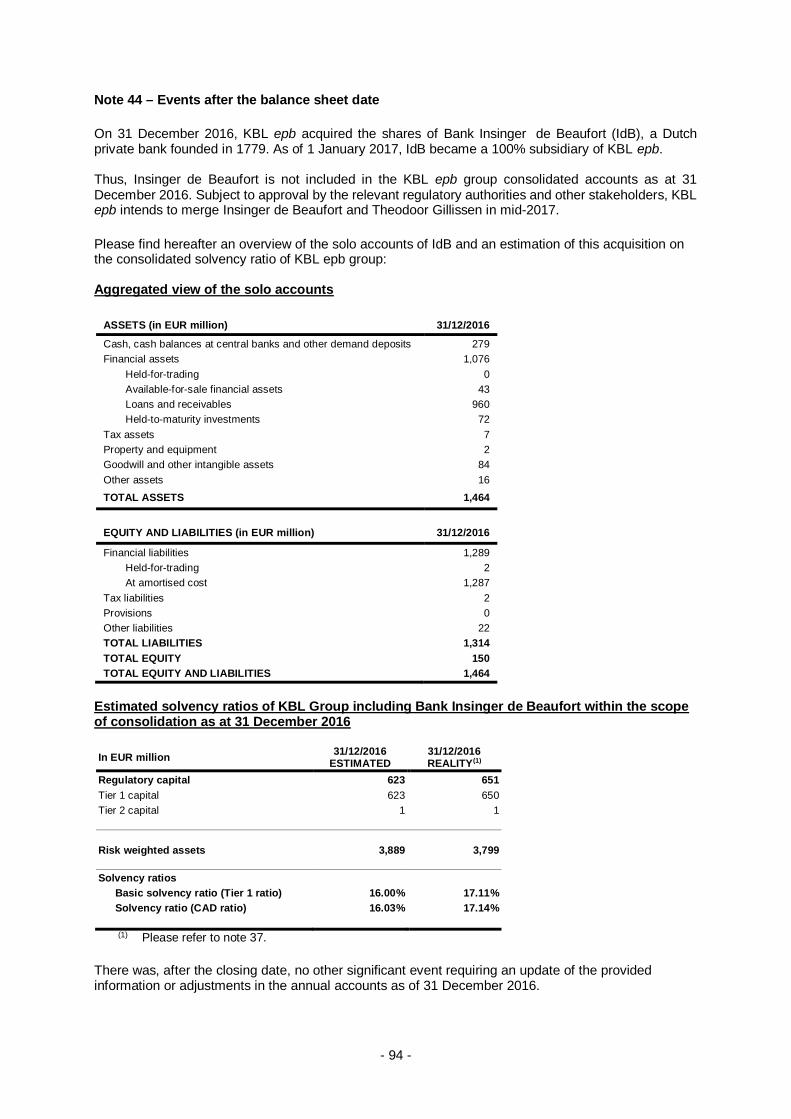
Note 44 – Events after the balance sheet date ............................................................................................ 94
The quantitative tables in the following pages may sometimes show small differences due to the use of concealed decimals.These differences, however, do not in any way affect the true and fair view of the consolidated accounts of the Group. Similarly,the value zero “0” in the following tables indicates the presence of a number after the decimal, while “-” represents the valuenil.
- 6 -
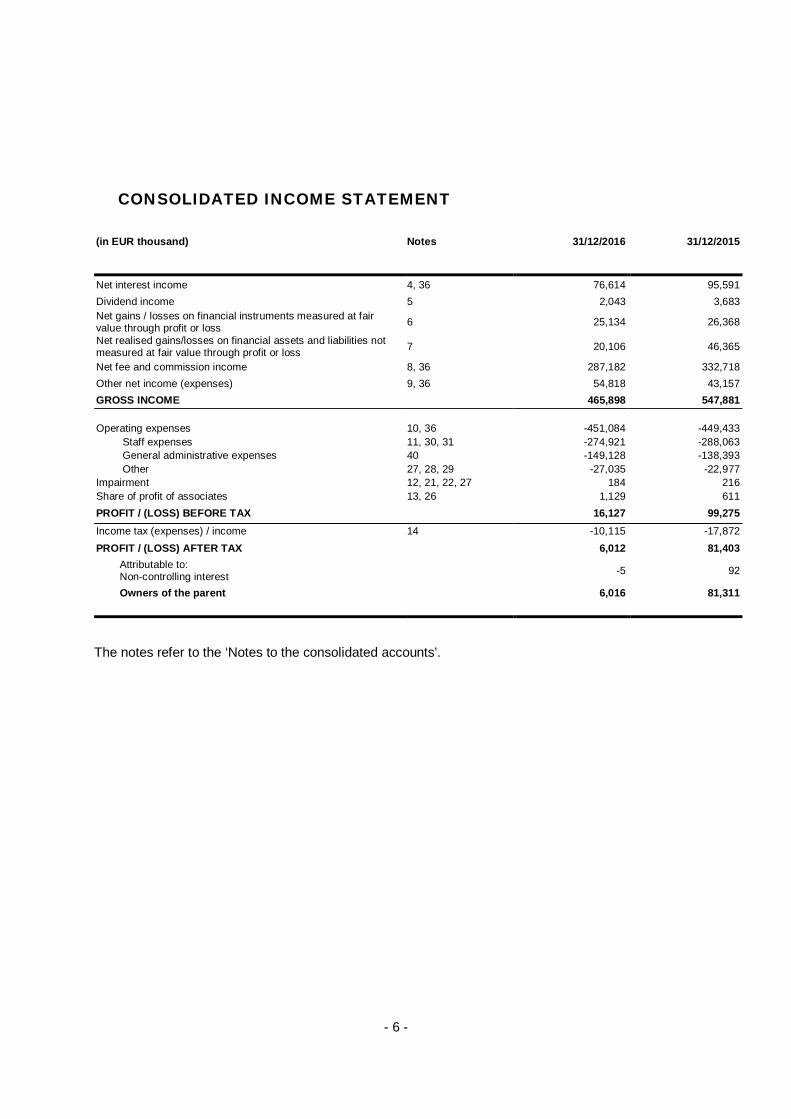
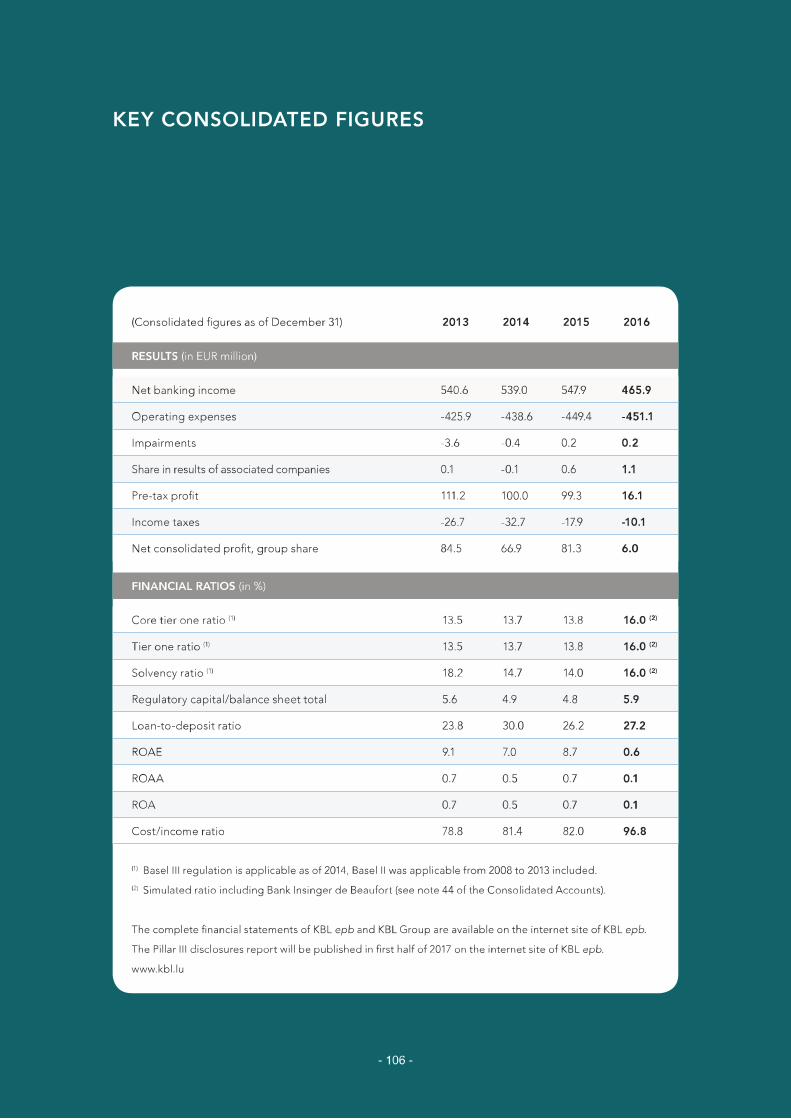
CONSOLIDATED INCOME STATEMENT
(in EUR thousand) Notes 31/12/2016 31/12/2015
Net interest income 4, 36 76,614 95,591Dividend income 5 2,043 3,683Net gains / losses on financial instruments measured at fairvalue through profit or loss 6 25,134 26,368
Net realised gains/losses on financial assets and liabilities notmeasured at fair value through profit or loss 7 20,106 46,365
Net fee and commission income 8, 36 287,182 332,718Other net income (expenses) 9, 36 54,818 43,157GROSS INCOME 465,898 547,881
Impairment 12, 21, 22, 27 184 216Share of profit of associates 13, 26 1,129 611PROFIT / (LOSS) BEFORE TAX 16,127 99,275Income tax (expenses) / income 14 -10,115 -17,872PROFIT / (LOSS) AFTER TAX 6,012 81,403
Attributable to:Non-controlling interest -5 92
Owners of the parent 6,016 81,311
The notes refer to the ‘Notes to the consolidated accounts’.
- 7 -
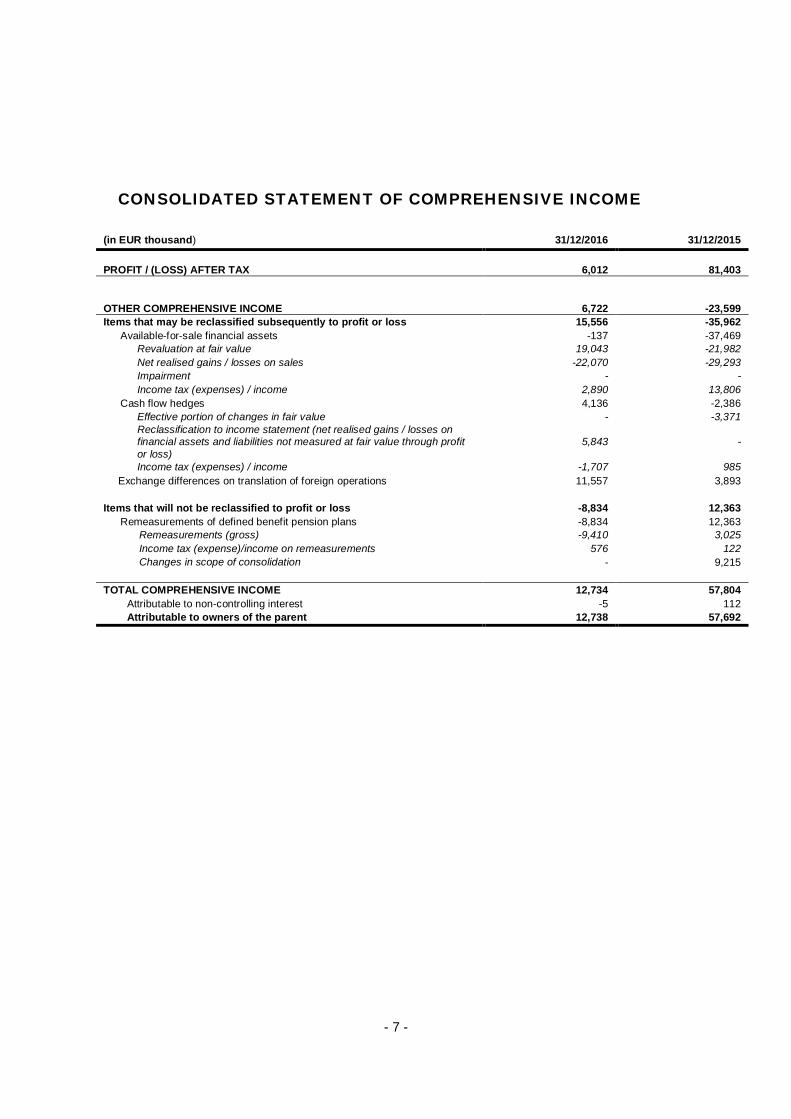
CONSOLIDATED STATEMENT OF COMPREHENSIVE INCOME
(in EUR thousand) 31/12/2016 31/12/2015
PROFIT / (LOSS) AFTER TAX 6,012 81,403
OTHER COMPREHENSIVE INCOME 6,722 -23,599Items that may be reclassified subsequently to profit or loss 15,556 -35,962
Available-for-sale financial assets -137 -37,469Revaluation at fair value 19,043 -21,982Net realised gains / losses on sales -22,070 -29,293Impairment - -Income tax (expenses) / income 2,890 13,806
Cash flow hedges 4,136 -2,386Effective portion of changes in fair value - -3,371Reclassification to income statement (net realised gains / losses onfinancial assets and liabilities not measured at fair value through profitor loss)
5,843 -
Income tax (expenses) / income -1,707 985Exchange differences on translation of foreign operations 11,557 3,893
Items that will not be reclassified to profit or loss -8,834 12,363Remeasurements of defined benefit pension plans -8,834 12,363
Remeasurements (gross) -9,410 3,025Income tax (expense)/income on remeasurements 576 122Changes in scope of consolidation - 9,215
TOTAL COMPREHENSIVE INCOME 12,734 57,804Attributable to non-controlling interest -5 112Attributable to owners of the parent 12,738 57,692
- 8 -
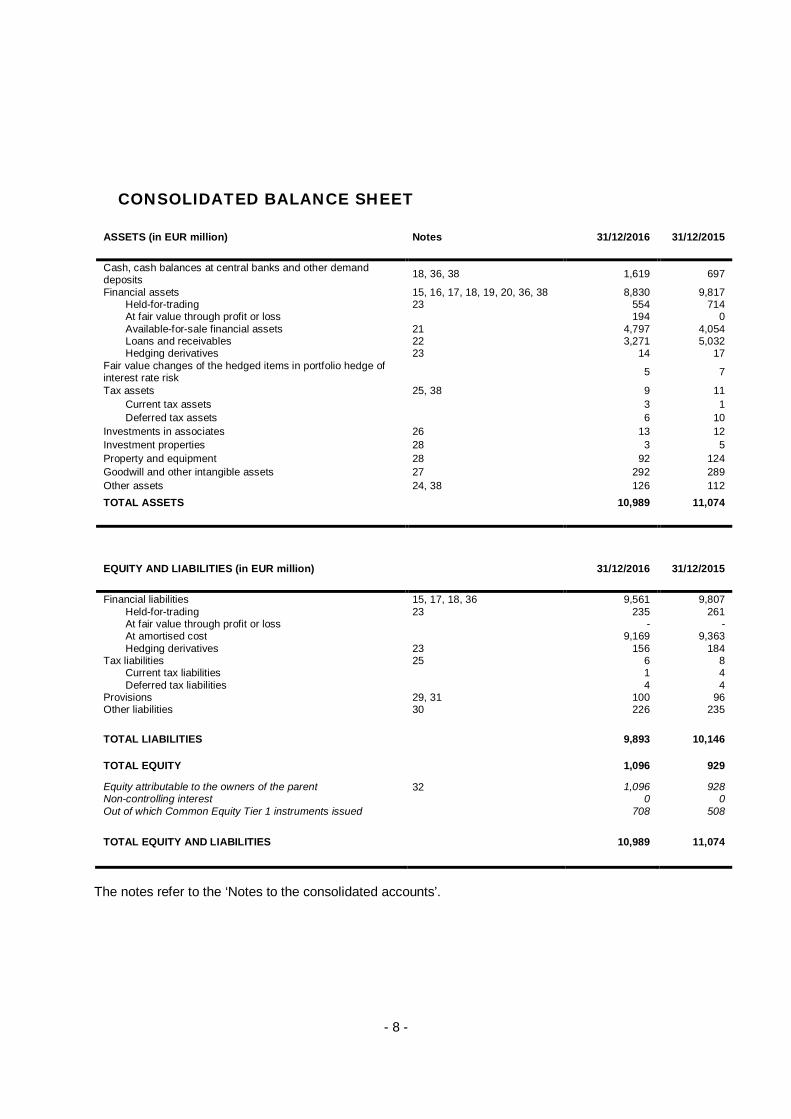
CONSOLIDATED BALANCE SHEET
ASSETS (in EUR million) Notes 31/12/2016 31/12/2015
Cash, cash balances at central banks and other demanddeposits 18, 36, 38 1,619 697
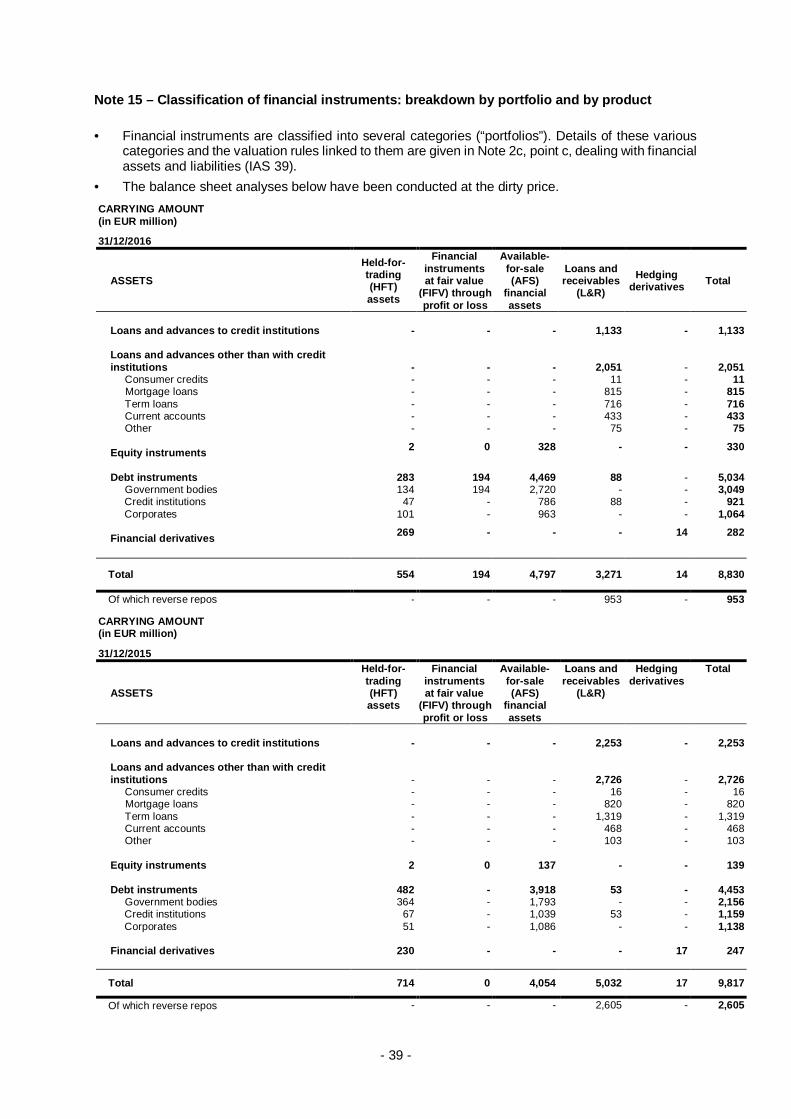
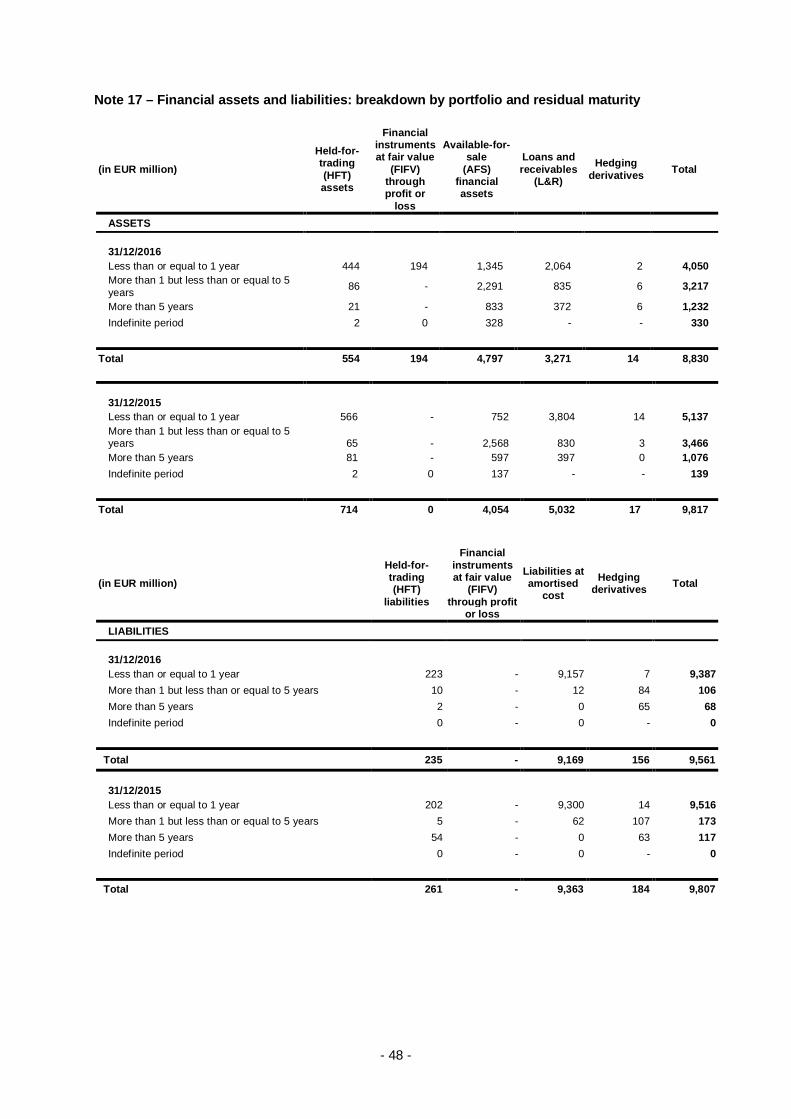
Financial assets 15, 16, 17, 18, 19, 20, 36, 38 8,830 9,817Held-for-trading 23 554 714At fair value through profit or loss 194 0Available-for-sale financial assets 21 4,797 4,054Loans and receivables 22 3,271 5,032Hedging derivatives 23 14 17
Fair value changes of the hedged items in portfolio hedge ofinterest rate risk 5 7
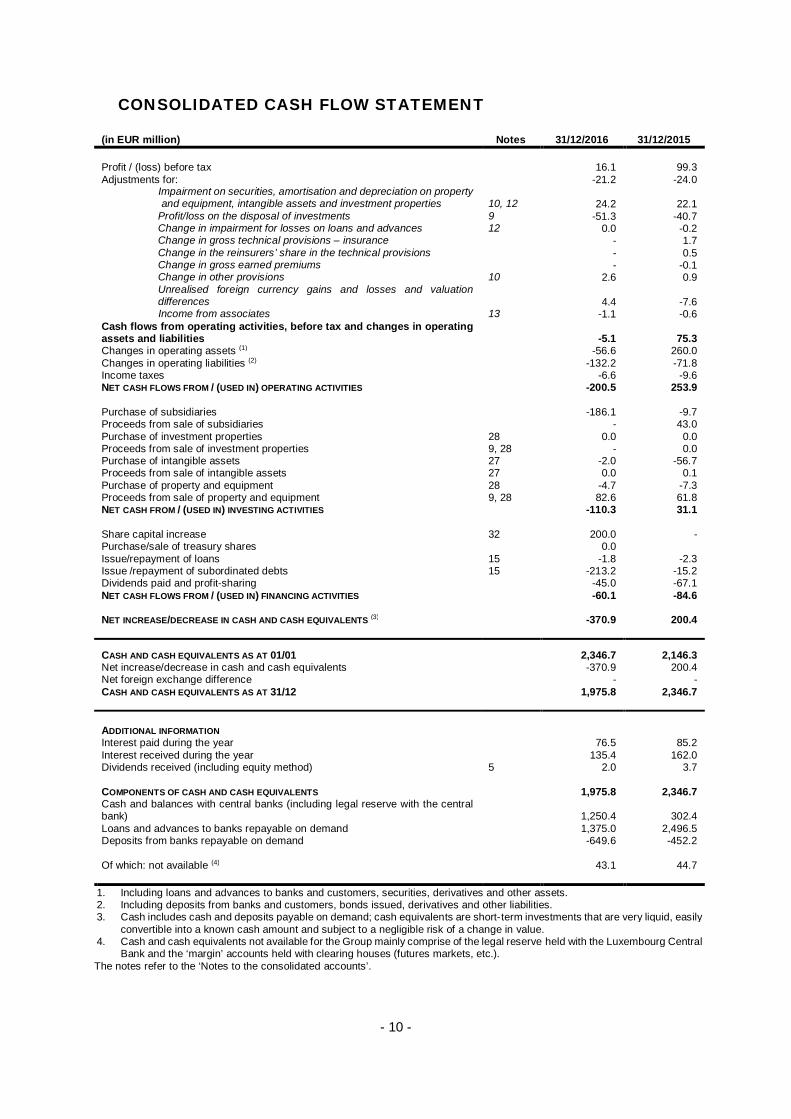
Profit / (loss) before tax 16.1 99.3Adjustments for: -21.2 -24.0
Impairment on securities, amortisation and depreciation on propertyand equipment, intangible assets and investment properties 10, 12 24.2 22.1
Profit/loss on the disposal of investments 9 -51.3 -40.7 Change in impairment for losses on loans and advances 12 0.0 -0.2 Change in gross technical provisions – insurance - 1.7 Change in the reinsurers’ share in the technical provisions - 0.5 Change in gross earned premiums - -0.1 Change in other provisions 10 2.6 0.9
Unrealised foreign currency gains and losses and valuationdifferences 4.4 -7.6
Income from associates 13 -1.1 -0.6Cash flows from operating activities, before tax and changes in operatingassets and liabilities -5.1 75.3Changes in operating assets (1) -56.6 260.0Changes in operating liabilities (2) -132.2 -71.8Income taxes -6.6 -9.6NET CASH FLOWS FROM / (USED IN) OPERATING ACTIVITIES -200.5 253.9
Purchase of subsidiaries -186.1 -9.7Proceeds from sale of subsidiaries - 43.0Purchase of investment properties 28 0.0 0.0Proceeds from sale of investment properties 9, 28 - 0.0Purchase of intangible assets 27 -2.0 -56.7Proceeds from sale of intangible assets 27 0.0 0.1Purchase of property and equipment 28 -4.7 -7.3Proceeds from sale of property and equipment 9, 28 82.6 61.8NET CASH FROM / (USED IN) INVESTING ACTIVITIES -110.3 31.1
Share capital increase 32 200.0 -Purchase/sale of treasury shares 0.0Issue/repayment of loans 15 -1.8 -2.3Issue /repayment of subordinated debts 15 -213.2 -15.2Dividends paid and profit-sharing -45.0 -67.1NET CASH FLOWS FROM / (USED IN) FINANCING ACTIVITIES -60.1 -84.6
NET INCREASE/DECREASE IN CASH AND CASH EQUIVALENTS (3) -370.9 200.4
CASH AND CASH EQUIVALENTS AS AT 01/01 2,346.7 2,146.3Net increase/decrease in cash and cash equivalents -370.9 200.4Net foreign exchange difference - -CASH AND CASH EQUIVALENTS AS AT 31/12 1,975.8 2,346.7
ADDITIONAL INFORMATIONInterest paid during the year 76.5 85.2Interest received during the year 135.4 162.0Dividends received (including equity method) 5 2.0 3.7
COMPONENTS OF CASH AND CASH EQUIVALENTS 1,975.8 2,346.7Cash and balances with central banks (including legal reserve with the centralbank) 1,250.4 302.4Loans and advances to banks repayable on demand 1,375.0 2,496.5Deposits from banks repayable on demand -649.6 -452.2
Of which: not available (4) 43.1 44.7
1. Including loans and advances to banks and customers, securities, derivatives and other assets.2. Including deposits from banks and customers, bonds issued, derivatives and other liabilities.3. Cash includes cash and deposits payable on demand; cash equivalents are short-term investments that are very liquid, easily
convertible into a known cash amount and subject to a negligible risk of a change in value.4. Cash and cash equivalents not available for the Group mainly comprise of the legal reserve held with the Luxembourg Central
Bank and the ‘margin’ accounts held with clearing houses (futures markets, etc.).The notes refer to the ‘Notes to the consolidated accounts’.
- 11 -
NOTES TO THE CONSOLIDATED ACCOUNTS
Note 1 – General
KBL European Private Bankers Group (hereinafter “KBL epb group” or the “Group”) is an internationalnetwork of banks and financial companies, specialised in private banking. In support of, andcomplementary to this activity, KBL epb group is also developing several niche activities specific to itsvarious markets.
The business purpose of KBL epb group is to carry out all banking and credit activities. In addition, KBLepb group is allowed to carry out all commercial, industrial or other operations, including real estatetransactions, in order to achieve its main business purpose, either directly or through shareholdings, orin any other manner, these provisions to be understood in the widest manner possible. KBL epb groupmay carry out any activity which contributes in any way whatsoever to the achievement of its businesspurpose. The Group’s main activities are described in “Note 3a - Operating segments by businesssegment”.
KBL epb group is headed by KBL European Private Bankers S.A. (hereinafter “KBL epb” or the “Bank”),a public limited liability company (société anonyme) in Luxembourg and having its registered office at:
43, boulevard RoyalL-2955 Luxembourg
Since July 2012, KBL epb group is 99.9% owned by Precision Capital S.A., a Luxembourg-basedcompany governed by Luxembourg law representing the interests of a group of Qatari private investors.The registered office of Precision Capital S.A. is located at 15, boulevard Roosevelt, L- 2450Luxembourg.
The Bank’s consolidated accounts are consolidated in the Precision Capital’s consolidated accounts.Precision Capital’s annual consolidated accounts and management report are available at its headoffice. Precision Capital’s consolidated accounts are consolidated in the Pioneer Holding S.A.’sconsolidated accounts. The registered office of Pioneer Holding S.A. is located at 15, boulevardRoosevelt, L- 2450 Luxembourg.
The Roberts PartnershipBrown Shipley & Co acquired The Roberts Partnership, a UK-based financial planning and wealthmanagement firm, on 1 November 2016. The Roberts Partnership became a subsidiary of BrownShipley and will join its Manchester office.
Insinger de BeaufortOn 31 December 2016, KBL epb acquired the shares of Insinger de Beaufort (IdB), a Dutch private bankfounded in 1779. As of 1 January 2017, IdB became a 100% subsidiary of KBL epb.
Thus, Insinger de Beaufort is not included in the KBL epb group consolidated accounts as at 31December 2016. However, an overview of the solo accounts of IdB and an estimation of this acquisitionon the consolidated solvency ratio are presented in the notes of the 2016 consolidated accounts (pleaserefer to Note 44 – Events after the balance sheet date) and in the key consolidated figures of the 2016Annual Report.
Subject to approval by the relevant regulatory authorities and other stakeholders, KBL epb intends tomerge Insinger de Beaufort and Theodoor Gillissen in mid-2017.
- 12 -
Note 2a – Statement of compliance
The consolidated accounts presented in this report were approved by the Board of Directors of KBL epbon 23 March 2017.
The Group consolidated accounts have been prepared in accordance with International FinancialReporting Standards as adopted by the European Union (“IFRS").
The consolidated accounts provide comparative information in respect of the previous financial year.
In preparing the consolidated accounts under IFRS, the Board of Directors is required to make estimatesand assumptions that affect reported income, expenses, assets, liabilities and disclosure of contingentassets and liabilities. Use of available information and application of judgement are inherent in theformation of estimates. Actual results in the future could differ from such estimates and the differencesmay be material to the annual accounts.
Note 2b – Changes in accounting policies since the previous annual publication that mayimpact KBL epb
The accounting policies adopted are consistent with those of the previous financial year, except for thefollowing amendments to IFRS effective for the Bank as of 1 January 2016 (for the avoidance of doubt,only the new standards, amendments to standards and IFRIC which may have an effect on the Bank’sannual accounts are mentioned below):
- IAS 1 Disclosure Initiative
The amendments to IAS 1 Presentation of Financial Statements clarify, rather than significantly change,the existing IAS 1 requirements. The amendments clarify:
- the materiality requirements in IAS 1;
- that specific line items in the statement(s) of profit or loss and OCI and the statement of financialposition may be disaggregated;
- that entities have flexibility as to the order in which they present the notes to financial statements;
- that the share of OCI of associates and joint ventures accounted for using the equity method mustbe presented in aggregate as a single line item, and classified between those items that will or willnot be subsequently reclassified to profit or loss;
- the requirements that apply when additional subtotals are presented in the statement of financialposition and the statement(s) of profit or loss and OCI.
These amendments are intended to assist entities in applying judgement when meeting the presentationand disclosure requirements in IFRS, and do not affect recognition and measurement. Although theseamendments clarify existing requirements of IAS 1, the clarifications may facilitate enhanced disclosureeffectiveness.
- IFRS 10, IFRS 12 and IAS 28
The first set of amendments address three issues that have arisen in applying the investment entitiesexception under IFRS 10 Consolidated Financial Statements.
The amendments to IFRS 10 clarify that the exemption in paragraph 4 of IFRS 10 from presentingconsolidated financial statements applies to a parent entity that is a subsidiary of an investment entity,when the investment entity measures its subsidiaries at fair value. This means that the fact thesubsidiary has not been consolidated into the parent investment entity does not prevent the subsidiarythat is also a parent from applying the consolidation exemption.
- 13 -
Furthermore, the amendments to IFRS 10 clarify that only a subsidiary of an investment entity that is notan investment entity itself and that provides support services to the investment entity is consolidated. Allother subsidiaries of an investment entity are measured at fair value.
The amendments to IAS 28 Investments in Associates and Joint Ventures allow the investor, whenapplying the equity method, to retain the fair value measurement applied by the investment entityassociate or joint venture to its interests in subsidiaries.
The amendments to IFRS 10 and IAS 28 provide helpful clarifications that will assist preparers inapplying the standards more consistently. However, it may still be difficult to identify investment entitiesin practice when they are part of a multi-layered group structure.
- IAS 27 - Equity Method in Separate Financial Statements
The amendments to IAS 27 Separate Financial Statements allow an entity to use the equity method asdescribed in IAS 28 to account for its investments in subsidiaries, joint ventures and associates in itsseparate financial statements. Therefore, an entity must account for these investments either:
- At cost;
- In accordance with IFRS 9 (or IAS 39), or
- Using the equity method.
The entity must apply the same accounting for each category of investment. A consequentialamendment was also made to IFRS 1 First-time Adoption of International Financial ReportingStandards. The amendment to IFRS 1 allows a first-time adopter accounting for investments in theseparate financial statements using the equity method, to apply the IFRS 1 exemption for past businesscombinations to the acquisition of the investment.
The amendments eliminate a GAAP difference for countries where regulations require entities topresent separate financial statements using the equity method to account for investments insubsidiaries, associates and joint ventures.
- IFRS 5 Non-current Assets Held for Sale and Discontinued Operations
Changes in methods of disposal
- Assets (or disposal groups) are generally disposed of either through sale or distribution to owners.The amendment clarifies that changing from one of these disposal methods to the other wouldnot be considered a new plan of disposal, rather it is a continuation of the original plan. There is,therefore, no interruption of the application of the requirements in IFRS 5.
- Equity Method in Separate Financial Statements – Amendments to IAS 27
The amendments allow entities to use the equity method to account for investments in subsidiaries,joint ventures and associates in their separate financial statements. Entities already applying IFRSand electing to change to the equity method in its separate financial statements will have to applythat change retrospectively. The amendments has not affected the Bank’s annual accounts.
KBL epb has also decided not to early adopt the standards, amendments to standards andinterpretations of the IFRIC which have been published but are not applicable for the year ending 31December 2016. KBL epb will adopt these standards on the date of their effective application and whenthey will be approved by the European Union.
- 14 -
- IFRS 15 – Revenue from Contracts with Customers
IFRS 15 was issued in May 2014 and subsequently amended in April 2016. The standard outlinesthe principles an entity must apply to measure and recognise revenue. The core principle is that anentity will recognise revenue at an amount that reflects the consideration to which the entity expectsto be entitled in exchange for transferring goods or services to a customer.
The standard requires entities to exercise judgement, taking into consideration all of the relevantfacts and circumstances when applying each step of the model to contracts with their customers.
The standard also specifies how to account for the incremental costs of obtaining a contract and thecosts directly related to fulfilling a contract.
In April 2016, the IASB issued amendments to IFRS 15 to address several implementation issuesdiscussed by the Joint Transition Resource Group for Revenue Recognition. The amendments:
- clarify when a promised good or service is distinct within the context of the contract;
- clarify how to apply the principal versus agent application guidance, including the unit ofaccount for the assessment, how to apply the control principle in service transactions andreframe the indicators;
- clarify when an entity’s activities significantly affect the intellectual property (IP) to which thecustomer has rights, which is a factor in determining whether the entity recognises revenuefor licenses over time or at a point in time;
- clarify the scope of the exception for sales-based and usage-based royalties related tolicenses of IP (the royalty constraint) when there are other promised goods or services in thecontract;
- add two practical expedients to the transition requirements of IFRS 15 for: (a) completedcontracts under the full retrospective transition approach; and (b) contract modifications attransition.
The amendments have an effective date of 1 January 2018, which is the effective date of IFRS 15.Entities are required to apply these amendments retrospectively. The amendments are intended toclarify the requirements in IFRS 15, not to change the standard.
- IAS 7 Disclosure Initiative – Amendments to IAS 7
The amendments to IAS 7 Statement of Cash Flows are part of the IASB’s Disclosure Initiative andhelp users of financial statements better understand changes in an entity’s debt.The amendments require entities to provide disclosures about changes in their liabilities arisingfrom financing activities, including both changes arising from cash flows and non-cash changes(such as foreign exchange gains or losses). On initial application of the amendment, entities arenot required to provide comparative information for preceding periods. This amendment is effectivefor annual periods beginning on or after1 January 2017.
- Annual Improvements to IFRS – 2012-2014 Cycle
The annual improvement process amends seven standards. However, no amendment is expected tosignificantly affect the Bank financial position and performance. Following is a summary of theamendments (other than those affecting only the standards’ Basis for Conclusions) from the 2012-2014 annual improvements cycle:
- IFRS 1 First-time Adoption of International Financial Reporting Standards- Deletion of short-termexemptions for first-time adopters
- Short-term exemptions in paragraphs E3–E7 of IFRS 1 were deleted because they have nowserved their intended purpose;
- 15 -
- The amendment is effective from 1 January 2018.
- IFRS 7 Financial Instruments: Disclosures
Servicing contracts
- The amendment clarifies that a servicing contract that includes a fee can constitute continuinginvolvement in a financial asset. An entity must assess the nature of the fee and the arrangementagainst the guidance for continuing involvement in IFRS 7.B30 and IFRS 7.42C in order toassess whether the disclosures are required. The assessment of which servicing contractsconstitute continuing involvement must be done retrospectively. This amendment has notaffected the Bank’s annual accounts.
Offsetting disclosures to condensed interim financial statements
- The amendment clarifies that the offsetting disclosure requirements do not apply to condensedinterim financial statements, unless such disclosures provide a significant update to theinformation reported in the most recent annual report. The amendments must be appliedretrospectively.
The amendment clarifies that market depth of high quality corporate bonds is assessed based onthe currency in which the obligation is denominated, rather than the country where the obligationis located. When there is no deep market for high quality corporate bonds in that currency,government bond rates must be used. The amendment must be applied prospectively. Thisamendment has not affected the Bank’s annual accounts.
- IAS 34 Interim Financial Reporting -Disclosure of information ‘elsewhere in the interim financial report
- The amendment clarifies that the required interim disclosures must be either in the interimfinancial statements or incorporated by cross-reference between the interim financial statementsand wherever they are included within the interim financial report (e.g., in the managementcommentary or risk report);
- The other information within the interim financial report must be available to users on the sameterms and at the same time as the interim financial statements.
The amendment must be applied retrospectively.
- IAS 28 Investments in Associates and Joint Ventures- Clarification that measuring investees at fairvalue through profit or loss is an investment-by investment choice
The amendments clarifies that:
- An entity that is a venture capital organisation, or other qualifying entity, may elect, at initialrecognition on an investment-by-investment basis, to measure its investments in associates andjoint ventures at fair value through profit or loss;
- If an entity that is not itself an investment entity has an interest in an associate or joint venturethat is an investment entity, the entity may, when applying the equity method, elect to retain thefair value measurement applied by that investment entity associate or joint venture to theinvestment entity associate’s or joint venture’s interests in subsidiaries. This election is madeseparately for each investment entity associate or joint venture, at the later of the date on which(a) the investment entity associate or joint venture is initially recognised; (b) the associate or jointventure becomes an investment entity; and (c) the investment entity associate or joint venturefirst becomes a parent.
- 16 -
The amendments should be applied retrospectively and are effective from 1 January 2018,with earlier application permitted. Early application is permitted and must be disclosed
- IFRS 12 Disclosure of Interests in Other Entities - Clarification of the scope of the disclosurerequirements in IFRS 12
- The amendments clarify that the disclosure requirements in IFRS 12, other than those inparagraphs B10–B16, apply to an entity’s interest in a subsidiary, a joint venture or an associate(or a portion of its interest in a joint venture or an associate) that is classified (or included in adisposal group that is classified) as held for sale.
- The amendments are effective from 1 January 2017 and must be applied retrospectively.
- IFRS 9 – Financial Instruments
The Group intends to use the exemptions from full retrospective application for the classification andmeasurement requirements of the new standards, including impairments, and elects to not restatecomparative information.
Also as an accounting policy choice, the Group has elected under IFRS 9 to continue to apply the hedgeaccounting requirements as defined per IAS 39.
APPROACH FOR CLASSIFICATION OF FINANCIAL ASSETS - BUSINESS MODEL
For debt instruments currently classified as Available For Sale (AFS), the assessment of business modelis performed at portfolios level because this best reflects the way the business is managed andinformation provided to the management. Some changes in portfolios are scheduled to occur in the firstquarter of 2017, therefore, the assessment of business models will be based on these new portfolios.This assessment will take into consideration various information for each portfolio such as: the statedobjectives and policies for the portfolio, the expectations about future sales activity, the basis formanagement decision making, the risk parameters under which the portfolios are managed to meet theirobjectives, the performance evaluation and reporting to the Group management.
While the Group has to undertake the detailed assessment of the debt instruments currently classifiedas AFS financial assets, it appears that some of these instruments will meet the conditions for amortizedcost as they are:
- held within a business model whose objective is to hold financial assets in order to collect contractualcash flows and
- the contractual terms of the financial asset give rise on specified dates to cash flows that are SPPIon the principal amounts outstanding.
The quantitative impact of such a reclassification is under assessment throughout the Group.
Loans and advances, which are mainly composed of loans to private client, reverse repos, advancesare held under a Business model to collect contractual cash flows and therefore should remain asamortized costs unless not meeting SPPI criteria.
The Group may make the following irrevocable election/designation at initial recognition of a financialasset:
- the Group may irrevocably elect to present subsequent changes in fair value of an equity investmentin other comprehensive income if criteria are met on an instrument by instrument basis;
- 17 -
- the Group may designate irrevocably a debt investment that meets the amortized cost or fair valuethrough other comprehensive income (FVOCI) criteria as measured at fair value through profit andloss (FVPL) if doing so eliminates significantly or reduces an accounting mismatch.
There is no impact expected for financial liabilities as the new requirements only affect the accountingfor financial liabilities that are designated at FVPL and the group does not have any such liabilities atthe moment.
IMPAIRMENT
Implementation & Group deployment
The IFRS 9 project is piloted by a central project management team supported by local teams. Updatedpolicies, processes and methodologies are devised at Group level and their implementation is deployedcentrally. Dedicated Steering and Implementation Committees have been set up to ensure a successfulimplementation.
Further to the implementation, the processes of measurement of Expected Credit Losses (ECL)calculation and processes relating to models management will be performed centrally after the transitiondate, using data communicated by each Group entity.
Scope
The Group will recognize loss allowances for the ECL on the financial assets that are not measured atFVPL. The principal contributors to the Group aggregate ECL provisions comprise:
- positions in ALM debt instruments;
- loans to private clients (mortgage, Lombard and mixed) and
- loan commitments and financial guarantee contracts issued.
Definition of credit risk and how the credit risk is mitigated by the Group
Credit risk designates the risk of financial losses ensuing from the failure of a counterparty to dischargean obligation, due to the deterioration of its credit quality or its default. The assessment, monitoring, andmitigation of such a risk is performed by applying Group Policies and procedures as described in Note39. These provide the framework for managing credit risk in order to comply with the Group’s RiskAppetite Statement and are to be applied to each entity within the Group as the minimum standard tobe complied with.
In line with its risk appetite statement, the Group only engages in contractual relationships withcounterparties showing evidence of good creditworthiness (e.g., investment-grade debt securities).Loans to private clients are granted as part of the private banking relationship. The Group Credit policyis to take collateral in form of mortgage or securities in order to provide additional security, withprocedures relating to acceptance and value monitoring of such collateral.
The Group Credit Risk Control team is currently updating the policies and procedures in order to alignthem with the new normative requirements brought by IFRS 9).
- 18 -
Approaches for Credit risk assessment under IFRS 9
IFRS 9 introduces new requirements for the monitoring and follow-up of credit risk with a new three-stage approach that qualifies the evolution of the level of credit risk associated with an exposure, relativeto that at the origination of the exposure. The existing credit risk assessment procedures are currentlybeing updated to comply with the norm requirements (definition of staging criteria, incorporation offorward-looking information).
A blend of quantitative and qualitative elements and factors will underlie the Group credit riskassessment approach, with the definition of primary and secondary drivers to stage transitions, as wellas backstop criteria, depending on the type of products, characteristics of the financial instruments andof the borrower.
For debt securities, we expect to use the low credit risk exemption for investment-grade investments,supplemented by the monitoring of dedicated variables (corporate action, days past due, marketvariables, etc.) as backstop. For other debt securities positions, the evolution of credit risk will beperformed through a comparison of the term structure of default at the purchase and the reporting dates.
For loans granted to private clients, an extensive recourse to expert judgement will be made to assesscredit risk. These experts will analyze the clients’ credit worthiness, on the basis of several quantitativeand qualitative factors (e.g., days past due, counterparty net wealth, behavioral change, collateralparameters, etc.).
Incorporation of forward-looking information in the credit risk assessment will be based on forecasts bya dedicated committee of economists and market analysts, where relevant. This committee will issueseveral market scenarios and their likelihood of occurrence, to capture the inherent nonlinearities onmarket evolutions.
Due to the nature of the activity of private banking, the forward-looking information components will beincluded in the credit risk assessment on a case-by-case basis, blended with expert judgement, and willbe reflected in the expectations of collateral valuation for the computation of the ECL.
The Group considers using the low credit risk expedient for a number of exposures, from the date oftransition and onwards.
Expected credit loss
The expected credit loss (ECL) is the estimate average credit losses that can be incurred as a result ofpossible defaults of a counterparty. It is given by the present value of the net cash flow shortfall for sucha credit event. Computation of ECL and processes relating to models management will be performedcentrally by Group Risk Control, with support of information provided by each entity.
Three main factors that will drive the ECL measurement will be:
(i) the probability of default(ii) the exposure at default and(iii) the loss given the occurrence of a default.
The models for debt securities and loans will use 3 scenarios (a base scenario, a pessimistic and anoptimistic one) to incorporate forward-looking information as assessed by a dedicated committee ofexperts at the Group level. Exposures will be handled on an individual basis with model parametersadapted to the segment level, where segments should be understood as subsets of portfolios sharinghomogenous risk characteristics.
- 19 -
The methodologies will rely on the postulate of default occurrences along the remaining lifetime of theexposures, on the basis of which, cash flow shortfalls will be estimated and weighted by the defaultprobability conditional on survival up to the occurrence of default. For debt securities, point-in-time termstructures of default probability will be used, with a curve per rating and issuer sector pair, combined toa flat recovery rate. For loans, ECL estimations will be based on historical term structures of defaultprobabilities whereas estimates of the loss given default will rely on forward-looking valuation scenariosof the loan collaterals.
Expected impacts
With the most notable exception of its ALM portfolios, which are mainly comprised of unsecured bonds,the Group limits its exposure to credit risk by engaging into secured relationships with its counterparties.The main contributions to the Group overall ECL balance are therefore expected to be related to theALM portfolios and the loanbook portfolios, according to forecast collateral valuations scenarios.
- 20 -
Note 2c – Significant accounting policies
a. Consolidation criteria
All entities controlled – either exclusively orjointly – by KBL epb, or over which KBL epb hasa significant influence are included in the scopeof consolidation.
KBL epb controls an entity when KBL epb isexposed, or has rights, to variable returns fromits involvement with the entity and has ability toaffect those returns through its power over theentity. KBL epb has power over an entity whenit has existing rights that give it the current abilityto direct relevant activities of the entity, i.e.those activities that significantly affect theentity’s returns.Joint control is the contractually agreed sharingof control of an arrangement, which exists onlywhen decisions about the relevant activitiesrequire the unanimous consent of the partiessharing control. A joint arrangement is either ajoint operation (i.e. a joint arrangement wherebythe parties that have joint control have rights tothe assets and obligations for liabilities, relatingto the arrangement) or a joint venture (i.e. a jointarrangement whereby the parties sharing jointcontrol have rights to the net assets of thearrangement).Significant influence is the power to participatein the financial and operating policy decisions ofan investee without being exclusive control orjoint control.
Entities exclusively controlled by KBL epb,either directly or indirectly, are consolidatedusing the full consolidation method.For a joint operation, KBL epb recognizes itsshare of assets, liabilities, income and expenseaccording to the terms of the joint arrangement.Joint ventures and investments in associates(that is, where KBL epb has significantinfluence) are accounted for using the equitymethod.
An entity is included in the scope ofconsolidation from the date of acquisition, beingthe date on which KBL epb obtains control orsignificant influence over that entity andcontinues to be included until this control orinfluence ceases.
The scope of consolidation however excludesthose investments which are controlled by KBLepb or over which KBL epb has significantinfluence, but which are regarded asinsignificant, i.e. for which the materialitythresholds are not exceeded. Those thresholdsrelate to the following criteria: share in theGroup equity, share in the Group profit and inthe Group total balance sheet (increased by theoff-balance sheet rights and commitmentsaddressed in the computation of solvencyratios).
Finally, an internal Group policy has been set upto address the issue of interests in collectiveinvestment funds and more specifically in thosefunds which have a legal personality (e.g. aSICAV in Luxembourg) and for which powerover the relevant activities (i.e. usually theselection and the management of theinvestments) is in fine in the hands of theshareholders (which have the power to appointand revoke the Board of Directors which in turncan appoint and revoke the InvestmentManager).In order to address the specificities of theshareholding (usually highly fragmented) of thistype of vehicles, the Group Management hasdefined the following thresholds to beconsidered when analysing whether the Grouphas power over the fund:
- power is assumed to be held if theGroup holds (directly and indirectlythrough its subsidiaries) the majority ofthe voting rights ;
- power is assumed not to be held if theGroup holds (directly and indirectlythrough its subsidiaries) less than 20%of the voting rights.
Should the Group hold a stake between 20%and the majority of the voting rights, other factsand circumstances have to be considered. Thisapproach merely acknowledges that for thistype of vehicles exhibiting largely scatteredshareholding, ‘de facto’ control may beestablished even with a relatively lowownership.
- 21 -
b. Foreign currency translation
KBL epb’s consolidated accounts are presentedin EUR, which is also the functional currency ofthe Group.
KBL epb maintains a multi-currency accountingsystem under which any transaction isregistered in its original foreign currency.
In preparing the annual accounts of all theconsolidated entities which present theiraccounts in EUR, assets and liabilities in foreigncurrencies are translated into EUR according tothe following principles:
· monetary items denominated in foreigncurrencies are converted at the closing rateprevailing at the reporting date; differencesarising from such conversion are recordedin the income statement;
· non-monetary items in foreign currenciesmeasured in terms of historical cost aretranslated using the historical exchangerate prevailing at the date of the transaction;
· non-monetary items denominated in foreigncurrencies measured at fair value aretranslated using the spot exchange rate atthe date when the fair value is determinedand translation differences are reportedtogether with changes in fair value.
Income and expense items denominated inforeign currencies are recognised in the incomestatement using exchange rates thatapproximate the rates at the dates of thetransactions (e.g. average monthly exchangerates).
Foreign subsidiaries balance sheetsdenominated in foreign currencies aretranslated into EUR using the closing rateprevailing at the reporting date (with theexception of the capital, reserves and goodwill,which are translated using historical rates).
Foreign subsidiaries income statementsdenominated in foreign currencies aretranslated at the average exchange rate for thefinancial year.These principles are applicable to the KBL epbsubsidiaries in the United Kingdom and in
Switzerland (till the sale of the entity in lastquarter 2015, see Note 1).
Annual average exchange rates in 20161 EUR = ... CUR Variation versus
average 2015GBP 0.817753 +12.63%
Exchange rate as at 31/12/20161 EUR = ... CUR Variation versus
31/12/2015GBP 0.853567 +16.30%
Exchange differences resulting from theprocedures applied to translate balance sheetsand income statements of foreign subsidiariesdenominated in foreign currencies into EUR arerecognised as a separate item in equity.
c. Financial assets and liabilities
General principles of recognition andderecognition of financial instruments
A financial instrument is recognised in thebalance sheet when and only when the Groupbecomes a party to the contractual provisions ofthe instrument.
A financial asset is derecognised when and onlywhen the contractual rights to receive cashflows from the asset have expired or the Grouptransfers the financial asset.
A financial liability is derecognised when andonly when the contractual liability is settled,cancelled or expires.
Regular way purchases and sales of financialassets are recognised on the payment date,which is the date on which the asset isdelivered. Any variation in the fair value of theasset to be received during the period from thetransaction date to the payment date isrecognised in the same way as for the assetacquired. In other words, the change in value isnot recognised for assets recognised at cost orat amortised cost; it is recognised in the incomestatement for assets classified as financialassets at fair value through profit or loss and inequity for those classified as available-for-sale.
- 22 -
In the case of sales, the assets at fair value aremeasured at their sale price during the periodbetween the transaction date and the paymentdate.
Pursuant to the provisions of IAS 39 onderecognition, the Group keeps securities lentin its securities portfolio but securities borrowedare not recorded on the balance sheet.
Similarly, the securities transferred throughrepurchase agreements are kept in thesecurities portfolio but those under reverserepurchase agreements are not recorded on thebalance sheet.
Definition of IAS 39 categories of financialassets and financial liabilities
All financial assets and liabilities – includingderivatives – must be measured on the balancesheet according to their IAS 39 category. Eachcategory is subject to specific measurementrules.
The IAS 39 categories are the following:
§ Held-to-maturity assets are all non-derivative financial assets with fixedmaturities and fixed or determinablepayments that KBL epb group intends andis able to hold to maturity. The Group’smanagement has decided not to classfinancial instruments in this category.
§ Loans and receivables are all non-derivative financial assets with fixed ordeterminable payments that are not quotedin an active market.
§ Financial assets at fair value through profitor loss include held-for-trading assets andany other financial assets initiallydesignated at fair value through profit orloss. Held-for-trading assets are thoseacquired principally for the purpose ofselling them in the near term and thosewhich are part of a portfolio with indicationsof recent short-term profit-taking. Allderivative assets are considered as beingheld for trading unless designated aseffective hedging instruments. Other assetsinitially designated at fair value through
profit or loss (frequently referred to as ‘thefair value option’) are valued in the sameway as held-for-trading assets, even if thereis no intention of short-term profit taking.The ‘fair value option’ may be used when acontract contains one or more embeddedderivatives under certain conditions orwhen its application produces morepertinent information:- either because a group of financial
assets/liabilities is managed on a fairvalue basis and its performancemeasured on a fair value basis,following a documented investment orrisk management strategy;
- or because the application of this optionreduces a measurement or recognitioninconsistency that would otherwisearise from measuring assets orliabilities or recognising the gains andlosses on them on different bases.
This option is mainly used by the Group forcontracts with one or more embeddedderivatives, as an alternative to hedgeaccounting (aligning the valuation of thehedged instrument with that of the hedginginstrument) and, for insurance subsidiaries,to mirror the valuation of unit-linkedfinancial liabilities.
§ Available-for-sale financial assets are allnon-derivative financial assets which do notfall into one of the above categories.
§ Financial liabilities at fair value throughprofit or loss encompass held-for-tradingliabilities and financial liabilities initiallydesignated at fair value through profit orloss.
§ Held-for-trading liabilities are liabilities heldmainly with the intention of repurchasingthem in the near term. All derivativeliabilities are considered as being held fortrading unless designated as effectivehedging instruments.Financial liabilities initially designated at fairvalue through profit or loss are thoseliabilities accounted for under the ‘fair valueoption’. This category is currently only usedfor unit-linked financial liabilities ofinsurance subsidiaries.
- 23 -
§ Other financial liabilities are all otherfinancial instruments not at fair valuethrough profit or loss.
§ Hedging derivatives are the derivativesdesignated in hedging relationships forwhich hedge accounting is applied.
Evaluation of financial instruments
Financial assets and liabilities are initiallyrecognised at fair value and are then measuredin accordance with the principles governing theIAS 39 category in which they are placed.
o General principles
Loans and receivables with a fixed maturity aremeasured at amortised cost using the effectiveinterest rate (hereinafter “EIR”) method, that isthe rate that precisely discounts the future cashinflows or outflows to obtain the carryingamount. Instruments without a fixed maturityare measured at cost.
The available-for-sale financial assets aremeasured at fair value with changes in fair valuerecognised in equity (‘Revaluation reserve(available-for-sale financial instruments)’) untilthe sale or impairment of these instruments. Inthe latter cases, the cumulative result of therevaluation is transferred from equity to theincome statement of the period.
The financial assets and liabilities at fair valuethrough profit or loss are measured at fair valuewith changes in fair value recognised in theincome statement.
Other financial liabilities are measured atamortised cost. The difference between theamount made available and the nominalamount is recognised in the income statement(net interest income) prorata temporis, on anactuarial basis using the EIR method.
o Determination of fair value
IFRS 13 defines fair value as the price thatwould be received to sell an asset or paid totransfer a liability in an orderly transactionbetween market participant at the measurementdate (i.e. an exit price).
When available, published price quotations(unadjusted) on active markets are used todetermine the fair value of financial assets orliabilities.
If such quotations are not available fair valuecan be determined or derived:§ from quoted prices for similar assets or
liabilities in active markets and/or fromquoted prices for identical assets or liabilitiesin markets that are not active.
§ by using a valuation technique.
When valuation techniques are used toestimate fair value, those techniquesincorporate all factors that market participantswould consider in setting a price and areconsistent with accepted financialmethodologies used for pricing financialinstruments.Such techniques encompass discounted cashflow analysis (e.g. for the valuation of interestrate swaps or forward foreign exchangetransactions) and option pricing models.Inputs used in those models (yield curves,exchange rates, volatilities…) are often readilyobservable on the markets. When measuringfair value, the Group maximises the use ofrelevant observable inputs and minimises theuse of unobservable inputs.
o Impairment
Available-for-sale financial assets and loansand receivables are also subject to impairmenttests and impairment losses are recognised ifevidence of impairment exists on the balancesheet date.
§ Available-for-sale financial assetsFor listed shares, an impairment is recognisedif the market value is less than 70% of thepurchase value or if the market price of theshare is less than the acquisition price over oneyear.For debt and other equity instruments, theimpairment amount is measured from therecoverable value.
Impairment losses are always recognised in theincome statement. Impairment reversals arerecognised in the income statement for debtinstruments and in other comprehensive
- 24 -
income (available-for-sale revaluation reserve)for listed shares and other equity instruments.
§ Loans and receivablesThe amount of the impairment loss is the excessof the carrying amount over the recoverableamount of the asset. The Group firstly evaluatesif there is an impairment loss for eachindividually significant loan or receivable or foreach group of loans or receivables notindividually significant. If the Group considersthat there is no evidence of an impairment lossfor a given loan or receivable, individuallysignificant or not, it includes it in a group offinancial assets presenting the same credit riskcharacteristics and examines the possibility ofan impairment loss on a collective basis. Theassets evaluated individually and for which animpairment loss is recognised are not examinedcollectively.
o Embedded derivatives
Derivatives embedded in financial instrumentsthat are not measured at fair value through profitor loss are separated from the financialinstrument and measured at fair value throughprofit or loss if the economic characteristics andrisks of the embedded derivative are not closelyrelated to the economic characteristics andrisks of the host contract.
In practice, financial assets with embeddedderivatives are however primarily classified asfinancial instruments at fair value through profitor loss, making it unnecessary to separate theembedded derivative from the hybrid(combined) instrument, since the entire financialinstrument is measured at fair value, withchanges in fair value being recognised in theincome statement.
o Hedge accounting
The Group makes little use of macro-hedgeaccounting. It is used to hedge a mortgageportfolio in one of the Group’s subsidiary.It does however apply micro-hedge accountingwhen all the following conditions are met: thehedging relationship must be designated atinception and formally documented, the hedgeis expected to be highly effective and it must bepossible to reliably measure the effectiveness of
the hedge, forecast transactions (for cash flowhedges) must be highly probable and the hedgeis measured on an ongoing basis and isdetermined actually to have been highlyeffective throughout the periods covered by theconsolidated accounts for which the hedge wasdesignated.
Fair value hedge accounting is used by theGroup to cover the exposure of a financialinstrument (e.g. loans, available-for-sale bondsand some issued debt securities) to changes infair value attributable to changes in interestrates or exchange rates. In this case thosederivatives designated as hedging instruments(mainly interest rate swaps and cross-currencyinterest rate swaps) are measured at fair valuewith changes in fair value recognised in theincome statement. Furthermore, the gain or losson the hedged item attributable to the hedgedrisk adjusts the carrying amount of the hedgedelement and is also recognised in the incomestatement. If the hedged item is an available-for-sale asset already measured at fair valueunder other IFRS requirements, applying hedgeaccounting leads to splitting the change in theinstrument fair value between the portionaddressed by the hedging relationship,recognised in the income statement, and theportion that relates to unhedged risks,recognised in the revaluation reserve in equity.
Hedge accounting is discontinued once thehedge accounting requirements are no longermet or if the hedging instrument expires or issold. In this case, and for debt instruments, thecumulative change to the carrying amount of thehedged instrument (relating to hedged risks) istransferred to the income statement proratatemporis until the instrument expires.
Cash flow hedge accounting is used by theGroup to recognise hedges of the exposure tovariability in cash flows of highly probableforecast transactions. In this case:§ highly probable forecast transactions are
anticipated sales of financial instrumentsrecognised within assets (hedges may relateboth to debt and equity instruments);
§ hedging instruments are forward sales;§ main hedged risk is interest rate risk.As at 31/12/2016 there are no hedgingoperations designated as cash flow hedge.
- 25 -
Hedging instruments are measured at fair valuewith changes in fair value recognized as follows:the portion of the gain or loss that is determinedto be an effective hedge is recognised in othercomprehensive income; the ineffective portionis recognised in the income statement.Hedge accounting is to be discontinued if thehedge accounting criteria are no longer met. Inthis case, the hedging instruments is to betreated as held-for-trading instruments andmeasured accordingly.
Foreign currency funding of a net investment ina foreign entity is accounted for as a hedge ofthat net investment. Translation differences(taking into account deferred taxes) on thefinancing are recorded in equity, along withtranslation differences on the net investment.
d. Goodwill, badwill and other intangibleassets
Goodwill arising in a business combination isdefined as any excess of the cost of thebusiness combination over the acquirer’sinterest in the net fair value of the identifiableassets and liabilities acquired and contingentliabilities recorded at the date of acquisition.
Goodwill arising in a business combination isnot amortised but is tested for impairment atleast on an annual basis.
An impairment loss is recognised if the carryingamount of the goodwill exceeds its recoverableamount. The recoverable amount may beestimated using various methods such as aDividend Discount Model, percentage of assetsunder management or a price/earnings ratiomultiple. Impairment losses on goodwill cannotbe reversed.Badwill (negative goodwill) is the excess of KBLepb’s interests in the net fair value of theidentifiable assets, liabilities and contingentliabilities of a subsidiary, joint venture orassociate at the date of acquisition over theacquisition cost. Where negative goodwill existsafter re-examination and re-estimation of thefair value of the identifiable assets, liabilities andcontingent liabilities of a subsidiary, jointventure or associate, it is immediatelyrecognised as a profit in the income statement.
The purchase of a portfolio of customersgenerally includes the transfer of the clientassets under management to the Group and therecruitment of all or part of the account officersin charge of client relationships.This type of intangible assets is amortized on astraight-line basis over its estimated useful life,typically 15 years.
When the recognition criteria are met and whenthe amounts are not immaterial, software isrecognised as an intangible asset.
Internal and external expenses incurred duringthe development phase of internally generatedstrategic software are initially recognised inassets at cost. These assets are subsequentlycarried at cost less any accumulatedamortisation and any accumulated impairmentlosses.Amortisation is calculated using the straight-linemethod over the estimated useful life.Research expenses for these projects and allexpenses that relate to non-strategic projectsare recognised directly in the income statement.
e. Property and equipment
Property and equipment are initially recognisedat cost.
Property and equipment the use of which islimited in time are depreciated using thestraight-line method over their estimated usefullives.
- 26 -
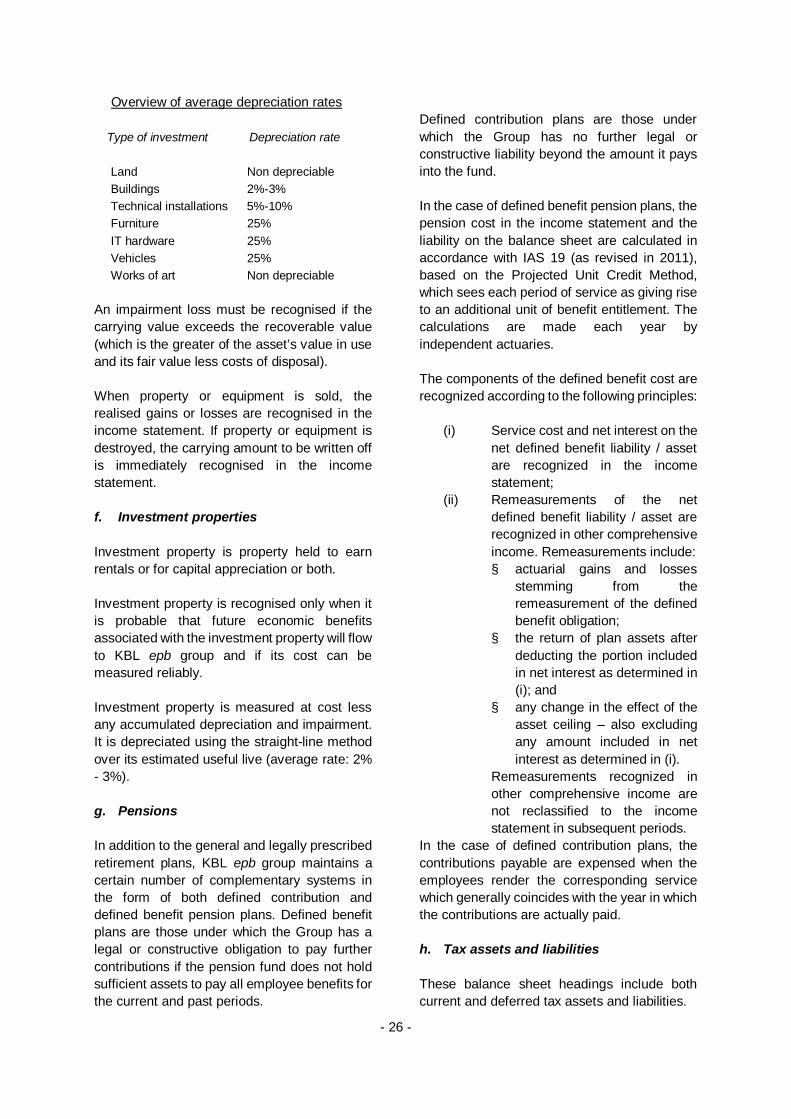
Overview of average depreciation rates
Type of investment Depreciation rate
Land Non depreciableBuildings 2%-3%Technical installations 5%-10%Furniture 25%IT hardware 25%Vehicles 25%Works of art Non depreciable
An impairment loss must be recognised if thecarrying value exceeds the recoverable value(which is the greater of the asset’s value in useand its fair value less costs of disposal).
When property or equipment is sold, therealised gains or losses are recognised in theincome statement. If property or equipment isdestroyed, the carrying amount to be written offis immediately recognised in the incomestatement.
f. Investment properties
Investment property is property held to earnrentals or for capital appreciation or both.
Investment property is recognised only when itis probable that future economic benefitsassociated with the investment property will flowto KBL epb group and if its cost can bemeasured reliably.
Investment property is measured at cost lessany accumulated depreciation and impairment.It is depreciated using the straight-line methodover its estimated useful live (average rate: 2%- 3%).
g. Pensions
In addition to the general and legally prescribedretirement plans, KBL epb group maintains acertain number of complementary systems inthe form of both defined contribution anddefined benefit pension plans. Defined benefitplans are those under which the Group has alegal or constructive obligation to pay furthercontributions if the pension fund does not holdsufficient assets to pay all employee benefits forthe current and past periods.
Defined contribution plans are those underwhich the Group has no further legal orconstructive liability beyond the amount it paysinto the fund.
In the case of defined benefit pension plans, thepension cost in the income statement and theliability on the balance sheet are calculated inaccordance with IAS 19 (as revised in 2011),based on the Projected Unit Credit Method,which sees each period of service as giving riseto an additional unit of benefit entitlement. Thecalculations are made each year byindependent actuaries.
The components of the defined benefit cost arerecognized according to the following principles:
(i) Service cost and net interest on thenet defined benefit liability / assetare recognized in the incomestatement;
(ii) Remeasurements of the netdefined benefit liability / asset arerecognized in other comprehensiveincome. Remeasurements include:§ actuarial gains and losses
stemming from theremeasurement of the definedbenefit obligation;
§ the return of plan assets afterdeducting the portion includedin net interest as determined in(i); and
§ any change in the effect of theasset ceiling – also excludingany amount included in netinterest as determined in (i).
Remeasurements recognized inother comprehensive income arenot reclassified to the incomestatement in subsequent periods.
In the case of defined contribution plans, thecontributions payable are expensed when theemployees render the corresponding servicewhich generally coincides with the year in whichthe contributions are actually paid.
h. Tax assets and liabilities
These balance sheet headings include bothcurrent and deferred tax assets and liabilities.
- 27 -
Current tax is the amount expected to be paidor recovered, using the tax rates which havebeen enacted or substantively enacted at thebalance sheet date.
Deferred tax liabilities are recognised for alltaxable temporary differences between thecarrying amount of an asset or liability and itstax base. They are valued using the tax rates ineffect for the periods when the assets arerealised or the liabilities settled, on the basis ofthe tax rates enacted or substantively enactedat the balance sheet date.
Deferred tax assets are recognised for thecarryforward of all unused tax losses andunused tax credits and for all deductibletemporary differences between the carryingvalue of the assets and liabilities and their taxbase, to the extent that it is probable that futuretaxable profit will be available against whichthese losses, tax credits and deductibletemporary differences can be utilised.
Where required by IAS 12, tax assets andliabilities are offset.
i. Provisions
A provision is recognised when and only whenthe following three conditions are met:§ the Group has a present obligation (at the
reporting date) as a result of a past event;§ it is more likely than not that an outflow of
resources embodying economic benefitswill be required to settle this obligation; and
§ the amount of the obligation can beestimated reliably.
j. Financial guarantees
Financial guarantees contracts are initiallyrecognised at fair value and subsequentlymeasured at the higher of (i) the amount initiallyrecognised less, when appropriate, cumulativeamortisation and (ii) the Group’s best estimateof the expenditure required to settle the presentobligation at the reporting date.
k. Equity
Equity is the residual interest in the assets of theKBL epb group after all its liabilities have beendeducted.
Equity instruments have been differentiatedfrom financial instruments in accordance withthe provisions of IAS 32.
The acquisition cost of KBL epb treasury sharesthat have been or are being purchased isdeducted from equity. Gains and lossesrealised on sale or cancellation of treasuryshares are recognised directly in equity.
The revaluation reserve for available-for-salefinancial assets is included in equity until anyimpairment or sale. In such a case, the gainsand losses are transferred to the incomestatement of the period.
The “defined benefit remeasurement reserve”relating to the recognition of certain pensioncosts is also included in equity. This reserve willhowever never be subsequently recycled intothe income statement.
As regards to cash flow hedges and hedges ofa net investment in a foreign operation, theportion of the gain or loss on the hedginginstrument that is determined to be an effectivehedge is recognised directly in equity.
- 28 -
l. Revenue
KBL epb group recognises revenue relating toordinary activities if and only if the followingconditions are met:§ it is probable that the economic benefits
associated with the transaction will flow tothe KBL epb group, and
§ the amount of revenue can be measuredreliably.
The specific conditions below must also be metbefore recognising the related revenue:
Net interest income
Interest is recognised prorata temporis usingthe effective interest rate, which is the rate thatexactly discounts the estimated future cashpayments or receipts through the expected lifeof the financial instrument or, when appropriate,a shorter period, to the net carrying amount ofthe financial asset or liability.
All interests paid and received on financialinstruments, including held-for-tradingderivatives, are recorded under the heading“Net interest income” except interest on held-for-trading derivative instruments, which arepresented under the heading “Net gains/losseson financial instruments measured at fair valuethrough profit or loss” in the income statement.
Dividends
Dividends are recognised when the right of theshareholder to receive the payment isestablished. They are presented under theheading “Dividend income” in the incomestatement irrespective of the IFRS category ofthe related assets.
Rendering of services
Revenue from services is recognised byreference to the stage of completion at thebalance sheet date. According to this method,the revenue is recognised in the periods whenthe services are provided.
Gross premiums, insurance
For single premium business, revenue isrecognised on the date on which the policy iseffective.
m. Reclassifications of prior year figures
Where necessary, certain prior year figures inthe Notes to the consolidated accounts havebeen reclassified to conform with changes tothe current year’s presentation for comparativepurposes.
- 29 -
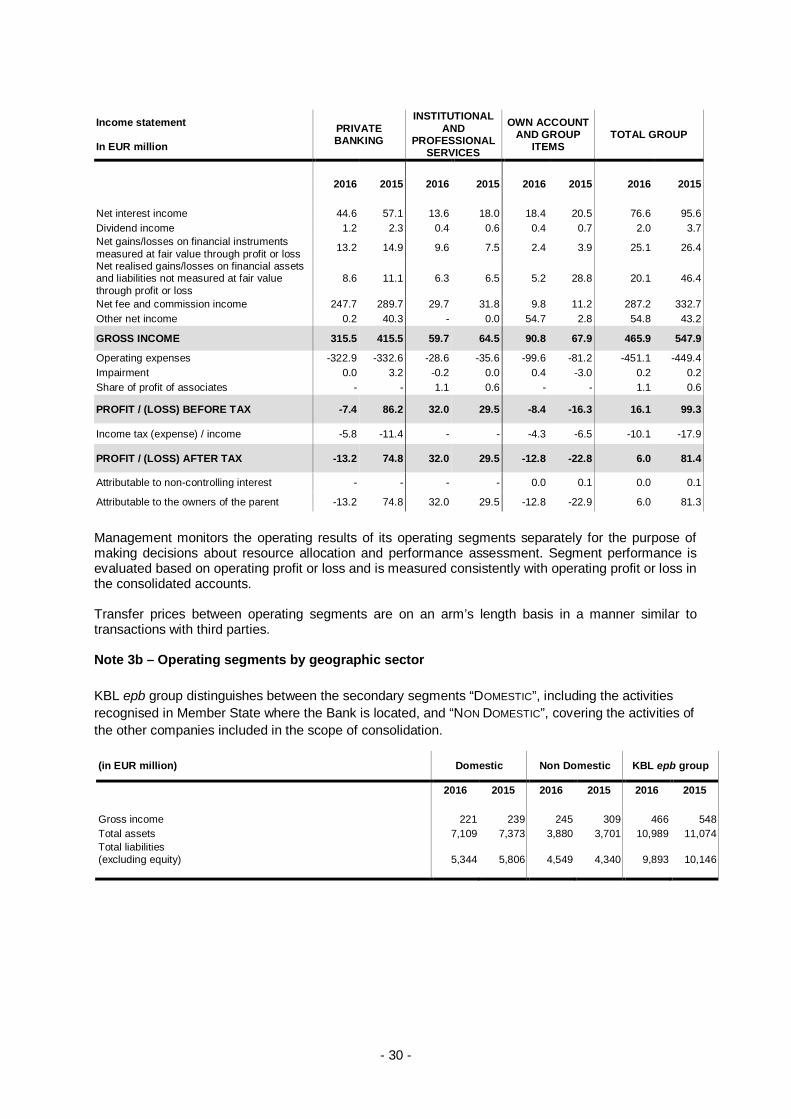
Note 3a – Segment reporting by business segment
KBL epb group distinguishes between the following primary segments:
The ‘PRIVATE BANKING’ segment includes the wealth management activities provided to private clientsby KBL epb group, as well as the management of investment funds, mainly distributed to private clients.This segment includes all major subsidiaries of KBL epb group (KBL Monaco Private Bankers, KBLRichelieu Banque Privée S.A., Puilaetco Dewaay Private Bankers S.A., Theodoor Gilissen BankiersN.V., Brown Shipley & Co Limited, Merck Finck & Co and KBL Switzerland Ltd (sold in October 2015)and the private banking activities of KBL epb (incl. branch in Spain) and Kredietrust Luxembourg S.A..Vitis Life SA Insurance (sold in October 2015) is also part of this segment.
The ‘INSTITUTIONAL AND PROFESSIONAL SERVICES’ segment includes services provided to institutionalclients. This segment includes custodian bank and fund domiciliation and administration activities,paying agent activities, central securities depository Clearstream / Euroclear, as well as intermediationand portfolio management services for KBL epb institutional clients.
The ‘OWN ACCOUNT & GROUP ITEMS ACTIVITIES’ segment includes support activity provided by KBL epbto the network of subsidiaries, acting in its capacity as parent company, and all other elements notdirectly linked to the previous three segments, including reallocation of excess equity, net of the cost offinancing of the holdings, and extraordinary elements not directly linked to other business segments.“Own Account” includes activities such as bullions, bond and structured products own account, ALMfree capital portfolio revenues, etc. (not directly private client-related).
The various profit or loss items include inter-segment transfers, calculated on an arm’s length or costrecovery basis.
The net result of each subsidiary included in the scope of consolidation is allocated to the various sectorsafter taking into account consolidation restatements, after removing non-controlling interests and beforeremoving intercompanies operations.
- 30 -
Income statement
In EUR millionPRIVATEBANKING
INSTITUTIONALAND
PROFESSIONALSERVICES
OWN ACCOUNTAND GROUP
ITEMSTOTAL GROUP
2016 2015 2016 2015 2016 2015 2016 2015
Net interest income 44.6 57.1 13.6 18.0 18.4 20.5 76.6 95.6Dividend income 1.2 2.3 0.4 0.6 0.4 0.7 2.0 3.7Net gains/losses on financial instrumentsmeasured at fair value through profit or loss 13.2 14.9 9.6 7.5 2.4 3.9 25.1 26.4
Net realised gains/losses on financial assetsand liabilities not measured at fair valuethrough profit or loss
8.6 11.1 6.3 6.5 5.2 28.8 20.1 46.4
Net fee and commission income 247.7 289.7 29.7 31.8 9.8 11.2 287.2 332.7Other net income 0.2 40.3 - 0.0 54.7 2.8 54.8 43.2
GROSS INCOME 315.5 415.5 59.7 64.5 90.8 67.9 465.9 547.9
Attributable to the owners of the parent -13.2 74.8 32.0 29.5 -12.8 -22.9 6.0 81.3
Management monitors the operating results of its operating segments separately for the purpose ofmaking decisions about resource allocation and performance assessment. Segment performance isevaluated based on operating profit or loss and is measured consistently with operating profit or loss inthe consolidated accounts.
Transfer prices between operating segments are on an arm’s length basis in a manner similar totransactions with third parties.
Note 3b – Operating segments by geographic sector
KBL epb group distinguishes between the secondary segments “DOMESTIC”, including the activitiesrecognised in Member State where the Bank is located, and “NON DOMESTIC”, covering the activities ofthe other companies included in the scope of consolidation.
(in EUR million) Domestic Non Domestic KBL epb group
Interest income 285,425 311,619Available-for-sale financial assets 75,750 90,640Loans and receivables 38,753 46,841Interest income on liabilities at amortised cost (1) 4,583 -Other 5 2Sub-total of interest income from financial assets not measured at fair valuethrough profit or loss 119,091 137,483
Interest expense -208,811 -216,028Financial liabilities at amortised cost -10,645 -26,363Interest expense on assets at amortised cost (1) -6,622 -Other -23 -30
Sub-total of interest expense on financial liabilities not measured at fair valuethrough profit or loss -17,290 -26,393
Financial liabilities held-for-trading -132,283 -130,825Net interest on hedging derivatives -58,882 -58,810Interest expense on assets measured at fair value through profit or loss (1) -355 -
Total 76,614 95,591(1) Negative interests disclosed in “Interest income on liabilities” and “Interest expense on assets” are applicable as from
31/12/2016.
- 32 -
Note 5 – Dividend income
(in EUR thousand) 31/12/2016 31/12/2015
Available-for-sale equity instruments 1,997 3,237Equity instruments held-for-trading 44 445Equity instruments at fair value through profit or loss 2 1
Total 2,043 3,683
Note 6 – Net gains/losses on financial instruments measured at fair value through profit or loss
(in EUR thousand) 31/12/2016 31/12/2015
Held-for-trading 11,831 13,662Other financial instruments at fair value 1,640 996Exchange differences 10,572 12,021Fair value adjustments in hedge accounting 1,092 -312
Micro-hedging 1,190 -300 Fair value of hedged items 2,178 10,246 Fair value of hedging items -988 -10,545
Macro-hedging -98 -12 Fair value of hedged items -2,114 -2,788 Fair value of hedging items 2,017 2,776
Total 25,134 26,368
- 33 -
Note 7 – Net realised gains/losses on financial assets and liabilities not measured at fair valuethrough profit or loss
of which:Net proceed from the sale of building located in London 20,935 -Net proceed from the sale of building located in Luxembourg 15,063 -Net proceed from the sale of building located in Monaco 14,705 -Net proceed from the sale of building located in Geneva - 36,051Net proceed from the sale of building located in Lugano - 1,684Net proceed from the sale of building located in Lausanne - 2,581Net proceeds from precious metals transactions 982 1,501Retrocession fees from Merck Finck related to credit files 752 -Sales of work of art 679 402Compensation payment after court settlement (Merck Finck) - 2,937
- 34 -
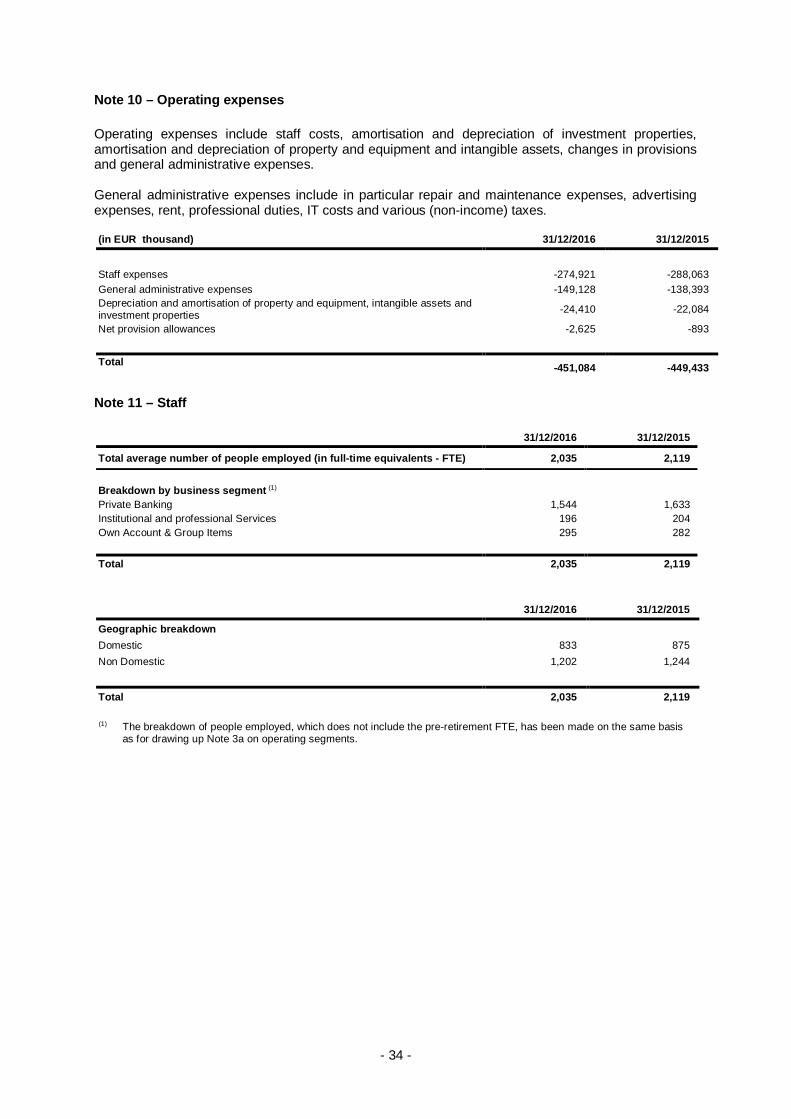
Note 10 – Operating expenses
Operating expenses include staff costs, amortisation and depreciation of investment properties,amortisation and depreciation of property and equipment and intangible assets, changes in provisionsand general administrative expenses.
General administrative expenses include in particular repair and maintenance expenses, advertisingexpenses, rent, professional duties, IT costs and various (non-income) taxes.
(in EUR thousand) 31/12/2016 31/12/2015
Staff expenses -274,921 -288,063General administrative expenses -149,128 -138,393Depreciation and amortisation of property and equipment, intangible assets andinvestment properties -24,410 -22,084
Net provision allowances -2,625 -893
Total -451,084 -449,433
Note 11 – Staff
31/12/2016 31/12/2015
Total average number of people employed (in full-time equivalents - FTE) 2,035 2,119
Breakdown by business segment (1)
Private Banking 1,544 1,633Institutional and professional Services 196 204Own Account & Group Items 295 282
(1) The breakdown of people employed, which does not include the pre-retirement FTE, has been made on the same basisas for drawing up Note 3a on operating segments.
- 35 -
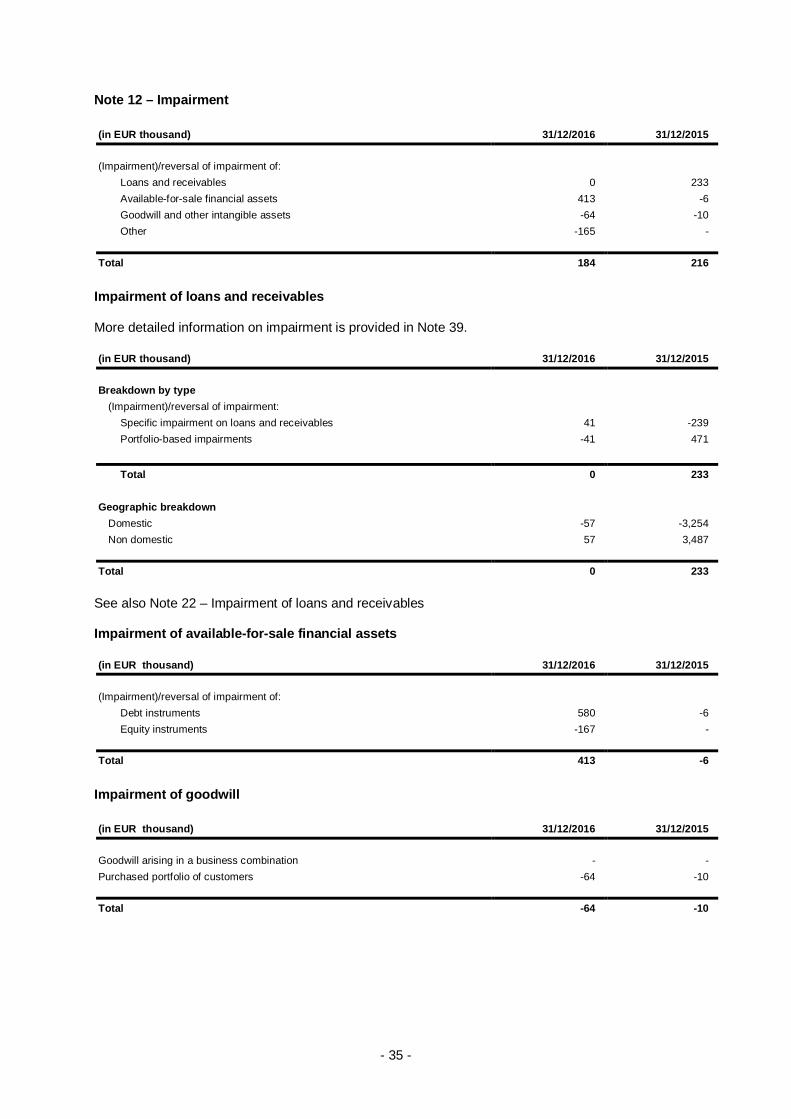
Note 12 – Impairment
(in EUR thousand) 31/12/2016 31/12/2015
(Impairment)/reversal of impairment of:Loans and receivables 0 233Available-for-sale financial assets 413 -6Goodwill and other intangible assets -64 -10Other -165 -
Total 184 216
Impairment of loans and receivables
More detailed information on impairment is provided in Note 39.
(in EUR thousand) 31/12/2016 31/12/2015
Breakdown by type(Impairment)/reversal of impairment:
Specific impairment on loans and receivables 41 -239Portfolio-based impairments -41 471
See also Note 22 – Impairment of loans and receivables
Impairment of available-for-sale financial assets
(in EUR thousand) 31/12/2016 31/12/2015
(Impairment)/reversal of impairment of:Debt instruments 580 -6Equity instruments -167 -
Total 413 -6
Impairment of goodwill
(in EUR thousand) 31/12/2016 31/12/2015
Goodwill arising in a business combination - -Purchased portfolio of customers -64 -10
Total -64 -10
- 36 -
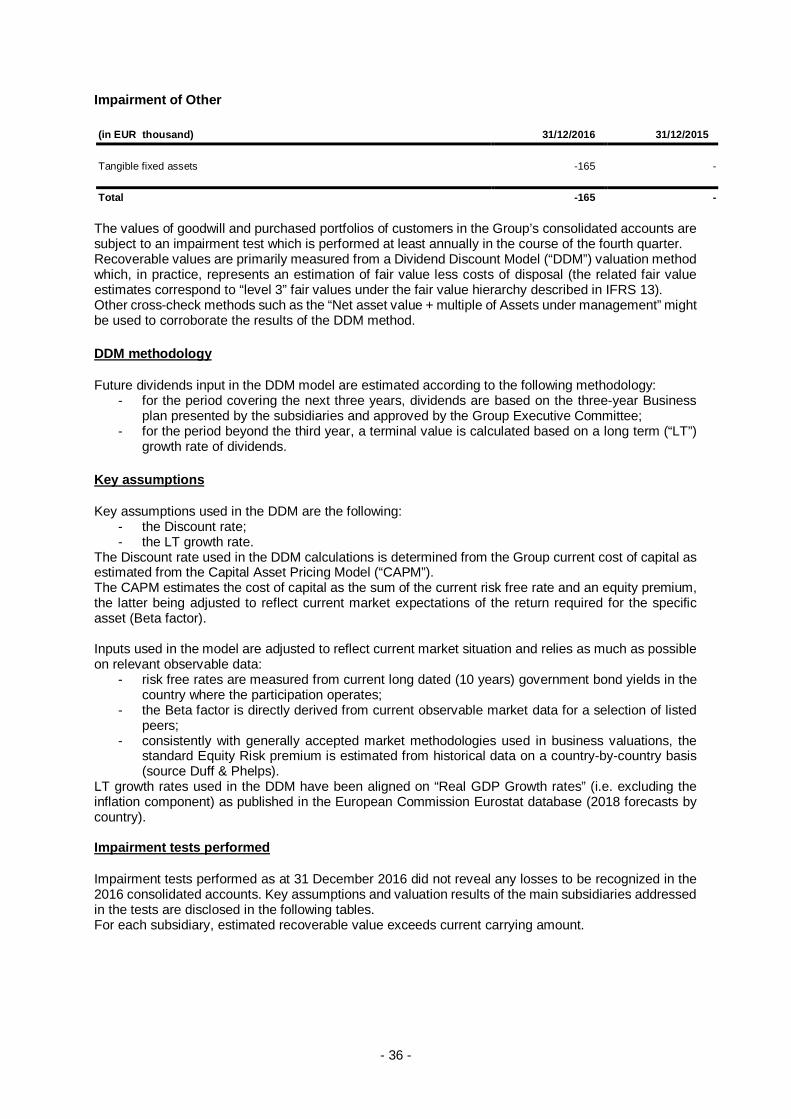
Impairment of Other
(in EUR thousand) 31/12/2016 31/12/2015
Tangible fixed assets -165 -
Total -165 -
The values of goodwill and purchased portfolios of customers in the Group’s consolidated accounts aresubject to an impairment test which is performed at least annually in the course of the fourth quarter.Recoverable values are primarily measured from a Dividend Discount Model (“DDM”) valuation methodwhich, in practice, represents an estimation of fair value less costs of disposal (the related fair valueestimates correspond to “level 3” fair values under the fair value hierarchy described in IFRS 13).Other cross-check methods such as the “Net asset value + multiple of Assets under management” mightbe used to corroborate the results of the DDM method.
DDM methodology
Future dividends input in the DDM model are estimated according to the following methodology:- for the period covering the next three years, dividends are based on the three-year Business
plan presented by the subsidiaries and approved by the Group Executive Committee;- for the period beyond the third year, a terminal value is calculated based on a long term (“LT”)
growth rate of dividends.
Key assumptions
Key assumptions used in the DDM are the following:- the Discount rate;- the LT growth rate.
The Discount rate used in the DDM calculations is determined from the Group current cost of capital asestimated from the Capital Asset Pricing Model (“CAPM”).The CAPM estimates the cost of capital as the sum of the current risk free rate and an equity premium,the latter being adjusted to reflect current market expectations of the return required for the specificasset (Beta factor).
Inputs used in the model are adjusted to reflect current market situation and relies as much as possibleon relevant observable data:
- risk free rates are measured from current long dated (10 years) government bond yields in thecountry where the participation operates;
- the Beta factor is directly derived from current observable market data for a selection of listedpeers;
- consistently with generally accepted market methodologies used in business valuations, thestandard Equity Risk premium is estimated from historical data on a country-by-country basis(source Duff & Phelps).
LT growth rates used in the DDM have been aligned on “Real GDP Growth rates” (i.e. excluding theinflation component) as published in the European Commission Eurostat database (2018 forecasts bycountry).
Impairment tests performed
Impairment tests performed as at 31 December 2016 did not reveal any losses to be recognized in the2016 consolidated accounts. Key assumptions and valuation results of the main subsidiaries addressedin the tests are disclosed in the following tables.For each subsidiary, estimated recoverable value exceeds current carrying amount.
- 37 -
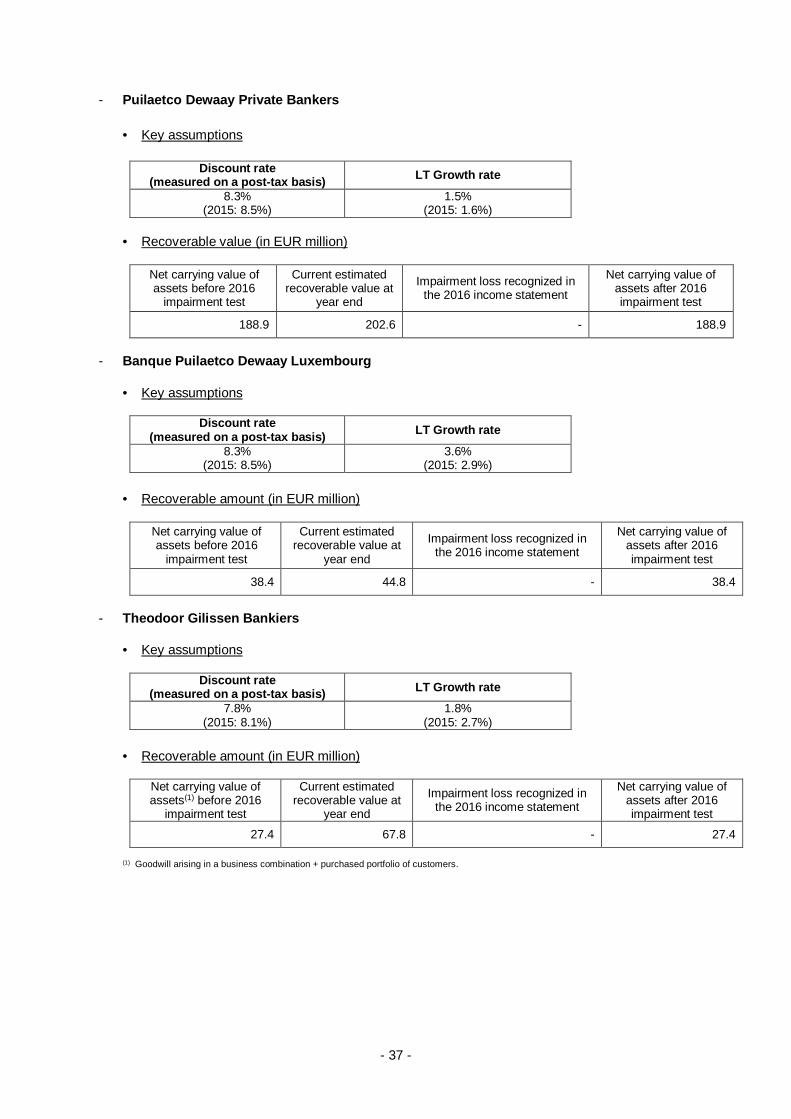
- Puilaetco Dewaay Private Bankers
· Key assumptions
Discount rate(measured on a post-tax basis) LT Growth rate
8.3%(2015: 8.5%)
1.5%(2015: 1.6%)
· Recoverable value (in EUR million)
Net carrying value ofassets before 2016
impairment test
Current estimatedrecoverable value at
year end
Impairment loss recognized inthe 2016 income statement
Net carrying value ofassets after 2016impairment test
188.9 202.6 - 188.9
- Banque Puilaetco Dewaay Luxembourg
· Key assumptions
Discount rate(measured on a post-tax basis) LT Growth rate
8.3%(2015: 8.5%)
3.6%(2015: 2.9%)
· Recoverable amount (in EUR million)
Net carrying value ofassets before 2016
impairment test
Current estimatedrecoverable value at
year end
Impairment loss recognized inthe 2016 income statement
Net carrying value ofassets after 2016impairment test
38.4 44.8 - 38.4
- Theodoor Gilissen Bankiers
· Key assumptions
Discount rate(measured on a post-tax basis) LT Growth rate
7.8%(2015: 8.1%)
1.8%(2015: 2.7%)
· Recoverable amount (in EUR million)
Net carrying value ofassets(1) before 2016
impairment test
Current estimatedrecoverable value at
year end
Impairment loss recognized inthe 2016 income statement
Net carrying value ofassets after 2016impairment test
27.4 67.8 - 27.4
(1) Goodwill arising in a business combination + purchased portfolio of customers.
- 38 -
- Brown Shipley
· Key assumptions
Discount rate(measured on a post-tax basis) LT Growth rate
7.6%(2015: 8.4%)
1.2%(2015: 2.3%)
· Recoverable amount (in EUR million)
Net carrying value ofassets(1) before 2016
impairment test
Current estimatedrecoverable value at
year end
Impairment loss recognized inthe 2016 income statement
Net carrying value ofassets after 2016impairment test
30.1 32.5 - 30.1
(1) Goodwill arising in a business combination + purchased portfolio of customers.
Note 13 – Share of profit of associates
(in EUR thousand) 31/12/2016 31/12/2015
European Fund Administration S.A. and EFA Partners S.A. 1,129 611
Total 1,129 611
Note 14 – Income tax (expenses) / income
(in EUR thousand) 31/12/2016 31/12/2015
Breakdown by typeCurrent tax -5,259 -13,685Deferred tax -4,856 -4,187
Total -10,115 -17,872
(in EUR thousand) 31/12/2016 31/12/2015
Breakdown by major components:
Result before tax 16,127 99,275Luxembourg income tax rate 26.01% 29.22%
Income tax calculated at the Luxembourg income tax rate -4,195 -29,008Plus/minus tax effects attributable to:
Differences in tax rates, Luxembourg – abroad -4,224 -20,777Tax free-income 13,709 30,603Other non-deductible expenses -1,956 -3,380Adjustments related to prior years 184 -581Adjustments to opening balance due to tax rate change -1,747 -55Unused tax losses and tax credits -11,918 2,387Other 32 2,938
Income tax adjustments -5,921 11,136
Total -10,115 -17,872Details of tax assets and liabilities are given in Note 25.
- 39 -
Note 15 – Classification of financial instruments: breakdown by portfolio and by product
· Financial instruments are classified into several categories (“portfolios”). Details of these variouscategories and the valuation rules linked to them are given in Note 2c, point c, dealing with financialassets and liabilities (IAS 39).
· The balance sheet analyses below have been conducted at the dirty price.CARRYING AMOUNT(in EUR million)
31/12/2016
ASSETSHeld-for-trading(HFT)assets
Financialinstrumentsat fair value
(FIFV) throughprofit or loss
Available-for-sale(AFS)
financialassets
Loans andreceivables
(L&R)Hedging
derivatives Total
Loans and advances to credit institutions - - - 1,133 - 1,133
Loans and advances other than with creditinstitutions Consumer credits Mortgage loans Term loans Current accounts Other
------
------
------
2,05111
815716433
75
------
2,05111
815716433
75
Equity instruments 2 0 328 - - 330
Debt instruments Government bodies
Credit institutions Corporates
283134
47101
194194
--
4,4692,720
786963
88-
88-
----
5,0343,049
9211,064
Financial derivatives 269 - - - 14 282
Total 554 194 4,797 3,271 14 8,830
Of which reverse repos - - - 953 - 953
CARRYING AMOUNT(in EUR million)
31/12/2015
ASSETS
Held-for-trading(HFT)assets
Financialinstrumentsat fair value
(FIFV) throughprofit or loss
Available-for-sale(AFS)
financialassets
Loans andreceivables
(L&R)
Hedgingderivatives
Total
Loans and advances to credit institutions - - - 2,253 - 2,253
Loans and advances other than with creditinstitutions Consumer credits Mortgage loans Term loans Current accounts Other
------
------
------
2,72616
8201,319
468103
------
2,72616
8201,319
468103
Equity instruments 2 0 137 - - 139
Debt instruments Government bodies
Credit institutions Corporates
482364
6751
----
3,9181,7931,0391,086
53-
53-
----
4,4532,1561,1591,138
Financial derivatives 230 - - - 17 247
Total 714 0 4,054 5,032 17 9,817
Of which reverse repos - - - 2,605 - 2,605
- 40 -
CARRYING AMOUNT(in EUR million)
31/12/2016
LIABILITIES Held-for-trading(HFT) liabilities
Financialliabilities at fair
value(FIFV) throughprofit or loss
Hedgingderivatives
Financialliabilities at
amortised costTotal
Deposits from credit institutions - - - 1,094 1,094
Deposits from other than creditinstitutions Current accounts/demand deposits Time deposits Other deposits
The following table summarises the carrying amounts and fair values of the financial assets and liabilitiesnot measured at fair value. Loans and advances to credit institutions have a short term maturity (mainlyless than 3 months) and loans and advances to other than credit institutions mainly carries a variableinterest rate justifying that carrying amounts and fair value of financial assets are considered to be equal.
The Group uses the following hierarchy for determining and disclosing the fair value of financialinstruments by valuation technique:
· Level 1: quoted (unadjusted) price in active market for identical assets or liabilities;· Level 2: other techniques for which all inputs which have a significant effect on the recorded fair
value are observable, either directly or indirectly;· Level 3: techniques which use inputs that have a significant effect on the recorded fair value that
All transfers between categories (i.e. those between level 1 and level 2 detailed in the above tables andthose into or out of level 3 detailed in the tables dedicated to the Level 3 fair value measurements herebelow) are the result of the internal Fair Value Hierarchy process run by the Bank (since 2015). Themost significant change concern a large range of debt instruments (bonds) that have been reclassifiedfrom Level 1 to level 2, because market indicators used in the process to validate the fair value areconsidered as “observable inputs” vs “executable inputs”. In substance, observable data may not beregarded as representative of an active market, and thus Level 2 is relevant to qualify those securitiesas at 31 December 2016.
All transfers disclosed are deemed to have occurred at the end of the reporting period. Transfers arethus measured at the closing fair values of the related items.
- 45 -
Level 3 items measured at fair value
Financial instrumentsmeasured at fair valuethrough profit or loss
Available-for-salefinancial assets Total
(in EUR million)
Balance as at 01/01/2016 2 50 52Total profit / loss for the year 0 2 2- recognised in the income statement 0 - 0- recognised in other components of
comprehensive income - 2 2
Purchases / Capital increases 0 2 2
Sales / Capital decreases - -6 -6
Transfers into / out of level 3 0 - 0
Balance as at 31/12/2016 2 47 49
Total gains / losses recognised in the incomestatement, that is attributable to the change inunrealised gains or losses relating to those assets andliabilities held at the end of the reporting period
0 2 2
Financial instrumentsmeasured at fair valuethrough profit or loss
Available-for-salefinancial assets Total
(in EUR million)
Balance as at 01/01/2015 1 46 47Total profit / loss for the year 0 5 5- recognised in the income statement 0 - 0- recognised in other components of
comprehensive income - 5 5
Purchases / Capital increases 0 0 0
Sales / Capital decreases 0 -1 -1
Transfers into / out of level 3 1 0 1
Balance as at 31/12/2015 2 50 52
Total gains / losses recognised in the incomestatement, that is attributable to the change inunrealised gains or losses relating to those assets andliabilities held at the end of the reporting period
0 4 4
Level 3 positions mainly include investments in Private Equity structures, holdings in unlisted equityinstruments and other participating interests. Most significant positions – which are all available-for-salefinancial assets – are further commented here below.
Private Equity holdings include two main positions whose global fair value recognized in the statementof financial position at year end amounts to EUR 25.2 million.
The first one (EUR 19.3 million) consists in shares held in a sub-fund (SIF / SICAV) whose investmentobjective is to build a balanced portfolio of properties in order to derive benefits from changes in thedemand for and supply of wood products and biomass. The fund currently owns forests and a farm inEastern Europe.The fund net asset value (NAV) is measured on a yearly basis and published in audited financialstatements. The valuation of the underlying assets of the fund (i.e. the biological and tangible assets) isperformed by two independent appraisers appointed by the Board of Directors of the fund (in accordancewith the Private Placement Memorandum).
- 46 -
Methodologies used by the appraisers to fair value the underlying assets range from ‘marketcomparison’ approaches (where fair value is derived from most recent valuations / transactionsobserved on similar assets in the same area, adjusted for the main differences identified between theproxy asset and the target asset to be fair valued) to pure ‘income approaches’ (DCF method). The DCFcomputation is based on the latest business plan prepared by the fund managers and on assumptionswhich include, among others, the discounting rate used, inflation rates, exit yield, sales growth targets,crop productivity levels and costs.
DCF Model is based on several assumptions among which (i) expectations that the biomass marketwill gradually reach maturity over the coming years and (ii) the liberalization of the gas market to takeplace in the area where the entity operates and which should lead to significant increase of gas prices.Agriculture crop yields are also expected to record a gradual increase in productivity levels, followingexpected improvement of the soil quality through intensive sub-soiling and plowing activities. Energycrop yields have been estimated based on technical studies. Discount rates used by the appraiser tocompute the DCF valuation are based on a weighted average cost of capital set at 8.0% for the forestsand 8.2% for the farm activities.For the key assumptions of timber price, biomass price, food and energy crops productivity anddiscounting rates that have significant impact on fair value of forest properties and farm activities,sensitivity analyses were performed.Those analyses led to fund NAV per share estimates which ranged from EUR 88.7 to EUR 107.53.
The market comparison approach led to a range of NAV valuation from EUR 99.40 to EUR 101.30.These valuations are lower compared to the previous year due to the impact of the drop in energy priceson the international markets.
KBL epb group management decided to adjust the value of this investment to EUR 98.1 per share whichis the mid value of the DCF valuation range disclosed in the audited annual report of the company.
The second investment (EUR 5.4 mios) is a structure with a fixed maturity (2022) whose investmentpolicy is to develop a portfolio of retail parks throughout Europe (+/- 50% in Western Europe and +/-50% in Eastern Europe). Once these assets being fully operational, they are sold to long term investorsand proceeds are returned to shareholders.Up to now, 2 retail parks have already been sold with substantial capital gains. These realizations, alongwith the excess cash flows generated by the existing portfolio, have already lead to a return of 40% ofthe invested amount since inception of the company in 2012.The majority of the parks currently held by the company are operational, generate revenues. Some arestill under development.Latest information received from the company indicates that business performance is strong in terms ofnet operating cash-flows.Again, the consistency of the independent appraiser estimates performed during the first quarter 2016(for the portfolio currently held by the company) has been confirmed by the sale of a major park held inBelgium, which was disposed in June 2016 at a price slightly above the latest fair valuation received.Net cash-inflows generated by the company, both in the ordinary course of business and from the netproceeds received in the above sale transaction have been returned to investors in September 2016.After reviewing those business developments, the Group management decided to adjust the fairvaluation of its interest in the company to reflect the latest official external valuation (March 2016)adjusted by the subsequent capital calls (October capital call of EUR 1.99 /share) and distributions(September distribution of EUR 0.93/share). This led to a fair value per share of EUR 8.13 at year end.
Other participating interests mainly include two holdings for a global fair value of EUR 18.9 million.
The first one (EUR 11.5 million) relates to an interest in a company offering securities settlementservices. The valuation of EUR 797.00 by share is based on the price achieved in the context of a sharebuy-back program proceeded by the company end of 2015.
The other position is a participating interest in a stock exchange (EUR 7.4 million). For this holding, theGroup retained the valuation performed by an independent valuer appointed by the company.Valuation estimates were computed using two different approaches: a discounted cash flow approach(DCF) and P/E multiples.
- 47 -
The DCF model notably includes a weighted average cost of capital of 6.06%, a long term growth rateof 1%, a liquidity discount of 15% as well as a minority discount of 15%. P/E multiples have beencomputed from average peers P/E ratios of 18.7 (actual 2015) and 17.4 (forecast 2016). Average fairvalue stemming from both models was then estimated to be EUR 1,974 per share; this figure has beenused to fair value the position in the Group financial statements as of 31 December 2016.The appraisal report also included a sensitivity analysis under various scenarios and for both models.Under that analysis, computed fair values ranged from EUR 1,263 to EUR 2,927 per share.
Note 16 – Available-for-sale financial assets and Loans and receivables: breakdown byportfolio and quality
Note 17 – Financial assets and liabilities: breakdown by portfolio and residual maturity
(in EUR million)
Held-for-trading(HFT)assets
Financialinstrumentsat fair value
(FIFV)throughprofit or
loss
Available-for-sale
(AFS)financialassets
Loans andreceivables
(L&R)
Hedgingderivatives Total
ASSETS
31/12/2016Less than or equal to 1 year 444 194 1,345 2,064 2 4,050More than 1 but less than or equal to 5years 86 - 2,291 835 6 3,217
More than 5 years 21 - 833 372 6 1,232Indefinite period 2 0 328 - - 330
Total 554 194 4,797 3,271 14 8,830
31/12/2015Less than or equal to 1 year 566 - 752 3,804 14 5,137More than 1 but less than or equal to 5years 65 - 2,568 830 3 3,466More than 5 years 81 - 597 397 0 1,076Indefinite period 2 0 137 - - 139
Total 714 0 4,054 5,032 17 9,817
(in EUR million)Held-for-trading(HFT)
liabilities
Financialinstrumentsat fair value
(FIFV)through profit
or loss
Liabilities atamortised
costHedging
derivatives Total
LIABILITIES
31/12/2016Less than or equal to 1 year 223 - 9,157 7 9,387More than 1 but less than or equal to 5 years 10 - 12 84 106More than 5 years 2 - 0 65 68Indefinite period 0 - 0 - 0
Total 235 - 9,169 156 9,561
31/12/2015Less than or equal to 1 year 202 - 9,300 14 9,516More than 1 but less than or equal to 5 years 5 - 62 107 173More than 5 years 54 - 0 63 117Indefinite period 0 - 0 - 0
Total 261 - 9,363 184 9,807
- 49 -
Note 18 – Offsetting of financial assets and liabilities
A financial asset and a financial liability shall be offset and the net amount presented in the balancesheet position when, and only when the Group:· currently has a legally enforceable right to set off the recognized amounts; and· intends either to settle on a net basis, or to realize the asset and settle the liability simultaneously.
The Group currently has no legally enforceable right which satisfies the above conditions. It follows thatall amounts presented on the face of the balance sheet are gross amounts.
The Group however frequently enters into Master Netting Agreements (“MNA”) with its counterpartiesto manage the credit risks associated primarily with (i) repurchase and reverse repurchase transactions,(ii) securities borrowing / lending and (iii) over-the-counter derivatives.These arrangements may also be supplemented by collateral agreements.
Offsetting rights provided for by such MNA are generally conditional upon the occurrence of somespecific future events (typically the events of default, insolvency or bankruptcy of the counterparty). Theyare thus not current, which prevents the Group from setting the related assets and liabilities off on thebalance sheet.Similarly, the rights of set off relating to the cash and other financial instrument collateral are alsoconditional upon the default of the counterparty.
The financial impact of the MNA potential offsetting opportunities are disclosed in the following tables.Only Global Master Repurchase Agreements (GMRA) for repurchase agreements and InternationalSwaps and Derivatives Association Master Agreement (ISDA) for over-the-counter derivatives havebeen considered.The effect of Master Netting Agreements relating to securities lending and borrowing has not beenreported because, as underlined in the Group’s significant accounting policies (cf. Note 2c), thosetransactions are not recognized on the balance sheet (i.e. securities lent are not derecognized from thebalance sheet and securities borrowed are not recognized within assets). Notes 19 and 20 giveadditional information on those activities and on the related financial collateral received / pledged.
ASSETS (in EUR million) Impact of Master Netting Agreements
31/12/2016Gross amounts
of financialassets
presented on thebalance sheet
Netting potential /financial liabilities
Financial collateralreceived
(securities andcash)
Net amount
Cash, cash balances at central banks and otherdemand deposits 1,619 - - 1,619
Financial assetsHedging and trading derivatives 282 -166 -63 53Held-for-trading assets (excluding derivatives) 285 - - 285Assets designated at fair value through profit orloss 194 - - 194Available-for-sale financial assets 4,797 - - 4,797Loans and receivables 3,271 - -950 2,322
Total 10,449 -166 -1,013 9,270
- 50 -
LIABILITIES (in EUR million) Impact of Master Netting Agreements
31/12/2016
Gross amountsof financialliabilities
presented onthe balance
sheet
Netting potential /financial assets
Financialcollateral pledged
(securities andcash)
Net amount
Financial liabilitiesHedging and trading derivatives 391 -166 -154 70Held-for-trading liabilities (excludingderivatives) 1 - - 1Liabilities designated at fair value throughprofit or loss - - - -Liabilities measured at amortized cost 9,169 - -526 8,643
Total 9,561 -166 -681 8,714
ASSETS (in EUR million) Impact of Master Netting Agreements
31/12/2015
Gross amountsof financial
assetspresented on the
balance sheet
Netting potential /financial liabilities
Financial collateralreceived
(securities andcash)
Net amount
Cash, cash balances at central banks and otherdemand deposits 697 - - 697
Financial assetsHedging and trading derivatives 247 -124 -25 98Held-for-trading assets (excluding derivatives) 484 - - 484Assets designated at fair value through profit orloss 0 - - 0Available-for-sale financial assets 4,054 - - 4,054Loans and receivables 5,032 -330 -2,297 2,405
Total 10,514 -455 -2,322 7,738
LIABILITIES (in EUR million) Impact of Master Netting Agreements
31/12/2015
Gross amountsof financialliabilities
presented onthe balance
sheet
Netting potential /financial assets
Financialcollateral pledged
(securities andcash)
Net amount
Financial liabilitiesHedging and trading derivatives 443 -124 -200 119Held-for-trading liabilities (excludingderivatives) 1 - - 1Liabilities designated at fair value throughprofit or loss - - - -Liabilities measured at amortized cost 9,363 -330 -65 8,968
Total 9,807 -455 -265 9,088
- 51 -
Note 19 – Securities lending and securities given in guarantee
The Group regularly carries out transactions in which the assets transferred do not qualify forderecognition under IAS 39. The related securities are generally transferred under full ownership andthe counterpart is thus able to re-use them in other operations.This mainly concerns the following operations:
- repurchase agreements (“repo”);
- securities lending; and
- securities given as collateral (in particular for securities borrowing or to guarantee credit linesreceived).
(*) The item ‘Other’ relates to securities borrowed or received as collateral for other operations.(**)The carrying amount of debts associated with repo operations is available in Note 15.(***) Fair value of securities borrowed: EUR 103 million at 31/12/2016 (EUR 230 million at 31/12/2015).
- 52 -
Note 20 – Securities received in guarantee
The Group mainly receives securities as collateral in relation to its reverse repurchase agreementoperations and securities lending.These securities are generally transferred under full ownership and the Group is able to re-use them inother operations.
The fair value of these guarantees can be broken down as follows:
(in EUR million) 31/12/2016 31/12/2015Reverse repurchase agreements 945 2,635Collateral received in securities lending 124 221
Total 1,070 2,857Of which, transferred to:
Repurchase agreements 180 20Securities lent - 4Collateral given for securities borrowing 26 138Other 11 -
Total 217 162
Note 21 – Impairment of available-for-sale financial assets
Changes (in EUR million) Debt instruments Equity instruments
Balance as at 01/01/2016 6 1Changes affecting the income statement -1 0
Allowances 0 0Reversals -1 -
Changes not affecting the income statement -2 0Securities sold/matured -2 -Change in the scope of consolidation - -Other 0 0
Balance as at 31/12/2016 4 1
Changes (in EUR million) Debt instruments Equity instruments
Balance as at 01/01/2015 6 2Changes affecting the income statement 0 0
Allowances - -Reversals 0 0
Changes not affecting the income statement 0 -1Securities sold/matured 0 0Change in the scope of consolidation 0 -1Other 0 0
Balance as at 31/12/2015 6 1
- 53 -
Note 22 – Impairment of loans and receivables
(in EUR million) 31/12/2016 31/12/2015
Total 15 28
Breakdown by type 15 28Specific impairments of loans and receivables 13 26Portfolio-based impairment 2 2
Breakdown by counterparty 15 28Loans and advances to credit institutions - -Loans and advances to other than credit institutions 15 28
(1) All hedging derivatives are designated in fair value hedging relationships except forward sales (interest rate contracts) whichexclusively relate to cash flow hedge relationships. Hedged cash flows of these 2015 cash flow hedge relationships affect theincome statement in early 2016.
Hedging (1)
2016 2015
(in EUR million) Fair value Notional value Fair value Notional valueAssets Liabilities Assets Liabilities
The heading ‘Other assets’ covers various short-term receivables such as dividends and coupons thatclients bring to KBL epb group to be cashed and the value of which has already been paid and preciousmetals assets.
Note 25 – Tax assets and liabilities
(in EUR million) 31/12/2016 31/12/2015
Current tax assets 3 1Deferred tax assets 6 10
Employee benefits 2 1Losses carried forward 34 36Tangible and intangible assets 1 1Provisions -18 -21Financial instruments at fair value through profit or loss - 2Available-for-sale financial instruments -12 -14Other - 6
TAX ASSETS 9 11
Tax losses and tax credits not capitalised (1) 112 129
(1) Tax losses and tax credits not capitalised mainly concern tax losses of Group companies, which are not recognised becauseof uncertainty about future taxable profits.
(in EUR million) 31/12/2016 31/12/2015
Current tax liabilities 1 4Deferred tax liabilities 4 4
Employee benefits - 0Losses carried forward - -Tangible and intangible assets 1 1Provisions 0 -Financial instruments at fair value through profit or loss - -Available-for-sale financial instruments 4 4Other 0 0
TAX LIABILITIES 6 8
Changes in deferred tax assets and liabilities are not equal to the deferred tax charge/incomerecognised in the income statement during the year. This is mainly due to the deferred tax linked to therecognition in the revaluation reserve of fair value changes in unimpaired available-for-sale financialinstruments.
- 56 -
Note 26 – Investments in associates
Associates are companies over which the KBL epb group has a significant influence, either directly orindirectly, without having full or joint control.
(in EUR million) 31/12/2016 31/12/2015
Total 13 12
Overview of investments in associates (including goodwill)European Fund Administration S.A. and EFA Partners S.A. 13 12
Goodwill in associatesGross amount - -Cumulative impairment - -
Changes 31/12/2016 31/12/2015
Opening balance 12 12 Share of profit for the year 0 0 Dividends paid - - Changes in scope - -
Ending balance 13 12
Summary financial information (in EUR thousand) Total asset Total liabilitiesexcluding equity Net result
31/12/2016 (provisional figures)
European Fund Administration S.A. 38,102 11,836 2,237EFA Partners S.A. 2,396 12 316
Balance as at 31/12/2015 215 59 7 6 1 289Of which cumulative amortisation andimpairment -117 -83 -14 -26 -9 -249
- 58 -
Note 28 – Property and equipment and investment properties
(in EUR million) 31/12/2016 31/12/2015
Property and equipment 92 124Investment properties
Carrying amount 3 5Fair value 6 10
Investment properties – Rental income 1 1
Investment properties’ fair values disclosed supra are based on valuations obtained from independentvaluers who hold a recognized and relevant professional qualification and have recent experience in thelocation and category of the investment properties being valued.The estimates are primarily derived from recent transactions and other local market data observable inthe areas where the properties are held. Related fair values are thus to be classified within the level 2category under the IFRS 13 fair value hierarchy.
Changes (in EUR million) Land andbuildings IT equipment Other
Balance as at 31/12/2015 102 5 17 124 5Of which cumulative depreciation andimpairment -97 -24 -36 -157 -5
- 59 -
Note 29 – Provisions
Changes (in EUR million)
Pensions &other post
employmentdefinedbenefit
obligation
Other longterm
employeebenefits
Specificimpairmentfor credit
commitments
Pendinglegal
disputesOther
provisions Total
Balance as at 01/01/2016 76 6 0 13 1 96Changes affecting the income statement 1 1 - 2 1 5
Allowances 3 1 - 3 1 9Reversals -2 0 - -1 0 -3
Other changes 4 0 0 -3 0 0Balance as at 31/12/2016 81 7 0 11 1 100
Changes (in EUR million)
Pensions &other post
employmentdefinedbenefit
obligation
Other longterm
employeebenefits
Specificimpairmentfor credit
commitments
Pendinglegal
disputesOther
provisions Total
Balance as at 01/01/2015 91 5 0 18 27 141Changes affecting the income statement 3 1 0 1 0 5
Allowances 3 1 - 3 1 7Reversals 0 0 0 -2 0 -2
Other changes -18 -1 0 -6 -26 -51Balance as at 31/12/2015 76 6 0 13 1 96
Specific impairment for credit commitments: provisions accounted for to cover risk on given guarantees,more precisely on credits for which the Bank acts as sub-participant.
Provisions for pending legal disputes: provisions recorded to cover legal disputes with private andprofessional counterparties, including lawyers’ fees.
Other provisions: other provisions than the above-mentioned provisions.
For most of the provisions recorded, no reasonable estimate can be made of when they will be used.The main litigation case is the following:
Madoff litigation
In December 2008, Bernard L. Madoff’s massive Ponzi scheme was discovered. Bernard L. MadoffInvestment Securities LLC (“BLMIS”) and its “feeder funds” were put into liquidation.The liquidator of BLMIS considers that certain investors in BLMIS knew or should have known thatBLMIS was fraudulent. The liquidator therefore launched a claim to recover payments made by BLMISto these investors (so called “claw-back actions”). As the liquidator started claw-back actions againstthe feeder funds, the liquidators of these funds have in their turn started similar proceedings againstKBL epb and other defendants before the New York Courts and the BVI Courts. The BVI Courts rejectedthe liquidators’ restitution claim against KBL epb and other defendants judging that they acted in goodfaith. The liquidators appealed this judgement of the BVI court before the Privy Council in London. ThePrivy Council rejected the liquidators’ appeal on 16 April 2014. As for the second proceedings beforethe BVI courts (i.e. proceedings to have the authority of the liquidators removed), parties are awaitingjudgment in this matter. Finally, proceedings before the New York Court are still pending and KBL epbas well as the other defendants will now try to dismiss these proceedings.
As in this case the risks are remote, provisions have only be made for the legal costs.
- 60 -
Note 30 – Other liabilities
The heading ‘Other liabilities’ in particular covers various items payable in the short term such ascoupons and redeemable securities as paying agent.
Note 31 – Retirement benefit obligations
KBL epb group operates a number of defined benefit plans for its employees. The most material plansare in Germany, United Kingdom and Luxembourg. It also operates defined contribution plans in somecountries.
LuxembourgThe Group operated a number of defined benefit plans in Luxembourg comprising employer-funded andemployee-funded plans. The employer-funded plans provided retirement benefits linked to service andfinal salary. Investment earnings applied to employee contributions were subject to a minimumguaranteed return. The plans were funded via insurance arrangement with a third party to which thecompany pays regular premiums.
Plan settlements
In 2016 the vested right of several active and former employees in specific defined benefit plans inLuxembourg were converted into new defined contribution schemes.
A global settlement gain of EUR 2 million recognized in the income statement in 2016 arose from thedifference between the present value of the defined benefit obligation settled (as determined on the dateof settlement), and the settlement price (including any plan assets transferred and any payments madedirectly by the Group in connection with the settlement).
GermanyKBL epb group operates defined benefit plans in Germany which provide retirement, death and disabilitybenefits. Some of these plans are closed to new entrants. Those plans with active membership mostlyprovide fixed amount pension promises. The plans are mostly unfunded but one plan is partly financedvia a support fund, which invests in a single property.
NetherlandsAs of 2 December 2016, it was determined the main pension schemes, that was accounted for as adefined benefit plan under IAS19, meets the definition of a defined contribution plan. This determinationwas based on the economic substance of the plan. From 2 December 2016, the Group has no legal orconstructive obligation to pay contributions for the plan and no segregated asset depot is held at theinsurance company where the assets backing the obligations are held. Therefore the plan is accountedfor as a defined contribution plan as of 2 December 2016. The change in accounting treatment hasresulted in a plan settlement and net asset settlement has taken place in 2016, resulting in a transfer ofthe prior recorded Other Comprehensive Income balance within Equity.
Other plansThe Group also has various retirement plans in France and the UK. Most of these plans are funded,with assets backing the obligations held in separate legal vehicles such as trusts or insurance vehicles.The benefits provided, the approach to funding and the legal basis of the plans reflect their localenvironments.
- 61 -
DEFINED BENEFIT PLANS 31/12/2016 31/12/2015In EUR million
Defined benefit plan obligationsValue of obligations as at 01/01 155 229
Current service cost 2 2Interest cost 3 4Past service cost and losses arising from settlements -1 -Actuarial (gains)/losses 16 -13
stemming from changes in demographic assumptions 0 -1stemming from changes in financial assumptions 18 -10experience adjustments -2 -2
Benefits paid -15 -8Out of which: amounts paid in respect of settlements -8 -
Plan participant contributions 0 0Currency adjustment -3 1Business combinations and disposals - -59Other -33 -
Value of obligations as at 31/12 125 155
Fair value of plan assetsFair value of assets as at 01/01 86 139
Actual return on plan assets 7 0Interest income 2 2Return on plan assets (excluding interest income) 5 -2
Out of which: amounts paid in respect of settlements -7 -Currency adjustment -3 1Business combinations and disposals - -50Other -38 -
Fair value of assets as at 31/12 44 86
Plan assets do not include any investment in transferable securities issued by the Group (2015: EUR 0.2 million). A propertyis partially used by the Group for administrative purposes. The fair value of the portion of the property held for own use, asestimated at year-end, is EUR 0.5 million (2015: EUR 0.5 million).
Effect of the asset ceilingEffect of the asset ceiling as at 01/01 -6 -1
Interest on the effect of asset ceiling 0 0Change in the effect of asset ceiling 1 -5Other 5 -
Effect of the asset ceiling as at 31/12 0 -6
Funded statusPlan assets in excess of defined benefit obligations -80 -69Unrecognised assets 0 -6Unfunded accrued / prepaid pension cost -80 -75
- 62 -
In EUR million 31/12/2016 31/12/2015
Changes in net defined benefit pension liability or assetUnfunded accrued / prepaid pension cost as at 01/01 -75 -91
Net periodic pension cost recognized in the income statement -2 -3Remeasurements recognized in OCI (excl. change in tax provision) -9 6Employer contributions 2 1Pension payments by employer 4 3
Out of which: amounts paid in respect of settlements - 0Currency adjustment 0 0Business combinations and disposals 0 9
Unfunded accrued / prepaid pension cost as at 31/12 -80 -75
Changes in the tax provision relating to current deficits on external plansRecognized provision as at 01/01 0 0
Change in the provision recognized through OCI 0 0Pension payments by employer 0 0Gains and losses arising from settlements 0 -
Recognized provision as at 31/12 0 0
Changes in the remeasurement reserve in equityRecognized reserve as at 01/01 -30 -43
Remeasurement recognized in OCI -9 6Transfers 4 6
Recognized reserve as at 31/12 -35 -30
AMOUNTS RECOGNIZED IN COMPREHENSIVE INCOMEAmounts recognised in the income statementCurrent service cost -2 -2Net interest on the defined benefit liability/asset -2 -2Past service cost - -Gains and losses arising from settlements 2 -Other - -Net pension cost recognized in the income statement -1 -3
Amounts recognized in other comprehensive incomeActuarial gains/losses on the defined benefit obligation -16 13Actual return on plan assets (excluding amounts included in interest income) 5 -2Change in the effect of the asset ceiling 1 -5Change in the tax provision 0 0Currency adjustment 0 0Total other comprehensive income -9 6
Actual return on plan assets 8.39% 0.09%
Breakdown of plan assets 100% 100%Fixed income
Quoted market price in an active market 54% 77%Unquoted - -
EquitiesQuoted market price in an active market 13% 8%Unquoted - -
AlternativesQuoted market price in an active market 8% 0%Unquoted - -
Cash 2% 4%Real estate 11% 6%Other 12% 5%
- 63 -
In EUR million 31/12/2016 31/12/2015
Significant actuarial assumptions used:
Defined benefit obligationThe rate used to discount the post-employment benefit obligations is determined by reference to market yields at the end ofthe reporting period on high-quality corporate bonds with similar maturities than the pension commitments.
Discount rate 0.34% to 2.70% 1.21% to 3.70%DBO sensitivity to changes in discount rate
Scenario DR -1% +20 +27Scenario DR +1% -15 -21
Expected rate of salary increase (including inflation) 1.50% to 3.00% 1.50% to 3.00%Scenario SR -1% 0 -2Scenario SR +1% 0 +3
Maturity profile of the DBOWeighted average duration of the DBO (in years) 14 16
Expected contributions for next year 1 1
Defined contribution plansIn EUR million
31/12/2016 31/12/2015
Amount recorded in the income statement -11 -8
Note 32 – Equity attributable to the owners of the parent
As of 31 December 2016, the subscribed and paid-up capital is EUR 221.2 million (31 December 2015:EUR 187.2 million), represented by 23,794,431 ordinary shares without par value (2015: 20,132,547)and by 4,336 non-voting preference shares without par value (2015: 4,041).
The 2016 evolution in equity is due to the following events:
- The Extraordinary General Meeting held on 21 July 2016 resolved
(i) to reduce the share capital by EUR 7,632 by cancelling 821 shares in accordance with the lawof 28 July 2014 regarding the immobilisation of bearer shares, modifying the law of 10 August1915 as amended;
(ii) to rectify a minor discrepancy deriving from the number of shares held in treasury by KBL, i.e.495 treasury shares, should actually have been converted and allocated as preference sharesheld by other shareholders. The number of shares mentioned are rectified via a netting of 495shares operated by a reduction of ordinary shares and an increase of preference shares. Thisadjustment does not affect the total number of shares of the Bank.
- The Board of Directors held on 15 December 2016 approved the increase of the share capital byEUR 34,053,266.77 by subscription of 3,663,000 new ordinary shares by Precision Capital S.A..
Holders of preference shares are entitled to receive an initial dividend of EUR 0.25 per share, asestablished in the Bank’s articles of incorporation, and are therefore guaranteed a minimum annualreturn. If there are no profits, this dividend entitlement is carried forward to subsequent periods. Anyprofits remaining once this first dividend has been paid are shared out between all shareholders, whetherthey hold ordinary or preference shares, in such a way that both categories of shareholders ultimatelyreceive an identical dividend. The Bank is not indebted towards preference shareholders.
Article 35 of the Bank’s articles of incorporation specifies that the net liquidation profit, after the chargespayment, will be used to firstly refund the non-voting preference shareholders. The remaining balancewill be allocated on equal basis to ordinary shareholders.
- 64 -
In accordance with the Luxembourg law on limited companies, at least 5% of the profit of the year hasto be allocated to the legal reserve. This allocation ceases to be mandatory as soon as the legal reserveamounts to 10% of the capital.
As at 31 December 2016, the legal reserve is EUR 18.7 million (31 December 2015: EUR 18.7 million)representing 10% of the paid-up capital, the free reserves amounts to EUR 504.5 million (31 December2015: EUR 504.1 million), the AGDL reserve amounts to EUR 1.7 million (31 December 2015: EUR 2.2million), and the reserve for the reduction of wealth tax is nil (31 December 2015: nil). The retainedearnings amounts to EUR 41.8 million (31 December 2015: nil).
In number of shares 31/12/2016 31/12/2015
Total number of shares issued 23,798,767 20,136,588Ordinary shares 23,794,431 20,132,547Preference shares 4,336 4,041
Of which: shares entitling the holder to a dividend payment 23,798,767 20,135,744Of which: treasury shares, - 844Of which: shares representing equity under IFRS 23,798,767 20,135,744
Changes Ordinary shares Preference shares Total
Balance as at 01/01/2016 20,132,547 4,041 20,136,588- Reduction of the share capital (Law of 28 July 2014
regarding the immobilisation of bearer shares modifyingthe law of 10 August 1915 as amended)
-621 -200 -821
- Minor discrepancy netting -495 495 -- Capital increase 3,663,000 - 3,663,000Balance as at 31/12/2016 23,794,431 4,336 23,798,767
Note 33 – Result allocation proposal
At its meeting on 23 March 2017, the Board of Directors proposes to allocate the 2016 net result of EUR28,732,355 as follows:
- allocation of EUR 3,405,327 to the legal reserve in order to reach 10% of the paid-up capital afterthe 2016 share capital increase
- allocation of EUR 25,327,028 to the retained earnings.
On 26 April 2017, this affectation will be submitted for the approval of the Annual General Meeting.
Note 34 – Loans commitments, financial guarantees and other commitments
Total assets under management related to clients in the private banking sector (including frozen andlow yielding assets) as at 31 December 2016 amount to EUR 50.8 billion (2015: EUR 48.7 billion).
Total assets under custody (investment funds and institutional) as at 31 December 2016 amount toEUR 18.7 billion (2015: EUR 40.4 billion).
Note 36 – Related party transactions
‘Related parties’ refers to the parent company of KBL epb, its subsidiaries and key managementpersonnel. Transactions with related parties are carried out under conditions equivalent to thoseapplicable to transactions subject to conditions of normal competition.
In EUR million 31/12/2016 31/12/2015
Cash, cash balances at central banks and other demand deposits 0 0of which financial assets with Pioneer Holding(1) - -
with Precision Capital - -with Banque Internationale à Luxembourg 0 0with Associates - -
Financial assets 0 68of which financial assets with Pioneer Holding(1) 0 2
with Precision Capital - 3 with Banque Internationale à Luxembourg 0 63 with Associates - -
Held-for-trading 0 0At fair value through profit or loss - -Available-for-sale financial assets - 2Loans and receivables 0 66Hedging derivatives - -
Financial liabilities 153 433of which financial liabilities with Pioneer Holding(1) 136 343
with Precision Capital 13 76with Banque Internationale à Luxembourg 0 8with Associates 3 6
Income statement -13 -14of which income statement with Pioneer Holding(1) 0 1
with Precision Capital -1 0with Banque Internationale à Luxembourg 1 0with Associates -13 -15
Net interest income 0 0Dividend income 0 0Net fee and commission income -13 -14Other net income / (charges) 0 -Operating expenses -1 0
(1) “Pioneer Holding” amounts include transactions with the ultimate beneficial owner as a private client
- 66 -
WITH KEY MANAGEMENT PERSONNELIn EUR million 31/12/2016 31/12/2015
Amount Number of persons Amount Number of persons
Amount of remuneration to key managementpersonnel of KBL epb group on the basis of theiractivity, including the amounts paid to former keymanagement personnel
The table below gives the solvency ratios calculated in the framework of the EU Parliament & Council,Capital Requirement Regulation (CRR 2013/575).
In EUR million 31/12/2016 31/12/2015
Regulatory capital 651 534
Tier 1 capital 650 527Capital, share premium, reserves and retained earnings 1,072 827Eligible Result 6 25Accumulated other comprehensive income/loss on remeasurement of definedbenefit pension plans -34 -28
Intangible assets and goodwill -292 -289Treasury shares - 0Defined benefit pension fund assets 0 0Deferred tax assets -4 -7Asset Value Adjustment -1 -Significant investments in relevant entities -96 -
Solvency ratiosBasic solvency ratio (Tier 1 ratio) 17.11% 13.78%Solvency ratio (CAD ratio) 17.14% 13.97%
The estimated solvency ratios as at 31 December 2016 including Bank Insinger de Beaufort (see Note 1) ispresented in Note 44 – Events after the balance sheet date.
- 67 -
Note 38 – Maximum credit risk exposure and collateral received to mitigate the risk
(in EUR million) 31/12/2016 31/12/2015
Assets 10,584 10,638Balances at central banks and other demand deposits 1,614 691Financial assets 8,830 9,817
Held-for-trading 554 714At fair value through profit or loss 194 0Available-for-sale financial assets 4,797 4,054Loans and receivables 3,271 5,032Hedging derivatives 14 17
For the instruments carried at fair value, the amounts disclosed above represent the current credit riskexposure and not the maximum credit risk that could apply as a consequence of future changes in theestimates made.
Collateral and guarantee received to mitigate the maximum exposure tocredit risk(in EUR million)
Other collateralized loans 2,033 3,761Cash 216 199Rest (including securities received in reverse repo operations) 1,817 3,561
Financial guarantees received 200 194
Collateral and guarantee received to mitigate the maximum exposure tocredit risk
2,776 4,455
The amount and type of collateral required depend on the type of business considered and the Group’sassessment of the debtor’s credit risk.
The main types of collateral received are as follows:
- Cash;- Securities (in particular for reverse repo operations and securities lending); and- Other personal and/or collateral guarantees (mortgages).
These guarantees are monitored on a regular basis to ensure their market value remains adequate asregards the assets they are intended to cover. If a guarantee is noted to be insufficient, margin calls aremade in accordance with the agreements signed with the various counterparties concerned.
Following the Bank’s request, the CSSF has approved an exemption from including in its calculation ofthe large risks exposures, in accordance with Part IV, article 400 of the EU No 575/2013, the risks towhich the Bank is exposed towards Banque Internationale à Luxembourg and KBL epb's subsidiaries.This exemption is not eligible towards Precision Capital. The exposures on related parties are disclosedin Note 36.
- 68 -
Note 39 – Risk management
This note aims to disclose the ‘nature and risks arising from financial instruments to which the entity isexposed during the period and at the end of the reporting period, and how the entity manages thoserisks’, as required by IFRS 7. The information is presented by risk type as proposed by the standards.
1. Credit risk
1.1. Qualitative information
1.1.1. Origin of credit risk
The credit risks arising from financial instruments mainly originate from:
- lending to private clients (mainly Lombard loans and Mortgage loans). Risk in this activity is largelymitigated by a strong collateral policy, implying limited unsecured exposures;
- positions in ALM portfolios;
- uncommitted lines covering the trading activity and counterparty exposures with banks (forex, moneymarkets, swaps, reverse repo, securities lending, derivatives, etc.);
- the granting of uncommitted lines to clients of the Institutional & Professional Services (IPS) Functionin Luxembourg (mainly UCI), to cover temporary overdrafts;
- the acceptance of securities used as collateral in securities lending and repo transactions.
1.1.2. Credit allocation decision making process / governance
In Luxembourg, as in subsidiaries, all lending/investment decisions and decisions to grant uncommittedlines are the responsibility of the Executive Committee or one of the other competent bodies designatedunder the delegation of authority based on specific criteria. This delegation of powers always requiresthe involvement of at least two people from different entities, to ensure that there is no risk of conflict ofinterest.
A credit authority grid within the credit policy defines the limits for credit decisions within each of thesubsidiaries of the group. Any credit proposal exceeding the defined limits has to be submitted to theGroup Credit Committee (“GCC”) for consideration, with further escalation to the Executive Committeeand/or Board Risk Committee for final decision on those credits which are above the limits of the GCC.
Each new credit proposal submitted to the Group Credit Committee/Executive Committee isaccompanied by an opinion issued by Group Credit Risk Control, based on an analysis of the financialsituation and creditworthiness of the borrower and of the structure of collateral.
Internal processes ensure the identification of related counterparties, in order to monitor concentrationrisk on debtors/group of debtors. Group structures are moreover permanently updated by Group CreditRisk Control.
1.1.3. Credit policy
The credit policy defines the framework within which loan activities to customers are managed in theKBL epb group. It is reviewed/updated on an annual basis. The last version was validated by the BoardRisk Committee(1) (“BRC”) in early 2016.
_________________________(1) The Board Risk Committee or BRC is a sub-Committee of the Board of Directors dedicated to risk issues
- 69 -
1.1.4. Measurement/monitoring of credit risk
Credit risk related to lending activities, investment portfolios or trading activities has to remain within thegeneral framework set in the Risk Appetite Statement validated by the Board Risk Committee.Therefore, specific indicators are reported to the ALCO on a monthly basis and quarterly to the BRC.Special attention is set on concentration risk, being on single issuers, single banking counterparties orcountries.
Group Credit Risk Control has its own system for country and concentration limits, approved by theExecutive Committee and by the Board Risk Committee. This system allows the definition of limitsadapted to the size of the Group and to its risk appetite.
At a regulatory level, KBL epb group uses the standardised Basel III methodology to calculate creditrisk.
1.1.4.1. Loans
In terms of the day-to-day monitoring of lending transactions, the loan administration systemsautomatically monitor the loans and guarantees schedule, which allows any overdraft or collateralshortfall to be detected and the appropriate corrective actions to be taken swiftly.
On a quarterly basis, a global consolidated reporting of all lending exposures is performed, detailing theportfolio by loan type, customers type, countries, maturities and performing status. It also presentsinformation on the effective loan-to-values for the collateralized exposures.
The files for which a specific monitoring is requested are included in the Watchlist which is discussedmonthly in the Group Credit Committee.
1.1.4.2. Investment portfolios
Investment proposals in the portfolios of any entity of KBL epb group are submitted by the Group ALMFunction. All proposals within the Group have to respect the concentration limits, defined by issuer type(Sovereigns, Corporates and Banks), as well as the concerned country limits. The Group Credit RiskControl department checks the availability under those limits before any investment and may adviseagainst any investment based on its own credit risk assessment, supported by comments provided bythe international rating agencies and analysis of the published financial statements.
Group Credit Risk Control automatically monitors debtors’ ratings, as reported by rating agencies, andinforms the entities concerned accordingly. Various types of standard or specific reports are also drawnup in order to monitor any deterioration in the quality of the portfolio.
Any overdraft of issuer concentration limits, due to rating downgrades, is communicated monthly to theALCO, and quarterly to the BRC.
1.1.4.3. Interbank transactions
The set-up and monitoring of interbank limits, which are mainly concentrated in the Luxembourg DealingRoom, is a major activity of Group Credit Risk Control. It covers:
- The maintenance of maximum limits, in line with principles validated by the BRC.
This system defines interbank limits which are commensurate with the size of the Bank and itsrisk appetite. It fully integrates the Large Exposures regulation. Loans outstanding are allocatedto lines according to a standard “marked-to-market + add on” approach.Their update is triggered by changes in one of the influencing factors (ratings, tier 1 capital...);
- The set-up of operational limits (that can only be smaller than maximum limits) that arenecessary to adequately allocate interbank sub-limits across the different products (MoneyMarket, Repo, Securities Lending,…) is processed in accordance with the different desks.The monitoring of exposures and their compliance with operational limits is monitored on a dailybasis by the Group Credit Risk Control department.
- 70 -
1.1.4.4. Collateral monitoring
The management and supervision of collateral received for secured transactions, in addition to contractmanagement, is handled by a dedicated entity of the Function ‘Operations’. Specific guidelines,validated by the Executive Committee, set rules on concentration by counterparties and by securitiesaccepted as collateral, as well as risk correlation limits (correlation between the counterparty and thecollateral). The respect of these rules is monitored on a daily basis by the Group Credit Risk Controldepartment.
1.1.4.5. Country limits
The framework for the definition and monitoring of country limits covers all types of country risks (inparticular that of contagion) and not only the risk of transferability.
Lines are allocated to the Bank and its subsidiaries for credit activities, bonds investments and tradingroom activities (for Luxembourg) as and when required. As for counterparty risk, the respect of the setcountry limits is monitored on a daily basis.
1.1.4.6. Concentration monitoring
As mentioned here above, issuer concentration limits are defined per individual or group of counterparts.These limits are assigned to sovereigns, banks and corporates, using a methodology derived from thecountry limit framework and consider additional financial criteria. Issuer concentration limits are dividedinto sub-limits which preserve diversification both in terms of maturity and products.
The issuer concentration limits are updated and monitored by Group Credit Risk Control. Exceptionreports are escalated to the Group ALCO.
- 71 -
1.2. Quantitative information
1.2.1. Breakdown of credit risk exposures
The distribution of the credit risk exposures (available-for-sale (AFS) financial assets and Loans andReceivables (L&R)) by products is as follows:
In EUR millionAFS
Amortised cost (before impairment) Fair value (after impairment)31/12/2016
In EUR millionLoans and receivables NPL/Impaired Standard Total31/12/2016Banks and other financial institutions 1,220.3 1,220.3Customers 24.0 2,027.1 2,051.1Sub-total 24.0 3,247.4 3,271.4Other L&R and Intercompanies
TOTAL 3,271.4
In EUR millionLoans and receivables
NPL/Impaired Standard Total31/12/2015Banks and other financial institutions - 2,252.9 2,252.9Customers 29.4 2,696.3 2,725.7Sub-total 29.4 4,949.2 4,978.6Other L&R and Intercompanies - -
TOTAL 4,978.6
- 72 -
1.2.2. Specific loan impairment
For the parent company in Luxembourg, which constitutes the largest portion of global exposures, thevaluation of potential losses and the adjustment of specific impairments are carried out quarterly byGroup Credit Risk Control. The Group Credit Committee decides on any adjustment for the first threequarters of the year, while it is the responsibility of the Executive Committee for the fourth quarter.
Subsidiaries submit their proposals for impairments during the quarterly consolidation.
Below are listed specific impairments established in respect of non performing loans and available-for-sale financial assets (debt instruments) as at 31 December 2015 and 2016:
(1) The related assets are impaired but not because of delays in payments.
Main variations on non performing L&R clients gross are linked to (i) the repayment of a client loan (EUR5.7 mln), partially through proceeds of collateral sale and by utilisation of impairment; (ii) the write-off of9 legacy loans by utilisation of the impairment (EUR 9.2 mln); (iii) the full repayment of a non performingmortgage (EUR 1.5 mln) through external refinancing.
Main variations on AFS gross are linked to the exercise of put options embedded in two perpetual bonds.
The loan/loss ratio is as follows:
Loan/Loss ratio (*) 2016 2015
L&R from customers 1bps 1bps
AFS financial assets <0% 0bps
(*) The loan/loss ratio is defined as the net variation of specific and general impairments on the average loan portfolio over theyear.
- 73 -
1.2.3. Concentration of risks
1.2.3.1. By rating(1)
In EUR millionAFS L&R-Banks and other financial institutions
(1) The information on rating is not available as such for Loans and Receivables to customers.
- 74 -
1.2.3.2. Government bonds by countryAvailable-for-sale financial assets Held-for-trading assets
In EUR million31/12/2016 Nominal Carrying
amount
Available-for-salereserve
ImpairmentRelatedhedging
derivativesNominal Carrying
amount
Austria 50.8 54.9 2.7 - - - -Maturing in 2017 11.6 12.0 0.3 - - - -Maturing in 2018 or 2019 30.8 33.1 1.4 - - - -Maturing in 2020 or 2021 6.2 7.2 1.0 - - - -Maturing in 2022 and later 2.2 2.6 0.1 - - - -
Canada 80.4 89.0 1.9 - -5.0 - -Maturing in 2017 - - - - - - -Maturing in 2018 or 2019 11.3 12.0 0.2 - - - -Maturing in 2020 or 2021 19.1 21.1 0.8 - - - -Maturing in 2022 and later 50.0 55.9 0.9 - -5.0 - -
Czech republic 126.5 152.2 2.6 - -20.7 - -Maturing in 2017 37.0 37.5 0.1 - -0.4 - -Maturing in 2018 or 2019 5.0 5.4 0.1 - - - -Maturing in 2020 or 2021 10.0 11.5 0.1 - - - -Maturing in 2022 and later 74.5 97.8 2.2 - -20.3 - -
France 133.5 142.9 3.9 - - 0.3 0.4Maturing in 2017 24.6 24.9 0.1 - - - -Maturing in 2018 or 2019 38.2 41.4 1.6 - - 0.1 0.1Maturing in 2020 or 2021 54.3 58.3 1.8 - - 0.2 0.3Maturing in 2022 and later 16.4 18.2 0.4 - - 0.0 0.0
Germany 53.4 57.3 1.9 - - - -Maturing in 2017 25.3 25.7 0.2 - - - -Maturing in 2018 or 2019 7.7 8.1 0.2 - - - -Maturing in 2020 or 2021 13.4 14.7 0.7 - - - -Maturing in 2022 and later 7.1 8.8 0.8 - - - -
Ireland 131.9 157.4 3.9 - -2.4 0.0 0.0Maturing in 2017 - - - - - - -Maturing in 2018 or 2019 19.3 22.4 0.4 - -2.4 - -Maturing in 2020 or 2021 52.1 62.9 2.4 - - - -Maturing in 2022 and later 60.5 72.1 1.1 - - 0.0 0.0
Italy 381.0 388.2 0.9 - -2.3 - -Maturing in 2017 285.0 285.4 0.1 - - - -Maturing in 2018 or 2019 50.7 54.1 0.6 - -2.0 - -Maturing in 2020 or 2021 45.3 48.7 0.2 - -0.2 - -Maturing in 2022 and later - - - - - - -
Japan 42.3 46.7 1.6 - -2.8 64.2 64.3Maturing in 2017 - - - - - 64.2 64.3Maturing in 2018 or 2019 - - - - - - -Maturing in 2020 or 2021 17.9 19.7 0.7 - -1.2 - -Maturing in 2022 and later 24.4 27.0 0.9 - -1.7 - -
SouthKorea 40.9 43.3 0.2 - -2.0 - -
Maturing in 2017 10.9 11.0 -0.0 - -0.1 - -Maturing in 2018 or 2019 5.1 5.2 0.1 - - - -Maturing in 2020 or 2021 7.8 8.3 0.0 - -0.2 - -Maturing in 2022 and later 17.1 18.8 0.1 - -1.7 - -
Lithuania 57.0 64.3 0.3 - -6.1 - -Maturing in 2017 - - - - - - -Maturing in 2018 or 2019 7.0 7.4 0.0 - - - -Maturing in 2020 or 2021 50.0 57.0 0.3 - -6.1 - -Maturing in 2022 and later - - - - - - -
- 75 -
Luxembourg 32.2 36.3 0.7 - - 0.1 0.1Maturing in 2017 - - - - - - -Maturing in 2018 or 2019 - - - - - - -Maturing in 2020 or 2021 32.2 36.3 0.7 - - - -Maturing in 2022 and later - - - - - 0.1 0.1
The Netherlands 95.4 103.5 3.5 - -3.2 - -Maturing in 2017 36.7 37.4 0.3 - - - -Maturing in 2018 or 2019 18.1 19.2 0.8 - - - -Maturing in 2020 or 2021 - - - - - - -Maturing in 2022 and later 40.7 46.9 2.4 - -3.2 - -
Qatar 178.6 181.5 0.3 - -1.1 - -Maturing in 2017 - - - - - - -Maturing in 2018 or 2019 14.7 16.1 0.0 - -0.9 - -Maturing in 2020 or 2021 74.8 76.1 -0.1 - -0.5 - -Maturing in 2022 and later 89.1 89.3 0.4 - 0.2 - -
Poland 157.0 171.7 1.0 - -10.5 - -Maturing in 2018 or 2019 46.4 50.9 0.5 - -3.4 - -Maturing in 2020 or 2021 58.4 64.0 0.2 - -2.7 - -Maturing in 2022 and later 52.1 56.8 0.3 - -4.4 - -
Portugal 35.0 35.0 0.0 - - - -Maturing in 2017 35.0 35.0 0.0 - - - -
SaudiArabia 44.6 43.3 -0.2 - 1.0 - -
Maturing in 2017 - - - - - - -Maturing in 2018 or 2019 - - - - - - -Maturing in 2020 or 2021 44.6 43.3 -0.2 - 1.0 - -Maturing in 2022 and later - - - - - - -
Slovakia 46.2 50.9 0.8 - -3.7 - -Maturing in 2017 6.1 6.1 0.0 - - - -Maturing in 2018 or 2019 - - - - - - -Maturing in 2020 or 2021 21.2 24.3 0.7 - -2.2 - -Maturing in 2022 and later 19.0 20.6 0.1 - -1.5 - -
Slovenia 35.7 39.9 1.2 - -1.8 2.4 2.8Maturing in 2017 - - - - - - -Maturing in 2018 or 2019 15.7 17.3 0.6 - -0.8 - -Maturing in 2020 or 2021 20.0 22.6 0.5 - -1.0 2.4 2.8
Spain 451.0 464.8 1.9 - -0.6 65.0 65.1Maturing in 2017 322.5 323.3 0.3 - -0.0 65.0 65.1Maturing in 2018 or 2019 51.1 55.4 0.9 - -0.6 - -Maturing in 2020 or 2021 77.4 86.1 0.8 - - - -
Supranational 120.4 126.2 2.9 - -2.3 0.0 0.0Maturing in 2017 41.1 41.8 0.3 - -0.3 - -Maturing in 2018 or 2019 42.6 45.7 0.9 - -2.0 - -Maturing in 2020 or 2021 26.5 28.2 1.6 - - 0.0 0.0Maturing in 2022 and later 10.2 10.6 0.1 - - - -
United Arab Emirates 137.0 139.3 0.6 - -0.8 - -Maturing in 2018 or 2019 8.1 8.9 -0.0 - - - -Maturing in 2020 or 2021 50.3 51.7 0.1 - -1.3 - -Maturing in 2022 and later 78.6 78.7 0.6 - 0.4 - -
Rest 96.8 103.8 2.3 - -0.0 1.8 1.7Maturing in 2017 13.3 13.6 0.1 - - - -Maturing in 2018 or 2019 23.2 24.7 0.5 - - - -Maturing in 2020 or 2021 57.2 62.0 1.1 - -0.0 1.8 1.7Maturing in 2022 and later 3.1 3.6 0.6 - - - -
TOTAL 2,527.3 2,692.3 34.9 - -64.4 133.9 134.4
- 76 -
In EUR million31/12/2015 Nominal Carrying
amount
Available-for-salereserve
ImpairmentRelatedhedging
derivativesNominal Carrying
amount
Austria 109.5 121.5 7.2 - - - -Maturing in 2016 - - - - - - -Maturing in 2017 or 2018 62.2 67.3 3.3 - - - -Maturing in 2019 or 2020 45.2 51.7 3.5 - - - -Maturing in 2021 and later 2.1 2.5 0.5 - - - -
Belgium 139.1 148.3 4.2 - -0.9 - -Maturing in 2016 69.4 71.0 0.3 - -0.9 - -Maturing in 2017 or 2018 36.0 39.2 1.0 - - - -Maturing in 2019 or 2020 29.7 33.4 2.2 - - - -Maturing in 2021 and later 4.1 4.7 0.6 - - - -
Canada 75.1 81.7 1.3 - -3.8 - -Maturing in 2016 - - - - - - -Maturing in 2017 or 2018 - - - - - - -Maturing in 2019 or 2020 25.1 27.4 0.8 - - - -Maturing in 2021 and later 50.0 54.3 0.5 - -3.8 - -
Czech republic 25,0 29.2 0.6 - -3.3 - -Maturing in 2016 - - - - - - -Maturing in 2017 or 2018 5.0 5.6 0.2 - - - -Maturing in 2019 or 2020 - - - - - - -Maturing in 2021 and later 20.0 23.6 0.4 - -3.3 - -
France 122.1 132.9 4.5 - - 0.9 1.1Maturing in 2016 10.9 11.1 0.0 - - - -Maturing in 2017 or 2018 64.3 69.5 2.7 - - - -Maturing in 2019 or 2020 18.8 20.2 0.5 - - 1.0 1.1Maturing in 2021 and later 28.0 32.1 1.2 - - -0.0 -0.0
Germany 70.7 75.6 2.5 - - - -Maturing in 2016 22.2 22.6 -0.1 - - - -Maturing in 2017 or 2018 30.9 32.9 1.1 - - - -Maturing in 2019 or 2020 9.4 10.0 0.5 - - - -Maturing in 2021 and later 8.1 10.1 1.0 - - - -
Ireland 117.8 138.5 5.5 - -3.1 0.0 0.0Maturing in 2016 5.0 5.1 0.0 - - - -Maturing in 2017 or 2018 45.7 51.3 4.1 - - - -Maturing in 2019 or 2020 67.1 82.2 1.4 - -3.1 0.0 0.0Maturing in 2021 and later - - - - - 0.0 0.0
Italy 102.2 110.9 4.5 - -2.9 225.0 225.0Maturing in 2016 2.2 2.2 0.0 - - 225.0 225.0Maturing in 2017 or 2018 80.0 87.1 4.3 - -1.7 - -Maturing in 2019 or 2020 20.0 21.6 0.2 - -1.2 - -Maturing in 2021 and later - - - - - - -
Japan 22.9 25.5 1.0 - -1.5 - -Maturing in 2016 - - - - - - -Maturing in 2017 or 2018 - - - - - - -Maturing in 2019 or 2020 - - - - - - -Maturing in 2021 and later 22.9 25.5 1.0 - -1.5 - -
Total 4.2 3,913.6 3,917.8 232.4 2,017.4 - 2,249.8 2,725.7
(1) Out of which reverse repos: EUR 297.2 million(2) Out of which reverse repos: EUR 290.0 million
- 80 -
2. Market Risk: Trading Risk
2.1. Qualitative information
2.1.1. Origin of trading risk
KBL epb group being Private Banking oriented, its trading activity mainly aims to support the corebusiness activities. The trading positions reflect the necessary intermediation of the Head Office‘sDealing Room, supporting client flows of the Group in terms of debt instruments, equity instruments,structured products, forex and deposits. Most of the instruments used by the Dealing Room are plainvanilla.
2.1.2. Trading risk policy
The risks incurred therefore are mainly short-term interest rate risk (treasury in the currencies of clients),medium/long-term interest rate risk (bond trading, particularly in EUR), price volatility risk (trading instructured products sold to private clients) and forex risk (spot and forward exchange rates in the liquidcurrency pairs used by clients)). Forex risk is the only trading activity for which subsidiaries are allowedto carry some residual positions relating to their customers’ flows.
2.1.3. Trading decision making process / governance
Trading activities are concentrated in Luxembourg. According to the Risk Appetite Statement, theprimary limits are granted by the Board Risk Committee.
2.1.4. Measurement and monitoring of trading risk
The system of primary limits in place at KBL epb is based on:
- nominal amounts for the Forex and Structured Products activities,
- 10 bpv, Historical Value at Risk (HVaR) and stressed HVaR limits for activities subject to interest raterisk (Treasury and Bond Desks).
These primary limits are supplemented by a structure of secondary limits allowing a more detailedanalysis of the trading risks. Those secondary limits consist in concentration limits by currency and bytime bucket as well as in limits by issue and issuer, based on their rating or on their market liquidity.
The whole limit framework is complemented with a diversified HVaR covering all activities and a 30days rolling Stop Loss trigger set per trading desk.
2.1.5. Concentration Risk
Issuer concentration risk is strictly governed by conservative limits restricting the trading in non-investment grade debts and in illiquid equities, which leads to a well diversified trading portfolio.
As at 31 December 2016, the trading activity was diversified on 102 Corporate and Financial issuerswith an average outstanding of +/- EUR 0.5 million, and a maximum exposure of EUR 2.88 millions onGoldman Sachs Group.
The evolution of exposures related to each activity compared with their respective limits (primary andsecondary), as well as the economic results and highlights, are reported daily to the Heads of GlobalMarkets and of the Group Risk Control Function. They are also weekly reported to the KBL epbExecutive Committee, on a monthly basis to the ALCO and on a quarterly basis to the Group Board RiskCommittee.
- 81 -
2.2. Quantitative information
As at 31 December 2015 and 2016, the usage of limits in the Trading activities is as follows (KBL epbgroup):
LimitOustanding Maximum
observed in2016
Averageobserved in
2016
Oustanding
In EUR million 31/12/2015 31/12/2016
Treasury [10bpv](1) 2.5 0.9 2.3 1.4 1.5
[HVaR](2) 3 1.5 2.7 1.9 1.9
Bond [10bpv](1) 0.8 0.1 0.3 0.1 0.1
[HVaR](2) 1 0.4 0.9 0.4 0.4(1) BPV 10 bps oustanding corresponds to the sum in abs value of the BPV 10 bps in each currency(2) HVaR corresponds to a 99% historical 10 days loss over the last 250 trading days.
Limit inNominal
Amount (3)
Oustanding Maximumobserved in
2016
Averageobserved in
2016
Oustanding
In EUR million 31/12/2015 31/12/2016
Forex (bullions included) 20.0 2.9 6.1 2.9 2.3
Structured Product 110.0 50.2 132.2 63.1 72.1
Outstanding in each activity remained below the authorised limits over the year 2016, except for 1occasional case: 1 day overrun by EUR 22.2 mln of the structured products limit, which wasconsecutive to the pre-booking of a purchase order for the client of a subsidiary.
The HVaR observed as at end of year 2016 for trading risk amounted to EUR 2.6 mln, well below thelimit of EUR 10 mln.
3. Market Risk : ALM Risk
3.1. Qualitative information
3.1.1. Origin of ALM risks
The core activities of a private bank entail little ALM risks(2) compared to a retail bank: most of the clientassets under management are securities or funds which are off-balance sheet items inducing no ALMrisks. Most short-term client cash deposits offer variable rates linked with money market rates and thesame applies to Lombard/mortgage loans to customers. When fixed rates are granted for loans, hedgingswaps are contracted.
As a consequence, ALM risks are mainly entailed by security portfolios set up within the frame of theALM policy being:
- portfolio of high grade bonds dedicated to the reinvestment of the free capital, and of the most stablepart of fixed rate sight deposits and savings accounts;
- portfolios dedicated to the reinvestment of other stable liquidities, looking for the right balancebetween interest rate risk, credit spread risk and return.
____________________________(2) The ALM risk is defined as the market risks induced by the balance sheet, except the trading activity
- 82 -
The ALM equity risk is induced by an investment portfolio invested in direct lines of equities or in UCIshares. The portfolio held in KBL epb (Luxembourg) is managed along Group ALCO’s guidelines. Someequities portfolios exist in the subsidiaries, in order to meet specific needs (pension obligations in MerckFinck & Co a.o.). Transactions in these portfolios are performed after validation of the local managementand of Group ALM.
KBL epb group is not exposed to any ALM forex risk as no active foreign exchange exposure is taken(assets are funded in their respective currencies).
3.1.2. ALM decision making process/governance
The ultimate responsibility for the ALM activity of KBL epb group is held by the monthly Group ALCOCommittee, which is an Executive Committee extended to the representatives of the Group ALM &Treasury Function, of the Group Risk Control Function, of Global Markets, of Finance, in addition to theChief Investment Officer.
The ALCO validates a.o. strategies in terms of management of the gap between resources andutilisations, in terms of Return on Equity enhancement, management of the structural liquidity andmitigation of the related risks.
Those strategies are proposed by the Group ALM & Treasury Function which has the responsibility forthe preparation of the ALCO meetings, a.o for the topics which are submitted to its decisions. TheFunction is also in charge of the day-to-day implementation of the ALCO decisions. When they have aGroup dimension, it has to ensure their implementation within the limits of the governance constraintsin place.
Under this structure, the Group Risk Control Function endorses a role of second level control entity,issuing opinions on the proposals and monitoring the risks related to the ALM activity on a recurringbasis.
3.1.3. ALM policy
A document entitled ‘Investment Policy and ALM framework’ describes a.o. the ALM objectives,governance and constraints (credit risk, liquidity,…). It is in line with the Risk Appetite Statementexpressed by the Board of Directors (see below).
3.1.4. Measurement and monitoring of ALM risks
The Risk Appetite Statement, at least reviewed on a yearly basis, expresses the Board of Directors’ riskappetite for ALM interest rate risk, credit spread risk and equity risk, mainly through limits on Value atRisk indicators, sensitivity measures and global outstanding at KBL epb group level.
Regarding the interest rate risk, the following limits apply:
- the regulatory 200 bpv (basis point value) limit for all banking book positions. While the regulatorylimit amounts to 20% of own funds, the BRC limit has been fixed at 18%; the 200 bpv sensitivityequals 12.3% of own funds as at 31 December 2016 (31 December 2015: 11.7%);
- The Interest Rate Value at Risk 99% - 1 year, which amounts to EUR 39 mln as at 31 December2016 (31 December 2015: EUR 33 mln). The related Risk Appetite limit has been set for KBL epbGroup to EUR 150 mln for KBL epb group.
- To be noted that in 2016, two additional limits have been implemented at Group level, taking intoaccount the sensitivity of the bank’s interest margin to interest rates changes, in order to addressnew standards issued by the Basel Committee on Banking Supervision (BCBS):(i) an interest earning at risk indicator consecutive to a parallel shift of the interest rate curve by
200 bpv, which amounts to EUR -5.5 mln (as at end of 2016) at consolidated level, for a RiskAppetite limit of EUR -60 mln
- 83 -
(ii) an interest earning at risk indicator reflecting the outcome of the worst case scenario (betweenparallel shifts by 100 bpv, 200 bpv, or scenarios of up, down, steepening, flattening movements)of the interest rate curve, which amounts to EUR -24.8 mln (as at end of 2016) for a Risk Appetitelimit of EUR -60 mln.
Regarding the equity (price) risk, the Risk Appetite is expressed in terms of maximum Value at Risk,stop losses and maximum size for listed equities and for alternative equity investments for the wholeGroup.
The Equity Value at Risk 99% - 1 year amounts to EUR 51 million as at 31 December 2016 (EUR 35million as at 31 December 2015) for a Risk Appetite limit of EUR 150 million for KBL epb group.
3.2. Quantitative information
3.2.1. Interest rate
The sensitivity of the economic value of the balance sheet to interest rates (impact of a parallelincrease by 1% of the interest risk curve) is as follows for KBL epb group:
The sensitivity of the interest margin of KBL epb group to the interest rates (impact of a parallelincrease by 1 % of the interest rate risk curve) is as follows:
In EUR millionLessthan 3months
Between 3monthsand 1 year
Between1 yearand 3years
Between3 yearsand 5years
Morethan 5years
TotalimpactSensitivity 100 bpv Shift
31/12/2016
Financial assets -4.0 -3.9 -10.9 -11.9 -8.8 -39.6
Financial liabilities 5.0 2.7 6.9 6.6 7.3 28.5
Net impact 1.0 -1.3 -4.0 -5.4 -1.4 -11.1
In EUR millionLessthan 3months
Between 3monthsand 1 year
Between1 yearand 3years
Between3 yearsand 5years
Morethan 5years
TotalImpact
Sensitivity 100 bpv Shift31/12/2015
Financial assets -4.2 -4.6 -14.7 -11.3 -6.1 -41.0
Financial liabilities 4.9 2.7 8.8 6.1 5.5 27.9
Net Impact 0.6 -1.9 -5.9 -5.2 -0.6 -13.0
- 85 -
3.2.2. Equity Risk
3.2.2.1. Sensitivity of equity risk
Regarding the equity risk, the impact of a decrease of 25 % on both the income statement (impairment)and the equity AFS revaluation reserve (excluding Equity instruments at cost) is as follows for KBL epbgroup:
Income statement impact (impairment) - -1,016 -1,016
(1) Some Equity instruments classified as available-for-sale financial assets are not covered here.
The global ALM equity exposure increased in 2016, mainly due to the additional investment of EUR 20mn in trackers decided by the Group ALCO Committee.
3.2.2.2. Concentration of equity risk
The decision to increase/decrease the proportion of equity in the ALM portfolio is taken at the ALCOlevel (within the limits agreed by the BRC) taking into consideration macro and fundamental analysis aswell as convictions from the Group Asset Allocation Committee. Such analysis also influences therelative weights of Europe, USA and Emerging Markets. Within the various regions, an adequatesectorial diversification is looked for. Concentration limits are expressed in absolute amounts and inpercentage of daily volume traded.
Next to this strategic investment policy, the Bank also acts as seed investor when new home investmentfunds are launched.
Following the principles presented above, the breakdown of the whole Equity portfolio of KBL epb group(direct lines and Funds) per nature and per region shows a prominent pan-European part as at end ofDecember 2016:
- 86 -
In EUR millionREGION / NATURE 31/12/2016
Europe (Equity Funds + direct lines) 48.3 44%
Europe (Diversified Funds) 6.1 6%
Europe (Fixed Income Funds) 1.5 1%
World (Equity Funds + direct lines) - -
World (Diversified Funds) 54.3 49%
World (Fixed Income Funds) 0.0 0%United States (Equity Funds + directlines) - -
United States (Fixed Income Funds) 0.0 0%
Asia (Equity Funds + direct lines) - -
TOTAL 110.2 100%
Other Equities 47.1
Total Equities portfolios 157.3
There are no direct lines in listed equities in total Equity portfolio as at 31 December 2016, in line withGroup ALCO decisions.
Furthermore, as at 31 December 2016, the individual exposures entailing equity risk do not exceedEUR 25 mln per Fund and EUR 20 mln per direct line for non listed equities (with historical positionsbeing the most significant).
4. Liquidity risk
4.1. Qualitative information
4.1.1. Origin of liquidity risk
The Bank as a Group has a large and stable funding base due to the natural accumulation of depositsfrom its two core businesses: Private Banking and Institutional & Professional Services (IPS), which onthe other hand consume relatively little liquidity. The overall funding gap is structurally and globallypositive and KBL epb group is a net lender recycling structural liquidity positions in the interbank market.
4.1.2. Liquidity decision making process/governance
Like for Assets and Liabilities Management, the Group ALCO Committee has the final responsibilityfor the Liquidity Management of KBL epb group. The Group ALM Function proposes strategies – withthe approval of the local Management/ALCO Committee - for the management of long term liquidity(putting, a.o. a strong emphasis on ECB eligible as well as Basel III eligible bonds), while the short termliquidity management is delegated to the Treasurer within strict limits (see trading risk above).
The Group Risk Control Function acts as a second level control entity, issuing opinions on investmentproposals and monitoring liquidity risk on a daily basis (through a set of indicators briefly described insection 4.1.4).
4.1.3. Liquidity policy
The current policy applied by KBL epb group is to centralise the placement of all liquidity surpluses atthe Head Office level. However, when local regulatory constraints exist (large exposures regime, liquidityconstraints), the subsidiaries’ liquidity is collateralized or is reinvested in local ALM portfolios under thesupervision of both Group ALM and Group Risk Control.At the Head Office, the stable part of global funding is reinvested in ALM portfolios following aconservative strategy (a.o. respecting minimum European Central Bank/Basel III eligibility and ratingcriteria) and the unstable part of global funding is replaced in the short-term interbank market, largelythrough reverse repo transactions.
- 87 -
4.1.4. Measurement and monitoring of liquidity risk
The Board Risk Committee has expressed its Risk Appetite in terms of liquidity risk, by imposing limitsfor each entity of the Group on the Basel III ratios (LCR and NSFR), and on the Liquidity Excess resultingfrom internal stress tests. The latter are run on a quarterly basis with the aim to assess the ability of KBLepb group to survive a severe liquidity crisis during a 3-month time period without affecting its businessmodel.
As the excess liquidity throughout the Group is centralised at KBL epb’s Treasury Department (underregulatory constraints), KBL epb’s operational liquidity situation is daily monitored by Group Market RiskControl through operational liquidity indicators and reported to the Group Treasurer. Main operationalindicators are:
- a contractual liquidity gap of up to five days, as if the activity was to be continued (no stress test).This report is also sent to the BCL;
- the stock of available liquid assets;
- a daily estimate of the Basel III Liquidity Coverage Ratio, which stood at 105.0% for KBL epb as at31 December 2016 (for a regulatory limit of 80% as at 01/01/2017). The ratio stood at 113.3 % forKBL epb group;
- the value of quantitative indicators, which can potentially trigger the Liquidity Contingency Plan (thePlan consists in various actions depending on the gravity - minor, major - of the liquidity crisis).
As far as structural indicators are concerned, the ‘Private Banking customers Loan-to-Deposit ratio(LTD) is computed on a monthly basis for KBL epb group. As at 31st December 2016, it stood at 33.3%,confirming the excellent liquidity situation of the Group as natural deposit collector.
In addition, liquidity stress tests are run on a quarterly basis with the aim to assess the ability of KBLepb group to survive a severe liquidity crisis during a 3-month time period without affecting its businessmodel.
- 88 -
4.2. Quantitative information
4.2.1. Maturity analysis of liquid stock
The maturity analysis of financial assets held for managing liquidity risk (unencumbered marketableassets) is as follows:
In EUR millionStock ofavailableassets
Lessthan
3 months
Between3 months
and1 year
Between 1year and3 years
Between 3years and
5 years
Morethan 5years
Marketable assets
31/12/2016
Initial stock of available assets 5,208.4 4,283.7 3,039.6 1,978.1 755.7CB eligible 3,689.1 -717.6 -1,020.0 -778.2 -781.3 -452.2
The concentration risk the Bank is facing in terms of liquidity is twofold:
- potential concentration in assets in which the excess liquidity is reinvested: this risk is monitoredaccording to the credit risk limit system (as described above);
- potential concentration in funding sources: this risk is monitored through 2 indicators that arequarterly reported to the BRC :
. relative weight of the top 20 private client deposits for KBL epb group,
. list of all significant counterparties in terms of funding sources (>1% of total liabilities, according toBasel III definition).
The following table shows consolidated information distributed by European Members and thirdcountries. It is worth to note that KBL and its subsidiaries haven’t received any public subsidies.
(1) number of employees on a full time equivalent basis.
- 92 -
Note 42 – List of significant subsidiaries and associates
COMPANY COUNTRY CAPITALHELD SECTOR
KBL European Private Bankers S.A. Luxembourg 100.00% Bank
FULLY CONSOLIDATED SUBSIDIARIES (global method)
Banque Puilaetco Dewaay Luxembourg S.A. Luxembourg 100.00% BankBrown, Shipley & Co. Limited United Kingdom 100.00% Bank
The Roberts Partnership United Kingdom 100.00% Other - financialCawood Smithie & Co Limited United Kingdom 100.00% Other - financialFairmount Pension Trustee Limited United Kingdom 100.00% Other - financialFairmount Trustee Services Ltd United Kingdom 100.00% Other - financialSlark Trustee Company Ltd United Kingdom 100.00% Other - financialWhite Rose Nominees Ltd United Kingdom 100.00% Other - financialHampton Dean Holdings Limited United Kingdom 100.00% Other - financial
Hampton Dean Limited United Kingdom 100.00% Other - financialKBL Immo S.A. Luxembourg 100.00% Real estate
Rocher Ltd Isle of Man 100.00% Real estateS.C.I. KBL Immo III Monaco 100.00% Real estate
Plateau Real Estate LTD Isle of Man 100.00% Real estateSCI KBL Immo II Monaco 100.00% Real estate
KBL Monaco Private Bankers Monaco 100.00% BankS.C.I. KBL Immo I Monaco 100.00% Real estateKBL Monaco Conseil et Courtage en Assurance Monaco 100.00% Insurance
ASSOCIATESEFA Partners S.A. (1) Luxembourg 52.70% HoldingEuropean Fund Administration S.A. (1) Luxembourg 48.58% Fund administration
NON-CONSOLIDATED COMPANIESKBL European Private Bankers S.A.
Forest Value Investment Management S.A. Luxembourg 25.60%Merck Finck & Co.
Steubag G. Betriebsw. & Bankendienst. GmbH Germany 100.00%
(1) Despite the ownership percentage, KBL epb does not exercise control or joint control over EFA Partners S.A. or EuropeanFund Administration S.A.. These two companies are thus considered as associates over which KBL epb exercises asignificant influence and are equity reported.
- 93 -
Note 43 – Main changes in the scope of consolidation
COMPANY COUNTRY CAPITALHELD SECTOR
EXIT FROM SCOPE OF CONSOLIDATIONKBL European Private Bankers S.A.
Horacio sarl Luxembourg 100.00% Real EstateKBL Informatique G.I.E. Luxembourg 100.00% IT
KBL Richelieu Banque Privée S.A.S.E.V. France 100.00% Other - CommercialKBLR INVEST 2 France 100.00% Management (Funds, Pensions, Portfolios)KBLR INVEST 3 France 100.00% Management (Funds, Pensions, Portfolios)
MERGE IN SCOPE OF CONSOLIDATIONKBL Beteiligungs A.G. with Merck Finck & Co Germany 100.00% Holding
On 31 December 2016, KBL epb acquired the shares of Bank Insinger de Beaufort (IdB), a Dutchprivate bank founded in 1779. As of 1 January 2017, IdB became a 100% subsidiary of KBL epb.
Thus, Insinger de Beaufort is not included in the KBL epb group consolidated accounts as at 31December 2016. Subject to approval by the relevant regulatory authorities and other stakeholders, KBLepb intends to merge Insinger de Beaufort and Theodoor Gillissen in mid-2017.
Please find hereafter an overview of the solo accounts of IdB and an estimation of this acquisition onthe consolidated solvency ratio of KBL epb group:
Aggregated view of the solo accounts
ASSETS (in EUR million) 31/12/2016
Cash, cash balances at central banks and other demand deposits 279Financial assets 1,076
Held-for-trading 0Available-for-sale financial assets 43Loans and receivables 960Held-to-maturity investments 72
Tax assets 7Property and equipment 2Goodwill and other intangible assets 84Other assets 16
TOTAL ASSETS 1,464
EQUITY AND LIABILITIES (in EUR million) 31/12/2016
Estimated solvency ratios of KBL Group including Bank Insinger de Beaufort within the scopeof consolidation as at 31 December 2016
In EUR million 31/12/2016ESTIMATED
31/12/2016REALITY(1)
Regulatory capital 623 651Tier 1 capital 623 650Tier 2 capital 1 1
Risk weighted assets 3,889 3,799
Solvency ratiosBasic solvency ratio (Tier 1 ratio) 16.00% 17.11%Solvency ratio (CAD ratio) 16.03% 17.14%
(1) Please refer to note 37.
There was, after the closing date, no other significant event requiring an update of the providedinformation or adjustments in the annual accounts as of 31 December 2016.