KBW's list of potential takeover targets of Real Estate Investment Trusts
18
Equity REITs April 8, 2011 "Hey, You Never Know....?" - Closer Look at REIT M&A & Potential Targets Summary--A few months ago we did not expect much public-to-public merger activity in the REIT space. Now after two larger merger transactions—ProLogis/AMB Property (industrial) and Ventas/Nationwide Health Properties (healthcare)—we are rethinking our views. Perhaps, there are more possibilities and combinations that may, in fact, come to fruition. We have developed an interactive M&A screener (excel) to identify potential targets based on ranking select criteria. We have also taken results from the quantitative list, and based on KBW REIT Research modifications, identified a potential target list (24 names). We expect a pick up in M&A over the next 18-24 months. Key Points-- ■ M&A Trends - We continue to believe that public real estate companies will represent a larger part of the commercial real estate pie over the next several years. The cost and access to capital pendulum has swung in REITs favor. Given the cost of capital advantage we expect more transaction activity to be commercial real estate, currently held in private hands, to be acquired by REITs and publicly traded real estate companies—with some select public-public merger activity. We highlight in more detail driving forces behind more potential combinations including cost of capital advantage for some companies vs. others, NAV and multiple differentiation, and companies with older senior management without obvious succession plans. We believe boards and managements may have a new perspective on the cyclical nature of things after surviving the financial crisis and with REIT stocks total return of over 200% since '09 low, selling the company into lower interest rate environment might be viewed more appropriate, after surviving the downturn, than would have otherwise. While we do not expect a wave of activity -- we do expect increased volume. ■ KBW REIT M&A Screener - We have compiled a variety of data for the 100+ REITs that we track to include the following: CEO age, change of control payout for Chairman/CEO, relative underperformance vs. REIT subsector, G&A % of revenues, geographic footprint (above avg., avg, below avg), etc.—developing a more quantitative approach to identifying potential M&A targets. The screener weighs the various data points to produce a ranking of possible takeout candidates. Since we based the derivation of the criteria on the two most recent mergers, recent target acquisitions PLD and NHP screened number 3 and 9, respectively, on the list—using KBW's default assumptions. ■ KBW Analyst Takeout List - Our KBW REIT Research team made some adjustments to the M&A screener—narrowing the list to 24 potential targets. This excluded companies that we did not believe are likely sellers or for other factors, or by adding a company that may not have shown up on the screener—where KBW REIT Research viewed more probable target. While we certainly do not believe that there will be nearly this many potential transactions, we think that the probability of takeout situations stacks up more favorably for this potential list than others. ■ Note: For all companies in this report not rated by KBW, all data reflects information obtained from Bloomberg and publicly filed documents. Inclusion of non-covered companies in this screener is provided for illustrative purposes, does not contain KBW estimates, and should not be considered stock recommendations. Additionally, across-the-board assumptions are applied to all companies in this screener. ■ Please view PDF for full version of this report. Industry Update Sheila McGrath 212-887-7793 [email protected]Nathan Crossett 212-887-3810 [email protected]KBW REIT Research 212-887-7777 [email protected]Please refer to important disclosures and analyst certification information on pages 16 - 18.
Transcript
Equity REITs April 8, 2011
"Hey, You Never Know....?" - Closer Look at REIT M&A & Potential Targets
Summary--A few months ago we did not expect much public-to-public merger activity inthe REIT space. Now after two larger merger transactions—ProLogis/AMB Property(industrial) and Ventas/Nationwide Health Properties (healthcare)—we are rethinking ourviews. Perhaps, there are more possibilities and combinations that may, in fact, come tofruition. We have developed an interactive M&A screener (excel) to identify potentialtargets based on ranking select criteria. We have also taken results from the quantitativelist, and based on KBW REIT Research modifications, identified a potential target list (24names). We expect a pick up in M&A over the next 18-24 months.
Key Points-- M&A Trends - We continue to believe that public real estate companies will representa larger part of the commercial real estate pie over the next several years. The cost andaccess to capital pendulum has swung in REITs favor. Given the cost of capitaladvantage we expect more transaction activity to be commercial real estate, currentlyheld in private hands, to be acquired by REITs and publicly traded real estatecompanies—with some select public-public merger activity. We highlight in moredetail driving forces behind more potential combinations including cost of capitaladvantage for some companies vs. others, NAV and multiple differentiation, andcompanies with older senior management without obvious succession plans. Webelieve boards and managements may have a new perspective on the cyclical nature ofthings after surviving the financial crisis and with REIT stocks total return of over200% since '09 low, selling the company into lower interest rate environment might beviewed more appropriate, after surviving the downturn, than would have otherwise.While we do not expect a wave of activity -- we do expect increased volume.
KBW REIT M&A Screener - We have compiled a variety of data for the 100+REITs that we track to include the following: CEO age, change of control payout forChairman/CEO, relative underperformance vs. REIT subsector, G&A % of revenues,geographic footprint (above avg., avg, below avg), etc.—developing a morequantitative approach to identifying potential M&A targets. The screener weighs thevarious data points to produce a ranking of possible takeout candidates. Since we basedthe derivation of the criteria on the two most recent mergers, recent target acquisitionsPLD and NHP screened number 3 and 9, respectively, on the list—using KBW'sdefault assumptions.
KBW Analyst Takeout List - Our KBW REIT Research team made someadjustments to the M&A screener—narrowing the list to 24 potential targets. Thisexcluded companies that we did not believe are likely sellers or for other factors, or byadding a company that may not have shown up on the screener—where KBW REITResearch viewed more probable target. While we certainly do not believe that therewill be nearly this many potential transactions, we think that the probability of takeoutsituations stacks up more favorably for this potential list than others.
Note: For all companies in this report not rated by KBW, all data reflects informationobtained from Bloomberg and publicly filed documents. Inclusion of non-coveredcompanies in this screener is provided for illustrative purposes, does not contain KBWestimates, and should not be considered stock recommendations. Additionally,across-the-board assumptions are applied to all companies in this screener.
Please refer to important disclosures and analyst certification information on pages 16 - 18.
Exhibit 1: Companies Mentioned
Prices as of 4/6/2011. Source: KBW Research and SNL.
Company Ticker Closing Price Rating Company Ticker Closing Price Rating
Alexandria Real Estate Equities, Inc. ARE $78.49 Outperform Pennsylvania Real Estate Investment Trust PEI $14.07 Market PerformBioMed Property Trust Inc. BMR $18.98 Not Rated Simon Property Group SPG $107.32 Market PerformBoston Properties, Inc. BXP $95.87 Market Perform Taubman Centers TCO $53.50 Market PerformBrandywine Realty Trust BDN $12.24 Not Rated Tanger Factory Outlet Cetners SKT $25.72 Market PerformCorporate Office Properties Trust OFC $36.12 Outperform Westfield Group WDC.AU $9.35 OutperformDouglas Emmett, Inc. DEI $19.10 Not Rated Acadia Realty Trust AKR $19.11 Market PerformGovernment Properties Income Trust GOV $27.26 Not Rated Agree Realty Corp. ADC $22.44 Not RatedHighwoods Properties, Inc. HIW $35.09 Not Rated Cedar Shopping Centers CDR $6.17 Not RatedCommonWealth CWH $25.72 Not Rated Developers Diversified Realty DDR $13.94 Not RatedHudson Pacific Properties, Inc. HPP $14.38 Not Rated Equity One, Inc. EQY $18.93 Market PerformKilroy Realty Corporation KRC $39.25 Not Rated Excel Trust, Inc. EXL $11.85 Not RatedMack-‐Cali Realty Corporation CLI $33.29 Market Perform Federal Realty Investment Trust FRT $81.33 Not RatedMaguire Properties, Inc. MPG $3.40 Not Rated Inland Real Estate Corp. IRC $9.45 Not RatedParkway Properties, Inc. PKY $17.50 Not Rated Kimco Realty Corp. KIM $17.99 Not RatedSL Green Realty Corp. SLG $77.40 Not Rated Kite Realty Group KRG $5.26 Not RatedVornado Realty Trust VNO $88.59 Market Perform Ramco-‐Gershenson Properties Trust RPT $12.72 OutperformDuke Realty Corporation DRE $14.01 Not Rated Regency Centers Corp. REG $43.82 Not RatedLiberty Property Trust LRY $33.34 Market Perform Saul Centers, Inc. BFS $44.29 Market PerformMission West Properties, Inc. MSW $6.50 Not Rated Urstadt Biddle Properties Inc. UBA $19.39 Not RatedPS Business Parks, Inc. PSB $58.92 Not Rated Weingarten Realty Investors WRI $24.95 Market PerformAMB Property Corporation AMB $36.16 Not Rated Extra Space Storage Inc. EXR $20.05 Market PerformDCT Industrial Trust Inc. DCT $5.50 Outperform Public Storage, Inc. PSA $110.77 Market PerformEastGroup Properties, Inc. EGP $44.07 Not Rated Sovran Self Storage, Inc. SSS $39.71 Not RatedFirst Industrial Realty Trust, Inc. FR $12.13 Not Rated U-‐Store-‐It Trust YSI $10.44 Not RatedFirst Potomac Realty Trust FPO $16.01 Market Perform Ashford Hospitality Trust Inc. AHT $11.38 Market PerformMonmouth Real Estate Inv. Co. MNR $8.29 Not Rated Chesapeake Lodging Trust CHSP $17.52 Not RatedProLogis PLD $16.15 Not Rated Chatham Lodging Trust CLDT $16.26 Not RatedTerreno Realty Corp TRNO $16.95 Not Rated DiamondRock Hospitality Co. DRH $11.11 Market PerformCapLease, Inc. LSE $5.42 Market Perform FelCor Lodging Trust Incorporated FCH $6.33 Market PerformEntertainment Properties Trust EPR $46.12 Not Rated Hersha Hospitality Trust HT $6.07 OutperformGetty Realty Corp. GTY $24.56 Not Rated Hospitality Properties Trust HPT $23.69 OutperformLexington Realty Trust LXP $9.44 Outperform Host Hotels & Resorts HST $17.00 Market PerformNational Retail Properties, Inc. NNN $26.05 Not Rated LaSalle Hotel Properties LHO $26.94 Not RatedOne Liberty Properties, Inc. OLP $15.30 Not Rated Pebblebrook Hotel Trust PEB $21.61 Not RatedRealty Income Corporation O $35.05 Not Rated Strategic Hotel Capital, Inc. BEE $6.39 OutperformApartment Investment and Mgmt. Co. AIV $25.56 Market Perform Sunstone Hotel Investors, Inc. SHO $9.96 OutperformAssociated Estates Realty Corporation AEC $16.26 Market Perform Plum Creek Timber Company, Inc. PCL $43.74 Market PerformAvalonBay Communities Inc. AVB $120.10 Outperform Potlatch Corp. PCH $40.49 Market PerformBRE Properties, Inc. BRE $47.62 Outperform Weyerhaeuser Company WY $24.12 Not RatedCamden Property Trust CPT $57.43 Market Perform Rayonier Inc. RYN $63.96 OutperformColonial Properties Trust CLP $19.28 Market Perform Cogdell Spencer Inc. CSA $6.15 Not RatedEquity Residential EQR $56.30 Market Perform HCP, Inc. HCP $37.56 Market PerformEssex Property Trust, Inc. ESS $125.80 Market Perform Health Care REIT, Inc. HCN $52.74 Not RatedHome Properties, Inc. HME $59.87 Market Perform Healthcare Realty Trust, Inc. HR $22.90 Not RatedMid-‐America Apartment Communities MAA $64.37 Market Perform LTC Properties, Inc. LTC $29.42 Not RatedPost Properties, Inc. PPS $39.07 Outperform Medical Properties Trust, Inc. MPW $11.59 Not RatedUDR Inc. UDR $24.33 Outperform National Health Investors, Inc. NHI $47.37 Not RatedEquity Lifestyle Properties, Inc. ELS $58.22 Market Perform Nationwide Health Properties, Inc. NHP $42.26 OutperformSun Communities, Inc. SUI $36.81 Market Perform Omega Healthcare Investors, Inc. OHI $23.24 Not RatedUMH Properties Inc. UMH $10.37 Not Rated Senior Housing Properties Trust SNH $23.48 Market PerformAmerican Campus Communities, Inc. ACC $32.79 Market Perform Universal Health Realty Income Trust UHT $42.38 Not RatedEducation Realty Trust, Inc. EDR $8.18 Market Perform Ventas, Inc. VTR $54.06 OutperformCampus Crest Communities CCG $11.61 Not Rated Cousins Properties Incorporated CUZ $8.53 Not RatedCBL & Associates Properties CBL $17.51 Not Rated Digital Realty Trust DLR $58.12 Not RatedGeneral Growth Properties GGP $15.31 Not Rated DuPont Fabros Technology, Inc. DFT $23.89 Not RatedGlimcher Realty Trust GRT $9.11 Outperform Franklin Street Properties FSP $14.13 Not RatedMacerich Co. MAC $48.93 Market Perform Investors Real Estate Trust IRET $9.47 Not Rated
Washington Real Estate Inv. Trust WRE $31.00 Not Rated
Please refer to important disclosures and analyst certification information on pages 16 - 18. 2
April 8, 2011"Hey, You Never Know....?" - Closer Look at REIT M&A & Potential Targets
We continue to believe that public real estate companies will represent a larger part of the commercial real estate pie over the next several years. The REIT group now has reasonably levered balance sheets and is poised to increase ownership of U.S. institutional commercial real estate beyond its current 11%-13% stake. The cost and access to capital pendulum has swung in REITs favor, so gaining market share at various levels continues to be a key theme for 2011 and over the next several years. Given the cost of capital advantage, we expect more transaction activity to be commercial real estate, currently held in private hands, to be acquired by REITs and publicly traded real estate companies. While public-to-public merger activity will not change REITs market share of real estate, we do think conditions are more conducive to this activity more so than recent years. Six months ago, we might have stuck with the party line of not expecting significant public-public company M&A activity given portfolios nomanagement and boards may not be willing sellers. Now after two larger merger transactions in 2011 ProLogis/AMB Property (industrial) and Ventas/Nationwide Health Properties (healthcare) we are rethinking our views. Perhaps, there are more possibilities and combinations that may, in fact, come to fruition. While we expect an increase of activity we
speculation
We believe the following factors set the stage for additional merger and acquisition activity in the REIT sector:
Cost of capital advantage for certain companies or improved cost of capital for the combined entity The cost of capital for some of the larger players both equity and debt is a powerful advantage versus some of the mid- and small-cap REITs. The step up (or improvement) in the cost of capital for the combined company could also be a motivating factor for a combination. Larger companies or investment grade rated REITs buying smaller companies that might not be investment grade could be a possibility.
Valuation differentiation among sectors There has been some more recent FFO multiple and NAV premium differentiation among companies within sectors which could be a driver behind M&A transactions.
Some REITs without obvious succession plans might be sale candidates Many REIT management teams have been in place as a public company for 10-15 years and if a succession plan is not clear, a sale of the company may make some strategic sense. Some chief executive officers (CEO) have attractive change of control payments that are disclosed in proxy filings that may make the board of directors decision to sell the company a more palatable one for key executives.
Surviving the financial crisis a wakeup call that was not so long ago After surviving the recent financial crisis with REIT prices rebounding up over 200% (total return) from the March 6, 2009 low there may be a different attitude by boards and management teams about an opportunistic sale of the company into a low interest rate environment. After all, many of the REIT management and boards that did sell in the last M&A wave made the right decisions for shareholders and are held in high regard, in hindsight, for either having tremendous insight or good luck. (Equity Office, Archstone, and many others.)
Efficiencies eliminating overlap and public company costs The cost of being a public company in the US is not cheap. The general and administrative savings and elimination of personnel as a result of overlap from a merger can assist in certain circumstances, with the merger transaction penciling out accretively. With the looming potential for REITs to report according to international accounting standards reporting real estate at fair value this could be an additional expense burden, particularly for smaller REITs.
A Closer Look at M&A in REITs
What Has Changed? Or Might Be Driving Forces for Combinations?
Please refer to important disclosures and analyst certification information on pages 16 - 18. 3
April 8, 2011"Hey, You Never Know....?" - Closer Look at REIT M&A & Potential Targets
Recent REIT history is a reminder that hostile
takeovers just do not happen in the REIT industry or are extremely rare. In order to avoid violating REIT regulations on the concentration of ownership, there are percentage of ownership restrictions in REIT company charters. In order to qualify for REIT status, no more than 50% of shares can be held by five or fewer investors. Consequently, acquiring a very large voting stake to aggressively pursue a hostile takeover is not practical, in many instances. We have learned from recent history particularly in the mall space with Simon Property Group (SPG) being rebuffed by both Taubman and General Growth Properties that willing parties on both sides, not hostile bids are deals that are most likely to cross the finish line. This Time Will Be Different! We do not expect to see the rampant merger and acquisition activity that we saw in the 2004-2007 period. Market conditions are not the same with public companies currently trading at higher FFO multiples and premiums to net asset value. During 2004-2007 private equity players had the cost and access to capital advantage with ample access to cheap debt and leverage levels were much higher (80%+ available). While debt capital markets have opened, we believe there is more discipline currently in terms of leverage levels. That factor, combined with the fact that most REITs cannot currently be acquired at big discounts to NAV and the public players have the cost and access to capital advantage, we do not expect the prevalence of the witnessed in 2004-2007. M&A trends in the REITs over the next several years are more likely to be dominated by privately held real estate into publicly traded real estate companies and some select public-public merger activity. That being said, we do think that there are reasons to believe that there will be a pickup in public-to-the reason behind this .
The number of public REITs shrank significantly in the mid-2000s due to a wave of privatizations fueled by private equity funds that were awash with capital and the abundance of cheap debt. While equity REITs typically have average debt levels in the 40%-50% range, private companies, particularly during this period, could lever to 75%-85% in many cases. Loan-to-value ratios on new commercial real estate loans are now more conservative as a direct result of the financial crisis. From 2004-2007, there were 68 merger-and-acquisition transactions announced among the REITs and other real
billion acquisition of Equity Office Properties Trust, which was announced in November 2006 and closed in February 2007.
M&A In Historical Context
Please refer to important disclosures and analyst certification information on pages 16 - 18. 4
April 8, 2011"Hey, You Never Know....?" - Closer Look at REIT M&A & Potential Targets
REITs that remained public during this time also sat on the sidelines for much of the frenzied buying of individual assets and portfolio by private players. In fact, during 2007 the peak year for commercial real estate values REITs represented only a 9% share of asset purchases but a 25% share of asset sales. With the capital market crisis of 2008-2009, we believe the pendulum of ownership is now poised to swing back in favor of the REITs, which emerged in better shape from the crisis than their debt-laden private counterparts due to their lower-leverage business models. As over-levered commercial assets work their way back onto the market, many REITs with pristine balance sheets are poised to return a lot of real estate to public ownership from their cash-strapped private counterparts. While some of the portfolio purchased during this time may come to the market in the form of IPOs, some of these portfolios may be purchased by existing public REITs.
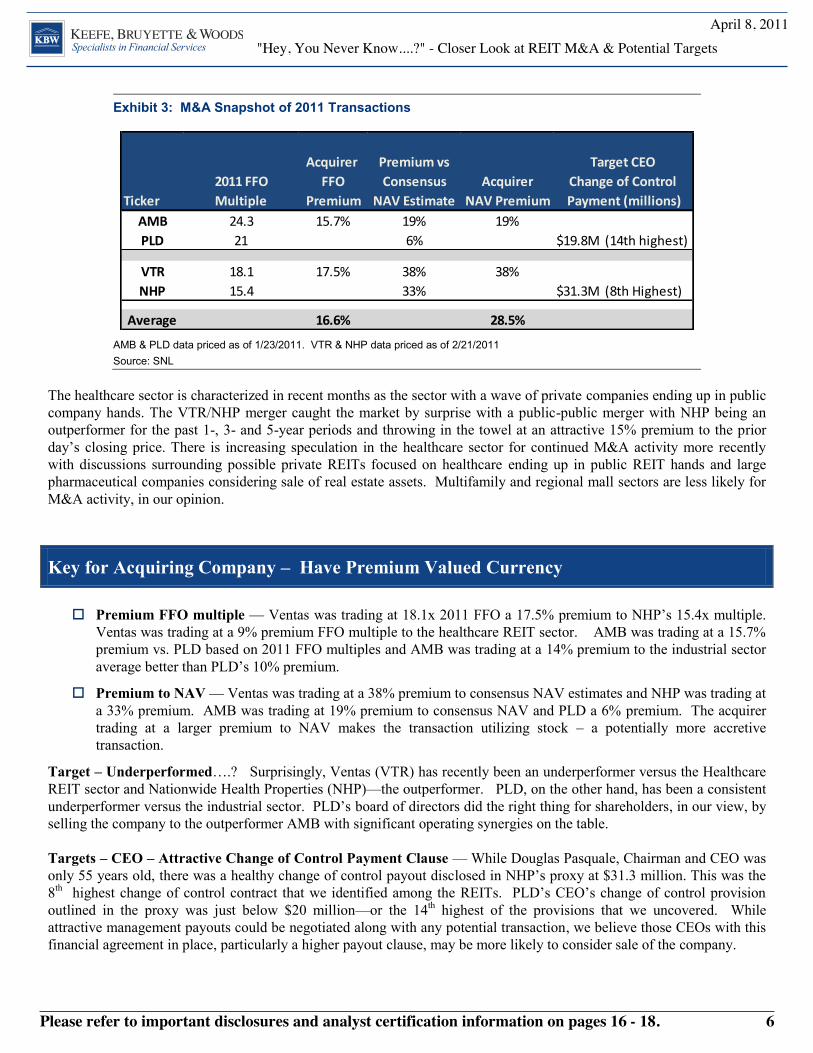
We took a closer look at the two most recent merger transactions AMB Property(AMB)/ProLogis(PLD) and Ventas(VTR)/Nationwide Health Properties(NHP) to see what items jump off the page in terms of (perhaps) some driving factors. For the purposes of our analysis, we consider AMB and VTR as the acquirers and PLD and NHP as the targets. In Exhibit 3, we include select data for each of the transactions and used pricing data a week prior to the transaction announcement. Both acquirers traded at healthy premium to NAV (28.5% avg) and FFO multiple premium (16.6% avg.) versus the target. Both transactions were stock for stock, not surprising, considering the premium valued currency of shares. In addition, both target company CEOs had hefty change of control payments disclosed in proxy. In fact, PLD had the 14th highest change of control payment among the REITs that disclosed these clauses and NHP the 8th highest payout. Every circumstance is clearly different ProLogis was an underperformer versus the REIT sector for the past 1-, 3-, and 5-year time periods. Walter Rakowich had come back out of retirement to assist PLD through a challenging time after senior management changes and with an overleveraged balance sheet heading into the financial crisis. Interestingly, both AMB and ProLogis had very high general and administrative costs as a percentage of revenues at 18%-20%, driven in part by the fund management business. This above average general and administrative costs creates the opportunity for potential synergies merging the entities.
Please refer to important disclosures and analyst certification information on pages 16 - 18. 5
April 8, 2011"Hey, You Never Know....?" - Closer Look at REIT M&A & Potential Targets
The healthcare sector is characterized in recent months as the sector with a wave of private companies ending up in public company hands. The VTR/NHP merger caught the market by surprise with a public-public merger with NHP being an outperformer for the past 1-, 3- and 5-year periods and throwing in the towel at an attractive 15% premium to the prior
closing price. There is increasing speculation in the healthcare sector for continued M&A activity more recently with discussions surrounding possible private REITs focused on healthcare ending up in public REIT hands and large pharmaceutical companies considering sale of real estate assets. Multifamily and regional mall sectors are less likely for M&A activity, in our opinion.
Premium FFO multiple Ventas was trading at 18.1x 2011 FFO a 17.5Ventas was trading at a 9% premium FFO multiple to the healthcare REIT sector. AMB was trading at a 15.7% premium vs. PLD based on 2011 FFO multiples and AMB was trading at a 14% premium to the industrial sector
Premium to NAV Ventas was trading at a 38% premium to consensus NAV estimates and NHP was trading at a 33% premium. AMB was trading at 19% premium to consensus NAV and PLD a 6% premium. The acquirer trading at a larger premium to NAV makes the transaction utilizing stock a potentially more accretive transaction.
Target Underperformed (VTR) has recently been an underperformer versus the Healthcare REIT sector and Nationwide Health Properties (NHP) the outperformer. PLD, on the other hand, has been a consistent u board of directors did the right thing for shareholders, in our view, by selling the company to the outperformer AMB with significant operating synergies on the table. Targets CEO Attractive Change of Control Payment Clause While Douglas Pasquale, Chairman and CEO was only 55 years old, there was a healthy change of control payout disc8th outlined in the proxy was just below $20 million or the 14th highest of the provisions that we uncovered. While attractive management payouts could be negotiated along with any potential transaction, we believe those CEOs with this financial agreement in place, particularly a higher payout clause, may be more likely to consider sale of the company.
Exhibit 3: M&A Snapshot of 2011 Transactions
AMB & PLD data priced as of 1/23/2011. VTR & NHP data priced as of 2/21/2011 Source: SNL
Key for Acquiring Company Have Premium Valued Currency
Acquirer Premium vs Target CEO 2011 FFO FFO Consensus Acquirer Change of Control
Ticker Multiple Premium NAV Estimate NAV Premium Payment (millions)AMB 24.3 15.7% 19% 19%PLD 21 6% $19.8M (14th highest)
Please refer to important disclosures and analyst certification information on pages 16 - 18. 6
April 8, 2011"Hey, You Never Know....?" - Closer Look at REIT M&A & Potential Targets
When looking at potential M&A opportunities among public players, the disparity between P/FFO multiples can be a factor. Exhibit 4 details the multiple spread (at the start of each year) between companies trading at the highest forward multiples and those trading at the lowest forward multiples by each specific sector. In the wave of M&A activity (2007) spreads averaged 64% the highest level since 2001. During that year there were 31 deals, with total volume more than $107 billion. The biggest deals included Blackstone Group acquiring Equity Office Properties Trust, Blackstone Group L.P. acquiring Hilton Hotels Corp, and Tishman Speyer and Lehman Brothers acquiring Archstone-Smith Trust. These were not, in fact, the lowest multiple companies selling but rather astute management teams and Boards of Directors of public companies that saw the pricing levels that these private players were willing to pay as a unique opportunity for shareholders. Private players were the dominate buyers as they had the cost of capital advantage with use of higher leverage strategies with inexpensive debt.
Multiple spreads between the highest multiple companies and lowest within each sector have remained high since the end of 2007, 96% at the beginning of this year. During the financial crisis, the flight of investor capital seeking safer haven in lower leverage REITs, drove this disparity. As we noted earlier, we would not, however, expect to see the high level of privatizations that occurred in 2007 but rather public players using their current capital advantage to expand their footprint. The capital arbitrage factors, in most cases, at this juncture are two-fold: 1) public companies having access and cost of capital advantage which should drive privately owned real estate and real estate companies to the public markets;; and 2) some premium multiple REITs using shares as currency to acquire other public companies.
All else equal, a company trading at a lower multiple and discount to NAV could be attractive to a potential buyer. REITs trading at a premium to NAV could still be attractive if synergies can be achieved, the geographic concentrations of the target are desirable, NAV premium is greater, and if cost of capital of the combined entity improves. Cost savings and geographic complements were some key drivers in the AMB/PLD merger;; G&A as a percent of revenue was 20% and 18% for AMB and PLD, respectively.
Please refer to important disclosures and analyst certification information on pages 16 - 18. 7
April 8, 2011"Hey, You Never Know....?" - Closer Look at REIT M&A & Potential Targets
Operating Partnership Units Basis Steps Up at Time of Death While many factors in the current environment are more conducive to public-public transactions, as we noted earlier, we remind investors to take into consideration if original founders of the REIT, particularly those formed as UPREITs, remain major stakeholders in the company. This factor may decrease the probability of a company sale at this time. Unless a takeover or merger was able to be structured to not trigger taxes for these founder operating partnership unit shares (OP), we believe a continued large ownership stake by an older founder of the REIT could be a deterrent to sale of the company. For family tax planning reasons, the sale of the company would be more likely upon the
at the time of death rather than paying a current tax on the original basis versus the takeout price. While boards of directors are obviously expected to act on the behalf of all stakeholders, we believe it is more appropriate or realistic to assume the probability of a takeover of that REIT to increase significantly upon the death. For example, we follow Saul Centers (BFS) a small-cap REIT with the Chairman, B. Francis Saul II (78) and founder owning a significant stake in the company recently acquired both shares and OP units. A sale of the company today would translate into significant tax burden (sales price versus original basis of real estate for OP shares) which may be a deterrent to sale currently. There are many other REITs with similar issues, although creative tax structuring or perhaps taking OP units in new entity might be possible. That being said, we still believe the probability of a REIT merger, particularly for UPREITs, should increase upon founders death.
California Unique Real Estate Tax Situation Proposition 13 limits real estate tax assessment value increases in California to up to 2% per year and sets the value of the property at the time of purchase both commercial and residential real estate currently benefit from this situation. If a company were to acquire another company with significant assets in California, the assets tax basis would likely be stepped up to the allocated purchase price. This could cause significant increase in real estate taxes which would have to be considered in the valuation of the entity (unless the transaction could be structured to not trigger big step up in taxable value). This would be particularly meaningful for entities that may have benefitted from long-term ownership of assets in California and therefore much lower taxes than would otherwise be incurred after step up in value.
Potential Hindrances to Takeovers That May Otherwise Pencil Out at First Glance
Please refer to important disclosures and analyst certification information on pages 16 - 18. 8
April 8, 2011"Hey, You Never Know....?" - Closer Look at REIT M&A & Potential Targets
We have compiled a variety of publicly available data for the 100+ REITs that we track to include rank and score the following:
.
Change of control payout for c nt reported
If the REIT has underperformed its respective property sector over the past 3-, and 3 & 5-year periods.
General and administrative costs as a percentage of revenue.
A more subjective metric based on our opinion if the portfolio would be categorized as above average, average, or below average in terms of desirability of geographic footprint. In other words, a portfolio with greater exposure to
or a more desired target, and for those
not ascribe these geographic measures to REITs in the triple net lease sector where it is a spread investing strategy and internal growth profile (or geographic concentration) is less meaningful.
Included only companies as targets with equity market cap of $10 billion or less.
We also include a field for some other subjective factors to determine our list. For example, we deducted points for those companies that have two classes of stock and for those companies that are outside advised. The outside advised REITs have other economic factors behind a takeout/merger being a less likely outcome.
We did not include poison pill or staggered board as a criteria because we do not think hostile bids will be transactions that cross the finish line.
Our scoring and resulting rankings are summarized in the KBW REIT M&A Takeout Screener. This is a more quantitative approach built on the above outlined assumptions giving higher points to companies that have CEOs that are older, allocating higher points to companies with larger change of control provisions (on an absolute basis), and higher payout multiples (CEO change in control payout divided by the most recently disclosed full year compensation). We gave additional points to those companies with higher general and administrative expenses with the thought that the acquirer could extract additional synergies. The assumptions are outlined in Exhibit 5. We have included ProLogis and Nationwide Health Properties in the quantitative presentation of how they scored as these were the transactions that we based the selected metrics on. Kilroy (KRC) and Healthcare Realty (HR) are on the top of the list based on large change of control payments as well as other factors including age of CEO. a transaction does not appear to be in the works. We have constructed an interactive screener in Excel where investors can modify assumptions and look at impact to rankings. Please click here to access the link to the KBW REIT M&A Screener. In addition, we have included lists for the top 25 change of control payouts, the top 25 payout multiples, the top 20 oldest CEOs, the highest general and administrative costs as a percentage of revenues, and a complete summary of data in the appendix. While our screener is limited as it focused on the above outlined criteria, many other factors come into play for transactions. This is simply a tool which we do intend on updating and fine tuning with the addition of other criteria over time.
Sorting Through the Stats KBW REIT M&A Screener
Please refer to important disclosures and analyst certification information on pages 16 - 18. 9
April 8, 2011"Hey, You Never Know....?" - Closer Look at REIT M&A & Potential Targets
Subjective Additions/DeductionsCompany Ticker Total Points CEO Age
Change in Control Payout
Payout/CEO Comp.
Underperformance vs Sector
G&A as % of Revenue
Targeted Geographic Footprint
RESET
Please refer to important disclosures and analyst certification information on pages 16 - 18. 10
April 8, 2011"Hey, You Never Know....?" - Closer Look at REIT M&A & Potential Targets
Our KBW REIT Research team then made some adjustments to the M&A screener narrowing the list to exclude companies that we did not believe are likely sellers or for other factors, or by adding a company that may not have shown up on the screener but the analyst thought more probable target. For example, Macerich (MAC) was pulled from the list given various factors including anti-trust issues that may come into play for the mall sector for most likely acquirerSimon Property Group (SPG). California concentration could also mean real estate tax ramifications that might be a discouraging factor for Macerich or other companies with heavy California presence. The KBW REIT Research M&A Potential Target list is highlighted below. While we certainly do not believe that there will be nearly this many potential transactions, we think that the probability of takeout situations stakes up more favorably for this potential list than others drrecent parings in 2011 M&A activity did not fail to surprise many
KBW M&A Potential Target List
Exhibit 6: Potential Target List
(1) Takes in account M&A screener results and modified by KBW REIT Research team. Source: KBW Research.
Company Ticker Property Sector1 Kilroy Realty Corporation KRC Office2 Healthcare Realty Trust, Inc. HR Healthcare3 Strategic Hotel Capital, Inc. BEE Hotel REIT4 U-‐Store-‐It Trust YSI Self Storage5 Sovran Self Storage, Inc. SSS Self Storage6 SL Green Realty Corp. SLG Office7 Douglas Emmett, Inc. DEI Office8 Health Care REIT, Inc. HCN Healthcare9 Regency Centers Corp. REG Shopping Centers10 Pebblebrook Hotel Trust PEB Hotel REIT11 Hersha Hospitality Trust HT Hotel REIT12 Medical Properties Trust, Inc. MPW Healthcare13 Acadia Realty Trust AKR Shopping Centers14 Cousins Properties Incorporated CUZ Diversified / Other15 Corporate Office Properties Trust OFC Office16 BioMed Property Trust Inc. BMR Office17 DCT Industrial Trust Inc. DCT Industrial18 LTC Properties, Inc. LTC Healthcare19 Highwoods Properties, Inc. HIW Office20 Potlatch Corp. PCH Timber21 Brandywine Realty Trust BDN Office22 Cedar Shopping Centers CDR Shopping Centers23 Ramco-‐Gershenson Properties Trust RPT Shopping Centers24 Home Properties, Inc. HME Multi-‐Family
KBW M&A Potential Target List (1)
Please refer to important disclosures and analyst certification information on pages 16 - 18. 11
April 8, 2011"Hey, You Never Know....?" - Closer Look at REIT M&A & Potential Targets
Appendix
Exhibit 7: Top 25 by Change in Control Payouts (Absolute including CEO & the Chairman)
Change in control based on most recently filed proxy filed as of 3/22/11 (includes cash, stock, accelerated vesting, and where applicable tax gross-up). Source: KBW Research and SNL.
Exhibit 8: Top 25 by Change in Control Multiple (CEO Payout/Compensation)
Change in control based on most recently filed proxy filed as of 3/22/11 (includes cash, stock, accelerated vesting, and where applicable tax gross-up). Source: KBW Research and SNL.
Change in Control Rank Company Ticker Value (CEO & the Chairman)
1 Vornado Realty Trust VNO 59.12 SL Green Realty Corp. SLG 56.23 HCP, Inc. HCP 53.24 Kilroy Realty Corporation KRC 38.45 Macerich Co. MAC 37.36 Healthcare Realty Trust, Inc. HR 37.17 Tanger Factory Outlet Cetners SKT 35.58 Nationwide Health Properties, Inc. NHP 31.39 Douglas Emmett, Inc. DEI 28.710 Host Hotels & Resorts HST 27.811 Developers Diversified Realty DDR 21.112 Pebblebrook Hotel Trust PEB 20.413 Ventas, Inc. VTR 20.214 ProLogis PLD 19.815 Digital Realty Trust DLR 19.816 Hersha Hospitality Trust HT 19.317 Boston Properties, Inc. BXP 18.618 Equity Residential EQR 18.519 Medical Properties Trust, Inc. MPW 18.320 Weyerhaeuser Company WY 18.121 AMB Property Corporation AMB 17.722 Strategic Hotel Capital, Inc. BEE 16.823 Health Care REIT, Inc. HCN 16.824 Entertainment Properties Trust EPR 16.825 Highwoods Properties, Inc. HIW 16.2
Change in Control Rank Company Ticker Multiple
1 Healthcare Realty Trust, Inc. HR 18.5x2 Hersha Hospitality Trust HT 9.9x3 Sovran Self Storage, Inc. SSS 8.3x4 Entertainment Properties Trust EPR 8.0x5 Nationwide Health Properties, Inc. NHP 7.7x6 HCP, Inc. HCP 6.7x7 ProLogis PLD 6.6x8 Kilroy Realty Corporation KRC 6.5x9 Strategic Hotel Capital, Inc. BEE 6.5x10 Macerich Co. MAC 6.4x11 Public Storage, Inc. PSA 6.2x12 Medical Properties Trust, Inc. MPW 6.1x13 Urstadt Biddle Properties Inc. UBA 6.1x14 Host Hotels & Resorts HST 6.0x15 Vornado Realty Trust VNO 5.9x16 Acadia Realty Trust AKR 5.7x17 U-Store-It Trust YSI 5.7x18 Douglas Emmett, Inc. DEI 5.6x19 Cousins Properties Incorporated CUZ 4.8x20 Mid-America Apartment Communities MAA 4.8x21 Sun Communities, Inc. SUI 4.8x22 Highwoods Properties, Inc. HIW 4.7x23 Glimcher Realty Trust GRT 4.7x24 EastGroup Properties, Inc. EGP 4.6x25 Camden Property Trust CPT 4.6x
Please refer to important disclosures and analyst certification information on pages 16 - 18. 12
April 8, 2011"Hey, You Never Know....?" - Closer Look at REIT M&A & Potential Targets
Exhibit 9: Top 20 by CEO Age
Source: KBW Research and SNL.
Exhibit 10: Top 20 by G&A as a % of Revenues
Excludes TRNO at 39% and EXL at 31%. Source: KBW Research and SNL.
Rank Company Ticker CEO Age
1 Urstadt Biddle Properties Inc. UBA 822 Pennsylvania Real Estate Investment Trust PEI 803 Saul Centers, Inc. BFS 784 Monmouth Real Estate Inv. Co. MNR 775 Boston Properties, Inc. BXP 736 Universal Health Realty Income Trust UHT 737 Mission West Properties, Inc. MSW 728 Cedar Shopping Centers CDR 719 Forest City Enterprises, Inc. FCEA 6910 Sovran Self Storage, Inc. SSS 6811 Healthcare Realty Trust, Inc. HR 6612 Rayonier Inc. RYN 6613 Ramco-Gershenson Properties Trust RPT 6614 Agree Realty Corp. ADC 6615 Corporate Office Properties Trust OFC 6516 U-Store-It Trust YSI 6417 EastGroup Properties, Inc. EGP 6418 Strategic Hotel Capital, Inc. BEE 6319 Apartment Investment and Mgmt. Co. AIV 6320 Tanger Factory Outlet Cetners SKT 62
Rank Company Ticker G&A % of Revenues
1 Cousins Properties Incorporated CUZ 24%2 Medical Properties Trust, Inc. MPW 21%3 Chesapeake Lodging Trust CHSP 21%4 AMB Property Corporation AMB 20%5 ProLogis PLD 18%6 Education Realty Trust, Inc. EDR 18%7 Cogdell Spencer Inc. CSA 18%8 One Liberty Properties, Inc. OLP 16%9 Extra Space Storage Inc. EXR 15%10 Agree Realty Corp. ADC 15%11 Equity One, Inc. EQY 14%12 Sovran Self Storage, Inc. SSS 14%13 Ramco-Gershenson Properties Trust RPT 12%14 LTC Properties, Inc. LTC 12%15 DCT Industrial Trust Inc. DCT 11%16 Regency Centers Corp. REG 11%17 U-Store-It Trust YSI 11%18 Developers Diversified Realty DDR 11%19 Associated Estates Realty Corporation AEC 10%20 Campus Crest Communities CCG 10%
Please refer to important disclosures and analyst certification information on pages 16 - 18. 13
April 8, 2011"Hey, You Never Know....?" - Closer Look at REIT M&A & Potential Targets
Exhibit 11: Company Statistics
(1) President & COO (2) President (3) Change in control based on most recently filed proxy filed as of 3/22/11 (includes cash, stock, accelerated vesting, and where applicable tax gross-up). Source: KBW Research and SNL.
Payout/CEO Comp. G&A %
Company Ticker Name Age Chairman Comp. CEO Comp. Ratio of Revenue
OfficeAlexandria Real Estate Equities, Inc. ARE Joel Marcus 62 11.6 See Chairman 1.6x 7%BioMed Property Trust Inc. BMR Alan Gold 50 8.4 See Chairman 2.1x 6%Boston Properties, Inc. BXP Mort Zuckerman 73 18.6 See Chairman 2.3x 4%Brandywine Realty Trust BDN Gerard Sweeney 53 NA 9.6 3.9x 3%Corporate Office Properties Trust OFC Rand Griffin 65 NA 12.9 3.1x 4%Douglas Emmett, Inc. DEI Jordan Kaplan 49 NA 28.7 5.6x 6%Government Properties Income Trust GOV David Blackman(1) 48 NA NA NA 6%Highwoods Properties, Inc. HIW Edward Fritsch 52 NA 16.2 4.7x 7%CommonWealth CWH Adam Portnoy(2) 40 NA NA NA NAHudson Pacific Properties, Inc. HPP Victor Coleman 49 5.0 See Chairman NA 10%Kilroy Realty Corporation KRC John Kilroy Jr. 61 NA 38.4 6.5x 8%Mack-Cali Realty Corporation CLI Mitchell Hersh 60 NA 12.3 3.5x 5%Maguire Properties, Inc. MPG David Weinstein 44 NA NA NA 1%Parkway Properties, Inc. PKY Steven Rogers 55 NA 4.0 3.7x 2%SL Green Realty Corp. SLG Marc Holliday 43 18.7 37.5 3.3x 8%Vornado Realty Trust VNO Mike Fascitelli 54 28.0 31.1 5.9x 6%
Office/IndustrialDuke Realty Corporation DRE Dennis Oklak 57 3.9 See Chairman 1.7x 4%Liberty Property Trust LRY William Hankowsky 59 9.5 See Chairman 3.6x 7%Mission West Properties, Inc. MSW Carl Berg 72 NA NA NA 2%PS Business Parks, Inc. PSB Joseph Russell Jr. 51 NA 2.3 2.8x 4%
IndustrialAMB Property Corporation AMB Hamid Moghadam 54 17.7 See Chairman 2.7x 20%DCT Industrial Trust Inc. DCT Philip Hawkins 55 NA 8.1 3.3x 11%EastGroup Properties, Inc. EGP David Hoster II 64 NA 5.0 4.6x 6%First Industrial Realty Trust, Inc. FR Bruce Duncan 59 0.8 5.6 2.3x 7%First Potomac Realty Trust FPO Douglas Donatelli 49 7.3 See Chairman 4.0x 9%Monmouth Real Estate Inv. Co. MNR Eugene Landy 77 2.5 See Chairman 2.4x 7%ProLogis PLD Walter Rakowich 53 NA 19.8 6.6x 18%Terreno Realty Corp TRNO W Blake Baird 50 NA 2.5 1.8x NM
Triple-Net LeaseCapLease, Inc. LSE Paul McDowell 50 4.8 See Chairman 4.3x 8%Entertainment Properties Trust EPR David Brain 55 NA 16.8 8.0x 5%Getty Realty Corp. GTY David Driscoll 56 NA NA NA 10%Lexington Realty Trust LXP T Wilson Eglin 46 1.6 2.6 2.0x 7%National Retail Properties, Inc. NNN Craig Macnab 54 10.1 See Chairman 4.0x 8%One Liberty Properties, Inc. OLP Patrick Callan Jr. 48 0.2 0.4 0.4x 16%Realty Income Corporation O Thomas Lewis Jr. 58 NA 8.8 3.8x 6%
ApartmentsApartment Investment and Mgmt. Co. AIV Terry Considine 63 13.6 See Chairman 3.3x 5%Associated Estates Realty Corporation AEC Jeffrey I. Friedman 59 8.3 See Chairman 3.5x 10%AvalonBay Communities Inc. AVB Bryce Blair 51 12.5 See Chairman 3.1x 3%BRE Properties, Inc. BRE Constance B. Moore 55 NA 10.9 2.5x 8%Camden Property Trust CPT Richard J. Campo 55 14.3 See Chairman 4.6x 5%Colonial Properties Trust CLP Thomas H. Lowder 61 4.3 See Chairman 1.7x 5%Equity Residential EQR David J. Neithercut 55 4.2 14.3 3.9x 2%Essex Property Trust, Inc. ESS Michael J. Schall 53 NA 1.4 2.0x 7%Home Properties, Inc. HME Edward J. Pettinella 59 NA 6.3 2.7x 5%Mid-America Apartment Communities MAA H. Eric Bolton, Jr. 53 5.9 See Chairman 4.8x 3%Post Properties, Inc. PPS David P. Stockert 48 NA 3.0 2.5x 5%UDR Inc. UDR Thomas W. Toomey 50 NA 3.9 1.0x 6%
Manufactured HousingEquity Lifestyle Properties, Inc. ELS Thomas P. Heneghan 46 NA 0.1 0.1x 8%Sun Communities, Inc. SUI Gary A. Schiffman 56 3.8 See Chairman 4.8x 10%UMH Properties Inc. UMH Samuel Landy 50 1.2 0.3 0.4x 7%
Change in Control Payouts (3)CEO
Please refer to important disclosures and analyst certification information on pages 16 - 18. 14
April 8, 2011"Hey, You Never Know....?" - Closer Look at REIT M&A & Potential Targets
Exhibit 11: Company Statistics Continued
(3) Change in control based on most recently filed proxy filed as of 3/22/11 (includes cash, stock, accelerated vesting, and where applicable tax gross-up). Source: KBW Research and SNL.
Payout/CEO Comp. G&A %
Company Ticker Name Age Chairman Comp. CEO Comp. Ratio of Revenue
Student HousingAmerican Campus Communities, Inc. ACC William C. Bayless, Jr. 45 NA 6.0 3.7x 2%Education Realty Trust, Inc. EDR Randall L. Churchey 49 NA 2.5 NA 18%Campus Crest Communities CCG Ted W. Rollins 48 3.4 1.4 4.4x 10%
Regional MallCBL & Associates Properties CBL Stephen Lebovitz 50 NA NA NA 4%General Growth Properties GGP Sandeep Mathrani 48 NA NA NA 3%Glimcher Realty Trust GRT Michael Glimcher 42 6.2 See Chairman 4.7x 7%Macerich Co. MAC Arthur Coppola 59 37.3 See Chairman 6.4x 2%Pennsylvania Real Estate Investment Trust PEI Ronald Rubin 80 4.8 See Chairman 2.6x 9%Simon Property Group SPG David Simon 49 NA NA NA 4%Taubman Centers TCO Robert Taubman 57 8.3 See Chairman 4.0x 4%Tanger Factory Outlet Cetners SKT Steven Tanger 62 35.5 See Chairman 3.8x 9%Westfield Group WDC.AU Frank Lowy 79 NA NA NA NA
Shopping CenterAcadia Realty Trust AKR Kenneth Bernstein 49 NA 14.7 5.7x 9%Agree Realty Corp. ADC Richard Agree 66 2.0 See Chairman 2.4x 15%Cedar Shopping Centers CDR Leo Ullman 71 6.3 See Chairman 2.9x 7%Developers Diversified Realty DDR Daniel Hurwitz 46 13.2 7.9 1.0x 11%Equity One, Inc. EQY Jeffrey Olson 42 NA 3.4 1.5x 14%Excel Trust, Inc. EXL Gary Sabin 56 NA NA NA NMFederal Realty Investment Trust FRT Donald Wood 49 NA 11.4 3.3x 5%Inland Real Estate Corp. IRC Mark Zalatoris 53 NA 2.1 3.9x 7%Kimco Realty Corp. KIM Dave Henry 62 0.7 2.7 1.5x 10%Kite Realty Group KRG John Kite 44 2.7 See Chairman 4.0x 6%Ramco-Gershenson Properties Trust RPT Dennis Gershenson 66 NA 4.3 3.5x 12%Regency Centers Corp. REG Martin Stein Jr. 58 11.0 See Chairman 4.6x 11%Saul Centers, Inc. BFS B. Francis Saul II 78 NA NA NA 10%Urstadt Biddle Properties Inc. UBA Charles Urstadt 82 9.2 See Chairman 6.1x 8%Weingarten Realty Investors WRI Andrew Alexander 53 NA NA NA 4%
Self-StorageExtra Space Storage Inc. EXR Spencer F. Kirk 48 NA NA NA 15%Public Storage, Inc. PSA Ronald L. Havner 53 NA 13.7 6.2x 2%Sovran Self Storage, Inc. SSS Robert J. Attea 68 9.7 See Chairman 8.3x 14%U-Store-It Trust YSI Dean Jernigan 64 NA 14.0 5.7x 11%
Hotel Ashford Hospitality Trust Inc. AHT Montgomery J. "Monty" Bennett 44 1.4 6.9 3.1x 4%Chesapeake Lodging Trust CHSP James L. Francis 48 NA 2.4 0.6x 21%Chatham Lodging Trust CLDT Jeffrey H. Fisher 55 5.3 See Chairman 1.5x 10%DiamondRock Hospitality Co. DRH Mark W. Brugger 41 NA 13.3 4.4x 3%FelCor Lodging Trust Incorporated FCH Richard A. Smith 48 NA 8.2 2.0x 3%Hersha Hospitality Trust HT Jay H. Shah 41 1.8 17.5 9.9x 8%Hospitality Properties Trust HPT John G. Murray 50 NA NA NA 0%Host Hotels & Resorts HST W. Edward Walter 55 NA 27.8 6.0x 3%LaSalle Hotel Properties LHO Mike D. Barnello 45 NA 12.4 4.5x 3%Pebblebrook Hotel Trust PEB Jon E. Bortz 53 20.4 See Chairman 3.1x 9%Strategic Hotel Capital, Inc. BEE Laurence S. Geller 63 NA 16.8 6.5x 6%Sunstone Hotel Investors, Inc. SHO Kenneth E. Cruse 41 1.4 0.7 NA 4%
Timber Plum Creek Timber Company, Inc. PCL Rick R. Holley 59 NA 5.3 1.1x 7%Potlatch Corp. PCH Mike J. Covey 53 10.7 See Chairman 3.1x 8%Weyerhaeuser Company WY Daniel S. Fulton 62 NA 18.1 3.1x 10%Rayonier Inc. RYN Lee M. Thomas 66 11.5 See Chairman 1.9x 6%
Healthcare Cogdell Spencer Inc. CSA Raymond W. Braun 52 2.3 NA NA 18%HCP, Inc. HCP Jay F. Flaherty III 53 53.2 See Chairman 6.7x 4%Health Care REIT, Inc. HCN George L. Chapman 62 16.8 See Chairman 2.6x 7%Healthcare Realty Trust, Inc. HR David R. Emery 66 37.1 See Chairman 18.5x 6%LTC Properties, Inc. LTC Wendy L. Simpson 61 5.0 3.0 0.9x 12%Medical Properties Trust, Inc. MPW Edward K. Aldag Jr. 46 18.3 See Chairman 6.1x 21%National Health Investors, Inc. NHI J. Justin Hutchens 36 NA NA NA 6%Nationwide Health Properties, Inc. NHP Douglas M. Pasquale 56 31.3 See Chairman 7.7x 7%Omega Healthcare Investors, Inc. OHI C. Taylor Pickett 49 NA 4.1 3.6x 5%Senior Housing Properties Trust SNH David J. Hegarty 54 NA NA NA 6%Universal Health Realty Income Trust UHT Alan B. Miller 73 NA See Chairman NA NAVentas, Inc. VTR Debra A. Cafaro 53 20.2 See Chairman 3.2x 5%
DiversifiedCousins Properties Incorporated CUZ Lawrence Gellerstedt III 54 NA 3.3 4.8x 24%Digital Realty Trust DLR Michael Foust 55 NA 19.8 3.9x 5%DuPont Fabros Technology, Inc. DFT Hossein Fateh 42 4.8 9.1 4.5x 5%Franklin Street Properties FSP George Carter Jr. 62 NA NA NA 7%Investors Real Estate Trust IRET Timothy Mihalick 51 NA NA NA 3%Washington Real Estate Inv. Trust WRE George McKenzie 55 NA 4.3 3.4x 5%
Change in Control Payouts (3)CEO
Please refer to important disclosures and analyst certification information on pages 16 - 18. 15
April 8, 2011"Hey, You Never Know....?" - Closer Look at REIT M&A & Potential Targets
IMPORTANT DISCLOSURESRESEARCH ANALYST CERTIFICATION: We, Sheila McGrath, Nathan Crossett and KBW REIT Research, hereby certify that the viewsexpressed in this research report accurately reflect our personal views about the subject companies and their securities. We also certify that We havenot been, and will not be receiving direct or indirect compensation in exchange for expressing the specific recommendation in this report.
Analysts’ Compensation: The equity research analysts responsible for the preparation of this report receive compensation based upon various factors,including the quality and accuracy of research, client feedback, competitive factors, and overall firm revenues, which include revenues from, amongother business units, Institutional Equities and Investment Banking.
For disclosures pertaining to recommendations or estimates made on a security mentioned in this report, please see the most recently publishedcompany report or visit our global disclosures page on our website at http://www.kbw.com/research/disclosures.html or see the section below titled"Disclosure Information" for further information on how to obtain these disclosures.
AFFILIATE DISCLOSURES: This report has been prepared by Keefe, Bruyette & Woods Inc. (“KBWI”) and/or its affiliates Keefe, Bruyette &Woods Limited and Keefe, Bruyette & Woods Asia Limited all of which are subsidiaries of KBW, Inc. (collectively “KBW”). Keefe, Bruyette &Woods Inc. is regulated by FINRA, NYSE, and the United States Securities and Exchange Commission, and its headquarters is located at 787 7thAvenue, New York, NY 10019. Keefe, Bruyette & Woods Limited is registered in England and Wales, no. 04605071 and its registered office is 7thFloor, One Broadgate, London EC2M 2QS. KBWL is authorised and regulated by the UK Financial Services Authority ("FSA"), entered on the FSA'sregister, no. 221627 and is a member of the London Stock Exchange. Keefe, Bruyette & Woods Asia Limited is a licensed corporation regulated bythe Securities and Futures Commission of Hong Kong ("SFC") (CE No.: AUI281). Its headquarters is located at 3101, 31/F Central Plaza, 18 HarbourRoad, Wanchai, Hong Kong. Disclosures in the Important Disclosures section referencing KBW include one or all affiliated entities unless otherwisespecified.
Registration of non-US Analysts: Any non-US Research Analyst employed by a non-US affiliate of KBWI contributing to this report is notregistered/qualified as research analyst with FINRA and/or the NYSE and may not be an associated person of KBWI and therefore may not be subjectto NASD Rule 2711 or NYSE Rule 472 restrictions on communications with a subject company, public appearances, and trading securities held by aresearch analyst account.
Disclosure Information: For current company specific disclosures please write to one of the KBW entities: Keefe, Bruyette & Woods ResearchDepartment at the following address: 787 7th Avenue, 4th Floor, New York, NY 10019. The Compliance Officer, Keefe, Bruyette and WoodsLimited, 7th Floor, One Broadgate, London EC2M 2QS. The Compliance Officer, Keefe, Bruyette and Woods Asia Limited, 3101, 31/F CentralPlaza, 18 Harbour Road, Wanchai, Hong Kong. Or visit our website at http://www.kbw.com/research/disclosures.html. KBW has arrangements inplace to manage conflicts of interest including information barriers between the Research Department and certain other business groups. As a result,KBW does not disclose certain client relationships with, or compensation received from, such companies in its research reports.
*KBW maintains separate research departments; however, the above chart, "Distribution of Ratings/IBServices," reflects combined information related to the distribution of research ratings and the receipt ofinvestment banking fees globally.
Explanation of Ratings: KBW Research Department provides three core ratings: Outperform, Market Perform and Underperform, and two ancillaryratings: Suspended and Restricted. For purposes of New York Stock Exchange Rule 472 and FINRA Rule 2711, Outperform is classified as a Buy,Market Perform is classified as a Hold, and Underperform is classified as a Sell. Suspended indicates that KBW's investment rating and target pricehave been temporarily suspended due to a lack of publicly available information and/or to comply with applicable regulations and/or KBW policies.Restricted indicates that KBW is precluded from providing an investment rating or price target due to the firm's role in connection with a merger orother strategic financial transaction.
North American Stocks are rated based on an absolute rate of return (percentage price change plus dividend yield).Outperform represents a total rateof return of 15% or greater. Market Perform represents a total rate of return in a range between -5% and +15%.Underperform represents a total rate ofreturn at or below -5%.
European and Asian Stocks are rated based on the share price upside to target price relative to the relevant sector index performance on a 12-monthhorizon. Outperform rated stocks have a greater than 10 percentage point (“pp”) relative performance versus the sector, Market Perform rated stocksbetween +10pp to -10pp relative performance versus the sector, and Underperform rated stocks a lower than 10pp relative performance versus thesector. The 12-month price target may be determined by the stock’s fundamentally-driven fair value and/or other factors (e.g., takeover premium orilliquidity discount).
Please refer to important disclosures and analyst certification information on pages 16 - 18. 16
April 8, 2011"Hey, You Never Know....?" - Closer Look at REIT M&A & Potential Targets
KBWModel Portfolio: "Model Portfolio Buy" - Companies placed on this list are expected to generate a total rate of return (percentage price changeplus dividend yield) of 10% or more over the next 3 to 6 months.
"Model Portfolio Sell" - Companies placed on this list are expected to generate a total rate of return (percentage price change plus dividend yield) at orbelow -10% over the next 3 to 6 months.
The purpose of the Model Portfolio is to inform institutional investors of KBWI’s short-term (as described above) outlook for a particular industrysector. The Portfolio is not available for purchase or sale, cannot be duplicated as shown, is hypothetical and is for illustrative purposes only. For amore detailed description of the selection criteria and other specifics related to the construction of the Model Portfolio, please refer to the January 5,2010 Model Portfolio Primer and/or contact your KBWI representative for more information.
The Model Portfolio should be viewed as a short-term outlook of a particular industry sector, not as individual security recommendations. The ModelPortfolio uses a three-to-six-month time horizon and should not be considered when making longer term investments. KBWI Research publishesresearch with a 12-month outlook on each issuer of securities contained in the Model Portfolio. Investors who are interested in a particular securityshould request KBWI Research’s coverage of such securities by contacting your KBWI representative. KBW research contains analyses offundamentals underlying each issuer.
KBWI’s long-term recommendations may differ from recommendations made for the Model Portfolio. These differences are the result of differenttime horizons -- KBWI research has a 12-month outlook and the Model Portfolio has a three-to-six-month outlook.
Although the model portfolio is based upon actual performance of actual investments, KBWI did not recommend that investors purchase thiscombination -- or hypothetical portfolio -- of investments during the time period depicted here. As this hypothetical portfolio was designed with thebenefit of hindsight, the choice of investments contained in it reflects a subjective choice by KBWI. Accordingly, this hypothetical portfolio mayreflect a choice of investments that performed better than an actual portfolio, which was recommended during the depicted time frame, would haveperformed during the same time period. Moreover, unlike an actual performance record, these results do not represent actual trading wherein marketconditions or other risk factors may have caused the holder of the portfolio to liquidate or retain all or part of the represented holdings.
Other Research Methods: Please be advised that KBW provides to certain customers on request specialized research products or services that focuson covered stocks from a particular perspective. These products or services include, but are not limited to, compilations, reviews and analysis that mayuse different research methodologies or focus on the prospects for individual stocks as compared to other covered stocks or over differing timehorizons or under assumed market events or conditions.
OTHER DISCLOSURES
Indices: The following indices: U.S.: KBW Bank Index (BKX), KBW Insurance Index (KIX), KBW Capital Markets Index (KSX), KBW RegionalBanking Index (KRX), KBW Mortgage Finance Index (MFX), KBW Property & Casualty Index (KPX), and KBW Premium Yield Equity REITIndex (KYX); KBW Financial Sector Dividend Yield Index (KDX); Europe: KBW Large-Cap Banks Index (KEBI), KBW Mid/Small Cap BanksIndex (KMBI), KBW Large-Cap Insurance Index (KEII), KBW Miscellaneous Financials Index (KMFI), KBW Emerging Europe Financials Index(KEEI); and Global: KBW Global ex-U.S. Financial Sector Index (KGX), are the property of KBWI. KBWI does not guarantee the accuracy and/orcompleteness of the Indices, makes no express or implied warranties with respect to the Indices and shall have no liability for any damages, claims,losses or expenses caused by errors in the index calculation. KBWI makes no representation regarding the advisability of investing in options on theIndex. Past performance is not necessarily indicative of future results.
ETFs: The shares ("Shares") of KBW ETFs are not sponsored, endorsed, sold or promoted by KBWI. KBWI makes no representation or warranty,express or implied, to the owners of the Shares or any member of the public regarding the advisability of investing in securities generally or in theShares particularly or the ability of its Indices to track general stock market performance. The only relationship of KBWI to Invesco PowerSharesCapital Management LLC , ProShares and State Street Bank and Trust Company is the licensing of certain trademarks and trade names of KBWI andits Indices which are determined, composed and calculated by KBWI without regard to Invesco PowerShares Capital Management LLC, ProSharesand State Street Bank and Trust, the fund, or the Shares. KBWI has no obligation to take the needs of Invesco PowerShares Capital Management LLC,ProShares, State Street Bank and Trust Company or the owners of the shares into consideration in determining, composing, or calculating the Indices.KBWI is not responsible for and has not participated in any determination or calculation made with respect to issuance or redemption of the Shares.KBWI has no obligation or liability in connection with the administration, marketing or trading of the Shares.
ETFs trade like stocks, are subject to investment risk, fluctuate in market value and may trade at prices above or below the ETFs net asset value.Investing in a single sector may be subject to more volatility than funds investing in a diverse group of sectors. Brokerage commissions and ETFexpenses will reduce returns. In general, ETFs can be expected to move up or down in value with the value of the applicable index. Although ETFsmay be bought and sold on the exchange through any brokerage account, ETFs are not individually redeemable from the Fund. Investors may acquireETFs and tender them for redemption through the Fund in Creation Unit Aggregations only, please see the prospectus for more details. There are risksinvolved with investing in ETFs, including possible loss of money. Shares are not actively managed and are subject to risks including those regardingshort selling and margin maintenance requirements. Past performance is not necessarily indicative of future results.
Most ProShares ETFs seek a return that is a multiple (e.g., -200%, -300%) of the return of an index or other benchmark (target) for a single day. Dueto the compounding of daily returns, Ultra and Short ProShares' returns over periods other than one day will likely differ in amount and possiblydirection from the target return for the same period. Investors should monitor holdings consistent with their strategies, as frequently as daily. For moreon correlation, leverage and other risks, please read the prospectus.
An investor should consider the Funds’ investment objectives, risks, charges and expenses carefully before investing. This and other information canbe found in their prospectuses. For this and more complete information about the Funds, call InvescoPowerShares at 1-800-983-0903 or visithttps://invescopowershares.com; call State Street at 1-866-787-2257 or visithttps://www.spdrs.com/resources/materials/productLiteratureOverlay.seam; or call ProShares Client Services at 1-866-776-5125 or visit
Please refer to important disclosures and analyst certification information on pages 16 - 18. 17
April 8, 2011"Hey, You Never Know....?" - Closer Look at REIT M&A & Potential Targets
http://www.proshares.com/resources/litcenter/ for a prospectus. The prospectus should be read carefully before investing.
Shares of the ETFs funds are not guaranteed or insured by the FDIC or by another governmental agency; they are not obligations of the FDIC nor arethey deposits or obligations of or guaranteed by KBWI, Invesco PowerShares Capital Management LLC, ProShares or State Street Bank and TrustCompany. ETFs are distributed by Invesco Distributors, Inc. the distributor of the PowerShares Exchange-Traded Fund Trust II. PowerShares® is aregistered trademark of Invesco PowerShares Capital Management LLC; by State Street Global Markets, LLC, member FINRA(http://www.finra.org/index.htm), SIPC (http://www.sipc.org/) ; ProShares are distributed by SEI Investments Distribution Co. which is not affiliatedwith ProFunds Group or its affiliates.
General Risk Disclosure: Investments in securities or financial instrument involve numerous risks which may include market risk, counterpartydefault risk, liquidity risk and exchange rate risk. No security or financial instrument is suitable for all investors and some investors may be prohibitedin certain states or other jurisdictions from purchasing securities mentioned in this communication. The securities of some issuers may not be subjectto the audit and reporting standards, practices and requirements comparable to those companies located in the investor’s local jurisdiction. Where netdividends to ADR investors are discussed, these are estimated, using withholding tax rate conventions, and deemed accurate, but recipients shouldalways consult their tax advisor for exact dividend computations.
COUNTRY SPECIFIC AND JURISDICTIONAL DISCLOSURES: United States: This report is being distributed in the US by Keefe, Bruyette& Woods Inc. Where the report has been prepared by a non-US affiliate, Keefe, Bruyette & Woods Inc., accepts responsibility for its contents. U.K.and European Economic Area (EEA): This report is issued and approved for distribution in the EEA by Keefe Bruyette & Woods Limited, which isregulated in the United Kingdom by the Financial Services Authority. Hong Kong: This document has been distributed by Keefe, Bruyette & WoodsAsia Limited for the information of institutional customers and is not intended for, and should not be distributed to, retail investors in Hong Kong.Keefe, Bruyette & Woods Asia Limited accepts responsibility for the information set out in this document. Singapore: This communication isdistributed in Singapore only to persons who are "institutional investors" as defined in the Securities and Futures Act, Chapter 289 of Singapore and isnot intended for, and should not be distributed to, any person in Singapore who is not an "institutional investor”.
In jurisdictions where KBW is not already licensed or registered to trade securities, transactions will only be affected in accordance with localsecurities legislation which will vary from jurisdiction to jurisdiction and may require that a transaction is carried out in accordance with applicableexemptions from registration and licensing requirements. Non US customers wishing to effect a transaction should contact a representative of theKBW entity in their regional jurisdiction except where governing law permits otherwise. US customers wishing to effect a transaction should do so bycontacting a representative of Keefe, Bruyette & Woods Inc.
ONLY DISTRIBUTE UNDER REGULATORY LICENSE: This communication is only intended for and will only be distributed to personsresiding in any jurisdictions where such distribution or availability would not be contrary to local law or regulation. This communication must not beacted upon or relied on by persons in any jurisdiction other than in accordance with local law or regulation and where such person is an investmentprofessional with the requisite sophistication and resources to understand an investment in such securities of the type communicated and assume therisks associated therewith.
CONFIDENTIAL INFO: This communication is confidential and is intended solely for the addressee. It is not to be forwarded to any other person orcopied without the permission of the sender. Please notify the sender in the event you have received this communication in error.
NO SOLICITATION OR PERSONAL ADVICE: This communication is provided for information purposes only. It is not a personalrecommendation or an offer to sell or a solicitation to buy the securities mentioned. Investors should obtain independent professional advice beforemaking an investment.
ASSUMPTIONS, EFFECTIVE DATE AND UPDATES: Certain assumptions may have been made in connection with the analysis presentedherein, so changes to assumptions may have a material impact on the conclusions or statements made in this communication. Facts and viewspresented in this communication have not been reviewed by, and may not reflect information known to, professionals in other business areas of KBW,including investment banking personnel.
The information relating to any company herein is derived from publicly available sources and KBW makes no representation as to the accuracy orcompleteness of such information. Neither KBW nor any of its officers or employees accept any liability whatsoever for any direct, indirect orconsequential damages or losses arising from any use of this report or its content.
This communication has been prepared as of the date of the report.
KBW does not undertake to advise clients of any changes in information, estimates, price targets or ratings, all of which are subject to change withoutnotice. The recipients should assume that KBW will not update any fact, circumstance or opinion contained in this report.
COPYRIGHT: This report is produced for the use of KBW customers and may not be reproduced, re-distributed or passed to any other person orpublished in whole or in part for any purpose without the prior consent of KBW.
Please refer to important disclosures and analyst certification information on pages 16 - 18. 18
April 8, 2011"Hey, You Never Know....?" - Closer Look at REIT M&A & Potential Targets


![[Najib Razali] Islamic REITS - prres.net REITs.pdfDo Islamic REITs Behave Differently from Conventional REITs? – Empirical Evidence from Malaysian REITs Sing Tien Foo National University](https://static.documents.pub/doc/80x56/5abe8db57f8b9a7e418d14eb/najib-razali-islamic-reits-prres-reitspdfdo-islamic-reits-behave-differently.jpg)


