57
KDDI CORPORATION Financial Results of the Fiscal Year Ended March 2013 President Takashi Tanaka April 30, 2013

KDDI CORPORATION
Financial Results of the Fiscal Year Ended March 2013
President Takashi Tanaka
April 30, 2013

1
1. Financial Results for FY2013.3
2. Initiatives Targeting the Next Stage
3. Outlook for FY2014.3
4. Shareholder Return
The figures included in the following brief, including the business performance target and the target for the number of subscribers are all projected data based on the information currently available to the KDDI Group, and are subject to variable factors such as economic conditions, a competitive environment and the future prospects for newly introduced services.
Accordingly, please be advised that the actual results of business performance or of the number of subscribers may differ substantially from the projections described here.
Today’s Presentation

Financial Results for FY2013.3
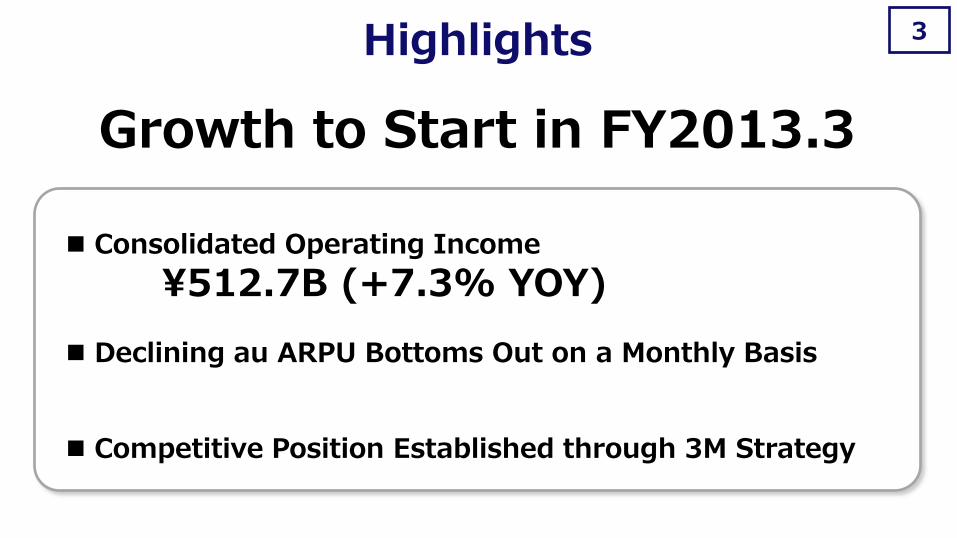
3 Highlights
Growth to Start in FY2013.3
Consolidated Operating Income
¥512.7B (+7.3% YOY) Declining au ARPU Bottoms Out on a Monthly Basis
Competitive Position Established through 3M Strategy

Operating revenues 3,572.1 3,662.3 +2.5%
Operating income 477.6 512.7 +7.3%
Operating margin 13.4% 14.0% -
Ordinary income 451.2 514.4 +14.0%
Net income 238.6 241.5 +1.2%
EBITDA 908.5 959.6 +5.6%
EBITDA margin 25.4% 26.2% -
Free cash flow 241.4 50.9 -
FY13.3FY12.3 yoy
FY12.3 FY13.3
3,572.1
3,662.3
FY12.3 FY13.3
477.6
512.7
+7.3%
YOY +2.5%
YOY
4 Consolidated Financial Results
Operating Revenues Operating Income
Higher Operating Revenues and Income
(Billions of yen)

Operating revenues 2,799.6 2,838.0 +1.4%
Operating income 347.2 378.6 +9.0%
Operating margin 12.4% 13.3% -
EBITDA 713.2 751.0 +5.3%
EBITDA margin 25.5% 26.5% -
yoyFY13.3FY12.3
Operating revenues 136.4 141.9 +4.0%
Operating income 44.4 41.9 -5.7%
Operating margin 32.6% 29.5% -
EBITDA 51.1 51.8 +1.4%
EBITDA margin 37.5% 36.5% -
yoyFY13.3FY12.3
Operating revenues 636.0 638.3 +0.4%
Operating income 75.0 79.8 +6.4%
Operating margin 11.8% 12.5% -
EBITDA 123.1 128.8 +4.6%
EBITDA margin 19.4% 20.2% -
yoyFY13.3FY12.3
Operating revenues 171.6 207.3 +20.8%
Operating income 4.3 7.8 +83.4%
Operating margin 2.5% 3.8% -
EBITDA 13.7 21.3 +55.3%
EBITDA margin 8.0% 10.3% -
yoyFY13.3FY12.3
5 Financial Results by Segment
Value Services
Personal Services
Global Services
Business Services
Revenues Up, Income Up
Revenues Up, Income Down
Revenues Up, Income Up
Revenues Up, Income Up
(Billions of yen) (Billions of yen)
(Billions of yen) (Billions of yen)

6
4,670 4,620
4,490
4,370
4,240 4,240 4,220
4,030
3,800
4,000
4,200
4,400
4,600
4,800
1Q 2Q 3Q 4Q 1Q 2Q 3Q 4Q
FY13.3 FY12.3
-9.2% -8.2% -6.0%
<YOY> 4,000
3,900
4,000
4,100
4,200
4,300
4,400
4,500
4,600
Oct Nov Dec Jan Feb Mar
-7.8%
au ARPU Personal Services
Declines bottom out on a monthly basis in February
(Yen) Quarterly Basis 2H/FY2013.3 Monthly Basis
Note: au ARPU in 4Q of FY12.3 and FY13.3 include impact of the settlement of access charges among carriers. The graph “2H/FY2013.3 Monthly Basis” does not include impact of the settlement of access charges among carriers.
(Yen)

Competitive Position Established through 3M Strategy
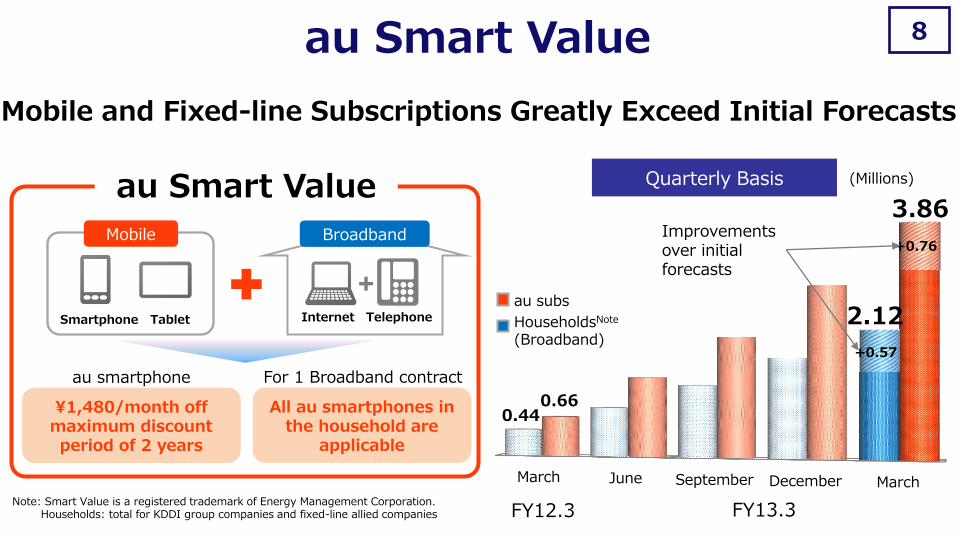
March June September December March
8
Improvements over initial forecasts
0.66 0.44
3.86
2.12
+0.57
+0.76
au subs
HouseholdsNote
(Broadband)
Mobile and Fixed-line Subscriptions Greatly Exceed Initial Forecasts
au Smart Value
Note: Smart Value is a registered trademark of Energy Management Corporation. Households: total for KDDI group companies and fixed-line allied companies
¥1,480/month off maximum discount period of 2 years
Smartphone Tablet Internet Telephone
au smartphone
Mobile Broadband
All au smartphones in the household are
applicable
For 1 Broadband contract
au Smart Value
FY13.3 FY12.3
(Millions) Quarterly Basis
9
1Q 2Q 3Q 4Q
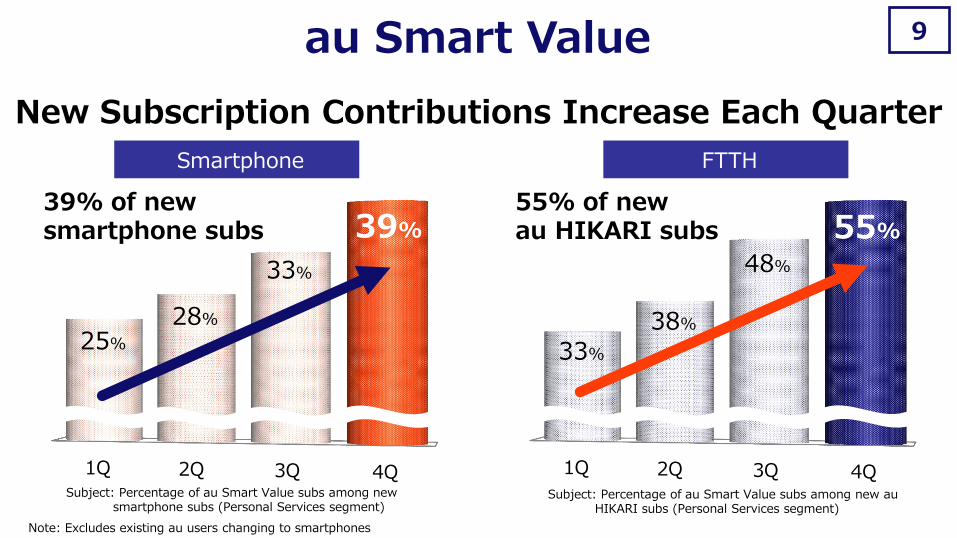
33%
38%
48%
55%
1Q 2Q 3Q 4Q
25%
28%
33%
39%
Smartphone
New Subscription Contributions Increase Each Quarter
FTTH
39% of new smartphone subs
55% of new au HIKARI subs
Subject: Percentage of au Smart Value subs among new smartphone subs (Personal Services segment)
Subject: Percentage of au Smart Value subs among new au HIKARI subs (Personal Services segment)
Note: Excludes existing au users changing to smartphones
au Smart Value

10
FTTH
CATV Allied CATV companies
au HIKARI / au HIKARI Chura (OCT)
Commuf@-hikari (CTC)
Nationwide household
coverage ratioNote3
Approx. 80%
Last year
FTTH 4 companies CATV 41 companies
118 channels
FTTH 5 companiesNote1
CATV 106 companiesNote2
189 channels
Present
Alliances with Energia Communications, Inc. and CATV companies planned
Note1: FTTH 5 companies include 3 KDDI group companies. (Shikoku covered by both “au HIKARI” and “Pikara”) Note2: CATV companies/channels include CATV 22 companies/22 channels through alliance with STNet. Note3: Household coverage ratio in detached house provision area of FTTH/CATV
Number of Fixed-allied Companies Doubled in 1 year
(Scheduled to start expanding alliances in July 2013)
au Smart Value

11
FY12.3 FY13.3
5.74
0.56
+0.74
Becoming a Standard Service for au Smartphones ~Subscription numbers greatly exceeded initial forecasts~
au Smart Pass
Unlimited use of apps
Storage Coupons & points Security
Customer center
Secure verification
¥390/month
au ID
Over 500 popular apps
High capacity (50GB)
O2ONote tie-ups Safer and
more secure
Note: O2O (online to offline) refers to utilizing information available on the Internet to encourage users to purchase items in the real world (community organizations, stores, etc.)
©2012 JustSystems Corporation ©Konami Digital Entertainment ©YAMAHA MUSIC MEDIA CORPORATION ©2009-2013 Kiragames. All Rights Reserved.Published by Quan Inc., ©BANDAI,WiZ ©NBGI ©EAST Co., Ltd. 2009-2012 ©Sanseido Co., Ltd. 2012 ©YOSHIMOTO KOGYO/ ©G-mode ©エキサイト株式会社 ©京都アム有限会社 ©毎日新聞社 ©Rayark Inc. ©NAVITIME JAPAN © Jorte Inc © SOURCENEXT CORPORATION © EAST Co., Ltd. 2009-2012© KONISHI Tomoshichi, MINAMIDE Kosei and Taishukan, 2012© MINAMIDE Kosei, NAKAMURA Mitsuo and Taishukan, 2012 © 2011-2013 TOLOT Inc. All Rights Reserved. 2013 © SHIMAUMA PRINT All Rights Reserved. *TRENDMICRO、およびウイルスバスターは、トレンドマイクロ株式会社の登録商標です。
Trends in Members
(Million members)
Improvements over initial forecasts

12
1Q 2Q 3Q 4Q
250 240 240
250 240
280
300
350 Overall Average
Smartphone Users
(Yen)
FY13.3
Boosting Value ARPU with “au Smart Pass”
Comparison of Value ARPU on Quarterly Basis
Value ARPU

13
20% 32% 43% 52% 39%
Achieved 50% of Initial Goal
Data Offloading Performance
March 2012 June December March 2013 September
Numerator:
Denominator: Definition
Data traffic during peak hour (11-12PM) over one month
Data offloading to Wi-Fi+WiMAX
Total smartphone data traffic (3G+Wi-Fi+WiMAX)
Note: "Wi-Fi" is a registered trademark of Wi-Fi Alliance®. Note: WiMAX is a trademark or a registered trademark of WiMAX Forum.
14
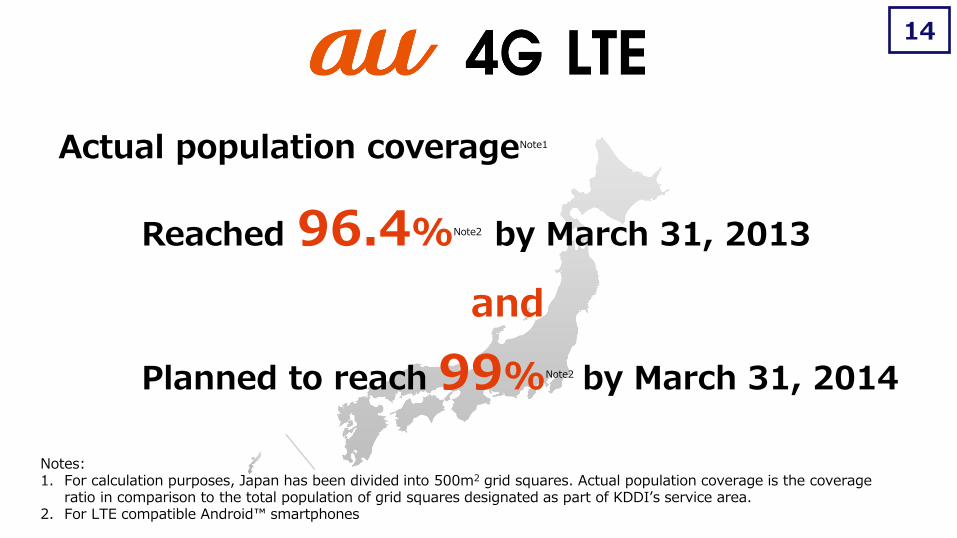
Actual population coverageNote1
Reached 96.4%Note2 by March 31, 2013
and
Planned to reach 99%Note2 by March 31, 2014
Notes: 1. For calculation purposes, Japan has been divided into 500m2 grid squares. Actual population coverage is the coverage
ratio in comparison to the total population of grid squares designated as part of KDDI’s service area. 2. For LTE compatible Android™ smartphones
Increasing Momentum of Mobile and FTTH Services

16
0.86%
1.12%
1Q 2Q 3Q 4Q 1Q 2Q 3Q 4Q
SOFTBANK MOBILE
NTT DOCOMO
0.67%
Increasing Momentum of Mobile Services
Maintaining lowest rate
in the industry
au Churn Rate
Note: au churn rate is calculated for ordinary handsets based on Personal Services segment, which exclude module-type terminals. Based on financial results materials, etc. of each company.
Personal Services
Quarterly Basis
FY2012.3 FY2013.3

17
0
200k
-100k
100k
-200k
FY13.3 1.01M Maximum in the past
Increasing Momentum of Mobile Services Consolidated
MNP Net Additions
No.1 for 18 consecutive months
from October 2011
Note: Created by KDDI based on telecommunications sector analyst reports, etc.
Monthly Basis Period: from April 2011 to March 2013
FY2012.3 FY2013.3
SOFTBANK MOBILE
NTT DOCOMO

19%
37%
0%
10%
20%
30%
40%
50%
60%
1H 2H 1H 2H 1H 2H
18
37% 2H/FY2013.3
Significant increases in 2-year period
Note: Share of net additions among NTT DOCOMO, SOFTBANK MOBILE, and KDDI
FY11.3 FY12.3 FY13.3
Changes by 6-month period
Increasing Momentum of Mobile Services Consolidated
Net Addition Share SOFTBANK MOBILE
NTT DOCOMO

19
3Q/FY2012.3 4Q/FY2013.3
Down
38%
FY12.3 FY13.3
352k
601k YOY 1.7X
Increasing Momentum of FTTH Services
FTTH Net Additions
Significantly increasing net additions while also decreasing acquisitions costs
Acquisitions Costs for au HIKARI Users
Personal Services
Before introducing au Smart Value
Note: FTTH net additions: total for KDDI group’s FTTH services (au HIKARI, au HIKARI Chura, and Commuf@-hikari)

Initiatives Targeting the Next Stage

Strategies for the Next 3 Years 21
“Reconstruction of Foundational Business”
“Growth to Start”
Complete recovery of au momentum
Full-scale implementation of 3M Strategy
FY12.3
FY13.3
FY14.3~ FY16.3
“Full-scale Income Growth” Advance and develop 3M Strategy implement Global Strategy
22
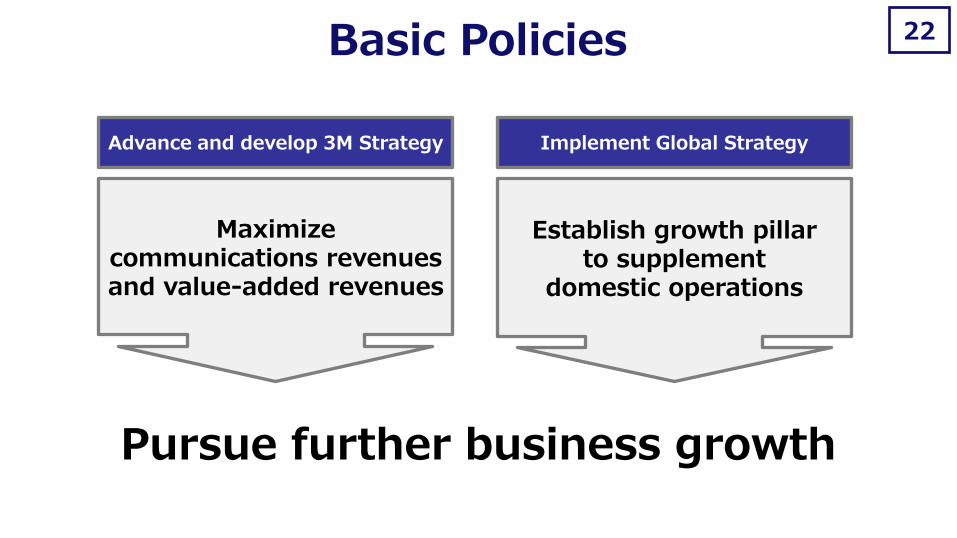
Advance and develop 3M Strategy Implement Global Strategy
Maximize communications revenues and value-added revenues
Establish growth pillar to supplement
domestic operations
Pursue further business growth
Basic Policies

3M Strategy
23 Business Model
Customer base
ARPU
Note: Calculated based on personal services figures
Value-added revenues
Communications revenues
Broadband (FTTH/CATV)
+
Smartphone penetration still
at 37%Note
Maximize Revenues
Churn reduction New acquisitions
(FY13.3)
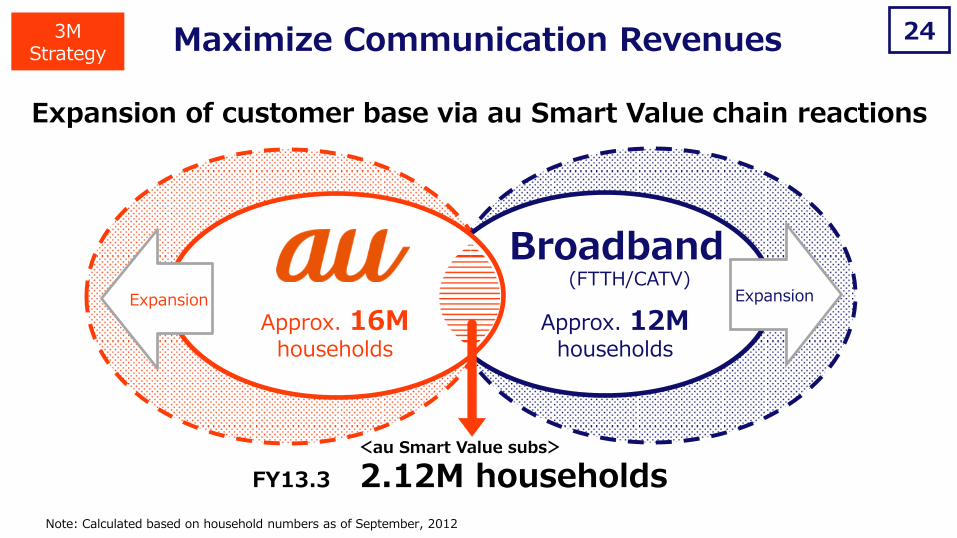
24
Expansion Expansion
Approx. 16M households
Broadband (FTTH/CATV)
Approx. 12M households
Expansion of customer base via au Smart Value chain reactions
Maximize Communication Revenues 3M Strategy
<au Smart Value subs>
FY13.3 2.12M households
Note: Calculated based on household numbers as of September, 2012

Customer contact point expansion
Business expansion
25
au Smart Pass
Up-selling
and more
Referral business opportunity
Note: O2O (online to offline) refers to utilizing information available on the Internet to encourage users to purchase items in the real world (community organizations, stores, etc.)
Uta Pass Video Pass Book Pass ・・・
Maximize Value-added Revenues 3M Strategy
Expansion of businesses spawned from au Smart Pass
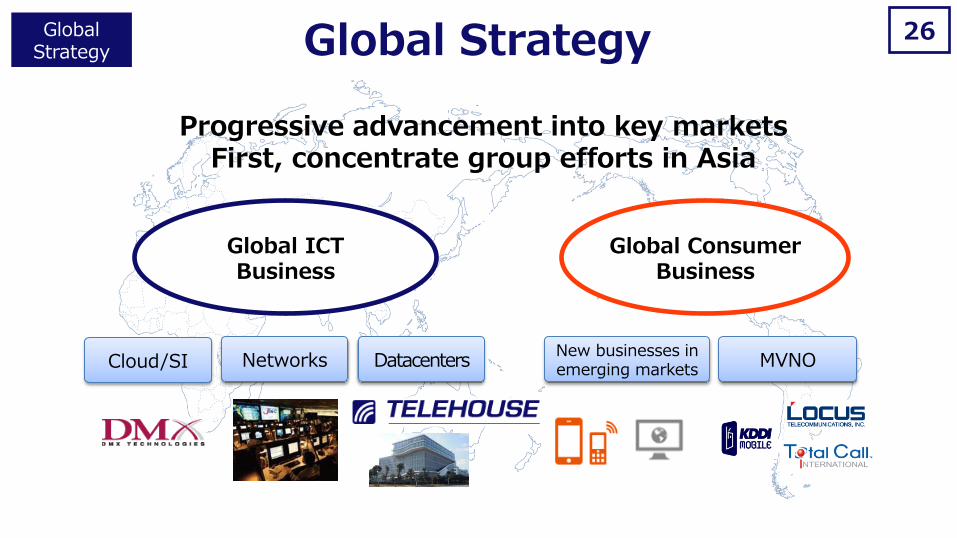
Global Strategy 26 Global Strategy
Global ICT Business
Progressive advancement into key markets First, concentrate group efforts in Asia
Global Consumer Business
Datacenters Cloud/SI Networks MVNO New businesses in emerging markets

Targets for the Next Stage 27
“Achieve continuous growth and enhance shareholder returns”
Consider as possible option for management
Double-digit annual growth rate
Large increases accompanying income growth
Dividend payout ratio
over 30%
Profit Growth
Consolidated Operating Income
EPS
Dividend Policy
Share Buyback
Shareholder Return
Past (FY2011.3–FY2013.3)
Future (FY2014.3–FY2016.3)
Gradually raise to 25–30%
Average annual growth
4.23%
Average annual growth
4.24%
Note: EPS (Earnings per Share):Net income per share

Outlook for FY2014.3

29 Reasons for FY14.3 Performance Forecasts
” Target Income Growth Exceeding 20%”
<1st Year of Initiatives Targeting the Next Stage>
Operating income, EBITDA, and net income all forecasted to grow more than 20% YOY
→J:COM to be consolidated in April (contributions throughout full year)
Increased communications revenues will drive income growth
→Substantial increase in communications revenues for the Personal Services segment (+¥75.6B)
→Consolidated au net additions of 2.3M forecasted
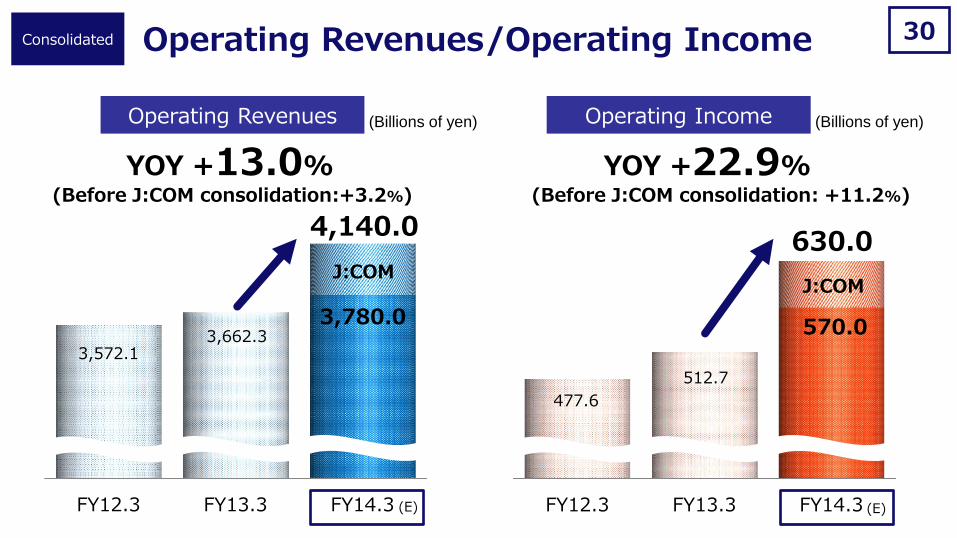
30
FY12.3 FY13.3 FY14.3
3,572.1 3,662.3
4,140.0
(E)
YOY +13.0%
J:COM
3,780.0
FY12.3 FY13.3 FY14.3
477.6
512.7
630.0
J:COM
570.0
(E)
YOY +22.9%
Operating Revenues/Operating Income
Operating Income Operating Revenues
Consolidated
(Billions of yen) (Billions of yen)
(Before J:COM consolidation:+3.2%) (Before J:COM consolidation: +11.2%)
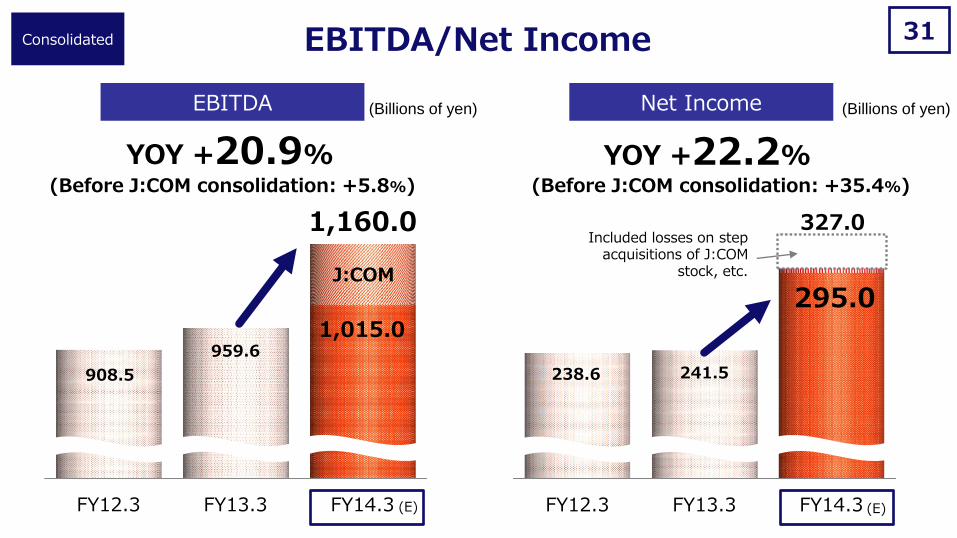
31
FY12.3 FY13.3 FY14.3
908.5
959.6
1,160.0
YOY +20.9%
J:COM
1,015.0
FY12.3 FY13.3 FY14.3
238.6 241.5
295.0
327.0
YOY +22.2%
EBITDA/Net Income
Net Income EBITDA
Consolidated
(Billions of yen) (Billions of yen)
(Before J:COM consolidation: +5.8%) (Before J:COM consolidation: +35.4%)
Included losses on step acquisitions of J:COM
stock, etc.
(E) (E)

Free Cash Flow
CAPEX Operating Revenues
Net Income
Operating Income
32
¥360B
¥90B
-¥32B
¥60B
¥60B
Of which includes extraordinary factors in FY2014.3: ¥30B
Note: Includes income and expenditure influences of J:COM consolidation and integration with JCN (unification of accounting standards, etc.)
Of which losses on step acquisitions of J:COM stock: -¥37.5B
(Ref.) Financial ImpactsNote of J:COM Consolidation
Reflected in Consolidated Performance Forecasts for FY2014.3
Consolidated
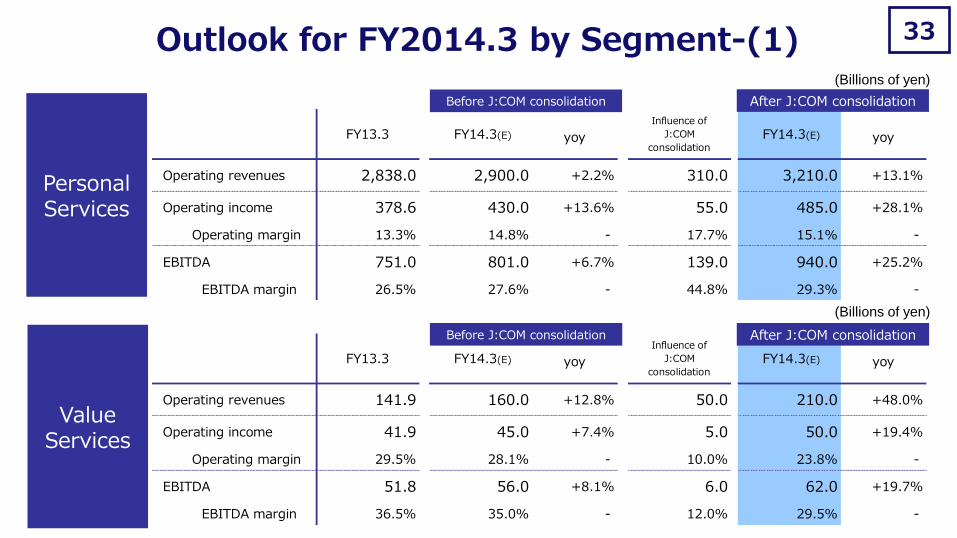
Operating revenues 2,838.0 2,900.0 +2.2% 310.0 3,210.0 +13.1%
Operating income 378.6 430.0 +13.6% 55.0 485.0 +28.1%
Operating margin 13.3% 14.8% - 17.7% 15.1% -
EBITDA 751.0 801.0 +6.7% 139.0 940.0 +25.2%
EBITDA margin 26.5% 27.6% - 44.8% 29.3% -
yoyFY13.3 FY14.3(E)
Influence of
J:COM
consolidation FY14.3(E)yoy
Operating revenues 141.9 160.0 +12.8% 50.0 210.0 +48.0%
Operating income 41.9 45.0 +7.4% 5.0 50.0 +19.4%
Operating margin 29.5% 28.1% - 10.0% 23.8% -
EBITDA 51.8 56.0 +8.1% 6.0 62.0 +19.7%
EBITDA margin 36.5% 35.0% - 12.0% 29.5% -
FY13.3 FY14.3(E)
Influence of
J:COM
consolidation FY14.3(E) yoyyoy
33 Outlook for FY2014.3 by Segment-(1)
Value Services
Personal Services
Before J:COM consolidation After J:COM consolidation
Before J:COM consolidation After J:COM consolidation
(Billions of yen)
(Billions of yen)
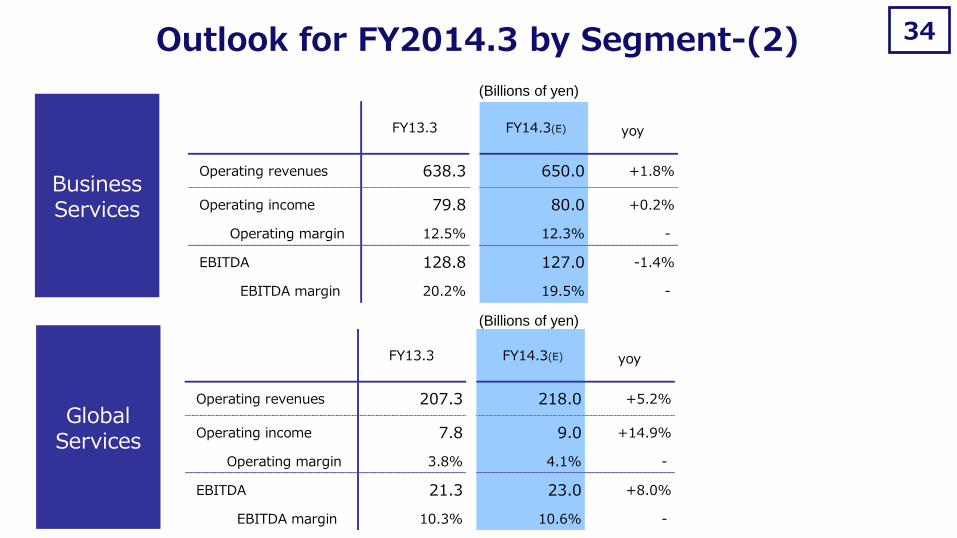
Operating revenues 638.3 650.0 +1.8%
Operating income 79.8 80.0 +0.2%
Operating margin 12.5% 12.3% -
EBITDA 128.8 127.0 -1.4%
EBITDA margin 20.2% 19.5% -
FY13.3 FY14.3(E) yoy
Operating revenues 207.3 218.0 +5.2%
Operating income 7.8 9.0 +14.9%
Operating margin 3.8% 4.1% -
EBITDA 21.3 23.0 +8.0%
EBITDA margin 10.3% 10.6% -
yoyFY13.3 FY14.3(E)
34
Global Services
Business Services
(Billions of yen)
(Billions of yen)
Outlook for FY2014.3 by Segment-(2)
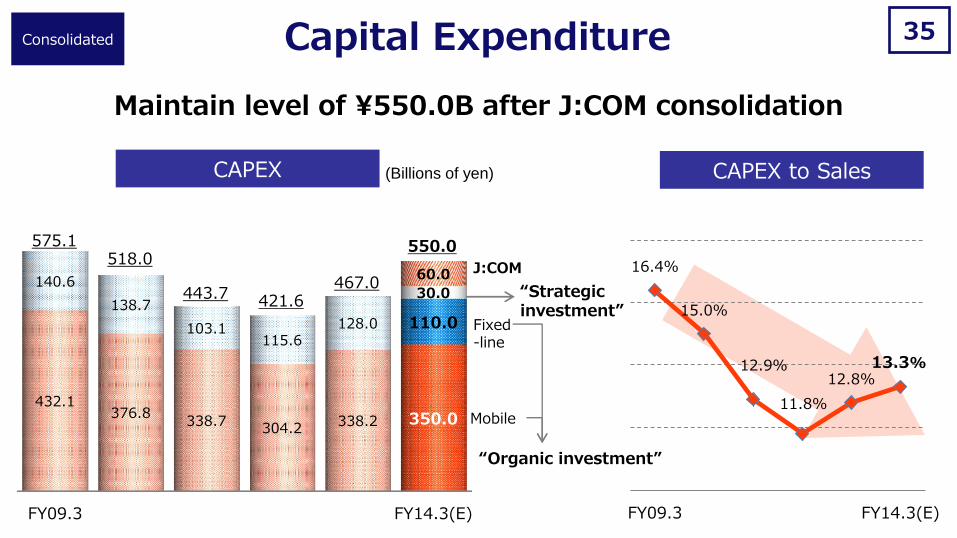
35
16.4%
15.0%
12.9%
11.8%
12.8% 13.3%
FY09.3 FY14.3(E)FY09.3 FY14.3(E)
432.1 376.8
338.7 304.2
338.2 350.0
140.6
138.7
103.1 115.6
128.0 110.0
30.0
60.0
575.1 518.0
443.7 421.6
550.0
467.0
Maintain level of ¥550.0B after J:COM consolidation
Capital Expenditure Consolidated
CAPEX to Sales CAPEX (Billions of yen)
Mobile
Fixed-line
“Strategic investment”
“Organic investment”
J:COM

Communications Revenue Growth

37
FY12.3 FY13.3 FY14.3
1,591.2
1,568.4
1,612.0
(E)
+2.8% YOY
-1.4% YOY
Mobile Communications Revenues
YOY Change
Personal Services
(Billions of yen)
Revenue growth achieved for first time in 5 years
+¥43.6B YOY

38
FY12.3 FY13.3 FY14.3
327.8
365.0
397.0
+8.8%
YOY
+11.4%
YOY
Fixed-line Communications
Revenues
Greater revenue growth
YOY Change
Note: Excludes revenues from J:COM
(Billions of yen)
Personal Services
+¥32B YOY
(E)

39
FY12.3 FY13.3 FY14.3
1,591.2 1,568.4 1,612.0
327.8 365.0 397.0
2,009.0 1,919.0 1,933.4
+3.9% YOY
+0.8% YOY
Total Amount of Communications
Revenues (Mobile & Fixed-line)
Mobile
Fixed-line
Transform into a driver for future business
growth
Personal Services
YOY Change (Billions of yen)
+¥75.6B YOY
(E)
Note: Excludes revenues from J:COM

FY12.3 FY13.3 FY14.3
2.60 2.30
2.11
2.10
+0.50
40
(E)
Initial forecast
Target level of net additions that exceeds
FY2013.3's initial forecast
Cumulative total of over 40M as of March 31, 2014
au Net Additions
(Millions) YOY Change
Consolidated

FY12.3 FY13.3 FY14.3
41
0.44 0.66
6.90
3.45
au subs
HouseholdsNote
au Smart Value
Further expand subscriptions for both mobile and fixed-line
YOY Change
(E)
(Millions)
Note: Households: total for KDDI group companies and fixed-line allied companies
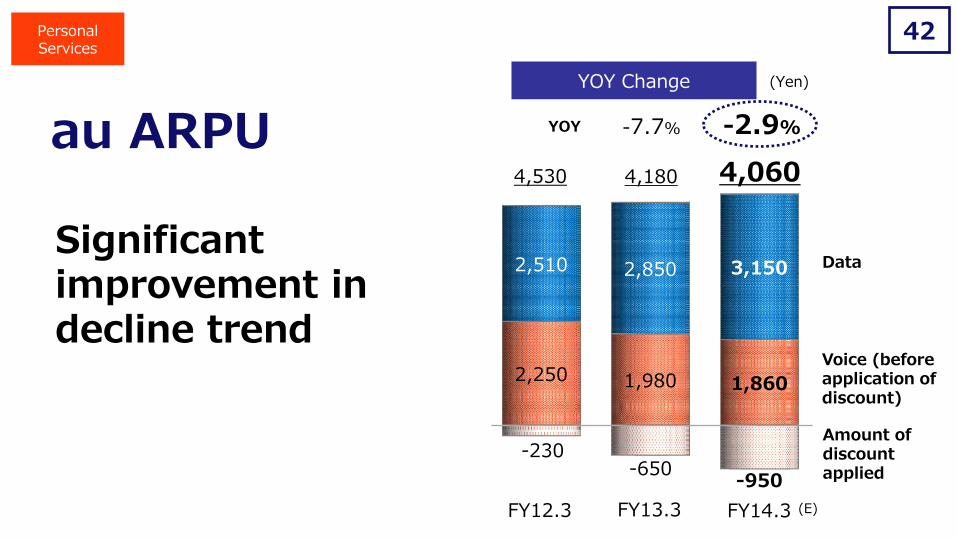
-230 -650
-950
2,250 1,980 1,860
2,510 2,850 3,150
4,180 4,530
FY12.3
4,060
FY13.3 FY14.3
-7.7% -2.9%
42
au ARPU
Personal Services
Significant improvement in decline trend
(Yen) YOY Change
YOY
Data
Voice (before application of discount)
Amount of discount applied
(E)
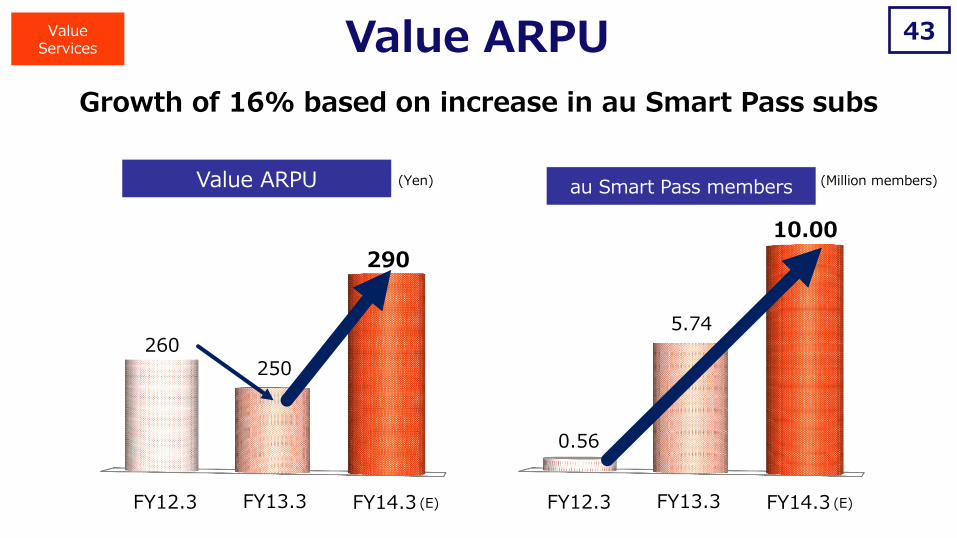
43
260 250
290
10.00
5.74
0.56
FY12.3 FY13.3 FY14.3 (E) FY12.3 FY13.3 FY14.3 (E)
Value ARPU
Growth of 16% based on increase in au Smart Pass subs
au Smart Pass members Value ARPU (Yen) (Million members)
Value Services

Shareholder Return
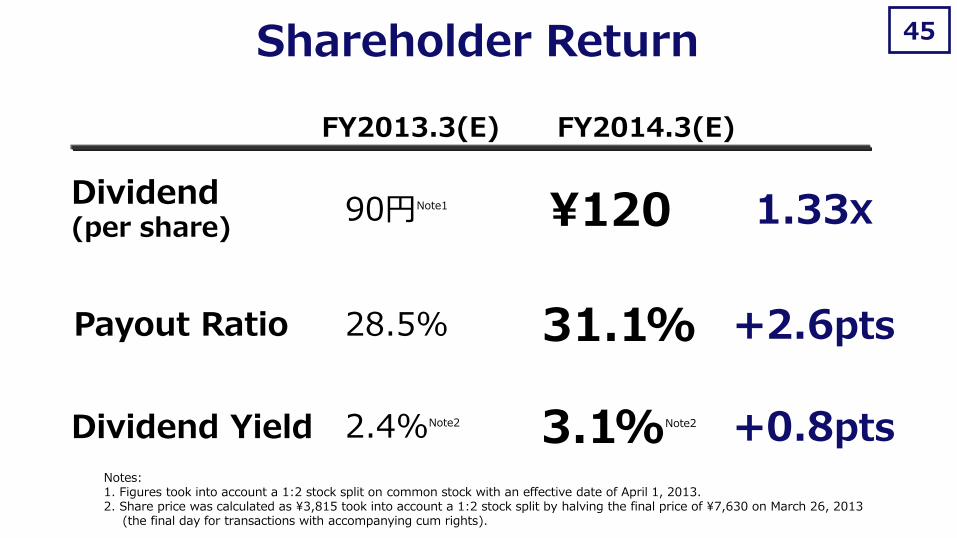
45
28.5% 31.1% +2.6pts
90円Note1 ¥120 1.33X
2.4%Note2 3.1%Note2
+0.8pts Notes: 1. Figures took into account a 1:2 stock split on common stock with an effective date of April 1, 2013. 2. Share price was calculated as ¥3,815 took into account a 1:2 stock split by halving the final price of ¥7,630 on March 26, 2013
(the final day for transactions with accompanying cum rights).
Dividend (per share)
Payout Ratio
Dividend Yield
Shareholder Return
FY2013.3(E) FY2014.3(E)

FY02.3 FY04.3 FY06.3 FY08.3 FY10.3 FY12.3 FY14.3
4.48 4.48 6.00 12.00 17.50 22.50 25.00 27.50 27.50 32.50 37.50 42.50
60.00
5.00
5.00
4.48 6.00 12.00
17.50 22.50 25.00
27.50 27.50 32.50 37.50
42.50 47.50
60.00
46
8.95 10.475 18.00
34.50 40.00
47.50
52.50 55.00 65.00
70.00
80.00
90.00
- 17.5% 16.8% 21.2% 20.8% 22.4% 21.5% 22.0% 27.2% 24.1% 27.5% 31.1%
FY13.3
(Yen)
(E) (E)
120.00
28.5%
Dividend per Share and Payout Ratio
[Dividend per Share]
Note: Figures took into account a 1:2 stock split on common stock with an effective date of April 1, 2013. (Dividend payment figures from the FY02.3 interim dividend to the FY13.3 year-end dividend have been restated in consideration of the stock split for convenience purposes.)
Year-end Dividend
Commemorative Dividend
Interim Dividend
[Consolidated Payout Ratio]

47
Consolidated Operating Income:
¥512.7B
au ARPU Declines bottom out on a monthly basis
Full consolidation of J:COM
Consolidated Operating Income:
+23% growth
Dividend 1.33x
Consolidated Operating Income:
Double-digit annual growth rate
Dividend Payout Ratio
over 30%
Summary
FY2013.3 performance FY2014.3 forecast Goals leading up to FY2016.3
“Achieving both continuous income growth & shareholder return enhancement”

Appendix
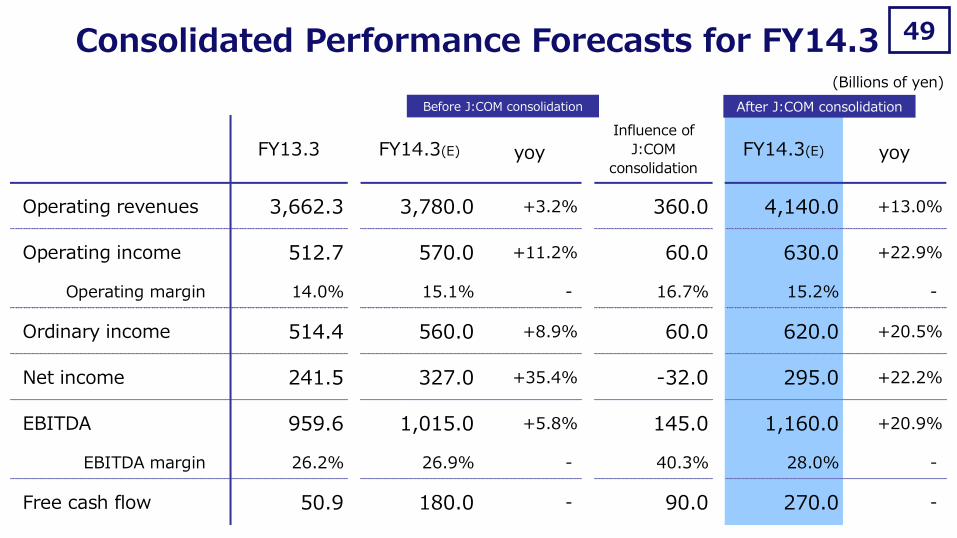
Operating revenues 3,662.3 3,780.0 +3.2% 360.0 4,140.0 +13.0%
Operating income 512.7 570.0 +11.2% 60.0 630.0 +22.9%
Operating margin 14.0% 15.1% - 16.7% 15.2% -
Ordinary income 514.4 560.0 +8.9% 60.0 620.0 +20.5%
Net income 241.5 327.0 +35.4% -32.0 295.0 +22.2%
EBITDA 959.6 1,015.0 +5.8% 145.0 1,160.0 +20.9%
EBITDA margin 26.2% 26.9% - 40.3% 28.0% -
Free cash flow 50.9 180.0 - 90.0 270.0 -
yoyyoyFY13.3 FY14.3(E)
Influence of
J:COM
consolidationFY14.3(E)
49 Consolidated Performance Forecasts for FY14.3
Before J:COM consolidation After J:COM consolidation
(Billions of yen)

FY13.3 FY14.3(E) Change Change rate
au subscriptions '000 32,189 33,689 +1,500 +4.7%
au churn rate % 0.63 0.69 +0.06 -
au ARPU yen 4,180 4,060 -120 -2.9%
au handset sales '000 11,080 10,900 -180 -1.6%
of smartphone sales '000 8,110 8,600 +490 +6.0%
au sales commissions yen 25,000 27,000 +2,000 -
au handset shipments '000 10,660 10,680 +20 +0.2%
50 Consolidated KPI in FY2014.3-(1)
Personal Services
Consolidated FY13.3 FY14.3(E) Change Change rate
au subscriptions '000 37,709 40,009 +2,300 +6.1%

3/'13 3/'14(E) Change
Data offload rate % 52 54 +2
51
Note
Value Services
Personal Services
--
Note: Data offload rate for 3/’14 includes data traffic of LTE compatible handsets.
Consolidated KPI in FY2014.3-(2)
FY13.3 FY14.3(E) Change Change rate
au Smart Pass members '000 5,740 10,000 +4,260 +74.2%
Value ARPU yen 250 290 +40 +16.0%
FY13.3 FY14.3(E) Change Change rate
【Utilizing au Smart Value】
au subscriptions
【Utilizing au Smart Value】
Households
FTTH subscriptions '000 2,822 3,260 +438 +15.5%
'000 2,120 3,450 +1,330 +62.7%
'000 3,860 6,900 +3,040 +78.8%
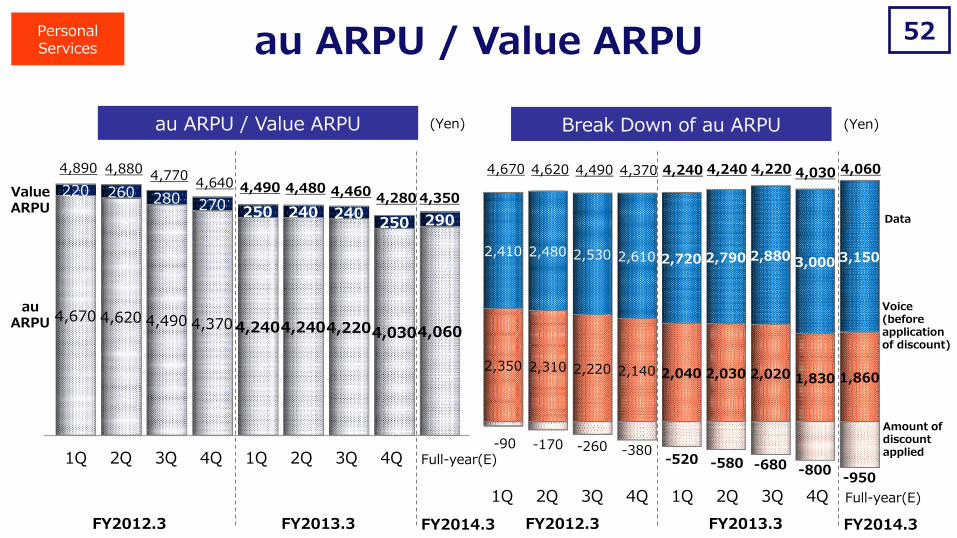
-90 -170 -260 -380 -520 -580 -680 -800
-950
2,350 2,310 2,220 2,140 2,040 2,030 2,020 1,830 1,860
2,410 2,480 2,530 2,610 2,720 2,790 2,880 3,000 3,150
4,670 4,620 4,490 4,370 4,240 4,240 4,220 4,030
2Q 1Q 4Q 3Q 2Q 1Q 3Q 4Q
4,060
52
4,890 4,880 4,770
4,640 4,490 4,480
2Q 1Q 4Q 3Q 2Q 1Q
4,460
3Q 4Q
4,280 4,350
4,670 4,620 4,490 4,370 4,240 4,240 4,220 4,030 4,060
220 260 280 270 250 240 240 250 290
au ARPU / Value ARPU
(Yen) au ARPU / Value ARPU Break Down of au ARPU (Yen)
Voice (before application of discount)
Amount of discount applied
Data
Value ARPU
au ARPU
FY2013.3 FY2012.3 FY2013.3 FY2014.3 FY2012.3 FY2014.3
Personal Services
Full-year(E)
Full-year(E)
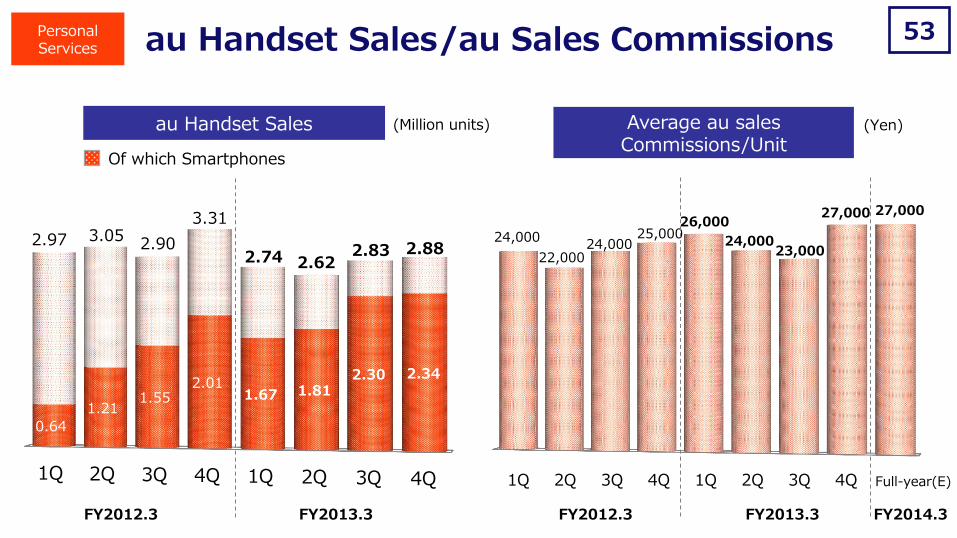
1Q 2Q 3Q 4Q 1Q 2Q 3Q 4Q
0.64
1.21 1.55
2.01 1.67 1.81
2.30 2.34
(Million units)
24,000
22,000 24,000
25,000 26,000
24,000 23,000
27,000 27,000
53
(Yen)
2Q 1Q 4Q 3Q 2Q 1Q 3Q 4Q
2.97 3.05 2.90
3.31
2.74 2.62 2.83 2.88
Of which Smartphones
FY2012.3 FY2013.3 FY2012.3 FY2013.3
au Handset Sales Average au sales Commissions/Unit
Personal Services au Handset Sales/au Sales Commissions
FY2014.3
Full-year(E)

54
477.6
-22.8
+14.5
+35.0
512.7
630.0
570.0
J:COM
+60
+117.3
(a) (b)
(c) +37.3
(a)
+75.6
+20.6
-18.3 (b)
(c)
+43.6
+32.0
(E)
Consolidated Operating Income Factor for Increase YOY (Billions of yen)
(a): <Personal Services>Mobile Communications Revenues (b): <Personal Services>Fixed-line Communications Revenues (c): Others
Financial impact of the elimination of bandwidth reorganization costs
FY12.3 → FY13.3 FY13.3 → FY14.3(E)
: ¥+60.0B : ¥+18.0B
<Personal Services>
<Personal Services>
FY2012.3 FY2013.3 FY2014.3
Communications Revenues
Communications Revenues
Consolidated

55
1Q 2Q 3Q 4Q 1Q 2Q 3Q 4Q
1,600 1,600 1,700
2,000
1,750 1,750
2,050
1,650
¥1,800 ¥1,800
(Full-year) (Full-year)
7%
12%
17%
23%
31%
36% 38%
42%
1Q 2Q 3Q 4Q 1Q 2Q 3Q 4Q
Maitsuki Discount (Monthly Discount) Personal Services
FY2012.3 FY2013.3 FY2012.3 FY2013.3
Maitsuki Discount unit price Take-up Ratio (Yen)


