Presentation to the Regional Congress of Actuaries in Africa The Kenyan Mortality Tables: KE 2001 - 2003 Crowne Plaza Hotel – Nairobi 3 – 4 November 2011 KE 2001 – 2003 Tables for Assured Lives
Transcript
Presentation to the
Regional Congress of Actuaries in Africa
The Kenyan Mortality Tables: KE 2001 - 2003
Crowne Plaza Hotel – Nairobi
3 – 4 November 2011
KE 2001 – 2003
Tables for Assured Lives
Page 2 Slide 2
Agenda
Introduction and Overview of Study
Review of Data Collection Exercise
Summary of Data
Methodology
Period of Investigation
Graduation of Crude Rates
Individual Life, Group Life and Annuitants
Recommendations
Page 3 Slide 3
Introduction and Background
Project entailed an investigation of mortality and
morbidity experience of insured lives in Kenya
Project undertaken in four phases: July 2005 to July 2007
Phase I - mortality experience of individual assured lives
Phase II –mortality experience of group assured lives
Phase III - study of mortality experience of annuitants
Phase IV - study of morbidity (sickness) rates
Completed investigations for all 4 phases and released
18 life companies requested to provide individual life
assured data and group life data
7 companies requested for annuitants data and 10 for
morbidity data
Each company provided with a copy of the data
required and format for the mortality study
Important that all companies participate
Page 5 Slide 5
Review of Data Collection Exercise
Exposure data requested
Data requested for all in-force policies as at 31
December 2000, 2001, 2002, 2003 and 2004
Claims data requested
Data requested for all death claims notified in the
years 2001, 2002, 2003 and 2004
„Principle of Correspondence‟ critical
Page 6 Slide 6
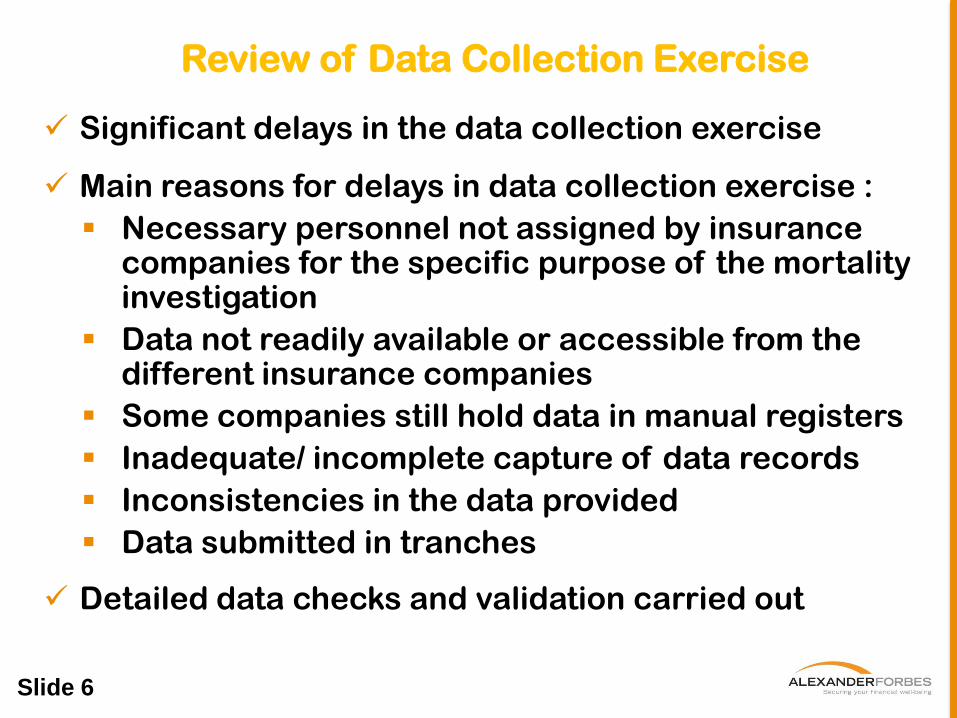
Review of Data Collection Exercise
Significant delays in the data collection exercise
Main reasons for delays in data collection exercise :
Necessary personnel not assigned by insurance companies for the specific purpose of the mortality investigation
Data not readily available or accessible from the different insurance companies
Some companies still hold data in manual registers
Inadequate/ incomplete capture of data records
Inconsistencies in the data provided
Data submitted in tranches
Detailed data checks and validation carried out
Page 7 Slide 7
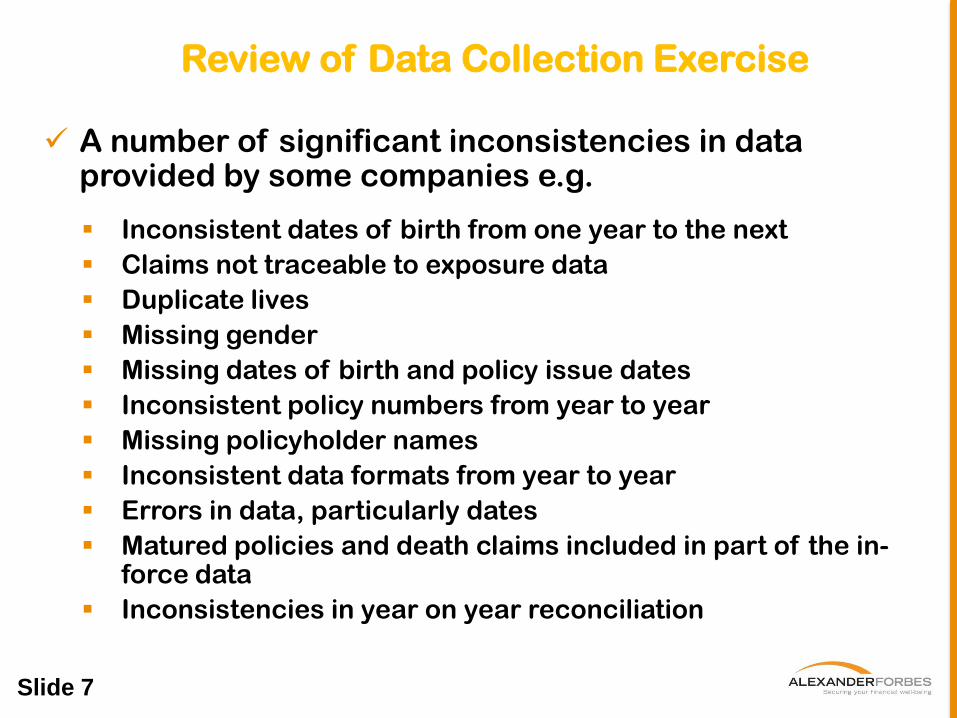
Review of Data Collection Exercise
A number of significant inconsistencies in data provided by some companies e.g.
Inconsistent dates of birth from one year to the next
Claims not traceable to exposure data
Duplicate lives
Missing gender
Missing dates of birth and policy issue dates
Inconsistent policy numbers from year to year
Missing policyholder names
Inconsistent data formats from year to year
Errors in data, particularly dates
Matured policies and death claims included in part of the in-force data
Inconsistencies in year on year reconciliation
Page 8 Slide 8
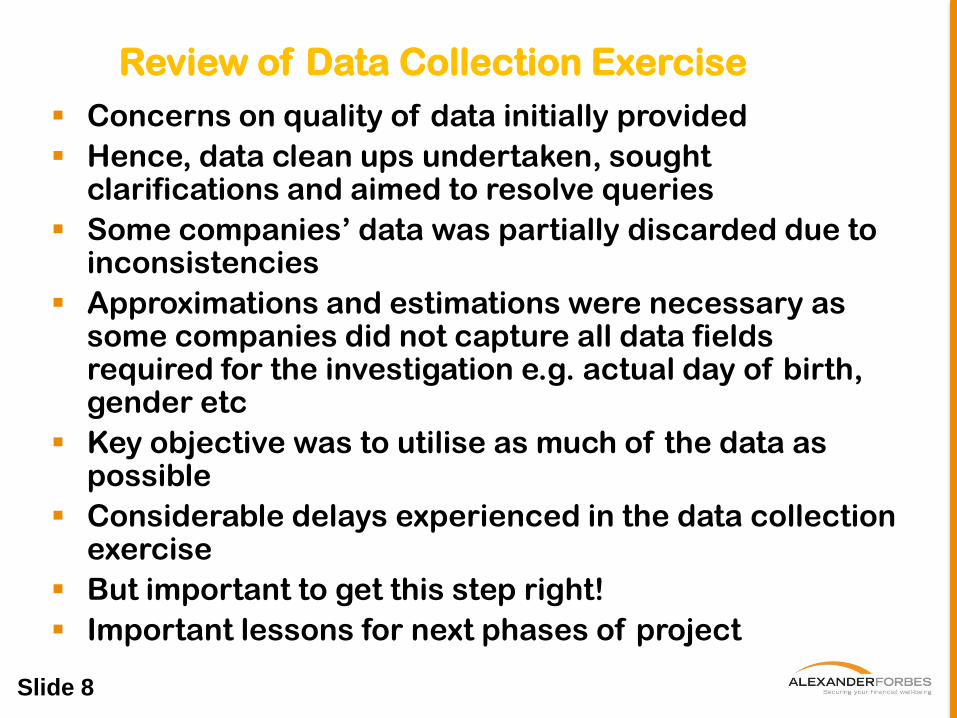
Review of Data Collection Exercise
Concerns on quality of data initially provided
Hence, data clean ups undertaken, sought clarifications and aimed to resolve queries
Some companies‟ data was partially discarded due to inconsistencies
Approximations and estimations were necessary as some companies did not capture all data fields required for the investigation e.g. actual day of birth, gender etc
Key objective was to utilise as much of the data as possible
Considerable delays experienced in the data collection exercise
But important to get this step right!
Important lessons for next phases of project
Page 9 Slide 9
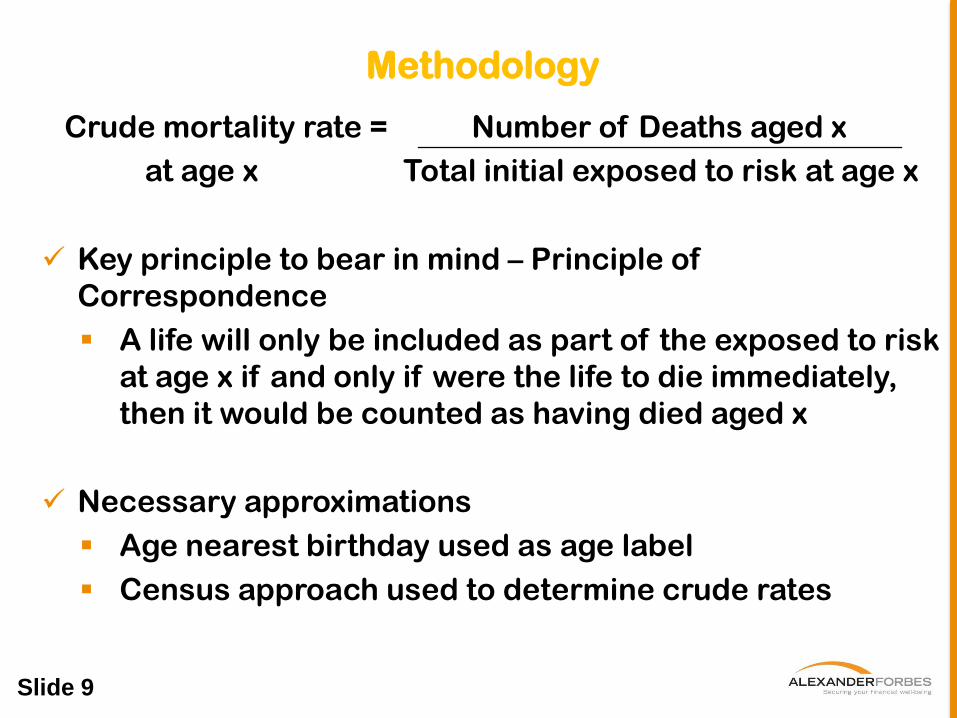
Methodology
Crude mortality rate = Number of Deaths aged x
at age x Total initial exposed to risk at age x
Key principle to bear in mind – Principle of
Correspondence
A life will only be included as part of the exposed to risk
at age x if and only if were the life to die immediately,
then it would be counted as having died aged x
Necessary approximations
Age nearest birthday used as age label
Census approach used to determine crude rates
Page 10 Slide 10
Period of Investigation
Period selected is 2001-2003
Balance between reasonable volumes and exposure period and
Ensuring data as recent as possible and homogeneity of experience
Other factors
Computerization of records by insurers recent and/or not complete in some cases
Claims experience for 2004 may not be fully developed or complete and hence exclusion of 2004
Page 11 Slide 11
Graduation of Crude Rates
Graduation of crude rates necessary in order to:
Produce set of smoothly progressing rates
(“smoothness”)
Reduce the effect of randomly observed deaths
(“goodness of fit”)
However need balance to avoid over or under
graduation
Compare graduated rates with standard published
mortality and morbidity tables commonly in use
Individual Lives
Page 13 Slide 13
Crude Rates - Males
Generally increasing trend of mortality rates
0.00
0.01
0.02
0.03
0.04
0.05
0.06
16 36 56 76 96
Rate
s
Age
Crude Rates
Page 14 Slide 14
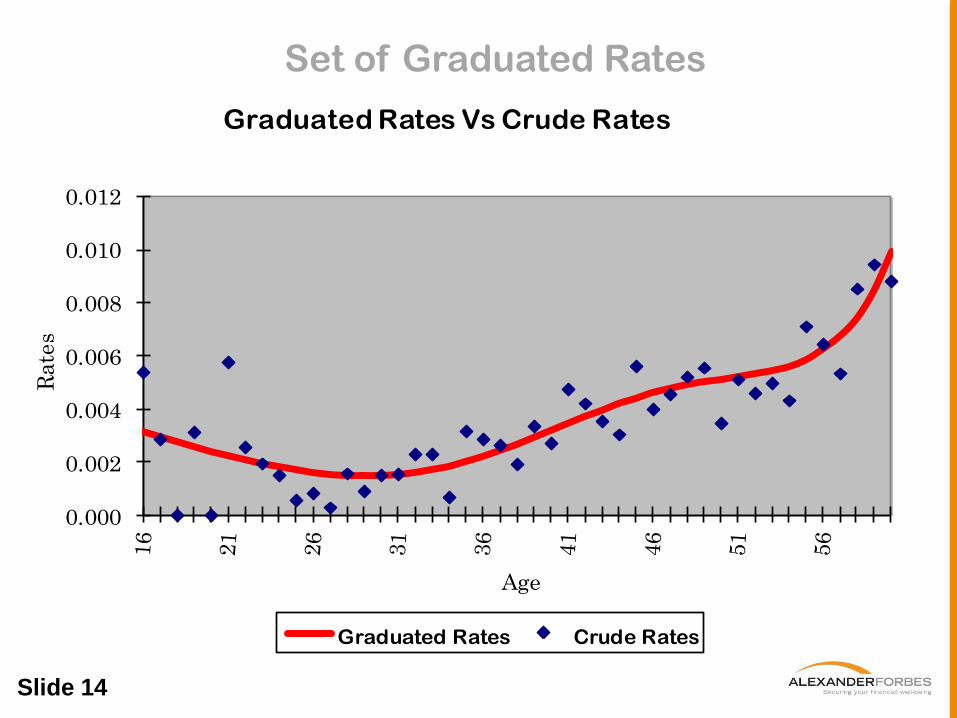
Set of Graduated Rates
0.000
0.002
0.004
0.006
0.008
0.010
0.012
Rate
s
Age
Graduated Rates Vs Crude Rates
Graduated Rates Crude Rates
Page 15 Slide 15
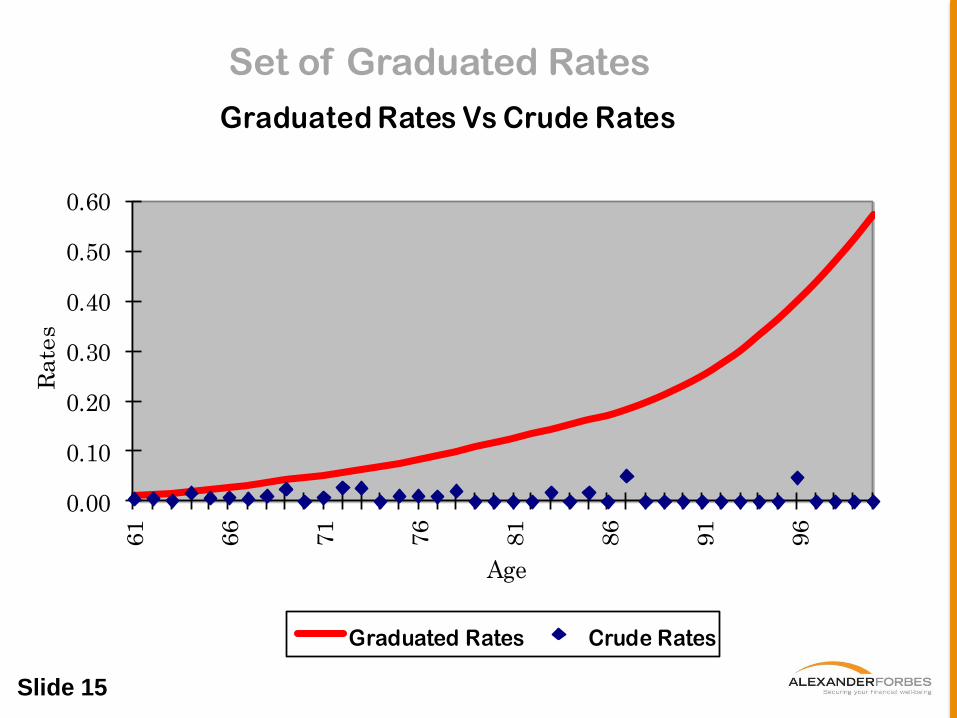
Set of Graduated Rates
0.00
0.10
0.20
0.30
0.40
0.50
0.60
61
66
71
76
81
86
91
96
Rate
s
Age
Graduated Rates Vs Crude Rates
Graduated Rates Crude Rates
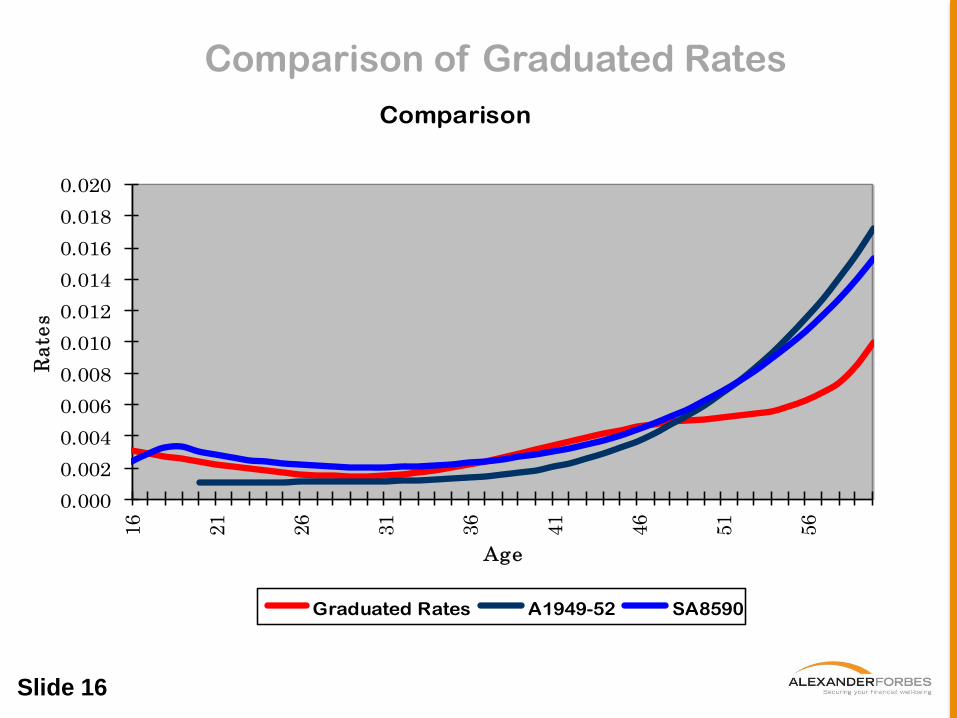
Page 16 Slide 16
Comparison of Graduated Rates
0.000
0.002
0.004
0.006
0.008
0.010
0.012
0.014
0.016
0.018
0.020
16
21
26
31
36
41
46
51
56
Ra
tes
Age
Comparison
Graduated Rates A1949-52 SA8590
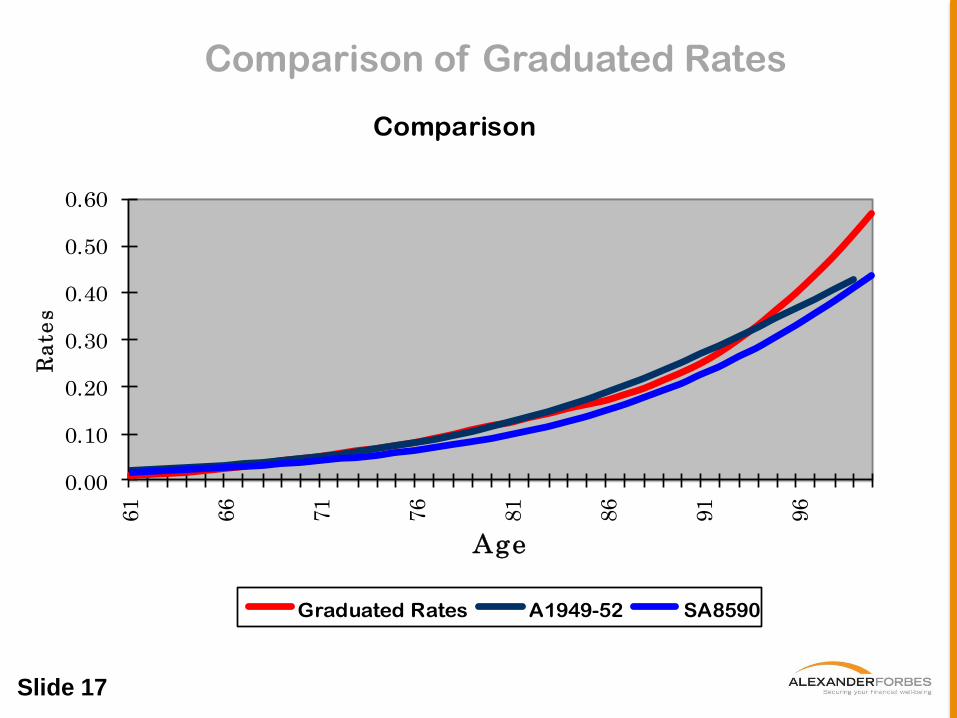
Page 17 Slide 17
Comparison of Graduated Rates
0.00
0.10
0.20
0.30
0.40
0.50
0.60
61
66
71
76
81
86
91
96
Ra
tes
Age
Comparison
Graduated Rates A1949-52 SA8590
Page 18 Slide 18
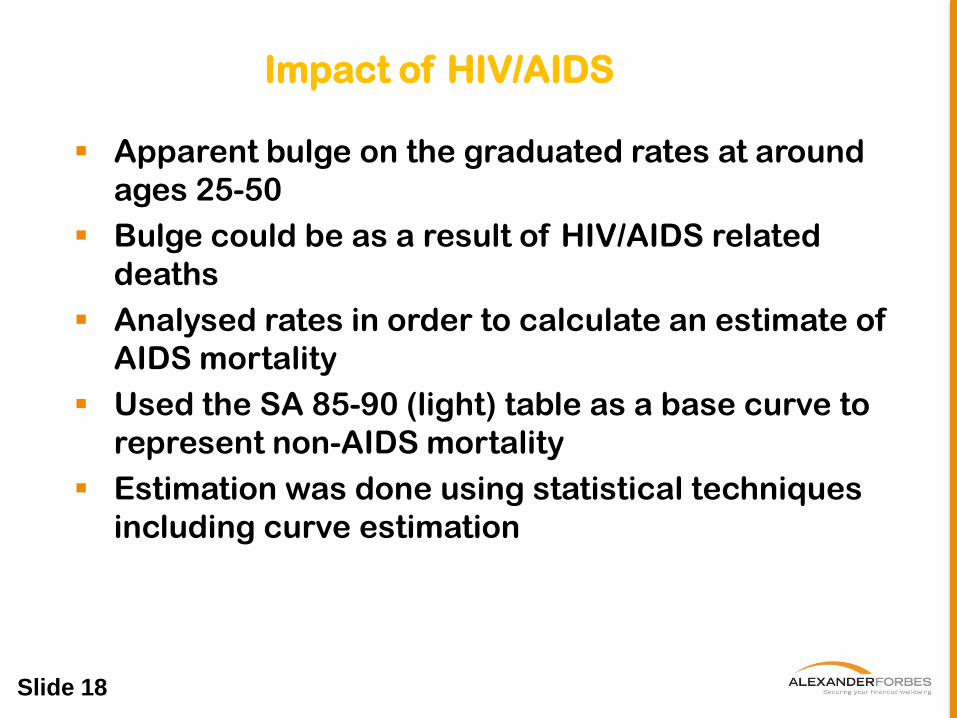
Impact of HIV/AIDS
Apparent bulge on the graduated rates at around
ages 25-50
Bulge could be as a result of HIV/AIDS related
deaths
Analysed rates in order to calculate an estimate of
AIDS mortality
Used the SA 85-90 (light) table as a base curve to
represent non-AIDS mortality
Estimation was done using statistical techniques
including curve estimation
Page 19 Slide 19
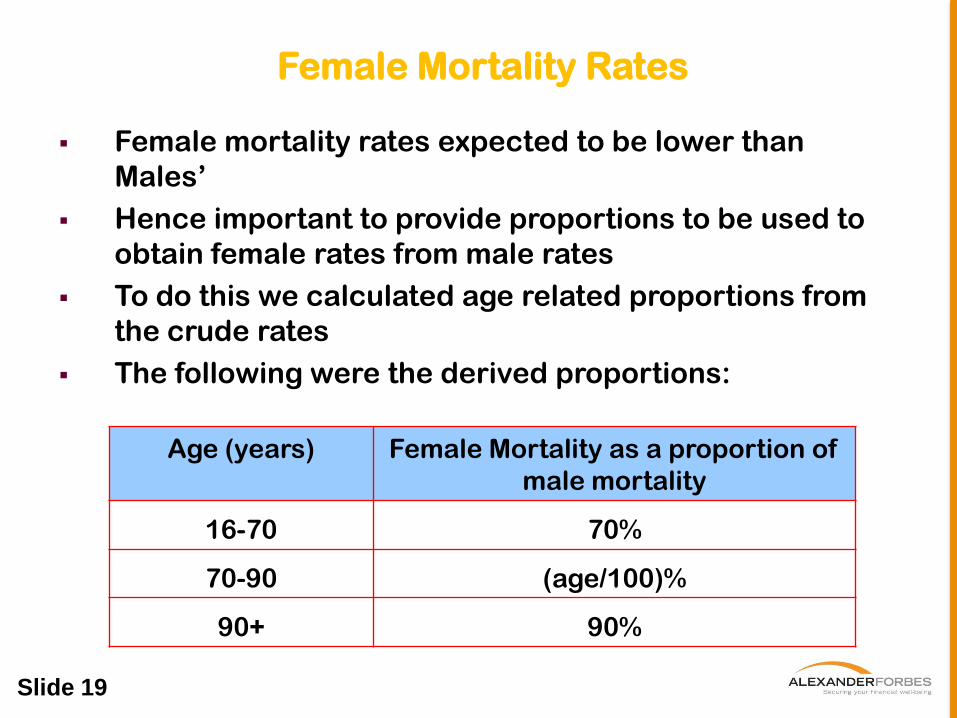
Female Mortality Rates
Female mortality rates expected to be lower than
Males‟
Hence important to provide proportions to be used to
obtain female rates from male rates
To do this we calculated age related proportions from
the crude rates
The following were the derived proportions:
Age (years) Female Mortality as a proportion of
male mortality
16-70 70%
70-90 (age/100)%
90+ 90%
Group Life
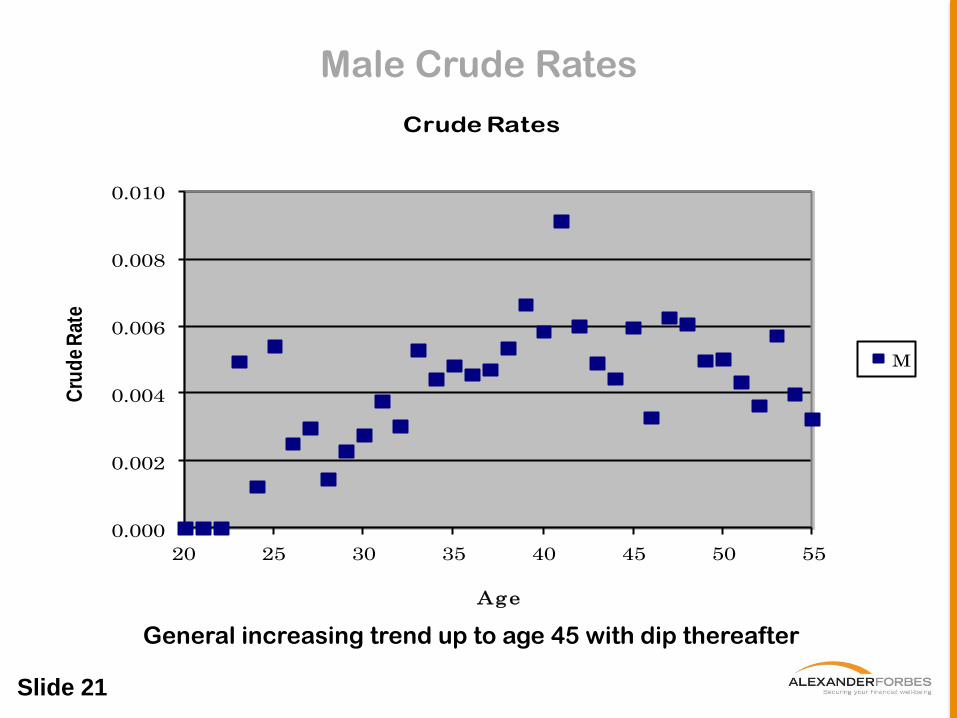
Page 21 Slide 21
Male Crude Rates
0.000
0.002
0.004
0.006
0.008
0.010
20 25 30 35 40 45 50 55
Cru
de
Rat
e
Age
Crude Rates
M
General increasing trend up to age 45 with dip thereafter
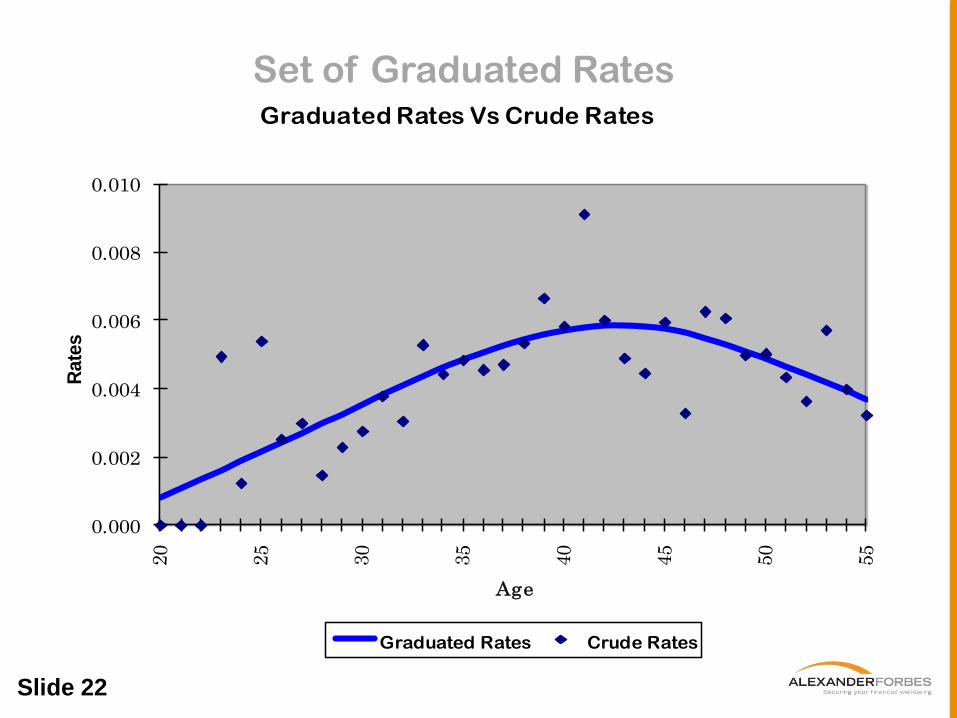
Page 22 Slide 22
Set of Graduated Rates
0.000
0.002
0.004
0.006
0.008
0.010
Rate
s
Age
Graduated Rates Vs Crude Rates
Graduated Rates Crude Rates
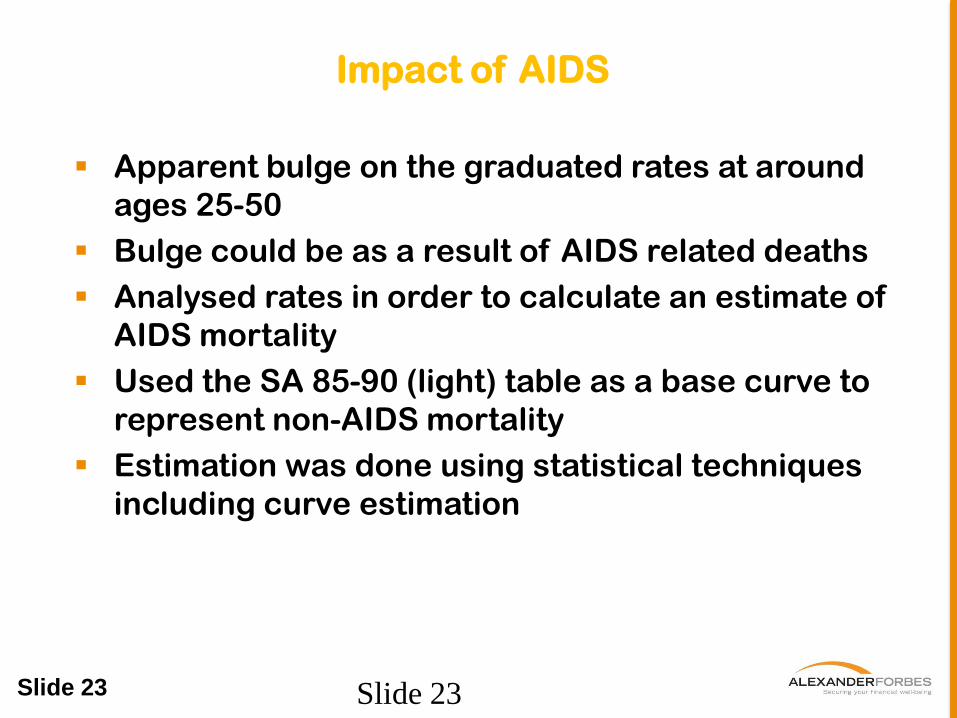
Page 23 Slide 23 Slide 23
Impact of AIDS
Apparent bulge on the graduated rates at around
ages 25-50
Bulge could be as a result of AIDS related deaths
Analysed rates in order to calculate an estimate of
AIDS mortality
Used the SA 85-90 (light) table as a base curve to
represent non-AIDS mortality
Estimation was done using statistical techniques
including curve estimation
Page 24 Slide 24
Female Mortality Rates
Female mortality rates expected to be lower than
Males‟
Hence important to provide proportions to be
used to obtain female rates from male rates
To do this we calculated age related proportions
from the crude rates
The following were the derived proportions:
Age (years) Female Mortality as a proportion of
Male mortality
20-55 80%
55+ (age/100)%
Annuitants
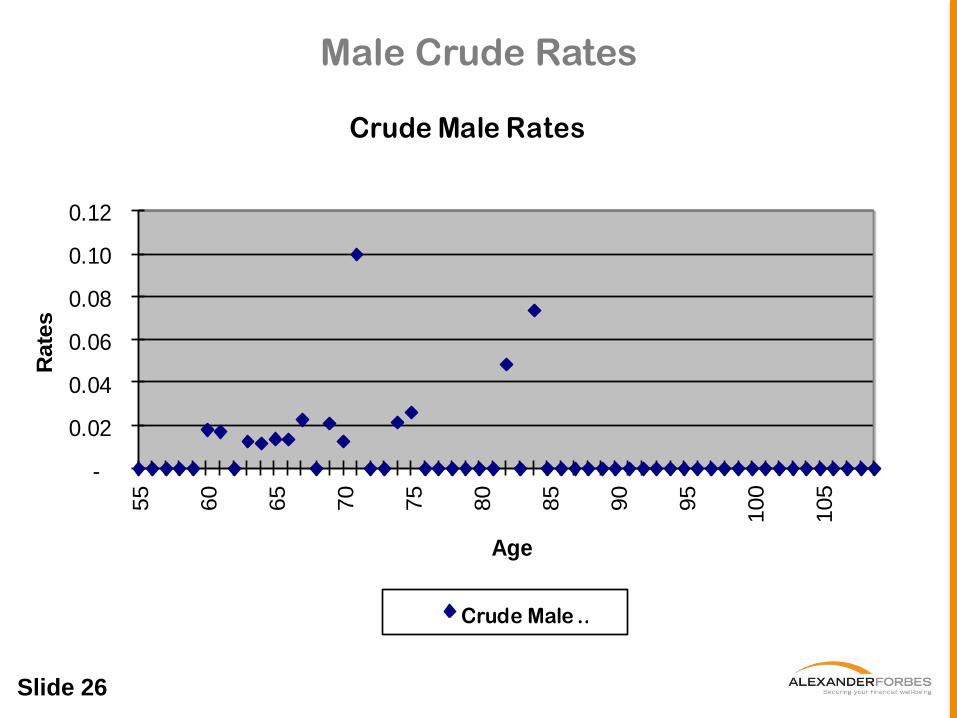
Page 26 Slide 26
Male Crude Rates
-
0.02
0.04
0.06
0.08
0.10
0.12
55
60
65
70
75
80
85
90
95
100
105
Rate
s
Age
Crude Male Rates
Crude Male …
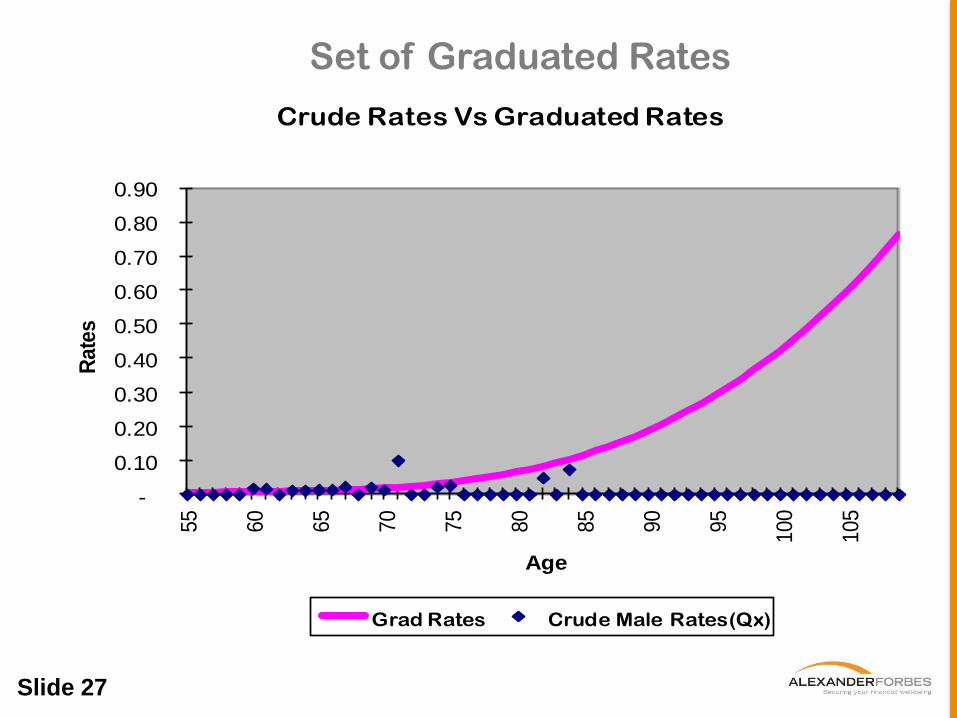
Page 27 Slide 27
Set of Graduated Rates
-
0.10
0.20
0.30
0.40
0.50
0.60
0.70
0.80
0.90 55
60
65
70
75
80
85
90
95
100
105
Rate
s
Age
Crude Rates Vs Graduated Rates
Grad Rates Crude Male Rates(Qx)
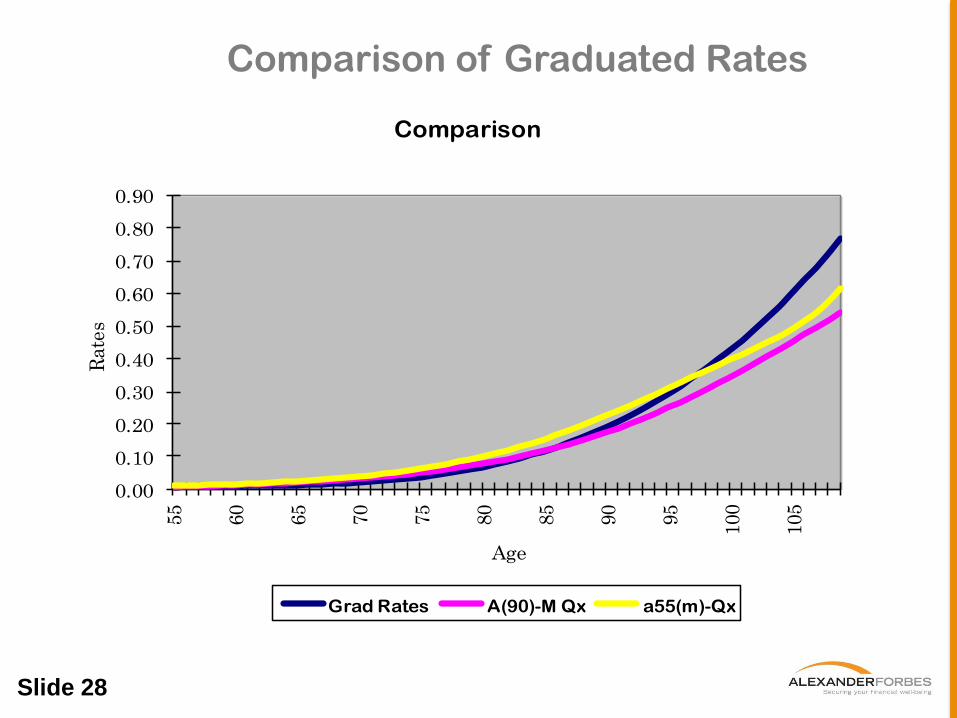
Page 28 Slide 28
Comparison of Graduated Rates
0.00
0.10
0.20
0.30
0.40
0.50
0.60
0.70
0.80
0.9055
60
65
70
75
80
85
90
95
100
105
Rate
s
Age
Comparison
Grad Rates A(90)-M Qx a55(m)-Qx
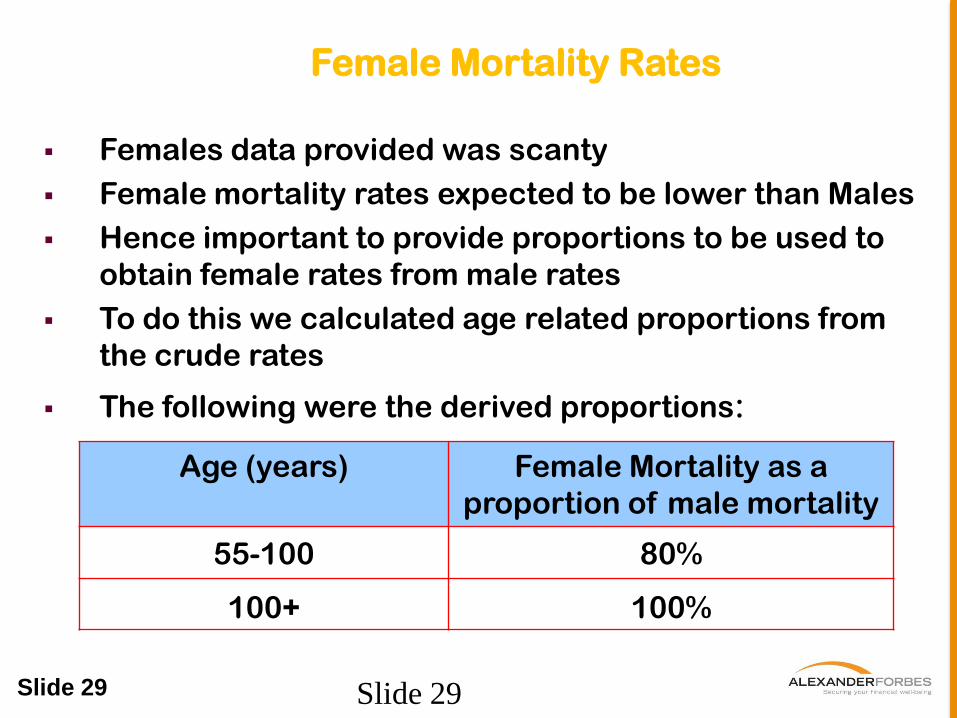
Page 29 Slide 29 Slide 29
Female Mortality Rates
Females data provided was scanty
Female mortality rates expected to be lower than Males
Hence important to provide proportions to be used to
obtain female rates from male rates
To do this we calculated age related proportions from
the crude rates
The following were the derived proportions:
Age (years) Female Mortality as a
proportion of male mortality
55-100 80%
100+ 100%
Recommendations
Page 31 Slide 31 Slide 31
Recommendations
Mortality studies should be carried out every 5 years
Individual lives, group life and annuity rates to be adopted
for pricing of insurance products and actuarial valuations
of long-term business
Adjustments for the effects of HIV AIDS may be necessary
Individual life rates are “ultimate rates”. However, “select
rates” dependent on policy duration may be derived
Insurance companies need to focus greatly on monitoring
the standard and quality of the data kept
Future morbidity studies need to differentiate between
group and individual rates
This possible only if companies keep proper records for