164
KEEP TRACK OF THE TRENDS INSIGHTS FROM THE EXPERTS The FY 18/19 Hays Salary Guide: Salary & Recruitment Trends hays.com.au | hays.net.nz

KEEP TRACK OF THE TRENDSINSIGHTS FROM THE EXPERTSThe FY 18/19 Hays Salary Guide: Salary & Recruitment Trends
hays.com.au | hays.net.nz

CONTENTS
Hays would like to express our gratitude to all those organisations that participated in our online survey and provided such invaluable feedback, which we feel has contributed to making this the most accurate and up to date survey of its kind in Australia and New Zealand. This year’s results are based on a survey of more than 3,000 participants. A list of all contributors who kindly gave their permission to be named as participants can be found on our website.
We welcome any feedback or comments regarding this guide whether positive or negative to ensure that it continues to be relevant to Australian and New Zealand organisations across all industries. Please address any suggestions to your local Hays office or to: Hays, Level 13, Chifley Tower, 2 Chifley Square, Sydney NSW 2000. E: [email protected]
The Hays Salary Guide is representative of a value added service to our clients, prospective clients and candidates. Whilst every care is taken in the collection and compilation of data, the guide is interpretive and indicative, not conclusive. Therefore information should be used as a guideline only and should not be reproduced in total or by section without written prior permission from Hays.
INTRODUCTION 3
MARKET OVERVIEW & TRENDS 4
Recommendations 6
Salary Policy 8
Recruitment Trends 14
Economic Outlook 26
SALARIES & SECTOR OVERVIEWS 28
Executive 29
Accountancy & Finance 30
Banking 57
Insurance 66
Office Support 71
Contact Centres 76
Human Resources 80
Sales 84
Marketing & Digital 87
Retail 94
Logistics 96
Procurement 99
Legal 101
Life Sciences 107
Healthcare 109
Education 114
Policy & Strategy 115
Information Technology 117
Construction, Architecture 127 & Engineering
Property 136
Facilities Management 140
Manufacturing & Operations 143
Energy 145
Resources & Mining 149
Oil & Gas 156
THANK YOU FEEDBACK DISCLAIMER
This Guide is reproduced in full in PDF format and can be requested from our website – hays.com.au and hays.net.nz

2018 Hays Salary Guide | 3
2017 was a phenomenal year for jobs growth in Australia, while New Zealand’s labour market continued to face significant skill shortages.2018 has thus far seen continued labour market strength. Permanent and temporary hiring intentions for the year ahead suggest further employment gains, while employers also expect business activity to increase and the economy to strengthen. However, employers say the shortage of highly-skilled professionals is impacting the effective operation of organisations and departments.
No wonder skilled professionals believe the time is ripe for wage growth. After years of sedate salary increases, our survey results show a pay rise is their number one priority this year. And if their employer doesn’t offer a salary increase, almost half will request one.
Interestingly, the intentions of employers suggest the tables are, ever so slightly, starting to turn in this direction. According to our survey data, more employers are willing to offer a pay rise this year compared to last. But the value of those increases is falling, which is a glaring impediment for widespread wage growth and is at odds with the expectations of professionals, who are inclined to think the value of their pay rise will be higher.
How then can you attract and retain the top talent? The provision of career progression opportunities and ongoing learning & development remains vitally important to employees. With organisations restructuring to keep up with changing business needs, including digital transformation and the requirement for new skill sets, upskilling existing staff is a strategy that works for both employers and employees. After all, constant upskilling is the new normal for any professional looking to stay relevant in the job market and any organisation looking to remain competitive in an increasingly mechanised world of work.
In the following pages, we share findings from our survey as well as typical salaries in 25 sectors and industries. We hope these insights keep you informed for the year ahead.
Nick Deligiannis Managing Director, Hays Australia & New Zealand
EMPLOYEES PRIORITISE A PAY RISEHOW WILL YOU RESPOND?

4 | 2018 Hays Salary Guide
MA
RK
ET O
VER
VIE
W &
TR
END
S
65%OF EMPLOYERS INTEND TO INCREASE SALARIES BY UP TO 3% THIS FINANCIAL YEAR
53%OF PEOPLE WHO PLAN TO CHANGE JOBS ARE DRIVEN BY A LACK OF PROMOTIONAL OPPORTUNITIES

General findingsFor our 2018-19 Hays Salary Guide we surveyed more than 3,000 organisations, representing over 2.3 million employees, for their views on salary policy, hiring intentions and recruitment trends. These employers hold positive business activity and economic performance expectations, yet while more plan to increase salaries this year compared to last, the value of those increases will fall.
OutlookBusiness activity increased in 74% of organisations over the past year, with 77% expecting it to increase in the next 12 months. 40% say the economy will strengthen in the coming six to 12 months, up from 36% last year.
Such positive sentiment helps account for expected headcount increases in the year ahead; 47% of employers intend to increase permanent staff levels and 22% temporary and contract staff numbers.
Furthermore, the trend of employing temporary and contract staff on a regular, ongoing basis continues, with 24% of employers now doing so.
Skill shortages67% of employers say skill shortages are likely to impact the effective operation of their business or department in either a significant (26%) or minor (41%) way, with mid management professionals the most difficult to recruit.
Perhaps this is why 34% of organisations report increased overtime. This is up from 32% one year prior. It also explains why, in skill short areas, 57% of employers would consider employing or sponsoring a qualified overseas candidate.
Salary trendsOur 2018-19 survey data shows more employers are willing to offer salary increases this year. When they last reviewed salaries, 14% of employers gave no increases; looking ahead 11% intend to give no increases in their next review. However, while more employers will give an increase this year, the value of those increases will fall, with 65% intending to raise salaries at the lower level of 3% or less, up from 60%. In addition, while 8% increased salaries by 6% or more in their last review, just 6% plan to do so this year.
The number of employers intending to increase salaries between 3-6% remains unchanged at 18%.
Advertising and media tops the list of most generous industries, with 13% of employers planning to award salary increases of 6% or more in their next review. This is followed by professional services (11%), construction, property & engineering (9%), IT & telecommunications and hospitality, travel & entertainment (both 8%), and financial services and mining, resources, energy and oil & gas (all 7%).
We also spoke to over 1,200 professionals for their perspective on salary and recruitment trends. As a group they have higher expectations for a salary increase than they did this time last year, with 17% expecting an increase of 6% or more, up from 14% last year.
When asked what’s most important to their career in the year ahead, a massive 67% said a pay rise. The priority placed on a salary increase is understandable considering the sedate wage growth of recent years.
This year for the first time we compared salary expectations by location. Professionals living in New South Wales and Western Australia are the most optimistic, with 17% expecting to receive an increase of 6% or more. This is followed by Queensland (16%), Tasmania (15%), Victoria and ACT (both 14%).
At the other end of the scale, 43% of South Australian professionals expect no salary increase, as do 38% of Northern Territorians and 29% of Tasmanians.
Benefits It’s pleasing to see that the benefits employers and employees offer and want are aligned. The most common benefits employers say they offer are flexible work practices (84%), ongoing learning & development (73%) and career progression opportunities (66%). Meanwhile, when looking for a new job it is flexible work practices (73%), career progression opportunities (72%) and ongoing learning & development (59%) that professionals want.
With the fourth industrial revolution changing the way organisations operate and job tasks are completed, it’s reassuring that employers and professionals have found common ground in flexibility, ongoing learning and career progression. These are factors that will help them both stay relevant in the future.
A SALARY INCREASE IS MORE ATTAINABLE BUT THE VALUE WILL FALL
2018 Hays Salary Guide | 5

6 | 2018 Hays Salary Guide
MA
RK
ET O
VER
VIE
W &
TR
END
S: R
ECO
MM
END
ATIO
NS
MARKET OVERVIEW & TRENDSRECOMMENDATIONS FOR EMPLOYERS
Survey highlights
Employers Employees
89% 75%
96% 72%
90% 46%
43% 73%
intend to increase salaries in the year ahead
expect a salary increase in the year ahead
envisage business activity to increase or remain the same in the next 12 months
envisage they will or might ask for a pay rise in their next review
expect permanent staff levels to increase or remain the same in the next 12 months
are currently looking or planning to look for a new job in the next 12 months
say staff management skills have the highest impact on the effectiveness of their organisation
say flexible work practices are an important benefit when looking for a new job
Flexibility is standard, making its absence a recruiting limitationFlexible work practices are the number one benefit professionals want (73%) and receive (70%), however just 45% are ‘very satisfied’ or ‘extremely satisfied’ with their current level of work-life balance. If your organisation doesn’t offer flexible working options, it is in the minority and this could have an obvious impact on attraction and retention. You can get back in the game to compete for the top talent by reviewing and implementing policies in this area, such as staggered start and finish times.
Promote career progression and development opportunities With business activity and confidence high, and employers adding to their teams, it is surprising that of the 46% of people who said they plan to look for a new job this year, 53% cited a lack of promotional opportunities as the main reason. This suggests employers could be doing more to develop their existing talent, particularly since a lack of new challenges (44%) and poor training and development (29%) came in as the third and fourth highest factors spurring them to look at jobs elsewhere. In addition, when looking for a new job, professionals also pursue career progression opportunities (72%) and ongoing learning & development (59%).
Recruitment remodelled67% of employers believe that skill shortages will impact the effective operation of their business or department. However, digital technology, data science and artificial intelligence now allow you to reach new candidate pools, helping to overcome skill shortages. How? Rather than the
historic and conventional ‘Advertise & Apply’ model of recruitment, where active jobseekers at that point in time apply to advertised vacancies, a ‘Find & Engage’ approach can now be realised. This involves using digital technology and data science analytics to reach deep into candidate pools and examine large amounts of data to prepare shortlists of the most suitable people, which span far wider than the community of active jobseekers. From this, it is possible to extrapolate meaningful patterns and gauge how open to new job opportunities a potential candidate is. The ‘Engage’ element then comes into effect, putting the relationship back at the heart of recruitment to understand a candidate’s personal priorities and aspirations for a successful outcome. It’s a game-changing transformation for employers and external agencies alike, and one you can now utilise to help fill skill gaps.
If your organisation doesn’t offer flexible working options, it is in the minority and this could have an obvious impact on attraction and retention.
“”

2018 Hays Salary Guide | 7
MARKET OVERVIEW & TRENDSRECOMMENDATIONS FOR EMPLOYEES
Upskill and become a continuous learnerOver half (52%) of employers said they are currently restructuring their department or organisation to keep up with changing business needs. Of these, the key drivers are a change in the required skill sets (48%) and digital transformation (31%). To remain employable in the face of the change occurring around you, become a constant learner. Ask for stretch opportunities, follow industry leaders on social media, join a professional association, and consider internal or external study.
If you don’t ask, you won’t getIf your employer doesn’t offer a salary increase, you could consider joining the 48% of professionals who said they’ll ask for one. Preparation and evidence of achievements that exceed your objectives are key steps in securing a pay rise, and don’t forget to have a fall-back position. For example, if your employer cannot afford to increase your salary, can you agree a date for another pay review in three or six months? What about additional annual leave, study or other benefits?
If necessary, consider advancement elsewhereStaff turnover increased in 32% of organisations during the past year, while overtime was up in 34%. No wonder only 40% of the professionals we spoke to are ‘very satisfied’ or ‘extremely satisfied’ in their current job. Just 41% and 51% are ‘very satisfied’ or ‘extremely satisfied’ with their current employer and current direct manager respectively.
Consider temporary assignments24% of employers now employ temporary and contract staff on a regular, ongoing basis. That’s a lot of employment opportunities that are passing you by if you are not open to this form of working. Temporary assignments are worth considering since they allow you to gain experience in new industries, business cultures and projects, develop new contacts and push you out of your comfort zone.

8 | 2018 Hays Salary Guide
MA
RK
ET O
VER
VIE
W &
TR
END
S: S
ALA
RY P
OLI
CY
1. Average percentage salary increases given in last salary review: across all industries
SALARY POLICYSALARY INCREASES LAST REVIEW
Advertising/Media
Construction/Property/Engineering
Education (teaching & support)
Financial Services
Hospitality/Travel/Entertainment
IT/Telecomms
Manufacturing
Mining/Resources/Energy/Oil & Gas
Public Sector/Not for Profit
Retail/FMCG
Transport/Distribution
18
17
14
9
15
14
6
10
30
14
11
52 22
41
73
57
55
41
80
78
56
61
76
44
27
13
21 103
20
33
13
10
7
18
11
10
4
8 4
2
1
2
5
6
13Professional Services
44 307
1
6 1
6
34
14%Nil
60%Less than 3%
18%From 3% to 6%
5%From 6% to 10%
3%More than 10%
For specific industries (%):

2018 Hays Salary Guide | 9
2. When you next review, by what percentage do you intend to increase salaries? across all industries
SALARY POLICYSALARY INCREASES NEXT REVIEW & BENEFITS
Advertising/Media
Construction/Property/Engineering
Education (teaching & support)
Financial Services
Hospitality/Travel/Entertainment
IT/Telecomms
Manufacturing
Mining/Resources/Energy/Oil & Gas
Public Sector/Not for Profit
Retail/FMCG
Transport/Distribution
9
11
11
10
17
8
4
10
21
10
4
56 22
52
80
62
59
52
76
82
57
66
81
49
28
7
213 4
16
32
16
8
15
20
11
7
2
2
8
3
4
2
6
7Professional Services
58 9242
1
4 3
13
11%Nil
65%Less than 3%
18%From 3% to 6%
4%From 6% to 10%
2%More than 10%
For specific industries (%):
Of those who answered yes, the following benefits were indicated as being commonly offered to (%)...
67%Yes
33%No
All employees
More than 50%
Less than 50%
Few employees
3. Does your company offer flexible salary packaging?
Car Salary sacrificeBonuses Private healthinsurance
Above mandatorysuperannuation
Private expenses Other
Parking
21
41
66
47
67
165
12
27
61 64
4133
57
612
25
1115
25
4665
29
1619
3810
20
49

In a separate survey we also asked our candidates what their expected salary increases were
In your next review, what percentage increase do you expect to receive? across all industries
For specific industries (%):
SALARY POLICYSALARY INCREASES
12
22
35
26
11
28
29
24
29
24
33
29 47
30
57
41
68
32
39
57
41
40
33
66
25
5
14 10 9
11
21
12
15
13
18
11
16
3
8 11
17
3
4
7
10
20 28 24
3
1
11
In the past year have you asked for a pay rise (%)?
In your next review, do you envisage asking for a pay rise (%)?
18
16
66
48
24
28
Yes, successfully
Yes
Yes, not successfully
Not sure
No
No
25%Nil
39%Less than 3%
19%From 3% to 6%
9%From 6% to 10%
8%More than 10%
10 | 2018 Hays Salary Guide
Advertising/Media
Construction/Property/Engineering
Education (teaching & support)
Financial Services
Hospitality/Travel/Entertainment
IT/Telecomms
Manufacturing
Mining/Resources/Energy/Oil & Gas
Public Sector/Not for Profit
Retail/FMCG
Transport/Distribution
Professional Services
9 8
10 18
7
19
MA
RK
ET O
VER
VIE
W &
TR
END
S: S
ALA
RY P
OLI
CY

Do you receive any of the following benefits (%)?
When looking for a new job, which of the following benefits are important to you (%)?
SALARY POLICYBENEFITS
2018 Hays Salary Guide | 11
Flexible work practices
Over 20 days’ annual leave
Financial support for study
Free or subsidised food
A day o� for your birthday
3520
45
55
32
15
55
7
38
30
30
40
705
Payment of own device usage
charges at work
Career progression opportunities
Health and wellness programs
Onsite childcare Ongoing learning & development
29
3
68
3745
8
4756
7
36
19
45
2539
36
25
Yes,I receive this
No, and I amnot interestedin receiving this
No, but I would like to receive this
Flexible work practices 73
Financial support for study 12
Free or subsidised food 2
A day off for your birthday 2
Over 20 days’ annual leave 28
Payment of own device usage charges at work 8
Health and wellness programs 15
Onsite childcare 2
Ongoing learning & development 59
Career progression opportunities 72
Note: Multiple choices permitted.

12 | 2018 Hays Salary Guide
MA
RK
ET O
VER
VIE
W &
TR
END
S: S
ALA
RY P
OLI
CY
Explore all articles in our Talent Management and Upskilling series or request a copy of ‘Hays Talent Management Report – Tips to manage, develop, retain and plan talent effectively’.
Follow Hays on social media
linkedin.com/company/hays
youtube.com/haysaustraliayoutube.com/haysnewzealand
@HaysAustralia@HaysNewZealand
Thinking of your career, what’s important to you in the year ahead?
CAREER DEVELOPMENTPROGRESSING YOUR CAREER
54%Being able to work flexibly
67%A pay rise
51%More challenging or exciting work
47%Support from my boss
48%Learning additional digital skills
12 | 2018 Hays Salary Guide
Note: Multiple choices permitted.
hays.com.au/talent-management hays.net.nz/talent-management

2018 Hays Salary Guide | 13
If yes or not sure, why?
What is your level of satisfaction for the following:
CAREER DEVELOPMENTLOOKING FOR A NEW JOB
2018 Hays Salary Guide | 13
Are you currently looking or planning to look for a new job in the next 12 months?
46%Yes
26%No
28%Unsure
★Not at all satisfied
★★Slightly
unsatisfied
★★★Moderately
satisfied
★★★★Very
satisfied
★★★★★Extremely
satisfied
My current job 9% 13% 36% 29% 11%
My current employer 11% 18% 29% 28% 13%
My current direct boss 12% 14% 21% 28% 23%
My work/life balance 7% 15% 32% 32% 13%
53%
Lack of promotional opportunities
26%
Poor work-lifebalance
48%
Uncompetitive salaries
44%
Lack of new challenges
29%
Poor training and development
21%
Poor benefits package

14 | 2018 Hays Salary Guide
MA
RK
ET O
VER
VIE
W &
TR
END
S: R
ECRU
ITM
ENT
TREN
DS
RECRUITMENT TRENDSSTAFFING
4. Over the last 12 months, have permanent staff levels in your department... across all departments
Accountancy/Finance
Distribution
Engineering
General Management
Human Resources
Information Technology
Marketing
OHS/WHS
Operational Management
Project Management
Purchasing/Procurement
Sales
Strategy & Consulting
15
40
13
15
12
17
14
19
16
15
21
25
19
51
60
45
30
37
33
42
44
39
29
29
36
25
34
42
55
51
50
44
37
45
56
50
39
56
For specific departments (%):
Decreased
Remainedthe same
Increased
16%
37%
47%
Note: Multiple choices permitted.
What skills are you looking for permanent employees to bring to the team (%)?
Tech/digital skills 50
Project management skills 39
Management skills 34
Communications skills 64
Commercial/business development skills 32
Vocational skills 18
Other 9
Stakeholder engagement skills 39
Critical thinking skills 55
Problem solving skills 69

2018 Hays Salary Guide | 15
RECRUITMENT TRENDSSTAFFING
5. Over the coming year, do you expect permanent staff levels to... across all departments
Accountancy/Finance
Distribution
Engineering
General Management
Human Resources
Information Technology
Marketing
OHS/WHS
Operational Management
Project Management
Purchasing/Procurement
Sales
Strategy & Consulting
11
60
8
9
8
14
8
6
6
11
17
21
19
57
40
49
34
42
33
58
50
44
38
54
29
18
32
43
57
50
53
34
44
50
51
29
50
63
For specific departments (%):
Decrease
Remainthe same
Increase
10%
43%
47%
Note: Multiple choices permitted.
6. If you expect staffing levels to increase, please specify how:
84%
Full time/permanent sta�
3%
Job sharing
27%
Temporary/contractors
(through an employment consultancy)
22%
Employment of part-time sta�
18%
Employment of casual sta�
(on your payroll)
3%
Mixture, other (inc. overseas recruitment,
acquisitions)

16 | 2018 Hays Salary Guide
MA
RK
ET O
VER
VIE
W &
TR
END
S: R
ECRU
ITM
ENT
TREN
DS
RECRUITMENT TRENDSSTAFFING
7. How often do you employ temporary/contract staff? across all departments
Exceptional circumstances/never
Special projects/ workloads
Regular ongoing basis
34%
42%
24%
Accountancy/Finance
General Management
Human Resources
Information Technology
Marketing
OHS/WHS
Operational Management
Project Management
Purchasing/Procurement
Sales
Strategy & Consulting
50
43
25
21
33
37
33
15
54
61
25
41
Engineering
26 49 25
38
46
44
50
38
36
47
33
18
56
9
Distribution
40 20 40
19
29
35
17
25
31
38
13
21
19
For specific departments (%):
Note: Multiple choices permitted.
What skills are you looking for temporary employees to bring to the team (%)?
Critical thinking skills 33
Project management skills 31
Stakeholder engagement skills 19
Communications skills 45
Commercial/business development skills 16
Other 14
Management skills 11
Vocational skills 20
Tech/digital skills 45
Problem solving skills 51

2018 Hays Salary Guide | 17
RECRUITMENT TRENDSSTAFFING
8. In the next 12 months, do you expect your use of temporary/contract staff to... across all departments
Decrease
Remainthe same
Increase
11%
67%
22%
Accountancy/Finance
Distribution
Engineering
General Management
Human Resources
Information Technology
Marketing
OHS/WHS
Operational Management
Project Management
Purchasing/Procurement
Sales
Strategy & Consulting
13
80
13
7
9
20
6
19
9
9
8
14
13
75
20
62
72
70
47
64
81
73
44
79
68
56
12
25
21
21
33
30
18
47
13
18
31
For specific departments (%):

18 | 2018 Hays Salary Guide
MA
RK
ET O
VER
VIE
W &
TR
END
S: R
ECRU
ITM
ENT
TREN
DS
RECRUITMENT TRENDSSKILL SHORTAGES
9. Do you think that skill shortages are likely to impact the effective operation of your business/department?
10. In skill-short areas, would you consider employing or sponsoring a qualified overseas candidate (%)*?
57
43
Yes
No
11. Which skills do you foresee to have the highest impact on the effectiveness of your organisation (%)?
Software skills 27
Digital skills 30
Security skills (cyber/data/personal data) 11
Trade specific skills 40
Vocational skills 19
Language skills 14
Soft skills 29
Business development skills 34
Staff management skills 43
*NB this survey was completed before the Australian Government’s 457 visa changes were announced in April 2017
No Yes - in a minor way Yes - significantly
41% 26%33%

2018 Hays Salary Guide | 19
RECRUITMENT TRENDSSKILL SHORTAGES
12. For which areas have you recently found it difficult to recruit (%)?
Junior/entry level candidates
Middle/Mid management candidates
Senior management candidates
Accountancy & Finance
14
6
6
Human Resources
5
2
1
Operations
16
7
10
Technical
17
8
6
Distribution
2
1
3
IT
14
7
5
Purchasing
3
1
1
Other
11
4
6
Engineering
14
9
4
Marketing
7
3
2
Sales
11
5
5

20 | 2018 Hays Salary Guide
MA
RK
ET O
VER
VIE
W &
TR
END
S: R
ECRU
ITM
ENT
TREN
DS
RECRUITMENT TRENDSWORK PRACTICES
13. Does your workplace offer any benefits?
84%Yes
16%No
Note: Multiple choices permitted.
14. If your workplace allows for flexible work practices, which of the following do you currently offer?
77%
Flexible working hours
31%
Job sharing
75%
Part time employment
66%
Flex-place
38%
Flexible leave options
18%
Career breaks
16%
Phased retirement
If yes, which practices do you currently offer (%)?
Payment of own device usage charges at work 25
Financial support for study 55
A day off for your birthday 7
Onsite childcare 3
Ongoing learning & development 73
Free or subsidised food 19
Over 20 days’ annual leave 19
Health and wellness programs 41
Career progression opportunities 66
Flexible work practices 84

2018 Hays Salary Guide | 21
RECRUITMENT TRENDSWORK PRACTICES
15. Has overtime/extra hours in your organisation over the last 12 months...
8%Decreased
58%Remained the same
34%Increased
If increased, by how much?
81%
Less than 25%
17%
From 25% to 50%
1%
From 50% to 75%
1%
More than 75%
16. For non-award staff in your organisation, is overtime/extra hours worked...
$$$$$$$$$$$$$$$$$$$$$$$$$$$$$$$$$$$$$$$$$$$$$$$$$$$$$$$$$$
Unpaid 58%
$$$$$$$$$$$$$$$$$$$$$$$$$$$$$$$$$$$$$$$$$$
Paid 42%

22 | 2018 Hays Salary Guide
MA
RK
ET O
VER
VIE
W &
TR
END
S: R
ECRU
ITM
ENT
TREN
DS
RECRUITMENT TRENDSWORK PRACTICES
18. Over the last 12 months has your staff turnover rate:
59%No
39%Sometimes
2%Yes
Of those you counter-offered, on average, did they....
17. Is it your policy to counter-offer staff when they resign?
Decreased
Remainedthe same
Increased
15%
53%
32%
45%
Leave anyway
30%
Stay longer than 12 months
22%
Stay 3-12 months
3%
Stay less than 3 months

2018 Hays Salary Guide | 23
RECRUITMENT TRENDSDIVERSITY
19. Does your organisation have a diversity policy for hiring new staff (%)?
If yes, do you think the people who hire in your organisation generally adhere to it (%)?
56
10
34
72
20
8
Yes
Yes
No
I don’t know
No
I don’t know
The workplace is changing rapidly, becoming more diverse, inclusive and authentic. Many people try to blend into their work environment at the expense of exposing their real self. Being authentic at work requires real self-awareness but if achieved, can be the real differentiator for living a happy and healthy work life. Read inspiring interviews we had with female role models at Hays, and find out how they are themselves at work.
hays.com.au/diversity/beyouatwork hays.net.nz/diversity/beyouatwork
#BEYOUATWORK

24 | 2018 Hays Salary Guide
MA
RK
ET O
VER
VIE
W &
TR
END
S: R
ECRU
ITM
ENT
TREN
DS
RECRUITMENT TRENDSEMPLOYER BRANDING
Level of importance
Organisational perception
Career path/training & development
An individual’s ‘fit’ with the company’s vision, culture and values
People’s direct experience of the company
People’s indirect experience of the company
A company’s social media and online presence
Salary and benefits
Commitment to diversity & inclusion
Work/life balance
1
1
10
9
10
1
4
1
2
3
19
27
28
2
15
1
19
16
32
43
34
16
35
12
54
42
27
18
22
54
31
49
4
3
5
5
11
2
7
4
15
9
12
14
27
13
18
10
42
32
27
37
37
39
38
34
32
36
38
32
20
37
25
36
24
38
12
3
6
27
15
37
7
20
18
12
5
9
12
16
Poor
No importance
Okay
Minor importance
Good
Some importance
Very Good
Significant importance
Excellent
Major importance
20. How important do you think the following factors are for an employer brand and how well do you think your organisation is perceived on the same criteria (%)?

2018 Hays Salary Guide | 25
RECRUITMENT TRENDSCHANGING BUSINESS NEEDS
21. Are you currently restructuring your department/organisation to keep up with changing business needs?
42%No
6%Unsure
52%Yes
If yes, what has/have been the driver(s) (%)?
Outsourcing 9
Merger/Acquisition 19
Other 20
Digital transformation 31
Offshoring 5
Inshoring 1
Downsizing 13
Requirement for a more flexible workforce 27
Change in required skill sets 48
Note: Multiple choices permitted.

26 | 2018 Hays Salary Guide
MA
RK
ET O
VER
VIE
W &
TR
END
S: E
CON
OM
IC O
UTL
OO
KECONOMIC OUTLOOK
22. In the past 12 months, has business activity...
23. In the next 12 months, do you envisage business activity: across all industries
9%
Decreased
17%
Remained the same
74%
Increased
4%
Decreasing
19%
Remained the same
77%
Increasing
For specific departments (%):
Advertising/Media
Construction/Property/Engineering
Education (teaching & support)
Financial Services
Hospitality/Travel/Entertainment
IT/Telecomms
Manufacturing
Mining/Resources/Energy/Oil & Gas
Public Sector/Not for Profit
Retail/FMCG
Transport/Distribution
4
424 72
10
7
17
18 6418
3
6
118 81
10
4
19
19
5935
13
13 83
1
83
77
77
4
Professional Services
15
77
85
7815
5
81

2018 Hays Salary Guide | 27
ECONOMIC OUTLOOK
*This data was collected during March 2018.
24. What are the key factors driving your business activity (%)?
25. Do you see the general outlook for the economy in the forthcoming 6-12* months as...
Interest rates
Currency/forex rates
Consumer/business confidence
Capex investments
Projects driven by government
Current economic conditions
55 37
8
7
32
61
18
43
39
43
31
4228
30
7
4647
26
Significant impact
Some impact
No impact
$$$$$$$$
Weakening 8%
$$$$$$$$$$$$$$$$$$$$$$$$$$$$$$$$$$$$$$$$$$$$$$$$$$$$
Static 52%
$$$$$$$$$$$$$$$$$$$$$$$$$$$$$$$$$$$$$$$$
Strengthening 40%

Using our salary tablesSalaries are in ‘000, all salaries are exclusive of superannuation (AU) or KiwiSaver (NZ) – which might differ to previous editions. The bold number represents the typical salary. The number(s) underneath represent the salary range. Refer to the notes section under the salary table to determine if other benefits are included. All salaries are represented in local currencies.
How does your salary compare?The complete Hays FY 18/19 Salary Guide is available online. Search salaries for more than 1,000 positions and find out how your salary compares in our real-time Salary Check at hays.com.au/HaysSalaryGuide or hays.net.nz/HaysSalaryGuide
Head of HR/HR Director >1000 employees
Sydney280 Typical salary200 - 400 Salary range
HOW TO NAVIGATE THIS GUIDE
28 | 2018 Hays Salary Guide
SALA
RY IN
FOR
MAT
ION
: SA
LARI
ES &
SEC
TOR
OV
ERV
IEW
S
2018 Hays Salary Guide | 29
EXECUTIVE
AUSTRALIANSW and Victoria’s construction boom underpinned strong employment growth in 2017-18, and in turn led to jobs growth in professional and technical services, social services and manufacturing. In particular demand were Commercial Directors, Corporate Finance Executives and Heads of Finance.
The mining states saw a steady improvement in senior appointments, particularly CFOs and Project Directors, in response to improved commodity prices.
The infrastructure, technology and healthcare sectors also saw strong vacancy activity for CEOs and executives with transformation and risk experience. Candidates are still open to relocating in order to secure a senior position in these sectors.
Across all industries, those organisations that are embracing disruption are hiring executives to take advantage of technological change and remain competitive.
Executive salaries remained stable in 2017-18 in most states and territories, with the focus instead on incentives and higher bonuses.
Looking ahead, the use of data to analyse and inform decision making will be of high importance in 2018-19 and hiring decisions will be made with these skills in mind.
In other trends, visionary CEOs who understand the importance of treating the customer as an individual will be needed too. To be successful, candidates must also have strong digital and social media management skills and experience transforming underperforming cultures to increase productivity.
The gender pay gap and women on boards will remain a key focus in many
companies as well as the public sector. Flexible working options and the opportunity to add value to an executive’s career are issues at the centre of candidate attraction and retention.
Turning to the not-for-profit sector, increased regulation and a shift away from block funding to consumer directed care in the aged care sector, in addition to the NDIS, have seen companies change their operating models.
As the not-for-profit sector becomes commercially focused, commercially-minded executives with ‘for purpose’ alignment are in high demand.
There is also a major shortage of talented commercially-minded CEOs and executive leaders with a fundraising focus. Such candidates are sought by not-for-profits looking for alternative funding to supplement their diminishing income while also delivering services to those in need.
Finally, while Western Australia faces cuts, NSW and Victoria continue to recruit Directors of Finance and Senior Executives to work on infrastructure investment.
A note on executive salariesGiven the broad range of executive positions, each package is dependent on a number of factors. These include company size (employee numbers and revenue), ownership (public, private or government), industry and responsibilities. To find out more about specific executive salaries please contact your local Hays Executive recruiting expert. You can find our nearest office on the back of this guide.
SALA
RY IN
FOR
MAT
ION
: EXE
CUTI
VE
The infrastructure, technology and healthcare sectors saw strong vacancy activity for CEOs and executives with transformation and risk experience.
“
”
As the not-for-profit sector becomes commercially focused, commercially-minded executives with ‘for purpose’ alignment are in high demand.
“
”

30 | 2018 Hays Salary Guide
SALA
RY IN
FOR
MAT
ION
: ACC
OU
NTA
NCY
& F
INA
NCE
ACCOUNTANCY & FINANCE
AUSTRALIAAccountancy and finance professionals will see increased demand for their skills in 2018-19 in response to the continued strength of the labour market and the ever-increasing volume of data that organisations now employ.
Both temporary assignments and permanent roles will be available in commerce and the public sector, although the latter is becoming more prevalent given market confidence.
Within commerce specifically, positive conditions have seen salaries increase moderately ahead of CPI across the board. In addition, annual bonuses are being used to attract and retain employees and are a large part of total packages. Flexible working opportunities are another attraction and retention tool.
In terms of the skills in demand, candidates who have developed their data analysis skills and present data in a user-friendly format that informs business decisions are highly sought. With organisations collecting vast amounts of data and making data-led decisions, traditional finance professionals such as Financial and Management Accountants need to evolve.
Change and transformation projects are another driver of demand. With innovation
and agility at the forefront of strategic plans, organisations seek to deploy technology-based solutions to streamline processes, improve systems and save expenditure. Consequently contract Business Analysts and Management Accountants who are highly skilled in project work, big data finance specialists and those who can support the transition of accountancy to a more digitised and automated future are in demand.
As consumer habits continue to drive change, finance leaders must innovate and capture real time information. Thus innovative finance leaders who can guide an organisation as well as illustrate a vision and explain the role of each team member in realising that vision, are in demand. So too are business partners who can steer the business towards the future, and risk professionals.
In addition, employers increasingly want candidates with strong commercial acumen and investment appraisal experience as investment activity increases. This is leading to candidate shortages, with strong CFOs, Financial Controllers and Finance Managers receiving multiple offers in addition to a counter offer from their existing employer.
At the accounting support level, automation and digitisation are changing the transactional skills employers require. Payrollers at all levels remain in high demand, with acute candidate shortages creating high competition and generous salary offers for those with specific system or sector experience.
Proven Credit Controllers and Accounts Receivable Officers are also sought to replace departing staff, while growth in the SME sector has seen demand grow for Bookkeepers. Despite demand, salaries are
dependent on an organisation’s size and the importance placed on the position.
Turning to professional practice, demand for experienced candidates remains as high as ever across all levels, from entry level up to Managers within business services, tax and audit. This continues to put pressure on salaries, particularly for first and second movers who are in highest demand and often receive large increases when changing firms.
Given demand, firms are focusing on establishing robust succession plans. This is fuelling even greater demand for Business Services and Audit Managers, however these professionals often move into commerce or start their own practice.
Talent shortages will deepen in the year ahead across commerce and professional practice, forcing employers to consider innovative ways to find and engage with candidates.
Temporary assignments will remain the preference for project support while economic confidence will drive permanent headcount increases.
Find out what’s keeping finance leaders across Australia & New Zealand awake at night in our report ‘What’s Challenging Today’s Finance Leaders?’. Download your copy now.
hays.com.au/finance-leaders hays.net.nz/finance-leaders
Accountancy and finance professionals will see increased demand for their skills in 2018-19 in response to the continued strength of the labour market.
“
”
Temporary assignments will remain the preference for project support while economic confidence will drive permanent headcount increases.
“
”

2018 Hays Salary Guide | 31
SALA
RY IN
FOR
MAT
ION
: ACC
OU
NTA
NCY
& F
INA
NCE
ACCOUNTANCY & FINANCENEW ZEALANDSalaries are increasing overall across New Zealand’s accountancy and finance markets, in both commercial and practice environments, as candidate shortages increase and a strong trading environment creates greater staffing demand.
Accountancy support teams are becoming leaner in response to automation and technology. Candidates who adapt to change and are technically savvy are highly valued above those who focus on manual processing duties.
Having said this, experienced Credit Controllers and Payrollers remain in demand in organisations experiencing revenue and headcount growth. Salaries for these positions are growing moderately.
Meanwhile, improved ERP systems are producing quality data, which organisations increasingly use to inform business decisions. This has increased demand for Financial Analysts, Management Accountants and Finance Business Partners who understand and have experience in this area. Given demand, salaries have increased for Analysts.
Salaries have also increased for Business Partners and Project Accountants, particularly for those working in the booming manufacturing and construction industries.
Within professional practice, more SMEs are embracing cost effective accounting tools, which is forcing firms to readdress their services and pricing strategies as well as expand the solutions they offer, including HR services, technology and cyber security consultancy solutions.
Skill shortages across professional practice continue to impact productivity. Jobseekers typically receive multiple offers from private practice, commercial organisations and the public sector.
During 2018-19 we expect government policy changes to impact staffing demand. The new government is finalising a number of policy initiatives that will ramp up requirements once they are implemented.
In the coming year, salaries should move upwards across the board as demand continues to increase. There will be a continuing need for employers to move quickly through the recruitment and selection process if they are to secure top talent.
Skill shortages across professional practice continue to impact productivity. Jobseekers typically receive multiple offers from private practice, commercial organisations and the public sector.
“
” Accountancy support teams are becoming leaner in response to automation and technology. Candidates who adapt to change and are technically savvy are highly valued above those who focus on manual processing duties.
“
”

32 | 2018 Hays Salary Guide
ACCOUNTANCY & FINANCECommerce & Industry | Senior Finance
TYPICAL BENEFITS THAT MAY BE INCLUDED ON TOP OF BASE SALARIES SHOWN: NOTES:• Additional super• Health cover• Interest free loans• Car/car allowance
• Cash bonuses• Study assistance• Parking• Share options in company
• Laptops• Vehicle expenses• Professional memberships• School fees
• All salaries shown are exclusive of superannuation (AU) or KiwiSaver (NZ)
• New Zealand salaries are represented in New Zealand dollars
* For a more detailed discussion on executive level salaries contact Hays Executive
SENIOR QUALIFIED ACCOUNTANTSFinance Director/CFO(Turnover up to $50m)
Finance Director/CFO(Turnover $50m - $500m)
Finance Director/CFO* (Turnover > $500m)
NSW - Sydney180 260 375160 - 200 200 - 320 320+
NSW - Regional140 170 200+130 - 160 150 - 200 180+
VIC - Melbourne175 225 255150 - 225 165 - 240 230+
VIC - Regional160 185 225140 - 170 160 - 240 200+
QLD - Brisbane, Gold Coast & Sunshine Coast150 220 250130 - 170 160 - 240 200+
QLD - Regional140 180 200110 - 170 130 - 200 170 - 240
SA - Adelaide140 180 180+130 - 160 150 - 200 160+
WA - Perth150 185 260135 - 175 170 - 200 250+
ACT - Canberra160 175 220150 - 180 160 - 200 200+
TAS - Hobart/Launceston130 160 190110 - 180 130 - 200 180+
NT - Darwin140 160 180120 - 150 140 - 180 180 - 200+
NZ - Auckland150 180 200+130 - 180 150 - 210 180+
NZ - Wellington130 155 19090 - 180 110 - 200 160 - 270
NZ - Christchurch140 155 190115 - 150 150 - 200 180 - 280
Financial Controller(Turnover up to $50m)
Financial Controller(Turnover $50m - $500m)
Group Financial Controller/GM Finance*(Turnover > $500m)
NSW - Sydney150 170 260100 - 170 145 - 200 200 - 300
NSW - Regional125 145 160115 - 135 130 - 180 140 - 200
VIC - Melbourne125 140 170120 - 150 130 - 175 160 - 250
VIC - Regional120 130 160100 - 140 110 - 140 140 - 200
QLD - Brisbane, Gold Coast & Sunshine Coast110 140 18090 - 130 100 - 160 140 - 200
QLD - Regional110 140 14090 - 120 110 - 160 110 - 180
SA - Adelaide130 130 160100 - 140 100 - 160 140 - 180
WA - Perth130 140 180120 - 140 135 - 145 160 - 200
ACT - Canberra120 140 150110 - 130 120 - 160 140 - 200
TAS - Hobart/Launceston120 130 15090 - 130 100 - 145 120 - 180
NT - Darwin130 140 170100 - 140 130 - 160 150 - 190
NZ - Auckland130 140 170100 - 150 130 - 180 140 - 220+
NZ - Wellington110 130 15090 - 130 110 - 150 120 - 200+
NZ - Christchurch110 125 15090 - 130 100 - 150 120 - 200+

2018 Hays Salary Guide | 33
ACCOUNTANCY & FINANCECommerce & Industry | Senior Finance
TYPICAL BENEFITS THAT MAY BE INCLUDED ON TOP OF BASE SALARIES SHOWN: NOTES:• All salaries shown are exclusive of superannuation (AU) or
KiwiSaver (NZ)
• New Zealand salaries are represented in New Zealand dollars
• Additional super• Health cover• Interest free loans• Car/car allowance
• Cash bonuses• Study assistance• Parking• Share options in company
• Laptops• Vehicle expenses• Professional memberships• School fees
SENIOR QUALIFIED ACCOUNTANTSFinance Manager (Turnover up to $50m)
Finance Manager (Turnover $50m - $500m)
Finance Manager (Turnover > $500m)
NSW - Sydney125 150 170100 - 150 130 - 170 140 - 200
NSW - Regional105 120 14085 - 120 100 - 140 120 - 180
VIC - Melbourne110 130 14590 - 120 110 - 145 130 - 160
VIC - Regional100 120 13590 - 120 100 - 140 120 - 160
QLD - Brisbane, Gold Coast & Sunshine Coast110 130 15080 - 120 110 - 150 120 - 180
QLD - Regional100 120 13080 - 120 100 - 130 110 - 150
SA - Adelaide110 130 14090 - 120 95 - 150 120 - 150
WA - Perth115 130 140100 - 125 120 - 140 130 - 150
ACT - Canberra115 130 140100 - 120 120 - 140 130 - 160
TAS - Hobart/Launceston100 115 13080 - 115 85 - 125 100 - 150
NT - Darwin110 130 14090 - 130 100 - 150 120 - 160
NZ - Auckland110 125 140100 - 130 110 - 150 120 - 160
NZ - Wellington100 115 13080 - 110 90 - 130 100 - 150
NZ - Christchurch100 120 13090 - 110 100 - 130 100 - 145
Commercial Manager (Turnover up to $50m)
Commercial Manager (Turnover $50m - $500m)
Senior Commercial Manager/Director(Turnover > $500m)
NSW - Sydney140 200 280100 - 150 180 - 220 230+
NSW - Regional130 150 160100 - 140 140 - 170 130 - 190
VIC - Melbourne130 150 200100 - 135 120 - 190 155 - 250
VIC - Regional125 150 180110 - 140 120 - 180 150 - 225
QLD - Brisbane, Gold Coast & Sunshine Coast130 150 180100 - 150 130 - 170 150 - 200
QLD - Regional130 150 180110 - 150 120 - 160 130 - 230
SA - Adelaide120 150 16095 - 140 110 - 150 140 - 180
WA - Perth135 160 200120 - 145 140 - 180 180 - 220
ACT - Canberra130 140 160120 - 140 130 - 150 140 - 190
TAS - Hobart/Launceston120 130 160100 - 135 115 - 160 140 - 200
NT - Darwin120 130 140110 - 130 110 - 150 120 - 160
NZ - Auckland120 140 160100 - 130 110 - 160 130 - 220
NZ - Wellington105 120 14580 - 120 100 - 135 110 - 170
NZ - Christchurch110 130 150100 - 125 100 - 150 120 - 180

34 | 2018 Hays Salary Guide
ACCOUNTANCY & FINANCECommerce & Industry | Senior Finance
TYPICAL BENEFITS THAT MAY BE INCLUDED ON TOP OF BASE SALARIES SHOWN: NOTES:• Subsidised accommodation• Bonus based on mine
production and performance
• Flights home if overseas residential
• Rental/utilities allowance
• Health cover• Relocation assistance• Site allowance
• All salaries shown are exclusive of superannuation (AU) or KiwiSaver (NZ)
• New Zealand salaries are represented in New Zealand dollars
• All salaries shown are exclusive of superannuation (AU) or KiwiSaver (NZ)
• New Zealand salaries are represented in New Zealand dollars
TYPICAL BENEFITS THAT MAY BE INCLUDED ON TOP OF BASE SALARIES SHOWN: NOTES:• Additional super• Health cover• Car/car allowance• Cash bonuses
• Study assistance• Parking• Share options in company• Laptops
• Vehicle expenses• Professional memberships• School fees
SENIOR QUALIFIED ACCOUNTANTSGroup Accountant (Turnover up to $50m)
Group Accountant (Turnover $50m - $500m)
Group Accountant (Turnover > $500m)
NSW - Sydney100 120 13090 - 120 90 - 150 100 - 150
NSW - Regional90 100 11080 - 100 90 - 110 90 - 120
VIC - Melbourne100 115 13090 - 115 100 - 130 115 - 140
VIC - Regional90 100 12080 - 110 90 - 110 110 - 130
QLD - Brisbane, Gold Coast & Sunshine Coast90 100 12080 - 110 90 - 120 100 - 140
QLD - Regional80 95 11570 - 100 80 - 110 90 - 125
SA - Adelaide90 95 12085 - 110 85 - 120 110 - 140
WA - Perth105 120 13090 - 110 100 - 130 125 - 135
ACT - Canberra100 110 12080 - 110 100 - 120 110 - 130
TAS - Hobart/Launceston85 95 11075 - 110 85 - 115 100 - 135
NT - Darwin90 100 12090 -110 100 - 120 120 - 140
NZ - Auckland90 110 11580 - 100 90 - 120 100 - 130
NZ - Wellington85 100 11075 - 100 90 - 115 90 - 130
NZ - Christchurch90 110 12075 - 100 90 - 120 100 - 140
Commerce & Industry | Mining
Mine Accountant
NSW - Regional120100 - 140
QLD - Regional12090 - 150
SA - Adelaide10090 - 130
WA - Perth140120 - 160
TAS - Hobart/Launceston8570 - 100
NT - Darwin120100 - 150
NZ - Auckland12090 - 130
NZ - Wellington10090 - 130
NZ - Christchurch12090 - 130

2018 Hays Salary Guide | 35
ACCOUNTANCY & FINANCECommerce & Industry | Senior Finance
TYPICAL BENEFITS THAT MAY BE INCLUDED ON TOP OF BASE SALARIES SHOWN: NOTES:• All salaries shown are exclusive of superannuation (AU) or
KiwiSaver (NZ)
• New Zealand salaries are represented in New Zealand dollars
• Additional super• Vehicle expenses• Professional memberships
• Car/car allowance• Health cover• Laptops
• Parking• Cash bonuses• Study assistance
SENIOR QUALIFIED ACCOUNTANTSDivisional Accountant(Turnover up to $50m)
Divisional Accountant(T. o. $50m - $500m)
Divisional Accountant(T. o. > $500m) Project Accountant
NSW - Sydney95 110 120 10580 - 100 90 - 120 100 - 140 85 - 135
NSW - Regional90 100 110 9585 - 100 90 - 110 100 - 120 85 - 110
VIC - Melbourne85 100 110 10075 - 95 85 - 110 100 - 125 85 - 110
VIC - Regional80 90 100 10070 - 85 75 - 100 85 - 110 80 - 110
QLD - Brisbane, Gold Coast & Sunshine Coast85 100 125 11080 - 95 90 - 110 100 - 130 90 - 120
QLD - Regional80 90 100 9570 - 85 80 - 100 90 - 120 85 - 120
SA - Adelaide85 95 110 11075 - 95 85 - 110 95 - 120 90 - 120
WA - Perth100 110 120 11095 - 110 100 - 130 110 - 140 90 - 135
ACT - Canberra90 100 115 10585 - 100 90 - 110 110 - 120 90 - 120
TAS - Hobart/Launceston75 80 90 9065 - 85 70 - 95 80 - 125 80 - 100
NT - Darwin80 90 100 11080 - 100 90 - 110 100 - 120 100 - 120
NZ - Auckland85 95 110 11575 - 95 85 - 105 90 - 125 95 - 135
NZ - Wellington80 90 100 10570 - 90 80 - 100 80 - 120 90 - 135
NZ - Christchurch80 100 110 11570 - 95 90 - 110 100 - 120 90 - 135
Corporate Accountant (Turnover up to $50m)
Corporate Accountant (T. o. $50m - $500m)
Corporate Accountant (T. o. > $500m)
NSW - Sydney105 120 13590 - 120 90 - 130 115 - 150
NSW - Regional80 85 9575 - 85 75 - 95 80 - 110
VIC - Melbourne95 110 12085 - 105 90 - 120 105 - 130
VIC - Regional80 90 10075 - 85 80 - 100 90 - 110
QLD - Brisbane, Gold Coast & Sunshine Coast90 110 12080 - 100 100 - 120 110 - 130
QLD - Regional80 95 11070 - 100 80 - 120 75 - 140
SA - Adelaide80 90 10070 - 90 85 - 110 90 - 120
WA - Perth100 115 12590 - 110 100 - 120 110 - 145
ACT - Canberra95 100 11085 - 100 90 - 110 100 - 120
TAS - Hobart/Launceston80 90 10065 - 90 75 - 95 85 - 110
NT - Darwin80 95 10070 - 90 85 - 110 90 - 120
NZ - Auckland85 100 11075 - 90 85 - 115 100 - 130
NZ - Wellington85 100 11075 - 90 80 - 110 95 - 115
NZ - Christchurch85 95 11575 - 90 85 - 110 100 - 120

36 | 2018 Hays Salary Guide
ACCOUNTANCY & FINANCECommerce & Industry | Senior Finance
TYPICAL BENEFITS THAT MAY BE INCLUDED ON TOP OF BASE SALARIES SHOWN: NOTES:• All salaries shown are exclusive of superannuation (AU) or
KiwiSaver (NZ)
• New Zealand salaries are represented in New Zealand dollars
• Additional super• Health cover• Study assistance
• Cash bonuses• Professional memberships• Laptops
SENIOR QUALIFIED ACCOUNTANTSFinancial Accountant(Turnover up to $50m)
Financial Accountant(Turnover $50m - $500m)
Financial Accountant(Turnover > $500m)
NSW - Sydney90 100 11075 - 100 85 - 105 90 - 120
NSW - Regional70 80 9565 - 80 70 - 90 75 - 110
VIC - Melbourne75 85 10070 - 90 75 - 100 85 - 120
VIC - Regional75 80 9070 - 90 75 - 100 80 - 120
QLD - Brisbane, Gold Coast & Sunshine Coast80 90 11070 - 90 80 - 100 90 - 120
QLD - Regional70 85 9565 - 85 75 - 100 90 - 120
SA - Adelaide75 85 9570 - 85 75 - 100 85 - 120
WA - Perth95 110 12590 - 100 95 - 125 110 - 140
ACT - Canberra85 90 10575 - 90 85 - 95 95 - 115
TAS - Hobart/Launceston75 85 9565 - 85 60 - 100 70 - 120
NT - Darwin80 90 10070 - 90 80 - 100 90 - 110
NZ - Auckland85 90 11075 - 95 80 - 100 90 - 120
NZ - Wellington80 90 11070 - 90 75 - 100 90 - 120
NZ - Christchurch85 90 12070 - 95 75 - 100 90 - 130
Management Accountant (Turnover up to $50m)
Management Accountant (Turnover $50m - $500m)
Management Accountant (Turnover > $500m)
NSW - Sydney90 110 12080 - 100 95 - 120 100 - 140
NSW - Regional75 90 11070 - 80 80 - 100 85 - 120
VIC - Melbourne85 95 11075 - 90 80 - 110 95 - 125
VIC - Regional80 90 10070 - 90 75 - 100 80 - 120
QLD - Brisbane, Gold Coast & Sunshine Coast85 100 12075 - 90 90 - 110 110 - 130
QLD - Regional85 95 12070 - 120 80 - 120 90 - 150
SA - Adelaide80 90 9570 - 90 80 - 100 90 - 125
WA - Perth95 110 12090 - 100 100 - 125 100 - 135
ACT - Canberra90 95 10580 - 100 90 - 100 95 - 115
TAS - Hobart/Launceston75 85 9565 - 85 70 - 100 80 - 120
NT - Darwin85 90 9575 - 95 80 - 100 90 - 120
NZ - Auckland85 90 11570 - 90 80 - 100 95 - 130
NZ - Wellington80 90 10070 - 90 75 - 95 90 - 125
NZ - Christchurch85 95 12075 - 95 85 - 100 100 - 130

2018 Hays Salary Guide | 37
ACCOUNTANCY & FINANCECommerce & Industry | Senior Finance
TYPICAL BENEFITS THAT MAY BE INCLUDED ON TOP OF BASE SALARIES SHOWN: NOTES:• All salaries shown are exclusive of superannuation (AU) or
KiwiSaver (NZ)
• New Zealand salaries are represented in New Zealand dollars
• Additional super• Health cover• Study assistance
• Cash bonuses• Professional memberships• Laptops
SENIOR QUALIFIED ACCOUNTANTSFinancial Analyst (T. o. up to $50m)
Financial Analyst(T. o. $50m - $500m)
Financial Analyst(T. o. > $500m)
Manager/Head of Financial Planning/ Analysis
NSW - Sydney90 110 120 22575 - 100 85 - 120 115 - 140 180+
NSW - Regional75 85 110 15070 - 80 70 - 100 85 - 125 140 - 200
VIC - Melbourne85 100 120 15080 - 95 85 - 110 100 - 140 140 - 175
VIC - Regional75 85 100 14070 - 90 75 - 100 80 - 120 125 - 160
QLD - Brisbane, Gold Coast & Sunshine Coast90 100 125 16080 - 100 85 - 110 115 - 135 140 - 180
QLD - Regional90 95 100 13080 - 100 75 - 110 80 - 120 110 - 130
SA - Adelaide85 95 105 15080 - 95 80 - 110 90 - 120 120 - 190
WA - Perth95 110 120 14590 - 100 100 - 120 100 - 130 135 - 165
ACT - Canberra90 95 115 15080 - 100 90 - 100 100 - 120 120 - 180
TAS - Hobart/Launceston75 85 95 13065 - 85 60 - 100 75 - 120 120 - 150
NT - Darwin85 95 100 13080 - 100 80 - 110 90 - 120 120 - 160
NZ - Auckland80 100 115 15075 - 95 80 - 120 100 - 130 120 - 190
NZ - Wellington75 95 110 14070 - 88 80 - 120 90 - 130 110 - 150
NZ - Christchurch80 90 100 13070 - 90 80 - 120 90 - 110 100 - 150
Systems Accountant (T. o. up to $50m)
Systems Accountant(T. o. $50m - $500m)
Systems Accountant (T. o. > $500m)
NSW - Sydney85 110 12570 - 100 90 - 120 90 - 145
NSW - Regional70 80 10060 - 80 75 - 90 90 - 120
VIC - Melbourne90 100 11075 - 100 85 - 110 100 - 135
VIC - Regional80 90 10070 - 90 80 - 100 90 - 120
QLD - Brisbane, Gold Coast & Sunshine Coast85 100 11575 - 95 85 - 110 90 - 130
QLD - Regional75 90 10070 - 90 80 - 100 85 - 120
SA - Adelaide85 90 11075 - 90 80 - 100 90 - 120
WA - Perth90 100 12090 - 100 100 - 120 110 - 140
ACT - Canberra95 100 11590 - 100 90 - 110 100 - 130
TAS - Hobart/Launceston80 90 11070 - 90 80 - 100 100 - 120
NT - Darwin85 90 11075 - 90 80 - 100 90 - 120
NZ - Auckland85 90 12075 - 95 80 - 100 90 - 150
NZ - Wellington85 90 12075 - 95 80 - 100 100 - 150
NZ - Christchurch85 95 12075 - 95 80 - 100 90 - 150

38 | 2018 Hays Salary Guide
ACCOUNTANCY & FINANCECommerce & Industry | Senior Finance
TYPICAL BENEFITS THAT MAY BE INCLUDED ON TOP OF BASE SALARIES SHOWN: NOTES:• All salaries shown are exclusive of superannuation (AU) or
KiwiSaver (NZ)
• New Zealand salaries are represented in New Zealand dollars
• Additional super• Health cover• Study assistance
• Cash bonuses• Professional memberships• Laptops
SENIOR QUALIFIED ACCOUNTANTSFinancial Systems Manager(Turnover up to $50m)
Financial Systems Manager(Turnover $50m - $500m)
Financial Systems Manager(Turnover > $500m)
NSW - Sydney120 160 170100 - 140 125 - 180 150 - 200
NSW - Regional90 120 13075 - 100 100 - 140 120 - 150
VIC - Melbourne120 140 160100 - 140 110 - 160 120 - 200
VIC - Regional100 120 15080 - 120 100 - 130 110 - 180
QLD - Brisbane, Gold Coast & Sunshine Coast105 120 12595 - 120 105 - 130 120 - 150
QLD - Regional90 110 12085 - 100 90 - 120 100 - 130
SA - Adelaide100 120 14080 - 120 90 - 140 100 - 150
WA - Perth110 120 150100 - 120 110 - 130 135 - 165
ACT - Canberra110 120 140100 - 120 110 - 130 130 - 150
TAS - Hobart/Launceston100 120 15080 - 120 100 - 130 110 - 180
NT - Darwin100 110 12090 - 110 100 - 120 110 - 130
NZ - Auckland100 120 13090 - 110 100 - 130 110 - 150
NZ - Wellington85 100 13075 - 95 85 - 115 110 - 150
NZ - Christchurch90 100 13085 - 95 90 - 110 120 - 150
Treasury Accountant(Turnover up to $50m)
Treasury Accountant(Turnover $50m - $500m)
Treasury Accountant(Turnover > $500m)
NSW - Sydney95 115 13580 - 100 90 - 125 100 - 150
NSW - Regional75 95 10070 - 80 70 - 110 95 - 120
VIC - Melbourne75 90 12560 - 80 80 - 105 110 - 150
VIC - Regional70 80 10055 - 82 70 - 90 80 - 120
QLD - Brisbane, Gold Coast & Sunshine Coast80 95 12575 - 90 85 - 100 110 - 140
QLD - Regional75 85 9570 - 80 75 - 100 100 - 120
SA - Adelaide80 95 11070 - 90 80 - 100 100 - 120
WA - Perth90 95 12090 - 95 90 - 100 100 - 130
ACT - Canberra80 95 11575 - 90 85 - 100 100 - 125
TAS - Hobart/Launceston70 80 10055 - 82 60 - 90 65 - 120
NT - Darwin80 90 11070 - 90 80 - 100 100 - 120
NZ - Auckland75 95 10065 - 85 80 - 105 80 - 120
NZ - Wellington75 95 10565 - 85 85 - 105 95 - 115
NZ - Christchurch70 85 10060 - 80 75 - 95 80 - 120

2018 Hays Salary Guide | 39
TYPICAL BENEFITS THAT MAY BE INCLUDED ON TOP OF BASE SALARIES SHOWN: NOTES:
ACCOUNTANCY & FINANCECommerce & Industry | Senior Finance | Financial Services
• All salaries shown are exclusive of superannuation (AU) or KiwiSaver (NZ)
• New Zealand salaries are represented in New Zealand dollars
* For a more detailed discussion on executive level salaries contact Hays Executive
• Additional super• Health cover• Study assistance
• Cash bonuses• Professional memberships• Laptops
TREASURY
Treasury Manager(T.o. up to $50m)
Treasury Manager (T.o. $50m - $500m)
Treasury Manager*(T.o. > $500m) Head of Treasury*
NSW - Sydney130 180 250 400100 - 150 150 - 200 200 - 280 280+
NSW - Regional100 120 180 20090 - 110 110 - 130 140 - 200 180 - 250
VIC - Melbourne100 120 150 25090 - 115 100 - 130 125 - 175 200 - 275
VIC - Regional90 110 130 17585 - 100 95 - 120 115 - 150 150 - 225
QLD - Brisbane, Gold Coast & Sunshine Coast100 120 160 18090 - 110 100 - 140 140 - 200 150 - 200
QLD - Regional100 115 130
N/A90 - 110 100 - 120 110 - 150
SA - Adelaide100 120 160 18095 - 120 100 - 140 125 - 180 150 - 210
WA - Perth120 135 185 200100 - 130 120 - 145 170 - 200 185 - 230
ACT - Canberra120 140 170 200100 - 130 120 - 160 150 - 220 180 - 250
TAS - Hobart/Launceston90 110 130
N/A85 - 100 95 - 120 115 - 150
NT - Darwin100 110 140 21585 - 110 100 - 130 120 - 150 180 - 250
NZ - Auckland85 120 150 16080 - 90 100 - 130 110 - 180 130 - 200
NZ - Wellington100 120 150 16080 - 120 110 - 130 120 - 180 130 - 190
NZ - Christchurch90 100 110 14080 - 100 85 - 110 100 - 120 120 - 160
PRODUCT AND FUNDS Product ControlProduct Control Manager
Fund/Investment Accountant
Senior Fund/ Investment Accountant
Fund/Investment Accountant Acctg. Manager
NSW - Sydney110 150 85 100 13090 - 130 120 - 180 75 - 90 85 - 120 100 - 160
NSW - Regional90 100 70 80 10085 - 95 90 - 110 60 - 75 70 - 85 80 - 110
VIC - Melbourne95 135 75 90 12080 - 100 120 - 150 65 - 90 80 - 110 110 - 150
VIC - Regional80 90 70 80 10060 - 85 85 - 100 60 - 80 75 - 85 85 - 110
QLD - Brisbane, Gold Coast & Sunshine Coast90 120 85 95 11080 - 100 110 - 130 65 - 90 80 - 110 90 - 130
QLD - Regional85 110 70 80 10080 - 95 90 - 120 60 - 85 70 - 100 90 - 120
SA - Adelaide85 110 70 80 10070 - 90 100 - 130 60 - 80 80 - 95 85 - 130
WA - Perth80 95 80 90 11065 - 85 90 - 110 70 - 95 90 - 100 95 - 120
ACT - Canberra N/A N/A80 100 12070 - 90 90 - 110 100 - 130
TAS - Hobart/Launceston80 110 70 80 10065 - 85 90 - 140 60 - 90 75 - 100 90 - 110
NT - Darwin80 90 80 90 11065 - 85 85 - 100 65 - 90 85 - 100 100 - 120
NZ - Auckland75 85 80 90 10565 - 85 75 - 95 75 - 85 80 - 100 85 - 115
NZ - Wellington70 80 75 90 10060 - 80 70 - 90 70 - 85 80 - 100 90 - 110
NZ - Christchurch75 85 80 85 10065 - 85 75 - 95 70 - 90 80 - 95 90 - 110

40 | 2018 Hays Salary Guide
TYPICAL BENEFITS THAT MAY BE INCLUDED ON TOP OF BASE SALARIES SHOWN: NOTES:• All salaries shown are exclusive of superannuation (AU) or
KiwiSaver (NZ)
• New Zealand salaries are represented in New Zealand dollars
• Additional super• Health cover• Study assistance
• Cash bonuses• Professional memberships• Laptops
ACCOUNTANCY & FINANCECommerce & Industry | Financial Services
STATUTORY AND TAX Tax Accountant Tax Manager Head of Tax Reporting Accountant
NSW - Sydney90 180 210 11080 - 110 120 - 230 160 - 260 95 - 130
NSW - Regional75 120 160 10070 - 80 110 - 130 140 - 170 95 - 130
VIC - Melbourne90 130 180 11085 - 100 110 - 150 160 - 210 95 - 130
VIC - Regional75 110 150 9070 - 85 100 - 130 120 - 160 80 - 100
QLD - Brisbane, Gold Coast & Sunshine Coast90 135 170 9080 - 100 95 - 150 140 - 200 85 - 100
QLD - Regional80 125 160 9070 - 95 100 - 150 140 - 200 85 - 100
SA - Adelaide80 130 160 9065 - 95 100 - 150 160 - 220 80 - 100
WA - Perth95 135 180
N/A90 - 105 120 - 150 160 - 210
ACT - Canberra90 125 150 9080 - 105 110 - 140 120 - 180 85 - 100
TAS - Hobart/Launceston75 120 150
N/A70 - 85 100 - 150 120 - 160
NT - Darwin90 120 160 8075 - 95 100 - 130 140 - 200 75 - 90
NZ - Auckland90 120 150 9065 - 100 100 - 130 120 - 180 80 - 100
NZ - Wellington80 110 120 9065 - 100 90 - 120 100 - 140 80 - 100
NZ - Christchurch90 110 115 9065 - 100 90 - 120 100 - 130 80 - 100
Reporting ManagerRegulatory Accounting Manager
Statutory Accountant
Financial Reporting Manager
NSW - Sydney130 130 100 190120 - 150 120 - 150 80 - 115 150 - 220
NSW - Regional125 110 80 120110 - 140 100 - 120 70 - 90 100 - 140
VIC - Melbourne120 130 110 12095 - 150 120 - 160 95 - 130 95 - 150
VIC - Regional120 100 90 100100 - 140 85 - 110 85 - 110 90 - 115
QLD - Brisbane, Gold Coast & Sunshine Coast125 120 90 130100 - 140 100 - 130 85 - 110 110 - 140
QLD - Regional125 120 90 130100 - 140 100 - 130 85 - 95 110 - 140
SA - Adelaide120 110 100 13095 - 130 90 - 130 80 - 110 120 - 150
WA - Perth N/A120 110 135100 - 140 95 - 130 110 - 150
ACT - Canberra120 110 95 13095 - 130 95 - 120 80 - 120 110 - 150
TAS - Hobart/Launceston N/A95 90 10085 - 110 85 - 110 90 - 115
NT - Darwin100 120 95 13090 - 120 90 - 130 85 - 110 120 - 150
NZ - Auckland120 110 100 130110 - 130 100 - 120 90 - 110 110 - 150
NZ - Wellington120 100 95 120110 - 130 90 - 120 85 - 110 110 - 140
NZ - Christchurch120 110 95 11080 - 100 110 - 130 90 - 120 80 - 110

2018 Hays Salary Guide | 41
TYPICAL BENEFITS THAT MAY BE INCLUDED ON TOP OF BASE SALARIES SHOWN: NOTES:
ACCOUNTANCY & FINANCECommerce & Industry | Financial Services
• All salaries shown are exclusive of superannuation (AU) or KiwiSaver (NZ)
• New Zealand salaries are represented in New Zealand dollars
• Additional super• Health cover• Study assistance
• Cash bonuses• Professional memberships• Laptops
COMPLIANCE/RISKCompliance/Risk Analysts
Compliance/Risk Manager
Operations Risk Analyst
Operations Risk Manager Head of Risk
NSW - Sydney100 130 95 140 25090 - 110 110 - 150 90 - 110 120 - 160 200 – 300
NSW - Regional70 100 85 120 22060 - 80 90 - 125 75 - 90 110 - 135 180 – 250
VIC - Melbourne90 140 95 140 25075 - 100 100 - 170 80 - 120 130 - 160 200 - 250
VIC - Regional75 110 85 120 22065 - 85 90 - 120 75 - 100 120 - 140 180 - 220
QLD - Brisbane, Gold Coast & Sunshine Coast90 130 95 150 21075 - 100 100 - 150 85 - 115 120 - 160 200 - 250
QLD - Regional70 100 80 110
N/A65 - 80 90 - 120 70 - 95 100 - 120
SA - Adelaide85 100 90 100 15075 - 90 90 - 130 80 - 95 95 - 120 130 - 200
WA - Perth95 120 110 145 16590 - 100 100 - 130 100 - 130 130 - 160 150 - 180
ACT - Canberra85 110 90 120 15070 - 90 100 - 120 80 - 105 110 - 135 140 - 180
TAS - Hobart/Launceston80 110 85 115
N/A70 - 95 90 - 130 75 - 98 110 - 135
NT - Darwin90 110 90 110 15080 - 110 90 - 120 75 - 110 95 - 120 120 – 180
NZ - Auckland75 100 85 120 16565 - 80 80 - 120 75 - 95 100 - 135 140 - 190
NZ - Wellington72 100 85 120 16565 - 80 80 - 120 75 - 95 100 - 135 140 - 190
NZ - Christchurch70 100 85 115 14060 - 80 80 - 120 70 - 100 90 - 130 120 - 160
INTERNAL AUDIT Internal AuditorSenior Internal Auditor
Internal Audit Manager
Head of Internal Audit
NSW - Sydney90 100 150 30075 - 95 90 - 110 120 - 180 230+
NSW - Regional95 105 120 18090 - 105 95 - 115 100 - 150 150 - 270
VIC - Melbourne95 115 140 16080 - 100 90 - 125 120 - 160 120 - 180
VIC - Regional80 100 125 15070 - 90 90 - 110 110 - 140 125 - 175
QLD - Brisbane, Gold Coast & Sunshine Coast85 100 140 18070 - 95 90 - 115 120 - 150 150 - 200
QLD - Regional75 90 120 15070 - 90 75 - 100 100 - 150 130 - 170
SA - Adelaide75 110 120 15070 - 85 85 - 130 100 - 140 140 - 190
WA - Perth85 100 140 16580 - 100 90 - 120 130 - 150 150 - 180
ACT - Canberra85 95 120 15080 - 100 90 - 110 100 - 125 130 - 200
TAS - Hobart/Launceston65 85 110 14055 - 75 75 - 100 90 - 130 110 - 160
NT - Darwin75 80 100 14065 - 80 75 - 90 95 - 110 130 - 170
NZ - Auckland80 100 130 15065 - 85 90 - 110 110 - 140 130 - 180
NZ - Wellington80 100 130 15070 - 90 90 - 110 100 - 140 130 - 160
NZ - Christchurch75 100 110 14065 - 85 90 - 110 85 - 120 110 - 160

42 | 2018 Hays Salary Guide
• All salaries shown are exclusive ofsuperannuation (AU) or KiwiSaver (NZ) • New Zealand salaries are represented in New Zealand dollarsNOTES:
ACCOUNTANCY & FINANCECommerce & Industry | Accounting Support
• All salaries shown are exclusive of superannuation (AU) or KiwiSaver (NZ)
• New Zealand salaries are represented in New Zealand dollars
• For internal audit and taxation salary details, please see the professional practice section or ask your consultant for advice
NOTES:
NON CPA/CA QUALIFIED EXPERIENCED ACCOUNTANTS 3-5 yrs exp 5-10 yrs exp Over 10 yrs exp
NSW - Sydney65 75 8055 - 70 65 - 80 70 - 90
NSW - Regional65 75 8055 - 70 65 - 80 70 - 90
VIC - Melbourne65 75 8060 - 70 65 - 80 70 - 100
VIC - Regional60 75 8055 - 70 65 - 80 70 - 90
QLD - Brisbane, Gold Coast & Sunshine Coast60 65 7553 - 66 55 - 80 60 - 80
QLD - Regional60 65 7545 - 65 50 - 75 60 - 85
SA - Adelaide65 75 8060 - 70 65 - 80 70 - 90
WA - Perth65 80 9060 - 70 70 - 90 85 - 100
ACT - Canberra60 75 8055 - 65 70 - 80 70 - 90
TAS - Hobart/Launceston60 65 7555 - 65 60 - 75 70 - 90
NT - Darwin55 70 8050 - 60 65 - 75 70 - 85
NZ - Auckland70 70 8065 - 75 65 - 75 75 - 85
NZ - Wellington65 72 8260 - 70 65 - 80 75 - 90
NZ - Christchurch60 65 7555 - 65 60 - 70 70 - 80
ASSISTANT ACCOUNTANTSGraduate(No experience)
Assistant Accountant(up to 2 yrs)
Assistant Accountant(2-4 yrs)
Assistant Accountant(4+ yrs)
NSW - Sydney45 55 60 6545 - 50 55 - 65 65 - 75 70 - 80
NSW - Regional40 55 60 6540 - 50 50 - 60 55 - 65 60 - 70
VIC - Melbourne40 55 58 6538 - 45 50 - 58 55 - 65 70 - 85
VIC - Regional42 55 65 7038 - 45 50 - 60 60 - 70 65 - 80
QLD - Brisbane, Gold Coast & Sunshine Coast45 55 60 6540 - 50 55 - 65 60 - 65 60 - 70
QLD - Regional40 50 55 6036 - 45 45 - 60 45 - 70 50 - 72
SA - Adelaide48 55 60 6545 - 50 50 - 60 55 - 65 60 - 75
WA - Perth45 60 55 7540 - 50 55 - 65 50 - 60 70 - 85
ACT - Canberra45 50 60 6540 - 50 45 - 55 55 - 65 60 - 70
TAS - Hobart/Launceston45 50 60 6540 - 50 45 - 60 50 - 65 55 - 70
NT - Darwin45 55 65 7040 - 50 50 - 60 60 - 70 65 - 75
NZ - Auckland45 50 58 6540 - 45 45 - 55 55 - 65 58 - 75
NZ - Wellington45 50 55 6540 - 50 45 - 55 50 - 60 60 - 70
NZ - Christchurch45 50 58 6540 - 45 45 - 55 50 - 60 60 - 70

2018 Hays Salary Guide | 43
ACCOUNTANCY & FINANCECommerce & Industry | Accounting Support
PAYROLL Payroll Officer Senior Payroll Officer Payroll Team LeadPayroll Systems Analyst
NSW - Sydney65 85 85 9565 - 75 75 - 85 80 - 90 90 - 100
NSW - Regional60 75 85 10060 - 65 65 - 75 80 - 90 90 - 110
VIC - Melbourne55 65 85 9045 - 60 60 - 80 80 - 90 85 - 95
VIC - Regional55 65
N/A N/A50 - 60 55 - 75
QLD - Brisbane, Gold Coast & Sunshine Coast60 70 80 8055 - 65 65 - 75 70 - 85 75 - 85
QLD - Regional55 60 70
N/A50 - 60 60 - 70 65 - 85
SA - Adelaide55 60 75 10050 - 60 60 - 70 70 - 80 85 - 110
WA - Perth60 70 90 10055 - 65 65 - 75 80 - 100 90 - 110
ACT - Canberra65 75 85 9560 - 75 75 - 85 80 - 90 90 - 100
TAS - Hobart/Launceston55 60 65 7050 - 60 55 - 65 60 - 80 65 - 85
NT - Darwin60 65 70 7555 - 65 60 - 70 65 - 75 70 - 80
NZ - Auckland55 60 80 8050 - 55 55 - 70 65 - 110 70 - 100
NZ - Wellington50 60 85 8545 - 55 55 - 70 70 - 100 70 - 100
NZ - Christchurch53 60 75 7550 - 55 55 - 70 65 - 90 65 - 90
Remuneration and Payroll Manager
Supervisor/Manager(<250 employees)
Supervisor/Manager (250 - 500 employees)
Supervisor/Manager (>500 employees)
NSW - Sydney115 90 95 110100 - 130 85 - 95 90 - 100 100 - 150
NSW - Regional105 80 90 9590 - 120 80 - 90 90 - 100 95 - 120
VIC - Melbourne110 75 85 9095 - 120 65 - 80 70 - 100 80 - 130
VIC - Regional N/A70 80 8060 - 90 70 - 90 70 - 100
QLD - Brisbane, Gold Coast & Sunshine Coast100 80 90 10090 - 120 75 - 85 85 - 95 90 - 120
QLD - Regional70 75 80 8565 - 75 65 - 80 70 - 90 75 - 100
SA - Adelaide100 70 75 9090 - 120 65 - 80 70 - 85 80 - 120
WA - Perth120 80 90 120100 - 150 70 - 90 80 - 100 100 - 180
ACT - Canberra120 85 95 110100 - 140 75 - 100 85 - 110 110 - 150
TAS - Hobart/Launceston90 62 60 7290 - 110 55 - 65 55 - 72 65 - 85
NT - Darwin80 70 75 7575 - 90 65 - 75 70 - 80 70 - 80
NZ - Auckland120 80 90 100110 - 150 65 - 90 80 - 100 90 - 110
NZ - Wellington125 80 90 100100 - 150 70 - 90 80 - 100 90 - 110
NZ - Christchurch100 80 90 10070 - 110 70 - 90 80 - 100 90 - 110
• All salaries shown are exclusive of superannuation (AU) or KiwiSaver (NZ)
• New Zealand salaries are represented in New Zealand dollars
NOTES:

44 | 2018 Hays Salary Guide
ACCOUNTANCY & FINANCECommerce & Industry | Accounting Support
CREDIT CONTROL/ACCOUNTS RECEIVABLE
Accounts Receivable Officer Credit Controller
Senior Credit Controller
Supervisor/Manager (1-5 staff)
Supervisor/Manager (> 5 staff)
NSW - Sydney55 60 65 80 9550 - 60 55 - 65 70 - 75 80 - 95 100 - 120
NSW - Regional50 55 60 70 8050 - 55 50 - 65 55 - 70 70 - 85 80 - 95
VIC - Melbourne55 55 60 65 8547 - 60 50 - 65 60 - 75 75 - 85 85 - 130
VIC - Regional55 55 60 70 7550 - 60 50 - 60 55 - 65 60 - 80 70 - 90
QLD - Brisbane, Gold Coast & Sunshine Coast55 60 65 75 8550 - 60 55 - 65 60 - 70 70 - 80 80 - 110
QLD - Regional50 55 60 65 7547 - 55 50 - 60 55 - 65 65 - 75 70 - 85
SA - Adelaide55 60 65 75 8550 - 60 55 - 65 60 - 75 65 - 85 70 - 100
WA - Perth55 60 65 75 9050 - 60 55 - 65 60 - 70 70 - 85 85 - 110
ACT - Canberra55 60 65 70 7550 - 60 55 - 65 60 - 70 65 - 75 70 - 85
TAS - Hobart/Launceston50 52 65 60 6547 - 55 47 - 60 55 - 75 50 - 65 55 - 75
NT - Darwin55 55 60 65 7050 - 60 50 - 60 55 - 65 60 - 70 65 - 75
NZ - Auckland56 58 65 75 8548 - 65 50 - 60 58 - 75 65 - 80 75 - 105
NZ - Wellington50 55 60 67 7145 - 55 50 - 60 55 - 65 60 - 75 65 - 90
NZ - Christchurch53 55 60 65 7050 - 55 50 - 60 55 - 65 65 - 70 65 - 90
BOOKKEEPERS To Trial Balance To Balance SheetSenior Bookkeeper
NSW - Sydney75 80 8570 - 85 80 - 85 85 - 95
NSW - Regional65 75 8065 - 70 70 - 75 80 - 85
VIC - Melbourne60 62 6550 - 65 50 - 65 75 - 85
VIC - Regional55 60 6550 - 60 55 - 65 60 - 70
QLD - Brisbane, Gold Coast & Sunshine Coast60 65 7055 - 65 60 - 70 65 - 75
QLD - Regional50 55 6045 - 55 45 - 60 55 - 70
SA - Adelaide55 60 7050 - 60 55 - 65 65 - 80
WA - Perth65 70 7560 - 75 65 - 80 70 - 95
ACT - Canberra60 65 7055 - 65 60 - 70 65 - 85
TAS - Hobart/Launceston50 55 6045 - 55 50 - 60 55 - 65
NT - Darwin60 65 6555 - 65 60 - 70 60 - 70
NZ - Auckland60 65 7055 - 60 60 - 70 65 - 80
NZ - Wellington55 60 6750 - 60 50 - 70 60 - 75
NZ - Christchurch60 65 7055 - 60 60 - 70 65 - 75
• All salaries shown are exclusive of superannuation (AU) or KiwiSaver (NZ)
• New Zealand salaries are represented in New Zealand dollars
NOTES:

2018 Hays Salary Guide | 45
ACCOUNTANCY & FINANCECommerce & Industry | Accounting Support
• All salaries shown are exclusive of superannuation (AU) or KiwiSaver (NZ)
• New Zealand salaries are represented in New Zealand dollars
NOTES:
ACCOUNTS PAYABLEAccounts Payable Officer
Accounts Payable Officer - Senior
Experienced Supervisor Accounts Payable
ManagerAccounts Payable
NSW - Sydney55 65 70 8550 - 60 60 - 70 70 - 75 80 - 110
NSW - Regional50 55 65 7543 - 55 55 - 60 60 - 65 70 - 80
VIC - Melbourne50 55 65 7545 - 60 50 - 65 60 - 75 65 - 100
VIC - Regional50 55 65 7545 - 55 50 - 60 60 - 70 65 - 85
QLD - Brisbane, Gold Coast & Sunshine Coast55 60 75 9050 - 60 60 - 65 70 - 75 80 - 110
QLD - Regional50 55 62 7545 - 55 50 - 60 58 - 65 65 - 85
SA - Adelaide52 60 65 7548 - 58 55 - 65 60 - 70 70 - 90
WA - Perth55 60 75 8550 - 60 55 - 70 70 - 85 80 - 90
ACT - Canberra50 60 65 7045 - 60 50 - 65 60 - 70 60 - 80
TAS - Hobart/Launceston50 55 60 6545 - 55 50 - 60 50 - 65 60 - 80
NT - Darwin55 60 60 6550 - 60 55 - 65 55 - 65 60 - 75
NZ - Auckland50 58 63 8045 - 55 50 - 65 58-68 70 - 100
NZ - Wellington50 60 65 8545 - 55 55 - 65 60 - 70 70 - 100
NZ - Christchurch48 52 58 8545 - 50 48 - 60 55 - 63 70 - 100
ACCOUNTS OFFICERSEntry Level Accounts Officer Accounts Officer
NSW - Sydney45 5545 - 55 55 - 65
NSW - Regional41 5040 - 45 50 - 55
VIC - Melbourne41 4640 - 45 45 - 60
VIC - Regional41 4540 - 45 45 - 55
QLD - Brisbane, Gold Coast & Sunshine Coast42 5541 - 45 50 - 60
QLD - Regional41 5040 - 45 45 - 55
SA - Adelaide47 5545 - 50 50 - 60
WA - Perth45 5540 - 50 45 - 60
ACT - Canberra45 5540 - 50 50 - 60
TAS - Hobart/Launceston45 4543 - 50 45 - 50
NT - Darwin50 5545 - 55 50 - 60
NZ - Auckland45 5845 - 50 50 - 60
NZ - Wellington43 5240 - 45 45 - 60
NZ - Christchurch45 5545 - 50 50 - 55
• All salaries shown are exclusive of superannuation (AU) or KiwiSaver (NZ)
• New Zealand salaries are represented in New Zealand dollars
NOTES:

46 | 2018 Hays Salary Guide
ACCOUNTANCY & FINANCEProfessional Practice
NOTES:TYPICAL BENEFITS THAT MAY BE INCLUDED ON TOP OF BASE SALARIES SHOWN:• All salaries shown are exclusive of superannuation (AU) or
KiwiSaver (NZ)
• New Zealand salaries are represented in New Zealand dollars
• Flexible packaging• High level of training• Performance based bonuses• Professional development
• Study support for professional and academic studies
BUSINESS SERVICES UNDERGRADUATES 0-2 yrs exp 2-3 yrs exp 3+ yrs exp
NSW - Sydney40 45 4836 - 45 44 - 50 46 - 55
NSW - Regional36 40 4636 - 38 36 - 42 42 - 48
VIC - Melbourne37 43 4940 - 45 45 - 55 55 - 60
VIC - Regional42 50 5536 - 45 45 - 55 50 - 65
QLD - Brisbane, Gold Coast & Sunshine Coast36 40 4536 - 40 40 - 45 45 - 50
QLD - Regional36 38 4536 - 40 36 - 40 40 - 48
SA - Adelaide36 40 4436 - 38 36 - 44 42 - 48
WA - Perth40 45 5238 - 42 40 - 49 50 - 55
ACT - Canberra36 40 4536 - 40 40 - 45 45 - 50
TAS - Hobart/Launceston36 38 4236 - 38 36 - 40 36 - 44
NT - Darwin45 60 7040 - 50 50 - 70 60 - 80
NZ - Auckland38 43 5035 - 42 40 - 45 45 - 60
NZ - Wellington38 43 5235 - 40 40 - 45 45 - 60
NZ - Christchurch37 45 5535 - 40 40 - 50 50 - 60
BUSINESS SERVICES GRADUATES No exp 1-2 yrs exp 2-3 yrs exp 3+ yrs exp
NSW - Sydney36 45 52 6236 - 38 40 - 50 48 - 60 55 - 70
NSW - Regional38 42 48 5636 - 40 38 - 44 42 - 50 50 - 65
VIC - Melbourne42 52 57 6045 45 - 55 55 - 60 60 - 65
VIC - Regional42 50 60 7038 - 45 45 - 55 50 - 65 60 - 75
QLD - Brisbane, Gold Coast & Sunshine Coast37 43 50 5536 - 40 39 - 50 45 - 55 50 - 65
QLD - Regional36 38 45 5536 - 40 36 - 40 40 - 48 50 - 65
SA - Adelaide42 44 48 5437 - 46 40 - 48 44 - 53 49 - 58
WA - Perth42 50 55 6540 - 45 45 - 55 50 - 60 60 - 70
ACT - Canberra42 47 53 6036 - 44 44 - 50 45 - 55 50 - 65
TAS - Hobart/Launceston38 42 50 5536 - 40 36 - 45 46 - 55 50 - 65
NT - Darwin40 60 70 8536 - 50 50 - 65 60 - 80 70 - 100
NZ - Auckland43 48 53 6035 - 45 45 - 55 50 - 65 55 - 70
NZ - Wellington43 47 55 6535 - 45 45 - 50 50 - 65 55 - 78
NZ - Christchurch43 50 55 6042 - 45 45 - 55 50 - 65 55 - 70

2018 Hays Salary Guide | 47
ACCOUNTANCY & FINANCEProfessional Practice
NOTES:TYPICAL BENEFITS THAT MAY BE INCLUDED ON TOP OF BASE SALARIES SHOWN:• All salaries shown are exclusive of superannuation (AU) or
KiwiSaver (NZ)
• New Zealand salaries are represented in New Zealand dollars
• Flexible packaging• High level of training• Performance based bonuses• Professional development
• Study support for professional and academic studies
BUSINESS SERVICES (TYPICALLY CA/CPA COMPLETE) SENIOR, SUPERVISOR, ASSISTANT MANAGERS 3-4 yrs exp 4-5 yrs exp 5-6 yrs exp 6+ yrs exp
NSW - Sydney70 75 85 9060 - 75 65 - 78 75 - 90 85 - 95
NSW - Regional68 72 82 8662 - 72 66 - 75 76 - 84 81 - 90
VIC - Melbourne66 75 83 9060 - 70 75 - 85 85 - 90 90+
VIC - Regional70 80 85 9065 - 80 65 - 85 70 - 95 80 - 110
QLD - Brisbane, Gold Coast & Sunshine Coast70 75 80 8565 - 80 65 - 85 75 - 95 80 - 110
QLD - Regional60 65 70 7555 - 65 58 - 70 68 - 80 70 - 95
SA - Adelaide68 72 77 8264 - 72 68 - 72 73 - 82 76 - 85
WA - Perth65 70 80 9060 - 70 65 - 75 75 - 90 90+
ACT - Canberra68 72 80 9060 - 70 65 - 75 75 - 85 80 - 95
TAS - Hobart/Launceston62 68 75 8555 - 68 62 - 75 70 - 85 80 - 100
NT - Darwin75 85 95 10070 - 80 80 - 90 90 - 100 90 - 110
NZ - Auckland65 72 80 9062 - 75 65 - 80 75 - 85 85 - 95
NZ - Wellington70 80 87 9665 - 75 75 - 85 80 - 93 85 - 105
NZ - Christchurch65 70 83 90+60 - 70 65 - 80 75 - 90 85+
BUSINESS SERVICES MANAGERS, SENIOR MANAGERS, PRINCIPALS/DIRECTORS Manager for 0-2 yrs
Senior Manager for 2-5 yrs Principals/Directors
NSW - Sydney105 125 17590 - 120 110 - 140 150+
NSW - Regional100 115 15590 - 110 100 - 135 125+
VIC - Melbourne110 130 175100 - 120 120 - 140 150+
VIC - Regional100 110 15080 - 110 100 - 125 125+
QLD - Brisbane, Gold Coast & Sunshine Coast95 130 15090 - 100 100 - 140 130+
QLD - Regional85 95 13075 - 95 80 - 120 115+
SA - Adelaide90 115 16085 - 95 110 - 125 140+
WA - Perth90 125 15085 - 100 100 - 140 150+
ACT - Canberra95 125 16085 - 105 110 - 140 140+
TAS - Hobart/Launceston85 110 13075 - 100 90 - 120 120+
NT - Darwin100 110 13090 - 110 100 - 120 120+
NZ - Auckland100 120 160+85 - 110 95 - 140 150+
NZ - Wellington95 122 17085 - 105 105 - 140 150+
NZ - Christchurch85 100 15080 - 95 90 - 125 130+

48 | 2018 Hays Salary Guide
TYPICAL BENEFITS THAT MAY BE INCLUDED ON TOP OF BASE SALARIES SHOWN: NOTES:
ACCOUNTANCY & FINANCEProfessional Practice
• All salaries shown are exclusive of superannuation (AU) or KiwiSaver (NZ)
• New Zealand salaries are represented in New Zealand dollars
• Flexible packaging• High level of training• Performance based bonuses• Professional development
• Study support for professional and academic studies
EXTERNAL AUDIT UNDERGRADUATES 0-2 yrs exp 2-3 yrs exp 3+ yrs exp
NSW - Sydney40 45 4836 - 45 44 - 50 46 - 55
NSW - Regional36 41 4636 - 38 38 - 43 43 - 48
VIC - Melbourne36 42 4640 - 45 45 - 50 50 - 55
VIC - Regional37 45 5536 - 40 40 - 50 50 - 60
QLD - Brisbane, Gold Coast & Sunshine Coast36 38 4536 - 38 36 - 41 36 - 48
QLD - Regional36 38 4536 - 40 36 - 40 40 - 48
SA - Adelaide36 42 4636-40 40 - 45 42 - 50
WA - Perth37 42 5036 - 40 40 - 45 45 - 60
ACT - Canberra36 40 4636 - 38 39 - 42 42 - 50
TAS - Hobart/Launceston36 40 4830 - 38 36 - 41 41 - 50
NT - Darwin40 45 6036-45 40 - 50 50 - 70
NZ - Auckland38 45 5035 - 42 40 - 50 45 - 55
NZ - Wellington36 40 5032 - 38 35 - 45 40 - 60
NZ - Christchurch37 45 5535 - 40 40 - 50 50 - 60
EXTERNAL AUDIT GRADUATES No exp 1-2 yrs exp 2-3 yrs exp 3+ yrs exp
NSW - Sydney36 45 51 6236 - 38 40 - 50 48 - 60 55 - 70
NSW - Regional40 45 52 5838 - 45 40 - 50 48 - 56 55 - 60
VIC - Melbourne41 45 52 5836-40 45 - 50 45 - 60 55 - 70
VIC - Regional36 45 50 5530 - 40 40 - 45 45 - 55 50 - 60
QLD - Brisbane, Gold Coast & Sunshine Coast38 45 50 5536 - 41 38 - 55 43 - 60 48 - 65
QLD - Regional38 40 45 5036 - 40 36 - 42 37 - 50 42 - 55
SA - Adelaide42 44 48 5437 - 46 40 - 48 44 - 53 49 - 58
WA - Perth40 48 55 6038-42 42 - 52 52 - 60 60 - 65
ACT - Canberra42 47 55 6036 - 44 44 - 50 45 - 60 50 - 65
TAS - Hobart/Launceston40 43 52 6036 - 44 36 - 45 46 - 55 55 - 70
NT - Darwin40 50 60 7036 - 45 40 - 55 55 - 70 60 - 75
NZ - Auckland43 48 53 6035 - 45 45 - 55 50 - 60 55 - 70
NZ - Wellington44 46 54 6035 - 45 40 - 48 50 - 58 45 - 65
NZ - Christchurch42 47 60 6038 - 45 40 - 55 45 - 65 50 - 70

2018 Hays Salary Guide | 49
TYPICAL BENEFITS THAT MAY BE INCLUDED ON TOP OF BASE SALARIES SHOWN: NOTES:
ACCOUNTANCY & FINANCEProfessional Practice
• All salaries shown are exclusive of superannuation (AU) or KiwiSaver (NZ)
• New Zealand salaries are represented in New Zealand dollars
• Flexible packaging• High level of training• Performance based bonuses• Professional development
• Study support for professional and academic studies
EXTERNAL AUDIT (TYPICALLY CA/CPA COMPLETE) SENIOR, SUPERVISOR, ASSISTANT MANAGERS 3-4 yrs exp 4-5 yrs exp 5-6 yrs exp 6+ yrs exp
NSW - Sydney70 76 80 8865 - 75 70 - 80 75 - 85 85 - 95
NSW - Regional68 71 83 9062 - 69 70 - 76 75 - 85 86 - 95
VIC - Melbourne65 70 80 8865 - 75 75 - 82 75 - 85 85 - 95+
VIC - Regional60 65 70 7555 - 65 60 - 70 65 - 75 70 - 80
QLD - Brisbane, Gold Coast & Sunshine Coast60 70 80 8560 - 70 65 - 75 75 - 85 80 - 90
QLD - Regional60 65 75 8550 - 65 55 - 75 65 - 85 70 - 90
SA - Adelaide68 72 77 8264 - 72 68 - 77 73 - 82 76 - 85
WA - Perth73 75 80 9270 - 76 70 - 80 75 - 85 88 - 98
ACT - Canberra70 80 90 10060 - 75 75 - 85 85 - 95 95+
TAS - Hobart/Launceston62 68 75 8060 - 70 62 - 75 70 - 85 72 - 90
NT - Darwin70 75 80 9060 - 80 65 - 85 70 - 90 75 - 100
NZ - Auckland65 72 80 9062 - 75 65 - 80 75 - 85 80 - 95
NZ - Wellington75 75 82 9060 - 75 65 - 80 76 - 88 82 - 92
NZ - Christchurch65 70 83 90+60 - 70 65 - 80 75 - 90 85+
EXTERNAL AUDIT MANAGERS, SENIOR MANAGERS, PRINCIPALS/DIRECTORS Manager for 0-2 yrs
Senior Manager for 2-5 yrs Principals/Directors
NSW - Sydney105 125 17595 - 110 110 - 135 135+
NSW - Regional103 120 16090 - 110 110 - 125 125+
VIC - Melbourne100 125 170+85 - 115 110 - 130 130+
VIC - Regional80 100 12565 - 85 95 - 110 110+
QLD - Brisbane, Gold Coast & Sunshine Coast100 120 15080 - 110 100 - 130 120+
QLD - Regional85 115 14070 - 100 90 - 130 130+
SA - Adelaide90 115 16085 - 95 110 - 125 140+
WA - Perth95 125 16590 - 100 115 - 130 140+
ACT - Canberra95 125 16085 - 105 110 - 140 140+
TAS - Hobart/Launceston85 110 13580 - 100 95 - 120 120+
NT - Darwin90 115 15085 - 95 110 - 125 140+
NZ - Auckland100 120 160+85 - 110 95 - 130 150+
NZ - Wellington100 120 18080 - 110 95 - 125 150+
NZ - Christchurch85 100 15080 - 95 90 - 110 140

50 | 2018 Hays Salary Guide
TYPICAL BENEFITS THAT MAY BE INCLUDED ON TOP OF BASE SALARIES SHOWN: NOTES:
ACCOUNTANCY & FINANCEProfessional Practice
• All salaries shown are exclusive of superannuation (AU) or KiwiSaver (NZ)
• New Zealand salaries are represented in New Zealand dollars
• Flexible packaging• High level of training• Performance based bonuses• Professional development
• Study support for professional and academic studies
INSOLVENCY GRADUATES No exp 1-2 yrs exp 2-3 yrs exp 3+ yrs exp
NSW - Sydney36 45 52 6236 - 38 40 - 50 48 - 60 55 - 70
NSW - Regional39 46 57 6237 - 42 42 - 51 49 - 63 58 - 65
VIC - Melbourne45 47 55 6338 - 45 43 - 54 49 - 64 56 - 69
VIC - Regional38 42 45 5036 - 42 38 - 45 42 - 50 45 - 55
QLD - Brisbane, Gold Coast & Sunshine Coast38 45 50 5736 - 39 40 - 50 47 - 55 52 - 62
QLD - Regional38 45 50 6036 - 41 42 - 48 45 - 55 50 - 65
SA - Adelaide42 44 48 5437 - 46 40 - 48 44 - 53 49 - 58
WA - Perth40 45 60 7038 - 43 40 - 50 55 - 65 65 - 75
ACT - Canberra42 47 51 6036 - 44 44 - 50 46 - 52 55 - 65
TAS - Hobart/Launceston38 42 50 5536 - 40 36 - 45 46 - 55 50 - 65
NT - Darwin42 44 48 6038 - 44 40 - 50 44 - 53 55 - 65
NZ - Auckland42 48 52 6038 - 46 45 - 55 45 - 58 55 - 65
NZ - Wellington44 48 55 6536 - 45 45 - 52 45 - 60 45 - 70
NZ - Christchurch38 48 53 60+35 - 43 40 - 52 50 - 60 65+
INSOLVENCY (TYPICALLY CA/CPA COMPLETE) SENIOR, SUPERVISOR, ASSISTANT MANAGERS 3-4 yrs exp 4-5 yrs exp 5-6 yrs exp 6+ yrs exp
NSW - Sydney70 75 80 10063 - 74 68 - 80 75 - 90 90 - 110
NSW - Regional65 74 82 9260 - 72 68 - 78 74 - 85 82 - 97
VIC - Melbourne67 75 85 9562 - 73 67 - 85 75 - 90 85 - 100
VIC - Regional60 65 75 8055 - 62 58 - 70 70 - 80 75 - 95
QLD - Brisbane, Gold Coast & Sunshine Coast65 72 80 9057 - 70 65 - 78 73 - 83 80 - 100
QLD - Regional60 70 80 8555 - 70 65 - 75 75 - 85 80 - 90
SA - Adelaide68 72 77 8264 - 72 68 - 77 73 - 82 76 - 85
WA - Perth70 80 90 11065 - 75 75 - 85 85 - 95 95 - 150
ACT - Canberra70 80 90 10065 - 75 75 - 85 85 - 95 95+
TAS - Hobart/Launceston58 63 68 7250 - 65 60 - 70 60 - 80 65 - 85
NT - Darwin65 70 80 9560 - 70 65 - 75 75 - 85 85 - 105
NZ - Auckland68 78 85 9565 - 70 70 - 88 80 - 90 90 - 110
NZ - Wellington75 80 90 10570 - 80 70 - 90 85 - 90 95 - 120
NZ - Christchurch65 70 80 90+60 - 80 65 - 85 75 - 90 80+

2018 Hays Salary Guide | 51
TYPICAL BENEFITS THAT MAY BE INCLUDED ON TOP OF BASE SALARIES SHOWN: NOTES:
ACCOUNTANCY & FINANCEProfessional Practice
• All salaries shown are exclusive of superannuation (AU) or KiwiSaver (NZ)
• New Zealand salaries are represented in New Zealand dollars
• Flexible packaging• High level of training• Performance based bonuses• Professional development
• Study support for professional and academic studies
INSOLVENCY MANAGERS, SENIOR MANAGERS, PRINCIPALS/DIRECTORS Manager for 0-2 yrs
Senior Manager for 2-5 yrs Principals/Directors
NSW - Sydney110 140 200+95 - 120 110 - 145 140+
NSW - Regional100 115 15083 - 105 105 - 120 120+
VIC - Melbourne110 130 19092 - 113 106 - 139 150+
VIC - Regional80 90 12070 - 85 85 - 110 110+
QLD - Brisbane, Gold Coast & Sunshine Coast95 120 15085 - 96 100 - 120 130+
QLD - Regional85 110 150+80 - 95 100 - 120 120+
SA - Adelaide90 115 16085 - 95 110 - 125 140+
WA - Perth100 115 14595 - 105 105 - 130 135+
ACT - Canberra100 125 16095+ 115+ 140+
TAS - Hobart/Launceston80 97 12070 - 90 89 - 103 110+
NT - Darwin90 115 13085 - 95 105 - 120 120+
NZ - Auckland100 120 160+95 - 110 100 - 150 140+
NZ - Wellington100 125 16090 - 110 105 - 145 140+
NZ - Christchurch90 110 130+70 - 110 85 - 120 120+
TAX CONSULTING (TYPICALLY CA/CPA COMPLETE) SENIOR, SUPERVISOR, ASSISTANT MANAGERS Up to 4 yrs exp 4-5 yrs exp 5-6 yrs exp 6+ yrs exp
NSW - Sydney75 80 90 9570 - 80 75 - 85 80 - 95 90 - 100
NSW - Regional68 73 80 8662 - 70 69 - 75 76 - 84 84 - 100
VIC - Melbourne70 75 85 8965 - 75 70 - 80 75 - 90 82 - 105
VIC - Regional60 65 70 7555 - 62 62 - 68 68 - 75 72 - 90
QLD - Brisbane, Gold Coast & Sunshine Coast70 75 85 9065 - 75 65 - 75 75 - 90 80 - 95
QLD - Regional60 65 75 8555 - 65 65 - 75 70 - 85 80 - 90
SA - Adelaide68 75 80 8665 - 72 70 - 80 75 - 85 80 - 91
WA - Perth75 85 100 11065 - 80 70 - 95 95 - 105 100+
ACT - Canberra70 75 90 100+60 - 70 65 - 80 80 - 100 95+
TAS - Hobart/Launceston58 63 68 7250 - 65 60 - 70 60 - 80 65 - 85
NT - Darwin75 85 90 10070 - 80 75 - 90 85 - 95 85 - 115
NZ - Auckland70 75 80 9060 - 75 65 - 85 75 - 85 80 - 100
NZ - Wellington72 75 82 9065 - 75 67 - 80 72 - 86 77 - 105
NZ - Christchurch70 75 80 85+60 - 75 65 - 85 70 - 85 75 - 100

52 | 2018 Hays Salary Guide
TYPICAL BENEFITS THAT MAY BE INCLUDED ON TOP OF BASE SALARIES SHOWN: NOTES:
ACCOUNTANCY & FINANCEProfessional Practice
• All salaries shown are exclusive of superannuation (AU) or KiwiSaver (NZ)
• New Zealand salaries are represented in New Zealand dollars
• Flexible packaging• High level of training• Performance based bonuses• Professional development
• Study support for professional and academic studies
TAX CONSULTING INCL MANAGERS, SENIOR MANAGERS, PRINCIPALS/DIRECTORS Manager for 0-2 yrs
Senior Manager for 2-5 yrs Principals/Directors
NSW - Sydney115 140 180+90 - 118 120 - 150 150+
NSW - Regional110 130 150100 - 115 120 - 135 128+
VIC - Melbourne105 140 18587 - 115 120 - 150 160+
VIC - Regional80 100 12565 - 85 92 - 103 110+
QLD - Brisbane, Gold Coast & Sunshine Coast100 123 15085 - 105 110 - 130 130+
QLD - Regional100 115 12585 - 105 105 - 125 120+
SA - Adelaide95 120 16090 - 103 115 - 125 140+
WA - Perth100 125 15595 - 110 110 - 140 150+
ACT - Canberra95 125 16085 - 105 110 - 140 140+
TAS - Hobart/Launceston80 100 12570 - 90 92 - 103 110+
NT - Darwin95 120 15090 - 100 110 - 125 140+
NZ - Auckland95 110 15085 - 110 100 - 130 140+
NZ - Wellington100 110 18090 - 110 100 - 130 150+
NZ - Christchurch90 100 15080 - 100 90 - 110 130+
CORPORATE FINANCE (TYPICALLY CA/CPA/SIA/MASTERS FINANCE) SENIOR, SUPERVISOR, ASSISTANT MANAGERS Up to 4 yrs exp 4-5 yrs exp 5-6 yrs exp 6+ yrs exp
NSW - Sydney80 85 90 12070 - 85 75 - 90 85 - 95 95 - 130
NSW - Regional60 65 76 8551 - 65 60 - 71 74 - 81 76 - 94
VIC - Melbourne74 80 85 10069 - 78 75 - 85 80 - 94 85 - 110
VIC - Regional65 70 80 8560 - 70 65 - 75 72 - 85 80 - 92
QLD - Brisbane, Gold Coast & Sunshine Coast75 80 85 10070 - 80 80 - 90 90 - 100 100 - 120
QLD - Regional65 75 80 9060 - 75 70 - 80 75 - 85 85 - 95
SA - Adelaide68 75 80 8665 - 72 70 - 80 75 - 85 80 - 91
WA - Perth75 85 95 12070 - 80 80 - 90 90 - 100 100 - 150
ACT - Canberra68 72 80 8560 - 70 65 - 75 75 - 85 80 - 95
TAS - Hobart/Launceston58 63 68 7250 - 65 60 - 70 60 - 80 65 - 85
NT - Darwin85 90 100 11080 - 90 80 - 100 90 - 110 90 - 120
NZ - Auckland70 78 82 9565 - 80 70 - 85 75 - 90 85 - 110
NZ - Wellington70 75 80 9065 - 80 65 - 85 70 - 90 75 - 110
NZ - Christchurch70 75 80 9060 - 80 60 - 85 70 - 90 80+

2018 Hays Salary Guide | 53
TYPICAL BENEFITS THAT MAY BE INCLUDED ON TOP OF BASE SALARIES SHOWN: NOTES:
ACCOUNTANCY & FINANCEProfessional Practice
• All salaries shown are exclusive of superannuation (AU) or KiwiSaver (NZ)
• New Zealand salaries are represented in New Zealand dollars
• Flexible packaging• High level of training• Performance based bonuses• Professional development
• Study support for professional and academic studies
CORPORATE FINANCE MANAGERS, SENIOR MANAGERS, PRINCIPALS/DIRECTORS Manager for 0-2 yrs
Senior Manager for 2-5 yrs Principals/Directors
NSW - Sydney120 170 220110 - 130 120 - 180 150+
NSW - Regional105 130 15090 - 110 110 - 140 130+
VIC - Melbourne115 160 22093 - 129 125 - 170 160+
VIC - Regional95 110 13585 - 105 100 - 140 125+
QLD - Brisbane, Gold Coast & Sunshine Coast110 140 200100 - 120 125 - 150 140+
QLD - Regional90 110 13085 - 100 105 - 125 120+
SA - Adelaide95 120 16090 - 103 115 - 125 140+
WA - Perth115 140 180105 - 125 120 - 185 145+
ACT - Canberra95 125 16085 - 105 110 - 140 140+
TAS - Hobart/Launceston80 95 12070 - 90 85 - 100 110+
NT - Darwin95 110 13585 - 105 100 - 120 125+
NZ - Auckland100 120 16090 - 110 100 - 140 150+
NZ - Wellington112 120 15090 - 115 100 - 140 180+
NZ - Christchurch90 110 14085 - 100 100 - 130 130+
MANAGEMENT CONSULTING (TYPICALLY CA/CPA COMPLETE) SENIOR, SUPERVISOR, ASSISTANT MANAGERS Up to 4 yrs exp 4-5 yrs exp 5-6 yrs exp 6+ yrs exp
NSW - Sydney70 75 85 9568 - 75 68 - 80 80 - 90 85 - 110
NSW - Regional60 68 74 8353 - 63 55 - 72 69 - 78 76 - 87
VIC - Melbourne64 72 80 9060 - 69 65 - 78 74 - 84 85 - 95
VIC - Regional62 68 75 8258 - 68 65 - 75 72 - 80 78 - 85
QLD - Brisbane, Gold Coast & Sunshine Coast65 75 85 9565 - 75 70 - 80 8.90 90 - 100
QLD - Regional60 68 75 8055 - 65 64 - 72 68 - 76 74 - 90
SA - Adelaide68 72 77 8264 - 72 68 - 77 73 - 82 76 - 85
WA - Perth75 80 90 10065 - 75 70 - 80 80 - 95 85 - 110
ACT - Canberra75 85 100 11070 - 80 80 - 90 90 - 100 100+
TAS - Hobart/Launceston58 63 68 7250 - 65 60 - 70 60 - 80 65 - 85
NT - Darwin77 90 95 10070 - 85 85 - 95 90 - 100 90 - 110
NZ - Auckland65 70 80 9060 - 70 65 - 80 75 - 90 80 - 100
NZ - Wellington64 72 80 9060 - 69 65 - 78 74 - 84 85 - 95
NZ - Christchurch60 70 80 90+55 - 65 65 - 75 75 - 85 80+

54 | 2018 Hays Salary Guide
TYPICAL BENEFITS THAT MAY BE INCLUDED ON TOP OF BASE SALARIES SHOWN: NOTES:
ACCOUNTANCY & FINANCEProfessional Practice
• All salaries shown are exclusive of superannuation (AU) or KiwiSaver (NZ)
• New Zealand salaries are represented in New Zealand dollars
• Flexible packaging• High level of training• Performance based bonuses• Professional development
• Study support for professional and academic studies
MANAGEMENT CONSULTING MANAGERS, SENIOR MANAGERS, PRINCIPALS/DIRECTORS Manager for 0-2yrs
Senior Manager for 2-5 yrs Principals/Directors
NSW - Sydney100 130 170+90 - 115 110 - 150 150+
NSW - Regional85 105 13570 - 95 100 - 120 120+
VIC - Melbourne105 130 17087 - 115 110 - 155 150+
VIC - Regional85 100 12580 - 90 90 - 110 110+
QLD - Brisbane, Gold Coast & Sunshine Coast110 130 160100 - 120 120 - 140 150
QLD - Regional85 100 12580 - 95 100 - 120 125+
SA - Adelaide90 115 16085 - 95 110 - 125 140+
WA - Perth110 130 170100 - 120 115 - 140 150+
ACT - Canberra100 125 16085 - 105 110 - 140 140+
TAS - Hobart/Launceston80 100 12570 - 90 88 - 110 110+
NT - Darwin90 115 13085 - 95 110 - 125 125+
NZ - Auckland90 110 150+80 - 100 100 - 130 130+
NZ - Wellington88 100 15078 - 95 90 - 115 120+
NZ - Christchurch85 95 11570 - 90 80 - 110 100+
RISK CONSULTING/INTERNAL AUDIT (TYPICALLY CA/CPA COMPLETE) SENIOR, SUPERVISOR, ASSISTANT MANAGERS Up to 4 yrs exp 4-5 yrs exp 5-6 yrs exp 6+ yrs exp
NSW - Sydney75 80 95 9865 - 80 78 - 86 87 - 95 95 - 110
NSW - Regional63 70 80 8557 - 68 66 - 78 76 - 86 78 - 92
VIC - Melbourne66 75 80 8860 - 70 68 - 77 75 - 86 82 - 95
VIC - Regional62 70 75 8058 - 65 65 - 74 74 - 82 76 - 85
QLD - Brisbane, Gold Coast & Sunshine Coast65 75 80 9060 - 68 65 - 74 70 - 92 74 - 90
QLD - Regional65 70 75 8060 - 70 65 - 75 70 - 80 75 - 85
SA - Adelaide68 72 77 8264 - 72 68 - 77 73 - 82 76 - 85
WA - Perth70 75 80 9060 - 80 70 - 80 75 - 90 85 - 95
ACT - Canberra68 72 85 9560 - 70 65 - 75 75 - 90 90+
TAS - Hobart/Launceston58 63 68 7250 - 65 60 - 70 60 - 80 65 - 85
NT - Darwin70 80 90 10060 - 80 65 - 85 80 - 100 85 - 115
NZ - Auckland68 78 87 9055 - 78 70 - 85 82 - 95 80 - 100
NZ - Wellington70 80 90 9565 - 75 75 - 85 85 - 95 90 - 100
NZ - Christchurch65 75 90 9050 - 70 65 - 85 80 - 100 85 - 110

2018 Hays Salary Guide | 55
TYPICAL BENEFITS THAT MAY BE INCLUDED ON TOP OF BASE SALARIES SHOWN: NOTES:
ACCOUNTANCY & FINANCEProfessional Practice
• All salaries shown are exclusive of superannuation (AU) or KiwiSaver (NZ)
• New Zealand salaries are represented in New Zealand dollars
• Flexible packaging• High level of training• Performance based bonuses• Professional development
• Study support for professional and academic studies
RISK CONSULTING/INTERNAL AUDIT MANAGERS, SENIOR MANAGERS, PRINCIPALS/DIRECTORS Manager for 0-2 yrs
Senior Manager for 2-5 yrs Principals/Directors
NSW - Sydney110 125 17092 - 115 110 - 135 140+
NSW - Regional95 120 15585 - 100 95 - 130 120+
VIC - Melbourne100 125 160+85 - 110 105 - 140 140+
VIC - Regional85 110 14070 - 95 95 - 130 130+
QLD - Brisbane, Gold Coast & Sunshine Coast100 125 16080 - 100 105 - 125 130+
QLD - Regional95 115 12580 - 100 105 - 125 125+
SA - Adelaide90 115 16085 - 95 110 - 125 140+
WA - Perth100 120 15090 - 105 110 - 145 140+
ACT - Canberra100 125 16090 - 110 110 - 140 140+
TAS - Hobart/Launceston80 95 12570 - 90 83 - 105 110+
NT - Darwin90 110 12080 - 100 95 - 120 110+
NZ - Auckland95 115 150+85 - 115 95 - 130 140+
NZ - Wellington100 120 16585 - 115 110 - 135 130+
NZ - Christchurch80 100 15065 - 90 80 - 125 130+

56 | 2018 Hays Salary Guide
NOTES:
ACCOUNTANCY & FINANCEProfessional Practice
• All salaries shown are exclusive of superannuation (AU) or KiwiSaver (NZ)
• New Zealand salaries are represented in New Zealand dollars
NOTES:
• All salaries shown are exclusive of superannuation (AU) or KiwiSaver (NZ)
• New Zealand salaries are represented in New Zealand dollars
PRACTICE ADMINISTRATION Accountant Practice Manager Finance Manager
NSW - Sydney85 100 11572 - 87 85 - 110 95 - 125
NSW - Regional76 90 10060 - 81 85 - 98 85 - 110
VIC - Melbourne80 90 11070 - 87 75 - 100 90 - 125
VIC - Regional70 80 9565 - 72 75 - 85 88 - 100
QLD - Brisbane, Gold Coast & Sunshine Coast70 85 10060 - 75 80 - 90 90 - 110
QLD - Regional65 80 9560 - 70 75 - 90 90 - 110
SA - Adelaide75 83 9070 - 80 78 - 90 85 - 105
WA - Perth80 95 10075 - 90 85 - 110 95 - 125
ACT - Canberra80 90 11075 - 85 80 - 100 95 - 125
TAS - Hobart/Launceston70 80 8560 - 75 70 - 90 75 - 95
NT - Darwin70 90 9565 - 75 80 - 100 90 - 105
NZ - Auckland80 90 10070 - 85 80 - 110 85 - 115
NZ - Wellington75 85 9060 - 80 75 - 95 80 - 100
NZ - Christchurch70 100 9060 - 80 90 - 110 80 - 100
ADMINISTRATION Team Assistant Office/Admin Manager PA to Partner (1 on 1) PA to Partners (2 or 3)
NSW - Sydney50 70 70 6545 - 55 60 - 75 65 - 80 65 - 75
NSW - Regional45 60 63 6040 - 50 52 - 65 55 - 58 52 - 65
VIC - Melbourne48 60 58 5840 - 55 50 - 70 55 - 70 55 - 70
VIC - Regional50 60 60 6040 - 55 55 - 65 50 - 65 50 - 65
QLD - Brisbane, Gold Coast & Sunshine Coast45 60 58 5242 - 48 55 - 65 50 - 62 48 - 65
QLD - Regional50 60 58 6045 - 55 55 - 65 55 - 63 50 - 80
SA - Adelaide50 61 60 7040 - 55 55 - 65 50 - 65 65 - 80
WA - Perth60 70 70 7555 - 70 65 - 75 65 - 75 70 - 80
ACT - Canberra45 60 60 6540 - 50 50 - 65 50 - 70 55 - 75
TAS - Hobart/Launceston48 60 55 5540 - 55 50 - 70 45 - 60 45 - 60
NT - Darwin60 80 60 6540 - 70 70 - 90 50 - 65 60 - 75
NZ - Auckland45 65 60 6540 - 50 55 - 70 55 - 70 55 - 70
NZ - Wellington40 55 50 5335 - 44 45 - 60 45 - 55 45 - 60
NZ - Christchurch50 60 60 6048 - 55 55 - 65 55 - 70 60+
• Education costs • Performance based bonusesTYPICAL BENEFITS THAT MAY BE INCLUDED ON TOP OF BASE SALARIES SHOWN:

2018 Hays Salary Guide | 57
SALA
RY IN
FOR
MAT
ION
: BA
NKI
NG
AUSTRALIAVacancy activity within Australia’s financial services sector remained high over the past twelve months, both for temporary and permanent positions, and this will continue in the year ahead.
Modest salary increases have been evident in most areas with Credit Analysts the biggest winners in response to growing demand and a shortage of relevant skills.
In addition, job opportunities are increasing for Business Development Managers and credit professionals given the growth of FinTech companies that specialise in unsecured cash flow lending as well as the resurgence of non-bank lenders, particularly subprime equipment and asset finance companies. Such employers are attractive options to successful bankers looking for an entrepreneurial culture.
Risk Managers with experience across operational risk, credit risk and conduct risk remain in demand, as do risk specialists with strong quantitative analysis skills as organisations strengthen their risk management practices and or improve their investment strategies. Despite demand, there has been no significant change to salaries.
Compliance is another active area for jobs. Once considered a support function, it is now an increasingly prominent role given accumulative regulatory requirements, particularly anti-money laundering and counter-terrorism financing (AML/CTF). With banks expected to continue growing their headcount in this area to meet AUSTRAC reporting requirements, particularly at an operational level, demand will remain high
in the year ahead for suitably skilled professionals. Given demand, there have been some moderate salary increases.
Financial planning salaries have increased in recent years in response to qualification requirements, remediation projects and the decline of commission-based incentives. However not every firm has followed this trend, with some relying instead on their brand, an open APL and non-monetary benefits to attract talent. Consequently financial planning salaries now vary greatly and span a wide range.
Financial planning qualifications have been a topic of discussion for several years and are an ongoing concern for planners and managers alike. The spotlight remains firmly on the delivery of the best possible outcome for customers, which has set in motion the requirement for planners to attain their CFP and degree. This is now an almost minimum requirement for new positions.
New job opportunities are being created in digital and virtual lending teams in the Big 4 banks, which continue to look for faster and easier processes for their customers. These include jobs for experienced Lending Managers who are looking to move out of a branch.
The inexorable rise of crypto-currencies over the past year has placed even greater importance on finance companies’ digital assets. In 2018-19 we expect to see the industry retrain and reshape its talent base in response. We’ll also see increasing demand for specialists in this field. Consequently, professionals who upskill in this area will have an advantage in this new, complex and fast-evolving sector.
In other trends, bonuses and incentive-based pay for customer-facing roles are focused on a broader range of measures, as opposed to solely sales, as banks implement the Sedgwick Review’s recommendations and embed a more customer-focused culture.
Assessment centres continue to be the preferred method of recruitment for volume customer service, operations and entry level positions. There is a focus within the bigger banks on improving the candidate experience during recruitment and onboarding.
Finally, employers are conducting more thorough pre-employment screenings given the implementation of the ABA background check protocol aimed at preventing individuals with a history of poor conduct from moving around the industry.
Vacancy activity within Australia’s financial services sector remained high over the past twelve months, both for temporary and permanent positions, and this will continue in the year ahead.
“
”
New job opportunities are being created in digital and virtual lending teams in the Big 4 banks.
“”
BANKING

58 | 2018 Hays Salary Guide
BANKING
NOTES:• All salaries shown are exclusive of superannuation
RETAIL BANKING TellerCustomer Service Officer
Branch Supervisor Personal Banker Lender
NSW - Sydney47 50 70 65 9547 - 50 48 - 54 60 - 75 55 - 75 80 - 110
VIC - Melbourne42 42 55 50 8042 - 44 42 - 46 50 - 60 47 - 55 75 - 85
QLD - Brisbane, Gold Coast & Sunshine Coast42 42 55 50 7542 - 43 42 - 46 50 - 60 47 - 55 70 - 80
SA - Adelaide44 45 53 55 6042 - 46 42 - 50 49 - 55 50 - 60 55 - 65
WA - Perth43 47 55 55 8542 - 47 42 - 50 50 - 60 50 - 60 75 - 90
ACT - Canberra42 42 49 58 7542 - 45 42 - 50 49 - 55 47 - 70 55 - 90
TAS - Hobart42 42 49 50 5542 - 44 42 - 43 49 - 60 47 - 55 50 - 60
NT - Darwin42 45 55 50 5542 - 44 42 - 50 49 - 60 47 - 55 50 - 60
Mobile Lending Manager Branch Manager
Regional/District Manager
NSW - Sydney95 100 14090 - 110 80 - 140 135 - 175
VIC - Melbourne90 85 12075 - 100 70 - 110 100 - 135
QLD - Brisbane, Gold Coast & Sunshine Coast80 75 12075 - 85 60 - 82 90 - 135
SA - Adelaide75 75 11065 - 85 65 - 82 90 - 120
WA - Perth95 100 14080 - 110 80 - 120 130 - 160
ACT - Canberra80 80 11070 - 110 55 - 110 75 - 135
TAS - Hobart68 75 11055 - 82 55 - 82 80 - 135
NT - Darwin75 75 11060 - 78 60 - 110 90 - 120
MORTGAGE BROKING Broker Support Account Manager Broker
NSW - Sydney60 85 9055 - 65 70 - 100 80 - 100
VIC - Melbourne55 85 9045 - 60 70 - 100 80 - 100
QLD - Brisbane, Gold Coast & Sunshine Coast60 65 10055 - 65 60 - 70 90 - 110
SA - Adelaide53 80 8550 - 55 75 - 85 80 - 95
WA - Perth55 60 7050 - 60 55 - 65 50 - 80
ACT - Canberra50 60 6040 - 55 50 - 70 40 - 70
TAS - Hobart N/A N/A N/A
NT - Darwin N/A N/A N/A

2018 Hays Salary Guide | 59
BANKING
NOTES:• All salaries shown are exclusive of superannuation
LENDING OPERATIONSOperations Officer
Settlements Officer
Collections Officer Credit Analyst
Senior Credit Analyst
NSW - Sydney53 60 60 80 9550 - 55 50 - 70 50 - 70 70 - 100 85 - 110
VIC - Melbourne44 55 50 70 7541 - 50 50 - 60 45 - 55 60 - 80 65 - 85
QLD - Brisbane, Gold Coast & Sunshine Coast41 45 45 60 7541 - 44 45 - 50 45 - 50 55 - 65 65 - 80
SA - Adelaide48 50 53 55 6545 - 50 45 - 55 50 - 58 50 - 60 60 - 70
WA - Perth48 50 55 60 7544 - 50 45 - 55 50 - 60 55 - 65 65 - 85
ACT - Canberra41 45 45 55 6541 - 44 45 - 50 45 - 50 50 - 60 50 - 75
TAS - Hobart41 45 45 46 6041 - 44 45 - 50 45 - 50 43 - 50 50 - 70
NT - Darwin41 45 45 46 6041 - 44 45 - 50 45 - 50 43 - 50 50 - 70
Team Leader/Supervisor Manager
Senior Manager
General Manager
NSW - Sydney90 100 120 17075 - 105 90 - 120 100 - 140 140 - 220
VIC - Melbourne70 75 110 15565 - 75 70 - 80 90 - 120 120 - 210
QLD - Brisbane, Gold Coast & Sunshine Coast60 70 100 13555 - 65 55 - 80 80 - 110 100 - 185
SA - Adelaide60 75 82 12055 - 65 65 - 80 75 - 100 100 - 135
WA - Perth65 85 110 14060 - 70 80 - 90 90 - 120 100 - 180
ACT - Canberra60 70 100 13555 - 65 55 - 80 80 - 110 100 - 185
TAS - Hobart50 70 82 13545 - 55 55 - 80 70 - 90 100 - 185
NT - Darwin65 75 90 12055 - 70 65 - 80 75 - 110 100 - 135
BUSINESS & COMMERCIAL LENDING
Assistant Relationship Manager
Relationship Manager
SeniorRelationship Manager
Executive Manager State Manager
Business Development Manager
NSW - Sydney80 120 135 200 220 13575 - 90 100 - 130 120 - 160 180 - 230 200 - 260 110 - 150
VIC - Melbourne70 100 130 180 200 13055 - 85 87 - 120 110 - 140 140 - 200 165 - 220 110 - 145
QLD - Brisbane, Gold Coast & Sunshine Coast70 100 120 145 200 13060 - 75 87 - 120 100 - 135 135 - 165 185 - 220 110 - 140
SA - Adelaide65 100 130 150 170 11060 - 70 87 - 120 115 - 150 135 - 165 160 - 185 90 - 120
WA - Perth80 120 135 170 200 13075 - 90 100 - 140 120 - 160 150 - 180 180 - 235 110 - 140
ACT - Canberra70 90 120 145 170 13055 - 78 75 - 120 90 - 140 90 - 165 140 - 200 100 - 145
TAS - Hobart60 90 105 135 160 10055 - 80 80 - 100 100 - 120 120 - 155 135 - 185 80 - 120
NT - Darwin65 78 110 125 160 11055 - 65 65 - 80 90 - 120 110 - 130 120 - 165 90 - 120

60 | 2018 Hays Salary Guide
BANKING
NOTES:• All salaries shown are exclusive of superannuation
CORPORATE & LENDING
Assistant Relationship Manager
Relationship Manager
SeniorRelationship Manager
Executive Manager State Manager
Business Development Manager
NSW - Sydney100 135 185 235 275 13580 - 130 120 - 165 165 - 200 220 - 255 235 - 310 120 - 165
VIC - Melbourne75 110 130 160 200 13065 - 80 100 - 120 120 - 145 135 - 175 175 - 230 110 - 155
QLD - Brisbane, Gold Coast & Sunshine Coast70 100 120 145 200 13060 - 75 80 - 120 100 - 135 135 - 165 185 - 220 110 - 142
SA - Adelaide70 110 130 150 170 13060 - 75 85 - 110 115 - 150 135 - 165 160 - 185 110 - 135
WA - Perth80 140 150 190 260 13075 - 90 100 - 150 140 - 160 180 - 200 200 - 290 115 - 165
ACT - Canberra70 90 120 145 170 13055 - 80 75 - 120 90 - 140 90 - 165 140 - 200 100 - 145
TAS - Hobart65 110 130 150 170 13060 - 70 85 - 110 115 - 150 135 - 165 160 - 185 110 - 135
NT - Darwin65 110 130 150 170 13060 - 70 85 - 110 115 - 150 135 - 165 160 - 185 110 - 135
ASSET FINANCEClient Services
Settlements Officer
Credit Analyst
Senior Credit Analyst
Business Development Manager
NSW - Sydney55 60 70 85 12550 - 60 55 - 65 65 - 75 75 - 100 100 - 145
VIC - Melbourne55 55 65 75 9045 - 60 50 - 65 60 - 75 65 - 80 75 - 100
QLD - Brisbane, Gold Coast & Sunshine Coast55 45 55 65 10040 - 60 40 - 50 50 - 60 55 - 75 80 - 110
SA - Adelaide55 50 55 65 9050 - 60 45 - 55 50 - 60 55 - 70 80 - 100
WA - Perth55 50 70 85 12050 - 60 45 - 55 65 - 75 75 - 90 90 - 130
ACT - Canberra55 40 55 60 7545 - 60 36 - 45 40 - 60 60 - 70 60 - 90
TAS - Hobart55 38 55 55 8550 - 60 36 - 45 50 - 60 50 - 60 80 - 100
NT - Darwin55 50 55 65 11050 - 60 45 - 55 50 - 60 60 - 70 80 - 130
SUPERANNUATION ADMIN AdministratorSenior Administrator Team Leader Manager
Senior Manager
NSW - Sydney50 60 70 95 12050 - 55 55 - 65 70 - 80 85 - 110 100 - 130
VIC - Melbourne50 60 70 95 12045 - 55 55 - 65 65 - 80 85 - 110 110 - 130
QLD - Brisbane, Gold Coast & Sunshine Coast45 55 65 90 12040 - 50 50 - 60 60 - 75 75 - 110 90 - 145
SA - Adelaide45 50 65 100 12040 - 45 40 - 50 55 - 70 75 - 110 100 - 130
WA - Perth50 55 65 90 12050 - 55 50 - 60 55 - 75 80 - 110 100 - 130
ACT - Canberra45 55 65 80 12040 - 50 50 - 60 60 - 75 75 - 90 100 - 130
TAS - Hobart45 40 50 70 12036 - 45 36 - 45 45 - 65 60 - 80 100 - 130
NT - Darwin45 50 65 100 12036 - 45 40 - 50 55 - 70 75 - 110 100 - 130
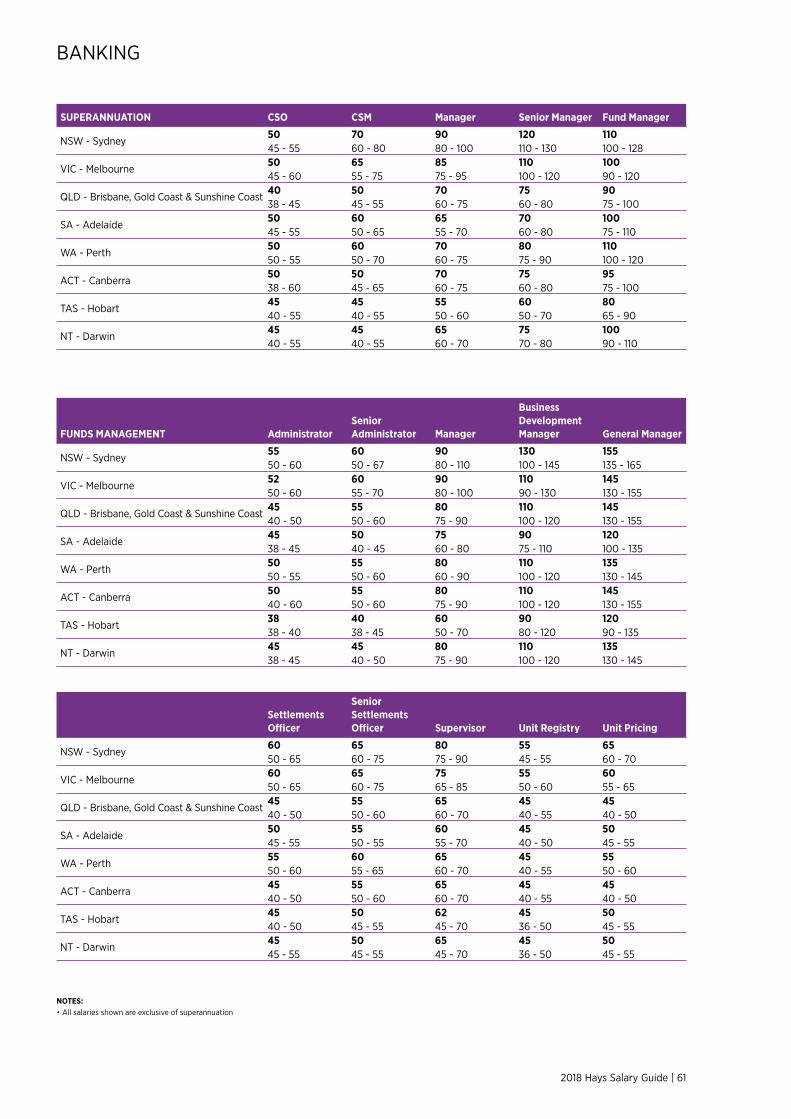
2018 Hays Salary Guide | 61
BANKING
NOTES:• All salaries shown are exclusive of superannuation
SUPERANNUATION CSO CSM Manager Senior Manager Fund Manager
NSW - Sydney50 70 90 120 11045 - 55 60 - 80 80 - 100 110 - 130 100 - 128
VIC - Melbourne50 65 85 110 10045 - 60 55 - 75 75 - 95 100 - 120 90 - 120
QLD - Brisbane, Gold Coast & Sunshine Coast40 50 70 75 9038 - 45 45 - 55 60 - 75 60 - 80 75 - 100
SA - Adelaide50 60 65 70 10045 - 55 50 - 65 55 - 70 60 - 80 75 - 110
WA - Perth50 60 70 80 11050 - 55 50 - 70 60 - 75 75 - 90 100 - 120
ACT - Canberra50 50 70 75 9538 - 60 45 - 65 60 - 75 60 - 80 75 - 100
TAS - Hobart45 45 55 60 8040 - 55 40 - 55 50 - 60 50 - 70 65 - 90
NT - Darwin45 45 65 75 10040 - 55 40 - 55 60 - 70 70 - 80 90 - 110
FUNDS MANAGEMENT AdministratorSenior Administrator Manager
Business Development Manager General Manager
NSW - Sydney55 60 90 130 15550 - 60 50 - 67 80 - 110 100 - 145 135 - 165
VIC - Melbourne52 60 90 110 14550 - 60 55 - 70 80 - 100 90 - 130 130 - 155
QLD - Brisbane, Gold Coast & Sunshine Coast45 55 80 110 14540 - 50 50 - 60 75 - 90 100 - 120 130 - 155
SA - Adelaide45 50 75 90 12038 - 45 40 - 45 60 - 80 75 - 110 100 - 135
WA - Perth50 55 80 110 13550 - 55 50 - 60 60 - 90 100 - 120 130 - 145
ACT - Canberra50 55 80 110 14540 - 60 50 - 60 75 - 90 100 - 120 130 - 155
TAS - Hobart38 40 60 90 12038 - 40 38 - 45 50 - 70 80 - 120 90 - 135
NT - Darwin45 45 80 110 13538 - 45 40 - 50 75 - 90 100 - 120 130 - 145
Settlements Officer
Senior Settlements Officer Supervisor Unit Registry Unit Pricing
NSW - Sydney60 65 80 55 6550 - 65 60 - 75 75 - 90 45 - 55 60 - 70
VIC - Melbourne60 65 75 55 6050 - 65 60 - 75 65 - 85 50 - 60 55 - 65
QLD - Brisbane, Gold Coast & Sunshine Coast45 55 65 45 4540 - 50 50 - 60 60 - 70 40 - 55 40 - 50
SA - Adelaide50 55 60 45 5045 - 55 50 - 55 55 - 70 40 - 50 45 - 55
WA - Perth55 60 65 45 5550 - 60 55 - 65 60 - 70 40 - 55 50 - 60
ACT - Canberra45 55 65 45 4540 - 50 50 - 60 60 - 70 40 - 55 40 - 50
TAS - Hobart45 50 62 45 5040 - 50 45 - 55 45 - 70 36 - 50 45 - 55
NT - Darwin45 50 65 45 5045 - 55 45 - 55 45 - 70 36 - 50 45 - 55

62 | 2018 Hays Salary Guide
BANKING
NOTES:• All salaries shown are exclusive of superannuation
FUNDS MANAGEMENTClient Services Officer
Client Services Supervisor
Client Services Manager
NSW - Sydney55 75 9050 - 60 70 - 85 85 - 105
VIC - Melbourne50 70 8545 - 55 65 - 80 70 - 95
QLD - Brisbane, Gold Coast & Sunshine Coast45 65 8040 - 55 60 - 70 65 - 90
SA - Adelaide55 65 6545 - 55 55 - 70 55 - 70
WA - Perth50 65 7545 - 55 60 - 70 70 - 80
ACT - Canberra45 55 6540 - 50 45 - 70 65 - 80
TAS - Hobart50 50 6540 - 55 45 - 55 55 - 70
NT - Darwin50 65 6540 - 55 55 - 70 55 - 70
TREASURY INVESTMENT OPERATIONSSettlements Officer
Senior Settlements Officer
Reconciliations Officer Payments Officer
Supervisor/Senior Manager
NSW - Sydney60 68 60 65 8050 - 65 60 - 75 50 - 65 60 - 70 75 - 85
VIC - Melbourne60 70 55 55 8050 - 65 60 - 75 50 - 60 50 - 65 70 - 90
QLD - Brisbane, Gold Coast & Sunshine Coast45 55 45 55 7540 - 55 50 - 60 40 - 50 50 - 60 65 - 80
SA - Adelaide50 55 50 55 7545 - 55 50 - 60 45 - 60 50 - 60 65 - 80
WA - Perth50 55 55 55 7545 - 55 50 - 60 50 - 60 50 - 60 65 - 80
ACT - Canberra50 55 50 55 7545 - 55 50 - 60 45 - 60 50 - 60 65 - 80
TAS - Hobart50 55 50 55 7545 - 55 50 - 60 45 - 60 50 - 60 65 - 80
NT - Darwin50 55 50 55 7545 - 55 50 - 60 45 - 60 50 - 60 65 - 80
MIDDLE OFFICE Portfolio AnalystPerformance & Attribution Research Analyst Trade Support
Corporate Actions
NSW - Sydney100 110 92 85 8590 - 110 100 - 120 85 - 110 75 - 95 80 - 90
VIC - Melbourne100 110 82 75 6590 - 110 100 - 130 75 - 110 65 - 85 60 - 75
QLD - Brisbane, Gold Coast & Sunshine Coast82 87 82 75 5575 - 100 80 - 100 75 - 110 65 - 85 50 - 60
SA - Adelaide82 87 82 75 5075 - 100 80 - 100 75 - 110 65 - 85 36 - 50
WA - Perth82 87 82 75 5575 - 100 80 - 100 75 - 110 65 - 85 50 - 65
ACT - Canberra82 87 82 75 4075 - 100 80 - 100 75 - 110 65 - 85 36 - 40
TAS - Hobart82 87 82 75 5075 - 100 80 - 100 75 - 110 65 - 85 40 - 55
NT - Darwin82 87 82 75 5575 - 100 80 - 100 75 - 110 65 - 85 50 - 65

2018 Hays Salary Guide | 63
BANKING
NOTES:• All salaries shown are exclusive of superannuation
TRADE FINANCEProcessing Officer
Senior Processing Officer Team Leader Manager
NSW - Sydney55 65 78 10050 - 60 60 - 70 70 - 85 85 - 115
VIC - Melbourne45 50 60 10038 - 50 40 - 55 55 - 65 75 - 110
QLD - Brisbane, Gold Coast & Sunshine Coast40 45 60 9038 - 45 45 - 55 55 - 75 75 - 110
SA - Adelaide45 50 60 8040 - 45 45 - 50 50 - 60 65 - 80
WA - Perth45 55 65 9040 - 50 50 - 60 60 - 70 75 - 100
ACT - Canberra40 45 45 6538 - 45 38 - 47 40 - 45 60 - 70
TAS - Hobart38 40 45 6538 - 40 38 - 42 40 - 50 55 - 75
NT - Darwin47 50 60 9045 - 50 50 - 60 55 - 65 75 - 100
FINANCIAL PLANNING Client Services ParaplannerSenior Paraplanner
Associate Advisor Financial Planner
NSW - Sydney60 75 85 75 9550 - 75 65 - 80 75 - 100 70 - 90 80 - 110
VIC - Melbourne60 70 85 70 9050 - 70 65 - 75 75 - 90 55 - 80 80 - 100
QLD - Brisbane, Gold Coast & Sunshine Coast50 57 75 70 8545 - 55 45 - 70 70 - 80 65 - 80 80 - 100
SA - Adelaide60 70 75 77 8545 - 65 60 - 70 70 - 85 70 - 80 80 - 90
WA - Perth55 60 75 75 8050 - 60 55 - 65 70 - 85 65 - 80 75 - 85
ACT - Canberra55 70 80 75 10045 - 60 60 - 80 70 - 90 65 - 85 85 - 120
TAS - Hobart45 50 60 60 9040 - 50 40 - 60 50 - 70 45 - 65 85 - 110
NT - Darwin55 62 68 68 9045 - 65 55 - 65 65 - 80 50 - 70 85 - 110
Senior Financial Planner
Financial Planning Manager
Head of Financial Planning
Practice Development Manager
NSW - Sydney120 155 230 150100 - 140 130 - 180 200 - 280 120 - 170
VIC - Melbourne110 140 210 13090 - 120 120 - 155 190 - 250 110 - 160
QLD - Brisbane, Gold Coast & Sunshine Coast110 120 185 13090 - 130 110 - 130 175 - 200 110 - 155
SA - Adelaide100 125 145 12880 - 110 110 - 135 135 - 165 100 - 137
WA - Perth120 120 180 130110 - 130 110 - 150 150 - 200 100 - 150
ACT - Canberra120 140 140 13090 - 130 110 - 150 110 - 180 90 - 135
TAS - Hobart100 125 145 13080 - 110 110 - 135 135 - 165 100 - 135
NT - Darwin100 125 145 13080 - 110 110 - 135 135 - 165 100 - 135

64 | 2018 Hays Salary Guide
BANKING
NOTES:• All salaries shown are exclusive of superannuation
CREDIT, MARKET & OPERATIONAL RISK Junior Analyst Senior Analyst Manager Senior Manager Head of
NSW - Sydney60 92 120 152 21560 - 68 75 - 100 100 - 140 140 - 165 180 - 250
VIC - Melbourne60 85 120 160 20560 - 70 75 - 100 110 - 135 145 - 185 185 - 230
QLD - Brisbane, Gold Coast & Sunshine Coast50 80 110 135 18540 - 55 70 - 85 100 - 120 130 - 145 175 - 190
SA - Adelaide45 60 78 82 12040 - 50 50 - 70 68 - 82 75 - 90 100 - 135
WA - Perth50 60 110 128 18545 - 55 50 - 70 100 - 120 125 - 145 175 - 200
ACT - Canberra45 60 110 82 12040 - 50 50 - 70 100 - 120 75 - 90 100 - 135
TAS - Hobart45 60 78 82 12040 - 50 50 - 70 68 - 82 75 - 90 100 - 135
NT - Darwin45 60 78 82 12040 - 50 50 - 70 68 - 82 75 - 90 100 - 135
QUANTITATIVE RISK Junior Analyst Senior Analyst Manager Senior Manager Head of
NSW - Sydney80 125 163 200 24575 - 85 105 - 145 145 - 180 175 - 225 210 - 280
VIC - Melbourne75 110 140 190 22065 - 80 100 - 130 130 - 165 170 - 200 200 - 250
QLD - Brisbane, Gold Coast & Sunshine Coast75 120 135 175 21070 - 80 100 - 130 130 - 165 165 - 185 185 - 220
SA - Adelaide55 82 110 137 16550 - 75 75 - 100 100 - 120 120 - 155 155 - 205
WA - Perth55 110 140 160 20050 - 75 90 - 130 130 - 160 150 - 180 180 - 250
ACT - Canberra55 82 110 137 16550 - 75 75 - 100 100 - 120 120 - 155 155 - 205
TAS - Hobart55 82 110 137 16550 - 75 75 - 100 100 - 120 120 - 155 155 - 205
NT - Darwin55 82 110 137 16550 - 75 75 - 100 100 - 120 120 - 155 155 - 205
COMPLIANCE Junior Analyst Senior Analyst Manager Senior Manager Head of
NSW - Sydney60 95 125 162 23750 - 70 80 - 110 110 - 140 140 - 185 175 - 300
VIC - Melbourne70 95 125 150 22055 - 80 80 - 110 110 - 135 140 - 180 165 - 250
QLD - Brisbane, Gold Coast & Sunshine Coast50 80 120 165 18550 - 55 75 - 90 110 - 130 155 - 165 175 - 190
SA - Adelaide45 60 90 110 12040 - 50 50 - 70 70 - 100 80 - 120 100 - 135
WA - Perth50 90 110 140 18045 - 55 80 - 100 90 - 130 120 - 160 150 - 200
ACT - Canberra45 60 90 110 12040 - 50 50 - 70 70 - 100 80 - 120 100 - 135
TAS - Hobart45 60 90 110 12040 - 50 50 - 70 70 - 100 80 - 120 100 - 135
NT - Darwin45 60 90 110 12040 - 50 50 - 70 70 - 100 80 - 120 100 - 135

2018 Hays Salary Guide | 65
BANKING
NOTES:• All salaries shown are exclusive of superannuation
AML & REGULATORY RISK Junior Analyst Senior Analyst Manager Senior Manager Head of
NSW - Sydney63 85 125 165 23258 - 68 70 - 100 110 - 140 155 - 180 185 - 280
VIC - Melbourne60 80 120 165 22055 - 65 75 - 100 100 - 130 155 - 175 160 - 250
QLD - Brisbane, Gold Coast & Sunshine Coast50 80 120 165 18540 - 55 75 - 100 100 - 130 155 - 175 165 - 200
SA - Adelaide45 70 90 110 13540 - 50 55 - 75 70 - 100 90 - 135 120 - 155
WA - Perth50 90 110 140 18045 - 55 75 - 100 90 - 130 120 - 150 150 - 200
ACT - Canberra45 70 90 110 13540 - 50 55 - 75 70 - 100 90 - 135 120 - 155
TAS - Hobart45 70 90 110 13540 - 50 55 - 75 70 - 100 90 - 135 120 - 155
NT - Darwin45 70 90 110 13540 - 50 55 - 75 70 - 100 90 - 135 120 - 155
TRANSACTIONAL BANKINGAccount Manager
Transaction Banking Manager
Senior Transaction Banking Manager
Implementation Manager
Business Development Manager
NSW - Sydney82 100 120 105 12575 - 90 82 - 110 110 - 135 85 - 115 100 - 140
VIC - Melbourne82 100 120 100 12075 - 90 82 - 110 110 - 130 80 - 110 100 - 130
QLD - Brisbane, Gold Coast & Sunshine Coast78 90 120 100 12075 - 80 80 - 100 110 - 130 85 - 110 100 - 130
SA - Adelaide78 82 100 100 11075 - 80 78 - 87 90 - 110 85 - 105 100 - 115
WA - Perth80 100 120 100 12075 - 90 80 - 110 110 - 130 80 - 110 100 - 130
ACT - Canberra78 82 100 90 10075 - 80 78 - 87 90 - 110 85 - 95 90 - 110
TAS - Hobart78 82 100 90 10075 - 80 78 - 87 90 - 110 85 - 95 90 - 110
NT - Darwin78 100 120 90 11075 - 80 80 - 110 110 - 130 80 - 100 100 - 120
PRIVATE BANKINGAssistant Private Banker Private Banker
Senior Private Banker
Executive/Manager
NSW - Sydney82 100 130 18365 - 90 90 - 110 120 - 150 165 - 200
VIC - Melbourne70 100 132 16560 - 80 80 - 110 119 - 146 110 - 185
QLD - Brisbane, Gold Coast & Sunshine Coast70 90 115 13060 - 75 80 - 100 100 - 130 120 - 135
SA - Adelaide65 75 82 11055 - 70 65 - 80 73 - 87 90 - 120
WA - Perth80 120 130 17070 - 90 90 - 130 120 - 150 150 - 180
ACT - Canberra70 90 110 13060 - 75 80 - 100 80 - 120 120 - 135
TAS - Hobart55 100 82 11045 - 60 80 - 110 73 - 87 100 - 128
NT - Darwin55 80 82 12050 - 60 65 - 90 73 - 87 90 - 145

66 | 2018 Hays Salary Guide
SALA
RY IN
FOR
MAT
ION
: IN
SURA
NCE
AUSTRALIAThe supply and demand ratio continues to favour insurance professionals, with employers still plagued by candidate shortages.
Despite this, salaries across the sector remain broadly stable. Instances of salary increases are the result of geographical skill shortages rather than sector-wide trends. For example, a shortage of Outbound Sales Consultants in NSW has seen salaries increase for these professionals.
Change remains a constant theme across Australia’s insurance industry. In life insurance, most banks are exiting or have exited the sector. Digital disruption and technological transformation are of course drivers of change too. Insurtech companies are impacting the industry, which has traditionally been slow to change due to a strict regulatory environment and a reliance on legacy technology.
With extensive technological disruption now evident, such as intelligent systems and the automation of complex property assessment, fraud detection and claims verification processes, innovation can be seen across the insurance sector. As a result, candidates with specialist digital and technology skills are in increasing demand. Such professionals can expect a salary increase.
Turning to the underwriting sector, regulatory change and compliance is resulting in rising vacancy activity for risk and compliance specialists at all levels. However a gap has emerged between the salary expectations of highly experienced Senior Underwriters and employers since candidates know they are in demand. Candidates tend not to move jobs for the same salaries so employers need to look at offering additional benefits, such as flexible working and training and development.
Senior Life Assessors and Senior Life Underwriters remain in short supply. Employers are looking for experienced professionals with coaching and mentoring abilities who can train junior staff into senior roles to overcome skills gaps while also taking the lead on initiatives and projects.
Also in increasing demand are experienced Workers’ Compensation Case Managers. Given changes in workers compensation contracts, more people are transferring into life insurance claims.
Looking ahead, the retention of senior staff will become a priority for organisations in response to ongoing skill shortages. This may lead to salary increases.
In other trends, employees and jobseekers continue to request flexible working hours and working from home options. Offering such opportunities can help employers attract and secure talent in a candidate short market.
Within claims management some large general insurers are employing more permanent staff rather than the temporary professionals they utilised in previous years. These employers are focused on attracting people who are interested in developing a longer-term career in claims.
Finally, diversity remains a focus for most insurers. Interestingly, the focus has expanded from gender to all forms of diversity.
NEW ZEALANDIn 2017-18 the impact of rising motor costs created demand for experienced Motor Assessors, Motor Claims Specialists and Commercial Claims Specialists. Meanwhile, recurring storms drove assessing activity and fuelled demand for specialist Complex Commercial Loss Adjustors and Technical Commercial Claims Consultants.
The rise of automated robo-advice continues. If preliminary quotes are converted to policies without the assistance of Brokers, demand for these professionals may reduce as a result of the increased use of AI across the industry. Algorithms are also being used for online claims and preliminary assessing.
The focus on cyber risk measures is creating demand for Specialist Brokers. Senior Brokers will need to upskill to understand how to bring this to the attention of commercial clients.
Salary increases were given to experienced professionals who added value. Life Insurance Claims Assessors also saw a slight increase since life insurers competed with the ACC for quality candidates. Specialist Brokers in the cyber and commercial space enjoyed slight increases too since they must go the extra mile to ensure all policies meet their clients’ needs and assets.
Remuneration across this sector typically includes bonuses, profit-share, flexi-hours and a Key Objectives/KPI component as a way of improving the overall value.
Looking ahead, the SME commercial market will remain active, with insurers and brokers focusing on educating and protecting businesses. Enthusiastic and reliable Broker Supports and Customer Service Team Leaders will be needed. So too will Recoveries & Settlement Consultants who are up-to-date with current technology.
Finally, a succinct interview and offer process will help to secure the ideal candidate, while salary packages will continue to be negotiated.
Looking ahead, the retention of senior staff will become a priority for organisations in response to ongoing skill shortages. This may lead to salary increases.
“
”
Looking ahead, the SME commercial market will remain active, with insurers and brokers focusing on educating and protecting businesses.
“
”
INSURANCE

2018 Hays Salary Guide | 67
INSURANCE
NOTES:• All salaries shown are exclusive of superannuation (AU) or KiwiSaver (NZ)
• New Zealand salaries are represented in New Zealand dollars
• All salaries are representative of the total package value
SALES & SERVICECustomer Service Officer
Inbound/Outbound Sales Consultant Team Leader
Client Services Manager
Business Development Manager
NSW - Sydney50 55 80 85 10050 - 55 55 - 60 75 - 85 75 - 90 100 - 140
VIC - Melbourne45 50 65 75 9042 - 50 45 - 55 55 - 73 65 - 85 75 - 110
QLD - Brisbane, Gold Coast & Sunshine Coast42 41 55 82 9042 - 46 41 - 46 50 - 65 75 - 90 82 - 110
SA - Adelaide47 48 59 68 8744 - 49 45 - 50 55 - 65 55 - 70 65 - 100
WA - Perth46 46 60 85 10042 - 50 40 - 50 55 - 65 70 - 90 90 - 130
ACT - Canberra42 41 55 82 9042 - 46 41 - 46 50 - 65 75 - 90 82 - 110
TAS - Hobart45 42 60 65 8242 - 46 41 - 46 55 - 65 55 - 70 65 - 100
NT - Darwin45 42 60 68 8742 - 46 41 - 46 55 - 65 55 - 70 65 - 100
New Zealand44 46 75 85 10040 - 50 40 - 55 55 - 90 70 - 105 80 - 130
GENERAL INSURANCE UNDERWRITINGUnderwriting Assistant
Domestic Underwriter
Commercial Underwriter
Senior Technical Underwriter
Underwriting Manager
NSW - Sydney50 65 100 120 15546 - 55 55 - 73 82 - 110 100 - 130 135 - 185
VIC - Melbourne46 64 82 100 13546 - 50 60 - 73 75 - 100 75 - 110 120 - 155
QLD - Brisbane, Gold Coast & Sunshine Coast50 60 70 80 10046 - 55 55 - 75 65 - 87 70 - 90 90 - 110
SA - Adelaide50 55 75 80 10046 - 55 50 - 60 65 - 100 70 - 100 90 - 110
WA - Perth46 55 80 115 13046 - 50 50 - 60 75 - 90 100 - 130 110 - 145
ACT - Canberra46 50 70 80 10046 - 50 48 - 55 65 - 80 70 - 90 90 - 110
TAS - Hobart46 50 75 80 10046 - 50 48 - 55 65 - 100 70 - 100 90 - 110
NT - Darwin50 50 75 80 10046 - 55 48 - 55 65 - 100 70 - 100 90 - 110
New Zealand53 65 85 120 14045 - 60 50 - 75 65 - 120 75 - 150 100 - 170

68 | 2018 Hays Salary Guide
INSURANCE
NOTES:• All salaries shown are exclusive of superannuation (AU) or KiwiSaver (NZ)
• New Zealand salaries are represented in New Zealand dollars
• All salaries are representative of the total package value
GENERAL INSURANCE BROKING
Assistant Account Executive
Account Executive Account Broker
Senior Account Broker
Divisional Manager
NSW - Sydney50 65 82 110 13240 - 55 55 - 75 75 - 90 90 - 125 100 - 137
VIC - Melbourne50 65 73 90 13040 - 55 55 - 70 65 - 82 80 - 110 120 - 135
QLD - Brisbane, Gold Coast & Sunshine Coast46 65 75 90 11040 - 55 60 - 75 65 - 82 80 - 110 90 - 130
SA - Adelaide50 65 75 90 10540 - 55 60 - 70 70 - 78 75 - 90 90 - 120
WA - Perth46 60 80 90 11545 - 50 55 - 65 75 - 90 80 - 110 90 - 135
ACT - Canberra44 55 65 80 10038 - 50 45 - 70 55 - 80 75 - 90 90 - 120
TAS - Hobart41 55 65 80 10538 - 46 50 - 65 50 - 75 75 - 90 90 - 120
NT - Darwin48 60 73 90 10540 - 55 50 - 65 55 - 78 75 - 90 90 - 120
New Zealand55 68 80 100 15045 - 65 60 - 80 65 - 100 80 - 130 100 - 180
GENERAL INSURANCE CLAIMSDomestic Claims Assessor
Commercial Claims Assessor
Senior Technical Claims Assessor
Claims Team Leader Claims Manager
NSW - Sydney55 65 75 85 12050 - 60 60 - 75 75 - 95 85 - 100 100 - 146
VIC - Melbourne50 64 87 87 11548 - 60 60 - 75 78 - 100 78 - 100 100 - 125
QLD - Brisbane, Gold Coast & Sunshine Coast48 64 87 87 11548 - 50 60 - 75 78 - 100 78 - 100 100 - 125
SA - Adelaide50 64 87 87 11550 - 58 60 - 75 78 - 100 78 - 100 100 - 125
WA - Perth50 65 80 90 11548 - 55 60 - 75 75 - 95 80 - 100 100 - 130
ACT - Canberra48 64 87 87 11548 - 50 60 - 75 78 - 100 78 - 100 100 - 125
TAS - Hobart48 64 87 87 11548 - 50 60 - 75 78 - 100 78 - 100 100 - 125
NT - Darwin48 64 87 87 11548 - 50 60 - 75 78 - 100 78 - 100 100 - 125
New Zealand58 70 80 85 10045 - 65 50 - 80 70 - 100 60 - 100 85 - 140

2018 Hays Salary Guide | 69
INSURANCE
NOTES:• All salaries shown are exclusive of superannuation (AU) or KiwiSaver (NZ)
• New Zealand salaries are represented in New Zealand dollars
• All salaries are representative of the total package value
LOSS ADJUSTING/ASSESSINGLoss Assessor/ Adjustor
Senior Loss Assessor/Adjustor
Technical/Specialist Loss Assessor/Adjustor
Assessing Manager
NSW - Sydney55 70 100 12050 - 70 65 - 82 82 - 110 110 - 130
VIC - Melbourne55 70 80 9050 - 70 65 - 82 75 - 90 82 - 110
QLD - Brisbane, Gold Coast & Sunshine Coast50 60 80 9048 - 55 55 - 70 75 - 90 82 - 110
SA - Adelaide50 50 68 8248 - 53 48 - 55 50 - 70 68 - 82
WA - Perth50 65 85 11048 - 60 60 - 80 75 - 100 90 - 130
ACT - Canberra50 65 75 8248 - 55 50 - 70 55 - 80 75 - 90
TAS - Hobart48 50 65 8248 - 50 48 - 60 55 - 75 75 - 90
NT - Darwin48 50 68 8048 - 50 48 - 55 50 - 70 68 - 82
New Zealand70 90 110 12055 - 90 75 - 125 80 - 140 80 - 140
WORKERS COMPENSATION Claims Assessor Case ManagerSenior Case Manager Team Leader Manager
NSW - Sydney65 70 80 90 14060 - 80 60 - 80 75 - 95 75 - 95 120 - 150
VIC - Melbourne55 65 75 90 10050 - 60 60 - 70 70 - 80 75 - 95 90 - 120
QLD - Brisbane, Gold Coast & Sunshine Coast55 50 60 68 7850 - 60 46 - 55 55 - 65 65 - 75 73 - 82
SA - Adelaide50 55 60 60 6846 - 55 45 - 60 55 - 65 50 - 62 60 - 75
WA - Perth55 70 80 85 11050 - 70 60 - 80 75 - 90 80 - 90 90 - 130
ACT - Canberra55 70 75 83 9546 - 60 50 - 78 60 - 80 64 - 87 82 - 100
TAS - Hobart46 55 60 60 7046 - 50 46 - 60 55 - 65 50 - 62 60 - 75
NT - Darwin50 55 60 75 8246 - 60 46 - 60 55 - 65 68 - 78 78 - 100
New Zealand65 70 80 90 10050 - 75 50 - 85 70 - 95 60 - 100 75 - 125

70 | 2018 Hays Salary Guide
INSURANCE
NOTES:• All salaries shown are exclusive of superannuation (AU) or KiwiSaver (NZ)
• New Zealand salaries are represented in New Zealand dollars
• All salaries are representative of the total package value
LIFE INSURANCEGroup Life Administrator
Life Claims Assessor
Senior Claims Assessor
Claims Team Leader Claims Manager
NSW - Sydney55 80 110 130 15052 - 58 75 - 85 95 - 115 110 - 140 130 - 170
VIC - Melbourne46 75 90 95 11040 - 50 70 - 80 80 - 100 90 - 120 100 - 120
QLD - Brisbane, Gold Coast & Sunshine Coast46 60 68 75 10041 - 50 50 - 65 60 - 78 65 - 82 82 - 110
SA - Adelaide46 55 65 68 9041 - 46 48 - 60 60 - 78 65 - 75 75 - 110
WA - Perth46 60 73 68 8240 - 50 48 - 65 68 - 78 65 - 75 75 - 90
ACT - Canberra46 60 68 75 10041 - 50 50 - 65 59 - 78 65 - 82 82 - 110
TAS - Hobart40 55 65 68 9041 - 46 48 - 60 60 - 78 65 - 75 75 - 110
NT - Darwin46 55 65 65 7341 - 46 48 - 60 55 - 68 55 - 70 55 - 75
New Zealand55 68 80 88 11045 - 60 48 - 78 65 - 95 60 - 95 85 - 125
Underwriting Support Underwriter
Senior Underwriter
Underwriting Manager
Chief Underwriter
NSW - Sydney60 78 110 160 17055 - 65 70 - 100 100 - 120 130 - 180 160 - 210
VIC - Melbourne46 78 110 130 17044 - 55 70 - 100 100 - 120 115 - 160 160 - 210
QLD - Brisbane, Gold Coast & Sunshine Coast52 70 90 90 10046 - 55 65 - 80 82 - 100 82 - 100 90 - 120
SA - Adelaide50 65 82 90 10048 - 55 48 - 70 70 - 87 82 - 100 90 - 120
WA - Perth50 70 85 120 13044 - 55 65 - 75 75 - 95 90 - 140 100 - 150
ACT - Canberra52 70 90 90 10046 - 55 65 - 80 82 - 100 82 - 100 90 - 120
TAS - Hobart46 55 70 80 7644 - 55 48 - 60 60 - 80 65 - 85 68 - 82
NT - Darwin46 70 82 90 10044 - 55 48 - 75 70 - 85 82 - 100 90 - 120
New Zealand50 80 125 140 16045 - 65 60 - 100 90 - 150 100 - 160+ 140 - 190+

2018 Hays Salary Guide | 71
SALA
RY IN
FOR
MAT
ION
: OFF
ICE
SUPP
ORT
AUSTRALIAAustralia’s office support job market remains buoyant, with high demand for skilled professionals. Overall, vacancy activity continued its strong upward trajectory in 2017-18 with confidence, opportunities and salaries all increasing.
The exception is for Executive and Personal Assistants, where salaries are steady and employers will either wait for a candidate who will accept the salary on offer or consider people with experience in other industries.
This is despite the expectation that EAs and PAs now possess a wider skill set, including IT, communications, creative writing, presentation, office management and people management. We do however expect salaries to rise in coming years for those who have supported a Project or Programme Manager and gained experience managing and tracking deliverables while also fulfilling normal EA duties.
At the entry-level, Administrators and those with advanced Microsoft Excel skills and Salesforce, Microsoft Dynamics or MYOB expertise are in short supply. As a result salaries are staring to increase.
Blended entry-level roles are also becoming more prevalent, often involving reception, administration, accounting support and data entry. Such roles require a varied skillset and candidates who have upskilled, with salaries increasing accordingly for strong talent.
Temporary roles remain common at the entry-level, with organisations willing to pay higher hourly rates in order to attract the right person. This in turn drives up salary packages for strong permanent candidates who are used to the higher take-home rate of temporary assignments. Packages can now include a bonus, particularly for roles in the finance industry.
Strong Office Managers are another area of demand. An increase in the number of staff working from home and hot desking has fuelled a requirement for IT-savvy professionals with strong organisation and coordination skills. Given the more extensive skills required, salaries have increased.
The resurgence of the resources sector, in particular mining, and strength in the
construction and engineering industries are creating demand for technical administration professionals, including Document Controllers, Project Administrators, Site Administrators and Mobilisation Administrators. This is starting to push up salaries for these roles.
Turning to the public sector, vacancy activity is consistent and focused primarily on temporary contracts. This is most notable within the government and not-for-profit sectors since employers want to fill positions quickly and also trial a candidate before offering them a permanent role.
In other trends, employers are increasingly offering their office support staff flexible working options, such as reduced or flexible hours and working from home opportunities. Professional development is also being offered to supplement salaries and make roles more enticing to the top talent.
For their part, candidates move very quickly when they are in the job market. They, like employers, are increasingly confident. Those with niche skills and specific industry experience in legal, finance, engineering and projects will be in greatest demand.
NEW ZEALANDThe major office support trend of 2017-18 was the increase in hybrid roles, such as a Personal Assistant who is also responsible for HR, a dual Product and IT Administrator and a multi-lingual Receptionist who provides technical sales support. Given demand, typical salaries for such cross-skilled candidates increased.
Demand for multi-skilled office support professionals will continue in 2018-19 at the expense of traditional PA,
administration or Receptionist skillsets as organisations look to save costs in response to tight budgets.
Another trend has been stricter Health & Safety requirements. WorkSafe site checks and media attention on workplace accidents have driven up demand for skilled Health & Safety professionals who can take a dedicated approach. Despite demand, salaries remain steady.
Strong Executive Assistants will remain in demand too. Typically sought by large organisations, they are sought to support high profile individuals. While there are a lot of Executive and Personal Assistants applying for such vacancies, highly-skilled professionals are in short supply. Depending on location, salaries have started to increase for candidates with a broader range of skills.
Candidates who can multitask and proactively take on additional responsibilities will find they are presented with the best opportunities in the market at present.
Employers are increasingly offering their office support staff flexible working options, such as reduced or flexible hours and working from home opportunities.
“
”
Depending on location, salaries have started to increase for candidates with a broader range of skills.
“”
OFFICE SUPPORT

72 | 2018 Hays Salary Guide
OFFICE SUPPORT
• All salaries shown are exclusive of superannuation (AU) or KiwiSaver (NZ)
• New Zealand salaries are represented in New Zealand dollars
NOTES:
ADMINISTRATION
Administration Assistant (6-12 mths exp)
Administration Assistant (12+ mths exp)
Project Admin Assistant (3+ yrs exp)
Office Manager
Project Coordinator
NSW - Sydney40 55 65 75 7038 - 45 45 - 60 55 - 75 65 - 90 55 - 80
NSW - Regional38 40 55 60 5538 - 40 39 - 45 45 - 60 55 - 75 48 - 60
VIC - Melbourne42 45 55 65 7040 - 45 44 - 50 50 - 65 60 - 75 50 - 80
VIC - Regional38 40 44 60 4838 - 40 39 - 45 40 - 48 55 - 65 43 - 53
QLD - Brisbane, Gold Coast & Sunshine Coast40 50 60 65 6040 - 43 45 - 55 55 - 65 60 - 75 55 - 65
QLD - Regional38 42 55 55 5238 - 40 40 - 50 50 - 60 50 - 65 45 - 60
SA - Adelaide40 42 55 62 6038 - 42 40 - 46 50 - 60 55 - 70 50 - 70
WA - Perth40 40 55 65 6038 - 45 45 - 55 55 - 65 60 - 80 60 - 80
ACT - Canberra48 60 65 75 7545 - 50 50 - 65 60 - 75 65 - 80 60 - 80
TAS - Hobart/Launceston40 42 47 60 6038 - 44 38 - 48 45 - 55 52 - 65 52 - 65
NT - Darwin50 55 65 75 6545 - 55 50 - 60 60 - 70 65 - 90 60 - 75
NZ - Auckland40 45 55 65 6038 - 45 38 - 48 50 - 62 53 - 78 50 - 70
NZ - Wellington40 45 50 60 6536 - 42 40 - 48 45 - 55 55 - 75 50 - 75
NZ - Christchurch40 45 50 60 6536 - 42 42 - 50 45 - 55 55 - 70 55 - 70
ADMINISTRATION/SUPPORT
Team Assistant/ Administrator (12+ mths exp)
Team Assistant/ Administrator (3+ yrs exp)
Personal Assistant (Assisting a number of execs)
Executive Assistant (Working for 1 person)
NSW - Sydney52 60 70 9045 - 60 50 - 70 65 - 80 75 - 120
NSW - Regional40 50 55 6538 - 45 45 - 60 50 - 65 55 - 80
VIC - Melbourne50 55 70 8045 - 55 50 - 60 60 - 75 75 - 95
VIC - Regional38 45 50 6038 - 42 40 - 50 45 - 55 50 - 65
QLD - Brisbane, Gold Coast & Sunshine Coast55 60 70 8050 - 60 55 - 65 65 - 75 70 - 85
QLD - Regional40 45 50 5838 - 45 40 - 50 47 - 60 52 - 67
SA - Adelaide47 53 62 6845 - 50 48 - 57 60 - 65 60 - 75
WA - Perth50 55 65 7050 - 60 55 - 70 60 - 80 70 - 85
ACT - Canberra55 62 75 8545 - 60 55 - 70 65 - 80 65 - 90
TAS - Hobart/Launceston45 48 55 6040 - 50 44 - 55 50 - 60 55 - 70
NT - Darwin55 60 68 7550 - 60 60 - 65 60 -75 65 - 85
NZ - Auckland48 52 60 7045 - 55 48 - 54 55 - 70 60 - 90
NZ - Wellington45 50 55 6540 - 50 45 - 55 50 - 65 60 - 70
NZ - Christchurch45 50 60 6540 - 50 45 - 55 55 - 65 65 - 75

2018 Hays Salary Guide | 73
OFFICE SUPPORT
• All salaries shown are exclusive of superannuation (AU) or KiwiSaver (NZ)
• New Zealand salaries are represented in New Zealand dollars
NOTES:
ADMINISTRATION/SPECIALISTS Data Entry Operator Sales Coordinator Records Officer Medical Secretary
NSW - Sydney42 55 65 5539 - 45 45 - 65 55 - 70 50 - 65
NSW - Regional38 50 45 5238 - 40 45 - 55 40 - 50 50 - 55
VIC - Melbourne40 50 45 5039 - 45 45 - 60 38 - 50 45 - 55
VIC - Regional38 42 43 4538 - 40 38 - 50 40 - 45 42 - 47
QLD - Brisbane, Gold Coast & Sunshine Coast48 50 45 5040 - 50 45 - 55 40 - 50 45 - 55
QLD - Regional40 45 45 4338 - 45 40 - 50 40 - 50 42 - 46
SA - Adelaide42 52 45 4540 - 45 50 - 55 40 - 50 42 - 50
WA - Perth40 50 55 5540 - 45 45 - 60 45 - 65 50 - 65
ACT - Canberra45 50 55 6040 - 50 45 - 60 40 - 60 50 - 65
TAS - Hobart/Launceston38 42 45 4238 - 40 38 - 45 40 - 45 42 - 45
NT - Darwin50 50 53 5545 - 55 45 - 55 50 - 55 45 - 60
NZ - Auckland40 52 50 5536 - 45 42 - 58 45 - 55 43 - 65
NZ - Wellington37 45 48 5035 - 40 38 - 50 42 - 52 45 - 58
NZ - Christchurch37 48 48 5035 - 40 40 - 55 42 - 52 45 - 60
RECEPTION Switchboard Operator
Receptionist (Up to 12 mths exp)
Receptionist(12+ mths exp)
Receptionist/Admin Assistant (12+ mths exp)
NSW - Sydney50 45 50 5540 - 55 40 - 55 45 - 60 42 - 65
NSW - Regional40 38 40 4538 - 42 38 - 40 39-45 43 - 50
VIC - Melbourne50 45 50 5045 - 55 40 - 48 45 - 55 45 - 55
VIC - Regional42 40 45 4538 - 45 38 - 42 39 - 50 40 - 55
QLD - Brisbane, Gold Coast & Sunshine Coast48 43 50 5545 - 53 38 - 45 45 - 53 50 - 60
QLD - Regional38 38 40 4238 - 40 38 - 42 39 - 45 39 - 48
SA - Adelaide42 40 42 4538 - 45 38 - 43 39 - 45 39 - 48
WA - Perth45 38 45 4540 - 55 38 - 45 45 - 50 45 - 55
ACT - Canberra46 48 55 6045 - 50 45 - 50 50 - 60 55 - 65
TAS - Hobart/Launceston42 38 42 4838 - 45 38 - 42 39 - 45 42 - 55
NT - Darwin45 45 50 5045 - 50 40 - 50 45 - 55 45 - 55
NZ - Auckland38 40 44 4835 - 40 35 - 45 38 - 48 42 - 55
NZ - Wellington35 40 42 4235 - 40 35 - 45 37 - 45 38 - 47
NZ - Christchurch37 40 42 4535 - 40 35 - 45 37-45 40 - 50

74 | 2018 Hays Salary Guide
OFFICE SUPPORT
• All salaries shown are exclusive of superannuation (AU) or KiwiSaver (NZ)
• New Zealand salaries are represented in New Zealand dollars
NOTES:
LEGAL SUPPORTLegal Secretary (Up to 2 yrs exp)
Legal Secretary (2-4 yrs exp)
Legal Secretary (4+ yrs exp)
Legal PersonalAssistant
NSW - Sydney60 65 70 7550 - 65 50 - 70 65 - 80 75 - 90
NSW - Regional45 48 55 5540 - 55 42 - 52 50 - 65 50 - 75
VIC - Melbourne50 55 65 7045 - 55 50 - 65 50 - 70 55 - 75
VIC - Regional40 45 50 5040 - 42 42 - 50 45 - 55 45 - 55
QLD - Brisbane, Gold Coast & Sunshine Coast55 55 60 6550 - 58 50 - 60 55 - 65 60 - 70
QLD - Regional40 48 55 5040 - 45 45 - 50 50 - 60 45 - 55
SA - Adelaide48 55 60 6045 - 55 50 - 65 55 - 70 55 - 65
WA - Perth60 65 70 7555 - 60 60 - 70 65 - 75 70 - 80
ACT - Canberra50 65 70 7545 - 55 60 - 75 65 - 75 75 - 80
TAS - Hobart/Launceston44 47 52 6040 - 50 42 - 52 47 - 57 52 - 65
NT - Darwin55 60 68 6850 - 60 55 - 65 60 - 75 60 - 75
NZ - Auckland55 60 65 6845 - 60 52 - 65 55 - 68 60 - 75
NZ - Wellington50 55 55 6045 - 55 50 - 60 53 - 63 55 - 65
NZ - Christchurch50 55 58 6045 - 55 50 - 60 55 - 60 55 - 65
BANKING & FINANCE SUPPORT Specialist Finance PA Investment Banking Personal Assistant Advisor Support
NSW - Sydney80 85 6075 - 95 75 - 90 55 - 65
NSW - Regional55 55 5550 - 75 50 - 70 50 - 60
VIC - Melbourne70 80 5565 - 80 70 - 90 45 - 60
VIC - Regional50 50 4845 - 55 45 - 55 43 - 53
QLD - Brisbane, Gold Coast & Sunshine Coast58 60 5250 - 70 57 - 62 40 - 55
QLD - Regional48 48 4544 - 53 46 - 53 40 - 50
SA - Adelaide62 65 5060 - 65 60 - 70 45 - 62
WA - Perth65 60 4555 - 75 55 - 70 40 - 50
ACT - Canberra70 65 6065 - 75 55 - 70 55 - 65
TAS - Hobart/Launceston50 52 5045 - 55 45 - 55 45 - 55
NT - Darwin60 60 5555 - 65 55 - 65 55 - 60
NZ - Auckland62 68 5856 - 70 58 - 75 50 - 65
NZ - Wellington55 55 4848 - 60 48 - 60 40 - 52
NZ - Christchurch60 55 5050 - 65 50 - 60 40 - 60
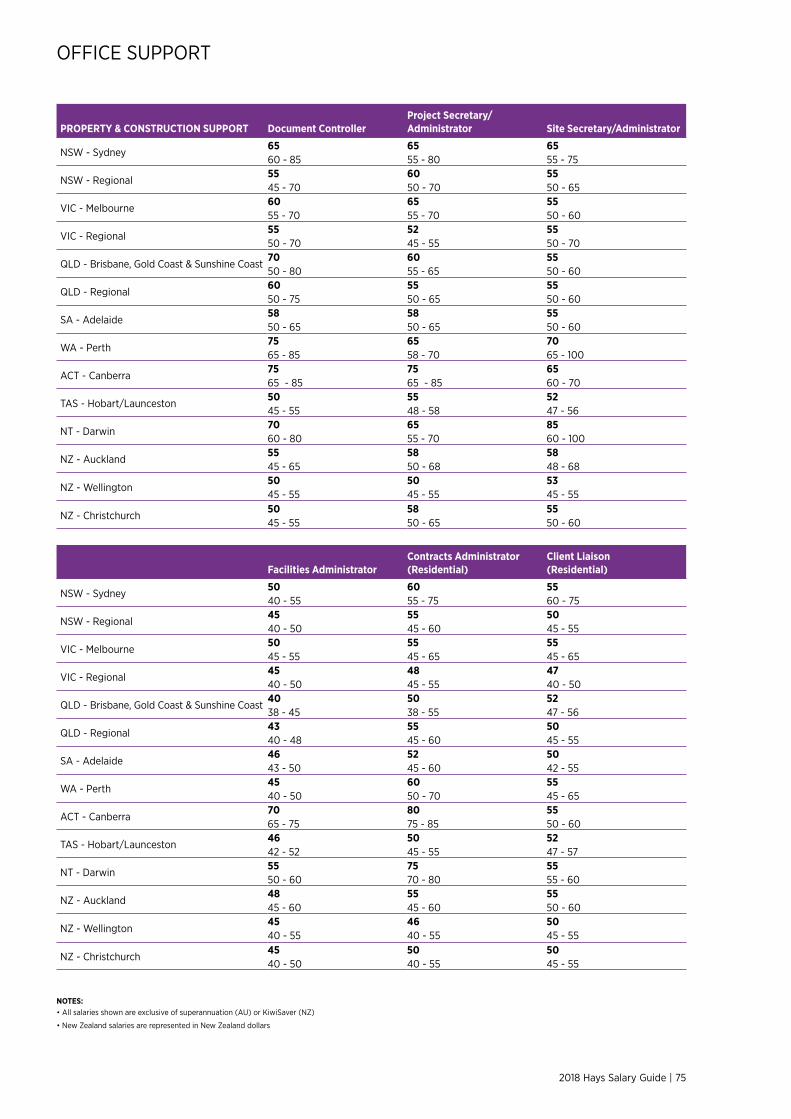
2018 Hays Salary Guide | 75
• All salaries shown are exclusive of superannuation (AU) or KiwiSaver (NZ)
• New Zealand salaries are represented in New Zealand dollars
NOTES:
OFFICE SUPPORT
PROPERTY & CONSTRUCTION SUPPORT Document Controller Project Secretary/Administrator Site Secretary/Administrator
NSW - Sydney65 65 6560 - 85 55 - 80 55 - 75
NSW - Regional55 60 5545 - 70 50 - 70 50 - 65
VIC - Melbourne60 65 5555 - 70 55 - 70 50 - 60
VIC - Regional55 52 5550 - 70 45 - 55 50 - 70
QLD - Brisbane, Gold Coast & Sunshine Coast70 60 5550 - 80 55 - 65 50 - 60
QLD - Regional60 55 5550 - 75 50 - 65 50 - 60
SA - Adelaide58 58 5550 - 65 50 - 65 50 - 60
WA - Perth75 65 7065 - 85 58 - 70 65 - 100
ACT - Canberra75 75 6565 - 85 65 - 85 60 - 70
TAS - Hobart/Launceston50 55 5245 - 55 48 - 58 47 - 56
NT - Darwin70 65 8560 - 80 55 - 70 60 - 100
NZ - Auckland55 58 5845 - 65 50 - 68 48 - 68
NZ - Wellington50 50 5345 - 55 45 - 55 45 - 55
NZ - Christchurch50 58 5545 - 55 50 - 65 50 - 60
Facilities Administrator Contracts Administrator (Residential)
Client Liaison (Residential)
NSW - Sydney50 60 5540 - 55 55 - 75 60 - 75
NSW - Regional45 55 5040 - 50 45 - 60 45 - 55
VIC - Melbourne50 55 5545 - 55 45 - 65 45 - 65
VIC - Regional45 48 4740 - 50 45 - 55 40 - 50
QLD - Brisbane, Gold Coast & Sunshine Coast40 50 5238 - 45 38 - 55 47 - 56
QLD - Regional43 55 5040 - 48 45 - 60 45 - 55
SA - Adelaide46 52 5043 - 50 45 - 60 42 - 55
WA - Perth45 60 5540 - 50 50 - 70 45 - 65
ACT - Canberra70 80 5565 - 75 75 - 85 50 - 60
TAS - Hobart/Launceston46 50 5242 - 52 45 - 55 47 - 57
NT - Darwin55 75 5550 - 60 70 - 80 55 - 60
NZ - Auckland48 55 5545 - 60 45 - 60 50 - 60
NZ - Wellington45 46 5040 - 55 40 - 55 45 - 55
NZ - Christchurch45 50 5040 - 50 40 - 55 45 - 55

76 | 2018 Hays Salary Guide
SALA
RY IN
FOR
MAT
ION
: CO
NTA
CT C
ENTR
ES
AUSTRALIAThe impact of digital technology can be felt in all sectors, including contact centres, where it is transforming the way centres operate and the skills in demand.
One example is the rising requirement for Customer Service Agents with digital customer engagement experience who are skilled in multi-channel communication and are confident web chat, email and social media users.
To support transitions, Team Leaders and Managers who have set up digital or omni-channel customer service functions are in high demand too, as are Real Time Analysts and Workforce Planners who can accurately measure, report, analyse and forecast digital functions.
Meanwhile a focus on growth and winning market share has led to ongoing demand for strong Outbound Sales, Telemarketers, Sales Agents and Customer Service Consultants. Employers are looking for agents with sound relationship building, negotiation and influencing skills who are motivated working to targets and possess excellent interpersonal skills.
In the public sector, experienced Customer Service Officers who are handling general queries and delivering customer service in response to implementations or changes in government policy are in high demand.
Given demand, it’s unsurprising that permanent vacancy activity rose over the 2017-18 year, particularly in the SME sector where employers offer flexible working hours to support parents and students. Temporary vacancy activity continues too in response to workload peaks and campaign work.
In short, with business sentiment strong the market is job rich and quality candidates receive multiple job offers. Employers therefore need to act quickly and decisively if they want to secure the top talent.
Despite this, salaries remain stable. Employees and jobseekers are therefore looking closely at non-monetary benefits such as flexible working conditions, social incentives and long-term career advancement opportunities when considering job offers or whether to remain with an employer. The variety of a role and a focus on customer experience over average call handling times are important too.
An organisation’s values and cultural fit are also key – for both jobseekers and employers – in order to reduce turnover and ensure a happy and productive team.
In other trends, more organisations are relocating offshore contact centres back to Australia. This has increased vacancy activity for Outbound Sales, Telemarketers, Sales Agents, Customer Service Consultants, Contact Centre Managers and Team Leaders.
When recruiting at the entry level, employers continue to consider candidates with retail and hospitality backgrounds, provided they have the right attitude and enthusiasm to work in a customer centric environment. This provides employers with a wider pool of candidates to consider, who can be given strong development pathways.
NEW ZEALANDContact centre salaries increased slightly in 2017-18 in response to the shortage of experienced professionals on shore. Employers were willing to slightly increase salaries for the limited pool of experienced candidates without any visa restrictions.
Inbound and outbound Telesales Representatives and Customer Service Representatives with data entry and administration skills will remain in high demand. Due to the technical and communications skills these positions require, the supply of suitable candidates fails to sustain the demand generated by SME growth across various sectors,
including manufacturing, distribution, FMCG, freight, logistics, automotive tools and supplies, and the services industries.
In terms of soft skills in demand, employers look for candidates who are resilient, committed and able to quickly grasp various computer systems who can also cope with high activity volumes and work long hours.
In addition, SMEs require candidates who can fit into a small team and share responsibilities with their colleagues rather than focus solely on a limited scope of work. With few suitable candidates, salaries are increasing for these professionals.
While demand is high for the abovementioned skills, there is a surplus of candidates without experience who want to enter the contact centre industry. There is also a high number of candidates with overseas experience but visa limitations. Some medium to large financial corporates will sponsor or upskill these candidates, although this is not the level where staffing demand is greatest.
The impact of digital technology can be felt in all sectors, including contact centres, where it is transforming the way centres operate and the skills in demand.
“
”
Employers look for candidates who are resilient, committed and able to quickly grasp various computer systems.
“
”
CONTACT CENTRES

2018 Hays Salary Guide | 77
• All salaries shown are exclusive of superannuation (AU) or KiwiSaver (NZ)
• New Zealand salaries are represented in New Zealand dollars
• All salaries are representative of fixed cash & incentive bonus components (if applicable), sales roles are base salary only and differ extensively across industry sectors
• At the more senior level, larger contact centres tend to be at the higher end of the ranges shown, whilst agent level roles tend to sit at the lower to medium level, whereby across industries, such as Pharmaceutical/Medical devices, and FMCG, these positions stretch the top end
NOTES:
CONTACT CENTRES
Back Office Processing
Inbound Service
Inbound Sales & Service
Snr Customer Service Representative
Sales/ Telesales Team Leader
Sales/Telesales Manager
NSW - Sydney40 50 50 55 75 10039 - 45 40 - 55 40 - 55 50 - 60 60 - 100 70 - 130
NSW - Regional40 40 40 42 50 8039 - 40 39 - 40 39 - 40 41 - 47 45 - 90 50 - 110
VIC - Melbourne42 50 55 55 70 10039 - 45 40 - 55 40 - 55 45 - 60 60 - 75 65 - 130
VIC - Regional42 45 45 50 60 8039 - 45 40 - 50 40 - 50 45 - 55 55 - 65 60 - 100
QLD - Regional43 43 45 48 70 8540 - 45 40 - 45 42 - 47 45 - 50 60 - 80 70 - 120
SA - Adelaide40 45 47 48 70 9039 - 42 43 - 49 42 - 50 45 - 55 50 - 80 70 - 120
WA - Perth40 43 45 50 70 10039 - 42 40 - 45 40 - 50 43 - 55 60 - 90 80 - 120
ACT - Canberra47 57 50 62 76 9040 - 55 50 - 65 45 - 55 55 - 70 60 - 80 75 - 115
TAS - Hobart/Launceston40 40 45 45 55 7539 - 45 39 - 48 39 - 50 40 - 50 55 - 65 60 - 120
NZ - Auckland41 43 47 48 60 7540 - 42 42 - 48 45 - 52 47 - 50 58 - 68 70 - 110
NZ - Wellington41 43 47 48 60 7540 - 42 42 - 48 45 - 52 47 - 50 58 - 68 70 - 110
NZ - Christchurch41 43 45 47 60 7040 - 42 40 - 48 40 - 50 45 - 50 55 - 65 65 - 90
Appointment Setter Telemarketer
Telesales Outbound
Outbound Sales & Service
Account Manager
Business Development Consultant
NSW - Sydney50 50 50 55 60 6045 - 60 50 - 60 50 - 60 50 - 60 50 - 65 50 - 75
NSW - Regional45 42 40 40 45 4539 - 60 41 - 45 39 - 55 39 - 45 45 - 50 39 - 60
VIC - Melbourne45 45 50 50 50 6040 - 55 41 - 50 40 - 65 40 - 55 45 - 60 45 - 70
VIC - Regional42 42 40 45 45 5040 - 45 41 - 50 39 - 45 40 - 50 45 - 55 40 - 65
QLD - Regional45 55 47 40 50 6040 - 50 50 - 60 43 - 50 39 - 48 45 - 60 55 - 65
SA - Adelaide45 50 47 50 65 5240 - 55 40 - 60 40 - 55 45 - 53 55 - 75 40 - 68
WA - Perth45 45 50 45 50 6040 - 50 40 - 50 42 - 60 42 - 50 45 - 60 45 - 70
ACT - Canberra50 55 50 45 65 5845 - 55 50 - 60 45 - 55 40 - 50 55 - 75 45 - 65
TAS - Hobart/Launceston45 45 45 45 55 5238 - 48 41 - 50 40 - 50 40 - 50 45 - 65 40 - 65
NZ - Auckland45 42 45 50 55 6542 - 48 40 - 48 40 - 50 48 - 58 50 - 70 60 - 80
NZ - Wellington45 42 45 50 55 6542 - 48 40 - 48 40 - 50 48 - 58 50 - 65 60 - 80
NZ - Christchurch44 41 43 45 60 6540 - 45 37 - 40 40 - 45 42 - 50 55 - 75 55 - 75

78 | 2018 Hays Salary Guide
• All salaries shown are exclusive of superannuation (AU) or KiwiSaver (NZ)
• New Zealand salaries are represented in New Zealand dollars
• All salaries are representative of fixed cash & incentive bonus components (if applicable), sales roles are base salary only and differ extensively across industry sectors
• At the more senior level, larger contact centres tend to be at the higher end of the ranges shown, whilst agent level roles tend to sit at the lower to medium level, whereby across industries, such as Pharmaceutical/Medical devices, and FMCG, these positions stretch the top end
NOTES:
CONTACT CENTRES
Call Coach/QA Reporting Analyst Workforce Planner Project Manager
NSW - Sydney60 65 80 11050 - 70 60 - 85 75 - 90 80 - 160
NSW - Regional45 50 60 7043 - 55 40 - 75 40 - 70 50 - 100
VIC - Melbourne52 65 70 9045 - 60 50 - 75 60 - 90 75 - 120
VIC - Regional50 60 60 7045 - 55 50 - 75 50 - 75 60 - 90
QLD - Regional48 65 80 9043 - 60 45 - 65 65 - 90 80 - 120
SA - Adelaide50 55 65 7545 - 60 45 - 70 60 - 90 65 - 100
WA - Perth55 65 75 8545 - 60 50 - 70 60 - 85 75 - 110
ACT - Canberra60 68 80 9050 - 70 52 - 75 68 - 95 75 - 110
TAS - Hobart/Launceston55 50 55 7045 - 65 45 - 65 50 - 70 60 - 110
NZ - Auckland55 55 55 7548 - 60 50 - 60 50 - 70 65 - 85
NZ - Wellington55 55 55 7548 - 60 50 - 60 50 - 70 65 - 85
NZ - Christchurch55 55 55 7548 - 60 50 - 60 50 - 70 65 - 85
Collections Representative
Collections Team Leader Collections Manager
NSW - Sydney50 75 11045 - 55 65 - 85 90 - 150
NSW - Regional40 50 9039 - 50 45 - 70 70 - 130
VIC - Melbourne50 68 9540 - 50 55 - 70 70 - 120
VIC - Regional42 52 7039 - 50 45 - 60 65 - 75
QLD - Regional45 70 8040 - 50 60 - 80 70 - 90
SA - Adelaide43 63 9040 - 48 50 - 70 65 - 120
WA - Perth45 70 8040 - 55 60 - 80 75 - 100
ACT - Canberra48 72 9045 - 55 55 - 80 80 - 115
TAS - Hobart/Launceston40 50 5040 - 50 50 - 60 50 - 65
NZ - Auckland48 55 6542 - 52 50 - 65 60 - 75
NZ - Wellington42 55 6538 - 46 50 - 60 60 - 75
NZ - Christchurch43 54 6040 - 45 50 - 55 55 - 65

2018 Hays Salary Guide | 79
• All salaries shown are exclusive of superannuation (AU) or KiwiSaver (NZ)
• New Zealand salaries are represented in New Zealand dollars
• All salaries are representative of fixed cash & incentive bonus components (if applicable), sales roles are base salary only and differ extensively across industry sectors
• At the more senior level, larger contact centres tend to be at the higher end of the ranges shown, whilst agent level roles tend to sit at the lower to medium level, whereby across industries, such as Pharmaceutical/Medical devices, and FMCG, these positions stretch the top end
NOTES:
CONTACT CENTRES
Supervisor Trainer Team Leader Team Manager
NSW - Sydney60 75 75 8555 - 70 45 - 85 60 - 85 70 - 100
NSW - Regional53 55 45 5050 - 60 40 - 65 39 - 65 40 - 70
VIC - Melbourne65 70 70 7560 - 75 55 - 90 60 - 80 60 - 90
VIC - Regional60 60 62 7055 - 65 55 - 65 55 - 70 60 - 80
QLD - Regional60 60 60 6550 - 60 48 - 75 50 - 75 50 - 85
SA - Adelaide60 60 70 7550 - 60 50 - 80 50 - 80 55 - 80
WA - Perth70 60 65 8060 - 80 55 - 75 60 - 80 65 - 90
ACT - Canberra62 70 67 8050 - 75 50 - 80 55 - 80 60 - 90
TAS - Hobart/Launceston55 60 55 7050 - 70 50 - 80 50 - 70 60 - 75
NZ - Auckland55 60 60 7550 - 65 55 - 75 50 - 75 70 - 90
NZ - Wellington55 60 60 7550 - 65 55 - 75 50 - 75 70 - 90
NZ - Christchurch53 60 60 7050 - 55 55 - 70 50 - 65 65 - 75
Customer Service Manager
Contact Centre Manager Operations Manager
Director Customer Service/Contact Centres
NSW - Sydney100 120 120 18580 - 140 80 - 150 100 - 180 130 - 210
NSW - Regional80 100 100 16560 - 120 70 - 130 80 - 160 110 - 190
VIC - Melbourne100 130 120 18070 - 140 80 - 150 80 - 160 120 - 200
VIC - Regional80 100 115 15570 - 100 80 - 120 80 - 150 110 - 200
QLD - Regional90 100 110 17070 - 120 80 - 130 85 - 150 120 - 220
SA - Adelaide85 100 100 15565 - 110 75 - 130 80 - 130 115 - 180
WA - Perth90 100 120 18070 - 120 80 - 130 100 - 150 100 - 200
ACT - Canberra80 115 125 13575 - 120 80 - 135 80 - 160 110 - 200
TAS - Hobart/Launceston80 100 100 15060 - 100 80 - 120 80 - 130 90 - 180
NZ - Auckland75 80 85 14070 - 90 70 - 110 75 - 130 120 - 180+
NZ - Wellington75 80 85 14070 - 90 70 - 100 75 - 120 120 - 180+
NZ - Christchurch75 80 85 14070 - 90 70 - 100 75 - 110 120 - 180+

80 | 2018 Hays Salary Guide
SALA
RY IN
FOR
MAT
ION
: HU
MA
N R
ESO
URC
ES
AUSTRALIAFollowing a challenging few years of redundancies, restructures and offshoring, human resources departments returned to growth in 2017-18. While internal recruitment is the focus moving forward, it is Talent Acquisition Specialists who are sought to engage with candidates. This is the next evolution in the recruitment function, following on from the 1990s focus on ‘personnel’ and the 2000s emphasis on ‘recruiter’.
It’s also representative of the industry’s shift towards an internal talent team that partners with key stakeholders across an organisation. As this partnership focus continues, master vendor solutions will increase in the year ahead.
Unsurprisingly then, HR Business Partners are sought as organisations look for a strategic multi-skilled generalist over a Consultant or Advisor. With highly-skilled professionals in short supply, employers have offered more competitive packages. For their part, HR Business Partners look at the entire package, including clear career progression, a development path, KPI-based bonuses and flexible working options.
Permanent organisational development, change management and learning & development roles have been available. While these roles have, in more recent years, been offered on a contract basis, permanent positions are now the focus in response to market confidence and investment in organisational headcount. However contract rates exceed the value of permanent packages, creating attraction challenges for employers. This is expected to change in 2018-19 as organisations secure strong senior candidates from the contract market.
IR specialists with EBA negotiation experience will be in demand too as organisations look to negotiate a cost-effective agreement for both a workforce and business. As EBA negotiations become more strategic and detailed, this demand will only increase.
In Canberra, large-scale infrastructure, construction, defence and technology projects have seen multinational, local and start-up businesses focus on building their customer centricity. Business-enabling and performance-driven HR initiatives are therefore underway as organisations look for agility and a competitive edge. This has led to increasing demand for people and culture professionals who can champion and drive initiatives in collaboration with senior stakeholders.
With the above skills in high demand, salary pressure will increase, especially in the Eastern states where an active construction market is fuelling competition.
Western Australia faces its own unique challenge as it attempts to attract back top HR professionals who moved interstate during the downturn. With organisations now growing, they want to attract and retain talent for the future.
Across Australia the contract market was very buoyant in 2017-18. The standout was the Federal and State Governments in Adelaide and Canberra, where the focus was on agility to respond to project demands. With a Federal election pending, we could see a shift towards more permanent engagements in 2018-19.
NEW ZEALANDContinued business confidence, low unemployment and sustained investment in business activity kept New Zealand’s HR job market active in 2017-18, with candidate movement consistent across the market.
Quality HR professionals will remain in high demand in 2018-19, particularly in learning and development as employers recognise the importance of continuous upskilling and training in new technologies that improve efficiencies.
The general increase in vacancy activity is also fuelling demand for ER Consultants
and Advisors with knowledge of New Zealand employee legislation and the ability to supervise performance management.
Knowledge of health and safety regulations will continue to create demand for Health & Safety Managers, Advisors and Health, Safety and Environment professionals. In order to effectively operate, businesses will need to ensure that they are fully compliant.
The business partnership model continues to flourish as companies move away from a centralised structure to a business unit focus. Consequently, commercially savvy HR Business Partners and Senior Advisors who can successfully align HR practices with business strategy are highly sought after.
Salaries remain static, although in-demand skillsets including Health & Safety, Learning & Development, Change Management and strategic HR Business Partners are seeing salary increases.
Throughout 2018-19 employee engagement and retention will be critical as HR professionals become more aware of the job opportunities available. Candidates will continue to request more flexible working options and employers will need to adapt accordingly as the focus on emotional and physical wellbeing increases.
IR specialists with EBA negotiation experience will be in demand as organisations look to negotiate a cost-effective agreement for both a workforce and business.
“
”
The business partnership model continues to flourish as companies move away from a centralised structure to a business unit focus.
“
”
HUMAN RESOURCES

2018 Hays Salary Guide | 81
• All salaries shown are exclusive of superannuation (AU) or KiwiSaver (NZ)
• New Zealand salaries are represented in New Zealand dollars
NOTES:
HUMAN RESOURCES
Head of HR/HR Director >1000 employees
Head of HR/HR Director250 - 1000 employees
Head of HR/HR Director <250 employees
HR Manager>1000 employees
HR Manager250 - 1000 employees
HR Manager<250 employees
NSW - Sydney280 200 160 180 140 120200 - 400 150 - 220 140 - 180 150 - 200 120 - 180 110 - 150
VIC - Melbourne250 200 150 150 130 120150 - 300 150 - 250 140 - 200 90 - 200 100 - 150 80 - 120
QLD - Brisbane190 170 150 150 130 120170 - 230 150 - 200 130 - 180 100 - 180 90 - 150 80 - 140
SA - Adelaide200 190 150 150 120 120150 - 250 130 - 230 120 - 180 120 - 180 100 - 150 100 - 140
WA - Perth220 180 150 180 150 110180 - 250 150 - 220 140 - 180 160 - 200 130 - 160 90 - 130
ACT - Canberra190 200 140 150 125 115150 - 250 160 - 250 120 - 160 100 - 180 100 - 150 85 - 130
NT - Darwin200 180 150 150 130 120180 - 230 160 - 200 120 - 180 120 - 160 100 - 140 90 - 130
TAS - Hobart/Launceston180 140 130 115 110 110150 - 250 100 - 160 90 - 140 80 - 130 80 - 130 80 - 130
New Zealand200 180 160 140 130 120150 - 250 130 - 240 120 - 200 110 - 160 100 - 150 100 - 140
HR Business Partner HR Advisor
HR Coordinator HR Admin
NSW - Sydney120 85 65 55100 - 150 70 - 95 60 - 70 50 - 65
VIC - Melbourne120 85 65 6090 - 150 70 - 95 55 - 70 55 - 65
QLD - Brisbane110 80 60 5590 - 130 65 - 90 55 - 65 45 - 60
SA - Adelaide120 85 60 5590 - 130 70 - 100 55 - 70 45 - 60
WA - Perth110 85 65 55100 - 130 80 - 100 55 - 75 45 - 65
ACT - Canberra110 80 65 5590 - 130 65 - 90 55 - 75 45 - 65
NT - Darwin120 80 65 5590 - 135 70 - 100 60 - 80 50 - 70
TAS - Hobart/Launceston100 80 60 5590 - 130 65 - 90 55 - 65 45 - 60
New Zealand115 85 60 5085 - 130 70 - 100 50 - 70 45 - 55
IR Manager ER Manager IR Advisor ER Advisor HR AnalystHR Policy Writers
NSW - Sydney160 130 110 90 95 120120 - 200 120 - 180 85 - 130 75 - 100 75 - 120 100 - 150
VIC - Melbourne150 130 110 90 85 90120 - 200 120 - 180 85 - 130 75 - 100 75 - 100 85 - 125
QLD - Brisbane160 130 90 90 85 90120 - 200 120 - 180 80 - 120 75 - 100 75 - 100 80 - 120
SA - Adelaide150 120 90 90 80 80120 - 180 100 - 160 80 - 120 80 - 120 70 - 100 70 - 100
WA - Perth150 150 100 100 90 90120 - 180 120 - 180 80 - 120 80 - 120 80 - 110 80 - 110
ACT - Canberra120 120 100 90 80 90100 - 140 100 - 140 90 - 110 75 - 110 75 - 100 80 - 110
NT - Darwin130 130 100 90 90 90100 - 160 100 - 160 90 - 120 75 - 120 70 - 110 80 - 100
TAS - Hobart/Launceston130 110 85 85 80 90100 - 160 100 - 160 70 - 120 70 - 120 70 - 95 80 - 100
New Zealand120 120 105 105 100 10090 - 140 90 - 140 90 - 120 90 - 120 90 - 120 80 - 120

82 | 2018 Hays Salary Guide
• All salaries shown are exclusive of superannuation (AU) or KiwiSaver (NZ)
• New Zealand salaries are represented in New Zealand dollars
NOTES:
HUMAN RESOURCES
Head of L&D/ L&D Director
Learning & Development Manager
Learning & Development Advisor
Learning & Development Coordinator
Training Manager Trainer
NSW - Sydney220 150 95 70 120 85150 - 250 120 - 180 85 - 120 55 - 80 90 - 140 70 - 110
VIC - Melbourne180 140 90 70 120 90150 - 250 110 - 175 80 - 120 60 - 80 90 - 145 75 - 120
QLD - Brisbane180 120 80 65 85 85120 - 200 100 - 140 70 - 90 55 - 70 70 - 100 60 - 100
SA - Adelaide180 120 85 70 100 85150 - 200 90 - 140 75 - 95 60 - 80 80 - 110 70 - 100
WA - Perth150 130 90 70 120 100130 - 180 110 - 150 70 - 100 65 - 85 110 - 140 80 - 120
ACT - Canberra150 120 90 70 90 80100 - 200 90 - 140 80 - 120 65 - 87 70 - 100 60 - 100
NT - Darwin150 120 90 70 100 85120 - 200 90 - 140 80 - 100 65 - 90 80 - 120 70 - 100
TAS - Hobart/Launceston150 120 85 70 100 85130 - 200 90 - 140 75 - 95 60 - 80 80 - 110 70 - 100
New Zealand175 125 95 65 120 85120 - 200 90 - 140 80 - 120 55 - 75 90 - 140 70 - 100
Diversity Manager
Diversity Advisor
Recruitment Mgr/TalentAcquisition Mgr
Recruitment Advisor
Recruitment Coordinator
Workforce Planner
NSW - Sydney150 110 130 95 65 110120 - 180 90 - 130 110 - 160 70 - 110 60 - 70 90 - 130
VIC - Melbourne145 110 125 90 70 110130 - 200 85 - 130 110 - 160 75 - 110 60 - 75 90 - 130
QLD - Brisbane120 100 110 70 60 11090 - 140 90 - 120 80 - 140 60 - 80 50 - 70 80 - 130
SA - Adelaide120 85 100 80 60 9090 - 140 75 - 100 80 - 125 65 - 90 50 - 70 70 - 100
WA - Perth140 100 130 85 65 100120 - 160 85 - 125 100 - 150 70 - 100 55 - 75 90 - 120
ACT - Canberra100 80 110 75 60 10090 - 110 75 - 95 90 - 140 65 - 90 50 - 70 90 - 110
NT - Darwin120 85 100 80 65 9090 - 140 75 - 100 80 - 120 70 - 90 60 - 80 70 - 110
TAS - Hobart/Launceston100 80 115 75 55 8080 - 120 70 - 100 90 - 140 60 - 100 45 - 65 60 - 100
New Zealand100 80 115 75 55 8080 - 120 70 - 100 90 - 140 60 - 100 45 - 65 60 - 100
Change Manager
Change Analyst
Instructional Designer
Organisational Development Manager
Organisational Development Advisor
NSW - Sydney200 150 160 150 110140 - 240 100 - 200 100 - 200 130 - 200 90 - 120
VIC - Melbourne200 130 140 150 120140 - 240 80 - 150 100 - 210 130 - 180 95 - 125
QLD - Brisbane150 130 110 130 100120 - 200 90 - 150 80 - 140 100 - 150 90 - 120
SA - Adelaide150 110 110 120 85130 - 180 80 - 130 90 - 130 100 - 140 75 - 95
WA - Perth150 110 140 150 100130 - 200 100 - 120 110 - 160 130 - 180 90 - 120
ACT - Canberra200 150 130 150 110140 - 240 100 - 200 80 - 180 100 - 180 90 - 120
NT - Darwin130 100 110 130 90100 - 160 80 - 120 90 - 130 100 - 150 70 - 110
TAS - Hobart/Launceston125 110 110 130 115100 - 150 90 - 130 90 - 150 100 - 150 90 - 140
New Zealand130 110 120 130 115110 - 160 90 - 130 100 - 150 100 - 150 90 - 140

2018 Hays Salary Guide | 83
HUMAN RESOURCES
• All salaries shown are exclusive of superannuation (AU) or KiwiSaver (NZ)
• New Zealand salaries are represented in New Zealand dollars
NOTES:
Head of/Director Remuneration & Benefits
Remuneration & Benefits Manager
Remuneration & Benefits Advisor
HRIS Advisor
HR Project Manager
NSW - Sydney200 150 100 100 130160 - 300 110 - 160 85 - 130 75 - 120 100 - 160
VIC - Melbourne200 140 100 85 120150 - 250 100 - 160 80 - 115 80 - 110 90 - 140
QLD - Brisbane190 130 95 70 130150 - 220 90 - 150 80 - 110 60 - 80 100 - 150
SA - Adelaide190 120 80 70 100150 - 220 90 - 140 70 - 90 60 - 85 90 - 130
WA - Perth180 130 120 110 130150 - 200 100 - 150 90 - 130 85 - 130 100 - 180
ACT - Canberra180 130 100 85 90120 - 200 110 - 150 80 - 100 75 - 120 80 - 110
NT - Darwin150 120 80 80 110120 - 210 90 - 140 65 - 90 65 - 90 90 - 130
TAS - Hobart/Launceston150 120 80 80 100120 - 210 90 - 140 65 - 90 65 - 90 80 - 120
New Zealand175 110 85 80 120150 - 200 90 - 130 70 - 110 65 - 100 90 - 140
Injury/RTW Manager
Injury/RTW Advisor RTW Coordinator
NSW - Sydney130 80 70100 - 140 75 - 90 65 - 75
VIC - Melbourne120 90 75100 - 130 80 - 100 60 - 80
QLD - Brisbane95 70 6075 - 110 60 - 80 50 - 70
SA - Adelaide100 75 6875 - 120 60 - 85 60 - 75
WA - Perth100 80 6080 - 120 65 - 90 50 - 70
ACT - Canberra90 80 7085 - 105 70 - 85 65 - 75
NT - Darwin110 90 70100 - 140 80 - 100 60 - 80
TAS - Hobart/Launceston85 70 6075 - 100 60 - 85 55 - 65
New Zealand90 75 5060 - 110 60 - 80 42 - 60
Head of WHS/WHS Director
Health & Wellbeing Manager/Officer WHS Manager WHS Advisor
WHS Coordinator
NSW - Sydney170 120 140 100 80150 - 250 100 - 130 100 - 150 80 - 110 65 - 85
VIC - Melbourne200 120 140 100 80180 - 220 100 - 130 120 - 170 80 - 120 70 - 90
QLD - Brisbane180 110 120 80 55120 - 250 80 - 150 80 - 150 60 - 100 50 - 65
SA - Adelaide150 110 130 80 60120 - 180 90 - 120 100 - 150 60 - 100 55 - 80
WA - Perth130 110 130 85 60110 - 160 80 - 140 100 - 180 75 - 95 50 - 70
ACT - Canberra150 85 120 85 60110 - 170 70 - 100 90 - 135 70 - 100 55 - 75
NT - Darwin150 120 120 90 75120 - 180 100 - 140 90 - 140 80 - 100 65 - 85
TAS - Hobart/Launceston150 110 110 70 60120 - 180 100 - 140 80 - 130 60 - 90 55 - 65
New Zealand130 95 110 75 5095 - 160 80 - 110 70 - 130 55 - 85 42 - 60

84 | 2018 Hays Salary Guide
SALA
RY IN
FOR
MAT
ION
: SA
LES
AUSTRALIAThroughout 2017-18 organisations prioritised the recruitment of key sales staff to take advantage of strong economic conditions. This created high demand for strong frontline customer-facing salespeople who represent the values of an organisation.
Business Development Managers rather than Account Managers remain in high demand to develop new business and increase revenue. The ability to identify new opportunities and present a clear and strategic plan for business growth will be key skills employers look for in the year ahead.
IT and tech start-ups have particularly high demand for Business Development Managers and sales professionals. This is most obvious in mid-market start-ups that want to aggressively focus on fast-growth revenue targets to stay afloat and meet investor requirements.
Employers in the telecommunications and construction industries are also actively recruiting sales professionals in response to increased competition, both domestically and from Chinese businesses that are investing in the Australian market.
The latter has also led to increasing demand for Mandarin speaking Business Development Managers.
When they recruit, employers continue to favour candidates with a strong and extensive network. Some employers value this above technical experience and knowledge. Employers also prefer, when possible, jobseekers with a solid understanding of the products and or services provided. However with competition for the top talent becoming stronger, more flexibility is being displayed in this area. We expect employers to become even more willing to train candidates as necessary in the year ahead.
Despite demand, salary movement has been limited. But this could change in the 2018-19 financial year as highly talented salespeople start to push for higher base salaries. Successful sales staff who are confident in their network and have a proven ability to increase revenue for an organisation are already starting to demand higher base salaries and commission structures.
In addition, they are pushing for more company benefits and flexible work practices. Consequently the ability to work from home and the offering of more lucrative and uncapped commission structures will set organisations apart this year.
Cultural fit is now of greater importance to both employers and jobseekers. In fact, employers now accept that to secure the right cultural fit, flexibility is required surrounding a candidate’s previous product knowledge and industry experience. As a result, it is far more common for an employer to invite a potential employee to meet the team before making a final hiring decision.
As ever, employers place importance on the CRM system/s jobseekers have previously used. Corporate organisations look for candidates with experience using popular systems, such as Salesforce, as they believe this allows a new employee to quickly become client-facing.
NEW ZEALANDAcross 2017-18 low unemployment and a shortage of quality sales professionals prompted employers to consider changing the base and commission ratio of salary packages in order to secure strong sales ‘hunters’. However, changing the remuneration structure for new staff also means reviewing it for existing
employees. Smaller organisations can often do this far quicker than larger businesses, particularly if they have a fixed remuneration structure.
Another key trend centres on communication skills. While technology allows greater access to potential prospects, it can also lead to a less personalised service if potential customers are only approached via email or social media.
As a result, employers now request sales candidates with a track record in not only winning new accounts but also building and developing long term relationships. Crucially, employers want to see evidence of a candidate’s ability to do so in person or over the telephone rather than relying on email or social media. The ability to have a conversation with a prospect or client does not always come naturally to the new generation of sales candidates entering the market. Consequently, any candidate with demonstrable evidence of this skill is highly sought after.
In addition, sales professionals with local market knowledge and an existing network of contacts are considered even more appealing.
There is however a shortage of candidates with these skills. Hiring managers must therefore consider their organisation’s EVP and differentiators in order to effectively promote their role to the top talent.
SALES
Employers now accept that to secure the right cultural fit, flexibility is required surrounding a candidate’s previous product knowledge and industry experience.
“
”
The ability to identify new opportunities and present a clear and strategic plan for business growth will be key skills employers look for in the year ahead.
“
”

2018 Hays Salary Guide | 85
• All salaries shown are exclusive of superannuation (AU) or KiwiSaver (NZ)
• All salaries shown exclude car and commission
• New Zealand salaries are represented in New Zealand dollars
NOTES:
SALES
Business Manager Account Manager
Senior Account Manager
KeyAccount Manager
National Account Manager
NSW - Sydney140 70 100 100 120110 - 180 60 - 90 80 - 110 80 - 120 100 - 140
VIC - Melbourne140 70 90 100 120110 - 165 60 - 80 80 - 100 90 - 120 100 - 150
QLD - Brisbane110 70 85 100 11580 - 115 55 - 90 75 - 100 80 - 120 95 - 130
SA - Adelaide110 60 65 70 9085 - 125 55 - 70 60 - 80 60 - 80 70 - 105
WA - Perth110 80 90 90 100100 - 145 70 - 90 80 - 110 80 - 110 90 - 120
ACT - Canberra100 70 85 85 11080 - 120 60 - 75 75 - 90 80 - 100 95 - 120
TAS - Hobart110 65 75 75 9080 - 120 55 - 75 70 - 95 70 - 100 80 - 120
NZ - Auckland115 80 95 100 11595 - 130 70 - 90 75 - 120 85 - 130 90 - 135
NZ - Wellington110 70 80 90 10090 - 120 65 - 75 70 - 100 75 - 120 80 - 130
NZ - Christchurch90 70 80 85 9075 - 100 60 - 80 65 - 90 70 - 100 80 - 110
Inside Sales RepSales Executive/Rep Sales Engineer Channel Manager
Category Manager
NSW - Sydney60 70 85 100 10050 - 65 60 - 90 75 - 110 80 - 120 80 - 120
VIC - Melbourne55 70 90 90 9545 - 65 60 - 80 80 - 120 80 - 100 75 - 110
QLD - Brisbane55 70 85 85 9045 - 60 55 - 80 65 - 110 65 - 110 75 - 105
SA - Adelaide45 60 85 70 8545 - 55 60 - 75 75 - 90 55 - 80 70 - 95
WA - Perth55 70 90 85 9550 - 60 60 - 80 80 - 100 80 - 110 90 - 130
ACT - Canberra50 70 80 80 9545 - 55 55 - 80 65 - 90 70 - 90 80 - 110
TAS - Hobart50 65 90 75 8545 - 55 55 - 75 80 - 100 70 - 85 70 - 90
NZ - Auckland55 70 95 90 9045 - 60 55 - 85 80 - 115 70 - 110 80 - 120
NZ - Wellington50 65 85 85 8545 - 55 55 - 70 75 - 100 70 - 100 75 - 100
NZ - Christchurch45 50 85 80 9040 - 50 45 - 60 75 - 100 60 - 110 70 - 110

86 | 2018 Hays Salary Guide
• All salaries shown are exclusive of superannuation (AU) or KiwiSaver (NZ)
• All salaries shown exclude car and commission
• New Zealand salaries are represented in New Zealand dollars
NOTES:
SALES
Business Development Manager
Territory Manager
State/Regional Manager
National Sales Manager
Director of Sales
NSW - Sydney90 70 110 150 22070 - 100 60 - 90 90 - 150 120 - 200 170 - 280
VIC - Melbourne100 65 100 140 21090 - 120 50 - 70 80 - 130 120 - 160 170 - 250
QLD - Brisbane85 65 100 140 17065 - 110 55 - 85 80 - 130 110 - 180 120 - 220
SA - Adelaide65 70 85 100 12060 - 70 60 - 80 75 - 110 80 - 130 90 - 140
WA - Perth100 80 120 120 18580 - 120 75 - 100 100 - 130 120 - 150 170 - 200
ACT - Canberra100 90 100 120 14090 - 130 70 - 95 90 - 120 90 - 140 110 - 150
TAS - Hobart75 80 90 120 16065 - 90 70 - 100 80 - 120 90 - 130 130 - 160
NZ - Auckland90 70 120 140 17575 - 100 65 - 80 110 - 150 110 - 170 130 - 225
NZ - Wellington85 70 105 125 15075 - 100 65 - 75 90 - 130 90 - 150 130 - 200
NZ - Christchurch80 70 90 110 14070 - 100 60 - 80 80 - 130 90 - 130 100 - 180

2018 Hays Salary Guide | 87
SALA
RY IN
FOR
MAT
ION
: MA
RKET
ING
& D
IGIT
AL
MARKETING & DIGITAL
AUSTRALIARecruitment activity remained buoyant in marketing and digital throughout 2017-18 across all functions and industries. A key trend was the shift towards flexible workers for roles at all levels as employers undertook more project-based work, sought cover while a permanent staff member was sourced or bridged skill gaps in their teams.
This focus on temporary and contract employees will continue throughout 2018-19 across marketing and digital.
Digital transformation was the other key trend evident across the public and private sectors, which increased vacancy activity for Digital Project Managers for contract roles and Content Managers and Specialists.
Candidate shortages in these areas saw organisations compete for the top talent. Rather than increase salaries though, employers improved their recruitment process and speed to hire to secure high performers. With demand expected to remain high in 2018-19, employers with strong employee value propositions who move through the recruitment process swiftly will secure the top talent in this field.
In other areas of demand, e-commerce candidates are sought in the retail sector to help in-house teams meet high online revenue targets. While this will continue throughout 2018-19, salaries will remain stable since the supply of suitable candidates currently matches demand.
Digital Insight Managers are in high demand too, with typical salaries increasing in response to the shortage of candidates. This demand will continue over the next 12 months as businesses increasingly use big data and consumer insights to grow engagement and sales.
The rise of multiple and specialised digital channels in marketing teams across all sectors created demand for hybrid
Marketing Managers, Senior Marketing Managers and Digital Marketing Managers with a blended generalist and digital skillset. These candidates can create and implement strategies for their teams without relying on digital agencies. Given demand, salaries have increased for such hybrid candidates.
Demand for Marketing Communications specialists has also increased in all sectors, particularly the public sector, with salaries and rates rising to attract talent. Temporary Graphic Designers in the public sector have been in greater demand too as government agencies aim to improve engagement with the public by enhancing their websites and digital applications.
Fundraising candidates will remain in demand, and overall packages in the not-for-profit (NFP) space have improved to match the increasing desire for commercially-focused candidates who would otherwise earn more elsewhere.
Marketing Executives and Assistant Brand Managers with strong experience in inventory and product management will be in high demand also, with SMEs competing with large corporates for these candidates. This demand is partially being met by agency candidates looking to move client-side who have strong deadline and stakeholder management skills. Despite demand, salaries remain steady since agency candidates earn more simply by moving across into the commercial sector.
NEW ZEALANDNew Zealand’s marketing and digital industry will remain active in 2018-19, with temporary staff sought for special projects and permanent recruitment driven by turnover and growth.
At the entry Marketing Assistant and Coordinator level, supply outweighs demand and has suppressed salaries. To stand out, candidates require a web presence and portfolio that showcases their creative and written communication skills.
At the intermediate Marketing Executive and Marketing Specialist level, specialist jobs outweigh generalist roles, with salaries trending upwards as a result. For example, Customer Communications Specialists transitioning from agencies to banks have secured significant salary increases to work on trigger-based conversational customer communications programmes. To maximise their potential for a salary increase, candidates must therefore upskill in marketing automation, SEO and Google Adwords, copywriting, direct marketing or social media content planning.
Senior leadership opportunities for Heads of Marketing will be available for those who can design and align whole marketing programmes to deliver customer value and commercial results. We expect salaries to increase for the top talent.
In other trends, SME employers expect a broad skill set. For example, Marketing Coordinators who can design, manage SEM and SEO, and understand Google Analytics. Despite this, salaries remain lower than the corporate, agency and technology sectors.
Digital specialists are increasingly sought as organisations digitise, while Digital Marketing Manager jobs are being created in large organisations. The latter can command high salaries.
Marketing Automation Specialists, Digital Copywriters and Inbound Marketing Specialists are required for temporary assignments as technology platforms and marketing techniques become more specialised. Candidates often earn more as a contractor than a permanent employee.
Digital Insight Managers are in high demand, with typical salaries increasing in response to the shortage of candidates.
“
”
Demand for Marketing Communications specialists has also increased in all sectors, particularly the public sector, with salaries and rates rising to attract talent.
“
”

88 | 2018 Hays Salary Guide
• All salaries shown are exclusive of superannuation (AU) or KiwiSaver (NZ)
• New Zealand salaries are represented in New Zealand dollars
NOTES:
MARKETING & DIGITAL
MARKETINGMarketing Assistant
Marketing Coordinator
Marketing Executive
Marketing Manager
Snr Marketing Manager
Marketing Director
NSW - Sydney55 65 80 110 150 20050 - 65 60 - 70 70 - 90 100 - 140 130 - 170 180 - 250
VIC - Melbourne55 60 75 100 140 20045 - 65 55 - 70 65 - 80 90 - 120 120 - 180 150 - 250
QLD - Brisbane45 65 75 95 110 14037 - 55 55 - 75 65 - 85 80 - 110 100 - 130 120 - 170
SA - Adelaide50 60 70 90 100 13050 - 55 55 - 70 60 - 80 85 - 100 90 - 120 120 - 160
NT - Darwin55 60 75 100 110 13045 - 60 55 - 65 65 - 80 75 - 120 90 - 130 110 - 160
WA - Perth50 60 75 110 140 19545 - 60 45 - 65 65 - 80 90 - 130 120 - 170 160 - 230
ACT - Canberra50 60 80 95 120 17045 - 65 50 - 70 70 - 85 110 100 - 140 150 - 200
NZ - Auckland45 55 70 100 130 18040 - 55 45 - 60 60 - 80 90 - 130 110 - 155 160 - 220
NZ - Wellington45 50 70 85 115 15040 - 55 40 - 60 60 - 80 70 - 120 85 - 140 130 - 180
NZ - Christchurch45 50 70 90 115 15040 - 55 40 - 60 60 - 80 70 - 120 85 - 140 130 - 180
Event Coordinator
Event Manager
Graphic Designer
Brand Manager
Campaign Manager
Product Manager
NSW - Sydney65 90 90 110 100 11055 - 75 80 - 110 65 - 110 90 - 130 90 - 140 90 - 140
VIC - Melbourne65 90 80 100 110 11055 - 70 80 - 110 60 - 90 90 - 120 90 - 140 90 - 130
QLD - Brisbane55 75 65 90 90 9045 - 65 60 - 90 60 - 75 80 - 110 80 - 110 80 - 110
SA - Adelaide60 80 55 75 75 8555 - 75 75 - 100 55 - 70 75 - 90 60 - 90 75 - 100
NT - Darwin60 80 70 70 75 8550 - 70 65 - 100 60 - 90 60 - 90 65 - 85 70 - 95
WA - Perth60 85 80 100 95 10055 - 75 75 - 95 65 - 90 80 - 110 80 - 110 80 - 110
ACT - Canberra65 90 70 90 95 9060 - 70 80 - 100 60 - 80 85 - 95 90 - 100 80 - 100
NZ - Auckland60 80 65 90 80 9550 - 75 60 - 100 50 - 90 80 - 110 70 - 100 80 - 120
NZ - Wellington60 80 60 80 80 8550 - 70 60 - 100 40 - 80 70 - 110 70 - 90 75 - 110
NZ - Christchurch60 80 60 80 80 8050 - 70 60 - 100 40 - 80 70 - 105 70 - 85 70 - 100

2018 Hays Salary Guide | 89
• All salaries shown are exclusive of superannuation (AU) or KiwiSaver (NZ)
• New Zealand salaries are represented in New Zealand dollars
NOTES:
MARKETING & DIGITAL
Research Executive/ Marketing Analyst
Direct Marketing Executive
Direct Marketing Manager
Advertising Executive
Advertising Manager
Internal Communications Advisor
NSW - Sydney100 85 110 75 120 10070 - 130 70 - 100 100 - 130 70 - 90 100 - 130 80 - 110
VIC - Melbourne100 75 100 70 90 11075 - 125 70 - 85 90 - 120 55 - 75 80 - 120 75 - 140
QLD - Brisbane80 80 85 70 90 7575 - 100 70 - 85 70 - 100 60 - 80 80 - 100 65 - 90
SA - Adelaide65 65 85 60 80 7555 - 70 55 - 75 80 - 100 55 - 75 75 - 90 60 - 95
NT - Darwin80 85 90 70 80 8070 - 90 75 - 95 80 - 100 65 - 85 70 - 90 70 - 100
WA - Perth80 75 90 75 95 8070 - 95 65 - 90 80 - 110 65 - 85 85 - 110 70 - 90
ACT - Canberra80 90 90 65 90 8070 - 90 80 - 110 80 - 100 60 - 70 70 - 90 65 - 100
NZ - Auckland70 80 95 70 100 8060 - 80 70 - 90 85 - 110 60 - 80 80 - 120 70 - 100
NZ - Wellington70 80 90 60 90 8060 - 80 70 - 90 80 - 110 50 - 70 80 - 120 60 - 110
NZ - Christchurch70 80 80 70 85 8060 - 80 65 - 90 70 - 110 65 - 90 70 - 100 65 - 95
It’s not hard to see the appeal of the top marketing job. But how do you get there? Find out in our report ‘The DNA of a Marketing Director’. Download your copy now.
hays.com.au/marketing-director hays.net.nz/marketing-director

90 | 2018 Hays Salary Guide
• All salaries shown are exclusive of superannuation (AU) or KiwiSaver (NZ)
• New Zealand salaries are represented in New Zealand dollars
NOTES:
MARKETING & DIGITAL
MARKETINGCommunications Advisor
Communications Manager
Major Gifts Manager
Direct Marketing Fundraising
Sponsorship/Fundraising Manager
Sponsorship/Fundraising Director
NSW - Sydney90 110 120 80 110 15080 - 110 100 - 130 100 - 140 60 - 80 90 - 130 140 - 180
VIC - Melbourne80 100 100 75 90 15070 - 90 90 - 130 80 - 130 65 - 85 80 - 120 140 - 180
QLD - Brisbane75 100 70 70 85 10565 - 90 90 - 110 60 - 85 60 - 85 70 - 100 90 - 120
SA - Adelaide85 105
N/A N/A85
N/A80 - 90 95 - 120 80 - 95
NT - Darwin80 95 80 75 80 10070 - 100 80 - 120 70 - 90 65 - 90 70 - 90 90 - 110
WA - Perth85 100 80 75 90 12075 - 90 90 - 110 75 - 90 65 - 80 75 - 100 95 - 130
ACT - Canberra100 100 100 70 85 12590 - 110 90 - 130 95 - 120 65 - 85 80 - 90 115 - 160
NZ - Auckland70 100
N/A70 85 100
60 - 90 90 - 130 60 - 80 70 - 100 90 - 120
NZ - Wellington80 90
N/A65 80 100
55 - 110 80 - 120 50 - 75 60 - 100 80 - 120
NZ - Christchurch80 90
N/A65 80 100
65 - 90 80 - 120 60 - 80 55 - 100 80 - 120
Bid Coordinator Bid Writer Bid Manager
NSW - Sydney80 110 14570 - 90 95 - 130 130 - 200
VIC - Melbourne80 110 14570 - 90 95 - 130 130 - 200
QLD - Brisbane55 55 7545 - 60 50 - 60 70 - 80
SA - Adelaide80 90
70 - 85 80 - 100 90 - 130
NT - Darwin70 80 9060 - 80 70 - 90 80 - 110
WA - Perth70 80 11060 - 80 65 - 90 90 - 120
ACT - Canberra N/A N/A N/A
NZ - Auckland60 80 9050 - 70 70 - 90 80 - 120
NZ - Wellington60 80 9050 - 70 70 - 90 80 - 110
NZ - Christchurch60 80 9050 - 70 65 - 90 75 - 110

2018 Hays Salary Guide | 91
• All salaries shown are exclusive of superannuation (AU) or KiwiSaver (NZ)
• New Zealand salaries are represented in New Zealand dollars
NOTES:
MARKETING & DIGITAL
DIGITALeCommerce Specialist
eCommerce Manager
Online Manager
Online Marketing Manager
Digital Project Manager
Digital Marketing Coordinator
NSW - Sydney90 130 110 120 120 6580 - 100 110 - 160 90 - 130 100 - 140 100 - 140 50 - 70
VIC - Melbourne80 130 100 100 120 7080 - 100 100 - 150 90 - 120 90 - 120 100 - 140 60 - 80
QLD - Brisbane85 90 85 90 90 8075 - 90 80 - 100 80 - 90 80 - 100 85 - 105 70 - 90
SA - Adelaide N/A90 85 90 90 6080 - 100 80 - 90 75 - 100 85 - 105 55 - 70
NT - Darwin80 90 95 90 100 8075 - 90 80 - 100 80 - 120 80 - 110 90 - 120 70 - 100
WA - Perth110 125 100 110 95 70100 - 120 100 - 150 75 - 120 90 - 130 80 - 110 60 - 80
ACT - Canberra105 130 100 95 125 8090 - 120 100 - 150 90 - 120 90 - 100 100 - 140 70 - 90
NZ - Auckland60 140 100 110 110 4550 - 80 125 - 150 80 - 110 100 - 120 80 - 120 40 - 55
NZ - Wellington60 130 95 90 90 4550 - 80 120 - 140 80 - 110 80 - 100 80 - 100 40 - 55
NZ - Christchurch65 110 80 90 85 4550 - 80 90 - 140 55 - 100 80 - 100 75 - 100 40 - 55
Digital Marketing Executive
Digital Producer
Digital Designer
Digital Marketing Manager
Multimedia Developer
Web Content Developer
NSW - Sydney90 100 90 130
N/A85
80 - 100 80 - 120 80 - 100 100 - 200 70 - 95
VIC - Melbourne90 95 90 140
N/A70
85 - 100 80 - 130 70 - 100 100 - 180 65 - 85
QLD - Brisbane80 85 85 100 70 7075 - 90 70 - 95 70 - 95 90 - 120 60 - 80 60 - 80
SA - Adelaide70 65 70 10060 - 80 60 - 80 60 - 80 90 - 110 75 - 85 75 - 90
NT - Darwin80 80 70 100 80 7570 - 90 70 - 95 60 - 90 80 - 120 70 - 95 65 - 90
WA - Perth90 85 70 120 75 7580 - 100 75 - 90 65 - 80 100 - 140 65 - 85 65 - 85
ACT - Canberra90 80 80 140 75 7580 - 100 70 - 90 70 - 90 100 - 180 60 - 90 65 - 85
NZ - Auckland70 90 90 110 70 7055 - 80 70 - 110 80 - 120 100 - 125 60 - 80 60 - 80
NZ - Wellington65 90 75 100 70 7050 - 80 70 - 110 60 - 85 90 - 120 60 - 80 60 - 80
NZ - Christchurch55 80 75 90 80 7050 - 70 65 - 100 55 - 85 70 - 110 60 - 90 60 - 80

92 | 2018 Hays Salary Guide
• All salaries shown are exclusive of superannuation (AU) or KiwiSaver (NZ)
• New Zealand salaries are represented in New Zealand dollars
NOTES:
MARKETING & DIGITAL
DIGITALWeb Content Editor
Website Manager
SEO Specialist
SEM Specialist
Optimization/Conversion Specialist Content Writer
NSW - Sydney80 110 85 80 100 8570 - 90 90 - 120 70 - 95 70 - 90 90 - 150 75 - 95
VIC - Melbourne70 100 80 80 100 8065 - 85 90 - 120 70 - 100 70 - 100 90 - 130 60 - 90
QLD - Brisbane70 90 85 80 80 7060 - 80 80 - 100 70 - 100 70 - 90 70 - 90 60 - 80
SA - Adelaide70 80 75 80 75 7570 - 80 70 - 90 65 - 85 70 - 90 65 - 85 70 - 85
NT - Darwin80 80 80 80 90 7570 - 95 70 - 100 70 - 100 70 - 90 80 - 100 65 - 90
WA - Perth75 90 85 95 90 7565 - 85 75 - 105 75 - 95 80 - 105 85 - 100 65 - 85
ACT - Canberra75 100 90 90 85 8560 - 80 90 - 110 80 - 110 80 - 100 75 - 110 75 - 95
NZ - Auckland70 80 80 80 90 7060 - 80 70 - 90 70 - 90 70 - 90 80 - 100 65 - 75
NZ - Wellington70 75 60 60 80 6560 - 80 65 - 85 50 - 70 50 - 70 65 - 100 60 - 75
NZ - Christchurch70 75 70 80 80 6060 - 80 65 - 85 60 - 80 65 - 100 65 - 100 45 - 70
Digital Analyst
Digital Product Owner
Digital Channel Manager
Digital Strategy Manager
Social Media Coordinator
Social Media Executive
NSW - Sydney120 130 130 150 55 75100 - 140 110 - 150 110 - 150 110 - 180 50 - 65 65 - 80
VIC - Melbourne110 130 140 140 55 6590 - 130 120 - 150 120 - 160 100 - 180 50 - 60 60 - 75
QLD - Brisbane85 85 100 110 60 7070 - 100 70 - 95 90 - 120 100 - 120 55 - 65 65 - 75
SA - Adelaide70
N/A N/A110 60 75
65 - 80 100 - 120 55 - 70 70 - 80
NT - Darwin75 80 90 110 65 7065 - 90 70 - 90 80 - 100 100 - 120 55 - 75 60 - 80
WA - Perth75 90 100 120 75 8565 - 85 80 - 100 90 - 110 100 - 150 65 - 85 75 - 90
ACT - Canberra95 110 100 120 60 7080 - 110 100 - 120 90 - 110 90 - 160 50 - 70 60 - 80
NZ - Auckland80 130 95 150 50 6065 - 100 110 - 150 85 - 115 140 - 160 40 - 55 55 - 70
NZ - Wellington80 130 90 135 50 6065 - 100 110 - 150 70 - 105 125 - 150 40 - 55 55 - 70
NZ - Christchurch80 120 85 120 45 6065 - 100 100 - 150 65 - 100 100 - 140 40 - 55 55 - 70

2018 Hays Salary Guide | 93
• All salaries shown are exclusive of superannuation (AU) or KiwiSaver (NZ)
• New Zealand salaries are represented in New Zealand dollars
NOTES:
MARKETING & DIGITAL
DIGITALSocial Media Manager CRM Manager
PR Coordinator PR Executive PR Manager PR Director
NSW - Sydney110 100 65 80 110 15090 - 150 80 - 130 55 - 75 75 - 90 85 - 130 130 - 160
VIC - Melbourne110 100 65 75 110 14090 - 150 80 - 130 60 - 70 70 - 80 80 - 130 130 - 160
QLD - Brisbane85 80 50 70 90 12075 - 95 70 - 90 40 - 60 60 - 80 80 - 100 100 - 130
SA - Adelaide85 75 60 75 90 12575 - 95 70 - 90 55 - 65 60 - 85 85 - 120 80 - 130
NT - Darwin90 85 70 80 90 10070 - 100 70 - 95 60 - 80 70 - 90 80 - 100 90 - 120
WA - Perth100 100 75 80 100 13590 - 115 90 - 110 65 - 85 70 - 90 85 - 115 120 - 150
ACT - Canberra110 100 55 85 100 13090 - 140 80 - 130 50 - 60 80 - 90 90 - 110 120 - 140
NZ - Auckland110 100 60 70 90 15085 - 140 90 - 110 50 - 70 60 - 80 70 - 110 120 - 160
NZ - Wellington90 95 55 60 80 13570 - 120 90 - 110 45 - 65 55 - 75 70 - 105 100 - 160
NZ - Christchurch90 90 50 60 80 13570 - 120 65 - 100 40 - 70 55 - 75 65 - 100 100 - 160
Media Relations Manager
Corporate Relations Executive
Corporate RelationsManager
NSW - Sydney100 80 12090 - 120 70 - 90 100 - 150
VIC - Melbourne100 75 12090 - 120 70 - 85 90 - 150
QLD - Brisbane90 75 9080 - 110 70 - 85 80 - 110
SA - Adelaide100 75 9590 - 110 70 - 85 80 - 110
NT - Darwin90 80 9075 - 110 70 - 90 80 - 100
WA - Perth100 75 10085 - 120 65 - 85 85 - 120
ACT - Canberra100 90 13590 - 110 85 - 110 95 - 140
NZ - Auckland100 75 12090 -120 70 - 90 100 - 140
NZ - Wellington90 75 12070 - 120 70 - 90 100 - 140
NZ - Christchurch85 70 10070 - 120 65 - 85 85 - 140

94 | 2018 Hays Salary Guide
SALA
RY IN
FOR
MAT
ION
: RET
AIL
AUSTRALIAThe 2017-18 financial year witnessed steady growth across Australia’s retail sector, with a number of businesses producing strong results, particularly over the Christmas period, and international brands entering the local market. Confidence consequently returned to retail professionals and consumers alike, and led to competition for store and head office talent.
Another major trend was the continuous growth of e-commerce retailers. Traditional retailers responded by developing e-commerce head office teams and adding digital responsibilities to traditional bricks and mortar roles. Consequently retail professionals with digital development and marketing expertise are in high demand. This has not led to salary pressure though, with candidates instead focused on the opportunity to expand their skills and move into a hybrid role. The exception is retail candidates with prior experience or qualifications in ecommerce or digital marketing.
A major change for Sales Assistants and Assistant Store Managers is the move to a team-based commission structure so as to reduce competition between staff.
Retailers now offer a more attractive base salary and guaranteed commission, as well as a collaborative working environment.
Store Managers with experience implementing change within a store are in high demand. Despite this, salaries remain flat.
Head office salaries remain stable too, particularly for Buyers. The expansion of planning functions in the major retailers as well as a shortage of Merchandise Planners has however allowed the top talent to negotiate higher wages. As a result, counter offers will increase in 2018-19 as retail employers attempt to retain top Planners.
Merchandise Allocators will be needed too, with the best candidates able to command competitive salaries.
In an interesting trend, Customer Service and Client Relationship Manager roles have been introduced to enhance aftercare, relationship development and repeat business in fashion.
Changes to the lists of eligible occupations for skilled visas have led to retailers focusing on developing existing staff into roles once filled by international talent.
In 2018-19 retailers will improve their staff retention strategies as innovative and digitally advanced international competitors enter the Australian market.
The expansion of planning functions in the major retailers as well as a shortage of Merchandise Planners has allowed the top talent to negotiate higher wages.
“
”
RETAIL
NOTES:• All salaries shown are exclusive of superannuation
MERCHANDISE PLANNINGMerchandise Assistant
Assistant Planner
Merchandise Planner
Senior Merchandise Planner
Planning Manager
Group Planning Manager/ Director
Sydney 50 - 60 60 - 75 75 - 125 100 - 140 125 - 200 150 - 350
Melbourne 45 - 55 60 - 75 80 - 100 100 - 140 125 - 200 150 - 350
BUYINGBuying Assistant
Assistant Buyer Buyer Senior Buyer
Buying Manager
Merchandise Manager/Buying Director
Sydney 50 - 60 60 - 75 80 - 130 90 - 150 125 - 200 150 - 400
Melbourne 50 - 60 60 - 75 80 - 100 90 - 150 125 - 200 150 - 400

2018 Hays Salary Guide | 95
NOTES:• All salaries shown are exclusive of superannuation
RETAIL
DESIGN Assistant Designer Designer
Senior Designer
Head of Design/Creative Director
Sydney 50 - 60 60 - 125 90 - 150 120 - 250
Melbourne 50 - 60 80 - 150 100 - 180 180 - 250
PRODUCT DEVELOPMENT & TECHNICALPattern Cutter
Garment Technician/QA
Assistant Product Developer
Product Developer
Product Development Manager
Sydney 60 - 90 50 - 85 50 - 65 60 - 90 85 - 125
Melbourne 60 - 90 50 - 85 50 - 65 60 - 90 85 - 125
VISUAL MERCHANDISING VMCoordinator
Store Visual Merchandiser
Area Visual Merchandiser State VM
National VM Manager
Sydney 45 - 55 42 - 55 45 - 80 65 - 100 80 - 200
Melbourne 45 - 55 42 - 55 45 - 80 65 - 100 80 - 200
OPERATIONSIn-store SalesProfessional
Assistant SM/2IC(Turnover up $2 m)
Assistant SM/2IC(Turnover $2-5 m)
Assistant SM/2IC (Turnover $5-10 m)
Assistant SM/2IC (Turnover $10-20 m)
Assistant SM/2IC (Turnover $20+ m)
Sydney 45 - 55 42 - 50 50 - 55 50 - 75 65 - 90 75 - 100
Melbourne 45 - 55 50 - 55 60 - 65 50 - 75 65 - 90 75 - 100
Store Manager(Turnover up $2 m)
Store Manager (Turnover $2-5 m)
Store Manager (Turnover $5-10 m)
Store Manager (Turnover $10-20 m)
Store Manager (Turnover $20+ m)
Cluster/ Area Manager 5–10 Stores
Sydney 45 - 60 50 - 70 70 - 110 80 - 115 90 - 125 60 - 85
Melbourne 45 - 60 50 - 70 65 - 110 80 - 115 90 - 125 60 - 85
Area/Regional Manager10-20 Stores
Area/Regional Manager 20+ Stores State Manager
Big Box - Multi-site 5–10 Stores
Big Box - Multi-site 11–20 Stores
Big Box - Multi-site 20+ Stores
Sydney 70 - 110 90 - 150 80 - 150 75 - 150+ 85 - 180 120 - 200
Melbourne 70 - 110 90 - 150 80 - 150 75 - 150+ 85 - 180 120 - 200
HEAD OFFICE
Loss Prevention Manager
E-Commerce Manager
National Operations Manager
Retail Director
General Manager
Sydney 80 - 120 85 - 200 150 - 300 150 - 400 200 - 500+
Melbourne 80 - 120 90 - 200 150 - 300 150 - 400 200 - 500+

96 | 2018 Hays Salary Guide
SALA
RY IN
FOR
MAT
ION
: LO
GIS
TICS
AUSTRALIAAcross Australia’s warehousing, transport and supply chain markets, a key theme has been positive productivity linked to efficiency improvements. Logistics companies have therefore been targeting multi-skilled candidates who have a strong knowledge of systems and processes. They must also have a proven track record in reducing costs, the ability to achieve demanding KPIs, and diverse experience.
Add the requirement for a wider technical skill set and the ability to meet compliance and OH&S regulations for those in management roles, and it is surprising that salaries have not increased in line with rising employer expectations. How long this can continue remains to be seen.
Turning to the transport industry specifically, we have seen an active market for transport professionals, particularly in Victoria and New South Wales where infrastructure is strained. While the improvement and expansion of transport networks will add value to the logistics industry, for now growing pressure on Sydney and Melbourne’s infrastructure and increasing employer demands are fuelling the need for Transport Allocators. After all, a strong Transport Allocator plays a key role in helping transport companies win million dollar contracts.
Salaries have increased in response to demand, reaching up to $85,000 plus superannuation.
Lateral thinking Transport Coordinators and Managers who can cope with pressure are also in demand. Companies have likened the transport room to that of a Wall Street trading floor, where one wrong decision can cost a company potentially millions of dollars.
Within warehouse and distribution, improved activity in late 2017-18 has led to demand for Warehouse Managers/Supervisors, import and export Coordinators and Dispatch Coordinators. The expectations of employers regarding candidate systems and general knowledge have also risen. Employers now prefer degree qualified candidates with a supporting technical background, which decreases the talent pool and highlights the importance for professionals of continuous learning.
Demand also exists from SMEs for inventory control professionals who can develop procedures to improve inventory accuracy and transparency. Despite growing demand for such professionals, employers continue to keep a tight rein on salaries.
This has led to attraction and retention challenges for employers, a significant issue when companies are committed to driving operational efficiencies.
Candidate movement at the senior level, particularly Heads of Logistics, Transport Managers/Planners and Distribution Managers, has been minimal. However this is expected to change in 2018-19 as senior professionals become more aware of the opportunities presented by industry growth. This could also be the catalyst that prompts employers to increase salaries to retain their top talent.
Within the supply chain market, the value of a robust and transparent supply chain has seen sales and operations planning (S&OP) processes come to the fore. This has created demand for quality Supply and Demand Planners who have worked with complex manual based systems, have exposure to and assisted with the
development of S&OP processes, and can influence and educate internal stakeholders across an organisation. Salaries for such professionals are competitive given the drive from employers to secure the best available talent in this area.
Demand exists from SMEs for inventory control professionals who can develop procedures to improve inventory accuracy and transparency.
“
”
Within the supply chain market, the value or a robust and transparent supply chain has seen sales and operations planning (S&OP) processes come to the fore.
“
”
LOGISTICS

2018 Hays Salary Guide | 97
NOTES:• All salaries shown are exclusive of superannuation
• Supply Chain salaries are related solely to this function within Logistics, not Procurement
LOGISTICS
WAREHOUSE/DISTRIBUTIONOperations Manager
Distribution Centre Manager
Project Manager
Warehouse Manager
Warehouse Supervisor
NSW - Sydney135 120 110 95 75120 - 150 110 - 130 100 - 120 80 - 110 65 - 85
WA - Perth100 115 100 90 6585 - 120 100 - 130 80 - 120 75 - 110 55 - 85
VIC - Melbourne100 120 110 90 7090 - 120 110 - 130 100 - 120 80 - 110 55 - 80
QLD - Brisbane95 100 110 80 6080 - 110 100 - 120 90 - 135 65 - 90 55 - 75
SA - Adelaide80 75 80 70 5575 - 100 70 - 100 70 - 90 55 - 80 45 - 65
ACT - Canberra95 110 90 75 6075 - 110 100 - 120 75 - 100 65 - 85 55 - 70
NT - Darwin100 85 90 85 7085 - 120 75 - 110 80 - 110 80 - 90 65 - 75
Contract/Account Manager
Warehouse Coordinator
Stock/Inventory Controller Storeperson
NSW - Sydney90 60 70 5580 - 110 55 - 70 65 - 75 45 - 55
WA - Perth100 60 75 5080 - 120 50 - 70 50 - 100 40 - 55
VIC - Melbourne100 50 60 4590 - 120 40 - 55 55 - 70 40 - 50
QLD - Brisbane80 50 60 4065 - 90 45 - 60 45 - 75 35 - 50
SA - Adelaide90 45 45 4075 - 110 45 - 60 40 - 65 35 - 50
ACT - Canberra80 50 60 4065 - 90 45 - 60 45 - 75 35 - 50
NT - Darwin100 55 60 5280 - 120 45 - 64 50 - 70 48 - 55
TRANSPORTOperations Manager
Transport Manager
Contract/Account Manager
Transport Analyst Fleet Manager
Fleet Controller
NSW - Sydney130 135 90 65 85 75120 - 150 120 - 165 80 - 100 55 - 75 80 - 90 65 - 85
WA - Perth130 120 110 65 85 70100 - 120 80 - 160 90 - 130 55 - 85 70 - 100 55 - 85
VIC - Melbourne110 120 100 65 80 7090 - 140 100 - 130 90 - 120 60 - 75 70 - 100 60 - 90
QLD - Brisbane110 80 80 64 75 6075 - 130 75 - 90 75 - 90 55 - 75 65 - 80 55 - 70
SA - Adelaide80 80 80 50 65 5075 - 90 75 - 90 75 - 90 40 - 55 60 - 75 45 - 55
ACT - Canberra90 75 80 55 75 6075 - 110 65 - 85 75 - 90 45 - 60 65 - 80 55 - 70
NT - Darwin100 90 100 65 80 6585 - 120 80 - 110 80 - 120 55 - 80 70 - 90 55 - 80

98 | 2018 Hays Salary Guide
NOTES:• All salaries shown are exclusive of superannuation
• Supply Chain salaries are related solely to this function within Logistics, not Procurement
LOGISTICS
SUPPLY CHAIN Demand PlannerSupply Chain Analyst
Supply Chain Planner
Supply Chain Manager
Supply Chain Director
NSW - Sydney100 75 85 135 18580 - 110 65 - 85 75 - 90 120 - 165 160 - 205
WA - Perth85 80 80 130 18070 - 110 65 - 110 65 - 100 100 - 160 160 - 200
VIC - Melbourne90 70 75 130 17580 - 110 60 - 85 70 - 85 120 - 150 150 - 200
QLD - Brisbane75 75 70 130 14570 - 85 60 - 85 60 - 85 110 - 140 135 - 165
SA - Adelaide60 60 55 105 13255 - 75 55 - 70 45 - 65 90 - 120 125 - 140
ACT - Canberra70 70 60 120 15065 - 80 55 - 75 55 - 70 110 - 140 135 - 165
NT - Darwin70 80 70 130 14065 - 80 70 - 100 50 - 85 110 - 145 110 - 165
TRANSPORT MR/HR Driver HC/MC Driver Mechanic
NSW - Sydney55 55 7045 - 60 50 - 65 60 - 75
WA - Perth55 65 7045 - 60 55 - 85 60 - 85
VIC - Melbourne55 55 6845 - 60 50 - 65 60 - 75
QLD - Brisbane50 55 6545 - 60 50 - 65 60 - 75
SA - Adelaide50 65 6840 - 60 55 - 80 60 - 75
ACT - Canberra N/A N/A N/A
NT - Darwin54 58 7553 - 55 55 - 60 70 - 80
INTERNATIONAL TRADE
Logistics Manager/Branch Manager
Customer/Account Managers
Operations/Customs
Logistics/ Operations Supervisors
Import/Export Documentation Clerks
NSW - Sydney120 85 80 70 65110 - 140 75 - 90 75 - 90 60 - 90 60 - 70
WA - Perth135 80 75 80 55110 - 165 65 - 90 65 - 90 70 - 95 45 - 70
VIC - Melbourne115 70 80 70 55110 - 145 60 - 85 70 - 90 65 - 90 50 - 65
QLD - Brisbane110 65 80 75 45100 - 140 50 - 80 65 - 110 65 - 90 35 - 50
SA - Adelaide110 60 80 75 45110 - 145 50 - 85 65 - 110 65 - 90 40 - 50
ACT - Canberra90 55 65 70 3780 - 130 45 - 75 60 - 90 60 - 80 37 - 45
NT - Darwin125 85 82 90 65100 - 150 65 - 95 75 - 90 80 - 110 55 - 75

2018 Hays Salary Guide | 99
SALA
RY IN
FOR
MAT
ION
: PRO
CURE
MEN
T
AUSTRALIACost and efficiency improvements were key focuses of 2017-18, with technological advances offering decision makers greater visibility and control of their costs and contracts. This led to increased demand for procurement professionals and, in turn, heightened skill shortages.
In response, private sector employers now elect to secure top talent long-term in permanent positions. Meanwhile temporary and contract recruitment remains the focus in the public sector, particularly in the ACT.
Vacancy activity and skill shortages are high in the Eastern Seaboard, particularly for Category Managers with end-to-end procurement skills as teams become strategically focused on adding value and saving costs. The top talent have secured higher salaries, but this has come with greater expectations to generate value and make an impact across a business.
In terms of the active industries, professional and services organisations have seen rising demand for procurement experts, while the marketing and ICT categories are busy. This demand has led to higher salaries, but again also higher performance expectations. Having said this, employers who have not adjusted their salary expectations in response to demand, particularly for skilled ICT category specialists and in the professional and services sectors, struggle to secure top talent.
Furthermore, procurement professionals with construction and engineering experience remain in demand, particularly in NSW and Victoria where organisations are attracting candidates with relevant industry experience from interstate and offering higher salaries to facilitate their relocation. Candidates without industry experience but transferable skills receive standard salary offers.
In Western Australia and Queensland’s resources and mining market, steady demand is evident for Category Managers. In response, salaries have risen and hourly rate contracts are being replaced with fixed-term roles. Despite this, Western Australia struggles to attract back qualified professionals who relocated during the downturn.
Purchasing teams remain lean and offshoring continues. This has seen transactional roles decrease in many industries across Australia.
Turning to the public sector, vacancy activity remains positive in the ACT with temporary contractors across the APS5 and APS6 level in greatest demand. To be successful candidates require prior experience providing procurement advice in line with the Commonwealth Procurement Rules or supporting or leading a tender process around service contracts.
Given the public sector’s fixed salary bandings, permanent salaries are not a reflection of demand. However hourly rates have increased in response to the shortage of contractors at the support level for short-term assignments.
As our 2018 DNA of a CPO report showed, hiring managers across the public and private sectors increasingly look at a candidates soft skills in addition to technical skills, including stakeholder management, commercial acumen and the ability to influence. While such skills were not sought five years ago, today being responsive, agile and open to change are essential. Cultural fit is essential too.
For their part, jobseekers look for a role offering professional development, additional exposure, a step up and a salary increase.
Looking ahead, a positive outlook will add to skill shortage pressures, making retention and employee engagement increasing priorities for employers.
NEW ZEALANDThe increasing number of long-term contract roles was a key trend of the past
year. These roles often involved additional responsibilities. Add the skills shortage, and daily rates increased in order to attract suitable procurement professionals.
Contract lengths increased too, with 12 month and two-year contracts offered to provide some level of job security for candidates moving from permanent roles. These candidates often found that the variety of assignments also led to career progression.
In terms of procurement skills in demand, those with end-to-end procurement experience are sought. The need to manage internal customers and build long-term strategic relationships with suppliers has fuelled a requirement for candidates who also possess relationship building and stakeholder management skills.
Procurement experts with strong category management experience are in demand too, particularly if they possess an IT, property or construction background.
An increase in offshoring, particularly in manufacturing, has created high demand for procurement professionals with international exposure and supply chain experience. Meanwhile, the automation and digitisation of the supply chain will see demand rise for professionals with e-commerce experience this year.
Sustainability is another focus. Consequently those with relevant experience will have a lot of value to add over the next 12 months.
As our 2018 DNA of a CPO report showed, hiring managers across the public and private sectors increasingly look at a candidates soft skills in addition to technical skills.
“
”
Procurement experts with strong category management experience are in demand, particularly if they possess an IT, property or construction background.
“
”
PROCUREMENT

100 | 2018 Hays Salary Guide
NOTES:• All salaries shown are exclusive of superannuation (AU)
or KiwiSaver (NZ)
• New Zealand salaries are represented in New Zealand dollars
• Supply Chain salaries are related solely to this function within Procurement, not Logistics
PROCUREMENT
Procurement Officer
Senior Procurement Officer
Procurement Manager
Strategic Sourcing Manager
Chief Procurement Officer
NSW - Sydney65 80 140 135 25560 - 70 65 - 90 110 - 160 110 - 165 200+
VIC - Melbourne65 85 135 140 25055 - 80 75 - 105 100 - 160 110 - 160 200+
QLD - Brisbane60 65 110 125 16555 - 70 60 - 80 90 - 140 100 - 150 145+
SA - Adelaide55 65 120 110 23050 - 60 60 - 70 90 - 120 90 - 165 135+
WA - Perth60 80 130 130 180+45 - 75 60 - 90 100 - 170 110 - 185 180+
ACT - Canberra70 90 120 110 15065 - 80 80 - 110 100 - 150 90 - 120 130 - 170
NT - Darwin60 65 100 110 23055 - 65 60 - 70 80 - 120 90 - 165 135+
New Zealand70 85 125 13060 - 80 70 - 100 110 - 150 110 - 150 150 - 200+
Purchasing Analyst
Materials Manager
Purchasing Manager
Category Manager
Contract Administrator
Contract Manager
NSW - Sydney75 80 90 135 80 12065 - 85 65 - 90 80 - 110 100 - 170 75 - 90 90 - 140
VIC - Melbourne70 80 100 140 80 12070 - 100 65 - 90 80 - 120 100 - 170 75 - 90 90 - 155
QLD - Brisbane75 80 100 110 80 10055 - 90 65 - 100 90 - 120 75 - 135 65 - 110 80 - 120
SA - Adelaide70 80 90 110 70 10060 - 75 65 - 90 75 - 110 80 - 110 65 - 85 90 - 110
WA - Perth70 90 110 130 90 14060 - 80 80 - 100 100 - 130 110 - 150 80 - 120 120 - 160
ACT - Canberra70
N/A90 100 80 120
70 - 80 80 - 110 100 - 120 80 - 90 110 - 140
NT - Darwin70 80 90 110 70 10060 - 75 65 - 90 75 - 110 80 - 110 65 - 85 90 - 110
New Zealand70 85 100 120 65 10060 - 80 70 - 100 90 - 120 100 - 130 60 - 70 80 - 120
In our report ‘The DNA of a CPO’ we aim to provide aspiring CPOs in Australia & New Zealand with insight on how they can reach the top procurement job. Download your copy now.
hays.com.au/cpo hays.net.nz/cpo

2018 Hays Salary Guide | 101
SALA
RY IN
FOR
MAT
ION
: LEG
AL
AUSTRALIAAn increase in specialist demands and a high number of vacancies are the dominant themes of Australia’s legal jobs sector at present thanks to buoyant activity from boutique, mid-tier and national firms and an improved in-house market.
Starting with private practice, constant demand remains for Lawyers with 3-8 years PAE across most areas, particularly commercial property, commercial litigation, construction, construction litigation and family law. Candidates however continue to gravitate to in-house roles, adding to demand.
Experienced Partners with portable practices are also highly sought since many firms hinge their expansion plans on individuals bringing business with them.
Migration Agents and Immigration Lawyers are another area of demand as immigration changes are implemented and organisations deal with the implications.
There is also a major focus on Commercial and Probity capability, with ICT procurement expertise within a Commonwealth capacity considered ideal.
There has been limited salary movement in private practice due to an oversupply of graduates. Conveyancing staff are the exception, with more mid-tier firms outsourcing requirements to boutiques. Top tier firms offer higher salaries for sought-after skills, especially in corporate and banking & finance.
Professional level staff salaries are unchanged.
Looking ahead, we expect a continued buoyant market with heightened demand for specialist law professionals with two or more years of PAE in commercial property and litigation, family law and conveyancing.
Turning to the in-house market, specialist and niche lawyers continue to secure most roles.
Construction & Property Lawyers are in greatest demand, particularly in NSW in response to the number of transport infrastructure, residential, commercial and retail development projects. Lawyers with three to five years’ PAE are in demand in
all areas of private practice as are Senior Lawyers with seven to nine years’ PAE.
Contracts continue to be offered to fill short to medium term gaps and assist with workload fluctuations. Over the past year senior candidates with 10 or more years’ PAE have become comfortable taking such assignments.
As the commercial sector continues to grow legal departments will strengthen, particularly at Legal Counsel and Senior Associate levels.
In-house salaries have dropped slightly as candidate interest outweighs the number of vacancies. At the senior level, a number of candidates are prepared to accept a reduced salary for an in-house role that offers career progression, exposure to a preferred industry or work-life balance.
Across the public sector, Freedom of Information Officers remain in demand along with candidates from strong privacy law backgrounds. Legal Policy Officers skilled in legislation development and drafting will be in continued demand. Employers look for skilled Lawyers with government experience due to policy and legislative changes.
Steady demand also exists for Commercial Lawyers and Generalist Lawyers with in-house Government backgrounds. The majority of opportunities remain at the APS6 and EL1 levels, with candidates expecting to be paid at the higher end of the scale.
NEW ZEALAND2017-18’s legal market saw strong levels of vacancy activity, particularly for Property Lawyers with two or more years PQE to work on residential conveyancing transactions and commercial property work. Given demand, salaries increased as firms became more competitive.
Litigation job opportunities have also increased as project delays gave rise to contract breaches. This has absorbed the pool of Litigators looking for their next opportunity. Demand has also risen for Commercial Solicitors with five or more years PQE to support negotiations across the business community. However, demand has not translated into salary increases. Firms are instead promoting their reputation, the quality of their clients and the nature of the work they do to attract potential candidates.
Given the extent of candidate shortages across the legal sector, firms are starting to offer flexible working options where possible. Part-time hours and working offsite are very effective methods of attracting and retaining talent.
The shortage of legal talent has also seen employers consider candidates who do not have the complete skillset but can be trained into a role. For example, when recruiting for a commercial property role a firm may hire someone with residential conveyancing experience and up-skill them.
Attracting talent from overseas is another common strategy, particularly for larger firms due to the limited availability of skills and expertise in New Zealand.
Finally, counter offers will continue to be made in response to candidate shortages, despite the unsuccessful nature of these as a staff retention measure.
LEGAL
As the commercial sector continues to grow legal departments will strengthen, particularly at Legal Counsel and Senior Associate levels.
“
”
The shortage of legal talent has also seen employers consider candidates who do not have the complete skillset but can be trained into a role.
“
”

102 | 2018 Hays Salary Guide
LEGAL
PRIVATE PRACTICE - TOP TIER Paralegal Graduate 0 - 1 yrs P.A.E 1 - 2 yrs P.A.E 2 - 3 yrs P.A.E
NSW - Sydney59 59 64 73 8250 - 87 55 - 68 60 - 75 68 - 85 75 - 96
VIC - Melbourne64 55 64 73 7845 - 70 50 - 65 55 - 70 60 - 80 75 - 85
QLD - Brisbane55 55 62 68 7845 - 75 55 - 69 55 - 75 60 - 85 75 - 92
WA - Perth55 55 62 70 7845 - 73 55 - 64 55 - 68 65 - 79 75 - 89
ACT - Canberra57 57 62 70 8242 - 61 48 - 61 52 - 67 61 - 77 72 - 93
SA - Adelaide60 50 50 60 6550 - 75 48 - 57 48 - 57 55 - 64 57 - 70
NZ - Auckland50 50 55 60 7040 - 62 45 - 65 48 - 60 55 - 65 64 - 80
NZ - Christchurch/Wellington50 45 50 55 7040 - 58 43 - 60 45 - 60 50 - 62 65 - 80
3 - 4 yrs P.A.E 4 - 5 yrs P.A.E 5 - 6 yrs P.A.E 6+ yrs P.A.E
NSW - Sydney96 110 128 15582 - 114 91 - 128 114 - 146 128 - 164
VIC - Melbourne91 105 119 12880 - 100 90 - 125 100 - 145 120 - 155
QLD - Brisbane87 105 119 12880 - 103 87 - 130 96 - 145 110 - 164
WA - Perth88 105 119 12880 - 105 91 - 123 100 - 132 110 - 155
ACT - Canberra98 103 113 12782 - 103 93 - 118 103 - 134 108 - 155
SA - Adelaide80 95 110 12070 - 85 85 - 105 95 - 120 115 - 130
NZ - Auckland80 98 110 12574 - 90 82 - 112 90 - 135 105 - 140
NZ - Christchurch/Wellington75 90 100 12070 - 90 85 - 110 85 - 115 95 - 130
Senior Associate Special Counsel Salaried Partner Equity Partner
NSW - Sydney183 200+ 280+ 685+146 - 228
VIC - Melbourne155 210+ 250+ 500+130 - 210
QLD - Brisbane155 200+ 250+ 500+125 - 230 183 - 230
WA - Perth155 200+ 250+ 500+137 - 183 190 - 228
ACT - Canberra150 169+ 196+ 330+113 - 191
SA - Adelaide130 185 230+ 380+120 - 135 164 - 228
NZ - Auckland145 170+ 190+ 320+125 - 180
NZ - Christchurch/Wellington130 120+ 150+ 250+110 - 150
NOTES:
• All salaries shown are exclusive of superannuation (AU) or KiwiSaver (NZ)
* Salaries shown are including benefits and professional memberships
• P.A.E: Post admission experience
• The salary packages above have been compiled on the basis of information from top tier law firms within the CBD
• New Zealand salaries are represented in New Zealand dollars
• New Zealand figures are representative of those offered in larger commercial practices
• Equity partner salary is representative of profit drawing plus base and superannuation
• Parking• Health cover• Further education studies• Gym membership• Vehicle expenses• Bonuses• Laptops/mobile phone
POTENTIAL BENEFITS THAT MAY BE INCLUDED ON TOP OF BASE SALARIES SHOWN

2018 Hays Salary Guide | 103
LEGAL
NOTES:
• All salaries shown are exclusive of superannuation (AU) or KiwiSaver (NZ)
* Salaries shown are including benefits and professional memberships
• P.A.E: Post admission experience
• The salary packages above have been compiled on the basis of information from top tier law firms within the CBD
• New Zealand salaries are represented in New Zealand dollars
• Equity partner salary is representative of profit drawing plus base and superannuation
• Parking• Health cover• Further education studies• Gym membership• Vehicle expenses• Bonuses• Laptops/mobile phone
POTENTIAL BENEFITS THAT MAY BE INCLUDED ON TOP OF BASE SALARIES SHOWN
PRIVATE PRACTICE - MID TIER Paralegal Graduate 0 - 1 yrs P.A.E 1 - 2 yrs P.A.E 2 - 3 yrs P.A.E
NSW - Sydney55 50 59 64 7846 - 73 50 - 64 55 - 70 59 - 78 64 - 87
VIC - Melbourne55 50 55 64 7345 - 70 50 - 65 50 - 70 55 - 75 60 - 85
QLD - Brisbane55 50 55 64 7350 - 75 48 - 55 55 - 68 58 - 75 65 - 85
WA - Perth55 50 55 64 7341 - 68 48 - 59 55 - 64 59 - 68 64 - 78
ACT - Canberra52 57 61 70 8236 - 61 52 - 64 52 - 72 66 - 80 72 - 93
SA - Adelaide55 50 50 55 6545 - 60 48 - 55 45 - 55 50 - 60 60 - 70
NZ - Auckland48 48 53 58 6836 - 55 40 - 55 45 - 60 51 - 65 60 - 78
NZ - Christchurch/Wellington50 45 50 55 6540 - 55 40 - 55 45 - 57 48 - 62 60 - 75
3 - 4 yrs P.A.E 4 - 5 yrs P.A.E 5 - 6 yrs P.A.E 6+ yrs P.A.E
NSW - Sydney87 100 110 12873 - 96 87 - 119 100 - 132 110 - 146
VIC - Melbourne82 96 105 11970 - 95 75 - 110 90 - 130 100 - 135
QLD - Brisbane84 91 105 11975 - 92 85 - 110 95 - 130 110 - 140
WA - Perth84 95 105 11978 - 91 90 - 119 100 - 123 110 - 137
ACT - Canberra98 94 117 11382 - 103 90 - 108 103 - 123 103 - 132
SA - Adelaide75 85 95 10570 - 85 80 - 100 85 - 105 90 - 120
NZ - Auckland75 85 90 10568 - 85 75 - 95 75 - 100 85 - 120
NZ - Christchurch/Wellington75 80 85 10070 - 85 70 - 90 70 - 95 80 - 100
Senior Associate Special Counsel Salaried Partner Equity Partner
NSW - Sydney146 183+ 230+ 275+137 - 174
VIC - Melbourne137 180+ 220+ 274+125 - 165
QLD - Brisbane137 183 220+ 280+125 - 165 150 - 201
WA - Perth137 169 220+ 274+128 - 164 155 - 183
ACT - Canberra113 141 188+ 235+108 - 141 113 - 169
SA - Adelaide120 150+ 200+ 250+100 - 130
NZ - Auckland125 140+ 150+ 200+105 - 150
NZ - Christchurch/Wellington110 115+ 125+ 130+100 - 130

104 | 2018 Hays Salary Guide
LEGAL
NOTES:
• All salaries shown are exclusive of superannuation (AU) or KiwiSaver (NZ)
* Salaries shown are including benefits and professional memberships
• P.A.E: Post admission experience
• The salary packages above have been compiled on the basis of information from top tier law firms within the CBD
• New Zealand salaries are represented in New Zealand dollars
• Equity partner salary is representative of profit drawing plus base and superannuation
• Parking• Health cover• Further education studies• Gym membership• Vehicle expenses• Bonuses• Laptops/mobile phone
POTENTIAL BENEFITS THAT MAY BE INCLUDED ON TOP OF BASE SALARIES SHOWN
PRIVATE PRACTICE - SMALL PRACTICES Paralegal Graduate 0 - 1 yrs P.A.E 1 - 2 yrs P.A.E 2-3 yrs P.A.E
NSW - Sydney46 48 50 55 6441 - 68 48 - 55 46 - 60 50 - 73 59 - 82
VIC - Melbourne46 48 46 50 5942 - 60 48 - 50 45 - 60 45 - 65 50 - 80
QLD - Brisbane46 48 46 50 5950 - 75 48 - 50 48 - 60 50 - 64 55 - 75
WA - Perth46 48 46 50 5937 - 59 48 - 50 46 - 55 50 - 64 55 - 78
ACT - Canberra47 52 57 66 7536 - 57 48 - 61 52 - 61 61 - 70 70 - 84
SA - Adelaide55 48 50 52 6550 - 60 48 - 55 48 - 55 45 - 60 55 - 70
NZ - Auckland42 45 48 52 5835 - 60 35 - 50 38 - 52 40 - 58 45 - 70
NZ - Christchurch/Wellington50 45 50 50 6040 - 55 40 - 48 42 - 55 45 - 58 55 - 70
3 - 4 yrs P.A.E 4-5 yrs P.A.E 5 - 6 yrs P.A.E 6+ yrs P.A.E
NSW - Sydney73 83 91 10068 - 91 77 - 100 87 - 115 100 - 135
VIC - Melbourne73 75 83 10065 - 90 70 - 100 80 - 110 90 - 125
QLD - Brisbane73 75 83 9670 - 85 75 - 83 80 - 110 85 - 130
WA - Perth73 75 83 9668 - 82 67 - 91 79 - 109 79 - 117
ACT - Canberra84 88 98 10180 - 90 82 - 113 93 - 118 103 - 134
SA - Adelaide75 75 80 9060 - 80 65 - 80 75 - 95 80 - 100
NZ - Auckland65 72 78 9050 - 70 55 - 80 55 - 85 70 - 110
NZ - Christchurch/Wellington70 70 75 9065 - 80 65 - 80 70 - 85 80 - 100
Senior Associate Special Counsel Salaried Partner Equity Partner
NSW - Sydney109 142 185+ 230+110 - 155 146 - 174
VIC - Melbourne100 146 180+ 228+85 - 135 125 - 160
QLD - Brisbane100 142 180+ 228+90 - 145 133 - 160
WA - Perth100 142 180+ 228+91 - 142 125 - 150
ACT - Canberra103 137 141+ 169+103 - 134 103 - 155
SA - Adelaide100 145+ 160+ 180+90 - 120
NZ - Auckland100 130+ 150+ 180+85 - 120
NZ - Christchurch/Wellington105 115+ 120+ 120+95 - 120

2018 Hays Salary Guide | 105
LEGAL
NOTES:
• All salaries shown are exclusive of superannuation (AU) or KiwiSaver (NZ)
* Salaries shown are including benefits and professional memberships
• P.A.E: Post admission experience
• New Zealand salaries are represented in New Zealand dollars
• In-house lawyers in financial services would receive a bonus, not included in packages indicated
• Car• Parking • Gym memberships• Health cover• Vehicle expenses• Bonuses• Laptops/mobile phone• School fees• Interest free loans
POTENTIAL BENEFITS THAT MAY BE INCLUDED ON TOP OF BASE SALARIES SHOWN
IN-HOUSE Paralegal 0-1 yrs P.A.ELegal Counsel 1-2 yrs P.A.E
Legal Counsel 2-3 yrs P.A.E
Legal Counsel 3-4 yrs P.A.E
NSW - Sydney 46 - 87 55 - 60 60 - 75 70 - 95 82 - 110
VIC - Melbourne 45 - 75 45 - 50 55 - 75 60 - 85 75 - 100
QLD - Brisbane, Gold Coast & Sunshine Coast 46 - 78 46 - 55 55 - 75 60 - 80 73 - 100
WA - Perth 46 - 78 50 - 55 55 - 75 65 - 90 75 - 110
ACT - Canberra 42 - 80 61 - 70 70 - 75 75 - 80 80 - 94
SA - Adelaide 50 - 70 48 - 55 55 - 65 70 - 85 70 - 90
NZ - Auckland 40 - 60 49 - 65 56 - 70 66 - 85 76 - 95
NZ - Christchurch/Wellington 40 - 60 45 - 65 50 - 70 60 - 85 70 - 90
Legal Counsel 4-5 yrs P.A.E
Legal Counsel 5 - 6 yrs P.A.E
Legal Counsel 6+ yrs P.A.E
Senior Legal Counsel General Counsel
NSW - Sydney 91 - 130 110 - 142 119 - 164 140 - 201 183 - 274+
VIC - Melbourne 90 - 120 100 - 135 100 - 150 135 - 190 165+
QLD - Brisbane, Gold Coast & Sunshine Coast 80 - 110 90 - 120 105 - 148 110 - 180 180 - 350
WA - Perth 90 - 120 100 - 130 110 - 145 110 - 155 160 - 274+
ACT - Canberra 94 - 103 108 - 123 113 - 144 124 - 165 144+
SA - Adelaide 80 - 110 90 - 115 100 - 130 100 - 140 125+
NZ - Auckland 86 - 110 100 - 140 120 - 150 130 - 165 160+
NZ - Christchurch/Wellington 80 - 110 95 - 130 115 - 150 120 - 165 150+

106 | 2018 Hays Salary Guide
LEGAL
NOTES:• All salaries shown are exclusive of superannuation (AU) or KiwiSaver (NZ)
• Salaries shown are excluding bonus, as they greatly vary
• New Zealand salaries are represented in New Zealand dollars
COMPANY SECRETARIAL
Assistant Company Secretary (unlisted company)
Assistant Company Secretary (listed company)
Company Secretary (unlisted company)
Company Secretary (listed company)
NSW - Sydney 73 - 100 82 - 137 110 - 146 137 - 183+
VIC - Melbourne 75 - 100 80 - 130 110 - 145 135 - 185+
QLD - Brisbane, Gold Coast & Sunshine Coast 73 - 91 110 - 175 110 - 180 150 - 250+
WA - Perth 75 - 100 91 - 128 110 - 155 146 - 183+
ACT - Canberra 110 - 146 N/A 137 - 183 N/A
SA - Adelaide 85 - 115 90 - 130 110 - 150 135 - 185+
New Zealand N/A N/A N/A N/A
INTERNATIONAL Non-qualified 0-1 yrs P.Q.E 1-2 yrs P.Q.E 2-3 yrs P.Q.E
Hong Kong HK$ average monthly N/A 52 - 75 66 - 91 74 - 95
London £ average yearly 52 - 68 56 - 74 60 - 84 66 - 90
3-4 yrs P.Q.E 4-5 yrs P.Q.E 5-6 yrs P.Q.E 6+ yrs P.Q.E
Hong Kong HK$ average monthly 80 - 100 86 - 115 93 - 126 126 - 200+
London £ average yearly 72 - 100 76 - 105 82 - 115 95 - 125
NOTES:• P.Q.E: post qualification experience (this refers to English
qualifications which would exclude 2 years pre qualification training)
• Medical cover• Pension• Relocation expenses
• Bonuses• HK & offshore low tax
POTENTIAL BENEFITS THAT MAY BE INCLUDED ON TOP OF BASE SALARIES SHOWN

2018 Hays Salary Guide | 107
SALA
RY IN
FOR
MAT
ION
: LIF
E SC
IEN
CES
AUSTRALIA2017-18 was a positive year for Australia’s life sciences industry, buoyed by the impact of emerging Asian markets, tax changes in the USA, domestic R&D tax incentives and cannabinoid medicine legislative changes.
Medical Science Liaisons (MSL) remain in demand, with employers placing increasing value on field and hospital sales experience in addition to academic achievements. While this broadens the supply of suitable candidates, a shortage remains. Those with a few years of experience therefore see their salaries rise exponentially.
As new technology is embraced, temporary candidates who can help companies adapt to mass digitalisation will be sought, including App Developers, Technical Writers and Digital Marketers. Contract rates may rise as a result.
Within health economics and market access, Associate and Senior Associates are in short supply. Organisations are top heavy having recruited few entry-level candidates in recent years. If this trend continues, in the years ahead organisations will increase salaries to attract suitable candidates, which will in turn impact senior salaries.
Clinical Research Associates (CRAs) remain in high demand and companies are reviewing remuneration packages and
employee rewards to compete. Entry-level CRA opportunities remain limited, although some major CROs have established in-house training programs to develop a future talent pipeline. Project management roles have increased due to international companies branching out their research in Australia, newly created roles like this require existing project management experience. Candidates looking for an opportunity to project manage are encouraged to gain experience before moving elsewhere. Salaries at project management level remain stable.
Mergers and acquisitions in Contract Research Organisations (CROs) have created super CROs. Many employees see this as an exciting opportunity to work for a larger organisation with improved resources, but others are uncertain. Staff engagement will therefore be critical to retention.
Salaries will increase in Regulatory Affairs given candidate shortages, especially at the Associate level. Candidates with
regulatory experience of Class III devices and in registering new drugs and major applications in pharma remain in high demand. Global regulatory experience is sought too as Australian biotechnology companies launch products overseas.
In the commercial space, companies continue to seek candidates with specific therapeutic experience and technical capabilities, and consider cultural fit in an attempt to minimise staff turnover. For their part, candidates are focused on culture and benefits over salary.
LIFE SCIENCES
NOTES:• All salaries shown are exclusive of superannuation, car
allowance and any other benefits
* These roles may include a car allowance of between $15,000- $25,000 in the base salaries shown
OPERATIONSClinical Trial Administrator CRA* Senior CRA*
Lead/Principal CRA*
Clinical DataManager
Australia70 80 100 110 10060 - 80 65 - 85 88 - 110 95 - 115 80 - 120
Clinical Project Manager*
Senior Clinical Project Manager*
Clinical Operations Manager*
Clinical Director/Head of Clinical*
Australia130 150 140 200115 - 150 130 -170 120 - 170 180 - 220
Global regulatory experience is sought as Australian biotechnology companies launch products overseas.
“
”

108 | 2018 Hays Salary Guide
OPERATIONS
Regulatory Affairs Assistant
Regulatory Affairs Associate
Snr Regulatory Affairs Associate*
Regulatory Project Manager*
Regulatory Affairs Manager*
Head of Regulatory Affairs*
Australia65 80 110 130 150 19555 - 75 70 - 90 95 - 130 125 - 140 130 - 170 165 - 230
Drug Safety Associate
Senior Drug Safety Associate*
Drug Safety Manager*
Head of Drug Safety*
Medical Information Associate
Senior Medical Information Associate*
Australia80 105 150 190 80 10570 - 90 90 - 120 135 - 165 160 - 220 70 - 90 90 - 120
Medical Information Manager*
Medical Science Liaison/SMSL*
Medical Science Liaison Manager*
Medical Manager*
Medical Advisor*
Senior Medical Advisor*
Australia140 125 150 147 167 190120 - 160 90 - 150 140 - 160 125 - 160 150 - 185 160 - 210
Medical Director*
Health Economics Associate
Senior Health Economics Associate/Specialist*
Health Economics Manager*
Health Economics/Market Access Director*
Australia270 110 130 155 255230 - 320 90 - 125 120 - 140 140 - 170 220 - 290
GP Sales Rep
Hospital Specialist Sales Rep
Business Development Manager
Regional/State Sales Manager
Territory Manager
Product Specialist
Australia80 100 120 130 90 11075 - 100 90 - 110 100 - 130 110 - 140 80 - 110 90 - 120
Key Account Manager
National Key Account Manager
National Sales Manager Sales Director
Business Unit Manager
Australia110 120 160 190 17095 - 125 100 - 130 140 - 190 180 - 220 150 - 200
Associate Brand/Product Manager
Brand/ Product Manager
Senior Brand/ Product Manager
Marketing Manager
Marketing Director
Australia95 115 135 165 19085 - 100 95 - 130 120 - 150 130 - 195 170 - 230
Quality Assurance Associate
Senior Quality Assurance Associate
Quality Assurance Manager
Australia75 85 11865 - 90 75 - 95 90 - 135
Quality Control Associate
Senior Quality Control Associate
Quality Control Manager
Quality Director
Australia58 75 100 16550 - 65 62 - 85 85 - 105 150 - 180
• Additional super• Health cover• Interest free loans• Car/car allowance
• Cash bonuses• Study assistance• Parking• Share options in company
• Laptops• Vehicle expenses• Professional memberships
• All salaries shown are exclusive of superannuation, car allowance and any other benefits
* These roles may include a car allowance of between $15,000- $25,000 in the base salaries shown
TYPICAL BENEFITS THAT MAY BE INCLUDED ON TOP OF BASE SALARIES SHOWN: NOTES:
LIFE SCIENCES

2018 Hays Salary Guide | 109
SALA
RY IN
FOR
MAT
ION
: HEA
LTH
CARE
AUSTRALIARecruitment activity will remain high across Australia’s healthcare sector in 2018-19. Looking firstly at Australia’s social care industry, qualified and experienced workers are needed in child protection, child and family services, and courts and corrections.
Funding injections and a focus on family violence has led to a constant requirement for temporary and permanent Social Workers, Counsellors, Case Workers and Coordinators. Meanwhile, a skill shortage combined with the burnout of existing employees leads to continuous demand for Child Protection Practitioners and Support/Access Workers.
The NDIS rollout is still creating opportunities in metropolitan, regional and remote locations in disability services for Support Coordinators, Local Area Coordinators, Service Area Managers, experienced Team Leaders, Occupational Therapists and Physiotherapists, as well as for any candidate with knowledge and experience within the disability sector. Mergers between smaller companies in this area are also creating demand for Supervisors and Managers.
Given the skills shortage in disability services and competition for suitable candidates, salaries have increased.
Clinical and Behavioural Psychologists will be in increasing demand in the private and public sectors as the NDIS provides funding for assessment and support to individuals and their carers who previously could not afford such services. Increased demand from key NDIS providers is increasing salaries for individuals with these specific skills.
Vacancy activity has also increased in the mental health sector as more
organisations combine clinical or medical models with psychosocial models to form robust services for their clients. In addition, more healthcare roles now involve a greater level of client interaction in an attempt to close the gap between clients and service providers.
Within domestic violence and homelessness services, GPs and managers are being encouraged to join frontline colleagues to gain a broader understanding of the issues clients face. Given this, vacancy activity is expected to increase for Social Workers, Mental Health Practitioners, Mental Health Nurses, GPs and Counsellors. Psychologists also remain in short supply in community services, with many preferring to work in private practice.
While community services is an underfunded sector, salaries are growing incrementally.
Turning to aged care, there is a shortage of Registered Nurses since graduating nurses prefer to work in an acute care or hospital environment. Community Nurses are needed too in response to the focus on consumer directed care. Salaries in the aged care sector remain flat.
Tasmania in particular is currently experiencing a critically high shortage of Registered Nurses in aged care, as well as Physiotherapists and GPs. There have been no significant salary increases to attract candidates from mainland Australia.
Regional Australia still faces a unique set of challenges in attracting suitable candidates to remote areas. In particular, attracting quality candidates to specialist roles such as midwifery in remote locations remains difficult despite allowances and free or subsidised accommodation. Salary growth is flat here too, creating an attraction challenge for employers.
Alcohol and Other Drug (AOD) Case Managers and Clinicians are sought in the Northern Territory due to continued reviews and changes to the alcohol policy. There is a shortage of candidates in this area, although employers will relocate experienced and enthusiastic workers.
More broadly, across all sectors we expect to see increased recruitment activity in small to medium-sized organisations that are realigning new management roles to meet changing requirements. There is still pressure to drive fee paying services in the not-for-profit space, with Team Leaders and Program Managers in high demand and receiving premium salaries in response.
Given the skill shortage in disability services and competition for suitable candidates, salaries have increased.
“
”
There is a shortage of Registered Nurses since graduating nurses prefer to work in an acute care or hospital environment.
“
”
HEALTHCARE

110 | 2018 Hays Salary Guide
HEALTHCARENursing Professionals
• Above salaries exclude superannuation, bonuses, on-call, or penalty ratesNOTES:
NURSING PROFESSIONALS AGED CAREEnrolled Nurse
Registered Nurse
Clinical Care Coordinator/Nurse Unit Manager
Care Manager/DDON
DON/Facility Manager
Executive DON
NSW - Sydney 45 - 55 60 - 80 70 - 95 75 - 100 95 - 140 140 - 170
ACT - Canberra 45 - 65 60 - 80 70 - 95 75 - 100 95 - 140 140 - 170
NT - Darwin 45 - 60 60 - 70 70 - 80 80 - 100 100 - 120 120 - 150
WA - Perth 50 - 85 60 - 90 70 - 95 75 - 110 90 - 140 130 - 160
VIC - Melbourne 50 - 65 55 - 90 75 - 95 80 - 110 90 - 140 130 - 160
QLD - Regional 55 - 75 60 - 90 75 - 90 93 - 110 100 - 140 130 - 160
TAS - Hobart 49 - 65 55 - 80 65 - 85 85 - 100 90 - 130 120 - 170
SA - Adelaide 48 - 60 57 - 80 85 - 95 97 - 108 110 - 130 120 - 165
ACFI ManagerQuality Manager
Lifestyle Assistant
Lifestyle Manager
Nurse Educator
NSW - Sydney 90 - 110 120 - 130 45 - 60 75 - 100 70 - 95
ACT - Canberra 90 - 110 120 - 130 45 - 60 75 - 100 70 - 95
NT - Darwin 70 - 80 80 - 90 55 - 65 65 - 70 65 - 90
WA - Perth 90 - 110 75 - 125 45 - 60 60 - 80 65 - 97
VIC - Melbourne 95 - 115 95 - 135 40 - 60 75 - 95 80 - 110
QLD - Regional 70 - 85 75 - 90 50 - 60 80 - 100 80 - 95
TAS - Hobart 85 - 105 85 - 100 38 - 55 65 - 80 80 - 110
SA - Adelaide 95 - 108 96 - 108 38 - 55 65 - 80 96 - 108
NURSING PROFESSIONALS NON-AGED CARE
Enrolled Nurse
Registered Nurse/Midwife
Clinical Nurse/Midwife/ACSC
Clinical Manager/Clinical Services Coordinator/Education Facilitator
NSW - Sydney 45 - 55 55 - 70 70 - 85 80 - 95
ACT - Canberra 45 - 65 55 - 70 70 - 85 80 - 95
NT - Darwin 45 - 60 60 - 70 70 - 80 80 - 90
WA - Perth 50 - 76 50 - 76 55 - 80 65 - 95
VIC - Melbourne 47 - 63 54 - 86 73 - 78 78 - 99
QLD - Regional 55 - 65 60 - 80 80 - 90 90 - 100
TAS - Hobart 50 - 58 50 - 75 70 - 85 80 - 95
SA - Adelaide 48 - 60 57 - 80 66 - 86 96 - 102

2018 Hays Salary Guide | 111
HEALTHCARENursing Professionals
NOTES:
• Above salaries exclude superannuation, bonuses, on-call, or penalty ratesNOTES:
NURSING PROFESSIONALS NON-AGED CARE
Advanced Clinical Service Coordinator/Clinical Practice Consultant
Director of Nursing/Midwifery Practice Nurse
NSW - Sydney 90 - 110 110 - 150 60 - 85
ACT - Canberra 90 - 110 110 - 150 60 - 85
NT - Darwin 90 - 100 100 - 110 110 - 120
WA - Perth 75 - 105 85 - 135 65 - 85
VIC - Melbourne 88 - 114 90 - 140 85 - 95
QLD - Regional 100 - 110 115 - 145 55 - 65
TAS - Hobart 90 - 100 100 - 140 55 - 75
SA - Adelaide 101 - 108 110 - 160 56 - 73
Radiographer1-3 yrs
Radiographer3-5 yrs
Radiographer5-10 yrs
Radiographer10+ yrs
Australia 54 - 65 65 - 78 75 - 110 110 - 135
Sonographer1-3 yrs
Sonographer3-5 yrs
Sonographer5-10 yrs
Sonographer10+ yrs
Australia 60 - 70 70 - 90 90 - 130 120 - 150
Mammographer1-3 yrs
Mammographer3-5 yrs
Mammographer5-10 yrs
Mammographer10+ yrs
Australia 50 - 62 60 - 75 73 - 90 85 - 120
• Above salaries exclude superannuation, bonuses, on-call, or penalty rates
Medical Imaging Specialists

112 | 2018 Hays Salary Guide
NOTES:
HEALTHCARESocial Care & Psychology
SOCIAL/COMMUNITY SERVICES Support Worker Case Worker Social Worker
Team Leader/Program Coordinator
NSW - Sydney 40 - 50 50 - 60 60 - 85 60 - 85
ACT - Canberra 40 - 50 50 - 60 60 - 85 60 - 85
NT - Darwin 40 - 50 55 - 65 60 - 70 65 - 70
WA - Perth 45 - 50 50 - 55 65 - 75 65 - 85
VIC - Melbourne 40 - 50 50 - 60 60 - 75 70 - 80
QLD - Regional 38 - 50 40 - 55 55 - 65 60 - 75
TAS - Hobart 38 - 50 45 - 55 60 - 75 65 - 80
SA - Adelaide 40 - 50 45 - 65 60 - 85 60 - 80
Program Manager
Program Director
NSW - Sydney 75 - 95 90+
ACT - Canberra 75 - 95 90+
NT - Darwin 70 - 85 90+
WA - Perth 70 - 90 90+
VIC - Melbourne 80 - 95 100+
QLD - Regional 70 - 85 90+
TAS - Hobart 70 - 90 90+
SA - Adelaide 55 - 80 80 - 110
PSYCHOLOGISTS Graduate Counsellor PsychologistSenior Psychologist
Clinical Psychologist
NSW - Sydney 45 - 55 60 - 80 60 - 85 85 - 95 95 - 115
ACT - Canberra 45 - 55 60 - 80 60 - 85 85 - 95 95 - 115
NT - Darwin 44 - 50 45 - 65 70 - 85 80 - 95 90 - 110
WA - Perth 45 - 55 55 - 65 65 - 85 80 - 95 90 - 115
VIC - Melbourne 45 - 55 55 - 65 60 - 80 75 - 90 80 - 100
QLD - Regional 44 - 50 50 - 60 60 - 70 70 - 85 80 - 110
TAS - Hobart 44 - 49 55 - 70 65 - 80 74 - 90 80 - 105
SA - Adelaide 48 - 52 55 - 70 60 - 80 75 - 90 80 - 100
• Above salaries exclude superannuation, bonuses, on-call, or penalty rates
• Salaries might vary for regional/remote roles
• There are bandings for NFP under SCHADS and grades in Government/Health
• Salary packaging available for most NFP roles

2018 Hays Salary Guide | 113
HEALTHCAREAllied Health Professionals
ALLIED HEALTH PROFESSIONALS
Occupational Therapist (Graduate)
Occupational Therapist
Senior Occupational Therapist Team Leader
Physiotherapist (Graduate)
NSW - Sydney 50 - 57 55 - 75 70 - 85 80 - 95 50 - 57
ACT - Canberra 50 - 57 55 - 75 70 - 85 80 - 95 50 - 57
NT - Darwin 50 - 55 55 - 65 65 - 75 70 - 80 50 - 57
WA - Perth 50 - 55 55 - 65 70 - 80 85 - 95 55 - 60
VIC - Melbourne 50 - 57 55 - 75 70 - 85 80 - 90 50 - 57
QLD - Regional 45 - 50 58 - 65 65 - 75 80 - 95 45 - 50
TAS - Hobart 45 - 50 55 - 70 65 - 80 75 - 85 45 - 52
SA - Adelaide 48 - 55 55 - 65 65 - 75 70 - 80 48 - 55
PhysiotherapistSenior Physiotherapist Team Leader
Speech Pathologist (Graduate)
Speech Pathologist
NSW - Sydney 55 - 75 70 - 90 80 - 95 50 - 57 55 - 70
ACT - Canberra 55 - 75 70 - 90 80 - 95 50 - 57 55 - 70
NT - Darwin 50 - 65 70 - 80 70 - 80 45 - 55 56 - 65
WA - Perth 60 - 70 70 - 85 85 - 95 45 - 50 50 - 65
VIC - Melbourne 55 - 75 70 - 85 80 - 95 45 - 55 55 - 70
QLD - Regional 55 - 70 70 - 80 85 - 95 50 - 55 60 - 70
TAS - Hobart 55 - 70 70 - 85 80 - 90 50 - 55 60 - 65
SA - Adelaide 50 - 65 55 - 70 65 - 80 48 - 55 55 - 70
Senior Speech Pathologist Team Leader
Diversional Therapist (Graduate)
Diversional Therapist
NSW - Sydney 70 - 80 75 - 90 45 - 50 50 - 60
ACT - Canberra 70 - 80 75 - 90 45 - 50 50 - 60
NT - Darwin 65 - 75 70 - 80 40 - 45 45 - 55
WA - Perth 60 - 75 75 - 90 40 - 45 45 - 55
VIC - Melbourne 70 - 80 75 - 90 45 - 50 55 - 60
QLD - Regional 65 - 80 80 - 90 40 - 45 45 - 55
TAS - Hobart 65 - 70 75 - 85 42 - 46 48 - 55
SA - Adelaide 65 - 75 65 - 80 40 - 48 48 - 55
NOTES:• Above salaries exclude superannuation, bonuses, on-call, or penalty rates
114 | 2018 Hays Salary Guide
SALA
RY IN
FOR
MAT
ION
: ED
UCA
TIO
N
AUSTRALIAIn the early childhood sector we continue to see continuous high demand for Early Childhood Teachers in response to the need for childcare, especially in major cities. The opening of new childcare centres adds to demand and higher competition for suitable candidates.
In response, it is now standard practice for employers to offer salaries above the modern award. However, salaries and benefits still do not compare with those available in the primary school system.
There is a critical shortage of Early Childhood Teachers in the long day care sector too and these candidates can command above award salaries and benefits including flexible or part-time hours.
Childcare centres are also looking for experienced Certificate III and Diploma educators. They want engaging educators who have a real passion for working with children and can teach school readiness.
Area Managers are in increasing demand, as are experienced Centre Directors and
2ICs who can drive policy, improve service provision and engage with parents and children.
Childcare Cooks with experience working in a childcare setting and a willingness to commit to the limited hours of work are also sought.
Looking ahead, the Australian Government’s New Child Care Package and the introduction of subsidy means testing may impact the price of childcare. If it does, it will be interesting to see if it will lead to increased staff salaries and benefits.
Turning to the schools sector, strict awards aligned to professional standards and a teacher’s accreditation level are in place, thus incentivising schools and teachers to maintain quality teaching standards and ongoing professional development.
Despite this, independent schools still pay the highest salaries, followed by Catholic systemic schools and then public schools. Salaries have increased slightly in line with economic growth.
The vocational education sector is still readjusting following a turbulent few years. This financial year we will see continued stabilisation in the job market and limited salary movement.
EDUCATION
SCHOOLS Principal Deputy Principal Director of Study Head of Department Teacher
Australia - Government Schools 112 - 185 112 - 132 95 - 105 95 - 105 65 - 98
Australia - Non-Government Schools 140 - 400 126 - 160 130 - 150 110 - 126 70 - 110
VOCATIONAL EDUCATION AND TRAINING Tutor Educator/VET Teacher
Head of Faculty/Head Teacher
Director of Studies
Manager/Principal
Australia 42 - 65 52 - 92 70 - 125 70 - 140 75 - 180
EARLY CHILDHOOD Area ManagerDirector(Degree Qualified)
Director (Diploma Qualified)
Australia 80 - 130 75 - 95 70 - 85
Early Childhood Teacher
Diploma Trained Childcare Worker
Certificate 111 Childcare Worker Cook
Australia 60 - 85 45 - 60 40 - 50 40 - 52
• All salaries shown are exclusive of superannuationNOTES:
The vocational education sector is still readjusting following a turbulent few years.
“”

2018 Hays Salary Guide | 115
SALA
RY IN
FOR
MAT
ION
: PO
LICY
& S
TRAT
EGY
AUSTRALIAIt has been an active year for Australia’s policy and strategy market, with the public sector recruiting temporary and contract roles and peak body, membership and not-for-profit organisations recruiting on a permanent basis.
Having said this, headcount restrictions were lifted in some government departments, providing the leniency to appoint directly onto their payroll as opposed to temporary contracts.
Salaries across policy and strategy will remain steady over the 2018-19 year, with moderate increases expected in key areas of demand.
This includes Strategy Managers, who are already receiving salaries at the top of the salary range in response to a supply shortage.
Generous temporary contract day rates are also being offered to Project Managers and Program Managers.
Senior Project Managers with subject or sector specific knowledge will see increased demand in the year ahead, with temporary assignments offered to assist in commissioning initiatives. Given demand, solid hourly rates will be on offer.
In other areas of demand, hands-on policy professionals with a solid understanding of machinery of government will be sought in Local, State and Federal Government to develop policies.
Project and Program Managers, Policy Managers and Senior Policy Officers have been in demand. The conclusion of several Royal Commissions and reviews in recent years have led to significant reforms that need to be delivered by both State and Federal Governments. These reforms are ongoing and will continue to require Policy and Program specialists into 2019 and beyond.
Policy Officers, Ministerial Liaison Officers and Governance Officers are also in increasing demand in the public sector. However, with a shortage of suitable candidates for temporary contracts, these professionals have their choice of vacancies. The high demand and short supply has also led to salary pressure.
Turning to the not-for-profit space, Risk & Compliance Officers and Managers are in high demand, particularly in the areas of health, aged care and disability (NDIS). Demand is particularly high for candidates from a private sector background as this sector develops a commercial focus.
NEW ZEALANDA New Zealand general election in 2017-18 saw a new government take office and new policies implemented. As a result, policy and strategy experts have been in high demand to work on legislative and policy changes. These include Policy Officers, Advisors, Programme Managers, Ministerial Liaison Officers, Ministerial Officers, Ministerial Writers and Project Managers. Permanent opportunities remain steady, while contract roles have surged.
Subject matter experts and those with a background in social, economic, financial and environmental policy will be in demand during 2018-19. While demand will be high in the public sector, non-government and not-for-profit (NFP) organisations will also require these professionals to assist with government-focused initiatives.
Salaries will remain consistent due to tightened resources and budgets, with some increases for highly skilled professionals who have very specific subject matter expertise, including Economists and Data & Research Analysts.
POLICY & STRATEGY
Policy Officer/Policy Advisor
Senior Policy Officer/Policy Advisor Policy Manager
Government Relations Manager
Strategic Manager
NSW - Sydney85 100 125 125 13070 - 90 90 - 120 100 - 150 100 - 150 120 - 150
VIC - Melbourne80 95 120 125 13070 - 90 85 - 105 100 - 140 100 - 140 110 - 140
QLD - Brisbane85 95 110 110 11065 - 90 85 - 115 95 - 120 95 - 120 95 - 120
WA - Perth70 90 110 120 12560 - 80 75 - 100 90 - 130 100 - 140 100 - 150
ACT - Canberra70 90 100 100 10060 - 85 80 - 100 85 - 140 85 - 120 90 - 120
SA - Adelaide75 95 110 125 12570 - 90 85 - 115 105 - 125 100 - 140 100 - 150
NZ - Wellington80 105 135 110 11070 - 90 90 - 120 110 - 150 100 - 120 100 - 120
• All salaries shown are exclusive of superannuation (AU) or KiwiSaver (NZ)NOTES:

116 | 2018 Hays Salary Guide
POLICY & STRATEGY
• All salaries shown are exclusive of superannuation (AU) or KiwiSaver (NZ)
* These roles generally occur in a NFP context and would be supplemented with tax benefits (generally the benevolent sacrificing which is up to $16,050 tax free but most of our clients are able to offer more tax related incentives – travel, meal, health and wellbeing etc)
NOTES:
Programme Manager*
Programme Officer/Coordinator* Project Officer* Project Manager*
NSW - Sydney100 70 80 10080 - 140 55 - 75 60 - 90 80 - 120
VIC - Melbourne100 85 80 10090 - 130 75 - 95 70 - 90 90 - 130
QLD - Brisbane100 65 80 10080 - 140 55 - 75 60 - 90 80 - 120
WA - Perth95 75 70 9080 - 120 70 - 85 60 - 80 80 - 120
ACT - Canberra100 85 75 9080 - 140 75 - 95 60 - 85 85 - 120
SA - Adelaide110 80 75 9080 - 115 60 - 90 65 - 85 85 - 120
NZ - Wellington100 70 70 11080 - 120 60 - 80 60 - 80 90 - 140
Research Analyst Data Analyst Executive Officer Business Analyst
NSW - Sydney75 80 100 12065 - 85 70 - 90 80 - 120 80 - 140
VIC - Melbourne70 80 90 9060 - 75 70 - 90 80 - 110 80 - 110
QLD - Brisbane60 80 90 9050 - 70 50 - 90 70 - 100 70 - 100
WA - Perth75 80 90 8560 - 85 60 - 90 70 - 110 70 - 110
ACT - Canberra80 85 90 9075 - 95 75 - 95 85 - 120 85 - 120
SA - Adelaide80 80 90 9570 - 90 70 - 90 85 - 115 80 - 110
NZ - Wellington70 70 90 8560 - 80 60 - 80 70 - 100 70 - 100
Ministerial Liaison Officer
Regulatory Advisor
Regulatory Manager Economist
Senior Economist
NSW - Sydney85 100 125 100 12070 - 95 80 - 120 100 - 150 80 - 110 100 - 150
VIC - Melbourne75 95 130 95 13065 - 85 80 - 110 110 - 150 90 - 120 110 - 150
QLD - Brisbane85 90 110 100 12070 - 95 80 - 100 100 - 120 80 - 110 100 - 150
WA - Perth70 85 110 95 11060 - 75 70 - 100 80 - 140 85 - 120 95 - 140
ACT - Canberra90 100 110 100 12080 - 95 90 - 110 95 - 120 95 - 115 110 - 140
SA - Adelaide90 105 125 100 11580 - 100 90 - 115 100 - 150 90 - 115 100 - 130
NZ - Wellington80 80 95 100 12070 - 90 70 - 90 80 - 110 80 - 120 100 - 140

2018 Hays Salary Guide | 117
SALA
RY IN
FOR
MAT
ION
: IN
FORM
ATIO
N T
ECH
NO
LOG
Y
AUSTRALIAThe past year was dominated by digital transformations that disrupted organisations in both major cities and regional areas. The demand from customers for constant, on-demand access to products and services drove significant change across all sectors and industries, with subsequent projects increasing demand for talent in a market already suffering from skill shortages.
In addition, several high-profile public breaches increased the awareness of the need for a cyber security strategy and in turn demand for candidates with an elastic skill set across all CSIRT functions, penetration testing and information security. Given demand, cyber security salaries became more competitive.
Another key trend was the increasing number of organisations that transferred their data to the Cloud. Skilled Developers who understand automation, continuous integration and deployment, and possess knowledge of cloud technologies such as Azure or AWS, were, and remain, highly sought after. Developers with certifications and commercial experience working with cloud platforms are often able to command higher salaries.
Traditional infrastructure roles such as System Administrators are being replaced with data-driven jobs that incorporate the automation of systems, including System Operator Engineers, System Architects, Infrastructure Engineers and System Reliability Engineers. This trend will increase in 2018-19 as more infrastructure professionals upskill in automation and DevOps.
With organisations continually shifting their focus to meet changing consumer expectations, UX/UI Designers and Service Designers are in high demand.
Salary increases for Front-end and Java Developers illustrate how tight the competition for talent is.
Organisations based in regional Australia will continue to automate manual processes and upgrade support applications. Innovation is a focus that will drive the recruitment of Mobile Application Developers, Software Engineers, UX/UI Designers, Web Developers and Cloud Developers/Solutions Architects.
Business Analysts with broad experience in business system transformation and Project Managers with digital exposure are in increasing demand too. As organisations continue to transition to digital platforms, this trend will continue.
Business Intelligence and Data Analysis professionals, particularly Data Scientists, Data Engineers and Data Analysts with experience in SQL and Tableau, will also be sought. Meanwhile, as organisations adapt to new technologies and business processes the demand for experienced Change Managers will remain high. In addition, the continued adoption of Agile project management methodologies across the public and private sectors has fuelled demand, in turn increasing salaries for project professionals experienced and qualified in Agile principles.
The contracting market remains dynamic as employers continuously require contractors to deliver transformation projects and add missing technical skills to their team. With an increased focus on the specific skills and value flexible workforces bring, organisations will continue to engage contractors in the year ahead.
Throughout 2018-19 IT professionals must stay up-to-date with the latest technology
trends and skills while simultaneously developing their business acumen. The IT department is critical to keeping an organisation competitive, which is why employers want commercially-minded technology professionals. If you are looking to advance your career, improving your business knowledge will put you in a unique position to bridge the gap between the corporate and technical worlds and futureproof your career.
INFORMATION TECHNOLOGY
With organisations continually shifting their focus to meet changing consumer expectations, UX/UI Designers and Service Designers are in high demand.
“
”
Throughout 2018-19 IT professionals must stay up-to-date with the latest technology trends and skills while simultaneously developing their business acumen.
“
”

118 | 2018 Hays Salary Guide
NEW ZEALANDDigital transformations are driving vacancy activity across New Zealand as organisations become customer centric, utilise the benefits of data and upgrade in new technologies. As a result, migrations to cloud based services, security, AI, big data and analytics are all fast becoming essential elements of everyday business.
The migration of local infrastructure to cloud platforms, in particular Microsoft Azure and Amazon Web Services, is fuelling demand for Cloud and Security Architects and Engineers with exposure to DevOps environments. Employers are therefore competing for the top talent and experienced and well qualified Cloud and Security Architects are commanding salary increases.
Meanwhile, the focus on data ETL development and the design and build of data warehouses has led to high competition for BI/DW Developers, Business Intelligence Developers, ETL Developers, Data Scientists, Reports Developers, Architects and Big Data Engineers. As a result, candidates increasingly expect improved salaries and or contract rates since they are more aware of their value.
Full Stack Developers are sought by small to medium enterprises and the public sector. These professionals understand the latest frameworks, design cloud integration solutions and develop across the technology stack, thereby reducing the need for additional headcount. Given demand, salaries have increased for high calibre candidates.
In the Microsoft domain, the growing popularity of .NET Core is fuelling demand for Developers with commercial experience utilising this framework. This is also pushing up salaries.
Strong candidates with heavy integration and API development expertise related to Java and open source technologies are scarce. In addition, SilverStripe remains very popular across the public and private sectors, creating demand for Front-End Developers who can use this framework. Those who have heavily customised Drupal are also sought as a strong alternative to SilverStripe Developers.
DevOps remains a growth area, especially at the enterprise level to support business transformation and accelerate the delivery of applications while maintaining quality. This is leading to salary increases.
Senior IT professionals with experience in Popular JavaScript frameworks for light weight single page applications such as React/Angular are in short supply too and therefore command higher rates and salaries.
Cyber security and data security is another growth area in government organisations where business continuity is a focus and a large amount of data is stored on the cloud. This is creating demand for cyber security specialists including Data Engineers and Architects. With high demand but a small candidate pool, organisations are using the complexity of their projects and attractive salaries to compete for the top talent.
Employers are also experimenting with new and emerging disruptive technologies such as augmented reality, blockchain and machine learning. Any candidate with commercial experience in these areas is therefore in demand.
For all other IT roles, New Zealand generally remains candidate-led at the senior level. Organisations are consequently competing for candidates
by offering either a salary increase or additional benefits such as flexibility, remote access, increased annual leave or share options.
In the Microsoft domain, the growing popularity of .NET Core is fuelling demand for Developers with commercial experience.
“
”
Cyber security and data security is another growth area in government organisations where business continuity is a focus and a large amount of data is stored on the cloud.
“
”
SALA
RY IN
FOR
MAT
ION
: IN
FORM
ATIO
N T
ECH
NO
LOG
YINFORMATION TECHNOLOGY

2018 Hays Salary Guide | 119
INFORMATION TECHNOLOGY
• All salaries shown are exclusive of superannuation (AU) or KiwiSaver (NZ)
• New Zealand salaries are represented in New Zealand dollars
NOTES:
IT OPERATIONS & SUPPORTEnd User Support/Level 1
End User Support/Level 2
Systems Administration/Level 3
UNIX Administration
NSW - Sydney55 65 85 8545 - 55 55 - 70 70 - 90 80 - 100
NSW - Regional45 75 100 8540 - 52 65 - 80 80 - 120 80 - 100
VIC - Melbourne55 65 90 10050 - 65 60 - 80 80 - 110 90 - 125
VIC - Regional45 55 65 8540 - 50 50 - 60 55 - 70 75 - 100
QLD - Brisbane, Gold Coast & Sunshine Coast50 60 80 8545 - 60 50 - 70 70 - 90 70 - 100
SA - Adelaide50 60 75 8545 - 55 55 - 65 65 - 85 70 - 100
WA - Perth45 60 85 10040 - 50 50 - 70 75 - 95 80 - 110
ACT - Canberra60 70 90 10055 - 65 65 - 75 80 - 100 90 - 120
TAS - Hobart/Launceston50 60 70 8045 - 55 55 - 65 65 - 75 80 - 95
NT - Darwin50 65 90 8545 - 55 55 - 70 80 - 110 80 - 100
NZ - Auckland50 60 80 8045 - 55 55 - 65 65 - 90 80 - 100
NZ - Wellington45 50 65 8840 - 50 45 - 55 50 - 80 75 - 95
NZ - Christchurch40 50 60 9035 - 45 45 - 55 55 - 75 80 - 100
Team LeaderService Desk Manager
Applications Support Server Engineer Cloud Engineer
NSW - Sydney80 90 80 125 12565 - 85 80 - 100 65 - 100 100 - 125 110 - 135
NSW - Regional85 90 75 100 10070 - 100 80 - 100 60 - 90 80 - 120 85 - 120
VIC - Melbourne90 95 85 100 11580 - 105 85 - 125 70 - 100 80 - 120 100 - 130
VIC - Regional75 80 70 75
N/A70 - 80 75 - 95 65 - 80 65 - 85
QLD - Brisbane, Gold Coast & Sunshine Coast80 90 80 90
N/A60 - 85 70 - 100 60 - 90 80 - 100
SA - Adelaide75 75 70 85 9565 - 90 65 - 90 60 - 80 70 - 100 80 - 120
WA - Perth75 90 80 100 10565 - 90 80 - 100 65 - 90 80 - 110 90 - 120
ACT - Canberra90 100 80 125 12080 - 100 90 - 110 70 - 90 110 - 140 110 - 130
TAS - Hobart/Launceston80 90 70 90
N/A75 - 95 85 - 95 65 - 75 80 - 100
NT - Darwin75 75 65 95 10060 - 85 60 - 85 55 - 75 80 - 110 80 - 120
NZ - Auckland85 85 80 80 9070 - 95 75 - 110 60 - 95 70 - 90 85 -120
NZ - Wellington70 82 85 80 8060 - 82 77 - 110 75 - 95 70 - 90 75 - 110
NZ - Christchurch70 85 85 80 8060 - 80 70 - 100 70 - 95 70 - 90 75 - 110

120 | 2018 Hays Salary Guide
INFORMATION TECHNOLOGY
• All salaries shown are exclusive of superannuation (AU) or KiwiSaver (NZ)
• New Zealand salaries are represented in New Zealand dollars
NOTES:
IT OPERATIONS & SUPPORTDevOps Engineer
Network Administration
Network Engineer
Network Designer
Network Architect
NSW - Sydney90 90 100 120 14080 - 110 80 - 95 90 - 120 100 - 130 120 - 160
NSW - Regional90 75 90 110 11575 - 115 60 - 80 80 - 100 80 - 120 90 - 140
VIC - Melbourne115 90 110 130 140110 - 140 80 - 100 90 - 120 110 - 150 120 - 170
VIC - Regional90 70 75 85 11075 - 100 65 - 85 65 - 85 75 - 100 95 - 125
QLD - Brisbane, Gold Coast & Sunshine Coast90 80 95 105 11570 - 110 70 - 90 80 - 110 90 - 120 100 - 130
SA - Adelaide85 75 90 95 12080 - 120 70 - 80 80 - 100 85 - 110 100 - 140
WA - Perth100 85 95 110 12090 - 120 75 - 95 80 - 110 95 - 120 100 - 140
ACT - Canberra120 100 120 120 140110 - 130 90 - 110 110 - 130 110 - 130 130 - 150
TAS - Hobart/Launceston85 80 90 100 11075 - 95 80 - 90 85 - 95 90 - 110 95 - 125
NT - Darwin90 70 100 110 13080 - 110 60 - 80 70 - 120 100 - 125 115 - 150
NZ - Auckland100 80 90 110 12075 - 125 70 - 85 80 - 110 90 - 125 90 - 140
NZ - Wellington85 80 85 110 12080 - 115 70 - 90 80 - 110 85 - 120 110 - 140
NZ - Christchurch80 80 80 100 12570 - 95 70 - 90 70 - 90 80 - 110 110 - 150
Data/Voice Engineer
Storage Engineer
Security Consultant
Security Architect
Security Analyst
NSW - Sydney105 110 120 170 12090 - 125 95 - 120 100 - 150 150 - 200 100 - 150
NSW - Regional90 95 115 150 10080 - 100 80 - 120 100 - 140 130 - 170 90 - 120
VIC - Melbourne100 105 140 160 11080 - 130 90 - 130 100 - 170 130 - 180 85 - 140
VIC - Regional90 95 90 120 8575 - 110 80 - 120 75 - 100 110 - 140 80 - 100
QLD - Brisbane, Gold Coast & Sunshine Coast100 100 115 115 9090 - 140 90 - 110 105 - 150 100 - 120 80 - 100
SA - Adelaide90 90 120 130 8575 - 120 80 - 110 100 - 150 110 - 150 80 - 100
WA - Perth110 95 120 140 9580 - 120 80 - 110 100 - 140 120 - 160 80 - 110
ACT - Canberra120 120 130 170 120110 - 130 110 - 130 110 - 150 150 - 180 100 - 140
TAS - Hobart/Launceston90 110 110 130 14080 - 110 100 - 120 100 - 140 110 - 150 120 - 160
NT - Darwin100 110 120 150 9585 - 120 95 - 120 100 - 150 130 - 160 80 - 110
NZ - Auckland83 75 130 150 11060 -105 70 - 110 120 - 160 110 - 180 90 - 120
NZ - Wellington98 75 110 140 10085 - 115 70 - 110 100 - 140 100 - 170 80 - 110
NZ - Christchurch100 75 110 140 10080 - 110 70 - 110 100 - 130 100 - 170 80 - 110

2018 Hays Salary Guide | 121
INFORMATION TECHNOLOGY
• All salaries shown are exclusive of superannuation (AU) or KiwiSaver (NZ)
• New Zealand salaries are represented in New Zealand dollars
NOTES:
DIGITAL TECHNOLOGY.Net Developer
Senior .Net Developer
Full Stack Developer .Net
Team Leader - .Net
Java Developer
NSW - Sydney85 110 125 135 9075 - 100 90 - 120 115 - 130 125 - 140 75 - 100
NSW - Regional80 105 110 120 8065 - 95 85 - 120 100 - 130 100 - 130 55 - 80
VIC - Melbourne80 100 110 120 8060 - 90 95 - 120 100 - 130 110 - 140 50 - 90
VIC - Regional70 80 85 90 7060 - 85 70 - 90 75 - 100 80 - 100 60 - 80
QLD - Brisbane, Gold Coast & Sunshine Coast75 110 90 120 8060 - 85 90 - 120 80 - 120 100 - 140 60 - 90
SA - Adelaide75 90 85 100 7550 - 80 80 - 105 75 - 100 80 - 110 50 - 80
WA - Perth80 110 110 125 8060 - 90 90 - 120 90 - 125 115 - 140 60 - 90
ACT - Canberra105 115 120 150 10595 - 115 105 - 125 110 - 130 140 - 160 95 - 110
TAS - Hobart/Launceston80 95 90 95 8075 - 85 85 - 100 80 - 100 90 - 110 75 - 85
NT - Darwin85 100 100 115 8070 - 100 90 - 120 90 - 125 100 - 130 70 - 90
NZ - Auckland70 110 110 125 8065 - 85 90 - 130 95 - 130 120 - 150 75 - 90
NZ - Wellington70 100 100 125 7060 - 95 95 - 120 95 - 125 120 - 140 60 - 85
NZ - Christchurch70 85 90 95 6060 - 80 70 - 100 75 - 110 85 - 110 50 - 70
Senior Java Developer
Full Stack Developer Java
Team Leader - Java
C/C++ Developer
Snr C/C++ Developer
NSW - Sydney120 120 140 80 110110 - 130 100 - 130 125 - 155 70 - 80 90 - 120
NSW - Regional100 110 120 85 10075 - 100 100 - 130 85 - 130 70 - 100 80 - 120
VIC - Melbourne100 110 120 90 11095 - 120 100 - 130 110 - 140 65 - 95 95 - 120
VIC - Regional80 85 90 60 8070 - 90 75 - 100 80 - 100 50 - 70 70 - 90
QLD - Brisbane, Gold Coast & Sunshine Coast100 80 120 75 10585 - 120 80 - 120 100 - 130 60 - 90 90 - 120
SA - Adelaide 90 85 100 75 9070 - 105 75 - 100 80 - 105 50 - 85 70 - 105
WA - Perth100 100 120 80 10590 - 120 90 - 120 115 - 140 60 - 90 90 - 120
ACT - Canberra130 110 150 115 135100 - 160 100 - 120 140 - 160 110 - 120 120 - 155
TAS - Hobart/Launceston95 90 95 75 9090 - 105 80 - 100 90 - 110 70 - 80 85 - 95
NT - Darwin100 105 115 90 11085 - 120 90 - 120 100 - 130 80 - 100 100 - 120
NZ - Auckland110 110 125 75 10090 - 120 95 - 130 120 - 150 65 - 85 90 - 120
NZ - Wellington100 100 110 70 10090 - 110 95 - 125 100 - 120 65 - 80 80 - 110
NZ - Christchurch85 90 100 70 9070 - 100 75 - 100 85 - 110 60 - 80 70 - 100

122 | 2018 Hays Salary Guide
INFORMATION TECHNOLOGY
• All salaries shown are exclusive of superannuation (AU) or KiwiSaver (NZ)
• New Zealand salaries are represented in New Zealand dollars
NOTES:
DIGITAL TECHNOLOGYDeveloper (Other)
Snr Developer (Other)
Front-End Developer
Mobile Apps Developer
Web/UX/UI Designer
NSW - Sydney80 100 110 100 11070 - 90 90 - 120 80 - 120 70 - 120 80 - 120
NSW - Regional85 120 90 100 10070 - 100 90 - 130 75 - 120 70 - 120 70 - 120
VIC - Melbourne80 110 100 100 10050 - 100 90 - 120 95 - 120 80 - 120 80 - 120
VIC - Regional60 80 70 85 7050 - 70 70 - 90 60 - 80 80 - 90 60 - 80
QLD - Brisbane, Gold Coast & Sunshine Coast85 110 90 100 10070 - 100 90 - 120 80 - 100 80 - 120 80 - 120
SA - Adelaide75 90 70 70 7050 - 85 70 - 100 60 - 95 60 - 95 60 - 85
WA - Perth80 100 95 90 9060 - 90 90 - 120 80 - 110 70 - 120 70 - 110
ACT - Canberra90 110 100 100 11080 - 100 100 - 120 90 - 110 90 - 110 90 - 130
TAS - Hobart/Launceston75 90 85 85 9070 - 80 85 - 95 75 - 90 75 - 95 80 - 100
NT - Darwin80 100 100 90 9570 - 90 90 - 110 90 - 110 80 - 100 80 - 110
NZ - Auckland85 110 100 100 9570 - 90 90 - 125 75 - 120 80 - 120 75 - 120
NZ - Wellington75 110 95 100 9070 - 90 90 - 125 75 - 120 90 - 110 70 - 100
NZ - Christchurch70 85 80 75 8560 - 80 70 - 100 70 - 90 70 - 90 70 - 95
Test AnalystSenior Test Analyst
Automation Test Analyst
Test/QA Manager
NSW - Sydney80 85 90 12870 - 90 75 - 105 75 - 110 115 - 140
NSW - Regional90 100 95 12085 - 100 80 - 120 85 -110 100 - 140
VIC - Melbourne80 95 100 11560 - 90 75 - 100 80 - 120 100 - 140
VIC - Regional80 90 85 10570 - 90 80 - 100 75 - 95 95 - 120
QLD - Brisbane, Gold Coast & Sunshine Coast80 90 100 11070 - 90 80 - 100 80 - 120 100 - 130
SA - Adelaide70 85 80 10060 - 80 75 - 100 65 - 100 85 - 110
WA - Perth70 85 95 11565 - 90 75 - 100 85 - 115 95 - 130
ACT - Canberra90 110 120 14080 - 110 100 - 120 100 - 140 110 - 160
TAS - Hobart/Launceston80 90 75 9070 - 90 80 - 100 70 - 90 80 - 100
NT - Darwin70 85 75 9560 - 80 70 - 110 60 - 90 80 - 110
NZ - Auckland75 85 110 12055 - 80 70 - 100 90 - 120 110 - 130
NZ - Wellington75 85 110 11070 - 80 70 - 100 90 - 120 95 - 120
NZ - Christchurch70 85 110 11060 - 85 70 - 100 90 - 115 95 - 120

2018 Hays Salary Guide | 123
INFORMATION TECHNOLOGY
• All salaries shown are exclusive of superannuation (AU) or KiwiSaver (NZ)
• New Zealand salaries are represented in New Zealand dollars
NOTES:
DIGITAL TECHNOLOGY Report Writer Data Analyst Data Scientist Data Modeller
NSW - Sydney75 90 145 12055 - 90 75 - 105 100 - 180 100 - 140
NSW - Regional70 80 130 12065 - 80 70 - 110 100 - 160 100 - 160
VIC - Melbourne80 90 160 12565 - 90 75 - 130 130 - 240 100 - 150
VIC - Regional55 75 110 N/A45 - 65 65 - 88 100 - 150 N/A
QLD - Brisbane, Gold Coast & Sunshine Coast75 85 105 11060 - 90 70 - 100 90 - 120 100 - 120
SA - Adelaide60 70 110 10055 - 75 60 - 80 100 - 150 90 - 110
WA - Perth75 100 135 12055 - 90 80 - 115 100 - 150 110 - 130
ACT - Canberra80 100 140 12570 - 90 80 - 120 120 - 160 110 - 140
TAS - Hobart/Launceston80 75 115 11565 - 85 60 - 80 100 - 130 100 - 130
NT - Darwin60 90
N/A100
45 - 65 75 - 105 90 - 110
NZ - Auckland65 80 100 10055 - 80 65 - 95 90 - 120 85 - 130
NZ - Wellington65 75 100 10055 - 80 65 - 85 90 - 120 85 - 130
NZ - Christchurch65 75 100 10055 - 80 65 - 85 90 - 120 85 - 130
Database Developer BI/DW Development Architect DBA
NSW - Sydney85 90 120 12570 - 100 80 - 120 110 - 140 110 - 140
NSW - Regional95 110 120 13070 - 115 100 - 140 100 - 140 120 - 160
VIC - Melbourne90 115 130 12585 - 105 90 - 130 110 - 180 110 - 150
VIC - Regional60 90 100 10550 - 70 85 - 105 90 - 110 90 - 125
QLD - Brisbane, Gold Coast & Sunshine Coast85 105 120 10070 - 100 90 - 120 110 - 130 80 - 140
SA - Adelaide75 85 110 10060 - 85 70 - 100 100 - 135 85 - 110
WA - Perth100 110 130 12080 - 120 95 - 120 120 - 150 100 - 130
ACT - Canberra120 110 180 120110 - 140 100 - 150 160 - 200 110 - 140
TAS - Hobart/Launceston75 85 100 10555 - 80 75 - 95 90 - 110 90 - 125
NT - Darwin85 90 100 10070 - 100 80 - 120 90 - 110 85 - 110
NZ - Auckland100 110 125 11075 - 120 90 - 130 110 - 150 80 - 110
NZ - Wellington90 110 125 11075 - 100 85 - 130 110 - 140 85 - 120
NZ - Christchurch80 95 125 11060 - 90 90 - 110 100 - 140 85 - 120

124 | 2018 Hays Salary Guide
INFORMATION TECHNOLOGY
• All salaries shown are exclusive of superannuation (AU) or KiwiSaver (NZ)
• New Zealand salaries are represented in New Zealand dollars
NOTES:
PROJECTS & BUSINESS CHANGE Systems Analyst Business Analyst Senior Business Analyst
Project Coordinator
Project Manager
NSW - Sydney95 115 130 85 14585 - 105 95 - 135 110 - 150 75 - 95 125 - 165
NSW - Regional90 100 110 70 13080 - 100 80 - 100 100 - 130 60 - 80 100 - 140
VIC - Melbourne90 105 125 85 13075 - 110 90 - 120 110 - 140 75 - 90 100 - 150
VIC - Regional75 75 100 75 10065 - 85 70 - 85 85 - 120 70 - 85 90 - 130
QLD - Brisbane, Gold Coast & Sunshine Coast85 90 120 75 12075 - 105 80 - 120 100 - 130 60 - 90 100 - 140
SA - Adelaide85 87 115 75 10065 - 100 70 - 95 95 - 125 65 - 85 90 - 125
WA - Perth90 85 105 80 12070 - 100 70 - 100 90 - 120 70 - 90 110 - 130
ACT - Canberra100 100 115 75 12080 - 100 90 - 110 105 - 130 65 - 90 100 - 130
TAS - Hobart/Launceston80 85 98 70 10575 - 85 80 - 95 85 - 115 65 - 80 87 - 115
NT - Darwin90 110 130 85 12070 - 105 90 - 130 120 - 150 75 - 100 100 - 140
NZ - Auckland95 90 110 75 10070 - 110 75 - 100 90 - 130 60 - 90 90 - 120
NZ - Wellington85 85 110 70 10070 - 95 75 - 100 95 - 120 60 - 80 90 - 120
NZ - Christchurch85 80 100 65 10070 - 95 75 - 100 90 - 110 55 - 75 90 - 110
Senior Project Manager
Project Director PMO Manager
IT Project Scheduler
NSW - Sydney165 225 160 110150 - 190 200 - 250 140 - 180 90 - 130
NSW - Regional140 160 180 90130 - 160 140 - 180 140 - 200 70 - 110
VIC - Melbourne155 190 170 110130 - 190 160 - 220 140 - 220 90 - 140
VIC - Regional140 160 160 75120 - 160 140 - 180 140 - 180 70 - 85
QLD - Brisbane, Gold Coast & Sunshine Coast140 170 170 100120 - 160 150 - 200 140 - 200 60 - 150
SA - Adelaide130 160 145 110120 - 150 130 - 200 120 - 180 90 - 140
WA - Perth140 175 190 70120 - 160 150 - 210 180 - 200 60 - 90
ACT - Canberra150 180 170 110120 - 170 160 - 200 150 - 200 100 - 120
TAS - Hobart/Launceston120 130 150 70110 - 130 120 - 150 130 - 180 65 - 75
NT - Darwin140 175 160 90125 - 165 150 - 200 120 - 180 75 - 100
NZ - Auckland140 150 150 65120 - 160 135 - 175 135 - 175 55 - 75
NZ - Wellington130 150 130 60110 - 150 130 - 180 118 - 148 52 - 65
NZ - Christchurch130 150 130 60110 - 150 120 - 180 125 - 145 52 - 65

2018 Hays Salary Guide | 125
• All salaries shown are exclusive of superannuation (AU) or KiwiSaver (NZ)
• New Zealand salaries are represented in New Zealand dollars
NOTES:
INFORMATION TECHNOLOGY
PROJECTS & BUSINESS CHANGE Change Analyst Change ManagerSenior Change Manager/Change Lead
NSW - Sydney110 140 170100 - 120 120 - 160 150 - 190
NSW - Regional100 130 16090 - 120 110 - 160 140 - 190
VIC - Melbourne100 140 17090 - 120 110 - 160 150 - 190
VIC - Regional100 110 13090 - 120 100 - 130 120 - 160
QLD - Brisbane, Gold Coast & Sunshine Coast90 140 15070 - 110 100 - 180 120 - 180
SA - Adelaide85 120 13070 - 95 85 - 160 120 - 160
WA - Perth110 125 13090 - 120 100 - 150 120 - 150
ACT - Canberra100 120 14090 - 110 100 - 130 120 - 160
TAS - Hobart/Launceston90 110 13580 - 100 90 - 130 120 - 150
NT - Darwin90 120 14575 - 110 100 - 140 120 - 160
NZ - Auckland110 120 150100 - 120 95 - 130 130 - 200
NZ - Wellington100 100 14090 - 110 90 - 110 120 - 150
NZ - Christchurch100 115 14090 - 110 100 - 130 120 - 150
MISCELLANEOUS IT Trainer Technical Writer
NSW - Sydney90 8065 - 110 65 - 95
NSW - Regional90 10070 - 110 90 - 115
VIC - Melbourne90 10070 - 110 90 - 115
VIC - Regional75 8565 - 85 75 - 95
QLD - Brisbane, Gold Coast & Sunshine Coast90 8565 - 120 65 - 100
SA - Adelaide75 6555 - 110 55 - 92
WA - Perth85 9065 - 105 80 - 100
ACT - Canberra90 9080 - 100 80 - 100
TAS - Hobart/Launceston80 7570 - 90 70 - 90
NT - Darwin85 9070 - 110 80 - 100
NZ - Auckland80 8560 - 100 75 - 95
NZ - Wellington90 8870 - 110 78 - 95
NZ - Christchurch75 8065 - 85 75 - 95

126 | 2018 Hays Salary Guide
• All salaries shown are exclusive of superannuation (AU) or KiwiSaver (NZ)
• New Zealand salaries are represented in New Zealand dollars
NOTES:
INFORMATION TECHNOLOGY
MANAGEMENTInfrastructure Manager
Service Delivery Manager IT Manager
Development Manager
Applications Manager
NSW - Sydney150 150 165 150 130130 - 180 110 - 180 140 - 180 125 - 180 120 - 140
NSW - Regional120 130 130 130 130100 - 140 100 - 150 100 - 160 110 - 150 110 - 150
VIC - Melbourne140 140 155 140 140120 - 170 110 - 170 120 - 200 110 - 180 120 - 180
VIC - Regional110 110 90 120 110100 - 130 100 - 130 80 - 120 100 - 140 90 - 120
QLD - Brisbane, Gold Coast & Sunshine Coast125 130 140 140 140100 - 160 100 - 160 100 - 180 120 - 180 100 - 180
SA - Adelaide130 100 130 140 145100 - 160 80 - 125 85 - 160 100 - 220 110 - 220
WA - Perth150 130 135 130 120130 - 170 100 - 160 100 - 170 120 - 1150 100 - 140
ACT - Canberra140 140 150 145 145120 - 160 100 - 160 140 - 180 135 - 155 135 - 155
TAS - Hobart/Launceston110 95 120 110 100100 - 120 90 - 110 110 - 150 100 - 120 90 - 110
NT - Darwin130 120 140 130 120120 - 140 90 - 140 130 - 150 110 - 150 100 - 140
NZ - Auckland130 110 130 130 120100 - 150 85 - 140 120 - 150 120 - 155 110 - 140
NZ - Wellington127 110 120 130 11090 - 150 88 - 130 110 - 140 85 - 155 80 - 140
NZ - Christchurch115 100 120 110 110100 - 130 80 - 110 100 - 140 85 - 120 80 - 140
Enterprise Architect Head of Digital
Chief Security Officer CIO CTO
NSW - Sydney200 220 250 265 265150 - 250 180 - 250 200 - 300 210 - 350 210 - 350
NSW - Regional140 160 200 220 200130 - 160 130 - 200 180 - 220 180 - 240 160 - 240
VIC - Melbourne210 230 240 260 250190 - 250 180 - 300 200 - 300 220 - 350 220 - 350
VIC - Regional150 150 180 200 200130 - 180 130 - 180 150 - 210 180 - 220 180 - 220
QLD - Brisbane, Gold Coast & Sunshine Coast130 200 200 225 225110 - 150 165 - 250 165 - 250 150 - 300 150 - 300
SA - Adelaide140 150 180 230 215120 - 180 130 - 180 150 - 220 140 - 300 150 - 260
WA - Perth160 150 200 240 240140 - 180 130 - 180 180 - 220 220 - 250 220 - 250
ACT - Canberra220 150 180 230 220200 - 240 120 - 180 160 - 220 180 - 260 200 - 280
TAS - Hobart/Launceston140 140 120 180 150120 - 160 120 - 160 110 - 140 160 - 250 140 - 200
NT - Darwin185 175 180 230 220150 - 225 150 - 210 160 - 220 180 - 260 200 - 280
NZ - Auckland150 135 175 180 180130 - 200 110 - 180 150 - 220 150 - 240 150 - 240
NZ - Wellington150 135 175 180 180130 - 200 110 - 180 150 - 220 145 - 215 145 - 215
NZ - Christchurch150 135 175 180 180130 - 200 110 - 180 150 - 220 140 - 215 120 - 215

2018 Hays Salary Guide | 127
SALA
RY IN
FOR
MAT
ION
: CO
NST
RUCT
ION
, ARC
HIT
ECTU
RE &
EN
GIN
EERI
NG
AUSTRALIAAustralia’s construction and engineering industries will remain strong economic drivers during 2018-19 as they did during 2017-18, with continued staffing demand and vacancy activity – although trends do vary based on location.
Looking firstly at New South Wales, construction and engineering enjoyed another busy year with Sydney’s infrastructure market also picking up. Skilled Supervisors, Project Engineers and Estimators with experience in tunnelling, roads and rail projects will remain in demand. Contract Administrators, Project Engineers and Site Managers with experience in large health, institutional and commercial projects are also sought.
The architecture industry remains strong, with demand high for REVIT Architects, Interior Designers and Landscape Architects. With firms switching to this software, demand will continue.
The Newcastle and Hunter Valley region continues to see increased demand for Contract Administrators and Estimators in response to a growing number of building and infrastructure projects. Project Managers with experience in high-rise commercial and educational projects are sought too.
Given activity and staffing demand, upward salary pressure has been seen across all areas of construction in NSW, especially for Project Managers and Contract Administrators.
Canberra’s market continues to thrive with rapid population growth and low rental vacancies creating a strong residential construction boom. Demand exists for Project Managers, Site Managers and Contract Administrators in residential
as well as health, education and infrastructure projects. This booming market has led to intense competition for candidates, which has driven up salaries across the board.
Victoria’s market remains buoyant, with growth across all sectors including infrastructure, residential, education and health. Construction professionals at all levels are in demand as a result, from high-level Design Engineers to experienced Delivery Engineers on roads, tunnels, bridges and rail. Salaries are increasing in response to demand.
The state’s architecture and design market is strong too, with particular demand for Project Architects with technical knowledge. REVIT skills are also sought, driving up salaries for REVIT Drafters, Designers and Architects.
Turning to Queensland, Brisbane will have a solid 2018-19 driven by residential construction, creating demand for Project Managers, Contract Administrators and Estimators. The expansion of suburbs will also lead to commercial infrastructure projects and demand for Contract Administrators and Estimators with commercial experience. After a period of stagnation we are seeing salary increases for candidates with commercial and residential construction experience. We are also seeing an upsurge in demand for candidates with civil construction experience.
Queensland’s architecture industry is showing signs of improvement, with candidates with strong REVIT skills in demand.
The Gold Coast enjoyed a strong market in the lead up to the Commonwealth Games, with infrastructure, commercial and residential projects. After a number of years we are now seeing modest upward salary pressure, especially in construction management.
Perth’s construction industry is showing modest signs of improvement with more residential and commercial construction activity underway or awarded. The resources industry is investing in new or upgrade projects too, while funding commitments and a new rail system will drive civil construction forward. Civil construction Project Managers and
Contract Administrators are in demand. Salaries generally remain steady, although there are signs that the market will tighten in the coming year, which will lead to salary pressure.
Adelaide’s construction and engineering market continues to strengthen, with numerous civil projects creating huge demand for Site Engineers, Project Engineers and Project Managers with rail and road experience. The commercial construction market is strengthening too, with Commercial Project Managers, Contract Administrators, Site Managers and Estimators with proven experience delivering $15-25M commercial projects needed.
Residential construction is buoyant and requires Site Supervisors and Project Managers with medium density experience.
Project Architects with experience managing a project from end-to-end, as well as Architects with five or more years of experience are needed. Demand is helping to drive up salaries.
The Northern Territory’s construction industry remains strong, driven by major defence upgrades. Remote locations are busy with various upgrades and developments. Site Managers and Project Managers are needed, on both the contractor and client side. Architectural and engineering candidates, particularly those with REVIT skills and Civil and Structural Engineers, are in short supply too given the transient population. This is placing upward pressure on salaries.
In Tasmania, and Hobart in particular, the construction and engineering industry will remain busy with a number of projects planned. Project Managers with experience in high-rise construction and civil construction will be needed. Salaries will continue to rise in the face of local skills shortages.
The architecture industry remains strong, with demand high for Revit Architects, Interior Designers and Landscape Architects. With firms switching to this software, demand will continue.
“
”
Residential construction is buoyant and requires Site Supervisors and Project Managers with medium density experience.
“
”
CONSTRUCTION, ARCHITECTURE & ENGINEERING

128 | 2018 Hays Salary Guide
NEW ZEALANDLooking firstly at New Zealand’s construction market, Canterbury remains steady thanks to high civil investment and commercial activity. However as we approach the completion of the Christchurch rebuild, candidate supply is starting to outweigh demand, keeping salaries stable.
Auckland is active thanks to commercial and residential construction projects, particularly multi-storey apartments, townhouses and office builds. But cost reductions and project completions led to some redundancies and salary stagnations. Looking ahead, this will create a surplus of Project Managers and Site Forepersons, which will keep future salary increases minimal.
Since the 2016 Kaikoura earthquake, large-scale demolition and vertical commercial construction work has increased dramatically in Wellington. The latter is expected to continue at current rates until 2019. Activity in the residential building sector is increasing too given the shortage of affordable homes. This is creating demand for experienced Project Managers, Site Managers and Estimators. Given activity, salaries are increasing slightly as more contractors are willing to pay above market rates to retain top talent.
Turning to engineering, New Zealand’s structural engineering market is driven by seismic projects in both Wellington and Auckland. During 2017-18 the supply of experienced Intermediate and Senior Engineers fell across all disciplines as these professionals took roles overseas or returned to their home country where job opportunities had improved. Salaries increased as a result of demand.
Structural Engineers with seismic detailing and complex medium to large project experience will remain in high demand in 2018-19.
As New Zealand’s cities grow, civil engineering is increasingly busy. Salaries have increased slightly across the board since demand outweighs supply. A continuously increasing population will lead to further salary increases in 2018-19 for those in the water, stormwater and wastewater fields, and in transportation engineering and planning.
Roading Engineers, Transportation Engineers and Geometric Designers and Engineers will remain in demand for new or upgrade road network projects around the country. Civil Engineers with land development experience and Registered Surveyors will also be sought nation-wide.
Environmental Engineers and those with Three Waters experience will be needed in response to new land developments and roading projects, while the shortage of Civil 12D Designers will remain.
Within the architecture industry, Architects with delivery experience will be required in Auckland as major projects near completion. Salaries for Registered Architects have increased as a result.
At the mid-management level, Associate Architects who can design and manage a team are in high demand but short supply.
Multi-unit residential remains active in Auckland, creating demand for Project Managers and Site Managers. Salaries are increasing to attract experienced candidates.
Registered Architects and Senior Project Architects are in demand in Wellington’s active residential and large-scale
commercial and industrial sectors. Increased competition between architectural practices could lead to steady salary increases for senior staff as firms attempt to attract and retain top talent. Demand will remain greatest at the intermediate to senior levels.
New Zealand’s structural engineering market is driven by seismic projects in both Wellington and Auckland.
“”
As New Zealand’s cities grow, civil engineering is increasingly busy. Salaries have increased slightly across the board since demand outweighs supply.
“
”
CONSTRUCTION, ARCHITECTURE & ENGINEERINGSA
LARY
INFO
RM
ATIO
N: C
ON
STRU
CTIO
N, A
RCH
ITEC
TURE
& E
NG
INEE
RIN
G

2018 Hays Salary Guide | 129
• All salaries shown are exclusive of superannuation (AU) or KiwiSaver (NZ)
• New Zealand salaries are represented in New Zealand dollars
NOTES:
ARCHITECTURE
Graduate Architect2-5 yrs exp
Project Architect5-10 yrs exp
Architect5-10 yrs exp
Senior Architect10+ yrs exp Drafter
BIM/CAD Manager
NSW - Sydney 55 - 80 80 - 110 75 - 100 100 - 150 55 - 80 100 - 140
NSW - Regional 50 - 65 70 - 90 60 - 80 80 - 120 45 - 70 80 - 120
VIC - Melbourne 55 - 75 75 - 100 70 - 95 100 - 150 55 - 90 90 - 130
VIC - Regional 50 - 70 70 - 90 70 - 90 85 - 120 50 - 75 80 - 120
QLD - Brisbane, Gold Coast & Sunshine Coast 49 - 70 70 - 95 70 - 95 90 - 120 45 - 90 85 - 110
QLD - Regional 49 - 55 65 - 80 56 - 75 70 - 90 45 - 65 70 - 90
SA - Adelaide 49 - 60 60 - 90 56 - 75 75 - 110 40 - 70 70 - 110
WA - Perth 49 - 65 70 - 85 70 - 90 90 - 120 50 - 80 80 - 120
ACT - Canberra 49 - 65 80 - 110 65 - 90 90 - 130 50 - 90 90 - 120
TAS - Hobart/Launceston 49 - 55 65 - 80 70 - 90 80 - 100 40 - 50 80 - 100
NT - Darwin 49 - 65 57 - 75 70 - 90 90+ 40 - 80 65 - 120
NZ - Auckland 55 - 75 85 - 110 80 - 120 120 - 140 70 - 110 95 - 130
NZ - Wellington 50 - 65 80 - 110 70 - 90 90 - 130 55 - 90 85 - 120
NZ - Christchurch 50 - 70 80 - 110 75 - 110 110 - 140 45 - 90 80 - 120
Interior Designer2-7 yrs exp
Senior Interior Designer7+ yrs exp
Planner2-5 yrs exp
Senior Planner5+ yrs exp
Urban Designer
Landscape Architect
NSW - Sydney 55 - 85 85 - 130 55 - 80 85 - 120 55 - 120 55 - 115
NSW - Regional 45 - 80 80 - 90 45 - 75 75 - 90 55 - 90 55 - 75
VIC - Melbourne 55 - 80 85 - 130 55 - 90 90 - 135 55 - 130 55 - 115
VIC - Regional 50 - 80 80 - 110 55 - 75 75 - 110 45 - 90 45 - 90
QLD - Brisbane, Gold Coast & Sunshine Coast 45 - 70 65 - 90 55 - 75 68 - 100 55 - 90 65 - 90
QLD - Regional 45 - 55 65 - 80 50 - 65 65 - 90 75 - 85 45 - 80
SA - Adelaide 45 - 65 60 - 90 50 - 70 70 - 100 75 - 110 50 - 80
WA - Perth 45 - 75 75 - 90 45 - 65 75 - 110 55 - 110 55 - 90
ACT - Canberra 55 - 90 90 - 120 80 - 120 80 - 120 65 - 90 60 - 100
TAS - Hobart/Launceston 45 - 60 60 - 80 50 - 65 65 - 95 55 - 70 55 - 80
NT - Darwin 40 - 60 60 - 90 45 - 65 65 - 110 55 - 120 45 - 80
NZ - Auckland 50 - 70 70 - 95 45 - 70 70 - 120 70 - 110 75 - 110
NZ - Wellington 45 - 70 70 - 95 45 - 70 70 - 120 60 - 100 60 - 100
NZ - Christchurch 45 - 70 70 - 90 45 - 70 70 - 120 70 - 110 55 - 100

130 | 2018 Hays Salary Guide
ENGINEERING
• All salaries shown are exclusive of superannuation (AU) or KiwiSaver (NZ)
• New Zealand salaries are represented in New Zealand dollars
NOTES:
BUILDING SERVICES DESIGN CONSULTANCY
CAD Drafter - Design Drafter CAD Manager
Graduate/Entry-level Design Engineer
Intermediate- Senior Design Engineer
Associate/Senior Associate
Principal/Director
NSW - Sydney 50 - 90 70 - 90 40 - 55 55 - 100 100 - 137 137 - 192
NSW - Regional 50 - 70 60 - 75 45 - 60 55 - 80 100 - 137 137+
VIC - Melbourne 50 - 90 70 - 90 40 - 55 60 - 120 100 - 137 137 - 192
VIC - Regional 45 - 80 60 - 80 40 - 65 60 - 90 90 - 130 130+
QLD - Brisbane, Gold Coast & Sunshine Coast 50 - 70 80 - 100 50 - 65 70 - 120 120 - 140 140 - 180
QLD - Regional 45 - 55 65 - 90 45 - 60 70 - 110 110 - 135 130+
SA - Adelaide 40 - 80 65 - 80 37 - 55 55 - 85 90 - 130 130+
WA - Perth 60 - 80 80 - 110 50 - 70 80 - 120 110 - 130 130+
ACT - Canberra 40 - 65 65 - 80 50 - 65 65 - 110 110 - 130 130+
TAS - Hobart 45 - 60 60 - 90 50 - 60 60 - 80 90 - 110 120+
NT - Darwin 40 - 70 60 - 80 40 - 65 65 - 110 110 - 145 130+
NZ - Auckland 50 - 80 85 - 120 50 - 70 75 - 120 120 - 140 150+
NZ - Wellington 50 - 80 70 - 100 50 - 70 75 - 120 100 - 130 130 - 150
NZ - Christchurch 50 - 70 70 - 100 50 - 60 75 - 120 110 - 130 130 - 150
BUILDING SERVICES CONTRACTOR
Foreperson/Supervisor
Estimator -Snr Estimator
Project Manager
Senior Project Manager
Operations Manager
Building Services Manager
NSW - Sydney 70 - 80 70 - 135 80 - 120 110 - 137 135 - 165 130 - 185
NSW - Regional 55 - 70 65 - 80 80 - 90 100 - 120 105 - 120 110 - 165
VIC - Melbourne 65 - 75 70 - 130 80 - 125 110 - 170 110 - 170 110 - 175
VIC - Regional 55 - 75 70 - 130 80 - 120 90 - 137 110 - 155 110 - 175
QLD - Brisbane, Gold Coast & Sunshine Coast 80 - 110 70 - 120 90 - 130 100 - 150 110 - 165 130 - 175
QLD - Regional 70 - 90 70 - 120 90 - 119 100 - 135 140 - 160 130 - 165
SA - Adelaide 55 - 70 50 - 110 65 - 120 75 - 145 100 - 165 110 - 145
WA - Perth 65 - 90 85 - 120 90 - 130 120 - 150 140 - 180 150 - 180
ACT - Canberra 55 - 65 55 - 75 70 - 90 80 - 110 90 - 130 90 - 130
TAS - Hobart 60 - 75 70 - 90 70 - 100 90 - 120 110 - 150 100 - 130
NT - Darwin 65 - 90 65 - 120 75 - 130 110 - 145 130 - 185 100 - 165
NZ - Auckland 60 - 80 60 - 105 85 - 110 95 - 130 110 - 150 110 - 170
NZ - Wellington 50 - 65 50 - 100 80 - 110 90 - 130 100 - 140 120 - 150
NZ - Christchurch 55 - 75 70 - 100 90 - 110 100 - 130 110 - 130 100 - 150

2018 Hays Salary Guide | 131
ENGINEERING
• All salaries shown are exclusive of superannuation (AU) or KiwiSaver (NZ)
• New Zealand salaries are represented in New Zealand dollars
NOTES:
CIVIL & STRUCTURAL DrafterCivil Designer Drafter
Civil/Structural Engineer
Client Side Representative/Resident Engineer
Environmental Engineer
NSW - Sydney 50 - 90 65 - 120 55 - 130 60 - 130 65 - 130
NSW - Regional 50 - 75 50 - 75 60 - 95 50 - 85 60 - 110
VIC - Melbourne 50 - 90 65 - 125 65 - 130 60 - 130 45 - 120
VIC - Regional 40 - 75 45 - 90 55 - 130 65 - 110 41 - 120
QLD - Brisbane, Gold Coast & Sunshine Coast 40 - 80 70 - 110 70 - 140 75 - 137 70 - 120
QLD - Regional 45 - 70 70 - 95 70 - 125 85 - 120 60 - 90
SA - Adelaide 40 - 60 45 - 75 65 - 80 55 - 90 70 - 110
WA - Perth 50 - 80 75 - 100 80 - 110 80 - 110 80 - 110
ACT - Canberra 50 - 55 50 - 80 60 - 130 60 - 110 55 - 110
TAS - Hobart 50 - 55 45 - 65 60 - 80 75 - 110 60 - 80
NT - Darwin 37 - 60 55 - 80 65 - 130 75 - 130 75 - 110
NZ - Auckland 50 - 85 65 - 90 65 - 140 80 - 130 60 - 130
NZ - Wellington 50 - 80 45 - 90 60 - 140 60 - 120 50 - 120
NZ - Christchurch 50 - 80 45 - 90 60 - 140 60 - 120 50 - 120
Structural/Civil Project Engineer Land Surveyor Associate
Group Manager/Principal
NSW - Sydney 50 - 130 75 - 137 110 - 145 150+
NSW - Regional 60 - 110 70 - 120 110 - 130 130+
VIC - Melbourne 50 - 120 55 - 130 120 - 160 150+
VIC - Regional 50 - 110 50 - 120 110 - 145 130+
QLD - Brisbane, Gold Coast & Sunshine Coast 70 - 130 60 - 120 110 - 145 150+
QLD - Regional 70 - 125 70 - 115 120 - 150 150+
SA - Adelaide 75 - 110 55 - 80 100 - 130 137+
WA - Perth 85 - 120 75 - 100 110 - 140 140+
ACT - Canberra 80 - 120 45 - 80 80 - 150 150+
TAS - Hobart 65 - 90 60 - 85 90 - 110 120 - 160
NT - Darwin 65 - 130 75 - 90 120 - 165 137+
NZ - Auckland 80 - 140 60 - 120 130 - 170 150+
NZ - Wellington 65 - 140 55 - 120 120 - 160 140 - 200
NZ - Christchurch 65 - 140 55 - 120 120 - 160 140 - 200

132 | 2018 Hays Salary Guide
ENGINEERING
• All salaries shown are exclusive of superannuation (AU) or KiwiSaver (NZ)
• New Zealand salaries are represented in New Zealand dollars
NOTES:
RAIL INFRASTRUCTURESignalling Designer
Signalling Supervisor
Signalling Maintenance Technician
Permanent Way Designer
Permanent Way Track
NSW - Sydney 80 - 130 80 - 135 82 - 105 95 - 145 85 - 120
NSW - Regional 65 - 95 65 - 85 45 - 75 70 - 95 70 - 95
VIC - Melbourne 85 - 140 85 - 140 75 - 105 100 - 150 85 - 130
VIC - Regional 75 - 100 75 - 100 60 - 85 75 - 110 70 - 110
QLD - Brisbane, Gold Coast & Sunshine Coast 75 - 110 70 - 95 60 - 85 80 - 110 75 - 100
QLD - Regional 75 - 110 70 - 95 60 - 85 78 - 110 70 - 100
SA - Adelaide 70 - 85 60 - 90 55 - 75 70 - 100 70 - 95
WA - Perth 80 - 120 90 - 130 85 - 110 75 - 140 90 - 145
ACT - Canberra 50 - 120 55 - 80 N/A N/A 50 - 120
TAS - Hobart 75 - 110 75 - 110 65 - 75 75 - 100 75 - 100
NT - Darwin 73 - 110 75 - 120 60 - 85 80 - 120 75 - 110
NZ - Auckland 65 - 95 70 - 100 60 - 85 70 - 110 70 - 110
NZ - Wellington 55 - 80 65 - 100 55 - 80 70 - 110 80 - 110
NZ - Christchurch 55 - 80 65 - 100 55 - 80 70 - 110 80 - 110
LOCAL GOVERNMENT Traffic Engineer Civil DesignerCivil Project Manager Asset Manager Town Planner
NSW - Sydney 55 - 110 55 - 90 90 - 110 70 - 85 45 - 90
NSW - Regional 60 - 90 60 - 90 80 - 110 60 - 90 55 - 90
VIC - Melbourne 55 - 75 60 - 80 85 - 120 75 - 100 55 - 90
VIC - Regional 55 - 75 60 - 80 75 - 130 70 - 110 55 - 90
QLD - Brisbane, Gold Coast & Sunshine Coast 55 - 90 55 - 80 70 - 110 55 - 85 40 - 85
QLD - Regional 55 - 85 70 - 85 80 - 150 55 - 85 50 - 85
SA - Adelaide 50 - 70 45 - 60 65 - 80 65 - 80 40 - 75
WA - Perth 80 - 100 65 - 85 80 - 100 80 - 100 65 - 80
ACT - Canberra 70 - 90 55 - 80 N/A N/A 50 - 85
TAS - Hobart 60 - 80 60 - 80 80 - 110 70 - 90 50 - 75
NT - Darwin 40 - 80 40 - 75 53 - 110 55 - 85 40 - 90
NZ - Auckland 60 - 120 65 - 110 90 - 150 80 - 130 65 - 110
NZ - Wellington 60 - 80 50 - 80 80 - 120 60 - 80 55 - 90
NZ - Christchurch 60 - 80 50 - 80 80 - 120 60 - 80 55 - 100

2018 Hays Salary Guide | 133
CONSTRUCTION
• All salaries shown are exclusive of superannuation (AU) or KiwiSaver (NZ)
• New Zealand salaries are represented in New Zealand dollars
NOTES:
CONSTRUCTION CIVIL Leading Hand Foreperson Site Engineer Project Engineer Project Manager
NSW - Sydney 60 - 70 80 - 135 55 - 80 90 - 130 135 - 185
NSW - Regional 60 - 85 90 - 135 55 - 80 120 - 130 140 - 190
VIC - Melbourne 55 - 65 80 - 150 60 - 90 80 - 150 100 - 190
VIC - Regional 55 - 65 70 - 110 55 - 65 70 - 130 90 - 155
QLD - Brisbane, Gold Coast & Sunshine Coast 60 - 80 90 - 130 60 - 90 90 - 130 130 - 250
QLD - Regional 50 - 75 75 - 120 75 - 85 85 - 120 140 - 170
SA - Adelaide 45 - 65 80 - 115 65 - 80 75 - 120 80 - 130
WA - Perth 80 - 85 100 - 120 70 - 90 90 - 110 140 - 160
ACT - Canberra 60 - 70 90 - 120 60 - 90 80 - 115 100 - 150
TAS - Hobart/Launceston 55 - 60 60 - 75 55 - 70 65 - 80 80 - 110
NT - Darwin 65 - 85 70 - 110 60 - 120 80 - 140 120 - 150
NZ - Auckland 45 - 60 70 - 85 60 - 80 75 - 110 110 - 160
NZ - Wellington 45 - 60 55 - 80 65 - 80 75 - 110 100 - 130
NZ - Christchurch 60 - 70 65 - 80 60 - 80 75 - 100 90 - 140
EstimatorConstruction Manager
Contracts Administrator/Qty Surveyor - Junior
Contracts Administrator/Qty Surveyor - Senior Design Manager
NSW - Sydney 80 - 165 185 - 225 65 - 80 80 - 130 110 - 135
NSW - Regional 80 - 130 165 - 200 70 - 100 100 - 130 100 - 130
VIC - Melbourne 75 - 165 150 - 250 55 - 75 80 - 150 100 - 150
VIC - Regional 65 - 90 110 - 145 55 - 75 75 - 135 80 - 115
QLD - Brisbane, Gold Coast & Sunshine Coast 110 - 250 180 - 250 65 - 90 90 - 140 110 - 190
QLD - Regional 90 - 150 145 - 200 65 - 85 85 - 130 110 - 180
SA - Adelaide 90 - 135 110 - 160 50 - 75 75 - 110 75 - 110
WA - Perth 80 - 120 100 - 130 60 - 70 70 - 100 80 - 110
ACT - Canberra 70 - 100 110 - 200 50 - 70 70 - 115 80 - 120
TAS - Hobart/Launceston 70 - 90 110 - 165 50 - 70 80 - 120 110 - 135
NT - Darwin 80 - 180 114 - 220 60 - 90 80 - 135 90 - 160
NZ - Auckland 70 - 150 140 - 160 55 - 90 110 - 150 100 - 150
NZ - Wellington 70 - 120 120 - 150 55 - 80 90 - 130 90 - 125
NZ - Christchurch 55 - 130 120 - 160 55 - 90 100 - 140 100 - 150

134 | 2018 Hays Salary Guide
CONSTRUCTION
• All salaries shown are exclusive of superannuation (AU) or KiwiSaver (NZ)
• New Zealand salaries are represented in New Zealand dollars
NOTES:
CONSTRUCTION BUILDING Leading Hand Foreperson Site EngineerProject Engineer
Project Manager Estimator
NSW - Sydney 70 - 110 130 - 190 90 - 115 120 - 170 150 - 250 100 - 180
NSW - Regional 60 - 90 80 - 110 60 - 85 80 - 110 140 - 200 90 - 150
VIC - Melbourne 60 - 75 65 - 135 45 - 75 75 - 150 110 - 200 65 - 150
VIC - Regional 50 - 65 80 - 110 40 - 65 60 - 120 100 - 145 90 - 185
QLD - Brisbane, Gold Coast & Sunshine Coast 60 - 70 110 - 140 65 - 90 75 - 120 130 - 200 100 - 200
QLD - Regional 65 - 80 80 - 115 65 - 90 85 - 120 130 - 190 80 - 190
SA - Adelaide 45 - 70 65 - 80 40 - 60 65 - 110 100 - 165 85 - 125
WA - Perth 60 - 80 90 - 95 90 - 100 90 - 110 110 - 150 80 - 120
ACT - Canberra 55 - 80 90 - 130 60 - 75 80 - 120 120 - 200 70 - 130
TAS - Hobart/Launceston 55 - 65 65 - 85 55 - 75 80 - 100 110 - 165 75 - 100
NT - Darwin 65 - 85 70 - 110 60 - 85 80 - 110 110 - 150 75 - 150
NZ - Auckland 55 - 65 65 - 80 70 - 90 75 - 100 110 - 175 70 - 180
NZ - Wellington 45 - 60 55 - 75 60 - 80 80 - 110 90 - 140 80 - 140
NZ - Christchurch 55 - 65 70 - 85 65 - 85 85 - 100 90 - 150 55 - 130
Construction Manager
Contracts Administrator/ Qty Surveyor - Entry-level
Contracts Administrator/ Qty Surveyor - Senior
Design Manager Site Manager
NSW - Sydney 200 - 300 65 - 80 120 - 180 130 - 180 150 -250
NSW - Regional 120 - 165 70 - 90 100 - 130 110 - 135 100 - 145
VIC - Melbourne 145 - 230 40 - 75 75 - 200 110 - 165 100 - 180
VIC - Regional 135 - 185 36 - 65 80 - 120 90 - 120 80 - 110
QLD - Brisbane, Gold Coast & Sunshine Coast 135 - 230 60 - 70 90 - 140 110 - 185 100 - 160
QLD - Regional 140 - 220 55 - 85 85 - 140 120 - 170 95 - 140
SA - Adelaide 120 - 200 36 - 55 65 - 135 80 - 110 75 - 125
WA - Perth 130 - 200 75 - 100 100 - 140 90 - 120 120 - 170
ACT - Canberra 140 - 300 50 - 75 80 - 140 75 - 130 100 - 160
TAS - Hobart/Launceston 130 - 165 55 - 70 80 - 120 90 - 120 80 - 100
NT - Darwin 115 - 180 60 - 85 80 - 135 90 - 135 100 - 145
NZ - Auckland 150 - 200 45 - 80 90 - 150 90 - 120 90 - 140
NZ - Wellington 130 - 150 50 - 70 90 - 130 90 - 120 85 - 120
NZ - Christchurch 130 - 160 50 - 80 100 - 130 100 - 150 85 - 115

2018 Hays Salary Guide | 135
CONSTRUCTION
• All salaries shown are exclusive of superannuation (AU) or KiwiSaver (NZ)
• New Zealand salaries are represented in New Zealand dollars
NOTES:
LOCAL GOVERNMENTBuilding Surveyor
Facilities Coordinator
Facilities Manager Project Manager
Property Manager
NSW - Sydney 60 - 110 40 - 55 50 - 90 75 - 100 45 - 115
NSW - Regional 55 - 85 55 - 75 75 - 95 75 - 100 45 - 105
VIC - Melbourne 120 - 180 65 - 70 70 - 90 80 - 120 80 - 100
VIC - Regional 100 - 130 60 - 70 70 - 80 70 - 90 70 - 85
QLD - Brisbane, Gold Coast & Sunshine Coast 50 - 80 40 - 55 60 - 90 60 - 100 45 - 75
QLD - Regional 65 - 100 45 - 70 70 - 95 90 - 115 45 - 80
SA - Adelaide 60 - 85 45 - 65 70 - 95 65 - 95 55 - 95
WA - Perth 80 - 110 60 - 80 80 - 100 75 - 110 70 - 100
ACT - Canberra N/A N/A N/A N/A N/A
TAS - Hobart/Launceston 70 - 90 60 - 75 70 - 90 80 - 100 70 - 90
NT - Darwin 50 - 80 40 - 60 60 - 90 60 - 100 45 - 75
NZ - Auckland 60 - 100 45 - 55 70 - 100 90 - 140 70 - 120
NZ - Wellington 50 - 95 45 - 60 60 - 90 70 - 120 70 - 120
NZ - Christchurch 55 - 95 45 - 60 65 - 90 80 - 120 70 - 120
Find out all about the architecture and engineering industries across Australia & New Zealand in our reports ‘The Role of an Architect’ and ‘The Modern Engineer’. Download your copy now.
hays.com.au/architect hays.net.nz/architecthays.com.au/engineer hays.net.nz/engineer

136 | 2018 Hays Salary Guide
SALA
RY IN
FOR
MAT
ION
: PRO
PERT
Y
AUSTRALIAThe 2017-18 financial year was an active one for Australia’s property market, particularly in the Eastern states. This trend should continue with increased positivity reaching across to South Australia and Western Australia, leading to rising vacancy activity.
Looking at trends by location, New South Wales remains buoyant in all sectors. A strong pipeline of residential stock underpins good levels of investment, both domestic and international. Meanwhile, government investment in major growth precincts and infrastructure projects will maintain positive market conditions.
In the residential market, there has been reduced pressure on candidate availability as fewer developments have commenced. Demand remains high for those with specialist development experience in the education, healthcare and hotel sectors, as well as Client Side Project Managers. However this hasn’t resulted in salary pressure.
Vacancy rates remain low in the commercial sector in New South Wales, unlike Queensland where major developments are commencing. This will put pressure on owners to upgrade their assets and increase competition for good tenancies. As a result, Client Side Project Managers with fitout experience and top Commercial Leasing Managers will be in demand. This will lead to salary increases.
Queensland’s development market is positive too, with low and medium density housing needed in major growth areas and a higher level of foreign investment. Residential Property Managers are therefore in high demand, with salaries expected to increase slightly as a result. Employers will also offer lifestyle incentives such as wellness programs and
flexible working arrangements to help attract and retain top talent.
Turning to Victoria, foreign investment restrictions have impacted the CBD and inner suburb apartment market however the development market remains strong with significant investment in land estate projects and owner occupier medium density sites. With nearly 300 land projects in Victoria, Project Managers with land subdivision experience are in demand and can generally achieve a higher remuneration package.
The ACT will see increased demand for Property and Strata Managers as multi-unit developments continue to come out of the ground. Development Managers will also be sought as the light rail project impacts developments in its corridor and new land is released across the territory. Salaries will increase slightly over the coming 12 months in response to demand.
South Australia has seen a high level of investment into medium density and land development projects across the state. This will result in sustained growth this financial year and will positively impact the salaries being offered for Commercial and Residential Property Managers.
In Western Australia, CBD commercial vacancy levels are decreasing slightly and demand for Sales and Leasing Executives outstrips supply. This will not have a massive impact on salaries. Retail is a highly active market with major refurbishments and developments creating demand for highly experienced Centre and Retail Managers. Demand is having a positive impact on salaries for these roles.
Finally, in the Northern Territory, Client Side Project Managers are needed to work on defence and remote housing projects. This will impact the local candidate market, resulting in salary pressure.
NEW ZEALANDThroughout 2017-18 commercial vacancy rates fell in Wellington due to demolition and remedial works but rose in Auckland in response to growth in prime vacancy space. After a buoyant few years, Christchurch’s property market began to settle as a more long-term development plan took shape.
In 2018-19 new commercial building developments in Auckland, the next stage of Christchurch’s CBD rebuild and the replacement of demolished buildings in Wellington will create vacancy activity. Add increased population growth in regional centres and more commercial space will be available, prompting property companies to consider adding additional headcount.
Residential property demand will depend on affordability, government policy, labour availability and the possible relaxing of loan-to-value ratios (LVRs) to accommodate first home buyers. In regional locations, residential property demand will increase for affordability and lifestyle reasons.
In response to these trends, Commercial Property Brokers with office leasing experience have and will continue to be sought, as will Residential and Commercial Development Managers to scope feasible project opportunities. While demand has not seen senior salaries rise, entry-level salaries have increased.
Looking ahead, the increase in new property developments will continue to drive up demand for experienced Property Managers and Client Side Project Managers. Those with strong relationships and networking skills are offered a premium salary. Experience, credibility and reputation factor favourably in hiring decisions, although some organisations are starting to invest in entry-level or trainee professionals who can eventually create and manage their own client portfolios.
New South Wales remains buoyant in all sectors. A strong pipeline of residential stock underpins good levels of investment, both domestic and international.
“
”
The ACT will see increased demand for Property and Strata Managers as multi-unit developments continue to come out of the ground.
“
”
PROPERTY

2018 Hays Salary Guide | 137
• All salaries shown are exclusive of superannuation (AU) or KiwiSaver (NZ)
• New Zealand salaries are represented in New Zealand dollars
NOTES:
PROPERTY
Commercial/Industrial/Retail Property Management 0-3 yrs exp
Commercial/Industrial/Retail Property Management 3+ yrs exp
Residential Property Manager 0-3 yrs
NSW - Sydney 50 - 70 65 - 120 45 - 65
NSW - Regional 45 - 60 60 -110 45 - 65
VIC - Melbourne 40 - 60 60 - 100 45 - 55
VIC - Regional 36 - 55 55 - 95 36 - 50
QLD - Brisbane, Gold Coast & Sunshine Coast 45 - 60 55 - 100 40 - 50
QLD - Regional 36 - 55 55 - 85 36 - 50
SA - Adelaide 36 - 65 60 - 85 39 - 55
WA - Perth 50 - 75 65 - 135 40 - 60
ACT - Canberra 50 - 65 65 - 110 45 - 60
TAS - Hobart 50 - 65 65 - 85 40 - 55
NT - Darwin 55 - 75 60 - 100 45 - 60
NZ - Auckland 55 - 70 80 - 100 60 - 80
NZ - Wellington 55 - 70 80 - 100 60 - 80
NZ - Christchurch 55 - 70 80 - 100 60 - 80
Residential Property Manager 3+ yrs
Asset Manager 0-3 yrs exp
Asset Manager 3+ yrs exp
NSW - Sydney 65 - 80 65 - 100 85 - 165
NSW - Regional 65 - 80 65 - 100 75 - 110
VIC - Melbourne 55 - 80 65 - 90 90 - 120
VIC - Regional 45 - 85 60 - 85 85 - 115
QLD - Brisbane, Gold Coast & Sunshine Coast 55 - 70 65 - 85 90 - 125
QLD - Regional 45 - 65 70 - 90 90 - 120
SA - Adelaide 50 - 70 55 - 85 68 - 110
WA - Perth 60 - 85 75 - 90 90 - 135
ACT - Canberra 60 - 90 70 - 100 90 - 130
TAS - Hobart 50 - 65 60 - 80 80 - 110
NT - Darwin 55 - 75 65 - 90 80 - 125
NZ - Auckland 80 - 100 90 - 110 110 - 150
NZ - Wellington 80 - 100 80 - 100 100 - 130
NZ - Christchurch 80 - 100 80 - 100 100 - 130

138 | 2018 Hays Salary Guide
• All salaries shown are exclusive of superannuation (AU) or KiwiSaver (NZ)
• New Zealand salaries are represented in New Zealand dollars
NOTES:
PROPERTY
Retail Centre Manager Lease AdministratorCommercial/Industrial Sales & Leasing
NSW - Sydney 80 - 130 50 - 80 60 - 150
NSW - Regional 70 - 120 45 - 80 55 - 120
VIC - Melbourne 75 - 130 45 - 60 60 - 120
VIC - Regional 65 - 105 36 - 50 55 - 115
QLD - Brisbane, Gold Coast & Sunshine Coast 80 - 120 40 - 60 50 - 150
QLD - Regional 75 - 155 36 - 50 45 - 165
SA - Adelaide 75 - 140 50 - 65 50 - 100
WA - Perth 75 - 140 40 - 55 75 - 165
ACT - Canberra 90 - 140 50 - 65 70 - 140
TAS - Hobart 70 - 110 40 - 55 55 - 90
NT - Darwin 80 - 120 45 - 60 55 - 100
NZ - Auckland 90 - 150 50 - 70 130 - 200
NZ - Wellington 90 - 120 45 - 60 130 - 150
NZ - Christchurch 90 - 120 45 - 60 130 - 150
Valuer CPV/RPV 0-3 yrs
Valuer CPV/RPV 3+ yrs
Client Side Project Manager0-3 yrs
Client Side Project Manager 3+ yrs
Client Side Project Director
NSW - Sydney 45 - 85 65 - 120 70 - 100 100 - 160 160 - 220
NSW - Regional 40 - 80 55 - 100 70 - 100 100 - 160 160 - 220
VIC - Melbourne 55 - 65 65 - 110 55 - 100 100 - 150 150 - 250
VIC - Regional 45 - 65 65 - 100 55 - 100 100 - 150 150 - 250
QLD - Brisbane, Gold Coast & Sunshine Coast 37 - 75 70 - 100 70 - 90 90 - 140 140 - 200
QLD - Regional 37 - 75 65 - 90 50 - 80 80 - 110 110 - 150
SA - Adelaide 45 - 75 65 - 100 60 - 80 75 - 110 120 - 250
WA - Perth 55 - 82 75 - 120 65 - 100 100 - 150 150 - 200
ACT - Canberra 50 - 75 75 - 110 70 - 110 110 - 160 160 - 240
TAS - Hobart 50 - 68 65 - 90 60 - 80 75 - 110 120 - 220
NT - Darwin 50 - 75 65 - 110 65 - 85 85 - 140 150 - 200
NZ - Auckland 50 - 80 80 - 130 70 - 90 90 - 140 160 - 200
NZ - Wellington 50 - 80 80 - 130 70 - 90 80 - 120 120 - 150
NZ - Christchurch 50 - 80 80 - 130 70 - 90 80 - 120 120 - 150

2018 Hays Salary Guide | 139
PROPERTY
• All salaries shown are exclusive of superannuation (AU) or KiwiSaver (NZ)
• New Zealand salaries are represented in New Zealand dollars
NOTES:
Acquisitions0-4 yrs exp
Acquisitions 4+ yrs
Assistant Development Manager
Development Manager
Development Director
NSW - Sydney 70 - 120 100 - 400 55 - 120 120 - 250 200 - 400
NSW - Regional 55 - 95 100 - 300 55 - 110 120 - 250 200 - 400
VIC - Melbourne 75 - 95 95 - 150 55 - 85 100 - 200 200 - 300
VIC - Regional 65 - 100 90 - 165 50 - 85 110 - 155 155 - 200
QLD - Brisbane, Gold Coast & Sunshine Coast 70 - 100 80 - 155 60 - 80 100 - 180 170 - 300
QLD - Regional 55 - 100 75 - 140 45 - 65 100 - 150 150 - 200
SA - Adelaide 40 - 85 110 - 140 50 - 90 130 - 200 145 - 230
WA - Perth 55 - 100 110 - 160 60 - 90 110 - 155 165 - 230
ACT - Canberra 60 - 100 90 - 180 60 - 90 100 - 180 180 - 240
TAS - Hobart 65 - 95 80 - 110 50 - 85 100 - 140 135 - 165
NT - Darwin 50 - 85 65 - 110 50 - 85 110 - 145 145 - 185
NZ - Auckland 60 - 80 80 - 120 70 - 120 180 - 250 300 - 400
NZ - Wellington 60 - 80 70 - 110 70 - 110 150 - 200 250 - 350
NZ - Christchurch 60 - 80 70 - 110 70 - 110 150 - 200 250 - 350

140 | 2018 Hays Salary Guide
SALA
RY IN
FOR
MAT
ION
: FA
CILI
TIES
MA
NA
GEM
ENT
AUSTRALIAAustralia’s construction boom is underpinning a strong facilities management jobs market. Thousands of extra assets are being delivered nationwide, and with positive forward work schedules the outlook for FM professionals wanting to change jobs or advance their career is encouraging.
Adding to vacancy activity is the continued trend of outsourcing. Large contracts have also recently changed hands, further fuelling turnover.
In addition, the consolidation of FM companies has created a dominant tier 1 that is vertically integrating and either adding tradespeople to their team or partnering with trade sub-contractors.
In terms of skills in demand, technical Project Managers with an engineering, construction or architecture background who can work in a range of sectors are sought.
So too are technical HSE professionals, Village Managers, and Buildings and Project Managers, particularly those with a construction or local government background.
In Western Australia and Queensland, those with a FIFO soft services background are sought too.
We’re also seeing demand in the public sector for Senior Facilities Managers with commercial backgrounds or private experience to drive efficiencies. General building maintenance, grounds, gardens and civil maintenance skills are needed too.
Growth in the healthcare, education and aged care sectors is fuelling demand for candidates with strong technical skills in these areas.
Given skill shortages, particularly for quality Project Managers, the FMA is
working hard to have FM recognised as a professional discipline, which will help to attract top talent. We’re also seeing large FM companies grow their graduate programs in response to skill shortages.
Despite demand, salaries remain steady for Project Managers and Facilities Managers since contracts have tight budgets. Employers are instead relying on their brand and projects to attract and retain staff.
In other trends, the public sector continues to hire almost exclusively on a contract basis, with the exception being Victoria where local councils are securing people in permanent roles in an attempt to overcome skill shortages and complete projects on time and to a high standard in an election year.
Turning to soft services, which is an increasingly significant segment, we have this year added dedicated tables in this area to our Salary Guide. Supporting technical hard services, soft services professionals in security, cleaning, helpdesk and catering are increasingly sought after, Most vacancies are at the officer level, with mid and upper management opportunities available too.
Across the country many soft service providers have won new contracts or extended existing ones, which has created salary pressure. Despite this, employers have kept salaries fairly steady.
NEW ZEALANDDuring 2017-18 positive conditions led to increasing demand for both hard and soft specialist FM professionals. This will continue throughout 2018-19 as many FM companies near full capacity.
An increasing number of property owners are investing in quality FM systems. Given building maintenance expenses, they are therefore outsourcing some or all of these
responsibilities to companies that are capable of managing both costs and operational efficiencies.
In other trends, overseas facilities management companies and contractors are entering New Zealand to establish or expand their market share. They bring new ideas to the industry and higher levels of service capability, but also increased competition that will further grow demand for Facilities Managers and Service Engineers as well as Helpdesk and hands-on facilities tradespeople.
Given existing skill shortages, salaries will increase in response to demand. For certain roles, such as Senior Facilities Managers and Engineers, double digit salary growth is expected.
Finally, employers are more open to considering candidates from overseas, particularly those from the UK, USA, Canada, South Africa and Australia who possess the specialist facilities management experience required. However, salaries will not be impacted by this increased candidate pool since it takes time for these candidates to relocate and commence a role.
Technical Project Managers with an engineering, construction or architecture background who can work in a range of sectors are sought.
“
”
The public sector continues to hire almost exclusively on a contract basis, with the exception being Victoria.
“
”
An increasing number of property owners are investing in quality FM systems.
“”
FACILITIES MANAGEMENT

2018 Hays Salary Guide | 141
• All salaries shown are exclusive of superannuation (AU) or KiwiSaver (NZ)
• New Zealand salaries are represented in New Zealand dollars
NOTES:
FACILITIES MANAGEMENT
Building Manager
Facilities Coordinator
Facilities Manager Service Manager
NSW - Sydney 65 - 80 50 - 65 70 - 100 80 - 150
NSW - Regional 60 - 70 50 - 65 70 - 100 80 - 130
VIC - Melbourne 65 - 75 60 - 70 85 - 110 100 - 120
VIC - Regional 65 - 75 50 - 70 80 - 110 100 - 120
QLD - Brisbane, Gold Coast & Sunshine Coast 55 - 75 45 - 65 70 - 120 80 - 110
QLD - Regional 50 - 60 40 - 55 55 - 100 75 - 100
SA - Adelaide 60 - 75 50 - 60 65 - 85 75 - 90
WA - Perth 70 - 80 50 - 60 70 - 85 80 - 110
ACT - Canberra 65 - 80 50 - 65 80 - 110 80 - 130
TAS - Hobart 60 - 70 45 - 65 65 - 85 65 - 80
NT - Darwin 60 - 80 60 - 80 80 - 120 100 - 140
NZ - Auckland 70 - 110 55 - 70 80 - 120 80 - 120
NZ - Wellington 70 - 110 45 - 65 80 - 120 75 - 115
NZ - Christchurch 70 - 110 45 - 65 80 - 110 80 - 110
Contracts Manager
Operations Manager
Engineering Manager Bid Manager General Manager
NSW - Sydney 100 - 150 110 - 150 100 - 150 110 - 150 150 - 250
NSW - Regional 80 - 120 80 - 120 100 - 120 100 - 130 150 - 250
VIC - Melbourne 75 - 120 80 - 120 75 - 110 80 - 150 130 - 230
VIC - Regional 65 - 110 80 - 130 75 - 110 80 - 150 110 - 230
QLD - Brisbane, Gold Coast & Sunshine Coast 75 - 130 75 - 130 75 - 110 80 - 135 110 - 200
QLD - Regional 65 - 115 75 - 115 70 - 90 80 - 140 110 - 185
SA - Adelaide 80 - 110 80 - 120 80 - 100 80 - 120 110 - 185
WA - Perth 110 - 140 130 - 150 100 - 120 110 - 150 150 - 180
ACT - Canberra 120 - 165 100 - 150 120 - 150 100 - 150 150 - 250
TAS - Hobart 75 - 90 80 - 115 65 - 90 75 - 90 100 - 145
NT - Darwin 100 - 140 90 - 145 90 - 150 75 - 140 120 - 230
NZ - Auckland 80 - 120 90 - 120 100 - 130 95 - 140 120 - 220
NZ - Wellington 75 - 110 90 - 130 100 - 130 110 - 150 120 - 180
NZ - Christchurch 80 - 120 100 - 140 100 - 125 100 - 140 110 - 180

142 | 2018 Hays Salary Guide
• All salaries shown are exclusive of superannuation (AU) or KiwiSaver (NZ)
• New Zealand salaries are represented in New Zealand dollars
NOTES:
FACILITIES MANAGEMENT
SOFT SERVICESCleaning Operations Manager
Cleaning Area Manager Catering Manager Facilities Helpdesk
NSW - Sydney 80 - 100 65 - 80 75 - 85 50 - 65
NSW - Regional 70 - 100 65 - 80 65 - 75 40 - 50
VIC - Melbourne 80 - 120 65 - 80 75 - 85 55 - 65
VIC - Regional 80 - 120 65 - 80 75 - 85 55 - 65
QLD - Brisbane, Gold Coast & Sunshine Coast 75 - 110 65 - 80 70 - 85 45 - 55
QLD - Regional 75 - 110 60 - 75 70 - 90 50 - 60
SA - Adelaide 75 - 90 60 - 70 70 - 75 45 - 55
WA - Perth 70 - 90 70 - 100 70 - 90 50 - 60
ACT - Canberra 80 - 100 65 - 80 65 - 75 40 - 55
TAS - Hobart N/A N/A N/A N/A
NT - Darwin N/A N/A N/A N/A
NZ - Auckland 75 - 90 65 - 75 65 - 80 45 - 65
NZ - Wellington 75 - 90 60 - 80 65 - 80 50 - 65
NZ - Christchurch 75 - 90 60 - 80 65 - 80 50 - 65
SOFT SERVICESControl Room Operator Security Manager Facilities Officer Guest Services Agent
NSW - Sydney 50 - 60 70 - 80 50 - 60 50 - 55
NSW - Regional 50 - 60 70 - 80 50 - 60 50 - 55
VIC - Melbourne 50 - 60 70 - 80 55 - 60 50 - 55
VIC - Regional 50 - 60 70 - 80 55 - 60 50 - 55
QLD - Brisbane, Gold Coast & Sunshine Coast 50 - 60 65 - 75 50 - 60 50 - 55
QLD - Regional 50 - 60 65 - 75 50 - 60 50 - 55
SA - Adelaide 50 - 60 60 - 75 50 - 60 45 - 55
WA - Perth 50 - 60 65 - 75 50 - 60 50 - 55
ACT - Canberra 50 - 60 70 - 80 50 - 60 50 - 55
TAS - Hobart 50 - 60 70 - 80 50 - 60 50 - 55
NT - Darwin 50 - 60 65 - 70 55 - 65 50 - 55
NZ - Auckland 50 - 60 70 - 80 50 - 60 50 - 55
NZ - Wellington 50 - 60 70 - 80 50 - 60 50 - 55
NZ - Christchurch 50 - 60 70 - 80 50 - 60 50 - 55

2018 Hays Salary Guide | 143
SALA
RY IN
FOR
MAT
ION
: MA
NU
FACT
URI
NG
& O
PERA
TIO
NS
AUSTRALIAAustralia’s manufacturing and operations industry continues to perform well as it transitions away from traditional products towards the technology, ship, steel and services sectors. The industry can be proud of its resilience and appetite to remain strong and grow.
Western Australia is a prime example, where bespoke technology manufacturers and specialist robotics companies are growing and reshaping Perth’s manufacturing landscape. This is increasing demand for Engineering Drafters, Production Managers, Engineering Managers and General Managers with technology and robotics industry experience. Given demand, salaries are increasing for candidates with these particular skills.
Another noticeable area of growth is the ship building industry, which is strong in Tasmania as production increases on military hardware, ferries and in private yacht manufacturers building super yachts. This has created demand for marine manufacturing specialists, including Production Planners, Design Engineers and Manufacturing Managers. Salaries are climbing due to the steady increase in work in this area.
Steel manufacturers are also benefiting from the active ship building industry, with an increase in production creating demand for Boilermakers, Workshop
Supervisors, Workshop Managers and General Managers in this industry. Given rising workloads, salaries are increasing.
The services industry meanwhile is becoming increasingly active in the Eastern Seaboard, with skilled Field Service Technicians sought by a broad range of companies, from industrial machinery suppliers to electromechanically driven processing and recycling unit, and cash management equipment manufacturers. Salaries are rising in order to attract and retain such staff. Electromechanical equipment suppliers, particularly in the gaming industry, traditionally offered low salaries but this is changing as they attempt to compete with industries that pay higher salaries.
In response to Industry 4.0, production and maintenance are moving closer together as large companies install automated production lines and upskill Fitters and Electricians to work as Process Technicians that operate and maintain the line. These technicians are paid more than standalone Fitters or Electricians. While this is good news for such workers, it has reduced the need for unskilled Machine Operators.
Manufacturers of long shelf life products and those in exportable industries, including companies producing plastics, packaging and some FMCG, are making staff redundant or decreasing operations with a view to close in the coming years.
FMCG does however continue to improve nationally, creating demand for Quality Assurance Managers and Coordinators in food and beverage.
A desire to improve efficiency has led to continued CapEx projects and therefore demand for Engineering Managers, Maintenance Managers and Technicians who can develop and implement preventative maintenance plans that reduce downtime. Engineering Managers and Maintenance Managers have seen their salaries rise significantly in NSW as a result.
In general, throughout 2017-18 many employers increased their manufacturing headcount and this is expected to continue in 2018-19. Temporary and contract roles in production will remain the focus, with permanent engineering vacancies also available as companies look to their future. Automation and lean production will remain key areas of focus.
Salaries are expected to gradually increase for technical and managerial roles in production, quality control, product design and maintenance and engineering since the industry remains active.
MANUFACTURING & OPERATIONS
NOTES:• All salaries shown are exclusive of superannuation
MANUFACTURING & OPERATIONSProduction/Process Worker Machinist Boilermaker
Production Supervisor
Production Manager
NSW - Sydney 40 - 50 45 - 65 55 - 70 60 - 80 80 - 120
VIC - Melbourne 40 - 50 50 - 65 55 - 70 65 - 80 80 - 120
QLD - Brisbane 40 - 45 45 - 50 50 - 60 55 - 80 75 - 110
WA - Perth 40 - 50 45 - 65 65 - 80 60 - 80 75 - 120
SA - Adelaide 37 - 45 45 - 55 45 - 55 65 - 85 85 - 110
NT - Darwin 44 - 48 60 - 70 60 - 70 55 - 75 75 - 90

144 | 2018 Hays Salary Guide
MANUFACTURING & OPERATIONS
NOTES:• All salaries shown are exclusive of superannuation
MANUFACTURING & OPERATIONSOperations Manager
Maintenance Manager
Engineering Manager
NSW - Sydney 120 - 155 100 - 140 100 - 140
V IC - Melbourne 110 - 150 100 - 130 100 - 140
QLD - Brisbane 100 - 140 110 - 130 110 - 140
WA - Perth 105 - 155 85 - 140 100 - 140
SA - Adelaide 80 - 130 70 - 90 90 - 120
NT - Darwin 80 - 130 70 - 90 80 - 120
QUALITY CONTROL & R&D QA Coordinator QA ManagerFood Technologist
NPD Manager Food
Technical Manager
NSW - Sydney 60 - 85 90 - 130 65 - 85 100 - 130 105 - 130
VIC - Melbourne 55 - 70 90 - 130 80 - 100 90 - 130 100 - 140
QLD - Brisbane 55 - 75 75 - 100 65 - 75 90 - 120 90 - 120
WA - Perth 55 - 75 80 - 130 75 - 100 80 - 110 80 - 110
SA - Adelaide 50 - 70 70 - 110 55 - 75 75 - 100 110 - 130
NT - Darwin 65 - 85 80 - 95 60 - 75 75 - 100 100 - 120
PRODUCT DESIGN & DEVELOPMENT DrafterMechanical Design Engineer Project Engineer
Electronics Engineer R&D Manager
NSW - Sydney 65 - 85 80 - 90 90 - 130 80 - 90 110 - 145
VIC - Melbourne 65 - 85 70 - 100 85 - 120 65 - 90 80 - 110
QLD - Brisbane 50 - 80 80 - 90 90 - 110 90 - 110 90 - 120
WA - Perth 75 - 90 90 - 120 90 - 130 75 - 105 110 - 145
SA - Adelaide 60 - 80 60 - 75 70 - 100 80 - 110 75 - 100
NT - Darwin 75 - 100 80 - 110 85 - 120 80 - 110 90 - 120
MAINTENANCE & ENGINEERINGMaintenance Fitter
Maintenance Electrician
Maintenance Planner
Electrical Engineer
Reliability Engineer
NSW - Sydney 65 - 85 70 - 90 80 - 95 75 - 90 75 - 90
VIC - Melbourne 65 - 85 70 - 90 70 - 80 80 - 110 80 - 100
QLD - Brisbane 60 - 80 70 - 90 70 - 90 100 - 120 100 - 120
WA - Perth 70 - 90 70 - 90 75 - 85 80 - 100 80 - 120
SA - Adelaide 50 - 60 55 - 75 70 - 80 70 - 100 75 - 100
NT - Darwin 70 - 80 70 - 80 80 - 100 85 - 100 85 - 100

2018 Hays Salary Guide | 145
SALA
RY IN
FOR
MAT
ION
: EN
ERG
Y
AUSTRALIAAustralia’s energy industry is transitioning as traditional generation is challenged by new emerging renewables. This is creating wage pressure in transmission and distribution and resulting in an influx of professionals with transferable skills from oil and gas, mining and other heavy industries.
Employers will consider those with a civil construction, rail or tunnelling background, with skills in project management, planning, scheduling and coordinating particularly transferable. Electrical Engineering Principals from rail and civil construction, or utility relocations, are also of interest.
Traditional generation candidates meanwhile are starting to focus on diversifying and adapting their skills through upskilling.
The renewables sector witnessed exciting developments during the 2017-18 financial year as new companies emerged, long-standing ones expanded and the construction of solar and wind farms, particularly across regional NSW, Victoria and Queensland, increased. In Western Australia, the focus remained on wind and wave projects.
In addition, commercial electricity providers in Queensland invested in network upgrades and metering projects, which further increased demand. So too did the construction and opening of the world’s largest lithium-ion battery in South Australia and the announcement of two hydrogen production and distribution facilities.
As a result, skilled energy professionals are sought across the country, in both regional and rural locations as well as FIFO workers in Queensland.
In particular demand are Project Managers, Electrical and Civil Project Engineers, Schedulers, Planners and Coordinators. There is also strong demand for civil Excavator Operators and Underground Electricians as well as High Voltage Technicians, EI Technicians, Trade Assistants and Mechanical Fitters.
Given demand, salaries within renewables have gradually increased.
With another record-breaking year of renewable energy projects ahead,
particularly wind and solar, vacancy activity and job opportunities will remain high.
Within transmission and distribution, mergers, government funded programs of work, infrastructure upgrades and substation maintenance led to rising demand for Project Engineers, Managers and Schedulers, Electricians with specific power experience, Electrical Inspectors and Maintenance Planners.
Transmission and distribution salaries have not kept pace with those in renewables, but employers are attempting to remain competitive.
In NSW, major construction and infrastructure projects have led to strong demand for Project Managers, Project Engineers, Estimators and Contract Administrators across the board, which has put pressure on salaries. Larger companies will accommodate salary increases but SMEs are not always able to.
In other trends, the past financial year saw the privatisation of several utilities, debate in New South Wales about power generation plans and resources and the movement of energy professionals back to Western Australia in response to improved market confidence and new renewable projects.
Meanwhile, an increase in the number of micro-grids is an interesting development, with Kalbarri set to become one of Australia’s largest microgrids to run in renewable mode in 2019. This will fuel demand for temporary staff.
With another record-breaking year of renewable energy projects ahead, particularly wind and solar, vacancy activity and job opportunities will remain high.
“
”
ENERGY

146 | 2018 Hays Salary Guide
ENERGYDesign Engineering
• All salaries shown are exclusive of superannuation
* Design Engineer - Discipline (Mechanical/Process/Elec/I&C)
NOTES:
TRANSMISSION & DISTRIBUTION/GENERATION Design Engineer*
Senior Design Engineer*
Principal Design Engineer
Engineering Manager Design Manager
NSW - Sydney 70 - 90 100 - 120 130 - 165 160 - 200 130 - 150
VIC - Melbourne 75 - 110 100 - 135 130 - 150 130 - 170 110 - 160
QLD - Brisbane 80 - 100 100 - 140 140 - 180 150 - 190 110 - 160
WA - Perth 75 - 100 100 - 135 140 - 170 160 - 200 130 - 160
SA - Adelaide 80 - 100 100 - 130 135 - 155 150 - 185 130 - 155
NT - Darwin 85 - 115 115 - 150 120 - 170 145 - 190 130 - 170
Design DrafterSenior Design Drafter
Project Engineer (EPCM)
Senior Project Engineer (EPCM)
NSW - Sydney 50 - 80 70 - 100 80 - 115 130 - 150
VIC - Melbourne 50 - 90 70 - 100 90 - 130 130 - 175
QLD - Brisbane 60 - 80 80 - 100 90 - 140 140 - 190
WA - Perth 65 - 85 85 - 100 100 - 125 125 - 160
SA - Adelaide 55 - 75 75 - 95 80 - 115 125 - 150
NT - Darwin 65 - 85 80 - 110 115 - 140 125 - 170
Power Systems Engineer
Protection Engineer
Transmission Line Design Engineer Project Manager
NSW - Sydney 80 - 120 75 - 110 110 - 150 120 - 160
VIC - Melbourne 80 - 120 75 - 125 100 - 125 100 - 140
QLD - Brisbane 80 - 110 110 - 150 80 - 150 120 - 160
WA - Perth 90 - 130 100 -120 95 - 145 120 - 160
SA - Adelaide 85 - 115 85 - 125 90 - 130 120 - 150
NT - Darwin 95 - 140 100 - 130 90 - 140 135 - 180
RENEWABLEWind Farm Engineer Solar Engineer
Geothermal Engineer Technician
NSW - Sydney 95 - 135 80 - 125 80 - 110 65 - 80
VIC - Melbourne 100 - 130 95 - 130 90 - 110 75 - 95
QLD - Brisbane 95 - 125 75 - 115 90 - 135 65 - 95
WA - Perth 100 - 130 100 - 120 100 - 130 80 - 100
SA - Adelaide 100 - 130 100 - 120 90 - 120 70 - 90
NT - Darwin N/A 105 - 125 95 - 125 75 - 110

2018 Hays Salary Guide | 147
NOTES:• All salaries shown are exclusive of superannuation
* Engineer (Mechanical/Electrical)
ENERGYOperations & Maintenance
OPERATIONS & MAINTENANCEControl Room Operator
Control Room Manager
Maintenance Superintendent
Maintenance Planning/Scheduler
Operations Manager
NSW - Sydney 75 - 100 85 - 120 85 - 100 80 - 105 140 - 170
VIC - Melbourne 80 - 95 95 - 120 85 - 100 80 - 105 120 - 160
QLD - Brisbane 75 - 100 95 - 125 110 - 140 100 - 120 150 - 200
WA - Perth 80 - 110 100 -120 120 - 160 90 - 125 160 - 200
SA - Adelaide 80 - 110 95 - 125 95 - 125 95 - 130 120 - 150
NT - Darwin 85 - 95 95 - 125 105 - 140 100 - 130 160 - 220
Asset Engineer (3-7 yrs)* Leading Hand Electrician
Mechanical Fitter E&I Technician
NSW - Sydney 85 - 110 65 - 80 65 - 75 65 - 75 65 - 85
VIC - Melbourne 85 - 130 90 - 110 60 - 90 60 - 80 70 - 95
QLD - Brisbane 80 - 115 85 - 120 70 - 100 70 - 100 80 - 140
WA - Perth 80 - 120 95 - 125 90 - 110 90 - 110 110 - 130
SA - Adelaide 95 - 120 75 - 100 80 - 100 70 - 90 75 - 100
NT - Darwin 90 - 130 90 - 125 85 - 110 85 - 110 90 - 120
Line workerG&B Linesworker
Switching Operator
Protection Technician
Generator Technician
NSW - Sydney 70 - 100 N/A 65 - 85 70 - 85 70 - 85
VIC - Melbourne 60 - 75 85 - 130 80 - 110 95 - 120 80 - 100
QLD - Brisbane 75 - 100 90 - 130 85 - 120 120 - 160 90 - 140
WA - Perth 75 - 95 85 - 120 95 - 140 90 - 135 80 - 120
SA - Adelaide 70 - 100 85 - 110 85 - 120 110 - 150 85 - 130
NT - Darwin 80 - 120 85 - 120 95 - 140 90 - 135 80 - 120
Directional Driller Cable Jointer Cable Layer
Operator/Maintainer
NSW - Sydney N/A 75 - 100 65 - 90 75 - 95
VIC - Melbourne 70 - 100 80 - 100 70 - 90 80 - 95
QLD - Brisbane 110 - 140 85 - 110 85 - 110 120 - 150
WA - Perth 60 - 90 80 - 120 60 - 85 120 - 150
SA - Adelaide 80 - 110 85 - 110 85 - 110 120 - 150
NT - Darwin 70 - 95 80 - 120 60 - 85 120 - 150

148 | 2018 Hays Salary Guide
ENERGYProject Development
• All salaries shown are exclusive of superannuation
* Mechanical/Electrical/Instrumentation & Controls
NOTES:
PROJECT DELIVERY Project Manager Project Engineer*Construction Manager Site Superintendent
NSW - Sydney 140 - 175 90 - 130 150 - 175 125 - 150
VIC - Melbourne 130 - 160 90 - 125 150 - 170 120 - 140
QLD - Brisbane 120 - 170 90 - 125 140 - 170 95 - 130
WA - Perth 150 - 180 90 - 130 140 - 170 120 - 160
SA - Adelaide 120 - 140 85 - 125 130 - 160 110 - 135
NT - Darwin 120 - 160 110 - 140 120 - 160 95 - 140
Site EngineerCommissioning Engineer
Commissioning Manager
NSW - Sydney 65 - 95 110 - 135 140 - 180
VIC - Melbourne 80 - 120 120 - 140 150 - 180
QLD - Brisbane 75 - 110 115 - 160 130 - 170
WA - Perth 100 - 140 120 - 150 140 - 180
SA - Adelaide 75 - 100 120 - 150 150 - 180
NT - Darwin 80 - 120 100 - 150 140 - 170
PROJECT SERVICES Estimator Senior Estimator Planner/Scheduler Planning Manager
NSW - Sydney 90 - 130 140 - 180 80 - 120 120 - 160
VIC - Melbourne 100 - 120 140 - 170 100 - 120 120 - 150
QLD - Brisbane 85 - 130 135 - 180 70 - 120 120 - 155
WA - Perth 90 - 130 110 - 135 90 - 120 120 - 150
SA - Adelaide 100 - 120 120 - 140 120 - 140 130 - 160
NT - Darwin 85 - 120 115 - 150 100 - 135 95 - 150
Contracts Administrator
Contracts Manager OHS Supervisor OHS Manager
NSW - Sydney 80 - 110 110 - 140 90 - 115 140 - 180
VIC - Melbourne 80 - 100 110 - 140 80 - 110 110 - 140
QLD - Brisbane 80 - 115 110 - 150 90 - 120 115 - 135
WA - Perth 80 - 100 120 - 140 90 - 115 115 - 135
SA - Adelaide 80 - 110 110 - 145 90 - 110 100 - 120
NT - Darwin 85 - 115 120 - 150 100 - 130 100 - 150

2018 Hays Salary Guide | 149
AUSTRALIAWhat a difference a year makes. Off the back of last year’s iron ore and coal price upturn, 2017-18 saw a broad based recovery with nickel and lithium pulling their weight and copper, iron ore, gold and coal remaining above most analysts’ short to medium term predictions. This led to renewed optimism, profits, increased exploration budgets, initial steps towards increased capital investment in new mines and the major expansion of existing mines.
Increasing job vacancies have brought an end to wage erosion for loyal workers who remained in the industry over recent years. In fact, by early 2018 many jurisdictions began to increase wages in an attempt to lure back those blue collar workers who secured jobs in alternative industries closer to home. This is particularly evident in North Queensland where drive-in, drive-out roles were common.
Over the year the number of available jobseekers reduced. At the same time, the Minerals Council of Australia expressed concern about the low levels of enrolments in engineering and geology degrees in its Senate Select Committee on the Future of Worker and Workers Submission. A growing chorus of mining bosses also spoke out about a potential skill shortage brought about by the number of workers who left the industry during the downturn.
Already high demand exists for Geologists and Field Assistants as exploration budgets are increased, and Drill and Blast Specialists, Maintenance Planners, HD Fitters and Dump Truck Operators for mobile plant in Western Australia.
Queensland needs HD Fitters too, as well as Dragline and Excavator Operators and Electricians.
Demand also exists in Queensland, New South Wales, South Australia and Victoria for Boilermakers since most transitioned into manufacturing during the downturn and now enjoy more family friendly rosters.
Turning to the Northern Territory, optimism is rising as two major mines commence construction and several others await final investment decision. Alice Springs will become a hotspot of activity in response.
Both South Australia and the Northern Territory already require Mechanical, Electrical and HD Fitters up to supervisory level.
Looking ahead, major project announcements will create contract roles for Project Managers, Design and Project Engineers and Contract Managers. Since most of these professionals are now working on infrastructure projects, wage pressure is expected as employers attempt to attract them back to regional Australia.
Geology and engineering experts will continue to be sought for an increasing number of permanent vacancies as investors put pressure on miners to reinvest profits into future supply.
In response to the general shortage of skills, over the coming year we expect employers to begin to consider candidates with no mining experience once more. Such workers bring with them new ideas and have a positive impact on culture and diversity.
In other trends, panic over the casualization of the mining workforce has now subsided since employers are offering proven temporary staff permanent positions. However with employers keen to continue trialling blue
collar workers in contract roles and a dwindling pool of experienced people, hourly rates will increase.
In last year’s Hays Salary Guide we noted the introduction of gender and Indigenous diversity targets. Since then, suitable candidates have secured roles and it is clear that education pathways need to be explored if further diversity targets are to be achieved.
Finally, automation and a continual push towards greater mine efficiency and maximising production will further increase engineering and technology roles in capital cities and, long term, reduce repetitive high risk tasks in remote areas.
SALA
RY IN
FOR
MAT
ION
: RES
OU
RCES
& M
ININ
G
RESOURCES & MINING
Increasing job vacancies have brought an end to wage erosion for loyal workers who remained in the industry over recent years.
“
”
Automation and a continual push towards greater mine efficiency and maximising production will further increase engineering and technology roles in capital cities.
“
”

150 | 2018 Hays Salary Guide
RESOURCES & MINING
NOTES:• Metalliferous mining engineering: In WA, SA & NT all salaries are based on 9&5 and 2&1 rosters excluding superannuation and additional benefits
• Metalliferous geology mining: In WA, SA & NT all salaries are based on 8&6 and 2&1 rosters excluding superannuation and additional benefits
• For all other states, salaries are based on residential positions excluding superannuation and additional benefits
• In Queensland more employers are offering drive-in-drive-out (DIDO) options and residential, which has been taken into consideration in these salaries presented
METALLIFEROUS MINING ENGINEERINGRegistered Mine Manager
Underground/Quarry Manager
Technical Services Mgr
Senior Mining Engineer
Mining Engineer
WA 180 - 250 170 - 190 170 - 190 140 - 160 100 - 145
QLD - Hard Rock 190 - 250 175 - 195 170 - 200 160 - 175 115 - 145
QLD - Coal 220 - 250 170 - 200 180 - 210 160 - 175 120 - 150
NSW 160 - 220 140 - 160 180 - 210 130 - 160 90 - 130
VIC 150 - 200 100 - 150 130 - 170 130 - 180 100 - 130
SA 180 - 220 130 - 160 160 - 180 140 - 170 110 - 140
TAS 150 - 200 110 - 140 130 - 170 120 - 140 90 - 120
NT 180 - 250 175 - 195 160 - 180 130 - 170 110 - 150
Graduate Mining Engineer
Geotechnical Engineer Chief Surveyor
Senior Surveyor Mine Surveyor
WA 80 - 100 120 - 160 165 - 200 140 - 170 110 - 150
QLD - Hard Rock 70 - 100 120 - 160 155 - 165 135 - 155 110 - 135
QLD - Coal 70 - 100 120 - 160 155 - 165 135 - 155 110 - 135
NSW 70 - 90 130 - 160 150 - 175 120 - 150 120 - 150
VIC 55 - 75 110 - 130 110 - 150 90 - 120 75 - 110
SA 60 - 90 120 - 140 120 - 150 110 - 125 90 - 120
TAS 60 - 85 105 - 130 95 - 120 85 - 115 70 - 90
NT 70 - 100 120 - 160 140 - 170 135 - 155 110 - 135
METALLIFEROUS GEOLOGY - MINING
Chief Geologist
Senior Mine Geologist
Mine Geologist
Graduate Geologist
Pit Technician/ Geological Technician
WA 200 - 250 130 - 170 90 - 135 70 - 90 70 - 95
QLD - Hard Rock 170 - 210 140 - 170 95 - 140 60 - 95 70 - 95
QLD - Coal 165 - 200 130 - 165 90 - 130 60 - 90 70 - 95
NSW 180 - 220 120 - 160 90 - 120 70 - 90 70 - 90
VIC 150 - 180 120 - 150 90 - 120 55 - 75 50 - 80
SA 120 - 140 100 - 120 90 - 120 45 - 50 55 - 60
TAS 120 - 160 95 - 115 80 - 100 55 - 70 55 - 70
NT 160 - 200 120 - 170 95 - 140 85 - 100 85 - 100

2018 Hays Salary Guide | 151
RESOURCES & MINING
• In WA, SA & NT all salaries are based on 8&6 and 2&1 rosters excluding superannuation and additional benefits
• For all other states, salaries are based on residential positions excluding superannuation and additional benefits
• In Queensland more employers are offering drive-in-drive-out (DIDO) options and residential, which has been taken into consideration in these salaries presented
METALLIFEROUS GEOLOGY - EXPLORATION
Exploration Manager
Senior Exploration Geologist
Exploration Geologist Field Assistant
WA 175 - 220 120 - 160 80 - 120 70 - 95
QLD - Hard Rock 160 - 200 120 - 160 80 - 120 65 - 90
QLD - Coal 170 - 200 130 - 170 100 - 120 65 - 90
NSW 180 - 220 120 - 160 90 - 120 50 - 70
VIC 150 - 180 130 - 160 100 - 125 60 - 80
SA 130 - 150 120 - 160 90 - 120 50 - 70
TAS 120 - 150 95 - 130 80 - 100 55 - 70
NT 150 - 205 120 - 170 110 - 140 75 - 95
NOTES:
MINERAL PROCESSING Process ManagerProcess Engineer Mid level 3-7yrs
Senior Metallurgist Metallurgist
Graduate Metallurgist
WA 180 - 245 110 - 160 140 - 175 120 - 135 75 - 100
QLD 180 - 230 100 - 140 130 - 170 100 - 130 60 - 75
NSW 170 - 190 80 - 100 100 - 130 80 - 100 60 - 75
VIC 160 - 180 85 - 110 110 - 135 85 - 100 60 - 75
SA 140 - 160 95 - 120 110 - 130 80 - 110 60 - 75
TAS 150 - 180 70 - 100 100 - 125 75 - 100 55 - 70
NT 170 - 220 100 - 140 130 - 170 100 - 130 60 - 75
Mill Superintendent Shift Supervisor Mill Operator
Metallurgical Technician
Laboratory Technician
WA 160 - 180 120 - 155 80 - 115 75 - 95 75 - 85
QLD 130 - 150 95 - 120 80 - 105 70 - 85 70 - 85
NSW 130 - 155 85 - 105 65 - 80 70 - 90 70 - 90
VIC 120 - 140 90 - 120 80 - 100 60 - 75 55 - 75
SA 120 - 150 80 - 100 70 - 90 55 - 75 55 - 75
TAS 110 - 140 75 - 90 65 - 80 55 - 70 50 - 70
NT 130 - 150 95 - 120 80 - 105 70 - 85 70 - 85

152 | 2018 Hays Salary Guide
RESOURCES & MINING
NOTES:• In WA, SA & NT all salaries are based on 8&6 and 2&1 rosters excluding superannuation and additional benefits
• For all other states, salaries are based on residential positions excluding superannuation and additional benefits
Leading HandMechanical Fitter Electrician
Boiler Maker/Welder
Instrumentation Technician
WA 140 - 160 120 - 145 120 - 140 120 - 145 140 - 160
QLD 100 - 115 95 - 115 100 - 120 90 - 115 90 - 120
NSW 100 - 125 90 - 115 90 - 120 85 - 110 80 - 110
VIC 120 - 150 110 - 150 80 - 120 100 - 150 90 - 120
SA 95 - 110 75 - 90 90 - 120 75 -90 85 - 110
TAS 80 - 95 70 - 85 70 - 85 75 - 85 75 - 85
NT 100 - 115 95 - 115 100 - 120 90 - 115 90 - 120
FIXED PLANT MAINTENANCEMaintenance Superintendent
Maintenance Planner
Maintenance Supervisor
Mechanical Eng Mid level 3-7yrs
Electrical Eng Mid level 3-7yrs
WA 170 - 210 150 - 180 140 - 170 120 - 150 120 - 150
QLD 155 - 185 120 - 140 120 - 150 115 - 140 115 - 140
NSW 160 - 180 100 - 130 130 - 150 90 - 120 90 - 120
VIC 130 - 180 110 - 160 100 - 150 90 - 130 90 - 130
SA 120 - 140 90 - 110 100 - 130 90 - 110 100 - 120
TAS 105 - 130 85 - 105 80 - 105 75 - 100 75 - 100
NT 155 - 185 120 - 140 120 - 150 120 - 150 120 - 150

2018 Hays Salary Guide | 153
RESOURCES & MINING
• In WA, SA & NT all salaries are based on 8&6 and 2&1 rosters excluding superannuation and additional benefits
• For all other states, salaries are based on residential positions excluding superannuation and additional benefits
NOTES:
Open Pit Supervisor
Excavator Operator
Dump Truck Operator Driller All-Rounder
WA 150 - 170 125 - 150 100 - 120 110 - 135 120 - 145
QLD 140 - 160 90 - 110 90 - 110 100 - 125 90 - 120
NSW 110 - 140 90 - 120 75 - 110 75 - 115 80 - 120
VIC 105 - 140 90 - 115 70 - 110 75 - 120 80 - 115
SA 110 - 140 100 - 140 85 - 100 75 - 120 85 - 120
TAS 90 - 110 70 - 90 60 - 85 70 - 95 65 - 85
NT 140 - 160 90 - 110 90 - 110 100 - 125 90 - 120
Underground Supervisor
Jumbo Operator
Bogger Operator Service Crew
WA 140 - 160 150 - 170 115 - 140 90 - 120
QLD 130 - 160 110 - 130 100 - 120 100 - 120
NSW 130 - 150 110 - 130 110 - 135 90 - 110
VIC 105 - 145 130 - 150 110 - 130 85 - 105
SA 100 - 140 100 - 120 80 - 100 90 - 110
TAS 90 - 110 85 - 110 80 - 105 60 - 75
NT 130 - 160 135 - 170 110 - 140 90 - 120
MOBILE PLANT MAINTENANCEWorkshop Supervisor HD Fitter Auto Electrician
Boiler Maker/Welder Service Person
WA 140 - 165 120 - 150 120 - 150 110 - 140 100 - 120
QLD 130 - 160 125 - 150 120 - 140 100 - 115 95 - 150
NSW 105 - 145 80 - 120 90 - 115 80 - 120 85 - 100
VIC 100 - 140 90 - 130 90 - 120 90 - 130 70 - 95
SA 90 - 130 80 - 130 80 - 130 70 - 120 80 - 100
TAS 80 - 110 80 - 110 75 - 100 65 - 85 70 - 85
NT 130 - 160 130 - 160 130 - 160 130 - 160 100 - 120

154 | 2018 Hays Salary Guide
RESOURCES & MINING
NOTES:• In WA, SA & NT all salaries are based on 8&6 and 2&1 rosters excluding superannuation and additional benefits
• For all other states, salaries are based on residential positions excluding superannuation and additional benefits
OHS & ENVIRONMENTAL HSE ManagerOH&S Manager/Superintendent
OH&S Coordinator OH&S Officer
WA 170 - 220 140 - 170 120 - 145 100 - 120
QLD 165 - 210 140 - 160 120 - 140 90 - 120
NSW 180 - 220 140 - 200 100 - 130 80 - 110
VIC 140 - 180 90 - 120 80 - 100 70 - 95
SA 140 - 170 120 - 160 75 - 120 55 - 90
TAS 130 - 200 120 - 180 100 - 130 90 - 120
NT 165 - 210 150 - 180 120 - 140 90 - 120
Environmental Superintendent
Environmental Coordinator
Environmental Officer
Training Coordinator
WA 140 - 160 90 - 150 70 - 90 120 - 140
QLD 140 - 170 130 - 145 90 - 130 90 - 120
NSW 140 - 170 110 - 140 90 - 120 90 - 120
VIC 90 - 120 65 - 85 65 - 85 60 - 75
SA 120 - 140 80 - 100 65 - 90 80 - 100
TAS 100 - 150 100 - 130 65 - 90 65 - 110
NT 140 - 170 130 - 145 90 - 130 90 - 120
INDUSTRIAL DESIGNEngineering Manager
Principal/Lead Engineer
Project Manager
Senior Design Engineer
Design Engineer
WA 200 - 220 130 - 150 200 - 220 110 - 130 100 - 120
QLD 200 - 220 165 - 200 180 - 220 130 - 170 85 - 120
NSW 150 - 220 130 - 160 150 - 180 100 - 130 80 - 110
VIC 180 - 220 150 - 180 150 - 220 100 - 150 70 - 110
SA 140 - 170 120 - 130 120 - 140 110 - 140 90 - 130
TAS 150 - 190 110 - 140 110 - 140 90 - 110 80 - 100
NT 200 - 250 165 - 210 180 - 250 130 - 170 85 - 120

2018 Hays Salary Guide | 155
RESOURCES & MINING
NOTES:• Salaries are based on residential positions excluding superannuation and additional benefits
• Site allowances are paid on base salary and range from 15 to 45 per cent depending on location
INDUSTRIAL DESIGN
Senior Project Engineer (EPCM)
Project Engineer (EPCM)
Design Manager/Chief Drafter
Senior Design Drafter Design Drafter
Piping Designer
WA 100 - 120 80 - 100 120 - 150 90 - 110 70 - 95 90 - 100
QLD 130 - 170 90 - 130 120 - 150 85 - 120 65 - 100 80 - 120
NSW 130 - 160 80 - 120 100 - 130 80 - 100 70 - 90 80 - 100
VIC 110 - 150 80 - 120 110 - 150 100 - 130 70 - 100 80 - 110
SA 120 - 160 80 - 110 100 - 130 85 - 120 60 - 90 85 - 120
TAS 90 - 120 80 - 110 110 - 160 80 - 140 70 - 100 80 - 140
NT 130 - 170 90 - 130 120 - 170 85 - 120 65 - 100 100 - 130
INDUSTRIAL CONSTRUCTIONProject Manager
Construction Manager/Superintendent
Senior Estimator
Planning Manager
Contracts Manager
Project Engineer (Civil/Mech/Elec)
WA 180 - 200 170 - 220 120 - 170 120 - 170 120 - 170 95 - 120
QLD 180 - 220 170 - 200 160 - 200 155 - 200 160 - 200 130 - 150
NSW 140 - 180 140 - 180 125 - 160 120 - 170 130 - 170 100 - 120
VIC 180 - 220 180 - 200 120 - 150 140 - 170 150 - 180 90 - 135
SA 140 - 200 130 - 180 130 - 150 120 - 180 140 - 180 110 - 140
TAS 120 - 160 120 - 160 100 - 130 110 - 130 110 - 130 80 - 110
NT 160 - 240 170 - 200 155 - 200 140 - 200 150 - 200 130 - 150
EstimatorContracts Administrator Planner
Site Supervisor
Site Engineer (Civil/Mech/Elec) Safety Advisor
WA 100 - 120 80 - 120 80 - 110 110 - 140 95 - 120 80 - 100
QLD 100 - 150 100 - 135 100 - 140 100 - 140 100 - 140 90 - 130
NSW 75 - 125 90 - 120 100 - 130 100 - 130 80 - 100 90 - 140
VIC 110 - 130 80 - 120 110 - 140 80 - 110 80 - 120 80 - 110
SA 90 - 120 80 - 120 100 - 130 100 - 140 75 - 115 90 - 100
TAS 80 - 120 80 - 110 80 - 110 80 - 110 80 - 115 80 - 100
NT 100 - 150 100 - 140 100 - 140 100 - 140 100 - 140 90 - 130

156 | 2018 Hays Salary Guide
SALA
RY IN
FOR
MAT
ION
: OIL
& G
AS
AUSTRALIA2018-19 is expected to see an oil and gas revival, with both prices and the number of major LNG projects tipped to rise.
This comes off an improving 2017-18, which saw conditions rally across the industry nationally, albeit to levels that remain a long way off peak. Fortunately, the oil price recovered enough to stop the transition of skilled professionals to alternative industries.
Australian salaries have not followed the oil price however and have held firm. There have been a few notable exceptions, particularly in exploration where Geologists, Drillers, Company Representatives and rig crews are in higher demand in both Queensland and Western Australia. Contract rates continued to be renegotiated and reduced.
Looking at trends by location, in Victoria confidence is returning to employers and jobseekers as evidenced by increased job vacancy advertising. This is an exciting change and positions the state strongly to bounce back over the year ahead. Salaries however remain steady, with supply outstripping demand.
Victoria’s downstream industry remains buoyant, driven by a significant gas project. Blue collar recruitment dominates vacancy activity given the focus on maintenance, with particular demand evident for Boilermakers, Welders, Operators and Fitters.
The situation is mirrored in NSW, with one notable exception: oil and gas professionals continue to move into renewable energy or power generation based on the ease of transferrable skills and the state’s renewable boom.
In South Australia skilled professionals are in high demand, particularly for line
maintenance and engineering services. Engineering Service Managers, Technicians and Mechanical Fitters are needed. Engineering consulting firms also require Mechanical, Electrical and Control Systems Engineers. Despite demand, salaries remain largely unchanged year-on-year.
A huge exploration funding injection from the government will create opportunities for production personnel in 2018-19, which should create demand for Operators.
Queensland’s industry continues to strengthen, despite the impact of alternate energy solutions. Having said this, some top tier companies have streamlined their workforce and recruited contract over permanent roles. This trend is expected to reverse as candidate supply declines.
Already demand for maintenance candidates, including TAs, Planners, Schedulers and Fitters, is at a two-year high. Given competition from the mining industry, this demand will remain great.
In a final Queensland trend, with exploration a focus again candidate salary expectations are starting to rise.
Western Australia retains a positive outlook. The downstream segment is dominating supply with most international contracts well underway and production peaking. In most demand are Cost, Planning and Project Engineers.
This has led to more open and flexible salary negotiations than in recent years. The exceptions are in offshore exploration and drilling, with Offshore Advisors/Officers the most affected as witnessed in our survey, as well as professionals working for large EPCs who generally have less negotiating power.
While employers continue to recruit on a contract basis, more assignments are becoming permanent. This is another positive sign of improved confidence.
2018-19 is expected to see an oil and gas revival, with both prices and the number of major LNG projects tipped to rise.
“
”
OIL & GAS

2018 Hays Salary Guide | 157
OIL & GASProject Development
NOTES:• All salaries shown are exclusive of superannuation * Design Engineer - Discipline (Civil/Mechanical/Process/Elec/I&C)
DESIGN/ENGINEERINGGraduate Engineer
Design Engineer*
Senior Design Engineer
Principal/Lead Engineer
Engineering Manager
WA 55 - 75 80 - 120 120 - 150 150 - 200 180 - 220
QLD 60 - 80 80 - 120 120 - 140 140 - 180 170 - 220
NSW 55 - 75 75 - 120 120 - 150 160 - 180 180 - 230
VIC 60 - 75 70 - 110 90 - 140 140 - 160 160 - 200
SA 50 - 55 65 - 80 80 - 120 120 - 140 140 - 160
NT 65 - 95 90 - 135 140 - 180 160 - 250 200 - 260
Senior Design Drafter
Design Manager
WA 90 - 120 120 - 150
QLD 80 - 120 120 - 160
NSW 80 - 110 120 - 180
VIC 75 - 100 120 - 160
SA 65 - 75 90 - 100
NT 90 - 130 150 - 190
SUBSEA DESIGN/ENGINEERINGGraduate Engineer Engineer
Senior Engineer
Principal/Lead Engineer Manager
WA 60 - 80 80 - 120 120 - 150 150 - 200 200+
QLD 60 - 80 80 - 120 120 - 140 140 - 180 180 - 220
NSW N/A N/A N/A N/A N/A
VIC 60 - 70 80 - 120 120 - 150 140 - 160 180 - 220
SA N/A N/A N/A N/A N/A
NT 60 - 90 80 - 125 150 - 220 180 - 250 200 - 325

158 | 2018 Hays Salary Guide
OIL & GASProject Development
• All salaries shown are exclusive of superannuation
x These salaries represent onshore salaries - for offshore you can typically add 15 - 20 per cent
NOTES:
PROJECT DELIVERY/CONTROLS PlannerSenior Planner
Planning Manager
Contracts Administrator
Senior Contracts Administrator Cost Engineer
WA 120 - 160 140 - 180 170 - 220 100 - 130 150 - 200 120 - 170
QLD 110 - 130 130 - 160 160 - 200 70 - 120 120 - 150 120 - 140
NSW 90 - 110 110 - 140 150 - 190 70 - 110 110 - 150 110 - 150
VIC 80 - 120 100 - 130 120 - 150 60 - 90 90 - 110 80 - 120
SA 95 - 110 110 - 130 130 - 150 80 - 110 100 - 130 110 - 130
NT 120 - 160 140 - 180 170 - 220 80 - 130 120 - 190 120 - 170
Senior Cost Engineer
Commercial Manager
Project Controls Manager
Commissioning Engineer
Commissioning Manager
WA 150 - 200 200 - 250 200 - 250 170 - 200 200 - 250
QLD 140 - 170 180 - 240 170 - 210 130 - 170 170 - 210
NSW 150 - 190 160 - 230 140 - 200 110 - 150 150 - 190
VIC 100 - 150 150 - 220 140 - 160 85 - 120 140 - 170
SA 120 - 130 130 - 140 140 - 160 90 - 130 150 - 170
NT 155 - 210 200 - 275 200 - 270 120 - 170 150 - 210
Project Engineer*x
Senior Project Engineer
Project Manager
Senior Project Manager Superintendent**x
WA 110 - 150 160 - 200 170 - 220 195 - 240 140 - 180
QLD 110 - 160 160 - 200 160 - 200 200 - 220 140 - 180
NSW 100 - 130 130 - 170 150 - 190 190 - 220 130 - 150
VIC 70 - 100 90 - 120 100 - 140 130 - 160 130 - 180
SA 90 - 100 100 - 130 130 - 150 150 - 180 135 - 160
NT 120 - 190 165 - 230 170 - 220 195 - 240 140 - 180
* Project Engineer - Discipline (Civil/Structural/Mechanical/Process/Elec/I&C)
** Superintendent - Discipline (Civil/Structural/Mechanical/Process/Elec/I&C)

2018 Hays Salary Guide | 159
OIL & GASProject Development
NOTES:
PROJECT DELIVERY/CONTROLS HSEQOnshore Advisor/Officer
Offshore Advisor/Officer HSE Manager
QA/QC Manager
WA 90 - 120 150 - 190 130 - 160 130 - 160
QLD 90 - 120 N/A 120 - 160 120 - 160
NSW 80 - 120 N/A 120 - 200 110 - 160
VIC 90 - 130 N/A 140 - 200 120 - 150
SA 90 - 140 N/A 130 - 160 120 - 140
NT 90 - 160 150 - 200 170 - 245 135 - 175
Corporate HSE Manager
Environmental Engineer
Environmental Advisor
WA 180 - 230 120 - 140 130 - 160
QLD 160 - 200 130 - 180 130 - 160
NSW 190 - 250 115 - 165 125 - 180
VIC 140 - 220 120 - 155 120 - 160
SA 160 - 180 125 - 160 90 - 120
NT 220 - 300 140 - 185 155 - 190
SUBSEA PROJECT DELIVERYTechnician (non degree)
Senior Technician (non degree) Installation Engineer
Senior Installation Engineer
WA 80 - 120 100 - 140 130 - 175 150 - 190
QLD N/A N/A N/A N/A
NSW N/A N/A N/A N/A
VIC N/A N/A N/A N/A
SA N/A N/A N/A N/A
NT 80 - 120 100 - 160 130 - 175 160 - 220
Installation Manager/Client Rep
Vessel Mgr/Marine Ops Manager
WA 150 - 200 180 - 220
QLD N/A N/A
NSW N/A N/A
VIC N/A N/A
SA N/A N/A
NT 180 - 260 160 - 220
• All salaries shown are exclusive of superannuation

160 | 2018 Hays Salary Guide
OIL & GASOperations & Maintenance
NOTES:
OPERATIONS & MAINTENANCEDiscipline Engineer*
Maintenance Planner
Maintenance Supervisor
Production Superintendent
Production Manager
Process Operator
WA 120 - 180 120 - 160 120 - 160 135 - 180 140 - 200 80 - 100
QLD 100 - 150 110 - 160 120 - 160 130 - 180 140 - 180 80 - 110
NSW 100 - 150 100 - 140 100 - 140 110 - 150 150 - 190 75 - 115
VIC 75 - 125 90 - 120 90 - 130 110 - 150 140 - 180 100 - 130
SA 85 - 120 95 - 120 120 - 130 130 - 150 150 - 180 80 - 100
NT 135 - 180 120 - 170 120 - 160 120 - 170 150 - 210 100 - 120
DESIGN/ENGINEERINGDiscipline Tech** OIM
Ops Support Engineer
Ops Superintendent Ops Manager
WA 85 - 120 170 - 210 100 - 150 140 - 180 200 - 250
QLD 70 - 110 N/A 100 - 140 130 - 180 180 - 230
NSW 70 - 90 N/A 80 - 110 120 - 180 190 - 260
VIC 60 - 100 180 - 250 90 - 130 120 - 170 150 - 200
SA 70 - 110 170 - 200 90 - 130 140 - 180 180 - 220
NT 85 - 120 N/A 100 - 150 150 - 200 210 - 300
• All salaries shown are exclusive of superannuation * Discipline Engineer - Discipline (E&I/Mech/Process/Corrosion/Materials/Reliability)
** Discipline Tech - Discipline (E&I/Mech/Process)

2018 Hays Salary Guide | 161
* Discipline Engineer - Discipline (E&I/Mech/Process/Corrosion/Materials/Reliability)
** Discipline Tech - Discipline (E&I/Mech/Process)
OIL & GASGeosciences & Petroleum Engineering
• All salaries shown are exclusive of superannuationNOTES:
GEOSCIENCESGraduate Geoscientist
Intermediate Geoscientist
Senior Geoscientist
Lead Geoscientist
Exploration Manager
Technical Assistant
WA 60 - 90 80 - 110 140 - 180 180 - 220 230 - 300 50 - 80
QLD 60 - 90 90 - 120 120 - 160 160 - 200 210 - 270 60 - 80
NSW 65 - 95 90 - 130 120 - 185 180 - 250 210 - 290 70 - 95
VIC 55 - 70 65 - 100 80 - 130 140 - 160 200 - 250 75 - 95
SA 45 - 60 60 - 80 80 - 100 100 - 120 120 - 150 50 - 70
NT 70 - 110 90 - 140 150 - 230 200 - 280 230 - 300 80 - 110
Geologist HydrogeologistEnvironmental Geologist Petrophysicist
WA 120 - 230 120 - 200 120 - 200 150 - 230
QLD 120 - 200 110 - 190 N/A 140 - 220
NSW 120 - 190 100 - 170 100 - 150 150 - 230
VIC 100 - 140 100 - 140 80 - 100 150 - 220
SA 80 - 100 90 - 130 70 - 100 120 - 140
NT 120 - 200 120 - 200 120 - 200 140 - 220
PETROLEUM/RESERVOIR ENGINEERINGGraduate Engineer
Intermediate Engineer
Senior Engineer
LeadEngineer
Engineering Manager
WA 65 - 85 80 - 120 140 - 180 180 - 230 230 - 300
QLD 60 - 90 90 - 120 130 - 180 180 - 220 220 - 300
NSW 70 - 90 95 - 135 120 - 150 130 - 190 180 - 220
VIC 60 - 80 75 - 100 130 - 150 150 - 210 190 - 280
SA 50 - 55 70 - 100 120 - 130 150 - 180 180 - 200
NT 75 - 125 120 - 180 160 - 220 185 - 240 230 - 300
DRILLINGDrilling Engineer
Senior Drilling Engineer
Drilling Manager
LWD/MWD Engineer Rig Manager
WA 120 - 160 160 - 200 190 - 250 110 - 160 180 - 250
QLD 140 - 180 180 - 230 230 - 250 110 - 160 160 - 200
NSW 110 - 150 150 - 190 200 - 270 N/A 155 - 185
VIC 120 - 150 150 - 180 200 - 280 100 - 140 180 - 200
SA 120 - 150 150 - 180 180 - 200 90 - 120 150 - 200
NT 145 - 180 170 - 240 240 - 320 90 - 140 165 - 195

ABOUT USOur passion lies in helping people develop their professional careers, in whatever sector they work; this principle is what makes Hays the world’s leading expert in powering the world of work.
We believe that the right job can transform a person’s life and the right person can transform an organisation. We have the depth of expertise and market insight to offer advice to both clients and candidates.
Fuelled by energy and passion, we look beyond skills and experience to find the right cultural fit. This allows us to find the right match that enables individuals and organisations to flourish.
Working across a wide variety of specialist areas, we have experts recruiting for professions from HR, legal and accountancy & finance to information technology, construction and life sciences, meaning we have the breadth of expertise to find the people you need.
Our extensive candidate database allows our consultants to search millions of candidates globally using Hays search technology to find the best people in the fastest timeframe. In addition we have partnered with SEEK Limited to create a leading and innovative position in the use of cloud computing and data science in the recruiting industry, bringing value to hirers and jobseekers alike. This new capability is fully integrated at both the database and candidate management system level, and creates instantaneous records of relevant SEEK candidates.
Our exciting collaboration with LinkedIn® provides real-time data on the active candidate market, behavioural trend analysis for future movers and an additional talent pool. GET SOCIAL
OUR SPECIALISMS
Hays is the most followed recruitment agency on LinkedIn® in the world. Join our growing network by following Hays Worldwide.
Get expert advice, insights and the latest recruitment news by following us on Twitter and Facebook:
@HaysAustralia @HaysNewZealand
Accountancy & FinanceArchitectureBankingConstructionContact CentresEducationEnergyEngineeringExecutiveFacilities ManagementHealthcareHuman ResourcesInsuranceInformation TechnologyLegalLife SciencesLogisticsManufacturing & OperationsMarketing & DigitalOffice SupportOil & GasPolicy & StrategyProcurementPropertyResources & MiningRetailSales Trades & Labour
162 | 2018 Hays Salary Guide

41+Years of experience
30Expertise areas
930+Recruiting experts
38Offices across Australia & New Zealand
2000+Jobs filled each week
ABOUT HAYS IN AUSTRALIA & NEW ZEALAND

hays.com.au | hays.net.nz
This guide is reproduced in full in PDF format on our websites.
HAYS and the H device are protected by trade mark and design laws in many jurisdictions. Copyright © Hays plc 2018. The reproduction or transmission of all or part of this work, whether by photocopying or storing in any medium by electronic means or otherwise, without the written permission of the owner, is prohibited. The commission of any unauthorised act in relation to the work may result in civil or criminal actions.
Australia
New South WalesSydneyChifley Tower T: 02 8226 9600City South T: 02 9280 3577North Sydney T: 02 9957 5733Chatswood T: 02 9411 8122Parramatta T: 02 9635 1133Liverpool T: 02 9601 8822Burwood T: 02 9744 3344Hurstville T: 02 9580 8333Newcastle T: 02 4925 3663Wollongong T: 02 4222 0100
VictoriaMelbourneCollins St T: 03 9604 9604St Kilda Rd T: 03 9804 5313Glen Waverley T: 03 8562 4250Moonee Ponds T: 03 9326 2149Camberwell T: 03 9946 3500Geelong T: 03 5226 8000
QueenslandBrisbaneBrisbane T: 07 3243 3000Mt. Gravatt T: 07 3349 6563Chermside T: 07 3259 4900Gold Coast T: 07 5571 0751Maroochydore T: 07 5412 1100Ipswich T: 07 3817 1900Toowoomba T: 07 3817 1999Mackay T: 07 4960 1100Townsville T: 07 4771 5100Mt. Isa T: 07 4960 1121Cairns T: 07 4049 2900
ACTCanberra T: 02 6257 6344
Western AustraliaPerth T: 08 9254 4595
South AustraliaAdelaide T: 08 8231 0820
TasmaniaHobart T: 03 6234 9554Launceston T: 03 6333 9400
Northern TerritoryDarwin T: 08 8943 6000
New Zealand
Auckland T: 09 377 4774South Auckland T: 09 525 1333Wellington T: 04 471 4490Christchurch T: 03 377 6656
Our international reach -operating in 33 markets
Australia
Austria
Belgium
Brazil
Canada
Chile
China
Colombia
Czech Republic
Denmark
France
Germany
Hong Kong
Hungary
India
Ireland
Italy
Japan
Luxembourg
Malaysia
Mexico
Netherlands
New Zealand
Poland
Portugal
Russia
Singapore
Spain
Sweden
Switzerland
United Arab Emirates
United Kingdom
United States of America


