131
Keeping Cattle & the Cost of Water in Eastern Botswana Ministry of Agriculture December, 1980 BEST AVAILABLE COpy

Keeping Cattle& the Cost of Waterin Eastern Botswana
Ministry of AgricultureDecember, 1980
BEST AVAILABLE COpy

WATER POINI'S SURVEY PUBLICATIONS
1. Emery Roe. 1980. Development of Livestock, Ag.riculture and WaterSupplies in Eastern Botswana Before Independence: A Short History andPolicy Analysis. Cornell University Rural Development Committee.Occasional Paper No. 10.
2. Charles Bailey, Louise Fortmann, and Emery Roe. 1980. Key to WaterPoint s Survey Maps. Ministry of Agriculture.
3. Charles Bailey. 1980. Keeping Cattle and the Cost of Water in EasternBotswana. Ministry of Agriculture.
4. Louise Fortmann and Emery Roe. 1"981. The Water Points Survey. Ministryof Agriculture.
5. Louise Fortmann and Emery Roe. 1981. Water Use in Eastern Botswana:Policy Guide and Su.mma.;r;v of the Water Points Survey. Ministry ofAgriculture. .
6. George Wellington. 1981. Bating Cattle for Physical Condition.Ministry of Agriculture.
7. Elaine Aderhold. 1981. :fia.ngeland Monitoring Methodology Based onLandsat Date: Case Stud in the Re ublic of Botswana. UnpublishedMasters Thesis Cornell Univer~ity •
8. Charles Bailey. 1981. Kee i Cattle and the Davelo ment of WaterResources in Eastern Botswana. Unpublished PhD. Dissertation CornellUniversity) •

KEEPING CATTLE AND THE
COST OF WATER
IN EASTERN BOTSWANA
.p
Charles Bailey
Ministry of Agriculture

TABLE OF CONTENTS
Page
Caveats and Acknowledgments
Introduction
Cattle holders: The Survey Respondents
Water Point Types and Categories
Part I. Cattle Holder Watering Strategies
Location and Movement of Cattle
Choice of Water Points
Reliability
Cost
Convenience
v
1
4
8
9
9
15
27
28
35
Part II. Patterns of Wq.ter Point Use: January 1979-March 1980 38
Number of Water Points Used
Number of Cattle Using Water Points
Quantity of Water Demanded by Cattle
Water Point Use Over Time: A Summary View
Part III. Costs of Water Point Construction, Operation,and Maintenance
Dams and Hafir-Dams
ConstructionThe Ministry of Agriculture's Small Dam Unit
The Serowe Brigades Dam Building Unit
A Private Contractor
Operation and Maintenance
i
40
41
42
43
49
49
49
56
58
62

Boreholes
Construction
Government Drilling
Private Sector Drilling
Equipping
Operation and Maintenance
Open Wells
Construction and Maintenance
Operation.
The Unit Cost of Water at Dams, Boreholes, and Open Wells
Summary and Conclusions
Appendices
A. Definitions of Water Point Physical Types.B. Derivation of Livestoc~ Units and Liters of Water
per Water Point
C. Water Use Fees Charged in Eastern Botswana
D. Derivation of Small Dam Unit Costs in FY 1979
63
66
66
66
69
70
70
72
73
79
A-I
B-1
C-l
D-l
....--...

Page7
7
TABLES
1. APRU Definitions of a Livestock Unit
2. Livestock Unit Definition Adopted by the Water Points Survey
3. Location of Main Herds and Area Type Importance by Community:November 1979
4. Year Respondents Started Keeping Cattle in Present Location
5. Reasons Respondents Kept Cattle at a Particular Place
6. Number of Herds MOved and Reasons Given: January 1979-March 1980
7. Number of Water Points Used by Respondents for Cattle. by WaterPoint Category: April 1979-March 1980
8. Percent of Total Annua1,LSU-Water Point Months Spent at DifferentCategories of Water Point
9A. Reasons Given for Leaving a Water Point, January 1979-March 1980I
9B. Reasons Given for Starting to Use a New Water Point: January 1979March 1980 23
24
30
33
16
~
22
10
12
13
14
37
44
50
51
53
54
59
60
64
65
67
68
69
72
74
77
78
Actual Farmer Responses Categorized in Tables 9A and 9B
Resources Required for Water Points of Different Physical Types
Cost of Water for Nonowners of Waber Points
Index of Kraal-Water Point Distances by Physical Type of WaterPoint .
Summary of Water Point Use Statistics: April 1979-March 1980
Man-Made Water Points in Eastern Communal Area
Location of SDU-bui1t Dams •p
SDU Dams Completed in 1979-1980
Costs of Running the Small Dam Unit--Fisca1 Year 1979
Dam Construction Costs for a Private Contractor
Summary of Dam Construction Costs
Government Borehole Drilling Costs
Comparative Borehole Drilling Costs
Central Government Borehole Equipping Costs: APRU Makhi II Ranch
Northeast District Connci1 Borehole Equipping Costs: Maka1eng
Summary of Borehole Construction Costs
Open Well Construction Costs
Unit Cost of Water at Different Water Points--12% Interest Rate
Unit Cost of Water at Different Interest Rates
The Unit Cost of Water for Cattle
13.
14.
15.
16.
17.
18.
19.
20.
21.
22.
23.
24.
25.
26.
27.
28.
9C.
10.
11.
12.
iii
FIGURES
1. Map of Water Points Survey Area
2. Numbers of Herds Kept in Areas of Different Types: 15 Months
3. Total Number of Water Points in Operation, Cattle Using Them, andLiters of Water Demanded: January 1979-March 1980
4. Seasonal Variation in Distance to Water
5. Number of Water Points in Operation. by Management Type: January 1979March 1980
6. Number Qf Water Points in Operation by Physical Type: January 1979March 1980
7. Number of Cattle (LSU) Present at Water Points. by Physical Type:January 1979-March 1980
8. Numb~r of Cattle (LSU) Present at Water Points. by ManagementPhysical Type Categories: January 1979-March 1980
9. Daily Water Demand by Cattle (LSU). by Management-Physical TypeCategories: January 1979-March 1980
iv

CAVEATS AND ACKNOWLEDGMENTS
The usual pattern in doctoral research is to finish the disserta-
tion and then write the articles. In this instance the pattern is rever-
sed. The reader is thus cautioned that material appearing in this article
is to be further refined and extended in an upcoming dissertation. In the
interim, the author would be very pleased to receive comments addressed
care of the Department of Agricultural Economics, Cornell University,
Ithaca, N.Y. ·14853, USA.
The data on which this article is based came from many sources,
chief among which are the 246 Batswana cattle holders who patiently and re-
peatedly submitted to questioning about their husbandry practices. This
paper literally could not have been written without their help plus the
diligence of the Water Points Survey enumerating staff. Other essential.information came from interviews with officials in the Ministry of Agricul-
ture (the home base of the Water Points Survey), the Ministry of Natural Re-
sources and Water Affairs, and the Roads Department, as well as private
contractors, drillers, and water point owners in the 12 surveyed communi-
ties. Without the energy and insight of Dr. Louise Fortmann and Emery Roe,
my two friends and colleagues in the Water Points Survey, this whole enter-
prise would have been quite impossible. Professor Daniel G. Sisler at
Cornell read an earlier draft of this paper, and his comments greatly im-
proved the present version.
I am grateful for the assistance of all these people, but the respon-
sibility for any errors of fact or interpretation of course remains my own.
v
1
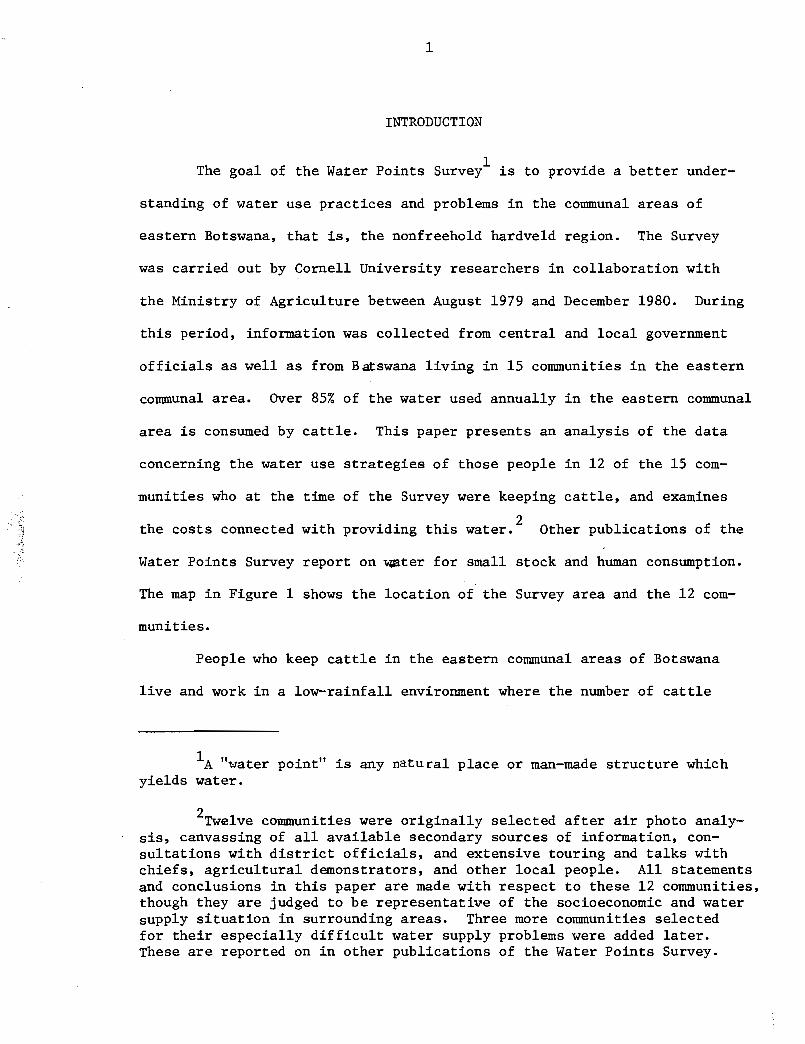
INTRODUCTION
1The goal of the Wa~er Points Survey is to provide a better under-
standing of water use practices and problems in the communal areas of
eastern Botswana, that is, the nonfreehold hardveld region. The Survey
was carried out by Cornell University researchers in collaboration with
the Ministry of Agriculture between August 1979 and December 1980. During
this period, information was collected from central and local government
officials as well as from Batswana living in 15 communities in the eastern
communal area. Over 85% of the water used annually in the eastern communal
area is consumed by cattle. This paper presents an analysis of the data
concerning the water use strategies of those people in 12 of the 15 com-
munities who at the time of the Survey were keeping cattle, and examines
2the costs connected with providing this water. Other publications of the
Water Points Survey report on ~ter for small stock and human consumption.
The map in Figure 1 shows the location of the Survey area and the 12 com-
munities.
People who keep cattle in the eastern communal areas of Botswana
live and work in a low-rainfall environment where the number of cattle
lA '\later point" is any natural place or man-made structure whichyields water.
2Twelve communities were originally selected after air photo analysis, canvassing of all available secondary sources of information, consultations with district officials, and extensive touring and talks withchiefs, agricultural demonstrators, and other local people. All statementsand conclusions in this paper are made with respect to these 12 communities,though they are judged to be representative of the socioeconomic and watersupply situation in surrounding areas. Three more communities selectedfor their especially difficult water supply problems were added later.These are reported on in other publications of the Water Points Survey.

2<1'-17'
21'\
22' \I
23"\,., I
2.'I
28"I
27'
I
," 2Et-
I2..
'7'
'8"
,..
23"
25'
27'
2"
28"
_..... ...............'""•'-.
Study Areas
11 Mokaleng
21 Phokoje
22 Motongalong
23 Ramokgonami
24 Mosolotshane
25 Mmaphashalala
31 Di~gonnye
32 Matebele
41 lentsweletau
42 Gamodubu
51 Ntlhantlhe
52 Mokatako
27' 28" 2"28"2.'2"23"
'100 200 KiIotrIetrn'----_......,---_....,22'21'
I
·I•I·Ir'-"·I·I~K
~ ............. J
·.......2.' \ \.
, \ -_...! tI •, '\I •
\,..27'
28"
-2<1'
,'-, I~~:~--------~~-, !
... ......-~~-- .--~'- --., (...... - /------.-- "'\ r;J'''''tKaune• -_.-- ...... r--'-lr'" ."...........,_ \ _....." .,#,. "
\,. 1 CHOBE '"I 0..-_... ._,.. u._.._.. .!_.._ .._.\
i ".'."..... , .Western limitof
'- .- 2CJI~' Study Area
••• I
-21'
-23"
Figure 1 Water Point Survey Study Area
2
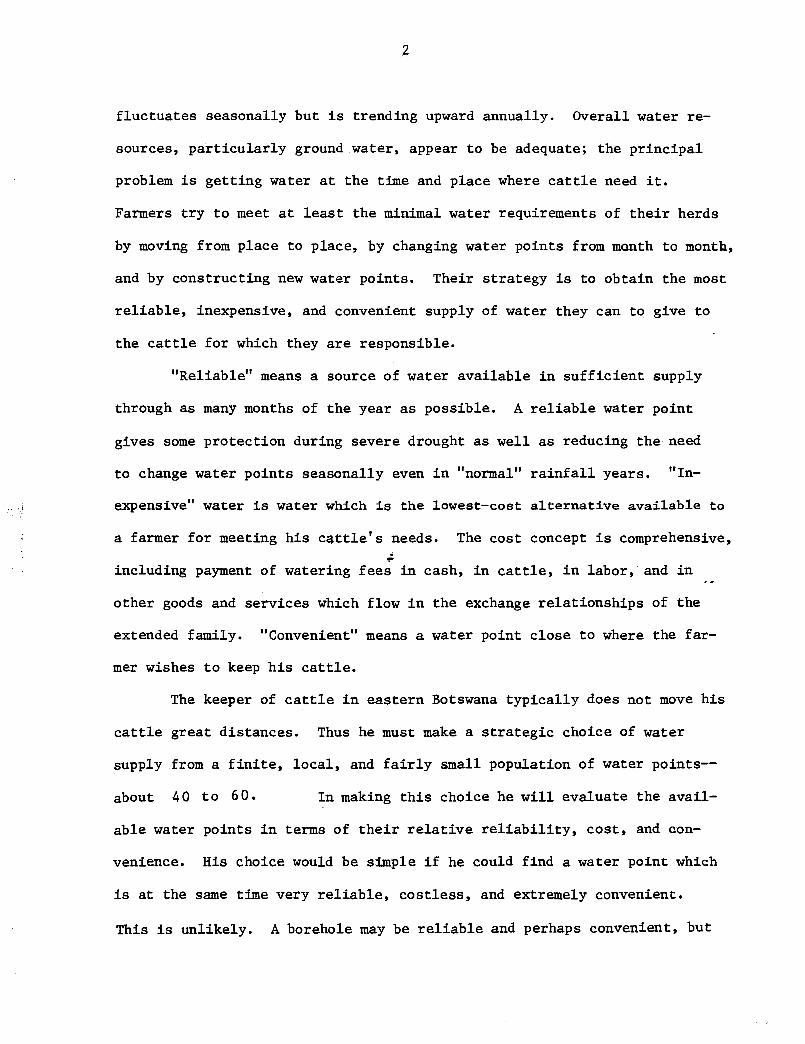
fluctuates seasonally but is trending upward annually. Overall water re-
sources, particularly ground water, appear to be adequate; the principal
problem is getting water at the time and place where cattle need it.
Farmers try to meet at least the minimal water requirements of their herds
by moving from place to place, by changing water points from month to month,
and by constructing new water points. Their strategy is to obtain the most
reliable, inexpensive, and convenient supply of water they can to give to
the cattle for which they are responsible.
"Reliable" means a source of water available in sufficient supply
through as many months of the year as possible. A reliable water point
gives some protection during severe drought as well as reducing the need
to change water points seasonally even in "normal" rainfall years. "In-
expensive" water is water which is the lowest-cost alternative available to
a farmer for meeting his cattle's needs. The cost concept is comprehensive,:..
including payment of watering fees in cash, in cattle, in labor, and in
other goods and services which flow in the exchange relationships of the
extended family. "Convenient" means a water point close to where the far-
mer wishes to keep his cattle.
The keeper of cattle in eastern Botswana typically does not move his
cattle great distances. Thus he must make a strategic choice of water
supply from a finite, local, and fairly small population of water points--
about 40 to 60. In making this choice he will evaluate the avail-
able water points in terms of their relative reliability, cost, and aon-
venience. His choice would be simple if he could find a water point which
is at the same time very reliable, costless, and extremely convenient.
This is unlikely. A borehole may be reliable and perhaps convenient, but

3
probably very costly. A dam may be nnreliable, some distance away, but
costless. The decision the farmer makes thus suggests the importance he
places on each of these three selection criteria.
It is the thesis ?f this paper that farmers do choose the most re-
liable, inexpensive, and convenient source of water among the alterna-
tives open to them.
Choosing the best available water supply, however, does not neces-
sarily mean, in the eastern communal area, that cattle will get enough
water to bring out their best performance. Economic productivity of beef
cattle is a function of reproductive performance, calf growth, calf mortal-
ity, and carcass merit. The first three of these factors can be measured
by "weight of wiener calf per cow per year"--a standard of growth in the
sense of animal body weight gain over a stated period of time. 3 The Ani-
mal Production Research Unit (APRU) of the Ministry of Agriculture recom-
4mends a package of practices which farmers can use to achieve this growth.
A principal part of this package is a water point or water points which can
provide a continuous supply of water freely available to cattle at all
times. 5 This standard of water supply is not reached by any farmer who
responded to the questionnaires of the Water Points Survey.
The farmer's cattle watering goal is a quantity at or somewQat above
3Animal Production Research Unit, Livestock and Range Research inBotswana--1978 (Gaborone: Ministry of Agriculture, 1978), pp. 20-24.
4Ibid ., p. 18.
5Animal Production Research Unit, Beef Production and Range Management in Botswana (Gaborone: Ministry of Agriculture, 1980), p. 12.

4
the minimum subsistence requirements of his herd, but short of the AFRU
ideal. This is mostly a frank recognition of constraints in local water
supply, but partly a lack of appreciation of performance gains attainable
through an abundant supply of water. Furthermore, growth to the farmer is
the increase in numbers of animals in his herd, not individual bodyweight
gain, which he sees as the result of weather and local grazing pressure.
Clearly, getting enough water for cattle is a prime concern of farmers,
but the meaning of "what is enough" is very flexible.
Throughout the rest of this paper, the target quantity of water for
cattle is the APRU ideal of that quantity consumed by cattle when water is
freely and continuously available to them. This is useful for planning
purposes though it should be recognized that to provide the AFRU ideal
quantity of water to every cattle holder in the eastern communal area would
require enormous amounts of publi~ and private investment, and basic
changes in current animal husbandry practices. Investment in water re
sources development should continue to be directed toward developing a
secure water supply "floor" first, with free and continuous supply a sec
ondary goal. Cattle in the eastern communal area will continue to consume
a quantity of water below that of the APRU ideal for some time to come.
However, with good planning, the geographical and temporal distributions
of water can be improved.
Cattle Holders: The Survey Respondents
Farmers in 358 randomly selected households in 12 communities re
sponded to questionnaires and personal interviews about their water use
practices and problems. Of this group, 246 had cattle and answered ques-

5
tions in the first round of the cattle owners' survey in Noyember 1979.
The second round, conducted in March 1980, collected information from 239
respondents. (Seven farmers from the first round could not be reached
again.) Survey respondents provided information on cattle numbers and
husbandry practices as well as changes in herd size and structure through
births, deaths, sales, trades, etc., which took place during 1979 and the
first quarter of 1980. Cattle numbers were broken down by type of animal
6(bull, cow, ox, etc.) and by type of holding (owned and kept, mafisa'd,
in, borrowed in, mafisa'd out, and loaned or hired out). The first three
types of holding constitute the respondent's "management herd," i. e., the
cattle for which he must provide water on a week to week basis. Mafisa'd
out and loaned or hired out animals, on the other hand, are the watering
responsibility of someone else. Therefore, in examining watering practices,
only animals in the respondent'~ management herd have been considered.
Another set of questions in the second round of the cattle owners'
survey asked the respondents to recall where they had kept their cattle
and which water points they had used in each of the 15 months back to Jan-
uary 1979. These questions were asked about the managed herd or herds,
and any groups of animals separated for use at another location during the
period. Thus the 239 second round respondents had 239 'lnain herds/' plus
32 "subherds" consisting of 20 groups of animals separated for draft use,
8 groups containing both draft and milch animals, and 4 groups of milch
6"Mafisa" is the long-term loaning of animals. The mafisa holdergets the right to the milk and draft power of these animals in exchangefor looking after them.

6
cows only. In the rest of the paper t "herd" by itself will refer to
both main and subherds. The 271 herds are the basis of information on
cattle holder watering strategies which are presented in the following
sections.
Every survey of cattle owners must consider the problem of mis-
reporting of cattle numbers t particularly when the enumerators are assoc-
iated with an arm of government. Certain measures to ensure accuracy
were followed by the Water Points Survey: enumerator visits to kraals
with the respondent t cross-checks built into the questionnaires t and
7examination of cattle crush reports. The purposes of the Water Points
8Survey were also explained and discussed in a succession of kgotla
meetings in each of the communities. Enumerators lived in the communities
for eight to nine months, and over this time were able to establish a rap-
port and a sense of trust with tpeir respondents. Supervisors visited
the communities nearly every week and also met many of the respondents.
Therefore these cattle numbers are felt to be reasonably accurate and
sufficient for the purposes of the present analysis.
A note on terminology: All cattle numbers are expressed in terms
of "livestock units" (LSU) to provide a common denominator for comparisons.
The LSU definition is a slightly simplified form of the definition used
by the AFRU, shown in Table 1.
7A "crush" is a government-maintained holding pen and chute in whichcattle can be immobilized for inoculations and tick treatments.
8The "kgotla" is an institution of local government presided overby a tribal authority. Physically, it is a place in the community forvillage meetings and the proceedings of the tribal court.
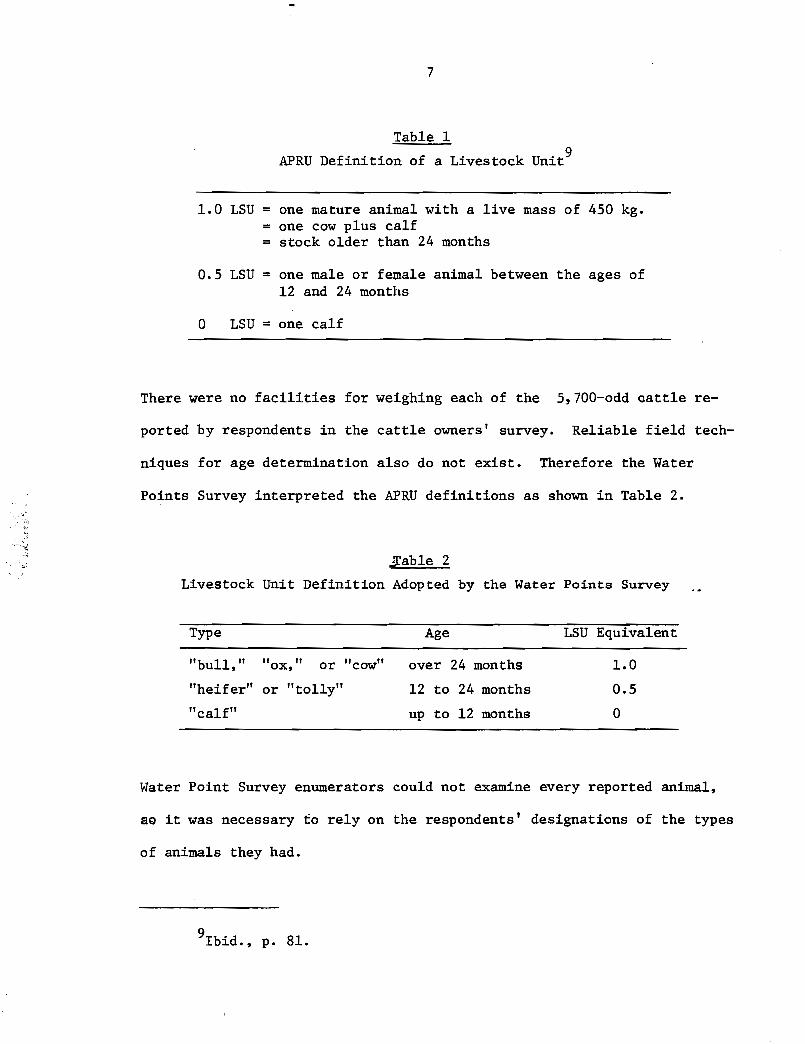
7
Table 1
APRU Definition of a Livestock Unit9
1.0 LSU one mature animal with a live mass of 450 kg.= one cow plus calf= stock older than 24 months
0.5 LSU = one male or female animal between the ages of12 and 24 months
o LSU = one calf
There were no facilities for weighing each of the 5,700-odd aattle re-
ported by respondents in the cattle owners' survey. Reliable field tech-
niques for age determination also do not exist. Therefore the Water
Points Survey interpreted the APRU definitions as shown in Table 2.
$able 2
Livestock Unit Definition Adopted by the Water Points Survey
Type Age LSU Equivalent
"bull," "ox, " or "cow" over 24 months LO
"heifer" or "tolly" 12 to 24 months 0.5
"calf" up to 12 months 0
Water Point Survey enumerators could not examine every reported animal,
SQ it was necessary to rely on the respondents' designations of the types
of animals they had.
9Ibid ., p. 81.

8
Water Point Types and Categories
The Water Points Survey identified ten physically distinct types
of water point. These are defined in Appendix A, and this terminology
is used throughout the paper.
The Survey also classified water points by management type. Broadly
speaking, '!management" is the exercise of human control from the time of
siting and construction of man-made water points or first use of natural
water points through their service life until they are abandoned. The
siting and construction phase of man-made water points usually involves
several agencies of district and central governments (Land Boards, dis-
trict Land Use Planning and Advisory Groups, tribal authorities, the mini-
stries of Local Government and Lands, Mineral Resources and Water Affairs,
and Agriculture) as well as private individuals, farmers' groups, and
private contractors or drillers •• Costs of water point construction are~
discussed in Part III of this paper.
The much longer water point operational phase involves a somewhat
different set of actors who own, manage, or own and manage water points.
Ownership and management require runn~ng the facility itself, maintaining
the facility, and revenue collection (if any). Ownership and management
also imply control of access :to the water point. The water points which
appeared in the Survey were classified into five management types:
1. Agencies of the central or district governments ("government"),which may own damsand hafir-dams, or own and manage boreholes.
2. Private individuals, who own and manage every physical type ofman-made water point.
3. Farmers' groups, which manage hafir-dams, or farmer "syndicates"which own and manage boreholes.
4. Whole communities taken as a group ("communal"), which may

9
manage every man-made physical type.
5. Natural water points--rivers, pans, and springs.
Both managerial and physical characteristics of a water point condition
its availability for use by cattle holders.
Cross-classification of water point management and physical types
produced 16 management-physical type categories each of which contains
one or more examples reported in the cattle owners' survey.
PART I. CATTLE HOLDER WATERING STRATEGIES
Location and MOvement of Cattle
In the short run, farmers can either move their cattle, or change
water points as they attempt to meet their herds' water requirements.
Most survey respondents kept their cattle permanently in one place, with
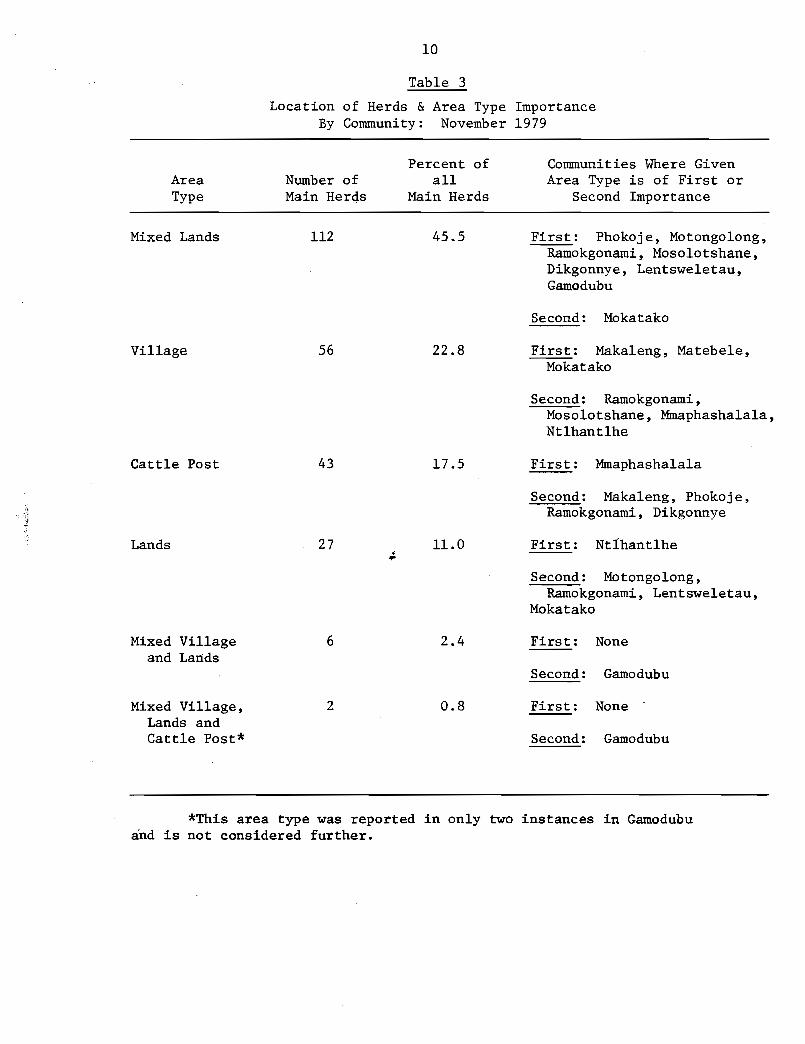
seasonal movements to the landslO for plowing. Table 3 shows how first
round respondents characterized the type of area where they were keeping
their cattle in November 1979. Over two-thirds of the main herds were in
11mixed lands and,cattle post areas or in a village. Less than 20% were
at a cattle post, and only 11% were at the lands. The right-hand column
lists the communities where the given area type was of first or second
importance. Four of the seven communities in which mixed lands and cattle
post areas are the dominant location for cattle keeping are themselves
laThe "lands"arable agriculture.are important crops.
are areas of fenced fields where farmers carryonSorghum, maize, millet, watermelon, and sweet reed
llA "cattle post" is a place where cattle are kept which is surrounded by unrestricted open range.
10
Table 3
Location of Herds & Area Type ImportanceBy Community: November 1979
AreaType
Mixed Lands
Village
Cattle Post
Lands
Mixed Villageand Lands
Mixed Village,Lands andCattle Post*
Number ofMain Herds
112
56
43
27
6
2
Percent ofall
Main Herds
45.5
22.8
17.5
11.0
2.4
0.8
Communities Where GivenArea Type is of First or
Second Importance
First: Phokoje, Motongo1ong,Ramokgonami, Mosolotshane,Dikgonnye, Lentsweletau,Gamodubu
Second: Mokatako
First: Makaleng, Matebele,Mokatako
Second: Ramokgonami,Mosolotshane, Mmaphashalala,Ntlhantlhe
First: Mmaphashalala
Second: Maka1eng, Phokoje,Ramokgonami, Dikgonnye
First: Ntlhantlhe
Second: Motongolong,Ramokgonami, Lentsweletau,
Mokatako
First: None
Second: Gamodubu
First: None
Second: Gamodubu
*This area type was reported in only two instances in Gamodubuand is not considered further.

11
lands areas. However, even farmers in Ramokgonami, Mosolotshane, and
Lentsweletau--large, old, established villages--are finding it exped-
ient to operate in the "fringe" between traditional lands and cattle post
areas. Relatively few farmers in the Survey were keeping cattle in
areas they recognized as "cattle post" areas.
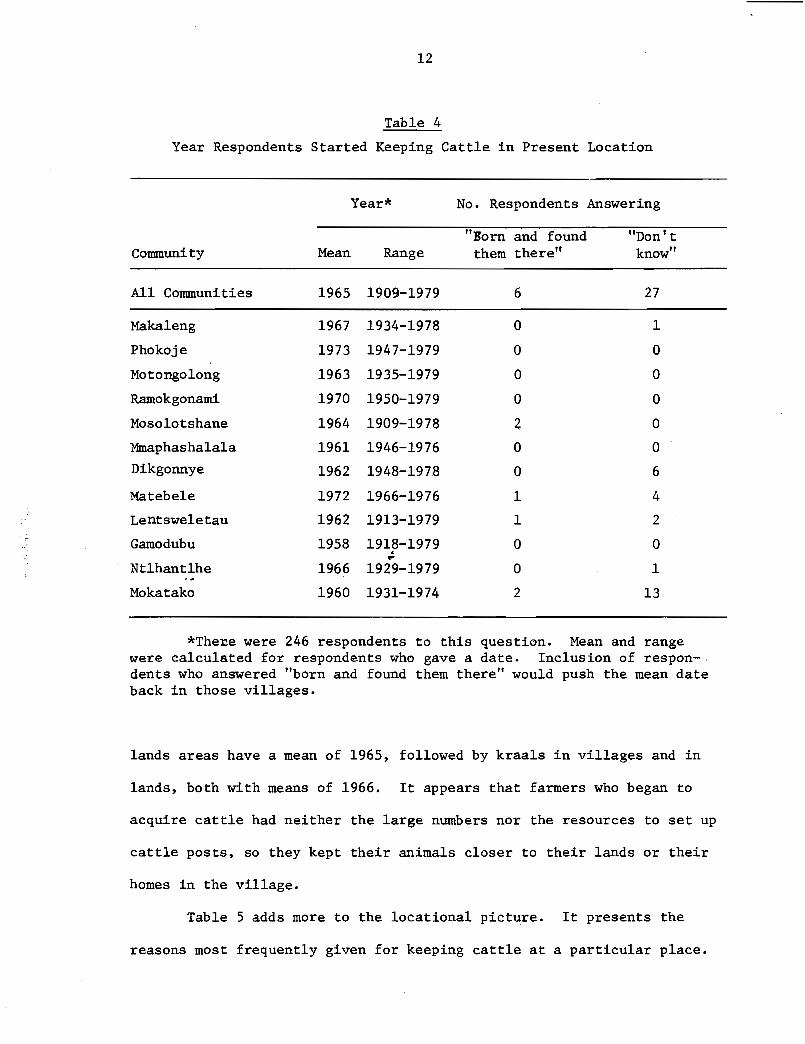
Table 4 presents the mean and the range of answers respondents
gave when asked for the year they started keeping cattle in their present
location. In this and other questions a large majority of respondents
appeared confident they knew the exact year. A few replied that the
family cattle were established at the place before they were born and
therefore they did not know the year. The year of known kraal12 estab-
lishment thus ranged from 1909 to 1979, with the mean falling in 1965.
This indicates that once a farmer finds a place for his kraal, he keeps
it there. The kraal is the "home base" for his animals throughout the...year, except perhaps in years of unusually low rainfall.
Both the number of cattle and the number of cattle holders in the
eastern communal area have increased, particularly in the last decade.
One-half of the respondents set up their kraals in the years following
1969 as the area recovered from the severe drought of the middle 1960s.
The mean year of kraal establishment in each different type of area sug-
gests a definite pattern of land use change. Kraals in currently recog-
nized cattle post areas of the 12 communities were on average started in
1958. Kraals in what are now mixed lands and cattle post areas' followed,
with a mean year of establishment falling in 1964. Mixed village and
12A "kraal" is a fenced enclosure for keeping cattle.

FIGURE 2NUMBERS OF HERDS KEPT IN AREAS OF DIFFERENT TYPES 15 MONTHS
Village
Mixed Lands & Cattle Post
Lands
Cattle Post
.--------.-.-.--.--.-.--.--.-.- --.'"\
\.
95
35
90
45
85
55
50
30
60
40
100
Jon 79 Feb 79 Mar 79 Apr 79 May 79 Jun 79 Jul 79 Aug 79
Month
Sep 79 Oct 79 Nov 79 Dec 79 Jon 80 Feb 80 Mar 80

165
FIGURE 3TOTAL NUMBER OF WATER POINTS IN OPERATION, CATTLE USING THEM, AND LITERS OF WATER DEMANDED
January 1979 to March 1980
. Figure 3AOperating Water Points
135
145
135 ..o---·~0-- ~
[Total Liters I
000'5
I Total ILivestock Uni Is
.I
Figure 3 BCattle Usage
I
Figure 3CWater Demand by Cattle
I
I
I
/0_.o__ o__• __.~o~ /0
• 0 ____0-- .•__o__o~~
0----0" .~o--.~.
". o~~.--. .~.---
~._-.--.----550
950
650
850
750
21000
18000
19000
17000
<>
20000
I I
. Jan 79 Feb 79 Mar 79 Apr 79 May 79 Jun 79 Jul 79 Aug 79 Sep 79 Oct 79 Nov 79 Dec 79 Jan 80 Feb 80 Mar 80
Month
12
Table 4
Year Respondents Started Keeping Cattle in Present Location
Year* No. Respondents Answering
"Born and found "Don'tCommunity Mean Range them there" know"
All Communities 1965 1909-1979 6 27
Maka1eng 1967 1934-1978 0 1
Phokoje 1973 1947-1979 0 0
Motongo10ng 1963 1935-1979 0 0
Ramokgonami 1970 1950-1979 0 0
Moso10tshane 1964 1909-1978 2 0
Mmaphasha1a1a 1961 1946-1976 0 0
Dikgonnye 1962 1948-1978 0 6
Matebe1e 1972 1966-1976 1 4
Lentswe1etau 1962 1913-1979 1 2
Gamodubu 1958 1918-1979 0 0.~
Ntlhant1he 1966 1929-1979 0 1
Mokatako 1960 1931-1974 2 13
*The~e were 246 respondents to this question. Mean and rangewere calculated for respondents who gave a date. Inclusion of respon-.dents who answered "born and found them there" would push the mean dateback in those villages.
lands areas have a mean of 1965, followed by kraals in villages and in
lands, both with means of 1966. It appears that farmers who began to
acquire cattle had neither the large numbers nor the resources to set up
cattle posts, so they kept their animals closer to their lands or their
homes in the village.
Table 5 adds more to the 10cationa1 picture. It presents the
reasons most frequently given for keeping cattle at a particular place.

13
The dominant reasons for maintaining cattle at a location can be sum-
marized as convenience and necessity--nearness to lands on the one hand,
and lack of labor and alternative locations on the other. Enough grass
and water rank next.
Table 5
Reasons Respondents Kept Cattle at ·a Particular Place
Number ofRespondents
63
56
34
32
28
26
19
Reasons Given*
Convenient for plowing
No other place to keep cattle
No labor available except owner's
Enough grass
Avoid crop damage disputes
~ Enough water
Can keep cattle at family's cattle post
*Remaining responses were specific to individual circumstancesand could not be categorized.
Figure 2 is a graph showing the numbers of herds present in four
different types of area month by month from January 1979 to March 1980.
It expands on the static picture presented in Table 3 and confirms the
view presented earlier: most herds are kept in mixed lands and cattle post
areas, and there is relatively little shifting of herds except for move-
ment to the lands for plowing. A sharp buildup of herds in the lands
and mixed lands and cattle post areas began in September-October 1979,
in parallel with a shift of herds out of the cattle posts and villages,

14
as farmers prepared to take advantage of the spring rains. Half the re-
spondents had begun to plow by the third week of November; by the second
week in January, half had finished plowing, and herds were being shifted
back out of the lands. Table 6 shows the number of main and subherds
moved to a different area over the 15 months, together with the reason
for the shift. Movement to get nearer to water is given as a reason by
only two respondents in,August 1979. Nearly all subsequent reasons for
movement relate either to plowing or to avoiding disputes about crop
damage by cattle.
Table 6
Number of Herds Moved and Reasons Given: January 1979-March 1980
',.!,
Month
Jan 79Feb 79Mar 79Apr 79May 79Jun 79Jul 79Aug 79Sep 79Sep 79Oct 79Nov 79Nov 79Nov 79Dec 79Dec 79Dec 79Jan 80Jan 80
Feb 80Feb 80Mar 80Mar 80
No. ofMainHerdsMoved
aaaa1aa251
1231184142
1132
Principal ReasonsGiven for Moving
Lack of herding labor
Take cattle closer to waterGoing to lands to plowTake cattle closer to grassGoing to lands to plowGoing to lands to plowAvoid crop damage disputesHard prevent scatteringLeft lands after plowingAvoid crop'~amage disputesGoing to lands to plowLeft lands after plowingAvoid crop damage disputes
Left lands after plowingAvoid crop damage disputesGoing to lands to plowLeft lands after plowing
No. ofSubherdsMoved
aaaaaaaaa
aa
71
5213
22
Principal ReasonsGiven for Moving
Left lands after plowingAvoid crop damage disputes'
Left lands after plowingAvoid crop damage disputesTake cattle closer to waterLeft lands dfter plowing
Left lands after plowing

15
Choice of Water Points
The previous section established that respondents do not generally
move their animals as a strategy for ensuring their water supply. This
section looks at strategies of changing water points to achieve the same
goal.
The 239 main herds and 32 subherds in this study met their water
requirements at 249 water points during the 15 months between January 1979
and March 1980. This amounted to 2,204 water point use-months. (Sub-
herds were away from their main herds only a few months out of the 15.)
Table 7 shows the size of the mean herd and the number of water points
used by survey respondents in each community by management-physical type
category for the one year period from April 1979 to March 1980. These 12
months were selected out of the total 15 to show the annual cycle of use
and to avoid overemphasizing the rainy season.'P'
All physical types were not used in all 12 communities. Respon-
dents used rivers and boreholes in 11 communities, open wells in 9, hafirs
in 8, and pans in 7. Sand river wells were used in 6 communities, dams
and seep wells in 5, hafir-dams in 3, and springs in 2. There are also
striking differences among the different communities in the number of
management-physical water p~int categories available: Ramokgonami res-
pondents used 29 water points in ten categories while Matebele respondents
used only 5 water points in three categories. Respondents in the "typi-
cal" community used 21 water points in seven management-physical type
categories to meet their cattle watering needs.
In each community respondents used some water points more heavily
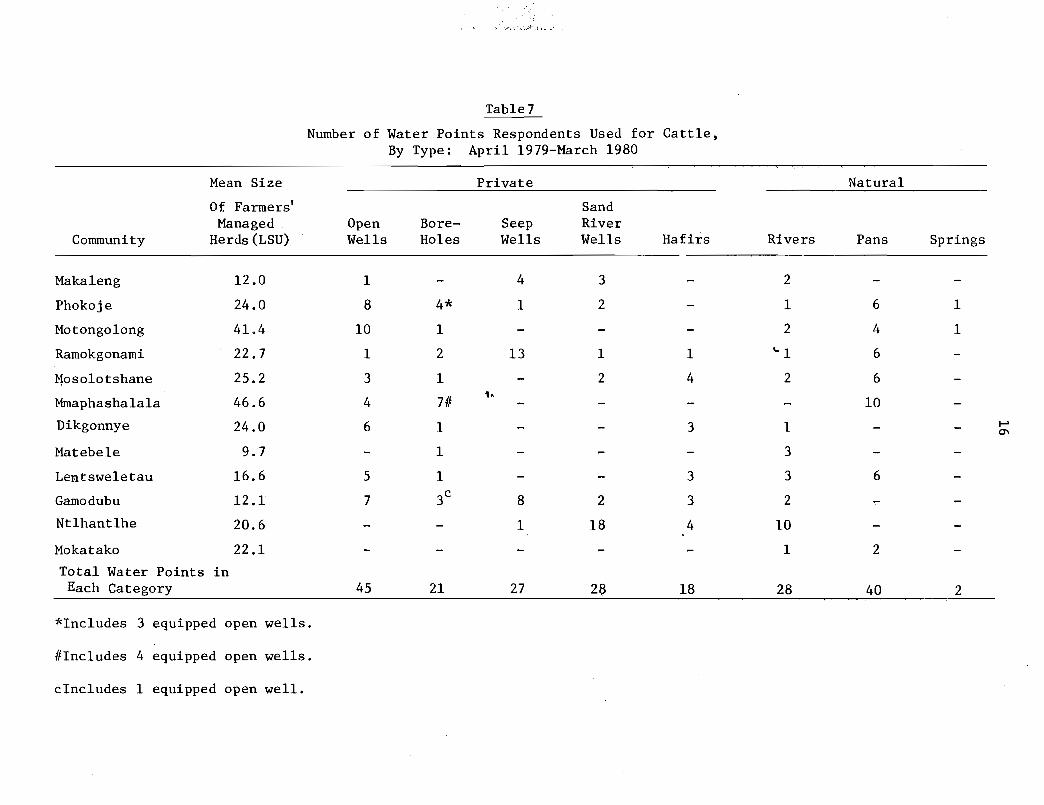
Table 7
Number of Water Points Respondents Used for Cattle,By Type: April 1979-March 1980
Mean Size Private Natural
Of Farmers' SandManaged Open Bore- Seep River
Community Herds (LSU) Wells Holes Wells Wells Hafirs Rivers Pans Springs
Makaleng 12.0 1 4 3 2
Phokoje 24.0 8 4* 1 2 1 6 1
Motongo1ong 41.4 10 1 2 4 1
Ramokgonami 22.7 1 2 13 1 1 '"I 6
l1oso1otshane 25.2 3 1 2 4 2 6
Mmaphasha1a1a 46.6 4 7#1.·
10
Dikgonnye 24.0 6 1 3 1 t-'0'0
Matebe1e 9.7 1 3
Lentswe1etau 16.6 5 1 3 3 6
Gamodubu 12.1 7 3c8 2 3 2
Ntlhant1he 20.6 1 18 4 10
Mokatako 22.1 1 2
Total Water Points inEach Category 45 21 27 28 18 28 40 2
*Includes 3 equipped open wells.
I/Includes 4 equipped open wells.
clncludes 1 equipped open well.

Table 7 (cont~
Number of Water Points Respondents Used for Cattle,By Type: April 1979-March 1980
Govern- Group/Mean Size Connnunal ment SyndicateOf Farmers' HaHrs/Managed Road Bore- Open Hafir~ Bore- Bore- Hafir-
Connnunity Herds (LSU Dams Pits Holes Wells Dams Holes Holes Darns
Maka1eng 12.0 1 1 1 2
Phokoje 24.0 1 8
Motongo1ong 41.4 1
Rarnokgonami 22.7 1 1.· 1 2
Moso1otshane 25.2 1 1
Mrnaphasha1a1a 46.6 1 1I-'......
Dikgonnye 24.0 2 5
Matebe1e 9.7 1
Lentswe1etau 16.6 1 2
Garnodubu 12.1 1 1 1Nt1hantlhe 20.6
Mokatako 22.1 1 2Total Water Pointsin Each Category 6 12 1 1 2 8 7 3
18
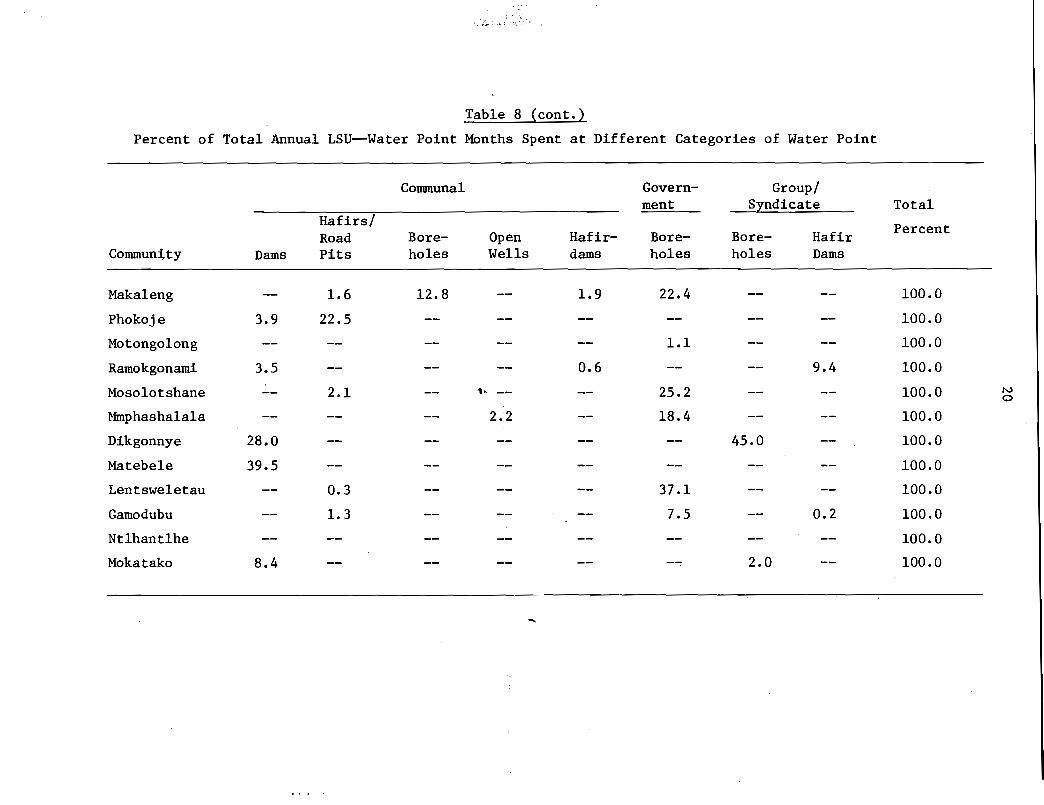
than others. Table 8 shows the distribution of each community's13
cattle over the water points used by Survey respondents for the same
l2-month period shown in Table 7. It. indicates the relative impor~ance
of each category of water point for the particular community. Cattle
usage in Makaleng is the most evenly distributed over the available
water point categories, while Mokatako, with its heavy dependence on the
Molopo River, is the most concentrated, with Ntlhantlhe not far behind.
The wide range in water point availability and usage among the 12 sur-
veyed communities is evident from these two tables.
The tables present the set of cattle watering opportunities, and
how farmers chose to make use of those opportunities. Choice results
from the interaction between farmers' judgments on the relative relia-
bility, cost, and convenience of water supplied from the different cate-
gories of water point and the availability of water from those water~
points·. Farmers' perceptions and water availability are really two sides
of the same coin: the set of water points in a particular community pos-
ess certain attributes, and farmers assess these attributes in terms of
their own needs and resources and choose their water points accordingly.
In the short run they select the water points which they can use to best
meet their needs; in the longer run they may try to change the attributes
of local water points or add new ones in order to better meet their needs.
Tables 9A, 9B, and 9C give some insight into the factors which
influence the farmer's short-run choice. Table 9A contains the frequency
l3Appendix B describes in detail the derivation of communityusage rates and their distribution over time.

Table 8
Percent of Total Annual LSU--Water Point Months Spent at Different Categories of Water Point
Private NaturalOpen Bore- Seep Sand Riv-
Community Wells Holes Wells er Wells Hafirs Rivers Pans Springs•
Maka1eng 1.2 22.6 14.8 22.7
Phokoje 31.4 19.2 0.6 5.8 4.6 10.0 2.0
Motongo1ong 34.9 31.3 3.0 3.3 26.4
Ramokgonami 16.2 3.5 47.2 1.8 0.4 2.9 14.5
Moso1otshane 45.4 4.7 """"f;' 7.0 4.6 2.8 8.2
Mmaphasha1a1a 16.6 55.0 7.8
Dikgonnye 14.4 8.6 1.2 2.8to
Matebe1e 1.7 58.8
Lentswe1etau 11.9 2.7 5.7 13.6 28.7
Gamodubu 24.4 10.4 39.2 2.5 4.7 9.8
Nt1hant1he 0.4 21. 7 1.9 76.0
Mokatako 87.0 2.6
· . '~'~. ;: :"..:
Table 8 (cont.)
Percent of Total Annual LSU--Water Point Months Spent at Different Categories of Water Point
Counnunal Govern- Group/ment Syndicate Total
Hafirs/ PercentRoad Bore- Open Hafir- Bore- Bore- Hafir
Communtty Dams Pits holes Wells dams holes holes Dams
Makaleng 1.6 12.8 1.9 22.4 100.0
Phokoje 3.9 22.5 100.0
Motongolong 1.1 100.0
Ramokgonami 3.5 0.6 9.4 100.0
Mosolotshane 2.1 1· 25.2 100.0 N0
Mmphashalala 2.2 18.4 100.0
Dikgonnye 28.0 45.0 100.0
Matebele 39.5 100.0
Lentsweletau 0.3 37.1 100.0
Gamodubu 1.3 7.5 0.2 100.0
Nt1hant1he 100.0
Mokatako 8.4 2.0 100.0
21
of different types of reasons farmers gave for leaving their current water
point for another one, month by month. Table 9B shows the frequency of
different types of responses farmers gave to explain why they chose a par-
ticular new water point in the following month. The total number of re-
sponses given for leaving a water point in one month does not exactly
equal the total number of responses for using a new water point in the
next month because respondents sometimes left two or three water points
for one water point, or vice versa. Table 9C shows the actual responses
farmers gave, arranged under the categories used in Tables 9A and B.
In Table 9A, reasons for leaving a water point have been categorized
as "push" factors, i.e. those reasons which cause a farmer to leave his
water point, and "pull" factors, where the attraction of another water
point is the dominant consideration. Any cattle movement unrelated to
dissatisfaction with the water.point, e.g., necessary movement to thep
lands for plowing, is shown separately. The last column in the table
gives total responses under each category, seasonally adjusted for the
l2-month period April 1979 to March 1980. Over the year, "push" factors
accounted for 43.5% of the reasons for leaving a water point while "pull"
factors were more important in 38.5% of the shifts to another water point.
Cattle movement was the major consideration in 18.0% of the changes of
water point. Nearly one-third of all changes to another water point were
caused by the current water point going dry.
There are two peak periods of change from water points to other
water points: at the end of the rainy season in March, spreading over in-
to April and Mayas surface catchment water points go progressively dry,
and in September-October, when spring rains begin to fill ephemeral

, , :.,".
Table 9A
Reasons Given for Leaving a Water Point: January 1979-March 1980
Category of Jan Feb Mar Apr May June July Aug Sep Oct Nov Dec Jan Feb Mar 12 mos.Response 1979 1980 Apr 79-
Mar 80
Push Factors:Water point No. 5 11 43 17 26 7 1 2 5 1 1 8 11 6 8 93went dry % 100.0 84.6 87.8 81.0 89.7 58.3 50.0 15.4 12.8 2.6 3.4 14.8 39.3 33.3 72.7 31.6
Push Factors:Other No. 1 1 6 9 8 2 5 2 2 35
% 7.7 3.4 46.2 23.1 21.1 6.9 9.3 7.1 11.1 11. 9
Pull Factors: 1-Lower cost No. 2 1 2 7 11 9 1 2 33 N
% 4.1 4.8 5.1 18.4 37.9 16.7 5.6 18.2 1l.2 N
Pull Factors:Greater No. 3 1 2 1 1 16 15 10 17 4 1 71Convenience % 14.3 3.4 16.7 50.0 7.7 41.0 39.5 34.5 31.5 14.3 5.6 24.1
Pull Factors:Other No. 1 1 3 2 2 1 9
% 7.7 3.4 25.0 15.4 5.1 2.6 3.2
Cattle No. 4 2 5 6 5 15 11 8 1 53Movement % 8.2 15.4 12.8 15.8 17.2 27.8 39.3 44.4 9.1 18.0
Total No. 5 13 49 21 29 12 2 13 39 38 29 54 28 18 11 294% 100.0 100.0 100.0 100.0 100.0 100.0 100.0 100.0 100.0 100.0 100.0 100.0 100.0 100.0 100.0 100.0

Table 9B
Reasons Given for Starting to Use a New Water Point: January 1979-March 1980
Category of Jan Feb Mar Apr May June July Aug Sep Oct Nov Dec Jan Feb Mar 12 mos.Response 1979 1980 Apr 79-
Mar 80
ReliabilityNo. 126 1 5 14 15 25 9 5 8 17 21 13 25 9 4 165% 43.8 16.7 55.6 93.3 88.2 92.6 81.8 71.4 61. 5 27.9 28.4 30.2 49.0 42.9 66.7 47.7
Lower CostNo. 52 3 3 1 1 2 3 7 19 20 13 6 172% 18.1 50.0 33.3 5.9 3.7
1 •. 28.6 23.1 11.5 25.7 46.5 25.5 28.6 20.8
Greater N\..o.l
Convenience No. 73 2 1 2 36 27 9 12 6 1 94% 25.3 33.3 3.7 15.4 59.0 36.5 20.9 23.5 28.6 16.7 27.2
Water PointOwner orconnected toowner or No. 37 1 1 1 2 1 7 1 1 1 15management % 12.8 11.1 6.7 5.9 ·18.2 1.6 9.5 2.3 2.0 16.7 4.3
TotalNo. 288 6 9 15 17 27 11 7 13 61 74 43 51 21 6 346% 100.0 100.0 100.0 100.0 100.0 100.0 100.0 100.0 100.0 100.0 100.0 100.0 100.0 100.0 100.0 100.0

24
Table 9C
*Actual Farmer Responses Categorized in Tables 9A and 9C
Table 9A
Greater • Water point was too far from my village/Conveniencet lands/cattle post.
Water point was too far from grazing.Rain has filled another water point which
is closer to where I want to keep mycattle.
Category
"Push" Factors
"Pull" Factors
Cattle Movement
Went dry:
Other:
Lower cost:
Other:
Response
Water point became dry.
River flooded sand river well:Water point was damaged or broke down.Wanted to avoid disputes about crop
damage.Owner told me to stop using his water
point.Too much work to desilt the water point.Too much work to get water from the well.
Payment for water was too high.Rain has filled another water point and
this is cheaper to use.Too many other cattle were coming there
for water.
My borehole/other water point was repaired.
My water point has filled with enoughwater.
Another water point has cleaner water.
Went to lands for plowing.Left lands after plowing.Return~d to village/cattle post.Cattle are now watering themselves.Wanted cattle closer to my job.
*Responses listed in order of decreasing frequency.

25
Table 9C (cont.)
Actual Farmer Responses Categorized in Tables 9A and B*
Table 9B
Category
Reliability
Lower cost
Greater Convenience
Water Point Owner orconnected to owneror management
Response
Water point has enough water.Nearest reliable water point.Only water point in area which has enough water.Water point is in working order.Water point is used only during the dry season.Previous water point went dry.
Payment for water was not too high/was free.Water point does not require labor to maintain it,
only cash payments.Easy to water your cattle with your own labor.Not many other cattle come there for water.Cattle can water themselves.
Water point is close to village/lands/cattle post/good grazing.
Water point is close to village and has cleanwater.
Own the. water point.Am a member of the borehole syndicate.Water point owner is friend/relative.Hold mafisa cattle from the water point owner.
* Responses listed in order of decreasing frequency.
sources. The relative importance of different types of reasons for leav-
ing water points varies with the season. "Push" factors, particularly
the water point going dry, dominate from January to September, after
which convenience becomes the most important consideration, continuing
thus more or less through December. The "push" factors reassert them-
selves from January onward. The cost of water is the most important
reason only in November, and then only marginally more than convenience.
As the number of water points offering free water increases in the October-
~ ,".
26
December period, farmers can shift their emphasis from merely finding any
water for cattle to using water points closer to their kraal, which may
also be less expensive. They can also lessen their use of wells, which
require a lot of labor to water herds of any size. During this period,
too, farmers begin moving their herds to the lands in anticipation of
plowing. This also requires a change of water points.
Cattle holders leaving one water point must choose a new one.
Table 9B categorizes the ~easons farmers gave for choosing a new water
point under the four headings of reliability, lower cost, greater conven-
ience, and ownership relation. Reliability has two connotations: a water
point that meets the needs of the moment and that offers water security
over the near future. It accounts for 47.7% of the seasonally adjusted
total responses. Greater convenience is next, with 27.2% of the respon-
ses, followed by cost at 20.8%. As in Table 9A, the relative importance
of reasons changes with the season, water supply reliability. being para-
mount through the dry fall and winter months. Convenience is most im-
portant in October and November, and cost considerations were mentioned
more frequently in December. Reliability comes to the fore again in Jan-
uary and succeeding months.
The evidence in Tables 9A through 9C supports the proposition that
cattle holders shift from water points to other water points on the basis
of their assessment of relative reliability, cost, and convenience. Reli-
ability of water supply is the most important consideration. If the re-
sponses classed as "pushll factors in Table 9A are added to those classed
under reliability in Table 9B, they account for 45.6% of all seasonally
adjusted responses. During the spring and early summer months of October-
27
December, the basic water need can easily be met from a large number and
variety of water points. At this time convenience and cost emerge as
considerations. Seasonally adjusted total responses under these two
headings from both tables are 25.7% and l6.0~ respectively.
The next three sections examine reliability, cost, and convenience
in more detail.
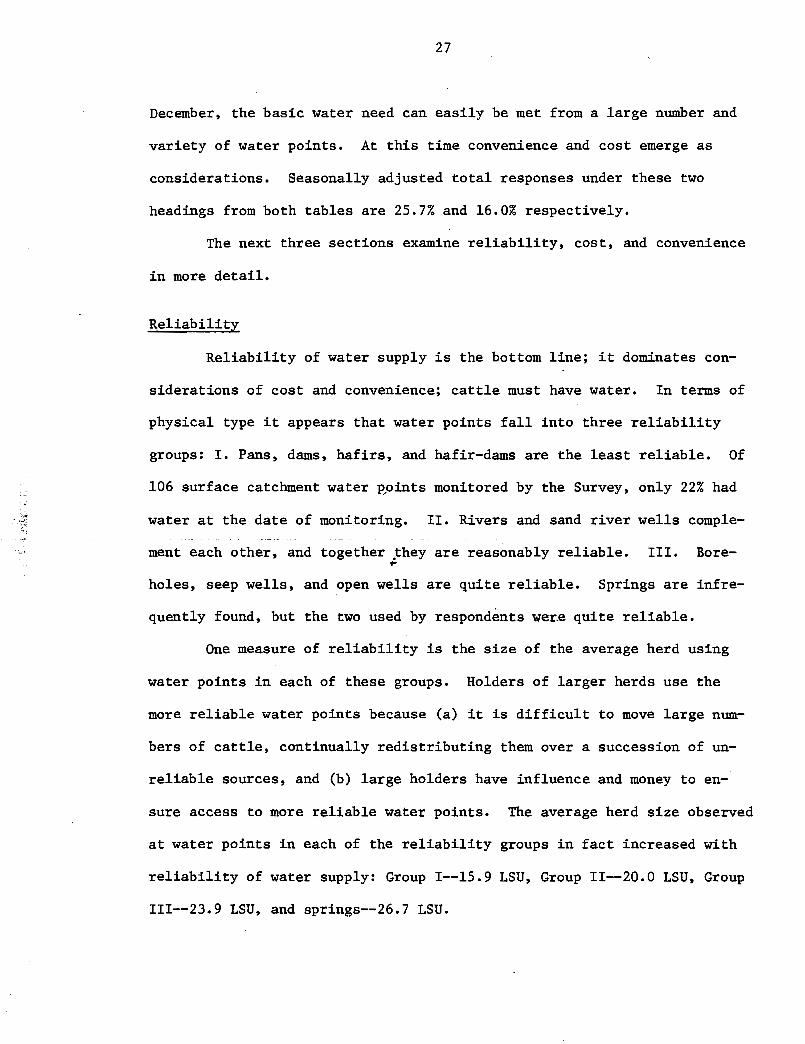
Reliability
Reliability of water supply is the bottom line; it dominates con-
siderations of cost and convenience; cattle must have water. In terms of
physical type it appears that water points fall into three reliability
groups: I. Pans, dams, hafirs, and hafir-dams are the least reliable. Of
106 surface catchment water ~oints monitored by the Survey, only 22% had
water at the date of monitoring. II. Rivers and sand river wells comple-
ment each other, and together they are reasonably reliable. III. Bore-p
holes, seep wells, and open wells are quite reliable. Springs are infre
quently found, but the two used by respondents we~e quite reliable.
One measure of reliability is the size of the average herd using
water points in each of these groups. Holders of larger herds use the
more reliable water points because (a) it is difficult to move large num-
bers of cattle, continually redistributing them over a succession of un-
reliable sources, and (b) large holders have influence and money to en-
sure access to more reliable water points. The average herd size observed
at water points in each of the reliability groups in fact increased with
reliability of water supply: Group 1--15.9 LSU, Group 11--20.0 LSU, Group
111--23.9 LSU, and springs--26.7 LSU.

28
Cost
The cost of water to be discussed here is the cost as seen by
cattle holders. The cost concept used is a broad one. It includes the
farmer's time and effort to get water directly, water payments in cash,
cattle, materials, and other services, and his use of his social position
within family and community. The farmer commits these resources to ob-
tain at least the minimum amount of water his cattle need. Table 10
arranges the 10 physical types of water point in ascending order of re-
quired resource commitment, based on their technical and social charac-
teristics.
~-Springs, pans, and rivers require little effort from the farmer
to water his cattle. Usually the cattle go by themselves and drink as
often and as much as they want. These three types are open to anyone who
cares to use them. .~
--Hafir-dams are essentially dams on flatter terrain with lower
water-holding capacity (see Appendix A). All the dams which respondents
used were built by the government before Independence and are usually not
fenced and therefore are open to all. They almost belong with springs,
pans, and rivers in terms of required resource commitment. Hafir-dams
are of more recent government construction (see PartUI) a~d access is
limited by a group of farmers who maintain a fence. Animals are taken
into the reservoir area in groups to water.
--Sand river wells, hafirs, and seep wells, in addition to cattle
herding and fencing, require the farmer's labor to lift water to where
his animals can reach it. Original construction (for sand river wells, an
annual task) and periodic cleaning and deepening also require resources.

29
These water points are nearly always privately owned, and access is limi-
ted to the owner, his family, and possibly some friends. A few respon-
dents reported paying for water from these sources.
--Open wells differ from the previous group by requiring much more
labor to lift water up within reach of cattle. Their initial construc-
tion is also much more protracted-and costly. Though cleaning and deepen-
ing is less frequently needed, it is quite laborious and risky when it
does get done. Construction also requires formal sanction by various
governmental agencies, whereas the water points in the previous group
require only informal local agreement. Nearly all open wells are pri-
vately owned, and access ~s limited to the owner, his family and friends,
and others who either pay in cash or in kind (labor, cattle).
--Boreholes and open wells equipped with pump and engine demand
the most resources. In addition to herding and fencing they require a"..
pumper and the cash to pay for diesel. oil, repairs, and replacement parts.
Initial drilling and equipping are relatively very expensive, as are
occasional repairs and rehabilitation of the structure. The technology
depends on equipment and energy source, which must come from outside the
community. Construction requires negotiations with a specialized tech-
nician--the driller--as well as approval by government agencies. Bore-
holes and equipped wells are owned by government, by syndicates of farmers,
and by pri~ate persons. Access is limited to those who can pay, either
in cash or in kind (diesel).
As costs increase from water point type to water point type, the
concept of the "group" becomes more important as a means of controlling
access and covering cost. As defined here, a group may consist of a

Table 10
Resources Required for Water Points of Different Physical Types
r - ... Increasing Level aiResonrce Commitment'" -.-. ~ -t + I
WaterPointPhysicalTypes
I.SpringsPansRivers
II.DamsHafir-dams
III.Sand River WellsHafirsSeep Wells
IV.Open Wells
V.BoreholesEquipped Open Wells
Resourcesconnnitted:Labor, cash,cattle,materials,influence
Negligible 1. herding towater
2. thorn bushfencing
1. herding to 1.water
2. thorn bush 2.fencing
3. labor to liftwater a short 3.distance totrough
4. construcution5. cleaning and 4.
deepening 5.
herding to l. herding to water w0
water 2. thorn bush or wiresometimes fencingthorn bush 3. pumper labor orfencing wageslabor to lift 4. diesel, oil, andwater a long partsdistance to 5. drilling andtrough equippingconstruction 6. structural repairscleaning and and rehabilitationdeepening
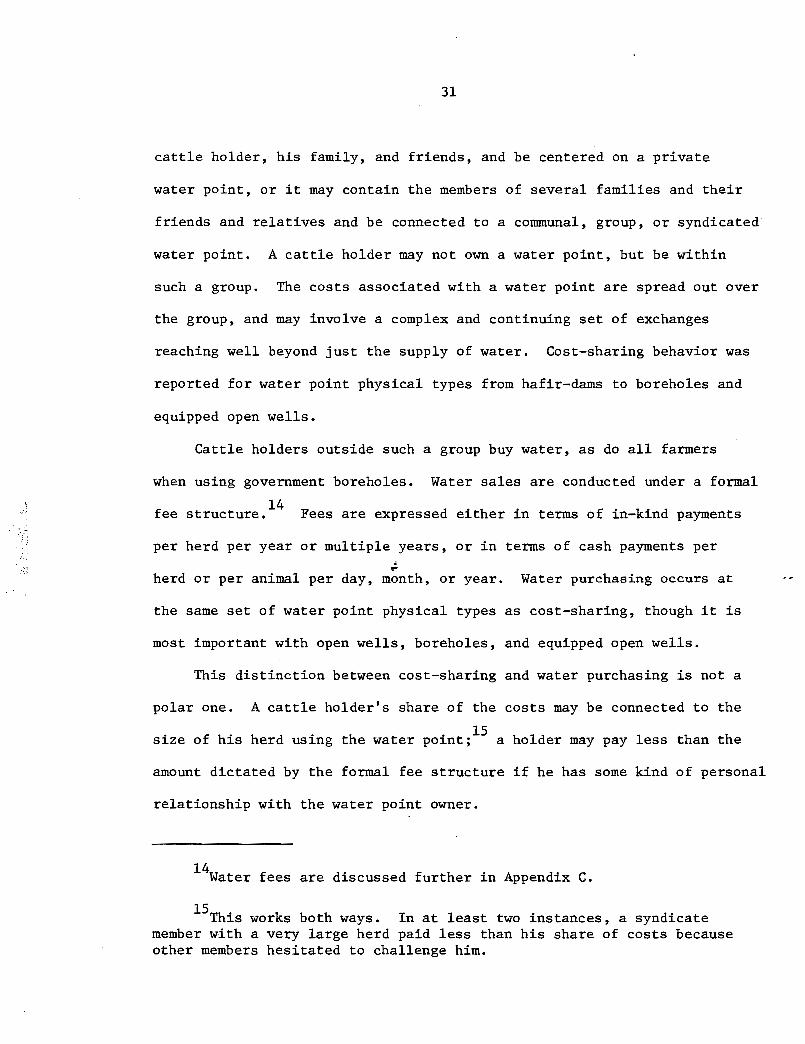
31
cattle holder, his family, and friends, and be centered on a private
water point, or it may contain the members of several families and their
friends and relatives and be connected to a communal, group, or syndicated
water point. A cattle holder may not own a water point, but be within
such a group. The costs associated with a water point are spread out over
the group, and may involve a complex and continuing set of exchanges
reaching well beyond just the supply of water. Cost-sharing behavior was
reported for water point physical types from hafir-dams to boreholes and
equipped open wells.
Cattle holders outside such a group buy water, as do all farmers
when using government boreholes. Water sales are conducted under a formal
14fee structure. Fees are expressed either in terms of in-kind payments
per herd per year or multiple years, or in terms of cash payments per.~
herd or per animal per day, month, or year. Water purchasing occurs at
the same set of water point physical types as cost-sharing, though it is
most important with open wells, boreholes, and equipped open wells.
This distinction between cost-sharing and water purchasing is not a
polar one. A cattle holder's share of the costs may be connected to the
" f h" h d . h . 15 h ld 1 h hS1ze a 1S er us1ng t e water p01nt; a a er may pay ess t an t e
amount dictated by the formal fee structure if he has some kind of personal
relationship with the water point owner.
l4water fees are discussed further in Appendix C.
l5This works both ways. In at least two instances, a syndicatemember with a very large herd paid less than his share of costs becauseother members hesitated to challenge him.

32
It should now be clear why gathering accurate and complete data on
the cost of water to cattle holders is difficult. Three-quarters of the
respondents did not own a water point. They used open access water points,
shared the costs of water points with others, or purchased water. Table
11 shows the cost of water to these "nonowners.,,16 The closer the cost-
sharing relationship, the more difficult it was to pin down exact costs
of cattle watering by non-water point owners. Thus Table 11 picks up all
costs from water sales and some cost-sharing expenditures.
Columns three through six in the table show the number of water
transactions involving cash, cattle, labor, and materials (primarily die-
sel). Cash and cattle are a rough index of the number of transactions"
which involved water selling; labor and materials indicate the amount of
cost-sharing. There was almost no water purchasing in Phokoje, Motongo-.long, or Ntlhantlhe;in these comiunities nearly all respondents were
either related to or friends of water point owners, or owned their own
water points. Nonowners in Matebele and Mokatako used mostly natural
sources, and in the case of the former, purchased water at the one pri-
vate borehole only when there was no other choice. Buying water was most
common in Makaleng, Mosolotshane, and Lentsweletau. Most respondents in
Ramokgonami and Mmaphashalala shared the costs of water, while those in
Dikgonnye and Gamodubu both bought water and participated in cost-sharing
arrangements.
The remainder of Table 11 presents mean expenditures on water per
livestock unit per month. Each respondent's total reported expenditure
l6Costs to water point owners are dealt with in Part III.

Table 11
Cost of Water for Nonowners of Water Points
Number of Number of Transactions Involving: Mean Expenditure per Livestock Unit-Month* (pula)Nonowners/Tota1 Private Private Private Govt. Syndicate Groupnumber of res- Open Seep Bore- Bore- Bore- Hafir-
Community pondents Cash Cattle Labor Materials Wells Wells holes holes holes Dams
Maka1eng 19/19 13 0 0 0 0 M 0.79 0.64** 0#(2) (4) (6)
Phokoje 25/27 3 o. 0 1 0.08 0 0.01(2) (1)
Motongo1ong 12/21 0 0 1 1 •. 0 0.01 0 M(1) (1)
Ramokogonami 15/21 5 0 14 6 0.01 0.04 0.22 0.06 w(1) (8) (2) (3) w
Moso1otshane 16/19 6 3 0 0 0.11 0 0.23(5) (4)
Mmaphasha1a1a 9/16 4 0 0 7 0 0.27 o@(10)
Dikgonnye 22/26 18 3 4 1 0.20 0.77 0.22(6) (6) (10)
Matebe1e 8/8 2 0 0 0 1.07(2)
Lentswe1etau 16/18 17 1 1 0 0.3(3 0.51 0.28(3) (1) (13)
* "M" indicates information is missing. The number in parentheses is the number of paymentson which the mean is based.
** Actually a communal borehole. /I Actually a communal hafir-dam.
@Quar.antine camp borehole at Dibete.

'., .,;- .:.~.,
Table 11 (cont.)
Cost of Water for Nonowners of Water Points
Number of Number of Transactions Involving: Mean Expenditure per Livestock Unit-Month (pula)Nonowners/Total Private Private Private Govt. S¥udicate Groupnumber of res- Open Seep Bore- Bore- Bore- Hafir-
Community pondents Cash Cattle Labor Materials Wells Wells holes holes holes Dams
Gamodubu 18/23 12 0 15 0 0.15 0.14 0.37 0.56 0.08(5) (6) (6) (1) (1)
Ntlhantlhe 1/18 0 0 0 0 0
Mokatako 23/23 2 0 0 1 0.09
All (3)
Communities 184/239 82 7 35 1.,16 0.13 0.09 0.32 0.47 0.32 0.07(23) (14) (28) (23) (19). (4)
w.po.

~ ..,"
35
was divided by the size of his herd in November 1979 times the number of
months he used the water point. Noncash payments were assigned a cash-
equivalent value as follows: Cattle were valued at the average sale
price prevailing in each community in the first quarter of 1980 for the
particular kind of animal. Labor was assigned an opportunity cost equal
17to the government-mandated minimum wage of P 2.10 per day. Diesel was
valued at P 0.50 per liter; other materials were valued at their going
market price. Thus expenditures on water range from P 0.01 to P 1.07 per
LSD-month, with an overall mean of P 0.23. Water points in order of in-
creasing expenditure are: group hafir-dams, private seep wells, private
open wells, private and syndicate boreholes, and government boreholes.
The expenditures computed for Makaleng are unexpectedly high, probably
because of underreporting of herd size. With these values removed, expen-
ditures at private and government boreholes are about the same, and syn-.~
dicate boreholes are somewhat below this.
Several conclusions can be drawn from these data. First, monthly
expenditure on cattle watering in the 12 communities is generally well
under one pula per LSD. Second, respondents in fact paid more for water
from the more resource-demanding types of water point. Third, there are
considerable differences in water expenditure from community to community
in part because of the quite different mix of water point types available
in each place.
Convenience
Convenience is the third factor cattle holders consider when choosing
17One pula (P) U.S.$1.28.
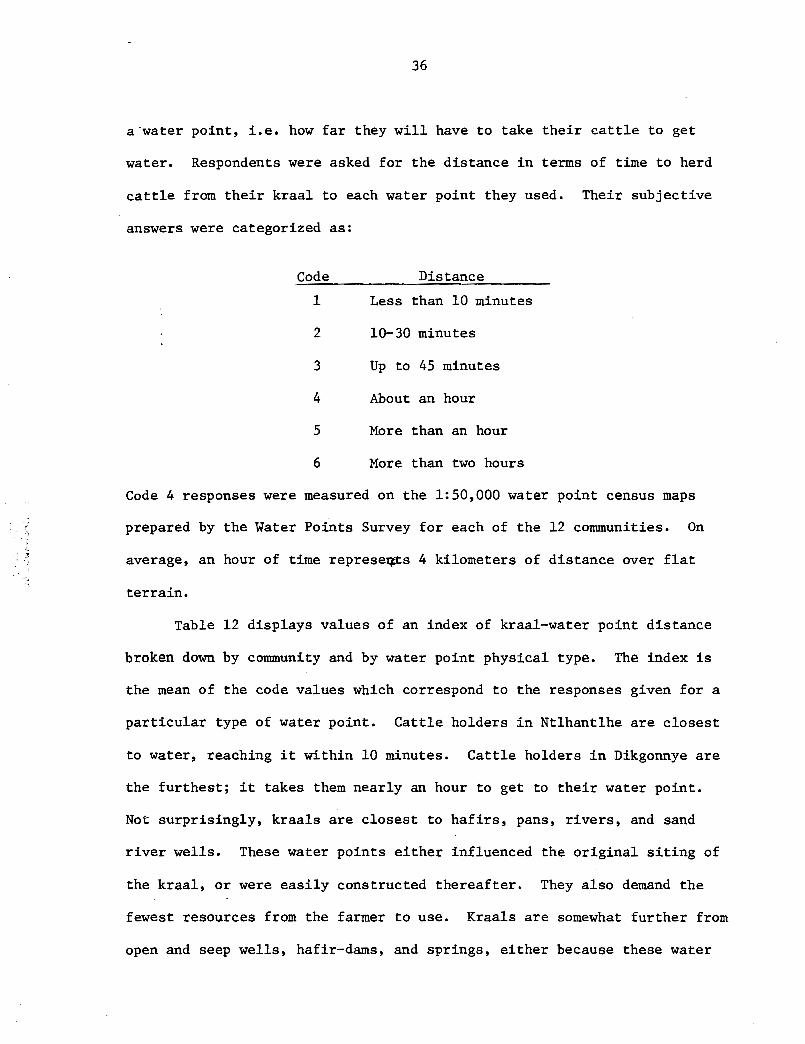
36
a 'water point, Le. how far they will have to take their cattle to get
water. Respondents were asked for the distance in terms of time to herd
cattle from their kraal to each water point they used. Their subjective
answers were categorized as:
Code Distance
1 Less than 10 minutes
2 10-30 minutes
3 Up to 45 minutes
4 About an hour
5 More than an hour
6 More than two hours
Code 4 responses were measured on the 1:50,000 water point census maps
prepared by the Water Points Survey for each of the 12 communities. On
average, an hour of time represe~s 4 kilometers of distance over flat
terrain.
Table 12 displays values of an index of kraal-water point distance
broken down by community and by water point physical type. The index is
the mean of the code values which correspond to the responses given for a
particular type of water point. Cattle holders in Nt1hant1he are closest
to water, reaching it within 10 minutes. Cattle holders in Dikgonnye are
the furthest; it takes them nearly an hour to get to their water point.
Not surprisingly, kraals are closest to hafirs, pans, rivers, and sand
river wells. These water points either influenced the original siting of
the kraal, or were easily constructed thereafter. They also demand the
fewest resources from the farmer to use. Kraals are somewhat further from
open and seep wells, hafir-dams, and springs, either because these water

Table 12
Index of Kraal-Water Point Distances by Physical Type of Water Point
Each Conununity SandNumber Hafir- Bore- Open River Seep
Conununity used Mean Dams Dams Hafirs . Rivers Pans holes Wells Wells Wells Springs
Mak.a1eng 15 3.6 2.7 6.0 3.3 3.2 2.0 4.6 5.0
Phokoje 32 2.9 2.0 2.4 6.0 2.0 1.7 3.9 6.0 3.0 4.0
Motongo1ong 19 2.2 3.5 2.1 2.0 1.7 3.0
Ramokgonami 29 3.0 3.5 3.4 2.0 3.0 2.3 3.7 3.0 1.0 3.6
Mos1otshane 20 3.2 2.6 1 •. 2.5 3.3 2.8 4.2 2.2 \.)oj
--J
Mmaphasha1a1a 23 2.7 3.3 2.7 1.9
Dikgonnye 18 3.8 4.0 1.3 4.8 4.0 3.6
Matebe1e 5 3.1 3.8 2.4 4.0
Lentswe1etau 21 2.7 1.8 2.8 1.9 3.2 3.8
Gamodubu 28 2.4 3.0 2.3 2.2 2.3 2.8 2.0 2.3
Nt1hantlhe 33 1.8 2.0 1.8 1.8 1.0
Mokatako 6 2.5 4.4 2.0 2.8 2.8
EachCategory Mean 2.8 3.9 3.1 2.3 2.4 2.5 3.2 3.1 2.5 3.1 3.1
Number Used 249 6 5 30 28 40 37 46 28 27 2
\

38
points tend to occur in clusters or because there is only a small number
of them in the community. The index values broken down for private, gov
ernment, and syndicate boreholes are 2.9, 3.5, and 3.6 respectively.
The differences in convenience of water indicated in Table 12 are
small, and water is, on the average, quite close to kraals. Most cattle
holders can reach water within 30 to 45 minutes. However, thi~ is still
a far cry from reaching the APRU ideal of a continuous and freely avail
able supply of water for cattle.
PART II. PATTERNS OF WATER POINT USE: JANUARY 1979-MARCH 1980
Part I described the watering strategies of farmers as shown by
movement of herds and use of water points. It particularly focused on
farmer choice of water points seen against the background of the water
supply situation in each communit~ Part II considers the change in the
usage pattern of water point types over time, i.e. the varying importance
of different sources of water from January 1979 to March 1980.
The three sections of Figure 3 show the total number of .water points
in operation, the number of livestock units using them, and the liters of
water these stock demanded per day for the period. Figure 3A indicates
that the number of water points in use diminishes during dry periods and
increases when rains are ample because of the greater availability of sur
face water sources. Fall and winter show the greatest drop, though num
bers were also fewer in the first quarter of 1979, a period of drought,
than in the six months from October 1979 onward, a time of relatively
abundant rainfall.
Figure 3B refers to the total population of cattle which used these

39
water points in the 12 communities. It is important to realize that the
month to month changes in livestock units represent changes in the size
of the aggregate herd using these water points because of entries and
exits into and from each respondent's herd from births, deaths, sales,
and so forth. The drop in the plotted line does not represent animals
shifting to water points other than those included in Figure 3A. The
steep rise in livestock units following December 1979 however does re
flect calves born in the first quarter of 1979 which entered the heifer
tolly class one year later, and thus got counted in the LSU calculation.
Figure 3C shows the trend in daily water demand by livestock units
in Figure 3B at water points included in Figure 3A. Daily water demand
is here a function of number of livestock units present, mean temperature,
and herd composition community by community for the given month. Broadly
speaking, daily water demand is lowest during the winter months whentem.".
peratures are lowest and there ~e few milch cows in the herds. Comsump
tion rises with the onset of warmer weather and the beginning of the
calving period. Adequate cattle watering is most difficult during the
winter season when the available water points are the fewest and the
water content of the available grasses is the lowest. On the other hand,
at the aggregate level, herd numbers are also fewer and water needs per
animal are least. However, to the individual cattle holder these things
are probably not very evident; he still has to find water for his herd.
Figure 4 displays the seasonal variation in distance between respon
dents' kraals and the water points they were using. The index of distance
is the same as that explained in Part I, 'Le., an index value of 4.0
represents a distance of an hour, or roughly 4 kilometers. Predictably,

and
KEY
-- -- -5--
Village
lands
Cattle Post
, ed lands5 - MIX
Cattle Post
22---
fiGURE 4 TO WATERIN DISTANCEVARIATIONSEASONAL
2- 2
/2 22
_·3...... ~ .-3_. __ . '~-3'-'-'.......... .- ~---,3-·_·3 .'3--.'- ~,
2 /____I,
2
____I,
- -5--'--\-5- ./5- - \
// \/
/ \' ,
/ \I \
/ \' \! \
I \/.", \
5",-I "/
5 _
All areas-........//
...5---5,/...
5 ....
2.6
2.5
2.4
2.3
2.8
3.4
3.5
3.6
3.7
2.279 Mar 79Feb Apr 79 May 79 Jun 79 Jul 79 L..-_--=- : '7Q Nov 79Oct 79-.- "S'eorp 79Aug 79
MontI)
Dec 79 Jan 80 b 80 Mar 80Fe

Number ofWoter Points
in Use
120
FIGURE 5
NUMBER OF '¥YATER POINTS IN OPERATION. BY MANAGEMENT TYPE
January 1979 - March 1980
KEY
- district councilorcentral government
2 - private
3 - group or syndicate
4 - communal
5 - natural
110
100
90
80
70
60
50
__2--_2---':~
/' '~2/2 2~
2 2~2--- ~2_--2~2 2
__5'----/5 5__55
o
Jon 79 Feb 79 Mar 79 Apr 79 May 79 Jun 79 Jul 79 Aug 79
Month
Sep 79 Oct 79 Nov 79 Dec 79 Jan 80 Feb 80 Mar 80

40
the distance to water increases with the beginning of the dry season in
April and falls with the beginning of the rains in September-October.
This pattern holds for cattle kept in villages and lands and most markedly
for cattle kept in mixed lands and cattle post areas. The pattern is some-
what the reverse for stock at cattle posts, probably because cattle returnJ
from more distant pans to boreholes nearer the cattle post kraals during
the dry season. The short distance to water for lands area cattle during
November-January is-surprising since adequate water at the lands is con-
sidered to be a chronic problem. Figure 4 reaffirms that the lands water
problem is at the beginning and end of the plowing season and suggests
that the real arable water shortage is in the mixed lands and cattle post
areas.
The meaning of Figures 3 and 4 can be summed up simply: In the dry
season in the eastern communal area the number of operating water points,,
p
the number of cattle, and the amount of water demanded fall; average
distance to water increases. Subsequent figures break down the three
graphs of Figure 3 by water point management and physical types and by
management-physical type categories.
Number of Water Points Used
Figure 5 considers water point usage in terms of number of operating
water points in each of the five management types. Here again seasonal
patterns are evident, with a shift from natural sources to privately
owned and managed water points beginning in March 1979 and a shift back
again beginning in September. Government and group or syndicate water
points do not show much seasonal shift. Use of communal water points, how-
ever, increased somewhat beginning in October. Overall, the importance
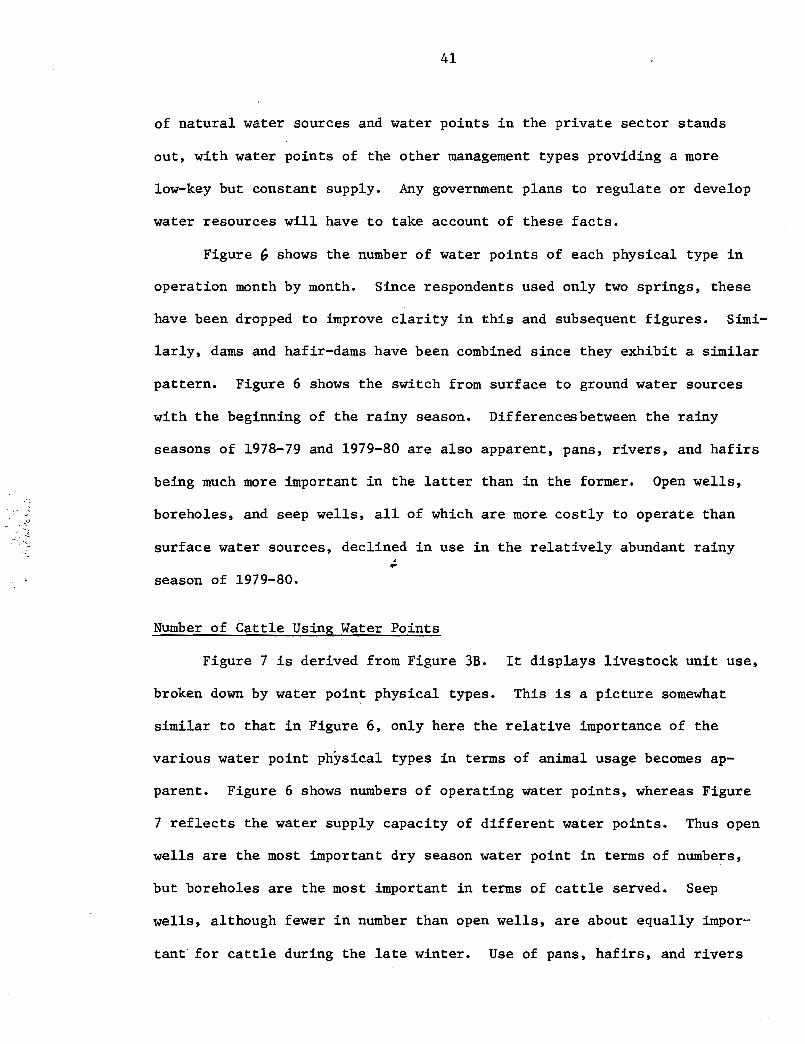
41
of natural water sources and water points in the private sector stands
out, with water points of the other management types providing a more
low-key but constant supply. Any government plans to regulate or develop
water resources will have to take account of these facts.
Figure Gshows the number of water points of each physical type in
operation month by month. Since respondents used only two springs, these
have been dropped to improve clarity in this and subsequent figures. Simi-
larly, dams and hafir-dams have been combined since they exhibit a similar
pattern. Figure 6 shows the switch from surface to ground water sources
with the beginning of the rainy season. Differencesbetween the rainy
seasons of 1978-79 and 1979-80 are also apparent, pans, rivers, and hafirs
being much more important in the latter than in the former. Open wells,
boreholes, and seep wells, all of which are more costly to operate than
surface water sources, declined in use in the relatively abundant rainy
season of 1979-80.
Number of Cattle Using Water Points
Figure 7 is derived from Figure 3B. It displays livestock unit use,
broken down by water point physical types. This is a picture somewhat
similar to that in Figure 6. only here the relative importance of the
various water point physical types in terms of animal usage becomes ap-
parent. Figure 6 shows numbers of operating water points, whereas Figure
7 reflects the water supply capacity of different water points. Thus open
wells are the most important dry season water point in terms of numbers,
but boreholes are the most important in terms of cattle served. Seep
wells, although fewer in number than open wells, are about equally impor-
tant for cattle during the late winter. Use of pans, hafirs, and rivers

KEY
2 - dam. hafir· dam.3 - hafi ..4 - rivers5 - pans6 - boreholes7 - open wells8 - sand river wells
9 - seep wells
5
8"", /1 1~8 8"" / ~8 1--- I
I 8 8
FIGURE 6NUMBER OF WATER POINTS IN OPERATION, BY PHYSICAL TYPE
January 1979 - March 1980
___ 6 6---6---6--- 6 6
6 6---6
444342414039383736353433323130292827
~~ ~5 5
~~ /8 8 9---9
~r ~;~9 9><819 9
18 /171615 4 4---14 ·9 9--- 413 3__
3----4
12 ---3
1~ ~5 ~ 4
~ 8 8 8 ~~3 ~ 4/
~ I----5~1 ; Il~l4 1 3
3 3 -3 32Io 5 5 5 5
Number ofWater Points
in Use
Jan 79 Feb 79 Mar 79 Apr 79 May 79 Jun 79 Jul 79I
Aug 79 Sep 79
Month
Oct 79 Nov 79 Dec 79 Jan 80. Feb 80 Mar 80

FIGURE 7NUMBER OF CATTLE (Lsul PRESENT AT WATER POINTS, BY PHYSICAL TYPE
January 1979 - March 1980
KEY
2 - dam hafir - dam$
3 - hafi'$4 - river$5 - pan$
6 - barehole$
7 - open well$
8 - $and river well$
9 - $eep well$
8__88----_---8----
___3---3
___3---3
6_--6
6 6 _ 6 ___
6~6
4--4~ /7.--7___
4__4~ ,~:-':,>:
/'7 7 7
7 7----
9---9---9 9 4 4/
5
~8 8~2 8 8
7 2--- 2 - 2_2
3~2__ 2 22.--.><:8 8 8--r-8
8 3-3~ 5
3 3~~ ~_......_
1000
o
500
1500
6000
2500
2000
5500
4000
3000
5000
3500
4500
Jan 79 Feb 79 Mar 79 Apr 79 May 79 Jun 79 Jul 79 Aug 79 Sep 79 Oct 79 Nov 79 Dec 79 Jan 80 Feb 80 Mar 80
Month

FIGURE 8NUMBER OF CATTLE (LSU) PRESENT AT WATER POINTS, BY MANAGEMENT PHYSICAL TYPES CATEGORIES
January 1979 - March 198
4500
---A
8-~
c-· -c_.-f,.- .-c.........
PrivateSeep Wells..,...K
____8
8---8---8
c-·-c/'
,,/C S S
Government A ~ ABoreholes ~S~A B...-I_.~ •• _1- .. _1_.. 8~8 B .
1-' ._1_•. -1-. --1--. -1-" -1- -' ..................1/_.5
J- .•. -J-. '.-J- •••-J_.. • •• _J_..._ -1_. . .._1-' '-1Syndicate :j '-J- ... -J- ... -J- ... -J- J -1-~~/ ,
'. 5Communal XDams /" 'J .........
S S S~S /K- - K- -K---K--K_.r~...... . .. -J
. / 5 5 '/ '" J_"'_J_"._J_K-- -K-- -K---K/ ---3--- ---5---5 " _K- -K_Group Jt' K- ~K- -KHafir - Dams~
Private ,,/8orehole --... /'._.C-·-C
c-
o
500
1000
1500
2000
2500
4000
3500
3000
Jan 79 Feb 79 Mar 79' Apr 79 May 79 Jun 79 Jul 79 Aug 79 . Sep 79 Oct 79 Nov 79 Dec 79 Jan 80 Feb 80 Mar 80
Month
/'",
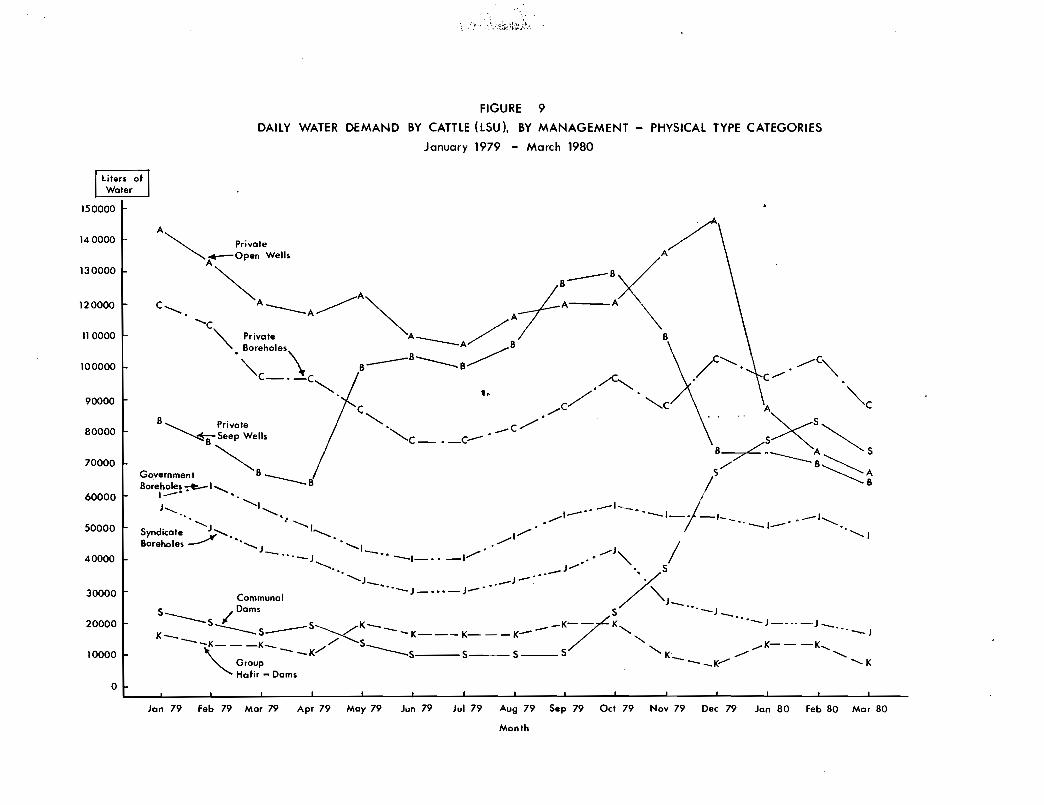
FIGURE 9
DAILY WATER DEMAND BY CATTLE (LSul, BY MANAGEMENT - PHYSICAL TYPE CATEGORIES
January 1979 - March 1980
150000
.,.
A"", Private /
""'-~" W.". A ' __'XA
C'- A__~~ JA A \
......C'" Private A A__ /Aj 8
• Boreholes\ 8 A ............. 8'" B-- ----B~C-. -C""". ,/C",
,~"" C/,
,C/ A "'-CC, ' ~.B~private '"", ._C/ . .. ~S~
B~ Wells C - ,_C- B~~ A ""'- 5
""'B ~/ ----B~AG~~m~t /' ~BBoreholes~ I...... ----B
1_' "',
J......... 'I _1-_ I'.............. ........1-·· . '-1-. _1__ ._,................. ,'.......... " -. _1_' "",Syndicate J>-.. '........... ..........1.......... ..........,
Boreholes~ •• ........ J ........ I •• ' _J, /-"'-J -., -1-" -I.......... ,
..................... J _J_:,.-J/ '/5Communal --"-J-.,.-J-'" / "-J
5 Dams 5 -"'-J----5 I' 5 K_ .--K7K -"'-J-.._-J_.K_ ----5--~ --K---K---K-.............. "-)--K---K_ // 5____ ....... ........K---K....
'\-......
--K 5 5---5--_5 K........ ,Group --_V ......... KHafir - Dams
10000
90000
o
30000
20000
80000
60000
70000
40000
50000
11 0000
100000
130000
140000
120000
Jan 79 Feb 79 Mar 79 Apr 79 May 79 Jun 79 Jul 79 Aug 79 5ep 79 Oct 79 Nov 79 Dec 79 Jan 80 Feb 80 Mar 80
Month
42
drops off sharply beginning in May, the last matched by an increase in the
use of sand river wells. Dams and hafir-dams continued to provide water
to some herds throughout the winter, although this observation is based
on only a small number of such structures.
Figure 8 decomposes Figure 7 one step further to show cattle by
eight important management-physical type categories. Natural sources and
other categories with only a small number of examples have been left out.
Private open wells, seep wells, and boreholes are the most important for
cattle and exhibit the most marked seasonal fluctuation. Borehole usage
under all three types of management falls off with the beginning of the
rainy season in October, with syndicate usage dropping the most. The few
group hafir-dams in the Survey appear to have had water during the winter
of 1979, and may have served as alternat~ve water points for farmers in
their areas when other surface sources went dry. Communal dams on the
"~other hand did not yield much water during the winter, but became very
popular as an open-access water source when they filled in the 1979-80
rains.
Quantity of Water Demanded by Cattle
Figure 9 is the last of this series. It presents the time use pat-
tern of water points in the eight management-physical type categories of
Figure 8, but this time in terms of daily water requirements of cattle.
The purpose is to show the amount of water that livestock present at a
water point in a particular category would have drunk if they could have/
//
had as much as they wished. Of course there is no guarantee that the
water point actually supplied this amount. Communal dams probably come
closest to meeting unfettered cattle demand, since they are usually

43
unfenced and unsupervised. Private open wells, however, probably fall
shortest of meeting demand because of the considerable labor required to
lift water and the shift-by-shift watering of cattle from a small trough.
The degree to which actual supply from different categories of water
points fell short of demand is a matter of judgment. The importance of
the calculations behind Figure 9 though is that they provide an estimate
of water point supply capacities. This information will be extremely
useful in Part III for deriving the unit cost of water from different
types of water points.
Water Point Use Over Time: A Summary View
Survey results presented thus far have concerned the type of area
used for cattle-keeping, movement of herds, and patterns of water point
use, with frequent references to the 12 communities which provided the.p
data. Table 13 displays a summary of some of this information, arranged
by water point types and categories. The listing is in descending order
of importance in terms of total use by cattle of water points of each
type or category over the year. On this criterion private open wells,
rivers, private seep wells, and private boreholes were the most important
water points used for cattle in the 12 communities. Pans, government
boreholes, sand river wells, communal dams, and syndicate boreholes were
of medium importance. Group hafir-dams, communal hafirs, springs, and
private hafirs were of least importance.
The second column of Table 13 shows the average size of a herd
using water points of different types and categories. Government owned
and managed water points (boreholes) attracted cattle holders with the
largest herds; communally managed water points served the smallest herds.

44
Table 13
Summary.of Water Point Use Statistics: April 1979-March 1980
Averagesize of Rank
Number herd at 12-month inof Water Total TotalWater Point Usage Usage
Water Point Types Points (LSU) (LSU-months) (%)
Management Types:
Privately oWned &managed 139 25.1 117,406 1 (51.5)
Natural Sources 70 18.7 60,114 2 (26.4)
Communally managed 22 11.3 18,041 3 (7.9)
Govt. owned &managed 8 27.2 16,932 4 (7.4)
Group/Syn. owned/managed 10 23.8 15,534 5 (6.8)
Physical Types:
Boreholes 37 32.8 59,538 1 (26.1)
Open wells 46 20.2 38,917 2 (17.1)
Rivers 28 16.4 38,150 3 (16.7)
Seep wells 27 . 18.8 32,928 4 (14.4)~
Pans 40 21. 2 18,334 5 (8.0)
Sand river wells 28 23.5 13,085 6 (5.7)
Dams 6 17.5 10,947 7 (4.8)
Ha~irs 30 11.3 6,866 8 (3.0)
Hafir-dams 5 13.7 5,632 9 (2.5)
Springs 2 26.8 3,630 10 (1.6)

45
Table 13 (cont.)
Summary of Water Point Use Statistics: April 1979-March 1980
Number of Months Daily Water EstimatedHerds Used Demand bY3 AnnualWater Point Cattle (ni) Supply from
Water 3Water Point Types Mean S.Deviation Mean S.Deviation Point (m )
Management Types:
Privately owned &managed 7.2 3.7 3.87 0.52 848
Natural Sources 5.7 3.4 6.27 0.90 1,091
Communally Managed 5.3 2.3 4.21 1.53 674
Govt. owned &managed 8.8 2.7 7.15 0.86 1,909
Group/Syn. owned/managed 7.3 4.4 7.26 1.77 1,605
Physical Types:
Boreholes 7.7 3.9 6.17 0.38 1,444,. ~
~.i Open wells 8.9 2.8 2.97 0.63 805"
~ Rivers 6.3 3.6 7.88 1.44 1,505.Seep wells 7.8 3.5" 4.95* 0.50 1,173*
Pans 4.1 1.8 3.80 1.40 471
Sand River Wells 4.9 3.0 4.18 3.89 623
Dams 4.7 1.6 9.86 7.25 1,410
Hafirs 4.7 2.2 1.50 0.81 215
Hafir-dams 5.9 4.0 7.02 2.66 . 1,257
Springs 9.2 3.9 8.73 3.86 2,447
*Provisional value.
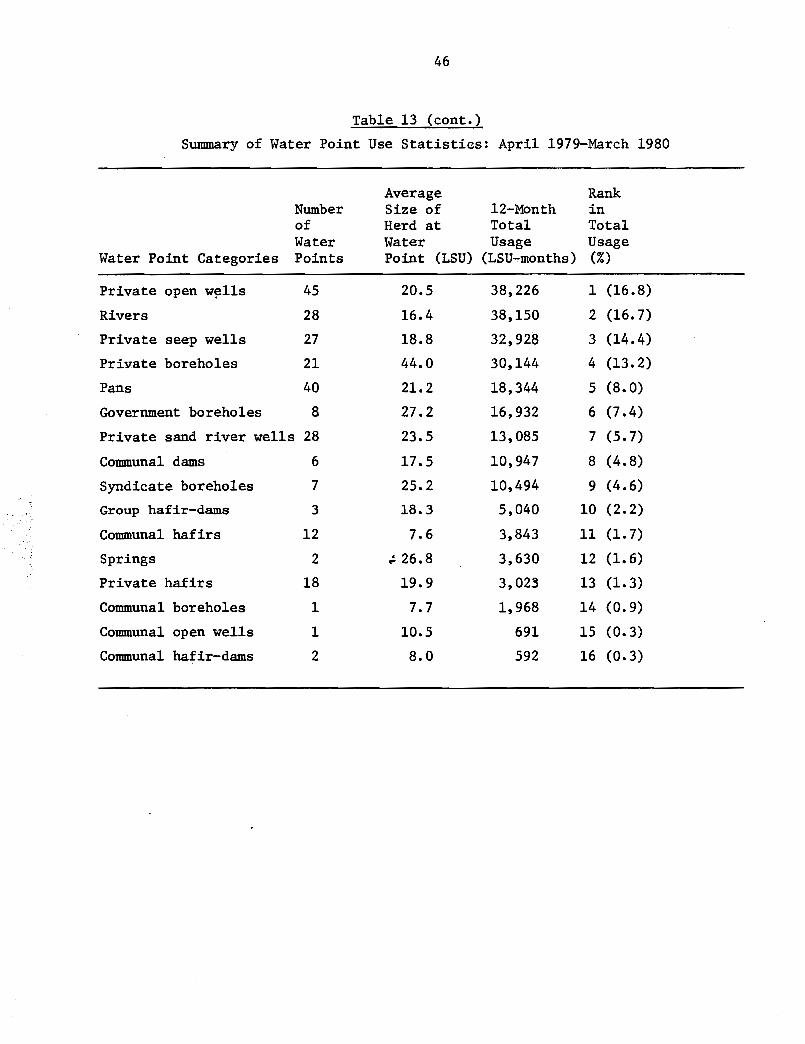
46
Table 13 (cont.)
Summary of Water Point Use Statistics: April 1979-March 1980
Average RankNumber Size of 12-Month inof Herd at Total TotalWater Water Usage Usage
Water Point Categories Points Point (LSU) (LSU-,.months) (%)
Private open w~lls 45 20.5 38,226 1 (16.8)
Rivers 28 16.4 38,150 2 (16.7)
Private seep wells 27 18.8 32,928 3 (14.4)
Private boreholes 21 44.0 30,144 4 (13.2)
Pans 40 21.2 18,344 5 (8.0)
Government boreholes 8 27.2 16,932 6 (7.4)
Private sand river wells 28 23.5 13,085 7 (5.7)
Communal dams 6 17.5 10,947 8 (4.8)
Syndicate boreholes 7 25.2 10,494 9 (4.6)
Group hafir-dams 3 18.3 5,040 10 (2.2)
Communal hafirs 12 7.6 3,843 11 (1. 7).. Springs 2 :. 26.8 3,630 12 (1. 6)
Private hafirs 18 19.9 3,023 13 (1.3)
Communal boreholes 1 7.7 1,968 14 (0.9)
Communal open wells 1 10.5 691 15 (0.3)
Communal hafir-dams 2 8.0 592 16 (0.3)

47
Table 13 (cont.)
Summary of Water Point Use Statistics: April 1979-March 1980
Number of Months Daily Water EstimatedHerds used Demand bY3 AnnualWater Point Cattle (m ) Supply from
Wa§er PointWater Point Categories Mean S. Deviation Mean S. Deviation (m )
Private 9pen wells 8.8 2.8 2.97 0.63 793
Rivers 6.3 3.6 7.88 1.44 1,513
Private seep wells 7.8 3.5 4.95* 0.50 1,173*
Private boreholes 7.0 4.3 5.66 0.94 1,189,
Pans 4.1 1.8 3.80 1.40 471
Government boreholes 8.8 2.7 7.15 0.86 1,909
Private sand river wells 4.9 3.0 4.18 3.89 623
Communal dams 4.7 1.6 9.86 7.25 1,410
Syndicate boreholes 7.5 4.5 6.63 0.97 1,505
Group hafir-dams 6.6 4.8 11.98 5.60 2,396
Communal hafirs 5.2 1.9. 1.53 1.27 240p
Springs 9.2 3.9 8.74 3.86 2,447
Private hafirs 3.8 2.5 1.35 0.56 155
Communal boreholes 8.8 2.2 5.52 2.72 1,474
Communal open wells 12.0 0 1.91 0.61 23
Communal hafir-dams 5.0 3.4 1.45 0.75 218
*Provisional value.
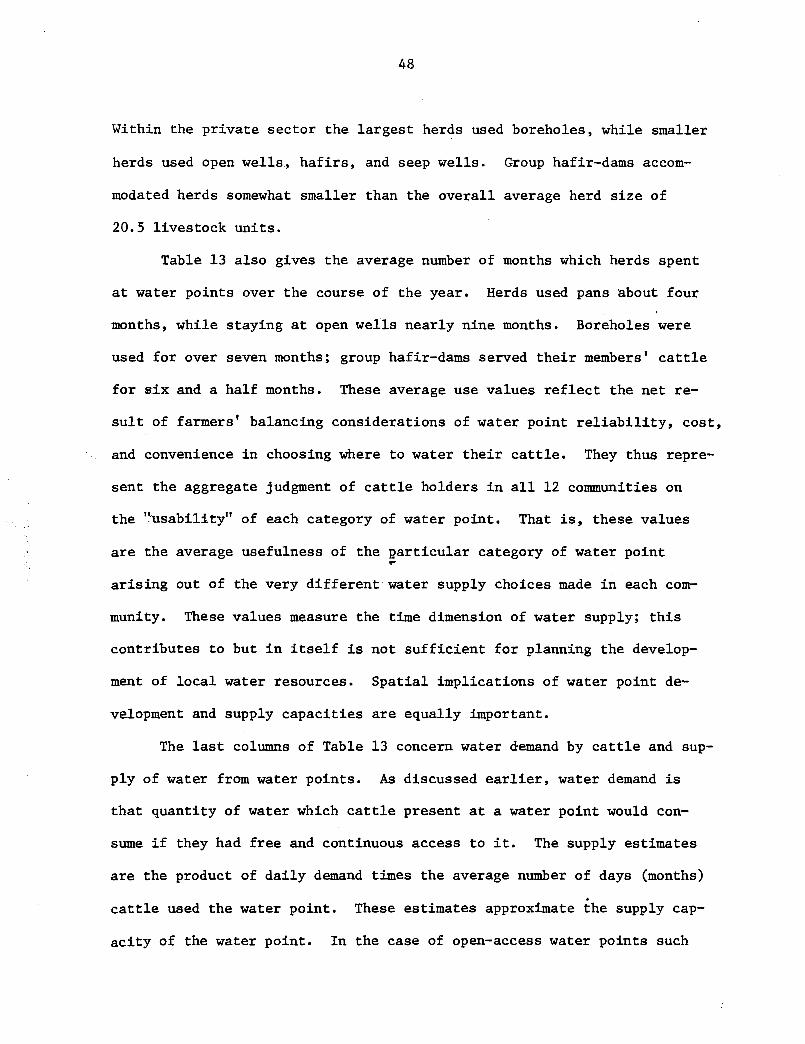
48
Within the private sector the largest herds used boreholes, while smaller
herds used open wells, hafirs, and seep wells. Group hafir-dams accom-
modated herds somewhat smaller than the overall average herd size of
20.5 livestock units.
Table 13 also gives the average number of months which herds spent
at water points over the course of the year. Herds used pans about four
months, while staying at open wells nearly nine months. Boreholes were
used for over seven months; group hafir-dams served their members' cattle
for s:ix and a half months. These average use values reflect the net re-
su1t of farmers' balancing considerations of water point reliability, cost,
and convenience in choosing where to water their cattle. They thus repre-
sent the aggregate judgment of cattle holders in all 12 communities on
the "'usability" of each category of water point. That is, these values
are the average usefulness of the narticular category of water point~
arising out of the very different water supply choices made in each com-
munity. These values measure the time dimension of water supply; this
contributes to but in itself is not sufficient for planning the develop-
ment of local water resources. Spatial implications of water point de-
ve10pment and supply capacities are equally important.
The last columns of Table 13 concern water demand by cattle and sup-
ply of water from water points. As discussed earlier, water demand is
that quantity of water which cattle present at a water point would con-
sume if they had free and continuous access to it. The supply estimates
are the product of daily demand times the average number of days (months).
cattle used the water point. These estimates approximate the supply cap-
acity of the water point. In the case of open-access water points such

J
49
as dams they may be underestimates, i.e., there were not enough cattle
present to drink all the water available. In the case of most water
points, though, these estimates will be high to the degree that the water
needs of cattle present were not satisfied. However, it is felt that the
estimates are sufficiently accurate to allow calculation of relative unit
costs of water for different water point types.
PART III. COSTS OF WATER POINT CONSTRUCTION, OPERATION, AND MAINTENANCE
Earlier sections of this paper have focused on cattle watering stra-
tegies and the operation of water points, particularly from the viewpoint
of nonowners. Part III presents information on the cost of constructing
water points and the cost to their owners or managers of operating them
thereafter. Table 14 displays the agencies, groups, and persons who may
play a role in the construction~ operation, and maintenance and revenue
collection at different physical types of water point. The following dis-
cussion deals with dams, boreholes, and open wells in turn.
Dams and Hafir-Dams: Construction
The Ministry of Agriculture's Small Dam Unit: There is a long his-
tory of small dam construction in Botswana: dams built by tribal authori-
ties starting in the early years of the century, dams built by the rail-
road, dams constructed by the Protectorate Government, and dams er.ected
under the Food for Work Program. After Independence, the Ministry of
Agriculture took up responsibility for further dam building through its
Soil Conservation and Dam Building Unit (SC&DBU). Between 1967 and 1970
the Unit constructed 10 dams in the Moshupa catchment and 12 dams in the

· , .... !".
Table 14
Man-Made Water Points: in Eastern Communal Area*
Water PointPhysical Type
Dams and HafirDams
Construction
1. MoA Small Dam Unit (SDU)2. Serowe Brigades Dam
Building Unit (with SDUoversight)
3. Private contractor (withSDU funds and oversight)
Operation and;Maintenance
Farmers' groupsFarmers' groups
Farmers' groups
Revenue Collection(if any)
Farmers' groupsFarmers' groups
Farmers' groups
Boreholes 1. Water Affairs 1. Water Affairs District CouncilVI
District Council District Council 0
Borehole Repair Service2. Large private con- Priv.ate person Private person
tractors Syndicate SyndicateBorehole Repair Service
3. Small private drillers Private person Private personSyndicate SyndicateBorehole Repair Service
Open Wells, SandRiver Wells,Seep Wells,and Hafirs
1. Private person Private personCommunal
Private personNone
* Excluding water points maintained by agencies of the central government other than theDepartment of Water Affairs. ~

51
Bokaa area t as well as a few in Tutume.
In 1974 the ~eorganized SC&DBU began operations again under a new
name t the present Small Dam Unit (SDU) of the Division of Land Utiliza-
tion. Since 1974 the SDU has constructed or commissioned the construc-
tion of 99 dams in the eastern communal area. Table 15 shows their dis-
tribution.
Table 15
Location of SDU-Built Dams
. ,;;
Dam Location
Northeast District
Central DistrictSerowe areaTswapong area
Southern part of Kgatleng District
Number
8
2120
9
Eastern part of Kweneng District 20.Southeast District P 10
Eastern part of Southern District 11
Total 99
Mr. H. Mettrick t Chief Agricultural Economist t carried out the
last cost analysis of the Ministry's dam-building efforts which he pre-
sented in a paper t "Small Dam Construction Pricing Policy" (December
1970). His approach was to "work out on the basis of past experience
the total cost for a notional 'a,rerage' dam. The annual cost of
operating the dam building unit is calculated and compared with the num-
ber of dams built in a typical year to arrive at the cost per dam." He

52
18characterized costs as follows (figures in Rand ):
Annual depreciation on capital assetsAnnual running costsInterest repayment at 8%
56,663130,920
26,528R 214,111
From his population of 22 dams, Mettrick excluded three: the very
large Moshupa village water supply dam with a storage capacity of 609,600
3 3 . 3m , and two very small dams (28,000 m and 6,400 m). Of the remaining
19, storage capacity averaged 65,480 m3, ranging between 30,800 m3 and
3288,000 m. By contrast, the average capacity of the 19 SDU dams for which
3 3 3data are available is 14,442 m , with a range of 4,218 m to 48,388 m •
The typical LUPu19 dam had four and a half times the storage capacity of
'a SDU dam. According to Mettrick's calculations, the average construction
cost for the 19 LUPU dams was R 8,223. This is equivalent to P 28,150 in
today's money.
The present cost analysis ~eals with the fiscal year running from
April 1, 1979, to March 31, 1980. It compares the number of dams com-
pleted during this period, the storage capacity created, and the volume
of earth moved to the costs directly incurred by the Small Dam Unit. Cost
per dam permits' comparison with the LUPU dams. Cost per cubic meter of
, storage· capacity and cost per cubic meter of earth moved will be compared
with similar costs to the Serowe Brigades Dam Building Unit and a private
contractor.
According to staff of the Small Dam Unit, these structures were com-
181 Rand = U. s. $1. 23.
19LUPU (Land Utilization Planning Unit) is the acronym commonly usedfor SC&DBU dams.

"\,
53
pleted or nearly completed during the fiscal year:
Table 16
SDU Dams Completed in 1979-1980
FullStorage Earth Moved
Number Name Completed (1,000 (m3). liters)
CE/18 Botepetepe October 1979 10,000 7,000C/PA/17 Sesulela July 1979 6,438 3,438C/PA/18 Mmamahututu September 1979 4,888 4,888C/PA/19 Ratholo January 1980 4,218 4,218KW/19 Dikhutlane August 1979 N.A. N.A.1&/20 Sefatlhane East February 1980 N.A. N.A.SO/ll Taupane February 1980 48,388 6,756SE/9 Tleberwane April 1979 N.A. N.A.
SE/10 Disaneng 75% complete* N.A. N.A.SO/lO Lokgoba 75% complete 14,495 9,023C/PA/20 Makaipaa 75% complete N.A. N.A•
...*At the end of the budget year.
N.A. = Not Available.
All but one of the eight completed dams were finished in the middle of
or toward the end of the year. That is, the work was substantially
accomplished within the limits of the fiscal year. The three nearly
completed dams have been included in the year's total, with weights of
three-quarters each. By this reckoning, the SDU completed 10.25 dams
during the fiscal year.
After examining various full storage averages of the available
data (with and without outliers, this year versus all previous years),
it was decided to use the average of all 19 dams for which information

54
was available to fill in the full storage missing values for Table 16.
Similarly, earth moved data from 10 dams were averaged to fill in that
missing value in the table. These averages are 14,442 m3 and 6,117 m3
respectively. With these interpolations, and the weighting of the three
dams mentioned earlier, the SDU in fiscal year 1979-80 created approxi
mately 148,000 m3 of storage capacity by shifting 63,000 m3 of earth.
Table 17 shows what this work cost. A detailed explanation of the
cost calculations is given in Appendix D.
Table 17
Costs of Running the Small Dam Unit--Fiscal Year 1979
Item Pula
2. Pensions, at 15% of above salaries
3. Wages for approximately 75 working-yearsof Industrial Class Staff
4. Heavy equipment: Interest and DepreciationFuel and Maintenance
1. Salaries and subsistence payments for10 working-years of permanent & pensionable staff 39,602
4,867
93,204
47,536142,947190,483 190,483
6201,6162,236 2,236
2,739
4,662
3,131
397
DepreciationInterest
6. Machinery and vehicle running costs
7. Traveling and transport
8. Maintenance of buildings and equipment;static plant
9. Clothing and uniforms
5. Other Plantand equipment

10. Water development equipment(watering troughs)
11. Fencing materials
55
8,425
8,418P 358,164
In addition to building eight dams, and nearly completing three more,
the Small Dam Unit repaired six other dams in FY 1979-80. This work is
treated as the equivalent of constructing two more dams. Thus for pur-
poses of the cost calculation, the SDU did work amounting to the construc-
tion of 12.25 dams. This leads to a cost of P. 29,238 per dam, P. 2.02
per cubic meter of storage capacity created, and P. 4.78 per cubic meter
of earth moved. The cost per dam compares favorably with the LUPU cost of
B. 28,150 until it is recalled that the LUPU dams had four and a half
tim~s the storage capacity of a SDU dam.
There are several appare~t reasons for the low productivity reflectedp
in these cost figures. These center on the use of heavy equipment, whose
cost makes up 53% of the SDU expenditure:
1. The machinery may be underutilized in the sense that the present
group of machines has more capacity and sophistication than are required
by the size and design of the hafir-dams they are currently engaged in
building. Evidence to support this view is that the original SC&DBU
machinery was used to build larger and (reportedly) more elaborate dams
than its direct descendants--the SDU machinery--is doing at present.
2. Because of the versatile nature of the SDU's machinery, other
government departments requisition it at short notice and use it for pro-
longed periods of time. This plays havoc with planning as well as with

56
actual construction.
3. The average age of SDU key equipment--613scrapers and bull-
dozers--is nine years. Aging equipment means more frequent breakdowns.
4. When breakdowns occur, it may take weeks to obtain the neces-
sary parts and get them to the construction site together with a mechanic
capable of making the repairs.
5. The failure of one key piece of equipment often immobilizes all
the other piece~ i~ that untt because of the complementary nature of the
work. The great distance between units prevents the exchange of equip-
ment and the continuation of work in such circumstances.
6. The SDU wage bill is higher than would be found in the private
sector both because Industrial Class laborers are paid even when they are
idle and because the machinery operators have attained a high hourly rate
through seniority. Also, since wages are only issued at Gaborone, a SDU
officer must specially travel to ail the work sites monthly with the money.
The Serowe Brigades Dam Building Unit: The Brigades' Dam Building
Unit works under contract to the Ministry of Agriculture, and has cons-
tructed nine hafir-dams in the Serowe area since 1976. The Ministry paid
for the first dams at the rate of PO.90/m3 of earth moved. 20 This was'
3subsequently raised to P 1.25/m. Whatever the other benefits arising
from its work, the Dam Building Unit W8snot a financial success. Appen
21dix 9 in its most recent report tells the story:
20Figures supplied by the Small Dam Unit.
2~auter vd Wall Bake, "Dam Building Programme '79-' 82--Work Document," Serowe Brigades Development Trust, Serowe, December 1979.

57
1~76 1977 1978 1979
Return on Capital Employed -52% 14% -18% N.A.
Net Profit Ratio - 8% 18.5% -52.7% -82.3%
It appears that past pa~~t rates were too low. However t the connection
between rates received per cubic meter of earth moved and the overall
financial performance of the Unit is not clear in the report just cited.
The bulk of the report lays out a new program to build 24 dams over
the three years 1979/80 to 1981/82. The investment required to carry out
this program is P l19 t 405 t with an average equipment service life of nine
22years. Using a capital recovery factor at 12% interest t the annual cap-
ital cost is P 22 t 4l0. The report assumes that eight dams can be completed
each year. The past experience of the Dam Building Unitt however t suggests
that a more likely number is two. This makes the capital cost per dam
P llt205. Recurrent costs of construction are estimated at P l3 t 500 per
dam, for a projected total of P 24,705 per completed structure. Eleven of
23these dams had preliminary designs done t which if representative call
3 3for an average storage capacity of 38 t 013 m t and 8t 682 m as the average
amount of earth moved. To compare cost per dam it is necessary to adjust
3the DBU's dam size (taken as 8 t 682 m of earth moved) down to that of the
22Ibid.t pp. 58-59 t and Appendix llt pp. l-2 t layout the total capital and construction cost figures. Interest costs excluded by Wall Bakehave been added; 12% is the current bank lending rate to private firms.
23The preliminary designs from which these average figures were calculated are currently being reworked by the Small Dam Unit. In the absenceof new values for storage capacity and earth moved t the old ones are beingused. Taken as an average t the new values are not likely to be substan~
tially different from the old.
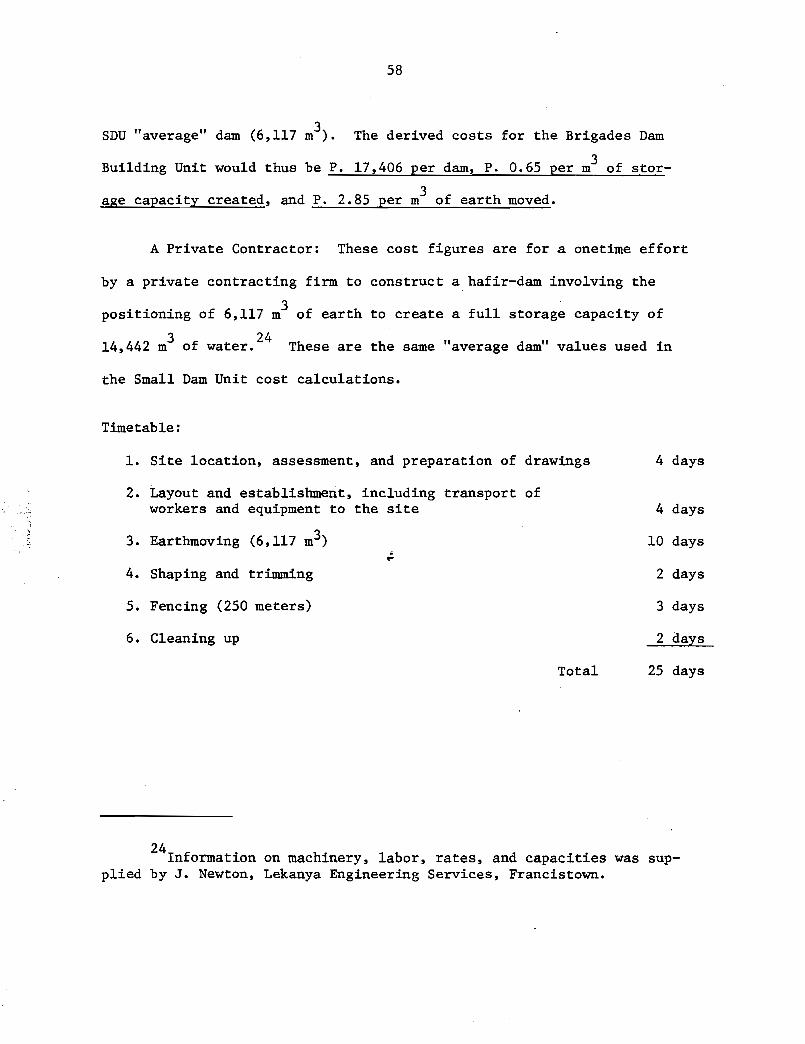
58
3SDU "average" dam (6,117 m). The derived costs for the Brigades Dam
3BUilding Unit would thus be P. 17,406 per dam, P. 0.65 per m of stor-
3age capacity created, and P. 2.85 per m of earth moved.
A Private Contractor: These cost figures are for a onetime effort
by a private contracting firm to construct a hafir-dam involving the
positioning of 6,117 m3 of earth to create a full storage capacity of
3 2414,442 m of water. These are the same "average dam" values used in
the Small Dam Unit cost calculations.
Timetable:
1. Site location, assessment, and preparation of drawings
2. Layout and establishment, including transport ofworkers and equipment to the site
3. Earthmoving (6,117 m3) .~
4. Shaping and trimming
5. Fencing (250 meters)
6. Cleaning up
Total
4 days
4 days
10 days
2 days
3 days
2 days
25 days
24Information on machinery, labor, rates, and capacities was supplied by J. Newton, Lekanya Engineering Services, Francistown.
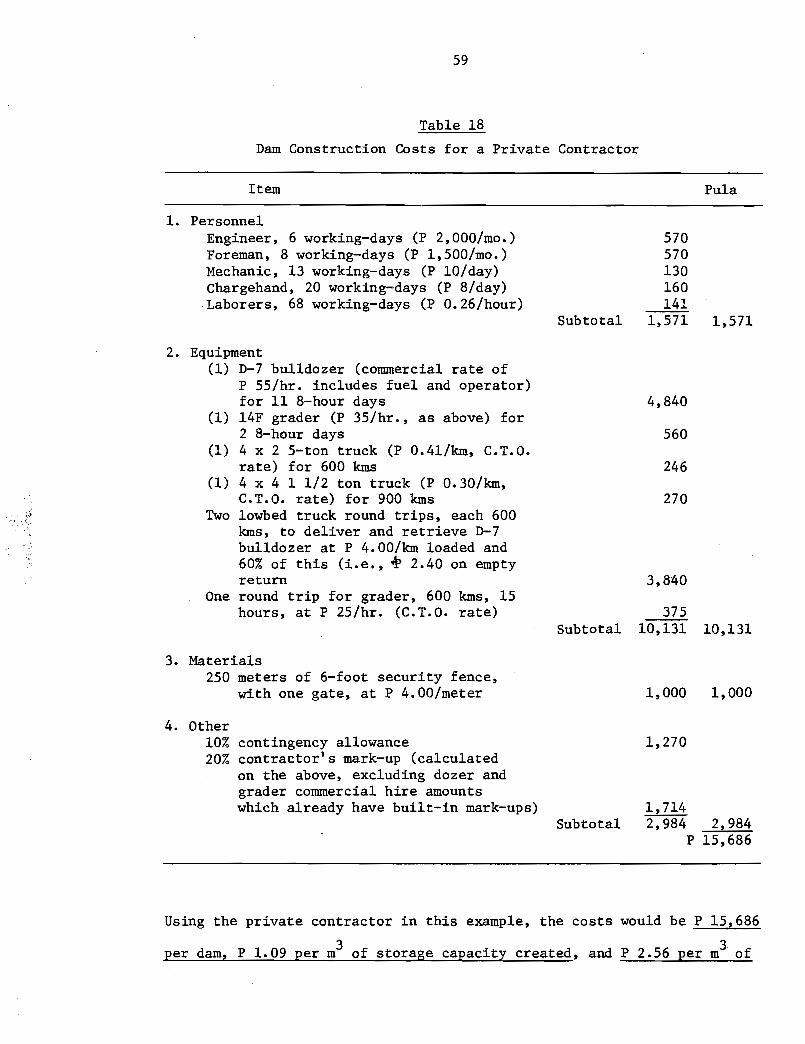
59
Table 18
Dam Construction Costs for a Private Contractor
Item Pula
1. PersonnelEngineer, 6 working-days (P 2,000/mo.)Foreman, 8 working-days (P 1,500/mo.)Mechanic, 13 working-days (P 10/day)Chargehand, 20 working-days (P 8/day)Laborers, 68 working-days (P 0.26/hour)
Subtotal
570570130160141
1,571 1,571
."".
2. Equipment(1) D-7 bulldozer (commercial rate of
P 55/hr. includes fuel and operator)for 11 8-hour days
(1) l4F grader (P 35/hr., as above) for2 8-hour days
(1) 4 x 2 5-ton truck (P 0.4l/km, C.T.O.rate) for 600 kms
(1) 4 x 4 1 1/2 ton truck (P 0.30/km,C.T.O. rate) for 900 kms
Two lowbed truck round trips, each 600kms, to deliver and retrieve D-7bulldozer at P 4.00/km loaded and60% of this (i. e., 4> 2.40 on emptyreturn
One round trip for grader, 600 kms, 15hours, at P 25/hr. (C.T.O. rate)
4,840
560
246
270
3,840
375Subtotal 10,131 10,131
3. Materials250 meters of 6-foot security fence,
with one gate, at P 4.00/meter 1,000 1,000
4. Other10% contingency allowance20% contractor's mark-up (calculated
on the above, excluding dozer andgrader commercial hire amountswhich already have built-in mark-ups)
Subtotal
1,270
1,7142,984 2,984
P 15,686
Using the private contractor in this example, the costs would be P 15,686
per dam, P 1.09 per m3 of storage capacity created, and P 2.56 per m3. of
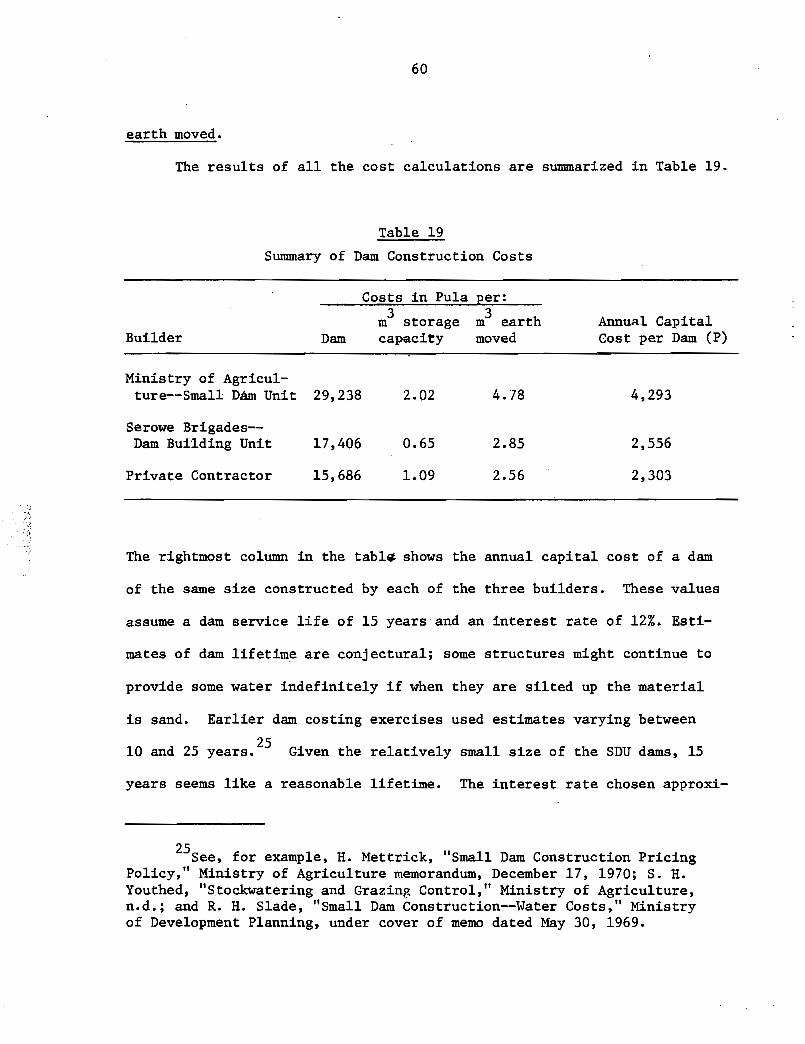
60
earth moved.
The results of all the cost calculations are summarized in Table 19.
Table 19
Summary of Dam Construction Costs
Costs in Pula per:
Builder
3 3m storage m earthDam capacity moved
Annual CapitalCost per Dam (P)
Ministry of Agricul-ture--Small DAm Unit 29,238 2.02 4.78 4,293
Serowe Brigades--Dam Building Unit 17,406 0.65 2.85 2,556
Private Contractor 15,686 l.09 2.56 2,303
The rightmost column in the tabl~ shows the annual capital cost of a dam
of the same size constructed by each of the three builders. These values
assume a dam service life of 15 years and an interest rate of 12%. Esti-
mates of dam lifetime are conjectural; some structures might continue to
provide some water indefinitely if when they are silted up the material
is sand. Earlier dam costing exercises used estimates varying between
2510 and 25 years. Given the relatively small size of the SDU dams, 15
years seems like a reasonable lifetime. The interest rate chosen approxi-
25see , for example, H. Mettrick, "Small Dam Construction PricingPolicy," Ministry of Agriculture memorandum, December 17, 1970; s. H.Youthed, "Stockwatering and Grazing Control," Ministry of Agriculture,n.d.; and R. H. Slade, "Small Dam Construction--Water Costs," Ministryof Development Planning, under cover of memo dated May 30, 1969.
61
mates the current prime lending rate by banks to large enterprises in the
private sector atld represents the opportunity cost of capital. The annual
capital cost is thus repayment of principle plus interest on the remain-
ing unpaid balance, spread out over the lifetime of the dam.
These results deserve careful scrutiny of all the steps and assump-
tions by which they were derived. In particular it should be remembered
that (1) the Small Dam Unit figures are based on actual expenditures
during the fiscal yea.. 1979-30, whereas dtt:: ~u~i:. estimates fOl' the other
two builders refer to expected costs in calendar 1980; (2) the cost fig-
ures for the Small Dam Unit and the Dam Building Unit are possibly more
comprehensive than those presented for the private contractor. On the
other hand, (3) the private contractor has a large entry for costs of
moving equipment to and from the site, an expense which is not explicitly
taken into account for the other two builders. If these transport costsp
are halved for the contractor, his cost per dam becomes P 16,579, storage
3 3capacity created is P 0.94 per m , and earth moved is P 2.22 per m .
The Small Dam Unit expended over one and a half times as much to
move a cubic meter of earth as would a private contractor; the Brigades
unit would require about 10% more than the contractor. Of course, the
purpose of moving the earth is to create storage capacity for water. The
cost per unit of capacity created is the important figure when planning
water resources development.
It is useful to distinguish between machinery efficiency and hydrau-
lic efficiency when considering how to reduce costs of water from SDU
26dams. Better sequencing of construction work and reduced idLe and down
26 h· di . . d b Gil L .T 1S st1nct10n was suggeste· y eV1ne, Water Points Surveywater resources engineer.

62
time would increase the amount of earth the existing SDU machinery could
move in a year. For example, if the number of dams completed in a year
could be increased from a little over 10 to 15, cost per cubic meter of
earth moved would fall to P 3.90, and cost per unit of storage capacity
would be P 1.65. Hydraulic efficiency gains are a question of improved
dam siting, design, and construction. The Small Dam Unit conducts or
oversees the construction of all stock-watering dams in the eastern com-
munal area~ If the Unit could also put more of its resources into plan-
ning dams, then the amount of storage created per unit of earth moved
could ~ncrease, and the cost per unit of water supply capacity would fall
even further than with just machinery efficiency gains.
Dams and Hafir-Dams: Operation and Maintenance
Dams and hafir-dams owners and managers spend very little on opera-
tion and maintenance of their water points. Of the eight structures fo~.
which this kind of cost information is in hand, two (privately owned) em-
ploy caretakers who receive annual wages of approximately P 100 to main-
tain the structure and control access. For the other six, the only cost
is that of the time of the owners or group members which is devoted to
building or repairing the fence. A rough estimate for group-managed dams
would be 10 men x 4 hours/day x 6 days/year, at an opportunity cost equal
to the minimum wage of P 0.26/hour, i.e., P 62.40, or say P 65 per hafir-
dam per year.
Poor maintenance, or more broadly speaking, poor management, shor-
tens the service life of the structure by permitting relatively higher
rates of reservoir siltation and erosion of the dam well. Certain design
changes, introduced at the time of construction may lengthen service
63
27life, e.g., a small hafir silt-trap upstream of the main structure, a
field stone-paved ramp for cattle into the reservoir, fencing which re
28stricts cattle access to the water to small sequential groups, flatter
slopes on the dam walls, and rip-rap covering on the wa11. 29 Since
higher levels of maintenance may not be forthcoming from most dam and
hafir-dam users, there is a distinct possibility that any increased cost
of construction through design improvements will be more than matched by
the (discounted) benefits of longer service life.
Boreholes: Construction
The construction of a ready-to-operate borehole usually happens in
two stages: (1) siting, drilling, installation of casing, and pump test-
ing, and (2) equipping the drilled hole with pump, engine, reservoir, and
associated fittings.
Government Drilling
Government cost figures for the first stage come from two sources:
a paper entitled "Review of Rural Water Prices" produced by C. E. W.
Simkins of the Ministry of Mineral Resources and Water Affairs in early
1975, and a paper entitled "Drilling Costs" by P. Spray of the same Mini-
27Some farmers use small silt-traps to protect their hafirs; thissilt-trap would be for larger structures, and would require fairly frequent cleaning during the rainy season.
28Design changes suggested by George Classen, ALDEP Consultanton water supply in lands areas, May 1980.
29See Gil Levine, "Observations of Botswana Water Points," WaterPoints Survey, February 1, 1980, pp. 5-6.
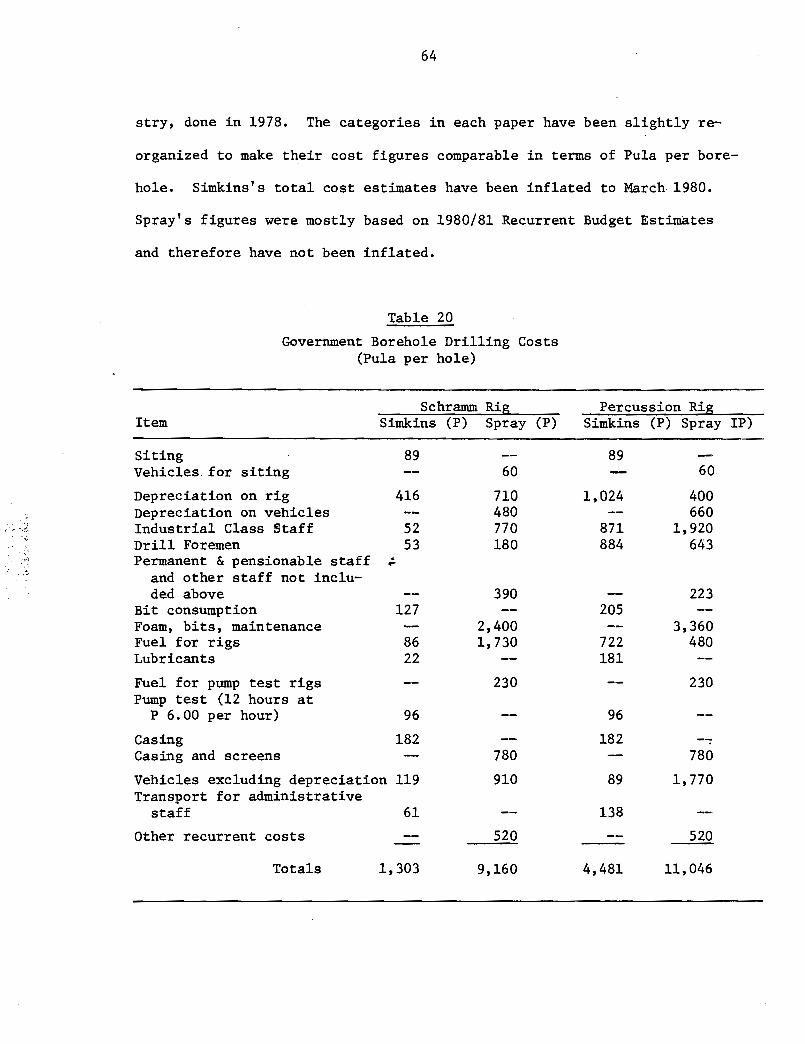
64
stry, done in 1978. The categories in each paper have been slightly re-
organized to make their cost figures comparable in terms of Pula per bore-
hole. Simkins's total cost estimates have been inflated to March 1980.
Spray's figures were mostly based on 1980/81 Recurrent Budget Estimates
and therefore have not been inflated.
Table 20
Government Borehole Drilling Costs(Pula per hole)
Schramm Rig Percussion RigItem Simkins (P) Spray (P) Simkins (P) Spray IP)
Siting 89 89Vehicles for siting 60 60
Depreciation on rig 416 710 1,024 400Depreciation on vehicles 480 660
~~~ Industrial Class Staff 52 770 871 1,920" .• ;"
Drill Foremen 53 180 884 643- ?~,c. Permanent & pensionable staff .
~
.. ~. and other staff not inclu-ded above 390 223
Bit consumption 127 205Foam, bits, maintenance 2,400 3,360Fuel for rigs 86 1,730 722 480Lubricants 22 181
Fuel for pump test rigs 230 230Pump test (12 hours at
P 6.00 per hour) 96 96
Casing 182 182Casing and screens 780 780
Vehicles excluding depreciation 119 910 89 1,770Transport for administrative
staff 61 138
Other recurrent costs 520 520
Totals 1,303 9,160 4,481 11,046

65
The Simkin totals have been brought up to March 1980 using (in the absence
of anything more appropriate) the Botswana Cost of Living Index. 30
Table 21
Comparative Borehole Drilling Costs(Inflated to March 1980)
Schramm Rig Percussion Rig
Basis of Comparison
Cost per hole (fromabove)
Cost per hole(inflated)
Simkins (P)
1,303
2,605
Spray (P)
9,160
as above
Simkins (P) Spray (P)
4,481 11,046
8,959 as above
Cost per successfulhole (inflated)*
Cost per meter**
4,570
23.47
15,267
82.52
15,718
80.71
18,410
99.51
*Simkins: 57% success rat~ based on D.G.S. experience in 1973;Spray: 60% success rate.
**Assuming, with Simkins, an average borehole depth of 110 meters.
30Central Statistics Office, Ministry of Finance and DevelopmentPlanning, Statistical Bulletin, vol. 4, no. 4, December 1979. The March1979 to March 1980 CPI percentage increase is courtesy of Michael Pepper, C.S.D.
Rate of Increase in Consumer Price Index
Year Ended March
197519761977197819791980
Percent
12.212.613.710.08.7
16.4
66
The two papers agree that percussion rigs are more costly than
Schramm rigs, and there is some agreement on the cost of the percussion
rig. The greatest discrepancy is between the two cost estimates for the
Schramm rig. Simkins's low estimate may be a result of the relatively
small amount of experience with Schramms existing at the time he wrote.
Private Sector Drilling
Small private drillers in Kgatleng and Southern districts are
charging P 30-32 per meter drilled, including casing. 3l The pumping test
is an additional flat rate of P 90 per hole •. The driller and his (private)
client agree on the site and split the cost of a dry hole. Assuming a
50% success rate, the cost of a successful hole of average depth (110
meters) ready to be equipped ranges between P 6,600 and P 7,040. Large
contra~~Clrs in th~ private_,sector _arE! charging P 9-10,000 per hole complete
with casing. Their advantage ~s a better hole faster finished. With a
60% success rate, this amounts to P 15,833 per successful hole.
Equipping
The costs of the second stage of borehole construction--equipping
can be illustrated by the experience of the Animal Production Research
Unit, which equipped a borehole at its Makhi II ranch in November 1979.32
The borehole is 116 meters deep.
3lDrilling charges for western Ngwaketse provided by B. Addy,Division of Land Utilization. Information on the small private drillingsector provided by Mr. Rampa of Pilane, Kgatleng District.
32Detailed expenditures on the Makhi II borehole were furnishedby T. Rennie, AFRU.

67
Table 22
Central Government Borehole Equipping Costs:APRU Makhi II Ranch
, t
Item
Provided through Water Affairs:
Mono pump and discharge head
Lister 6/1 engine with pulley, cooling tankand stand, belts
Pumphouse
Fittings and fixtures
Procured from private firms:Reservoir
Piping
One watering trough
Cement, paint, tools, other materials
Labor and installation charges
Total
Pula
276
1,099
365
447
1,346
1,133
50
1,382
909
7,007
Another example of recent borehole equipping costs comes from the
North East District Council Water Maintenance Unit, which equipped a
borehole at Maka1eng in 1979. 33
33p • N. Dijeng, Chief Technical Assistant (Water), North EastDistrict Council, provided, via ~. Fortmann, the expenditure data onthe Maka1eng borehole.

68
Table 23
North East District Council Borehole Equipping Costs: Makaleng
Item
MRTS Mono pump and pump element
Lister SWl air-cooled engine with pulleYt cooling systemtand belts
Pumphouse
Fittings and fixtures
Two 2t OOO gallon water tanks
Piping
One watering trough
Cement and other materials
50 working-days labor
Total
Pula
405
2 t 13l
450
35
514
538
73
121
277
4 t 544
The Makhi II borehole costs also included P 877 for 38 pipes of the rising
main; this item was omitted from Table 22 to facilitate comparisons.
The cost of drilling and equipping a borehole is a function of its
depth t yield t locationt anticipated water supply requirements t and the
agency doing the work t which is to say that the cost varies widely.
Table 24 summarizes the costs of borehole drilling and equipping. The
annual capital cost of drilling assumes that the hole will be usable
for 35 years; equipment lifetime is set at 20 years t following the

69
O'Sullivan report. 34 The interest rate is 12% in both cases.
Table 24
Summary of Borehole Construction Costs
Total Cost(P)
Drilling:
Annual CapitalCost perBorehole (P)
Government* --Schramm
--Percussion
Large private contractor
Small driller
Equipping:
Makhi II borehole
Maka1eng borehole
*P. Spray, cost per successful hole.
Boreholes: Operation and Maintenance
15,267
18,410
15,833
7,040
7,007
4,544
1,867
2,252
1,937
861
938
608
These costs are even more difficult to pin down than those of bore-
hole construction. Average annual repair and maintenance costs to owners
of all boreholes looked after by the Borehole Repair Service are currently
on the order of P 535. This figure was derived from the calculations done
by P. Spray in his paper, "The Annual Cost of the BPMS and its implication
34T• P. O'Sullivan and Partners, Borehole Preventative MaintenanceStudl, draft final report, London and Gaborone, February 1975, TableV.4.1.

70
for Fees," Ministry of Mineral Resources and Water Affairs (n.d.), in-
flated to March 1980. Information from nine boreholes in the Water Points
Survey shows their owners spent an average of P 310 on repairs and main-
tenance in calendar 1979.
Costs of borehole operation include pumper's wages, diesel, and
lubricating oil. Information from 13 boreholes in the Water Points Sur
35vey reveals their owners spent an average of P 522 on diesel and oil.
Five of these boreholes had pumpers, whose annual wage payment averaged
about P 400.
Open Wells: Construction and Maintenance
With the exception of a recent initiative in Ngamiland, the Govern~
ment of Botswana has no program which constructs or encourages the cons~
truction of open wells. However, this is one of the most common and reli-
able forms of water point found i~ eastern communal areas. An 'open wellp
has several advantages: its construction emphasizes relatively unskilled
labor over sophisticated heavy machinery; it can provide reasonable vol-
umes of clean water the year round; it is easy to control cattle access
to open well water; and the well can be upgraded in stages by the addi-
tion of a hand-pump, then an engine as the owner accumulates funds.
There are also some disadvantages: open wells are somewhat dangerous to
construct; with no raised lip or rim dirt, animals and people can fall
in; it is a lot of work to water cattle from the typical open well equip-
ped with roller, chain, and bucket.
350perating costs for Bodungwane syndi~ate borehole came out ofthe work of P. Peters on syndicate boreholes in Kgatleng.

71
Costing open well construction is difficult because wells are in-
frequently dug these days in the eastern communal area. The newest well
in the Water Points Survey was finished in 1976; most were built during
the 1920s and 1930s; some date back to World War I. Several reasons are
offered for the lack of new construction: a lack of time and interest in
the long-drawn~out and casual labor on wells as it used to be done; for
those that have money to invest. a much greater interest in borehole con-
struction; the Land Board requirement that water points must be eight
kilometers apart; and stringent government regulations on the handling and
transport of dynamite. An accurate evaluation of costs will depend on
how a new effort at open well construction is organized. Open well siting
and rock blasting are two construction phases where government help could
be critical.
Eleven open wells measured by the Water Points Survey showed an ave-...rage depth of 16.1 meters, with a range of 7.2 to 27.0 meters. The ground
water table is fairly close to the surface in many parts of the eastern
communal area, and it is assumed that new open wells would be of about the
same depth. With an average construction diameter of 1.5 meters, the ty-
pica1 new open well would require the removal of a core of earth and rock
3amounting to 28.5 m. Current private sector rates for excavation are
3 3 36P 5 per m and for blasting, P 15 per m • It is assumed that half of
the ma~erial would have to be blasted, and all would have to be excavated.
In addition, concrete might be used in place of the traditional timbering
36Estimates supplied by J. Newton, Lekanya Engineering Services,Francistown.
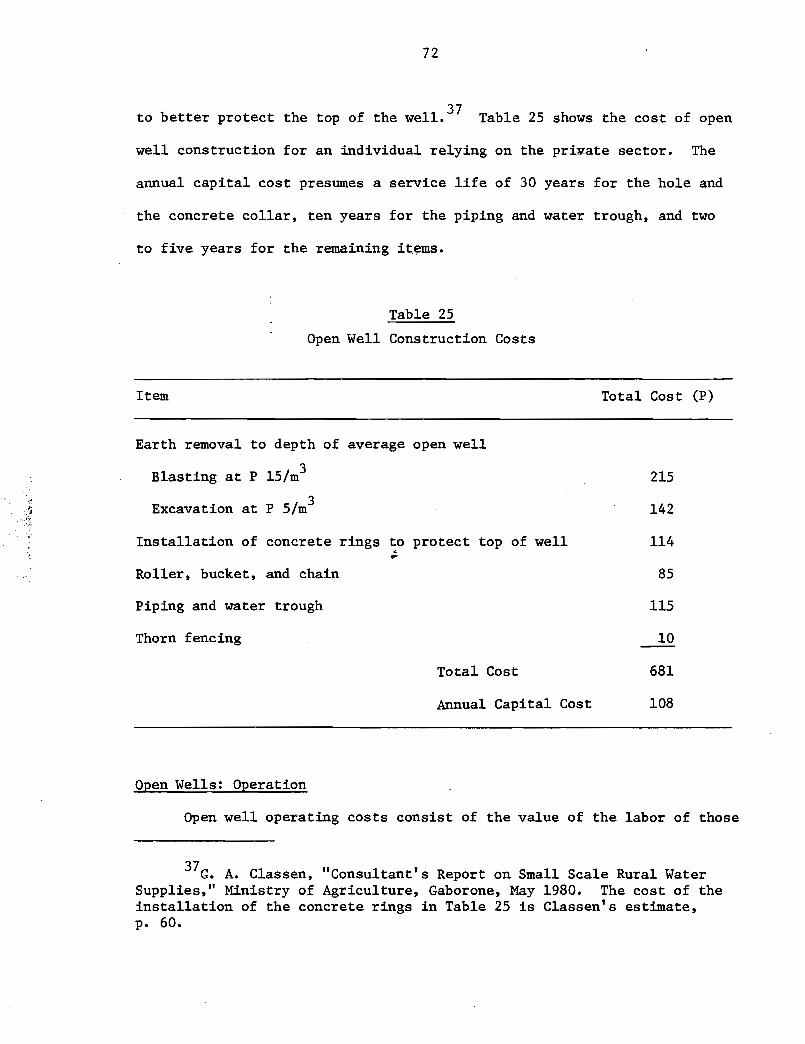
72
37to better protect the top of the well. Table 25 shows the cost of open
well construction for an individual relying on the pri¥ate sector. The
annual capital cost presumes a service life of 30 years for the hole and
the concrete collar, ten years for the piping and water trough, and two
to five years for the remaining it~ms.
Table 25
Open Well Construction Costs
Item
Earth removal to depth of average open well
Blasting at P 151m3
Excavation at P 51m3
Installation of concrete rings to protect top of well
Total Cost (P)
215
142
114
Roller, bucket, and chain 85
Piping and water trough 115
Thorn fencing 10
Total Cost 681
Annual Capital Cost 108
Open Wells: Operation
Open well operating costs consist of the value of the labor of those
37G. A. Classen, "Consultant's Report on Small Scale Rural WaterSupplies," Ministry of Agriculture, Gaborone, May 1980. The cost of theinstallation of the concrete rings in Table 25 is Classen's estimate,p. 60.

73
engaged in drawing water. Most well users draw for themselves and their
family. Some older men brag of watering 200 head of cattle a day from
a roller-equipped open well, which must represent some upper limit on
effort. Water Points Survey respondents used open wells 8.8 months of
the year and watered on average 85 livestock units a day. The labor of
two men working daily at this task valued at the minimum wage amounts to
an open well operating cost of P 1,120 per year. Unlike all other water
points, open wells are very labor-intensive; labor accounts for over 90%
of total annual costs. The unit cost of water is thus very sensitive to
assumptions about the amount of labor required to operate an open well.
The Unit Cost of Water at Dams, Boreholes, and Open Wells
Many different pieces of information developed earlier in this paper
are brought together in Table 26, which shows the unit cost of water at
different categories of dams, poreholes, and open wells. The leftmost
column lists eight different ways of constructing one of these water points,
from SDU dams to private sector open wells. The next three columns dis
play annual costs of these water points. Borehole annual recurrent costs
are composed of repair and maintenance, diesel and oil consumed, and the
wages of a pumper. For repair and maintenance the Borehole Repair Service
estimate of P 535 was used for government boreholes, while the Water Points
Survey value of P 310 was assigned to private boreholes. The mean of
these values was used for syndicate boreholes. The diesel and oil charges
of P 522 were allocated to private boreholes and prorated upward for
syndicate and government boreholes which on the average pumped more water.
The next columns of the table show the management presumed to pre
vail over the water points constructed by the agencies in the first column.

Table 26
Unit Cost of Water at Different Water Points--12% Interest Rate
Annual Annual • Total Estimated Annual Supply Annual Cost perCapital Recurrent Annual from Water Point Cubic Meter of
Water Point Builder Cost (P) Cost (P) Cost (P) Water Point Category Am~unt Water Supplied (P)m
DamsMoA Small Dam Unit 4,293 65 4,358 Group Hafir-Dam 2,396 1.82
Brigades Dam BuildingUnit 2,556 65 2,621 Group Hafir-Dam 2,396 1.09
Private Contractor 2,303 65 2,368 Group Hafir-Dam 2,396 0.991.,
Boreholes .......
Water Affairs--Schramm 2,640 1,773 4,413 Government Borehole 1,909 2.31 .j::'oo
Water Affairs--Percussion 3,025 1,773 4,798 Government Borehole 1,909 2.51
Large PrivateContractor 2,710 1,773 4,483 Government Borehole 1,909 2.35
1,486 4,196 Syndicated Borehole 1,505 2.79
1,232 3,942 Private Borehole 1,189 3.32
Small PrivateDriller 1,634 1,486 3,120 Syndicate Borehole 1,505 2.07
1,232 2,866 Private Borehole 1,189 2.41
Open WellsPrivate Sector 108 1,120 1,228 Private Open Well 793 1.55
75
The Small Dam Unit specifically builds hafir-dams for groups of farmers,
as do the Brigades and the private contractor under SDU direction.
Water Affairs-built boreholes are for government. It is assumed that large
private contractors may build boreholes for the government, syndicates,
or private individuals, but the small driller is unlikely to get a govern-
ment contract at present. Up -until recently, open wells have been cons-
tructed and operated entirely within the private sector. The annual
supply of water from water points was derived earlier in this paper (see
Table 13) and refers to the period April 1979-March 1980. Thus the unit
cost of water presented in the last column is the cost of water presumed
used by cattle in the 12 surveyed communities in 1979-80 at current costs
of water point construction, operation, and maintenance.
These unit costs are sensitive to (a) the number of livestock units
using a particular category of ~ater point and hence the water assumed to~
be supplied by it, and (b) the assumed cost of capital, or the interest
rate. Based on random selection of respondents within each of the 12 sur-
veyed communities, it was possible to derive the total number of cattle
using a water point and not just the respondents' animals. 38 The volume
of water supplied by a water point is based on this number, with the
assumption that cattle could drink as much as they wished from the water
point. This is not always the case, as discussed earlier, so the water
supply estimates are if anything high. Therefore the unit costs above
somewhat underestimate the true values.
The proper selection of interest rates in project evaluation has
38A d' B' d 'I h d dppen 1X g1ves eta1 s on t e proce ure use •

76
generated an enormous literature in the field of economics. However, the
general practice is to use a low interest rate for publicly funded pro-
jects and the market rate of interest for private projects. Unit costs
in Table 26 were all calculated with an interest rate of 12%; Table 27
shows unit costs with assumed interest rates of 8, 4, and 2%. Dams are
most sensitive to changes in the assumed interest rate since over 90% of
their total annual cost is the 'cast of capital. Boreholes are of medium
sensitivity, with 50-60% of their annual cost made up of capital. Open
wells are least sensitive, since less than 10% of their annual cost is
based on capital costs.
This paper contains enough information on costs and their derivation
that the reader can alter any of the assumptions he wishes to produce his
own estimates. The final table in Part III displays unit costs of water
pulled out of the previous two taples, assuming a 2% interest rate forp
government-financed projects and a 12% rate for all other projects. Under
these assumptions a group hafir-dam built by a private contractor is the
lowest cost water point at P 0.54 per cubic meter; a privately owned bore-
hole drilled by a large private contractor is the most expensive water
point, providing water at a cost of P 3.32 per cubic meter. The average
unit cos~ of water from all the listed water points is P 1.69. As a
group, boreholes supply the most expensive water, having an (unweighted)
mean cost of P 2.14. The cost of water from hafir-dams is about one-third
this amount. Water costs more at open wells than at hafir-dams chiefly
because of the labor involved in lifting it up to ground level.
The cost of water for cattle in the 12 surveyed communities is
higher than it need be. Overall cost savings appear to be possible through
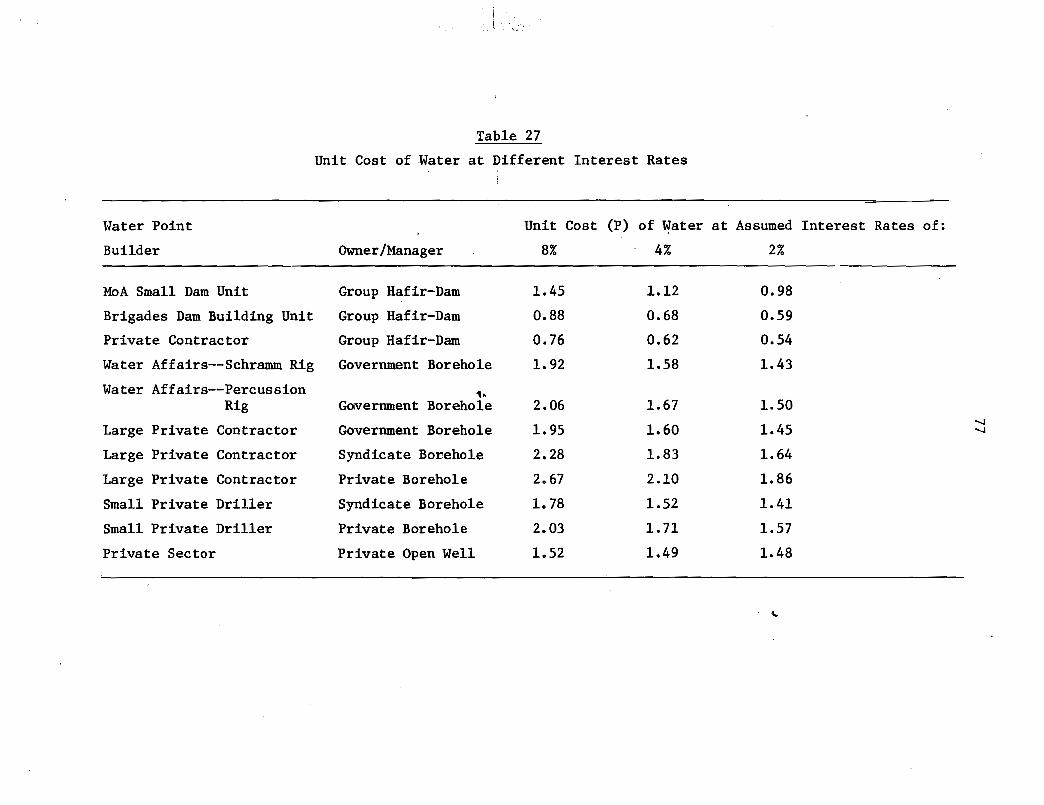
· ....."'.:.
Table 27
Unit Cost of Water at Different Interest Rates
Water Point Unit Cost (P) of Water at Assumed Interest Rates of:
Builder Owner/Manager 8% 4% 2%
MoA Small Dam Unit Group Hafir-Dam 1.45 1.12 0.98
Brigades Dam Building Unit Group Hafir-Dam 0.88 0.68 0.59
Private Contractor Group Hafir-Dam 0.76 0.62 0.54
Water Affairs--Schramm Rig Government Borehole 1. 92 1.58 1. 43
Water Affairs--Percussion 1,·Rig GOIVernment Borehole 2.06 1.67 1.50
Private Borehole 1.95 1.60 1.45......,
Large Contractor Government ......,
Large Private Contractor Syndicate Borehole 2.28 1.83 1. 64
Large Private Contractor Private Borehole 2.67 2.10 1.86
Small Private Driller Syndicate Borehole 1. 78 1.52 1.41
Small Private Driller Private Borehole 2.03 1.71 1.57
Private Sector Private Open Well 1.52 1.49 1.48

78
Table 28
The Unit Cost of Water for Cattle
Large Private Contractor
Large Private Contractor
Large Private Contractor
Small Private Driller
Small Private Driller
Water Point
Builder Owner/Manager
MoA Small Dam Unit Group Hafir-DamJ
Brigades Dam Building Unit Group Hafir-Dam
Private Contractor Group Hafir-Dam
Water Affairs--Schramm Rig Government Borehole
Water Affairs--PercussionRig Government Borehole
Government Borehole
Syndicate Borehole
Private Borehole
Syndicate Borehole
Private Borehole
Open We11s--Private Sector Private Open Well
Annual Cost perCubic Meterof Water (P)
0.98
0.59
0.54
1.43
1.50
1.45
2.79
3.32
2.07 .
2.41
1.55
improved dam siting, design, and construction, better borehole mainten-
ance, and open well water lifting techniques which improve the efficiency
39of hand labor. On the other hand, relative cost differences among
different physical types of water point are inherent in the different
water supply technologies. Surface water supplies will always fluctuate
more than water from underground; ground water will nearly always require
an energy source to get it to cattle; ground water lifting structures are
more costly to construct per unit of water supplied, therefore they are
39For specific recommendations, see, respectively, Gil Levine,T. P. O'Sullivan, and G. A. Classen, op cit.
79
less numerous and are at greater distances from farmers' kraals. Thus
the water resources planner finds himself in a position remarkably similar
to that of the cattle holder, i.e., balancing reliability, cost, and con
venience of water supply in the context of a local water use system. The
difference is the planner's job is explicitly to take a longer run view
and consider how best to develop the water resources of an area.
SUMMARY AND CONCLUSIONS
This paper has presented an analysis of the water use strategies of
cattle holders in the 12 communities of Botswana's eastern communal area
which were studied intensively by the Water Points Survey during 1979-80.
It is maintained that farmers choose the most reliable, inexpensive, and
convenient sources of water among the alternatives available to them
within their locality.
The introduction sets trhe scene. Cattle consume over 85% of the
water annually used in the eastern communal area, but they still are not
able to get enough to meet APRU recommendations of a continuous and freely
available supply required for optimal bodyweight growth. However, it is
suggested that water development efforts should first be directed to
improving water security, with continuous and freely available supply a
secondary goal. The remainder of the introduction describes the survey
procedures, explains the meaning of "livestock unit" used in the analysis,
and classifies all wa~er points by physical and management types, and a
cross-classification, the management-physical type category.
Part I examines water use from the viewpoint of the cattle holder.
In the short run, farmers can either move their cattle or change water

80
points as they attempt to meet their herds' water requirements. MOst
farmers keep their cattle permanently at one place, except for seasonal
movements to the lands for plowing, and change water points to satisfy
their cattle's water needs. Over the course of a year, most farmers use
between two and three water points. On average there are 54 water points
within normal range of their kraals, though this number varies widely
among the 12 surveyed communities from 14 to over 100.
In choosing his water points the farmer balances the relative relia-
bility, cost, and convenience of water available from the different cate-
gories of water point. During much of the year he gives most weight to
reliability--the assurance of enough water now and in the immediate
future. However, during the spring and early summer (October-December),
when rainfall fills many surface catchment water points, convenience be-
comes a more important consideration. Convenience means thedistancebe=-.tween the farmer's kraal and the ~ater point he is using; distance drop-
ped from 45 minutes during June, July, August, and September to 30 min-
utes during December and January. Two-thirds of the Survey respondents
did not own their own water point and had to pay for water they used from
boreholes, equipped open wells, private open wells and seep wells, and
group hafir-dams. Still, cost in the sense of outlays of cash, cattle,
labor and materials to pay for water was the least important of the three
considerations in choosing a water point. Water payments ranged from
P 0.01 to P 1.07 per livestock unit-month, with a mean of P 0.23.
Part II focuses on the water points respondents used and shows their
pattern of use over time. The usage pattern is described in terms of (a)
changes in the number of operating water points of different types, (b)
changes in distance to water, broken down by types of area in which re
spondents were keeping their cattle, (c) changes in the distribution of
cattle over water points of different types and categories, and (d)
changes in daily water demand by cattle at different categories of man-made
water points. These changes are shown graphically in Figures 3 to 9.
The total number of operating water points dropped 9% from March to
May-June 1979; it rose 26% between August 1979 and January 1980, reflec
ting a more abundant rainy season. Fifty-six percent of all water points
were privately owned and managed. The major seasonal shift was from nat
ural sources to these water points and back again. The number of opera
ting open wells and seep wells increased during the winter dry season and
fell off again with the rains because of the considerable labor these
water points, especially open wells, require. The number of operating
boreholes maintained a constant level from March until October 1979 when
it too fell. Of the man-made sarface catchment water points, the number
of operating hafirs used for cattle watering rose the most dramatically
in the spring and summer of 1979-80.
Distance to water increased most in mixed lands and cattle post areas
in the winter of 1979; it decreased slightly in cattle post areas as cat
tle left pans for boreholes and open wells situated closer to their
kraals. Among all area types, cattle were closest to water in the lands
in January 1980.
Changes in the distribution of cattle over water points exhibit a
similar seasonal pattern to changes in the number of operating water
points: ground water tapping water points dominate surface water catchment
water points during the dry season. However, in this case the relative
importance of the various water point physical types in terms of animal
usage becomes apparent. Open wells are the most numerous dry season
water point but boreholes serve more cattle. The fall in cattle usage of
boreholes, open wells, and seep wells in the November to March period is
dramatic, but matched by an equally steep rise in use of rivers, pans,
dams, and hafir-dams.
Changes in daily water demand by cattle have been analyzed by man-
agement-physical type categories of water point. Cattle demand for water
is the quantity an animal would drink if water were continuously and freely
available to him. This condition did not usually prevail in the 12 commun-
ities except at open-access natural sources and unfenced dams; to this
degree the water demand values are overestimates of water actually consumed.
Water demand is a function of the number of cattle using a water point,
the mean monthly temperature, and the composition of the community herd.
Overall cattle numbers and mean t~mperature both fall in the winter months,p
and herd composition shifts toward less water demanding types of animals
(i.e., fewer cows in calf). Therefore overall water demand is less in the
winter months, though it is concentrated on fewer water points. Private
open wells and seep wells had the greatest demand for water from May to
November 1979; most of the remaining demand over the same period was met
by private, government, and syndicate boreholes (in that order).
Part III shifts from a concern with current water point use practice
and patterns to consider the costs of constructing new water points,
specifically dams and hafir-dams, boreholes, and open wells. Costs of
construction are detailed for the Ministry of Agriculture's Small Dam
Unit, the Serowe Brigades Dam Building Unit, a private contractor (dams

and hafir-dams). the Ministry of 11ineral Resources and Water Affairs De
partment of Water Affairs. a large private contractor. and a small pri
vate driller (borehole). and the private sector (open wells). Costs of
operation and maintenance are also discussed.
The analysis concludes with estimates of the pula cost per cubic
meter of water supplied from newly constructed group hafir-dams. govern
ment. syndicate. and private boreholes, and private open wells. As a
group, boreholes supply the most expensive watei at an average cost of
P 2.14 per cubic meter. Hafir-dams are the least expensive at P 0.79 per
cubic meter. Open wells cost P 1.55 per cubic meter of water, largely be
cause of the high labor component in operating costs.
The water supply situation for cattle holders in the eastern commun
al area varies enormously from place to place and at the same place over
time. Farmers are faced with a whole set of decisions on cattle watering;
this set constitutes a very larse fraction of their total herd management
effort. In choosing where to water their cattle farmers give most weight
to reliability of supply, but also take distance to water and cost of
water (including their own labor) into account. The first. goal of water
resources development should be ~o stabilize water supply in a locality
over the course of the year. The second goal should be to increase
overall supply both to raise per capita consumption of existing stock and
to provide for the anticipated growth in stock numbers.
In carrying out such a program the first need is for information on
local water resources. This permits setting priorities on which areas to
work in first and also suggests the proper mix of new water points which
will best complement those already in place. A very simple local survey
84
combined with kgotla meetings should be able to provide the required
information. The results of the Water Points Survey provide the back-
ground within which to interpret this information and plan water devel-
opment. Work is currently in progress on such applications and more
general water planning methodologies for the eastern communal area of
Botswana.
.p
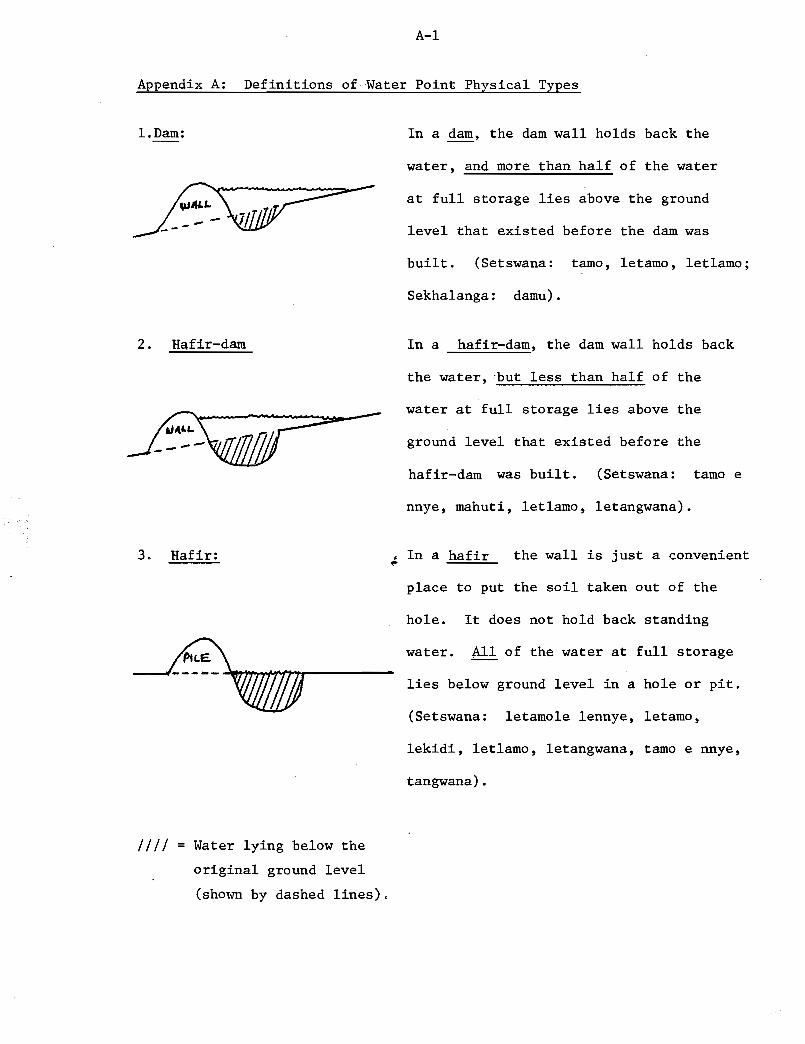
A-I
Appendix A: Definitions of Water Point Physical Types
I.Dam: In a dam, the dam wall holds back the
water, and more than half of the water
2. Ha,fir-dam
at full storage lies above the ground
level that existed before the dam was
built. (Setswana: tamo, letamo, letlamo;
Sekhalanga: damu).
In a hafir-dam, the dam wall holds back
the water, ;but less than half of the
water at full storage lies above the
ground level that existed before the
hafir-dam was built. (Setswana: tamo e
nnye, mahuti, letlamo, letangwana).
3. Hafir: • In a hafir.. the wall is just a ~onvenient
IIII = Water lying below the
original ground level
(shown by dashed lines).
place to put the soil taken out of the
hole. It does not hold back standing
water. All of the water at full storage
lies below ground level in a hole or pit.
(Setswana: letamole lennye, letamo,
lekidi, letlamo, letangwana, tamo e nnye,
tangwana) .

A-2
4. River: A seasonal or perennial flow of water along a defined water
course. A linear ~ather than a point source of water. (Setswana:
molapo, noka).
5. Pan: A low spot Jr depression in which water seasonally collects.
(Setswana: mogobe, letsha, letlodi).
6. Borehole: A machine-drilled, small diameter hole of variable depth,
often lined with casing pipe. An engine and pump, or a hand-pum~
is required for. obtaining water. (Setswana: sediba se se dirisaleng
engine, motobetso, mokhenyembule, sediba, sediba sa engine, sediba se
se thunthunyetswang, dipompo; Sebirwa: gwege; Sekhalanga: borabora).
7. Open Well: A shaft deeper than it is wide, the top portion of which
is lined with logs to prevent cave-ins. It is commonly equipped with
a roller, chain, and bucket. Some owners have installed a hand-pump
or an engine and pump. (Sitswana: sediba se se epilweng, petse,
sediba, sediba se se tiraesewang, sediba se se epilweng sa terai,
sediba sa petse).
8. Sand River Well: A shallow well penetrating to ground water in sand
rivers •. It is reconstructed after every rainy season which causes
water to flow over the surface of the sand. Water is obtained with
a bucket. (Setswana: sediba se se epilweng mo molapong, sediba
se se mo nokeng, sedibana se se tswelang se epilwe fa nokeng).
9. Seep Well or Pit: A pit often wider than it is deep, unlined in the tqp
portion, and tapping groundwater which lies above an impervious layer.
Water is obtained with a bucket. During the rainy season a large seep

A-3
well may function as a haffir. (Setswana: se se epilweng, sediba,
petse, madutledi, sediba se se fato lotsweng gore metsi atswe ka
diatla, lehoti, motswedi, morokwana).
10. Spring: A spontaneous flow of water out of the ground. The volume
typically varies with the season. (Setswana: mosenyana, motswedi,
molatswana, madutledi).

Tem perature
°c
260
25 0
24 0
23 0
22 0
21 0
20 0
,,:'
19 0
18 0
17 0
16 0
15 0
14 0
13 0
12 0
11 0
FIGURE B1
RELATION BETWEEN TEMPERATURE ANDDAILY WATER CONSUMPTION IN
BEEF CATTlE
20 30 40 50
Water Consumed (litres)
60 70
B-1
Appendix B: Derivation of Livestock Units and Liters of Water per Water Point
The field data came from the two rounds of the Water Points Survey
which were directed to cattle owners in the 12 communities. The data
consist of:
a. Numbers of cattle owned or held and managed and owned but not managed
by type (bulls, cows, etc.) and by location as of November 1979.
b. Calf births, deaths, and total breeding stock, which permitted calcula-
tion of the effective calving percentage for each herd. About 5% of
the cases had missing values for births and deaths; village means were
substituted.
c. Annual distribution of calf births.
d. All other entries into each herd from purchases, trades-in, dowry, gift,
inheritance, and mafisa-in. .e. All exits from each herd from~sales, trades-out, dowry, gift, mafisa-
out, payment of wages, fees, and fines, home slaughter, natural death,
and disappearance.
f. Composition of each team used to plough in the 1979-80 season in terms
of type of animal and ownership.
g. Monthly information for each of the farmer's herds and subherds over
the period January 1979 to March 1980 on where it was being kept, which
water points were being used, and distance (in terms of time) from the
kraal to each water point.
h. Water point census maps and key.
The derivation proceeded in stages from these data:

B-2
Step I
Farmer herds and subherds consisting of animals they owned, mafisa'd
in, or borrowed and managed on a month-to-month basis were the starting
point in this analysis. Of the total number of water point use-months,
farmers' first herds account for 94%, and subherds within first herds an-
other 4%. The remaining 2% were farmers' second herds. These were dropped
from the analysis because of their small share in total usage and because
second herds were often found far away from the actual water use survey
areas.
The size of each farmer's herd and subherd in terms of numbers and
composition was determined for each of the 15 months from January 1979 to
March 1980. This step had three aspects: allocation of entries and exits
into each first herd over the IS-month period, accounting for calves born
January to March 1979 which entered the heifer and tolly classification 12
months later, and shifting draft ~nd milking animals from first herd to~
subherds at the designated times.
Entry-exit allocation over time proceeded on the principle that any
reported herd entry or exit had an equal probability of occurring in any
of the 15 months, except sales and deaths. These two latter categories
make up the bulk of herd inventory changes and were assigned the proba-
bility distrihutions given in Table B.l.
Since date-of-sale data were not collected, the cattle sales distri-
but ion is the average monthly throughput at the Botswana Meat Commission
(BMC) originating from cooperatives, 1972-1979. 1 Cooperative sales are
lIain MacDonald, A Handbook of Livestock Statistics: Botswana,section 5 (draft, 1980).
J
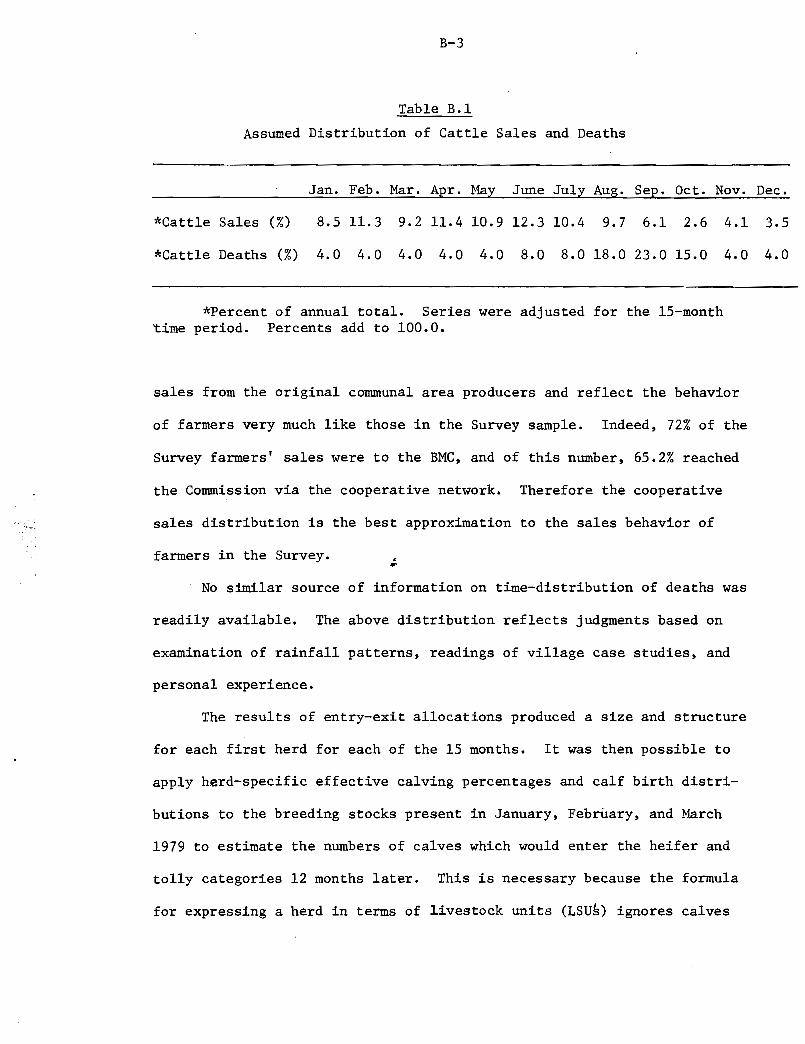
B-3
Table B.l
Assumed Distribution of Cattle Sales and Deaths
Jan. Feb. Mar. Apr. May June July Aug. Sep. Oct. Nov. Dec.
*Cattle Sales (%) 8.5 11.3 9.2 11.4 10.9 12.3 10.4 9.7 6.1 2.6 4.1 3.5
*Cattle Deaths (%) 4.0 4.0 4.0 4.0 4.0 8.0 8.0 18.0 23.0 15.0 4.0 4.0
*Percent of annual total. Series were adjusted for the 1S-month~ime period. Percents add to 100.0.
sales from the original communal area producers and reflect the behavior
of farmers very much like those in the Survey sample. Indeed, 72% of the
Survey farmers' sales were to the BMC, and of this number, 65.2% reached
the Commission via the cooperative network. Therefore the cooperative
sales distribution is the best approximation to the sales behavior of
farmers in the Survey.
No similar source of information on time-distribution of deaths was
readily available. The above distribution reflects judgments based on
examination of rainfall patterns, readings of village case studies, and
personal experience.
The results of entry-exit allocations produced a size and structure
for each first herd for each of the 15 months. It was then possible to
apply herd-specific effective calving percentages and calf birth distri-
butions to the breeding stocks present in January, February, and March
1979 to estimate the numbers of calves which would enter the heifer and
to1ly categories 12 months later. This is necessary because the formula
for expressing a herd in terms of livestock units (LSUS) ignores calves

B-4
but counts heifers and tollies at 0.5 LSU each. These additional animals
must be taken account of in expressing January, February, and March 1980
herds in LSU§. That is, these animals were present in the herds in 1979
as calves, but were recognized as part of the herd in 1980 in terms of
livestock units.
The third aspect of Step I was determining LSU values for the sub-
herds. These subherds represent removal of some animals from the farmer's
first herd for use at another location, most often for milking or plowing
at the lands. It was important to recognize these subdivisions because
the subherds frequently use a different set of water points during the
months they are away from the first herds.
In the end, Step I produced a livestock unit value for every herd
and subherd for every month between January 1979 and March 1980.
Step II
Monthly livestock unit values were matched with the water points each
farmer reported using in that month. Most farmers used only one water
point in a given month and therefore the total LSU value of the herd was
assigned to that water point. However, in 9.7% of the user-months farmers
used two water points, and in an additional 2.5% of the user-months
farmers used three or-more water points. In these cases the LSU value
of the farmer's herd was divided up among all the water points he used in
that month. If the water points were equidistant from the farmer's kraal,
then the LSU value was apportioned equally. If the water points were not
equidistant, then the LSU value was allocated according to a geometric
decay function. At this level of information it is assumed that, other
things being equal, in a situation of using two or more water points,

B-5
the more distant water point gets used less.
After completing these allocations, Livestock Units were summed for
each water point for each month it was in use. The unit of analysis has
now become the water point-month.
Step III
The next step was to jump from sample herds to the area herd in each
of the 12 in order to get an accurate idea of total cattle usage of water
points within each area. Since sample herds were randomly selected, and
the total number of farmer-households within each area was known, the total
cattle
sample
population of each area (C ) is a simple function of survey areap
herd size (C ), number of cattle-holding households in the samples
(H ), and total number of cattle-holding households in the area (H ):s p
C = {C • H ) / HP s P s
Area total herd sizes can then be used to estimate water point us-
age by the cattle
water point-month
population (W),P
(W ) obtained ins
using the LSU utilization figures per
Step II above. However, this would
assume that all area cattle used just the water points used by sample
farmers and no others. This is not the case. W was therefore weightedp
by the ratio of the number of water points of given physical type used by
sample farmers (N ) to the total number of water points of that physicals
type in the area (N ).P
w = [(Cp
• w )/ C ] • (N / N )P s ssp
The weighting procedure prevents overestimation of water point cattle
populations. It also assumes that the otherwise overestimated fraction
of the particular water point cattle po~ulation properly belongs at
another water point of the same physical type. On a month-to-month basis

~6
this does not seem to be an unrealistic assumption.
Values appearing in the first equation are shown in Table B.2.
The second equation was used with values for 67 different combinations
of the 12 survey areas and the physical types of water point found in
each place. It yielded LSU values for the population of cattle using
each water point each month from January 1979 to March 1980.
Step IV
The final step is to convert tIle population Livestock Units pre-
sumed present at each water point each month to liters of water consumed
each day of that month. The conversion is carried out by expressing
liters of water consumed as a function of mean monthly temperature and
the composition of the survey area herd in that month. That is, cattle
drink more when it is hot. Milch cows drink more than other cows and
heifers. Hence herd water consumption will be highest when it is hottest
and cows are calving, i.e., during the months of November, December, and
January.
The assumption underlying this approach is that cattle are always
able to drink as much as they wish, whenever they wish, at the particular
water point. This assumption may be true when cattle have unrestricted
access to natural water points such as rivers, pans, and springs. However,
in the majority of cases the Gaily water intake of cattle is restricted
in timing, and during especially water-short periods, in quantity as well.
Therefore, these water consumption estimates represent the amount of water
which should be produced by the water point for optimal growth of the
cattle population using it. This estimate is more useful for planning

Table B.2
Cattle Holders and Cattle Held: Survey Sample and Population Estimates
Cattle-Holding Cattle-Holding Total Cattle Total CattleHouseholds Households Held (LSD) Held (LSD)
Survey Area (sample) (population) (sample) (population)
Makaleng 20 122 239 1,458
Phokoje 27 86 649 2,067
Motongolong 20 28* 828 1,175
Ramokgonami 22 32!l 500 7,318
Mosolotshane 22 86 555 2,170tJ:I
Mmaphashalala 16 66 746 3,077 I"'-J
Dikgonnye 27 82 649 1,971
Matebele 8 21 78 205
Lentsweletau 18 153 299 2,542
Gamodubu 23 109 278 1,317
Ntlhantlhe 18 90 372 1,860
Mokatako 23 100* 509 2,213
*Based on best estimates of total number of occupied dwelling units.

B-3
purposes than the actual consumption of water in a particular year would
be. Ready availability of adequate water is one of the basic features
of the "reasonably acceptable" standard o.f beef cattle management recom
mended by the Ministry of Agriculture's Animal Production Research Unit. 2
Since no studies of cattle daily water intake have been carried
out in Botswana, data developed in the United States on the temperature
3water intake relationsh~p were used. These are graphed in Figure B.l
for the four classes of cattle which correspond to animal types reported
in the field surveys. Calves are excluded; tollies and oxen fall in the
graphed category "80011 Growing Cattle." The four classes are thus com-
ponents of the livestock unit calculation formula and therefore the rela-
tionship is between mean daily temperature and daily water consumption
in liters per LSU. Table B.3 shows interpolated values over the range of
temperatures found within the survey area .
.;.Table B.4 shows temperature data for five points within the Water
Points Survey study area. These were computed from mean monthly maxima
and minima based on records for the 19-29 years preceding 1962. 4 Each of
the 12 survey areas is assigned to the nearest temperature recording
station.
2Ministry of Agriculture, Animal Production Research Unit, Livestockand Range Research in Botswana--1978, pp. 18 ff.
3D• G. Fox and O. E. Olson, "Water Requirements for Beef Cattle,"Fact Sheet 111090, Cornell Beef Production Reference Manual, Animal ScienceDepartment, Cornell University, Ithaca, N.Y., 1979.
4M. G. Bawden and A. R. Stobbs, The Land Resources of Eastern Bech-uanaland (Surrey, England: Department of Technical Cooperation, Directorate of Overseas Surveys, 1963), Appendix II, Table B, "Mean Temperaturein Degrees Centigrade--Monthly Values."

Table B.3
Temperature Ranges for One-Liter Increments of Water Consumption by Beef Cattle
Milch Cows Other Cows and Heifers Bulls 800# Growing Cattle
°c Liters 0(3 Liters °c Liters °c Liters
26.1 66 26.2 38 26.4 50 26.4 3825.4 65 25.2 37 25.6 49 25.2 3722.8 64 24.6 36 25.0 48 23.6 3621.4 63 23.8 35 24.2 47 22.2 3520.0 62 23.0 34 23.5 46 20.7 3419.5 61 21.8 33 22.8 45 19.3 3318.9 60 20.2 32 1.1. 21.4 44 18.0 3218.3 59 19.2 31 20.0 43 16.8 3117 .8 58 18.0 30 19.5 42 15.7 30 b::l17.1 57 16.8 29 18.9 41 14.5 29 I
'"16.3 56 15.7 28 18.3 40 13.4 2815.5 55 14.5 27 17.8 39 12.3 2714.9 54 13.4 26 16.7 38 11.114.2 53 12.2 25 15.7 3713.4 52 11.1 14.7 3612.7 51 13.7 3512.0 50 13.5 3411.3 12.5 33
11.4

Table B.4
Mean Monthly Temperatures (Oe.)
Recording Stationsand Survey Areas J F M A M J J A S 0 N D
Francistown 26.0 25.3 23.7 21.0 16.5 13.1 13.1 15.8 20.1 24.2 25.3 25.9Maka1engPhokojeMotongo1ang
Pa1apye 25.2 22.0 23.1 19.9 16.2 13.2 12.8 15.5 19.8 23.3 24.8 25.1Ramokgonamu ,\
t:l:l
Maha1apye 25.3 24.7 23.0 20.4 16.4 13.2 13.1 16.1 20.2 23.9 24.7 25.2 I.....
Moso1tshane':)
Mmaphasha1a1a
Gaborone 25.1 24.6 22.8 19.6 15.2 12.1 12.0 14.7 18.9 22.9 23.9 24.6DikgonnyeMatebe1eLentswe1etauGamodubu
Ranye 23.6 22.6 iLl 18.4 15.4 12.4 12.3 14.8 18.3 22.0 22.2 23.4Nt1hant1heMokatako
B-II
The data in Tables B.3 and B.4 were used to construct tables of
daily water intake by month by class of animal for each of the five
groups of survey areas. Month-by-month changes in relative proportions
of each animal class in each survey area herd were then used to produce
the weighted average daily LSU water consumption per month for each
survey area. This set of values was combined with the values for LSUs
present at each water point each month to convert them to liters of
water consumed at each water point each month.

C-l
Appendix C: Water Use Fees Charged in Eastern Botswana
The following list contains data gathered by the Water Points
Survey on water use fees charged at a sample of 78 dams, hafir-dams,
hafirs, boreholes, and open wells in the communal areas of eas~ern
Botswana. Privately owned water points, primarily hafirs, which serve
only the owner's needs have been excluded. Certain terms are used in
the list:
\I\
)
"beast"
"smallstock"
"hhd."
"drum"
"hand-pumped"
"equipped"
"*"
= a single adult bovine
= a single adult or juvenile goat orsheep
= household
= a 200 liter steel drum
= appears in the name of a borehole soequipped; all other boreholes operatewith an engine and pump
= appears in the name of an open wellequipped with an engine and pump;all other open wells feature a reel,chain, and bucket
= dams constructed by the Small Dam Unit
Respondents stated fees in terms of (1) in-kind payments per herd
per year or multiple years, or (2) in terms of cash payments per herd or
per animal per day" month, or year. In most cases the level of payment
per herd did not vary with herd size. In the following paragraphs the
plethora of fee structures have been partially consolidated:
cash per household per year or cash per drum for domestic water, and cash
per animal per year for smallstock and cattle.
A warning: These formally stated fee structures do not mean that
these amounts were actually collected from every water user during the

C-2
last one or two years. Actual fees collected often vary with the rela
tionship between payer and payee and the urgency with which funds are
needed to keep the water point operating.
Dams, Hafir-Dams, and Hafirs
Of the 36 dams, hafir-dams, and hafirs for which fee data will be
found in the list, 22 (61%) charge no fees (though three of these require
group members to contribute labor), and ten (28%) have some kind of pay
ment for water. InformatiQn is still being compiled on the other four.
Of the ten with water payments, three involve users sharing the costs
of construction, or contributing labor to main the fence or to desilt, one
involves payment with cattle (one heifer or tolly per two years of use),
and the remaining six have cash payments.
Domestic~-25t!drwa (N = 1) and an average of P 2.55!household!year,
ranging from P 1.00 to P 6.00 (N~ 4). Nongroup members at group-managed
water points pay the most for domestic water in this sample.
Smallstock--lt!4 smallstock!day (nonmembers at one group-managed
hafir-dam).
Cattle--72t!beast!year '(members at one group-managed hafir-dam)
P 3.65!beast!year (nonmembers at one group-managed hafir-dam).
Some group-managed water points exclude nonmembers altogether; others
appear to achieve the same result by charging relatively high prices.
Boreholes
All the owners of the 19 boreholes examined charge fees. Three of
these boreholes supply water exclusively for domestic use, while the rest
meet a mixture of demands for water for smallstock, cattle, and domestic
C-3
needs.
Domestic--P S.2S/household/year on average, ranging from P 1.00 to
P 12.00 (N = 6). Water by the drum averages 27t, with a range of St to
SOt (N = S).
Smallstock--2 head of smallstock/herd/year (N = 1); SOt/herd/year
(N = 1); and cash payments which average 97t/smallstock/year (range 2St
to P 2.40, N ~ 8).
Cattle--l heifer/herd/year (N = 1), 1 beast/herd/2 years (N = 1);
an average of P 3S/herd/year (N = 3); per capita cash payment which aver
ages P 3.8S/beast/year, with a range of 60t to P 7.20 (N = IS). These
calculations exclude one Council borehole at MOsolotshane where cattle
watering is being discouraged with a fee equivalent to P l8.2S/beast/year.
Open Wells
SiK owners among the 2SP
owners of open wells in the sample do not
charge fees, and of the remaining 19, six share costs among users, and
13 charge fees:
Domestic--P 1.00/household/year (N = 1), with one hand-pump equipped
open well having an annual charge of P 6.00. Water by the drum averages
23t (N = S).
Smallstock--l goat/herd/year (N = 1); P 1.20/smallstock/year (N m 1).
Cattle--l heifer/herd/4 years, 1 beast/herd/6 years, 1 heifer .or
tolly/herds larger than 90-100 head/2 years, 2 beasts/herds larger than
100 head/year, 1 beast/herds smaller than 100 head/year, 1 heifer or
tolly/herd/2 years, 1 beast/herd/2 years; P lS.OO/herds less than 90-100
head/year (N = 1 for all the preceding). Cash payments average P 2.76/
beast/year, ranging from P 2.40 to P 3.60 (N = 4).

C-4
Comment
It appears that fees for domestic water are highest at boreholes,
followed by dams and hafir-dams, and then by open wells. This is true for
payments both by the household and by the drum. The fee ranking for
sma11stock is unclear. Cattle watering fees are highest at boreholes,
followed by open wells, and then dams and hafir-dams.
Study Manage- WPSArea ment No. Name Fees ChargedCode Code
DAMS, HAFIR-DAMS , AND HAFIRS
11 4 101 Regimental Dam None11 1 301 Bosudi Hafir None11 4 302 Toteng Hafir None21 2 101 Sinombe's Dam None21 1 Mambo Hafir None23 3 201 Lekurwana Hafir Dam* None, nonmembers
excluded23 3 202 Radithota.(Gwaike1wa) Hafir-Dam None, nonmembers.,
excluded23 3 203 °Uinokana Hafir-Dam* Members: None, non-
members domestic useonly: 2St/drum (limit1 drum per day) SOt/month (buckets only)
23 3 204 Sekerepa Hafir-Dam* Members: DomesticP 1.20/hhd./year,cattle 72t/beast/year plus contribu-ted labor
Nonmembers: DomesticP 2.00/hhd./year,smallstock 1t/4head/day, cattlelti/beast/day
23 4 101 Igo1e (Ipe1egeng) Dam None23 2 206 Orabi1e's Hafir-Dam Users help with de-
silting and fencemaintenance
24 2 101 Dennison's Dam Fence maintenance24 2 301 Pha1apye Hafir 1 heifer or to11y/
2 years; larger herdowners pay withlarger heifersor to11ies
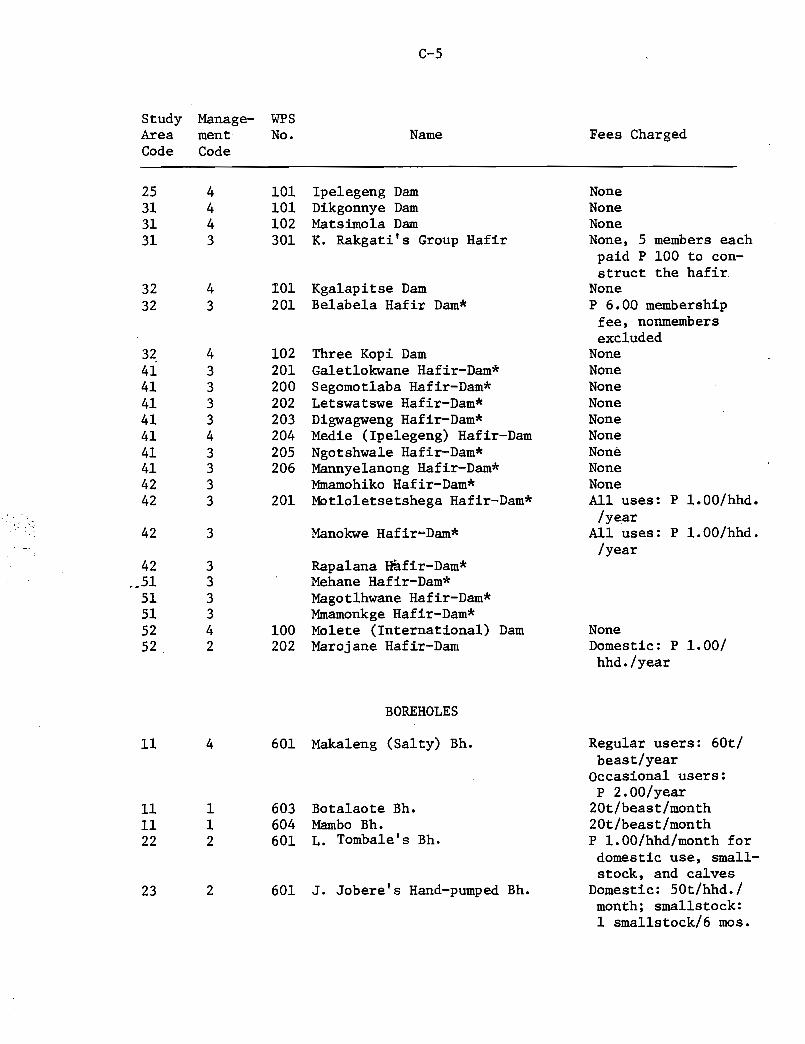
StudyAreaCode
25313131
3232
32414141414141414242
42
42.,51
51515252
11
111122
23
ManagementCode
4443
43
4333343333
3
333342
4
112
2
C-5
WPSNo. Name
101 Ipe1egeng Dam101 Dikgonnye Dam102 Matsimo1a Dam301 K. Rakgati's Group Hafir
101 Kga1apitse Dam201 Be1abe1a Hafir Dam*
102 Three Kopi Dam201 Ga1et1okwane Hafir-Dam*200 Segomot1aba Hafir-Dam*202 Letswatswe Hafir-Dam*203 D1gwagweng Hafir-Dam*204 Medie (Ipe1egeng) Hafir-Dam205 Ngotshwa1e Hafir-Dam*206 Mannye1anong Hafir-Dam*
Mmamohiko Hafir-Dam*201 MOt101etsetshega Hafir-Dam*
Manokwe Haf1r~Dam*
Rapa1ana Hafir-Dam*Mehane Hafir-Dam*Magot1hwane Hafir-Dam*Mmamonkge Hafir-Dam*
100 Mo1ete (International) Dam202 Marojane Hafir-Dam
BOREHOLES
601 Maka1eng (Salty) Bh.
603 Bota1aote Bh.604 Mambo Bh.601 L. Tomba1e's Bh.
601 J. Jobere's Hand-pumped Bh.
Fees Charged
NoneNoneNoneNone, 5 members eachpaid P 100 to construct the hafir
NoneP 6.00 membership
fee, nonmembersexcluded
NoneNoneNoneNoneNoneNoneNoneNoneNoneAll uses: P 1.00/hhd.
/yearAll uses: P 1.00/hhd.
/year
NoneDomestic: P 1.00/hhd./year
Regular users: 60t/beast/year
Occasional users:P 2.00/year
20t/beast/month20t/beast/monthP 1.00/hhd/month for
domestic use, sma11stock, and calves
Domestic: 50t/hhd./month; sma11stock:1 smal1stock/6 mos.

C-6
Study Manage- WPSArea ment No. Name Fees ChargedCode Code
Draft oxen: P 2.00for season, Cattle1 heifer/year, orP 50.00/year
23 2 602 M. Seshaba's Hand-pumped Bh. 1 beast/2 years24 1 601 Council Bh. 5t/beast/day25 2 601 R. Tse1ayabone's Bh. Domestic: 50t/hhd./
monthSma11stock: 50t/year,Cattle: P 42.00/year
25 1 602 Council Bh. 5t/drum31 3 601 Diphage (Mmamakgoro) Bh. Members: P 5.00/year
+ assessmentsNonmembers: 20t/drum,
30t/beast/month, lOtIsma11stock/month
31 2 602 Gabosiane1we's Bh. 10t/sma11stock/month50t/beast/month25t/ca1f/month
32 2 601 Mot1hat1hedi's Bh. 20t/sma11stock/month40t/beast/month
41 1 601 Council Bh. 5t/sma11stock/month20t/beast/month5t/ca1f/month
42 1 601 Mot1at1awe's Bh. Domestic: P 3.00/hhd.;. /year
Sma11stock: 50t/sma11stock/yearCattle: P 2.00/beast/year; 50t/calf/year
52 3 601 Gakikana Bh. Members: P 30.00 onetime subscription,30t/beast/year
Nonmembers: Domestic40t/drum (harvestseason only), 5t/bucket, 15t/beast/month, 7 smallstock~counted as 1 beast
52 3 602 Freestaat Bh. Members: P 10-20/yearNonmembers: Domestic
20t/drum, 60t/beast/month includingcalves, donkeys, 7sma11stock count as1 beast
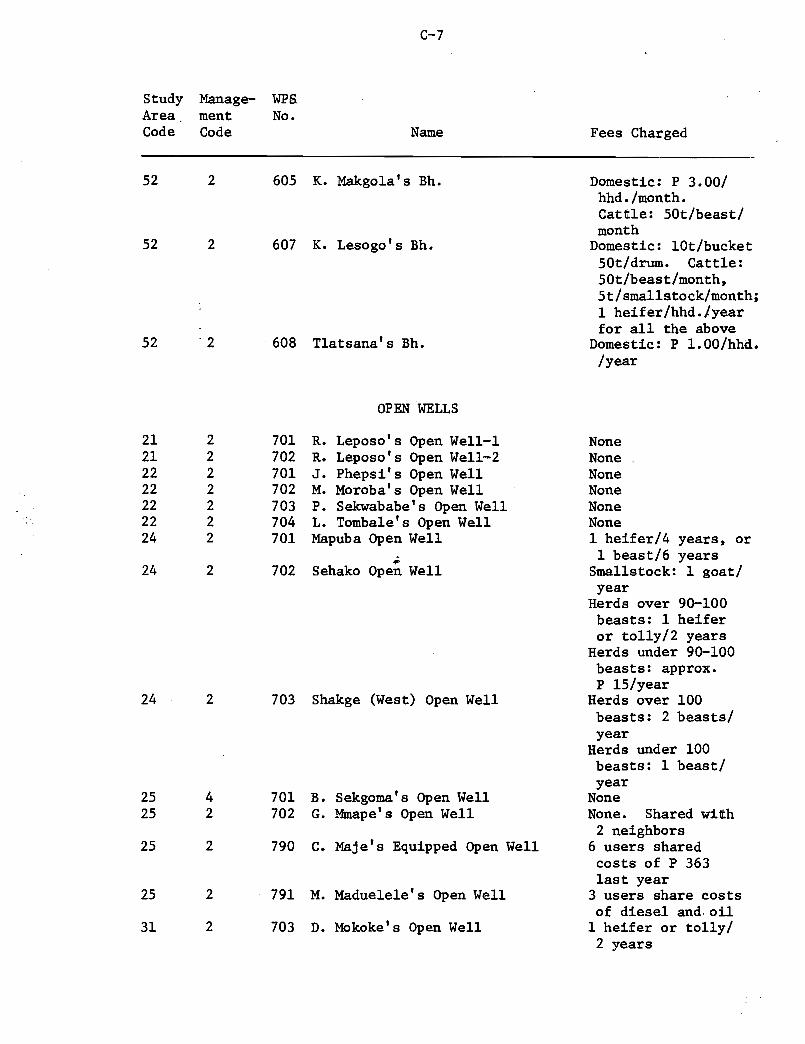
C-7
Study Manage- wps.Area ment No.Code Code Name Fees Charged
52 2 605 K. Makgola's Bh. Domestic: P 3.00/hhd./month.Cattle: 50t/beast/month
52 2 607 K. Lesogo's Bh. Domestic: lOt/bucket50t/drum. Cattle:50t/beast/month,5t/smallstock/month;1 heifer/hhd./yearfor all the above
52 '2 608 Tlatsana's Bh. Domestic: P 1.00/hhd./year
OPEN WELLS
21 2 701 R. Leposo's Open Well-l None21 2 702 R. Leposo's Open Well-2 None22 2 701 J. Phepsi's Open Well None22 2 702 M. Moroba's Open Well None22 2 703 P. Sekwababe's Open Well None22 2 704 L. Tombale's Open Well None24 2 701 Mapuba Open Well 1 heifer/4 years, or
.;. 1 beast/6 years24 2 702 Sehako Open Well Smallstock: 1 goat/
yearHerds over 90-100beasts: 1 heiferor tolly/2 years
Herds under 90-100beasts: approx.P l5/year
24 2 703 Shakge (West) Open Well Herds over 100beasts: 2 beasts/year
Herds under 100beasts: 1 beast/year
25 4 701 B. Sekgoma's Open Well None25 2 702 G. Mmape's Open Well None. Shared with
2 neighbors25 2 790 C. Maje's Equipped Open Well 6 users shared
costs of P 363last year
25 2 791 M. Maduelele's Open Well 3 users share costsof diesel and. oil
31 2 703 D. Mokoke's Open Well 1 heifer or tolly/2 years
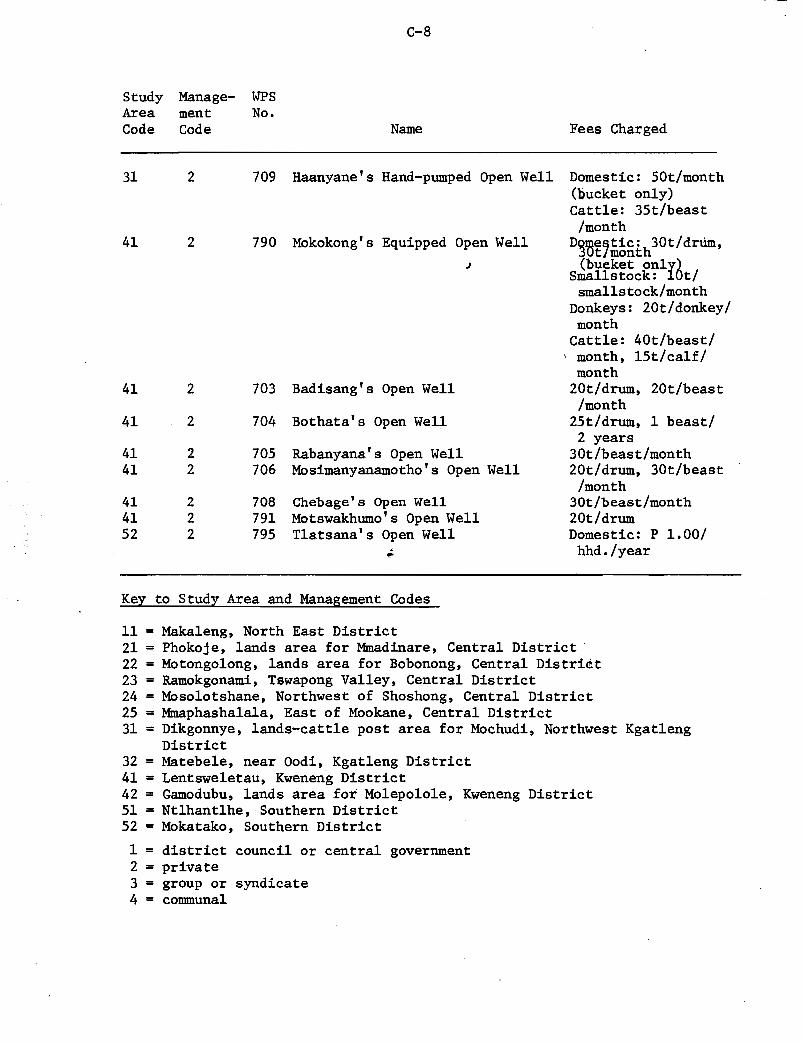
StudyAreaCode
31
41
41
41
4141
414152
ManagementCode
2
2
2
2
22
222
WPSNo.
709
790
703
704
705706
708791795
C-8
Name
Haanyane's Hand-pumped Open Well
Mokokong's Equipped Open Well
J
Badisang's Open Well
Bothata's Open Well
Rabanyana's Open WellMosimanyanamotho's Open Well
Chebage's Open WellMotswakhumo's Open WellTlatsana's Open Well
Fees Charged
Domestic: SOt/month(bucket only)Cattle: 3St/beast
/monthDQme~tic:h30t/drUm,
Jut/mont(bueket only)
Smallstock: lOtismallstock/month
Donkeys: 20t/donkey/month
Cattle: 40t/beast/\ month, lSt/calf/
month20t/drum, 20t/beast
/month2St/drum, 1 beast/2 years
30t/beast/month20t/drum, 30t/beast
/month30t/beast/month20t/drumDomestic: P 1.00/hhd./year
Key to Study Area and Management Codes
= district= private= group or= communal

D-l
Appendix D: Derivation of SDU Costs in FY 1979
Notes for Table 17 in text:
Item 1: There are 11 P & P staff members in the SDU. Of these, 10 spent
all or portions of their time on managing dam construction.
Actual salaries and subsistence received by the 10 were furnished
by the SDU and appear in Table C-l along with their weights. Time
spent in overseeing Brigades dam work, meeting with dam groups,
dealing with the Water Appropriations Board, etc., has been
explicitly excluded.
Item 2: Pensions are calculated at 15% of the total salary attributable
to dam work.
Item 3: Actual aggregate expenditure. This includes overtime payments.
The figure was supplied by the SDU.
Item 4: Table D-2 shows the item-by-item disposition of heavy equipment
during the fiscal year. Up until the end of 1979, this equipment
was divided among four units located in Serowe, Tswapong, Kweneng,
and South East. It is now being consolidated into two units in
Kweneng and Southern Districts. This information comes from
personal recollections of senior SDU staff.
Table D-3 is the immediate source of the Interest and
Depreciation and the Fuel and Maintenance figures in Table 17 in
the text. Interest and depreciation represent the cost of owner-
ship, and this applies whether the machine is in use, idle, or
under repair. The column "Hrs./Yr." shows the number of hours
each type of equipment may be used during a year. The next column
to the right shows hourly rates for interest and depreciation used

n-2
by C.T.O. in mid-June 1979. The product of hours per year that
the machinery is not loaned out and the hourly rates gives total
interest and depreciation for the equipment.
Similarly, the product of "Hours Worked for snu" and "Fue1
& Maintenance Costs/Hr. 11 is the total expenditure on each piece
of equipment to make it run and build dams. "Hours Worked for
snu," again, is the product of the percentage of total working days
"Available for Work" (Table n-2) and IILife Expectancy, Hrs./Yr. 1I
(Table n-3).
Item 5: Table n-4 shows the line items under this heading, and actual
expenditures. The service life for each item is derived from the
gnu Project Memorandum (AG 09), estimates by Mettrick, and personal
judgment.
Items 6 These line items and expenditures were provided by the snu.to 11:
Fifty percent of total expenditure on total IItrave1ing and trans-
pore' has been attributed to dam construction. An additional
item, machinery, in the amount of P 175,472, was excluded from
these calculations because the equipment arrived too late in the
fiscal year to contribute noticeably to dam completions •.

D-3
Table D-1
SDU Professional Staff
% Time Spent on Total Amount Attribut-Person Sa1ary* Subsistence Dam Construction able to Dam Construction
(P) (P) (P)
1 4,992 1,827 60 4,091
2 4,200 182 60 2,629
3 3,720 418 94 3,890
4 3,920 59 100 3,979
5 3,420 2,325 100 5,745
6 3,420 2,322 100 5,742
7 3,960 147 100 4,107
8 4,200 427 100 4,627
9 1,920 614 40 1,014
10 2,740 30 100 2,770
11 1,008 0 100 1,008
34,080 39,602
.;
*Tota1 salary attributable to dam work = P 32,448.
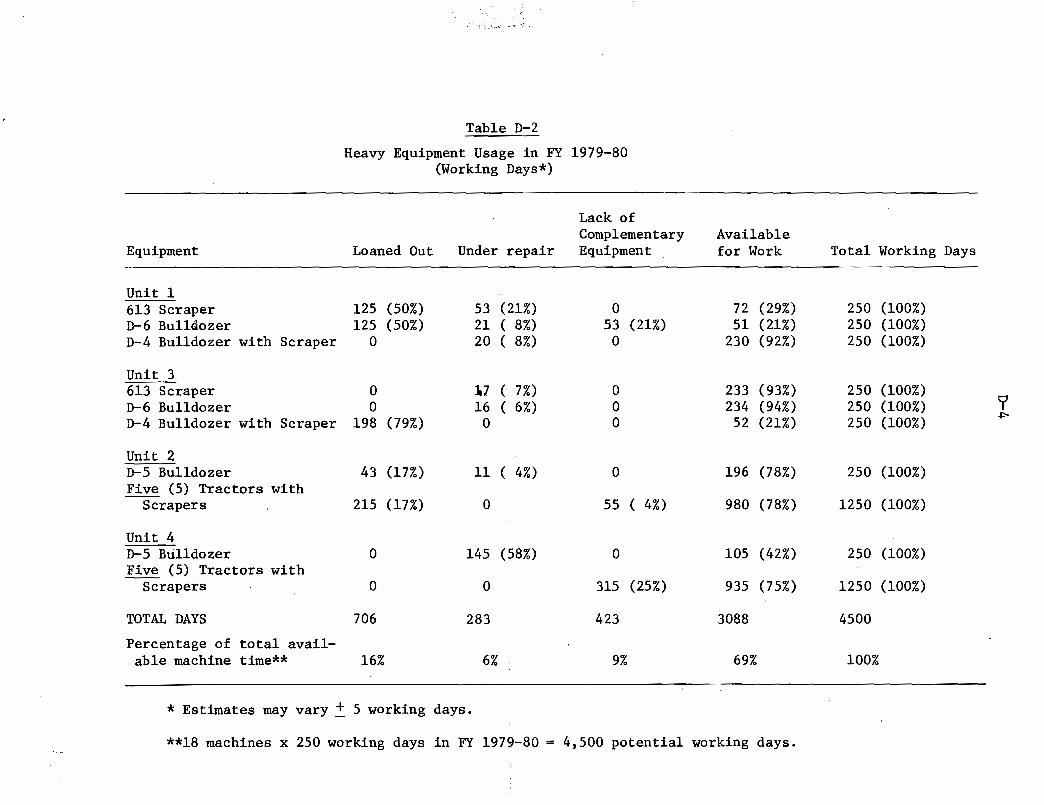
Table D-2
Heavy Equipment Usage in FY 1979-80(Working Days*)
Lack ofComplementary Available
Equipment Loaned Out Under repair Equipment for Work Total Working Days
Unit 1613 Scraper 125 (50%) 53 (21%) 0 72 (29%) 250 (100%)D-6 Bulldozer 125 (50%) 21 ( 8%) 53 (21%) 51 (21%) 250 (100%)D-4 Bulldozer with Scraper 0 20 ( 8%) 0 230 (92%) 250 (100%)
Unit 3613 Scraper 0 lJ7 ( 7%) 0 233 (93%) 250 (100%)D-6 Bulldozer 0 16 ( 6%) 0 234 (94%) 250 (100%) ?D-4 Bulldozer with Scraper 198 (79%) 0 0 52 (21%) 250 (100%)
~
Unit 2D-5 Bulldozer 43 (17%) 11 ( 4%) 0 196 (78%) 250 (100%)Five (5) Tractors with
Scrapers 215 (17%) 0 55 ( 4%) 980 (78%) 1250 (100%)
Unit 4D-5 Bulldozer 0 145 (58%) 0 105 (42%) 250 (100%)Five (5) Tractors with
Scrapers 0 0 315 (25%) 935 (75%) 1250 (100%)
TOTAL DAYS 706 283 423 3088 4500
Percentage of total avail-able machine time** 16% 6% 9% 69% 100%
* Estimates may vary ~ 5 working days.
**18 machines x 250 working days in FY 1979-80 = 4,500 potential working days.
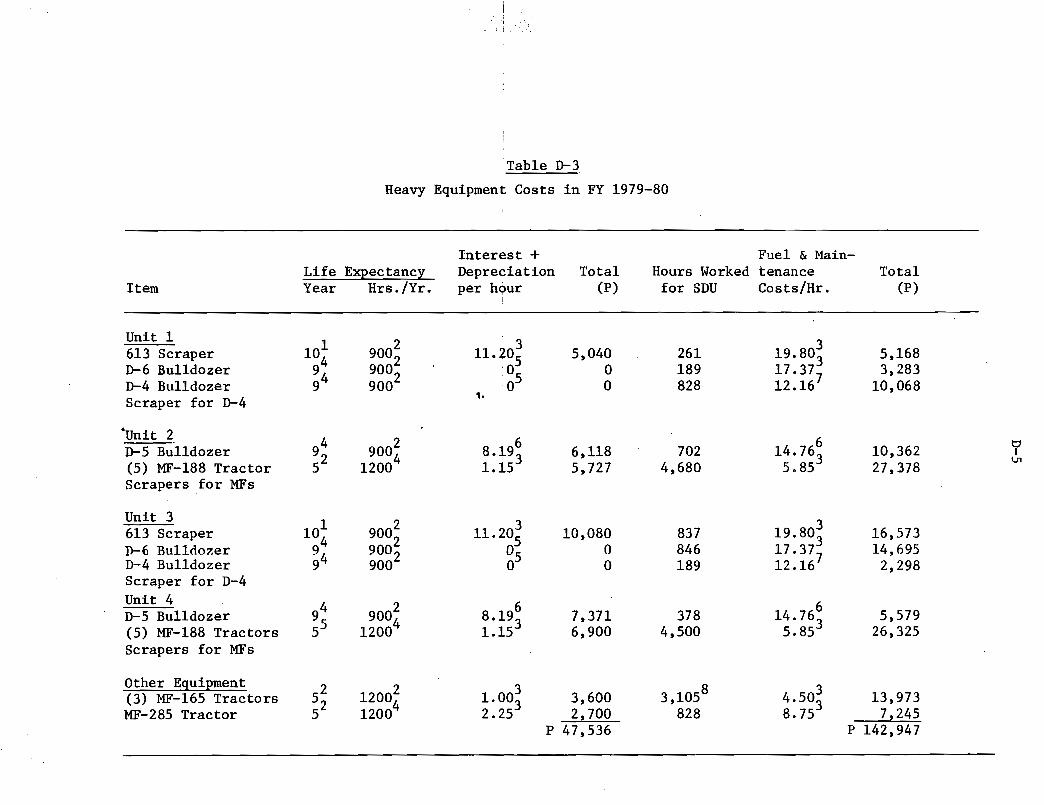
Table D-3
Heavy Equipment Costs in FY 1979-80
Interest + Fuel & Main-Life Expectancy Depreciation Total Hours Worked tenance Total
Item Year Hrs./Yr. per hQur (p) for SDU Costs/Hr. (P)I
Unit 1101 900
2 3 3613 Scraper 11. 205 5,040 261 19.803 5,168D-6 Bulldozer 94 9002 0 0 189 17.37
73,283
D-4 Bulldozer 94 9002 05 0 828 12.16 10,068Scraper for D-4
1.
'Unit 294 9002 6 6
D-5 Bulldozer 8.193 6,118 702 14.763 10,362 ?(5) MF-188 Tractor 52 12004 1.15 5,727 4,680 5.85 27,378
\JI
Scrapers for MFs
Unit 310
1900
2 3 3613 Scraper 11.20510,080 837 19.80
3 16,5734 9002D-6 Bu11do7.er 94 °5 0 846 17.37
714,695
D-4 Bulldozer 9 90020 0 189 12.16 2,298
Scraper for D-4Unit 4
94 9002 6 6D-5 Bulldozer 8.193 7,371 378 14.76
35,579
(5) MF-188 Tractors 55 12004 1.15 6,900 4,500 5.85 26,325Scrapers for MFs
Other Equipment52 1200~ 3 3,1058 3(3) MF-165 Tractors 1.003 3,600 4.503 13,973
MF-285 Tractor 52 1200 2.25 2,700 828 8.75 7,245p 47,536 P 142,947

D-6
Notes to Table D-3, Heavy Equipment Costs in FY 1979-80
1. Estimate from Small Dam Unit.
2. Estimate from N. C. Schultz, Senior Engineer (Maintenance),Roads Department.
3. Figures are from Central Transport Organization, "Vehic1e/Plant Operating Cost (Excluding Driver) ," 12 June 1979.
4. Figures are from Kampsax International A/S, "HighwayMaintenance Study--Fina1 Report, II vol. 1, Ministry of Works and Communications, May 1978, plate 9-05 and p. 130.
5. Fully depreciated.
6. 85% of the C.T.O. figure for the D-6 bulldozer.
7. 70% of the C.T.O. figure for the D-6 bulldozer.
8 Overall machine average availability was 68%, so this figurewas used to calculate hours worked for "Other Equipment."

i~' ,. c_: ";".,;.., ",::',7.;.-2 ...
Table D-4
Other Plant and Equipment
1 Service 2Expenditure Life Annual Annual 3
Item in FY 1979 (Years) Depreciation Interest Cost Total
Buildings 1,182.03 15 78.80 89.83 168.63
Furniture and Office Equipment 1,179.69 10 117.97 92.01 209.99
Field Radios 317.85 8 39.73 25.27 65.00
Technical Equipment 336.68 1. 5 67.34 28.28 95.62
Field Vehicle Equipment 931. 38 3 310.46 85.69 396.15 t::lI
Camping Equipment 2,302.39 3 767.46 211.82 979.28 -.....J
Equipment and Tools 1,170.91 5 234.18 87.12 331. 301,615.94 620.02 2,235.97
1. Figures provided by Small Dam Unit.
2. Straight line.
3. Calculated with the formula: I = rA [t + 1] + Sr2 t
Where I = annual interest cost, A = amount of investment to be amortized, t = total service life,r = interest rate (here 12%), and S = salvage value (here set at 10% of original cost~ This formulawas suggested by J. Litschauer, Division of Planning and Statistics, Ministry of Agriculture.
BEST AVA.lL4.SLE COpy


