20
Brightness of Horizontal (H5) and Vertical (H1) Cold Sources Ken Andersen
| Date post: | 16-Dec-2015 |
| Category: |
Documents |
| Upload: | renee-jans |
| View: | 213 times |
| Download: | 0 times |

Brightness of Horizontal (H5) and Vertical (H1) Cold
SourcesKen Andersen

1011
1012
1013
0 2 4 6 8 10 12
ILL Cold Source Brightnesses
HCS brightness (Ageron measured)
HCS brightness (Calzavara)
VCS Brightness (Ageron calculated)
VCS brightness (Calzavara)
Wavelength (Å)
H1
H5

Extract Brightness from Neutron Measurement Needs end-of-guide position with chopper and
TOF analysisReadily available on H1: Figaro, D17, PF1BNot so readily available on H5 (IN15?)
Propagate backwardsCorrect for attenuation through window
materials etc.Scale using Au-foil measurement
Use spectrum measured on Figaro (H172)

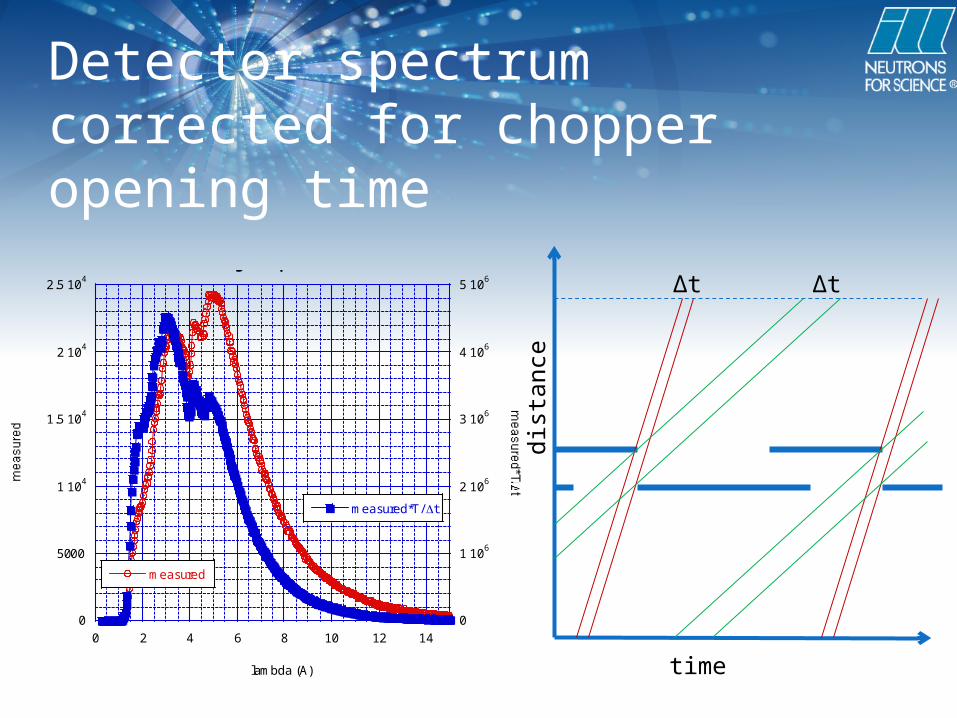
Detector spectrum corrected for chopper opening time
0
5000
1 104
1.5 104
2 104
2.5 104
0
1 106
2 106
3 106
4 106
5 106
0 2 4 6 8 10 12 14
Figaro spectrum
measured
measured*T/ t
lambda (A) time
dis
tan
ce
Δt Δt

Al Bragg edges measured on D17
0
0.2
0.4
0.6
0.8
1
0 5 10 15 20
Transmission of AG3 Aluminium on D17
75mm AG3 Al
50mm AG3 Al
wavelength (Å)
0.5
0.6
0.7
0.8
0.9
1
0 10 20 30 40 50 60 70 80
AG3 Aluminium Transmission on D17
Thickness of AG3 window (mm)
y = exp(-m1*x)
ErrorValue
8.2921e-50.0067182m1
NA4.5788e-5Chisq
NA0.99973R

0.5
0.6
0.7
0.8
0.9
1
0 10 20 30 40 50 60 70 80
AG3 Aluminium Transmission on D17
Thickness of AG3 window (mm)
y = exp(-m1*x)
ErrorValue
8.2921e-50.0067182m1
NA4.5788e-5Chisq
NA0.99973R
Al window transmission
2 106
2.5 106
3 106
3.5 106
4 106
4.5 106
5 106
2 2.5 3 3.5 4 4.5 5 5.5 6
Figaro spectrum
lambda (A)
T=0.875
⇒t=20mm
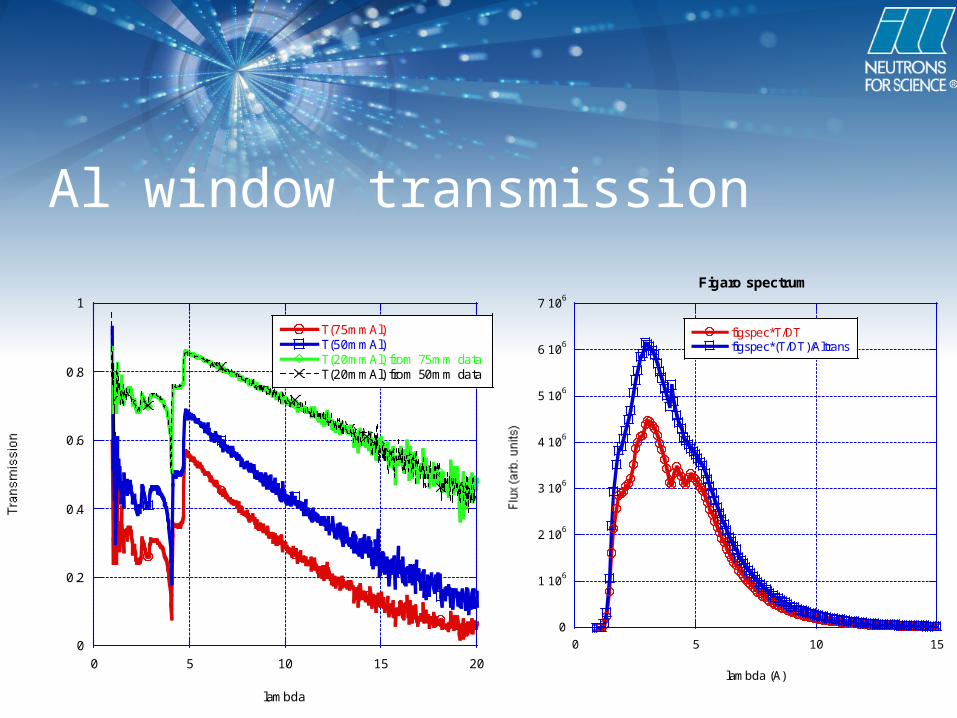
Al window transmission
0
0.2
0.4
0.6
0.8
1
0 5 10 15 20
Transmission of Al as a function of neutron wavelength
T(75mmAl)T(50mmAl)T(20mmAl) from 75mm dataT(20mmAl) from 50mm data
lambda
0
1 106
2 106
3 106
4 106
5 106
6 106
7 106
0 5 10 15
Figaro spectrum
figspec*T/DTfigspec*(T/DT)/Altrans
lambda (A)

Detector efficiency
lnePP )(0 1
82.0)Å8.1(
b5.4
30
Pp
mml Window thickness = 10mm- half of the total 20mm

Air attenuation
Ageron measurement at 60% humidity
50cm through air
75]Å[04.0]m[ 1
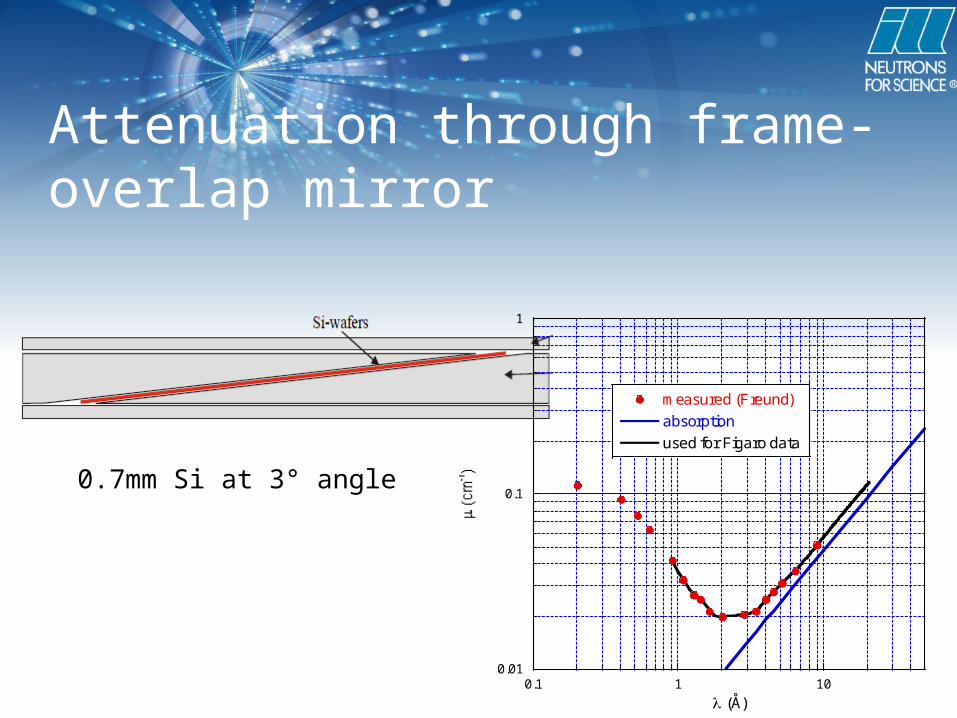
Attenuation through frame-overlap mirror
0.01
0.1
1
0.1 1 10
Inverse attenuation length of single-crystal Si at 300K
measured (Freund)
absorption
used for Figaro data
(Å)
0.7mm Si at 3° angle

Final corrected spectrum
0
1 106
2 106
3 106
4 106
5 106
6 106
7 106
0 5 10 15
Figaro spectrum
figspec*T/DTfigspec*(T/DT)/Altransfigspec*(T/DT)/Altrans/deteff/airtrans/Sitrans
lambda (A)
Flux (
arb
. u
nit
s)
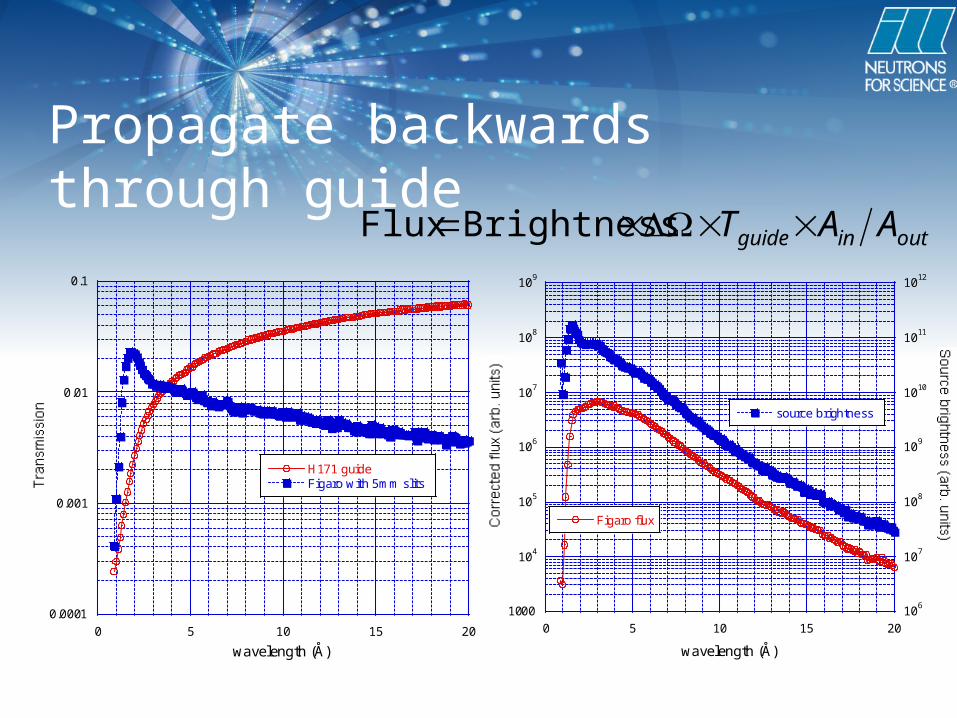
Propagate backwards through guide
0.0001
0.001
0.01
0.1
0 5 10 15 20
Guide transmission
H171 guideFigaro with 5mm slits
wavelength (Å)
1000
104
105
106
107
108
109
106
107
108
109
1010
1011
1012
0 5 10 15 20
Figaro flux
source brightness
wavelength (Å)
outinguide AAT BrightnessFlux
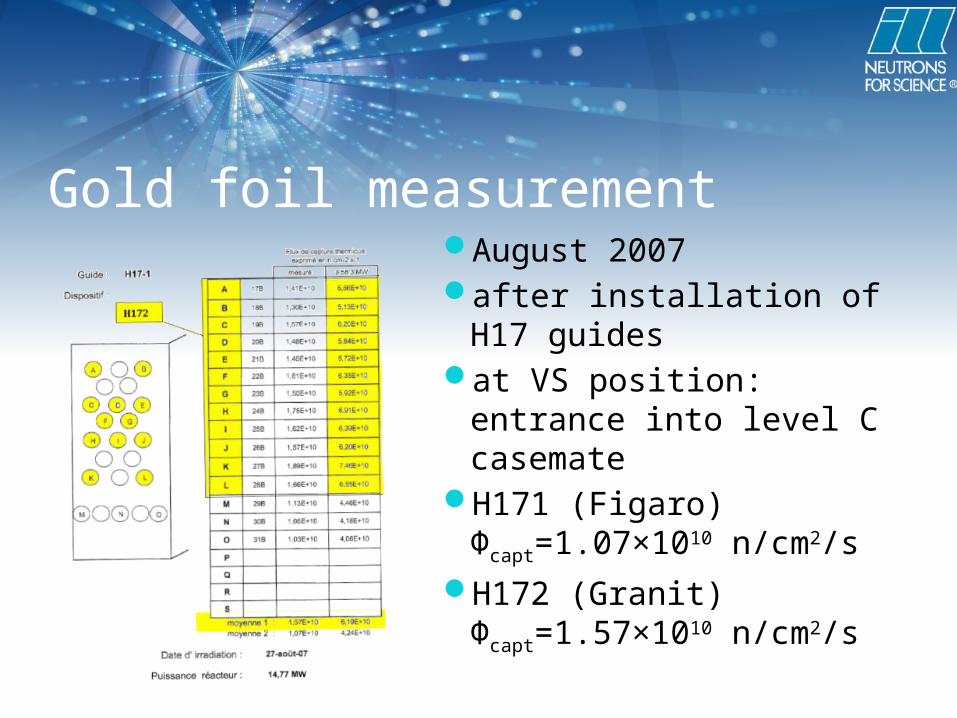
Gold foil measurementAugust 2007after installation of H17
guidesat VS position: entrance
into level C casemateH171 (Figaro)
Φcapt=1.07×10¹⁰ n/cm2/sH172 (Granit)
Φcapt=1.57×10¹⁰ n/cm2/s
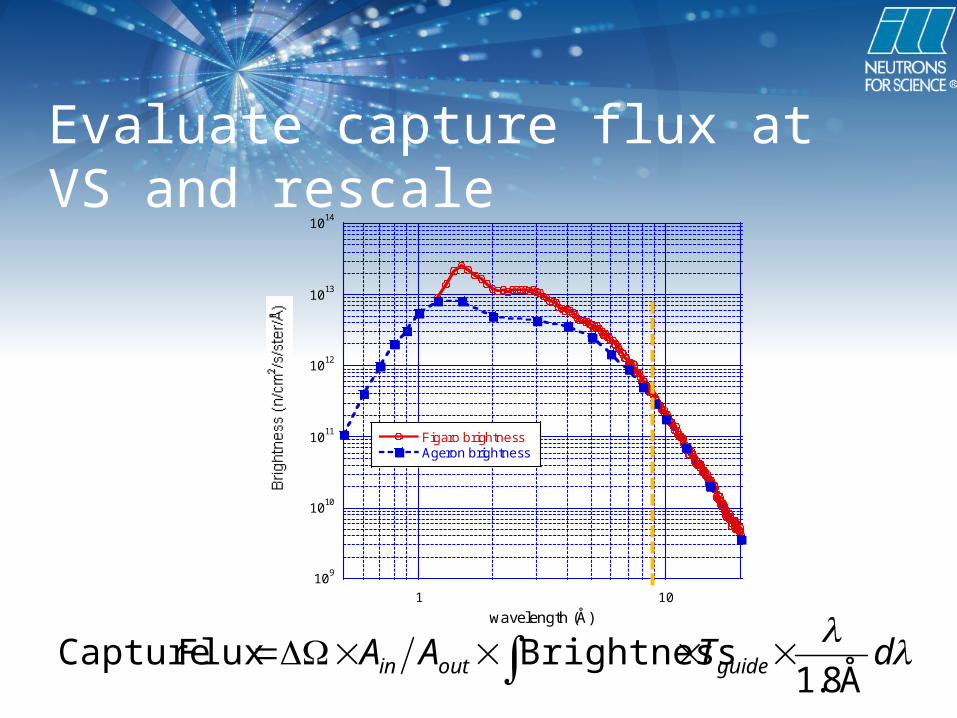
Evaluate capture flux at VS and rescale
dTAA guideoutin Å8.1
BrightnessFlux Capture
109
1010
1011
1012
1013
1014
1 10
Cold Source Brightness
Figaro brightnessAgeron brightness
wavelength (Å)

Comparison of capture fluxes
Capture Flux(n/cm2/s)
Measured Calculated from Ageron
Present calculation
H171 (Figaro) VS 4.24×10¹⁰
August 20072.88×1010 (4.24×10¹⁰)
H172 (Granit) VS 6.19×10¹⁰
August 20074.03×1010 5.98×10¹⁰
H172 (Granit) mono 4.4-4.8×10¹⁰
April 20083.20×1010 4.63×10¹⁰
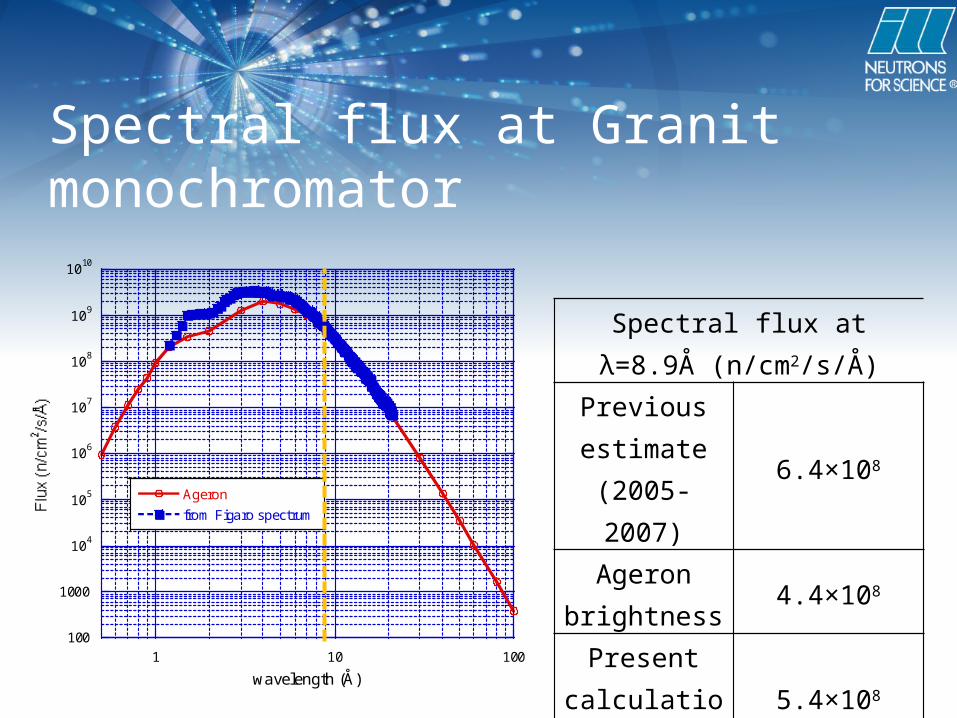
Spectral flux at Granit monochromator
100
1000
104
105
106
107
108
109
1010
1 10 100
Flux at H172 Granit monochromator
Ageron
from Figaro spectrum
wavelength (Å)
Spectral flux at λ=8.9Å (n/cm2/s/Å)
Previous estimate
(2005-2007)6.4×10⁸
Ageron brightness 4.4×10⁸
Present calculation 5.4×10⁸

Brightnesses of HCS & VCS
1011
1012
1013
0 2 4 6 8 10 12
ILL Cold Source Brightnesses
HCS brightness (Ageron measured)HCS brightness (Calzavara)VCS Brightness (Ageron calculated)VCS brightness (Calzavara)VCS brightness (Figaro)
Wavelength (Å)
SummaryPrevious estimate of 8.9Å flux at Granit was
about rightAgeron VCS brightness is slightly low
needs 50% readjustment in the 1.5-4Å rangeneeds 20% readjustment around 9Å
HCS and VCS brightnesses are probably about the same (within 30%)
![Introduction - Georgia Institute of Technologypeople.math.gatech.edu/~mbaker/pdf/hyperelliptic.pdf[Bak07].) We then prove that the graph-theoretic analogues of conditions (H1)-(H5)](https://static.documents.pub/doc/80x56/6120a77349a9ac16e110ba13/introduction-georgia-institute-of-mbakerpdfhyperellipticpdf-bak07-we-then.jpg)


![M 25 E Zwoelfseiter 17.06.14 09:27 Seite 1 M25E · Turbocharger nozzle position 0° Turbocharger at driving end [Dimensions (mm)] Engine L1 L2 L3 L4 H1 H2 H3 H4 W1 W2 L1° H1° H5](https://static.documents.pub/doc/80x56/5f928e77900ac65f4f38b3af/m-25-e-zwoelfseiter-170614-0927-seite-1-m25e-turbocharger-nozzle-position-0.jpg)


