117
Kenn Sou 201 Apri necott Uta uth Faci 10 Rem il 2011 h Copper | ilities G edial Pr | Environm Groundw rogress mental Rest water Report toration Group

Kenn
Sou
201
Apri
necott Uta
uth Faci
10 Rem
il 2011
h Copper |
ilities G
edial Pr
| Environm
Groundw
rogress
mental Rest
water
Report
toration G
roup

Kennecott Utah Copper | Environmental Restoration Group
South Facilities Groundwater April 2011 2010 Remedial Progress Report Page i
Contents
1. Introduction ................................................................................................... 1-1 2. Remedial Operations ..................................................................................... 2-1
2.1 Groundwater Remediation System ........................................................... 2-1 2.2 Extraction and Treatment ......................................................................... 2-1
3. Compliance with Performance Standards and Monitoring Requirements ... 3-1 3.1 Performance Standards ............................................................................. 3-1 3.2 Extraction Rate .......................................................................................... 3-1 3.3 Required Monitoring ................................................................................. 3-1 3.4 Plume Containment ................................................................................. 3-2
4. Remedial Progress ......................................................................................... 4-1 4.1 Sulfate ........................................................................................................ 4-1
4.1.1 Plume Interior ................................................................................. 4-2 4.1.2 KUC Deep Well Field ...................................................................... 4-4 4.1.3 Southeast Margin ............................................................................ 4-6 4.1.4 West Jordan Well Field ................................................................... 4-6
4.2 Aluminum ................................................................................................. 4-7 4.3 Arsenic, Cadmium, Copper and Manganese ............................................ 4-8 4.4 pH ............................................................................................................. 4-9
4.4.1 Plume Core ...................................................................................... 4-9 4.4.2 Leading Edge of Plume ................................................................. 4-10
5. Groundwater Elevation .................................................................................. 5-1 5.1 Groundwater Gradients ............................................................................ 5-1 5.2 One-Year Water-Level Elevation Changes ............................................... 5-2 5.3 Water Level Changes from 1996 to 2010 ................................................. 5-4
6. Subsidence ..................................................................................................... 6-1 7. Tailings Chemistry ......................................................................................... 7-1
7.1 Flow and Tailings pH ................................................................................ 7-1 7.2 Tailings Chemistry .................................................................................... 7-1 7.3 UPDES Permit Compliance ...................................................................... 7-2 7.4 Tailings Neutralization Potential ............................................................. 7-2
8. References ..................................................................................................... 8-1
Tables
2-1 Annual Zone A Groundwater Extraction 2005-20010 (ac-ft) ............................... 2-1 2-2 Annual RO Plant Feed Water Volumes (ac-ft) .................................................... 2-3 3-1 Five-year average extraction from the acid plume (acre-feet) ............................. 3-1 3-2 Compliance Well Sampling Frequency and Timing ............................................ 3-2 3-3 Compliance and Extraction Well Monitoring Parameters .................................. 3-2 3-4 Compliance Monitoring Well Sulfate (mg/l) Measurements .............................. 3-3 4-1 Arsenic, Copper, Cadmium and Manganese (mg/l) in Acid Wells ....................... 4-9 4-2 Arsenic, Copper, Cadmiumand Manganese (mg/l) in Leading Edge Wells ........ 4-9 6-1 Subsidence Survey Data (Elevation Feet AMSL) ................................................. 6-2 7-1 2010 Tailing NP (t CaCO3/kt) .............................................................................. 7-3 7-2 2010 Aqueous Alkalinity (mg CaCO3/l) .............................................................. 7-3

Kennecott Utah Copper | Environmental Restoration Group
South Facilities Groundwater April 2011 2010 Remedial Progress Report Page ii
Figures
2-1 Acid Well Extraction 2006-2010 ......................................................................... 2-4 2-2 Barrier Well Extraction 2006-2010 .................................................................... 2-4 2-3 Average Daily Pumping Rates for Barrier Wells ................................................. 2-5 2-4 Average Daily Pumping Rates for Acid Wells ..................................................... 2-6 3-1 Compliance Well Network ................................................................................... 3-4 4-1 Contoured 2010 Sulfate Concentrations ............................................................. 4-12 4-2 Change in Contoured Sulfate Concentrations from 2009 to 2010 .................... 4-13 4-3 Change in Contoured Sulfate Concentrations from 2006 to 2010 .................... 4-14 4-4 Time-Series Plot of Sulfate in SRG946 .............................................................. 4-15 4-5 Time-Series Plot of Sulfate in ECG1115A, B, and C ............................................ 4-16 4-6 Time-Series Plot of Sulfate in ECG1124A, B, and C and ECG1146 ..................... 4-17 4-7 Time-Series Plot of Sulfate in ECG1145A, B, and C ........................................... 4-18 4-8 Time-Series Plot of Sulfate in ECG1144A, B, and C ........................................... 4-19 4-9 Time-Series Plot of Sulfate in ECG1128A, B, and C .......................................... 4-20 4-10 Time-Series Plot of Sulfate in ECG1118A, B, and C .......................................... 4-21 4-11 Time-Series Plot of Sulfate in BSG1177A, B, and C and BSG1201 ................... 4-22 4-12 Time-Series Plot of Sulfate in BSG1119A, B, and C.......................................... 4-23 4-13 Time-Series Plot of Sulfate in BSG2782A, B, and C and BSG2784 ................. 4-24 4-14 Time-Series Plot of Sulfate in BSG1179A, B, and C and P241B ....................... 4-25 4-15 Time-Series Plot of Sulfate in BSG2777A, B, and C ......................................... 4-26 4-16 Time-Series Plot of Sulfate in BSG2783A, B, and C ........................................ 4-27 4-17 Time-Series Plot of Sulfate in B2G1157A, B, and C and B2G1193 ................... 4-28 4-18 Time-Series Plot of Sulfate in BFG1156A through F ....................................... 4-29 4-19 Time-Series Plot of Sulfate in BFG1155A through F and B2G1200 ................ 4-30 4-20 Time-Series Plot of Sulfate in BFG1195A and B ............................................... 4-31 4-21 Time-Series Plot of Sulfate in P277.................................................................. 4-32 4-22 Time-Series Plot of Sulfate in B2G1194A and B .............................................. 4-33 4-23 Time-Series Plot of Sulfate in B3G1197A, B, and C ......................................... 4-34 4-24 Time-Series Plot of Sulfate in P241C ............................................................... 4-35 4-25 Time-Series Plot of Sulfate in BSG1148A, B, and C ......................................... 4-36 4-26 Time-Series Plot of Sulfate in BSG1133A, B, and C ......................................... 4-37 4-27 Time-Series Plot of Sulfate in BSG1132A, B, and C ......................................... 4-38 4-28 Time-Series Plot of Sulfate in W363 ............................................................... 4-39 4-29 Time-Series Plot of Sulfate WJG1154A, B, and C ............................................ 4-40 4-30 Time-Series Plot of Sulfate in WJG1170A, B, and C ........................................ 4-41 4-31 Time-Series Plot of Sulfate in WJG1171A, B, and C ......................................... 4-42 4-32 Contoured 2010 Aluminum Concentrations ................................................... 4-43 4-33 Change in Contoured Aluminum Concentrations from 2009 to 2010 ........... 4-44 4-34 Time-Series Plot of Aluminum in SRG946 ..................................................... 4-45 4-35 Time-Series Plot of Aluminum in ECG1115A, B, and C) ................................. 4-46 4-36 Time-Series Plot of Aluminum in ECG1146 and ECG1124A, B, and C ........... 4-47 4-37 Time-Series Plot of Aluminum in ECG1128A .................................................. 4-48 4-38 Time-Series Plot of Aluminum in ECG1118A, B, and C .................................. 4-49 4-39 Time-Series Plot of Aluminum in BSG1201 .................................................... 4-50 4-40 Time-Series Plot of Aluminum in BSG2782A, B, and C and BSG2784 ........... 4-51 4-41 Time-Series Plot of Aluminum in BSG1119B ................................................... 4-52 4-42 Time-Series Plot of Aluminum in BSG2777A and B ....................................... 4-53 4-43 Contoured 2010 pH Values ............................................................................. 4-54 4-44 Change in Contoured pH Values from 2009 to 2010...................................... 4-55 5-1 Water Surface Elevation Contours September 2010 ........................................... 5-6 5-2 Change in Water Surface Elevation Sept. 2009 to Sept. 2010 ............................ 5-7 5-3 Change in Water Surface Elevation 1996 to 2010 ............................................... 5-8 6-1 Subsidence Survey Monitoring Locations ........................................................... 6-3 6-2 Time-Series Plots of Ground Elevation Measurements ....................................... 6-4 7-1 2010 Tailings Circuit Monitoring Data (7-Day Average) ..................................... 7-4

Kennecott Utah Copper | Environmental Restoration Group
South Facilities Groundwater April 2011 2010 Remedial Progress Report Page iii
Appendices
A Groundwater Chemistry Data
B Groundwater Level Monitoring Data
C Tailings Monitoring Data

Kennecott Utah Copper Environmental Restoration Group
South Facilities Groundwater April 2011 2010 Remedial Progress Report Page 1-1
1. Introduction
Kennecott Utah Copper LLC (KUC) is conducting groundwater remediation at its
South Facilities as selected by the U.S. Environmental Protection Agency (EPA) and
the Utah Department of Environmental Quality (DEQ) in a Record of Decision (ROD;
EPA 2000) dated December 13, 2000 for the Kennecott South Zone, Operable Unit 2.
In response to the ROD, KUC submitted a Final Design for Remedial Action (RDRA;
KUC 2002) for the groundwater remediation in December 2002. EPA and DEQ
approved the RDRA and issued an Explanation of Significant Differences (ESD) in
June 2003 (EPA 2003). A second ESD (EPA 2007) was issued in June 2007
modifying and clarifying certain aspects of the remedy.
KUC has completed construction of remedy components and now operates under an
Operations, Maintenance, and Replacement (OM&R) Plan for South Facilities
Groundwater (Version 2, approved April 2009). This plan will be updated
periodically as needed. A requirement of the OM&R Plan is preparation and
submittal of annual reports on remedial activities and remedial progress. This report
describes remedial activities and results for calendar year 2010 along with
comparative changes from previous years.
Groundwater contamination at the South Facilities, referred to as the Zone A Plume,
is located immediately down gradient of the old Bingham Reservoir and Bingham
Canyon Mine waste rock piles. The plume consists of an acidic core area with low pH
and elevated metals surrounded by a partially to fully neutralized zone of elevated
sulfate groundwater.
The technical components of the selected South Facilities groundwater remedy
include:
• Maintaining source control measures,
• Containing the sulfate plume in Zone A through extraction from barrier wells
at the leading edge of the contamination,
• Remediating of the Zone A plume through extraction of heavily
contaminated waters from the acidic core of the plume,
• Treating extracted water by reverse osmosis (RO) technology for barrier well
water, and by neutralization of acid well water in the tailings pipeline, and
• Monitoring and reporting progress.

Kennecott Utah Copper Environmental Restoration Group
South Facilities Groundwater April 2011 2010 Remedial Progress Report Page 2-1
2. Remedial Operations
2.1 Groundwater Remediation System KUC has completed construction of groundwater extraction and treatment systems
necessary to implement the remedy. Components of this system are:
• A barrier well extraction system consisting of three wells, B2G1193,
BFG1200, and LTG1147, and conveyance lines to deliver water to an RO
treatment plant.
• A reverse osmosis treatment plant capable of producing 3,500 acre feet of
drinking water per year using feed water from the barrier wells.
• An acidic groundwater extraction system comprised of three wells, ECG1146,
BSG1201 and BSG2784, and conveyance to the tailings pipeline near the
Copperton Concentrator.
• An acidic water treatment system which relies on operating KUC milling
facilities, specifically a) the tailings pipeline, which serves as a 17-mile plug-
type treatment reactor; b) the Copperton Concentrator lime plant, which has
the ability to add hydrated lime directly to the tailings line as needed; and c)
the North Tailings Impoundment, which provides a repository for non-
hazardous solid treatment residuals within a much larger mass of tailings.
2.2 Extraction and Treatment Annual extractions for 2006 through 2010 from wells in Zone A are reported in Table
2-1 and shown on Figures 2-1 and 2-2. The 2010 average daily pumping rates for
each of the barrier and acid wells are plotted on Figures 2-3 and 2-4, respectively.
Table 2-1 Annual Zone A Groundwater Extraction 2006-2010 (ac-ft) 2006 2007 2008 2009 2010 Barrier Well Extraction B2G1193 2188 2225 2464 2268 2268 BFG1200 2244 2353 2464 2164 1503 LTG1147 374 307 30 896 851 Total 4806 4885 4958 5328 4622
Acid Well Extraction ECG1146 1495 1419 947 665 541 BSG1201 1300 869 927 910 342 BSG2784 0 1 706 171 647 Total 2795 2289 2580 1746 1530

Kennecott Utah Copper Environmental Restoration Group
South Facilities Groundwater April 2011 2010 Remedial Progress Report Page 2-2
Production from B2G1193 and LTG1147 was comparable to 2009 and both wells
operated 95% of the year (Figure 2-3).
Extraction from barrier well BFG1200 was lower in 2010 than in 2009 due to two
motor failures and from time spent redeveloping the well. One motor failure occurred
in the first quarter after redevelopment work was completed and after the motor had
operated for four years; the second failure occurred in the fourth quarter on a new
motor rebuild. The variable frequency drive (VFD) also failed in the fourth quarter
after VFD had operated for seven years (Figure 2-3b).
Re-development work, completed in February 2010, on BFG1200 was successful and
this activity increased the specific capacity of the well from 6.5 gallons per foot of
drawdown to 15.3 gallons per foot of drawdown. In terms of pumping water levels,
before re-development, the drawdown was 175 feet when producing 1100 gallons per
minute and after redevelopment there was 90 feet of drawdown when producing 1300
gallons per minute. Redevelopment work consisted of three steps: 1) acidify the well
with NSF approved sulfamic acid to dissolve mineral build up in the sand pack and on
the well screen; 2) use of double surge blocks to swab and extract water and 3) surge
pump the well with a vertical turbine pump and perform a step test.
During late 2009 and the first quarter of 2010, KUC collected a large quantity of
electrical power data for all three acid well electrical operating systems. This
evaluation included checking all aspects of the power supply at each well and
reevaluating pump and motor requirements and options. After all information was
assessed, it was apparent that due to the sensitivity of submersible motors to power
quality, power filtering was needed on the power supply at each well site. VFDs and
line and load side filters were installed and tested in ECG1146 and BSG1201 in May
2010. ECG1146 was started in late May and BSG1201 was placed into operation in late
June after the air-conditioning system was installed to keep the VFD at proper
temperature. Air-conditioning units had been previously installed at both ECG1146
and BSG2784. At BSG2784, after observing operating characteristics of the VFDs at
both ECG1146 and BSG1201, the VFD and filters were installed at BSG2784 in early
September. Since the installation of the VFDs at each of the three wells, only one
motor has an unexplained failure and this was a Hitachi 200 horsepower motor that
was mated with a 1000 gallon-per-minute pump in ECG1146. This motor and pump
were replaced. Currently all three acid extraction wells have Franklin 200 horsepower
motors. Operation of all three systems through the first quarter of 2011 has resulted
in good performance with no problems or down time due to electrical problems
encountered in 2009 and 2010.
Acidic water extraction well ECG1146 operated approximately 47% of 2010 (Figure 2-
4a). This well did not operate during the winter and spring while awaiting VFD
installation. KUC also temporarily sealed the bottom 40 feet of the screen interval in
ECG1146 in July 2010 with gravel pack and bentonite to inhibit cleaner type water
from entering the basal portion of the well. Adjacent monitoring well, ECG1124B,

Kennecott Utah Copper Environmental Restoration Group
South Facilities Groundwater April 2011 2010 Remedial Progress Report Page 2-3
which is screened at same level as the bottom portion of ECG1146 and located 100
feet north, has been showing progressively cleaner water in the past 4 years.
BSG1201 operated about 40% of 2010 (Figure 2-4b) and was not operated during
most of the first half of 2010 while waiting on VFD installation. Well BSG2784
operated about 76% of 2010 (Figure 2-4c).
All groundwater extracted from the acidic water extraction wells was conveyed to the
KUC tailings line for treatment. In early 2010, the acidic water delivery point to
tailings was modified. Previously acidic water was delivered to Box NP-5 at the
beginning of the tailings line; after modification water now reports to a point on the
tailings line identified as Box A.25, which is located 1.25 miles downstream from NP-
5. The purpose of this modification was to improve the ability to clean scaling from
the pipeline.
KUC’s groundwater extractions removed 36,316 tons of sulfate in 2010 compared
with 41,091 tons of sulfate in 2009. Since 1997, KUC has removed over 647,000 tons
of sulfate from the principal alluvial aquifer in the South West Jordan Valley.
Barrier Well water from B2G1193 and BFG1200 along with LTG1147 was routed to
the RO Plant during 2010 and KUC delivered the produced drinking water to the
Jordan Valley Water Conservancy District. Concentrate from the plant was routed to
the KUC tailings pipeline. Feed water volumes are indicated in Table 2-2.
Table 2-2 Annual RO Plant Feed Water Volumes (ac-ft) 2006 2007 2008 2009 2010 RO Treatment 4806 4762 4928 5039 4039

Kennecott Utah Copper Environmental Restoration Group
South Facilities Groundwater April 2011 2010 Remedial Progress Report Page 2-4
Figure 2-1 Acid Well Extraction 2005-2010
Figure 2-2 Barrier Well Extraction 2005-2010
2006 2007 2008 2009 2010
Acr
e-Fe
et
0
500
1000
1500
2000
2500
3000ECG1146 BFG1201 BFG2784 5-Year RollingAverage
2006 2007 2008 2009 2010
Acr
e-Fe
et
0
1000
2000
3000
4000
5000
6000B2G1193 BFG1200LTG1147

Kennecott Utah Copper Environmental Restoration Group
South Facilities Groundwater April 2011 2010 Remedial Progress Report Page 2-6
Figure 2-3 Average Daily Pumping Rates for Barrier Wells
a) B2G1193
Jan-10 Feb-10 Mar-10 Apr-10 May-10 Jun-10 Jul-10 Aug-10 Sep-10 Oct-10 Nov-10 Dec-10 Jan-11
GP
M
0
250
500
750
1000
1250
1500
1750
2000
b) BFG1200
Jan-10 Feb-10 Mar-10 Apr-10 May-10 Jun-10 Jul-10 Aug-10 Sep-10 Oct-10 Nov-10 Dec-10 Jan-11
GP
M
0
250
500
750
1000
1250
1500
1750
2000
c) LTG1147
Jan-10 Feb-10 Mar-10 Apr-10 May-10 Jun-10 Jul-10 Aug-10 Sep-10 Oct-10 Nov-10 Dec-10 Jan-11
GP
M
0
250
500
750
1000
1250
1500
1750
2000

Kennecott Utah Copper Environmental Restoration Group
South Facilities Groundwater April 2011 2010 Remedial Progress Report Page 2-7
Figure 2-4 Average Daily Pumping Rates for Acid Wells
a) ECG1146
Jan-10 Feb-10 Mar-10 Apr-10 May-10 Jun-10 Jul-10 Aug-10 Sep-10 Oct-10 Nov-10 Dec-10 Jan-11
GPM
0
200
400
600
800
1000
1200
b) BSG1201
Jan-10 Feb-10 Mar-10 Apr-10 May-10 Jun-10 Jul-10 Aug-10 Sep-10 Oct-10 Nov-10 Dec-10 Jan-11
GPM
0
200
400
600
800
1000
1200
c) BSG2784
Jan-10 Feb-10 Mar-10 Apr-10 May-10 Jun-10 Jul-10 Aug-10 Sep-10 Oct-10 Nov-10 Dec-10 Jan-11
GPM
0
200
400
600
800
1000
1200

Kennecott Utah Copper Environmental Restoration Group
South Facilities Groundwater April 2011 2010 Remedial Progress Report Page 3-1
3. Compliance with Performance Standards and Monitoring Requirements
3.1 Performance Standards Performance standards for operation and maintenance of the remedy are described in
the 2007 ESD and include:
• Extract a minimum of 1,200 acre-feet per year from the core of the acid
plume on a five-year rolling average.
• Maintain groundwater sulfate concentration in a network of compliance
wells, listed in the OM&R Plan, at or below 1,500 mg/l.
The OM&R Plan specifies required monitoring including sampling frequency, timing,
and parameters for compliance and extraction wells.
Performance in 2010 is compared to these performance standards and requirements
below. KUC reports separately to the State Trustee for Natural Resources on
operations at the RO Plant in compliance with the Natural Resource Damage
settlement and implementing project agreements.
3.2 Extraction Rate Average acid water extraction for the 5-year period 2006 to 2010 was 2,188 acre-feet
(Table 3-1). Thus, KUC complied with the minimum annual extraction performance
standard of 1,200 acre-feet of acid plume water on a 5-year rolling average.
Table 3-1 Five-year average extraction from the acid plume (acre-feet) 2006 2007 2008 2009 2010 5-Year
AverageExtraction 2795 2289 2580 1746 1530 2188
3.3 Required Monitoring The OM&R Plan specifies required monitoring frequency and timing for compliance
wells, which is dependent on sulfate concentrations as shown in Table 3-2.
Extraction wells are scheduled for sampling semi-annually in the first and third
quarters. Required monitoring parameters are indicated in Table 3-3.

Kennecott Utah Copper Environmental Restoration Group
South Facilities Groundwater April 2011 2010 Remedial Progress Report Page 3-2
Table 3-2 Compliance Well Sampling Frequency and Timing Sulfate (mg/l) Frequency Timing*
<1,000 Annually 3rd Quarter 1,000-1,250 Semi-annually 1st and 3rd Quarters >1,250 Quarterly Each Quarter *calendar-year quarters
Table 3-3 Compliance and Extraction Well Monitoring Parameters pH Arsenic (D) Barium (D) Cadmium (D) Copper (D) Fluoride Lead (D) Selenium (D) Nickel (D) Sulfate *(D) means dissolved
All compliance monitoring wells had sulfate concentrations less than 1,000 mg/l and
all were sampled in 2010 within the third quarter, at a minimum. Extraction wells
were sampled during the third quarter 2010, at a minimum. None of the acid wells
were sampled in the first quarter because the wells were not operating.
Required monitoring parameters were gathered for compliance and extraction well
sampling in 2010.
3.4 Plume Containment The compliance well network for 2010 is shown on Figure 3-1. Sulfate concentrations
in the third quarter of 2010 are listed in Table 3-4; for comparison, third-quarter
measurements from 2009 are also listed.
No compliance wells exceeded the sulfate compliance limit of 1,500 mg/l in 2010, and
the highest concentration measured was 642 mg/l. No large changes in sulfate
concentration occurred in the compliance wells between 2009 and 2010. Sulfate
concentrations decreased by more than 9 percent in three wells and only increased in
two wells with the highest by 7 percent.
There does not appear to be any significant increase in sulfate concentrations in
compliance wells that would suggest the potential for future non-compliance with the
performance standard.

Kennecott Utah Copper Environmental Restoration Group
South Facilities Groundwater April 2011 2010 Remedial Progress Report Page 3-3
Table 3-4 Compliance Monitoring Well Sulfate (mg/l) Measurements during Third Quarter
Well ID 2009 2010 COG1178A 306 278 WJG1169B 463 471 WJG1154A 292 265 WJG1154B 360 386
W189 93 81 P192B 87 60 P194B 41 38
EPG1165A 176 166 BSG1135B 70 69 HMG1123A 667 642 HMG1126B 390 384


Kennecott Utah Copper Environmental Restoration Group
South Facilities Groundwater April 2011 2010 Remedial Progress Report Page 4-1
4. Remedial Progress
Analysis of 2010 groundwater monitoring data, especially as shown on the time-series
plots included in this report, indicates that the remedial extraction program is
continuing to achieve reduction in contaminant levels.
All water chemistry data collected during 2010 is reported in Appendix A; results
from 2009 are also included in Appendix A. Samples were analyzed at Kennecott
Environmental Laboratory (KEL), a State of Utah certified analytical laboratory.
For all South Facilities Groundwater sampling, KUC follows the Groundwater
Monitoring and Characterization Plan (GCMP; KUC 2010a) and its associated
Standard Operating Procedures (SOPs; KUC 2010b), and Quality Assurance Project
Plan (QAPP; KUC 2010c) . KUC submits quarterly Quality Assurance Reports and an
annual GCMP summary to the Division of Water Quality. These submittals report
data and discuss quality assurance for the data utilized below to assess remedial
progress.
4.1 Sulfate The distribution of sulfate in 2010 in Zone A is represented on Figure 4-1 as
contoured sulfate concentrations. In monitoring wells with multiple completions at
different depths, the well with the highest sulfate concentration was used to generate
the contours. The most recent sampling event during 2010 (or the most recent
analyses within the past five years if no 2010 data were available) was used. Changes
in contoured sulfate concentrations from 2009 to 2010 are highlighted on Figure 4-2.
Figure 4-3 represents the sulfate concentration changes from 2006 through 2010.
The time-period of 2006 through 2010 was selected because in 2006 additional
plume delineation drilling was completed.
Over most of the area, the sulfate isoconcentrations lines indicate a contraction in the
plume footprint between 2009 and 2010. Generally, the sulfate isoconcentration
lines for 500 mg/l and 1,500 mg/l located on the east and southeast side of the plume
area have moved inward along with decreasing areas of the 5,000 mg/l and 10,000
mg/l between ECG1146 and BSG1201 (Figure 4-2). Only one area of the 10,000 mg/l
isocontour has increased located northeast of ECG1146 and is likely due to the period
of non-pumping at ECG1146 during the first half of 2010.
From 2006 through 2010, the same general contraction of sulfate isocontours is
apparent, but with larger changes (Figure 4-3). The large reduction in the footprint
underlain by sulfate concentrations in excess of 10,000 mg/l and 15,000 mg/l is
particularly significant.

Kennecott Utah Copper Environmental Restoration Group
South Facilities Groundwater April 2011 2010 Remedial Progress Report Page 4-2
Time-series plots of sulfate concentration for selected monitoring wells are presented
and discussed below.
4.1.1 Plume Interior The plume interior includes areas with groundwater sulfate concentrations greater
than 5,000 mg/l. Most of the changes in sulfate concentration are due to pumping or
lack of pumping at ECG1146, BSG1201 and BSG2784. When consistent pumping
occurs, surrounding monitoring wells generally show decreasing sulfate
concentrations. If partial-year pumping occurs, decreasing trends may be less
pronounced, trends level off or trends show increasing sulfate concentrations.
Another factor that influences trends includes when the sample was collected with
respect to pumping, the distance of the monitoring well from the respective pumping
well, and the degree of hydraulic communication between the hydrostratigraphic
horizons of a monitor well and the horizons screened in the pumping well.
Zone A Source Area
Comparison of the isoconcentration contours from 2010 with those from 2009
indicates no significant changes in the western acid plume area at monitoring well
site SRG946 near the Small Bingham Reservoir. One sample was collected in 2010
and contained 17,900 mg/l which was 200 mg/l greater than last sample collected in
2009. Although the 2010 sulfate result from SRG946 is slightly higher than the last
sample of 2009, the results are in line with past results (Figure 4-4). It is likely that
sulfate and other contaminant concentrations in this area will reach an equilibrium as
contaminants are slowly rinsed from sediments and released over time. Pumping at
ECG1146 appears to have little effect on water table at this site but due to the
pumping at ECG1146, the water gradient steepens eastward which increases the
potential for water to move towards the pumping well.
Monitoring wells ECG1115 A, B, and C are located 1,500 feet upgradient from
extraction well ECG1146 along the apparent migration pathway of the Zone A plume.
In 2010, sulfate concentrations in ECG1115 A and B decreased slightly (Figure 4-5),
while sulfate in ECG1115C decreased from 41,700 mg/l in 2009 to 34,100 mg/l in
2010. Sulfate concentrations in ECG1115A have been greater than 30,000 mg/l since
at least 1996 and now appear to be on a downward trend for the past three years with
the 2010 concentration at 28,400 mg/l (Figure 4-5). Sulfate concentrations in
ECG1115 B and C have shown marked increases since initiation of pumping at
ECG1146, however the last four years ECG1115B shows a decreasing sulfate trend. The
very high sulfate concentration in ECG1115C is similar in concentration as compared
to the early sampling data from ECG1115A. These overall responses are attributed to
induction of horizontal contaminant migration from the Zone A source area or
possible induction of vertical migration between horizons. It is also possible that
vertical migration is occurring due in the borehole itself. ECG1115 was drilled using
casing driven techniques so that water quality could be collected during drilling. Even
through the proper completion materials were placed to seal the annular space, it is
possible that the upper higher sulfate concentration has moved downward in the
outer annular space.

Kennecott Utah Copper Environmental Restoration Group
South Facilities Groundwater April 2011 2010 Remedial Progress Report Page 4-3
Acid Extraction Well ECG1146 Area
There was a discernable aquifer response, both in terms of sulfate concentration and
water level, to partial year pumping at extraction well ECG1146 (Section 2.2).
Examination of the time series concentration plots (Figure 4-6 to Figure 4-10)
indicates that sulfate concentrations at most wells within the ECG1146 area
decreased at a slower rate than previous years or increased slightly. Pumping at
ECG1146 occurred more or less in the first half of 2009 and in the second half of
2010.
Sulfate concentrations in ECG1146 averaged 18,200 mg/l in 2009 and 19,700 mg/l in
2010 (Figure 4-6). The increase is attributable to modifying the well screen in
ECG1146. The bottom of the well screen, from 710 feet to 740 feet, was filled with
gravel and capped with bentonite to inhibit cleaner type water from entering the base
of the well. When sampling occurred one week after the well modification, the sulfate
increased from 20,400 mg/l to 23,900 mg/l; however, the sample collected in the
fourth quarter of 2010 showed the sulfate decreased to 14,800 mg/l. Because the
latest sample in 2010 was less than 15,000 mg/l, KUC plotted the area of greater than
15,000 mg/l sulfate slightly smaller for the ECG1146 area (Figure 4-2).
Notably, sulfate concentrations in ECG1124B (Figure 4-6), located adjacent to
extraction well ECG1146, increased from 403 mg/l in 2009 to 1,490 mg/l in 2010,
which is likely due to the modification of the ECG1146 screen interval.
In ECG1145A, located south of well ECG1146, sulfate decreased from 7,190 mg/l in
2009 to 6,260 mg/l in 2010 (Figure 4-7). The sulfate concentration in the ECG1145B
showed a slight increase and ECG1145C continued to decline.
In ECG1144A (Figure 4-8), located approximately 500 feet northeast of ECG1146,
sulfate concentrations decreased from 6,530 mg/l in 2009 to 4,930 mg/l in 2010,
which is on trend compared to previous years. During the same period, ECG1144B
increased from 7,050 mg/l to 9,430 mg/l. The changes from previous trends,
especially the increase in sulfate in ECG1144B, are likely due to partial-year pumping
at extraction well ECG1146 and less direct hydraulic connection of the ECG1144B
stratigraphy with the screen interval at ECG1146.
The sulfate concentration in monitoring well ECG1128A (Figure 4-9) decreased from
6,310 mg/l in 2009 to 4,220 mg/l in 2010. This well was sampled in November 2010
after ECG1146 had been pumping for at least 4 months. Sampling in 2009 had shown
increasing sulfate due to partial-year pumping at ECG1146 during 2009. Decreasing
sulfate concentration in this well is reflected in the contraction of the 5,000 mg/l
contours on the southwest sector of the sulfate plume (Figure 4-2).
In ECG1118A, located approximately 1,800 feet east-northeast of ECG1146, sulfate
concentration decreased from 9,050 mg/l in 2009 to 8,180 mg/l in 2010 (Figure 4-
10). The rate of decrease in past three years is relatively steady. Since the sulfate
concentration at this site is continuing to decline, the 10,000 mg/l isoconcentration
Kennecott Utah Copper Environmental Restoration Group
South Facilities Groundwater April 2011 2010 Remedial Progress Report Page 4-4
line is truncated between extraction wells ECG1146 and BSG1201 (figure 4-1).
Compared with previous years, the 10,000 mg/l contour was continuous through the
ECG1118 area.
Acid Extraction Well BSG1201Area
Acid extraction well BSG1201 operated for most of the last half of 2010. Sulfate in
BSG1201 decreased from 10,100 mg/l in 2009 to 8,540 mg/l in the fourth quarter of
2010 (Figure 4-11). At the adjacent monitoring wells, BSG1177A and B (Figure 4-11),
the sulfate concentration decreased in 2010 at a rate consistent with the previous
three years. That the rate of sulfate decline in 2009 and 2010 is consistent with the
period from 2006 through 2010 suggests that the lower pumping rate from this well
implemented in 2007 remains sufficient to effectively promote mass removal and
aquifer remediation.
Sulfate concentration in BSG1119B (Figure 4-12), located at the leading edge of the
low pH plume decreased from 6,210 mg/l in 2009 to 5,300 mg/l.
Acid Extraction Well BSG2784 Area
At acid extraction well BSG2784, sulfate remained (Figure 4-13) at an average of
11,550 mg/l between 2009 and 2010. Since BSG2784 was pumped during 2010 from
the end of March through December. In that time, sulfate in BSG2782A (Figure 4-13),
located 150 feet west and upgradient of extraction well BSG2784, decreased from
24,700 mg/l at end of year 2009 to 16,500 mg/l at end of year 2010. Over the same
period, BSG2782C decreased from 24,100 mg/l to 21,300 mg/l. In the less
contaminated and lower permeability horizon monitored by BSG2782B, sulfate
decreased from 4,320 mg/l in late 2009 to 3,990 mg/l in late 2010.
Pumping at BSG2784 also caused sulfate concentrations in monitoring wells BSG1179
B and C and P241B, located approximately 1,400 feet west of BSG2784, to decrease in
2010 (Figure 4-14). The highest concentration of sulfate occurring at this location is
found in BSG1179C, which decreased from 16,200 mg/l in 2009 to 14,100 mg/l in
2010. BSG1179A showed the largest decrease for the nested well site from 10,500
mg/l in 2009 to 5,980 mg/l in 2010. Similarly, sulfate concentrations in acid
extraction well BSG2783B , located approximately 1,700 feet southeast of acid
extraction well BSG2784, decreased from an average of 14,300 mg/l in 2009 to an
average of 12,750 mg/l in 2010 (Figure 4-15).
At monitoring well BSG2777A, located 1,200 feet east and downgradient of extraction
well BSG2784, sulfate concentrations decreased from 21,300 mg/l in late 2009 to
15,700 mg/l in 2010 (Figure 4-16). With the decrease in sulfate, the 20,000 mg/l
sulfate isoconcentration line moved inward and is centered at the BSG2782 site
(Figure 4-1).
4.1.2 KUC Deep Well Field The KUC deep well field area includes barrier extraction wells B2G1193 and BFG1200
and the monitoring wells located on the northeast margin of the plume. Sulfate

Kennecott Utah Copper Environmental Restoration Group
South Facilities Groundwater April 2011 2010 Remedial Progress Report Page 4-5
concentrations in the extraction wells remained essentially unchanged during 2010.
Sulfate concentrations in monitoring wells located close to extraction well B2G1193
show slight decreases in 2010. Other monitoring wells in the well field generally held
steady or decreased.
Deep Well B2G1193 Area
B2G1157A, B, and C are located immediately adjacent to barrier extraction well
B2G1193. B2G1157A is dry. Sulfate in B2G1157B is sampled quarterly and the last two
samples appear to be showing a decreasing trend even though a two sample
downward sulfate trend has been seen in the past (Figure 4-17). It appears that the
overall increasing sulfate trend in this well may be ending. The average sulfate
concentration decreased from 6,655 mg/l in 2009 to 6,433 in 2010. The sulfate
concentration in water extracted from B2G1193 decreased from an average of 1,962
mg/l in 2009 to an average of 1,788 mg/l in 2010. Sulfate concentrations in
B2G1157C decreased from an average of 408 mg/l in 2009 to 97 mg/l in 2010. The
changes at B2G1157 reflect the pumping at B2G1193, which is drawing water from the
interior of the plume as well as the margin. The fact that the sulfate concentration in
extraction well B2G1193 is in the range of 1,800 mg/l suggests that the concentration
of sulfate in B2G1157B does not contribute significantly to the overall production
from B2G1193.
Monitoring wells BFG1156B, C, D, and E are located approximately half the distance
between extraction wells BFG1200 and B2G1193 and are located at the northern
leading edge of the 1,500 mg/l sulfate contour. Sulfate concentrations in BFG1156B
and BFG1156C decreased in 2010. Sulfate concentrations in BFG1156D increased
from 1,230 mg/l in 2009 to 1,430 mg/l in 2010 (Figure 4-18) which is likely due to
lateral movement of higher sulfate water from the south and west (same zone that
B2G1157B is screened). BFG1156E was not sampled in 2010.
Deep Well BFG1200 Area
Sulfate concentrations over time for extraction well BFG1200 are shown in Figure 4-
19 along with monitoring well BFG1155A, B, C, D, E, and F. BFG1155A and B are dry.
There are seasonal fluctuations in sulfate concentrations in this extraction well. The
sulfate concentration in BFG1200 decreased slightly from an average sulfate
concentration of 726 mg/l in 2009 to 688 mg/l in 2010. Monitoring wells at the
nested site BFG1155 were not sampled in 2010.
In well BFG1195A (Figure 4-20), the sulfate concentration decreased from 1,490 mg/l
in 2009 to 1,390 mg/l in 2010 showing a decreasing trend over the past two years.
BFG1195B decreased from 1,370 mg/l in 2009 to 1,330 mg/l in 2010, the lowest
measured sulfate concentration since 2001. It is likely that the extraction from
barrier wells BFG1200 and B2G1193 is causing cleaner water to move vertically
and/or laterally to these monitoring wells.
Time-series plots for other monitoring wells in the deep well field area where sulfate
concentrations were measured in 2010 are presented here. At P277, it is noteworthy

Kennecott Utah Copper Environmental Restoration Group
South Facilities Groundwater April 2011 2010 Remedial Progress Report Page 4-6
that the sulfate concentration dropped from 1,360 mg/l in 2009 to 974 mg/l in 2010
(Figure 4-21). This change caused the 1,500 mg/l sulfate isoconcentration line to
move farther inward (Figure 4-2). Sulfate in B2G1194 A and B continued a sustained
downward trend (Figure 4-22). A slight decrease was measured in both B3G1197A
and B (Figure 4-23). For B3G1197A, the decrease from 298 mg/l in 2009 to 259 mg/l
in 2010 reverses a three year upward trend.
4.1.3 Southeast Margin Sampling in 2010 indicates an overall continued increase in sulfate in P241C (Figure
4-24); however, the fourth quarter sample indicated a decrease from 1,120 mg/l to
1,080 mg/l and it is expected that with pumping at BSG2784, the sulfate will continue
to decline in2011. A slight decrease was observed in BSG1148A (Figure 4-25). Sulfate
at BSG1148B showed a marked increase (Figure 4-25). It is likely that the higher
sulfate concentration in the BSG1148A level is moving downward as the water table
declines to the BSG1148B level. There were decreasing sulfate changes at BSG1133 B
(Figure 4-26) and BSG1132A and B (Figure 4-27). Responses to pumping at
extraction well BSG2784 are expected to continue over time with these areas.
4.1.4 West Jordan Well Field KUC monitors water quality and water levels in and adjacent to the West Jordan
municipal well field, which includes wells W363 and W387, shown on Figure 4-1, and
W420, not shown. A fourth well, W361, has not been pumped by West Jordan since
the mid-2000s due to land development activities. Heavy extraction from these four
wells in the 1990s caused migration of elevated-sulfate groundwater toward this area
and well W363 saw increasing sulfate through the late 1990s (Figure 4-28).
Sulfate concentrations at W363 have declined since 1999 and correspond to reduced
annual extraction by West Jordan and increased extraction by KUC. During 1999,
W363 had its highest sulfate concentration of 188 mg/l, and in 2010, the average
concentration was 110 mg/l, a slight decrease from 113 mg/l in 2009. Well W363 is
located approximately 6,700 feet northeast of KUC’s barrier well BFG1200. Well
W387, located 2,700 feet west of W363, was not sampled in 2009 but has had
relatively consistent sulfate concentration in the range of 50 mg/l. The northern-
most West Jordan well (W420) was not sampled in 2010. Both W387 and W420 are
not within the sulfate plume pathway.
Monitoring wells located between the leading edge of the sulfate plume and the West
Jordan Well field showed generally steady to slightly increasing sulfate
concentrations in 2010. WJG1154A, located 3,400 feet southeast of W363, also saw
elevated concentrations through the late 1990s and has shown fairly consistent
sulfate concentrations since. The average concentration for WJG1154A in 2010
decreased from 320 mg/l in 2009 to 285 mg/l with seasonal highs and lows (Figure
4-29). Sulfate concentrations in well WJG1154B have increased from 356 mg/l in
2009 to 377 mg/l in 2010. The increase in sulfate at WJG1154B is likely due to
vertical movement of water with higher sulfate concentration between the WJG1154A
and B horizon moving downward as the water table declines.

Kennecott Utah Copper Environmental Restoration Group
South Facilities Groundwater April 2011 2010 Remedial Progress Report Page 4-7
Sulfate concentrations in well WJG1170B (WJG1170A is dry) increased from 339 mg/l
in 2009 to an average of 362 mg/l in 2010 (Figure 4-30). The water has continued to
decline in this general area and it appears that the poorer quality water in the upper
portion of the aquifer is moving downward from below the WJG1170A horizon into
the WJG1170B horizon. WJG1171A has an increasing sulfate trend over time but now
has two years showing a decrease from 172 mg/l in 2009 to 169 mg/l in 2010 (Figure
4-31). WJG1171B continues to have sulfate concentrations less than 60 mg/l.
4.2 Aluminum Aluminum concentrations continued to decrease in 2010. This constituent is the
primary contributor to mineral acidity and influences treatment strategies for acid
plume water.
The distribution of aluminum in groundwater in 2010 is shown on Figure 4-32. The
aluminum concentration contours for 2010 on this figure were drawn in a similar
manner as the sulfate contour map (Section 4.1; Figure 4-1). Changes in aluminum
from 2009 to 2010 are highlighted on Figure 4-33. Decreases in aluminum
concentration in the Zone A plume generally are proximal and centered on the three
acid wells. As with sulfate, the decrease in aluminum is attributed primarily to mass
removal due to groundwater extraction.
Zone A Source Area
In the western-most portion of the low pH plume, adjacent to the Small Bingham
Reservoir, the aluminum concentration at SRG946 remained just below 1,000 mg/l
for a fourth consecutive year (Figure 4-34). This is reflected as a complete
contraction of the 1,000 mg/l aluminum isocontour in this area (Figure 4-33). As
noted above in the discussion of sulfate in SRG946 (Section 4.1.1), due to the
remobilization of precipitated minerals in the immediate Zone A source area, it is
likely that aluminum concentrations will continue to be elevated over time in this
area.
Acid Extraction Well ECG1146 Area
In 2010, the primary area of aluminum concentrations greater than 1,500 mg/l
continues to reside in the core of the low pH plume around monitoring well
ECG1115A, which is located northwest and up gradient of extraction well ECG1146.
With continued pumping from acid extraction well ECG1146, the area containing
greater than 1,500 mg/l aluminum continues to decrease slightly in size. ECG1115A,
which contained 1,950 mg/l in 2009 decreased to 1,770 mg/l in 2010 (Figure 4-35).
During the same period, ECG1115C decreased from 1,680 mg/l to 1,610 mg/l and
ECG1115B decreased from 372 mg/l to 367 mg/l. Prior to 2010, aluminum
concentrations in ECG1115 B and C have shown marked increases since initiation of
pumping at ECG1146. These responses are attributed to induction of horizontal
contaminant migration from the western portion of the Zone A source area, slow
release of contaminants from lower-permeability horizons, and/or possible induction
Kennecott Utah Copper Environmental Restoration Group
South Facilities Groundwater April 2011 2010 Remedial Progress Report Page 4-8
of vertical migration from shallower to deeper horizons through the outer borehole
wall.
Aluminum concentrations in ECG1146 has slightly increased with an average
concentration of 908 mg/l in 2009 as compared to 928 mg/l in 2010 (Figure 4-36).
Aluminum decreased at ECG1128A from 157 mg/l in 2009 to 125 mg/l in 2010
(Figure 4-37). The decrease continues the declining aluminum seen in this well prior
to 2009 which occurred during that year due to partial-year extraction at acid
extraction well ECG1146.
At ECG1118A, aluminum decreased from 422 mg/l in 2009 to 400 mg/l in 2010
(Figure 4-38). Partial-year extraction at ECG1146 appears to have also influenced the
aluminum concentration for this area based on comparison with earlier years on the
time series curve.
Acid Extraction Wells BSG1201and BSG2784 Area
Between 2009 and 2010, aluminum concentrations in the BSG1201 and BSG2784
decreased. Sampling in the fourth quarter of 2010 after pumping for 9 months from
BSG2784 and 5 months from BSG1201 caused 1,500 mg/l and 1,000 mg/l isocontours
to collapse and also caused a large decrease in the 500 mg/l isocontour. Most of the
changes in the contours were due to the decreases measured at BSG2782A, located
adjacent to BSG2784, and in BSG1179C, located 1,300 feet west of BSG2784.
BSG2782A decreased from 1,540 mg/l in 2009 to 712 mg/l in 2010 while BSG1179A
decreased from 1,030 mg/l to 952 mg/l. Aluminum concentrations decreased at acid
extraction well BSG1201 from 362 mg/l in 2009 to 346 mg/l in 2010 (Figure 4-39)
and at acid extraction well BSG2784, decreased from 440 mg/l in 2009 to 361 mg/l in
2010 (Figure 4-40). If continued pumping at both wells can be maintained, it would
appear that continued decreases of aluminum concentration for this eastern portion
of the low pH plume area will follow.
On the leading edge of the low pH plume, aluminum in well BSG1119B decreased
from 52 mg/l in 2009 to 43 mg/l in 2010 (Figure 4-41). BSG2777A decreased from
125 mg/l in 2009 to 108 mg/l in 2010 (Figure 4-42).
4.3 Arsenic, Cadmium, Copper and Manganese In general, the concentrations of arsenic, cadmium, copper and manganese have been
declining in the acid plume due to pumping. These metalloids and metals are
prevalent where groundwater has a pH less than or equal to 4.5. Changes are also
monitored closely at the leading edge of the pH 4.5 plume. Extraction and
monitoring wells located in neutral pH water generally have less than or near
detection limit concentrations of arsenic, cadmium, and copper.
Comparisons of arsenic, cadmium, copper and manganese for 2009 and 2010 are
included in Table 4-1 for each of the three acid extraction wells. Most of the changes

Kennecott Utah Copper Environmental Restoration Group
South Facilities Groundwater April 2011 2010 Remedial Progress Report Page 4-9
are relatively small showing decreases except for a slight increase for cadmium in
ECG1146 and BSG2784 and slight increase in manganese in BSG2784.
Table 4-1 Arsenic, Copper, Cadmium and Manganese (mg/l) in Acid Wells ECG1146 BSG1201 BSG2784
2009 2010 2009 2010 2009 2010 Arsenic 0.350 0.026 0.021 0.010 0.024 0.022 Cadmium 0.792 0.797 0.615 0.598 0.782 0.859 Copper 57.57 64.00 16.84 16.00 12.82 12.56 Manganese 311 298 156 146 217 225 At the leading edge of the low pH plume, monitoring wells BSG1119B and BSG2777A
show changes (Table 4-2) that would be typical for the reaction boundary of low pH
water where the aluminum, arsenic, and copper concentrations are relatively low
compared to the core of the low pH plume. However, manganese, due to higher
solubility in a wider range of pH is relatively high with respect to the acid extraction
wells. BSG1119B shows minor to moderate decreasing changes for arsenic, cadmium,
copper and manganese, while BSG2777A shows slightly increasing arsenic and copper
but decreasing cadmium and manganese. The influences of pumping at BSG1201 and
BSG2784 should cause the metal and metalloid concentrations to hold relatively steady
and possibly decrease. BSG1119B and BSG2777A are located approximately 2,000 ft
and 1200 ft down gradient, respectively, of extraction wells BSG1201 and BSG2784
and some of the water at the leading edge may move eastward farther into the basin.
Table 4-2 Arsenic, Copper, Cadmium and Manganese (mg/l) in Leading Edge Wells BSG1119B BSG2777A
2009 2010 2009 2010 Arsenic 0.012 0.012 0.036 0.086 Cadmium 0.744 0.676 1.555 1.425 Copper 0.086 0.078 0.115 0.387 Manganese 138 118 426 398
4.4 pH Groundwater pH isocontours for 2010 are shown on Figure 4-43. Figure 4-44
indicates changes in contoured pH values from 2009 to 2010. Specific portions of the
pH plume are discussed below.
4.4.1 Plume Core The 2010 data depict two separate areas containing groundwater with an
approximate pH of 3.5 or less. These include the area around the Bingham Creek
Reservoirs which contains residual low pH water; and the area surrounding
extraction well ECG1146 and extending east in the Bastian Sink area west of
extraction well BSG2784.
Monitoring wells in the Bingham Creek Reservoir area containing a pH of around 3.5
or less include the following: LRG912, which had a pH of 3.7 in 2009 and 3.6 in 2010;

Kennecott Utah Copper Environmental Restoration Group
South Facilities Groundwater April 2011 2010 Remedial Progress Report Page 4-10
B1G951 had a pH of 3.5 in 2009 and 3.3 in 2010 and SRG946 had a pH of 3.5 in 2009
and 3.4 in 2010. Because all three sites are within or adjacent to the footprint of the
Large Bingham Reservoir, residual sediments, especially iron hydroxides with sorbed
hydrogen ions, will likely continue to cause the pH of groundwater to remain low for
many years.
In the area of extraction well ECG1146, three wells had at least one sampling event in
2010 with a pH of 3.5 or less. These wells include ECG1146, ECG1115A, and
ECG1118A. Many of the wells in the acid plume vary between 3.2 and 3.8 on a year to
year basis. Due to these small changes, the map showing pH changes from 2009 to
2010 (Figure 4-44) has relatively large areas that change from less to 3.5 to greater
than 3.5. ECG1144B had a pH of 3.3 in 2009 and 3.6 in 2010.This well changed a
large portion of the 3.5 pH plume area adjacent to ECG1146. ECG1118A has had three
years with a pH of less than 3.5 and this data point is the only one with less than 3.5
pH between the eastern and western portion of the low pH plume, so the 3.5 contour
was drawn to join the area at BSG1179C.
Monitoring well ECG1124B, located adjacent to extraction well ECG1146 and screened
at and below the ECG1146 screen interval, shows a pronounced increase in pH during
the past several years with a measurement of 4.0 in 2006, 5.4 in 2007, 5.8 in 2008,
6.6 in 2009 but decreased slightly to 6.3 in 2010. This increase in pH is likely due to
cleaner water located near the base of principal alluvial aquifer rising upward into the
base of the low pH plume core and the slight decrease is likely because the bottom
portion of the extraction well ECG1146 was sealed off during 2010 (See Section4.1.1-
Acid Extraction Well ECG1146).
In the area of extraction wells BSG1201 and BSG2784, one monitoring well,
BGS1179C, had a pH measurements of 3.5 or less, and measured at 3.43. Both
extraction wells, BSG1201 and BSG2784, show fourth quarter sampling events for
2010 with a pH above 3.5.
4.4.2 Leading Edge of Plume The average pH in well BSG1119B in 2009 was 4.7 and decreased to 4.6 in 2010. In
BSG2777A, the pH average remained the same at 4.4 from 2009 to 2010. Monitoring
wells located east of BSG1119B and BSG2777A have neutral or near neutral pH values,
however, small pH changes have caused relatively large changes in the pH change
map (Figure 4-44). The nearest monitoring wells located downgradient of BSG1119B
is BSG2779A, B and C. Measurements of pH in all of the wells remained relatively
steady from 2009 to 2010. However, the pH at B2G1157B decreased from last quarter
of 2009 at 6.85 to 6.78 in last quarter of 2010. BSG1133A, B, and C are the nearest
down gradient wells to BSG2777A and are located approximately 1700 feet east. The
pH of BSG1133B decreased from 7.3 in fourth quarter of 2009 to 7.2 in fourth quarter
of 2010. pH field measurements are collected at each sampling event and would have
some inherent variability so changes could from year to year are expected.

Kennecott Utah Copper Environmental Restoration Group
South Facilities Groundwater April 2011 2010 Remedial Progress Report Page 4-11
Minor changes in pH from 2009 to 2010 were observed at the barrier wells. Average
pH measurements for 2010 were 7.3 at LTG1147, 6.9 at B2G1193, and 7.2 at
BFG1200.
Along the north side of the plume area at well WJG1169B, pH remained the same
from 2009 to 2010 at 7.2.
Monitoring wells between barrier well BFG1200 and West Jordan’s municipal wells,
including WJG1154A and B, WJG1170A and B and WJG1171A and B show steady pH
measurements above a pH of 7.0.


Kennecott Utah Copper Environmental Restoration Group
South Facilities Groundwater April 2011 2010 Remedial Progress Report Page 4-15
Figure 4-4 Time-Series Plot of Sulfate in SRG946 (See 4.1.1)
1996 1997 1998 1999 2000 2001 2002 2003 2004 2005 2006 2007 2008 2009 2010 2011
Sul
fate
(mg/
l)
0
5000
10000
15000
20000
25000
30000
35000
SRG946 SO4SRG946 DTW
Screened Interval and D
epth to Water (feet below
ground surface)
0
100
200
300
400
500
600
700
800
900
1000
1100
1200
S

Kennecott Utah Copper Environmental Restoration Group
South Facilities Groundwater April 2011 2010 Remedial Progress Report Page 4-16
Figure 4-5 Time-Series Plot of Sulfate in ECG1115A, B, and C (See 4.1.1)
1996 1997 1998 1999 2000 2001 2002 2003 2004 2005 2006 2007 2008 2009 2010 20110
5000
10000
15000
20000
25000
30000
35000
40000
45000
50000
ECG1115A SO4ECG1115B SO4ECG1115C SO4ECG1115A DTW
Screened Intervals and D
epth to Water (feet below
ground surface)
0
100
200
300
400
500
600
700
800
900
1000
1100
1200
A
B
C
Sulfa
te (m
g/l)

Kennecott Utah Copper Environmental Restoration Group
South Facilities Groundwater April 2011 2010 Remedial Progress Report Page 4-17
Figure 4-6 Time-Series Plot of Sulfate in ECG1124A, B, and C and ECG1146 (See 4.1.1)
1995 1996 1997 1998 1999 2000 2001 2002 2003 2004 2005 2006 2007 2008 2009 2010 20110
5000
10000
15000
20000
25000
30000
35000
40000
45000
50000
ECG1124A SO4ECG1124B SO4ECG1124C SO4ECG1146 SO4ECG1124B DTW
Screened Intervals and D
epth to Water (feet below
ground surface)0
100
200
300
400
500
600
700
800
900
1000
1100
1200
A
B
C
Sul
fate
(mg/
l)

Kennecott Utah Copper Environmental Restoration Group
South Facilities Groundwater April 2011 2010 Remedial Progress Report Page 4-18
Figure 4-7 Time-Series Plot of Sulfate in ECG1145A, B, and C (See 4.1.1)
1996 1997 1998 1999 2000 2001 2002 2003 2004 2005 2006 2007 2008 2009 2010 20110
5000
10000
15000
20000
25000
30000
35000
ECG1145A SO4ECG1145B SO4ECG1145C SO4ECG1145A DTW
Screened Intervals and Depth to W
ater (feet below ground surface)
0
100
200
300
400
500
600
700
800
900
1000
1100
1200
A
B
C
Sul
fate
(mg/
l)

Kennecott Utah Copper Environmental Restoration Group
South Facilities Groundwater April 2011 2010 Remedial Progress Report Page 4-19
Figure 4-8 Time-Series Plot of Sulfate in ECG1144A, B, and C (See 2.1.1)
1996 1997 1998 1999 2000 2001 2002 2003 2004 2005 2006 2007 2008 2009 2010 20110
5000
10000
15000
20000
25000
30000
35000
40000
ECG1144A SO4ECG1144B SO4ECG1144C SO4 ECG1144A DTW
Screened Intervals and D
epth to Water (feet below
ground surface)0
100
200
300
400
500
600
700
800
900
1000
1100
1200
A
B
C
Sulfa
te (m
g/l)

Kennecott Utah Copper Environmental Restoration Group
South Facilities Groundwater April 2011 2010 Remedial Progress Report Page 4-20
Figure 4-9 Time-Series Plot of Sulfate in ECG1128A, B, and C (See 4.1.1)
1996 1997 1998 1999 2000 2001 2002 2003 2004 2005 2006 2007 2008 2009 2010 20110
5000
10000
15000
20000
25000
30000
35000
40000
ECG1128A SO4ECG1128B SO4ECG1128C SO4ECG1128A DTW
Screened Intervals and D
epth to Water (feet below
ground surface)0
100
200
300
400
500
600
700
800
900
1000
1100
1200
A
B
C
Sul
fate
(mg/
l)

Kennecott Utah Copper Environmental Restoration Group
South Facilities Groundwater April 2011 2010 Remedial Progress Report Page 4-21
Figure 4-10 Time-Series Plot of Sulfate in ECG1118A, B, and C (See 4.1.1)
1996 1997 1998 1999 2000 2001 2002 2003 2004 2005 2006 2007 2008 2009 2010 2011
Sul
fate
(mg/
l)
0
5000
10000
15000
20000
25000
ECG1118A SO4ECG1118B SO4ECG1118C SO4ECG1118A DTW
Screened Intervals and D
epth to Water (feet below
ground surface)0
100
200
300
400
500
600
700
800
900
1000
1100
1200
A
B
C

Kennecott Utah Copper Environmental Restoration Group
South Facilities Groundwater April 2011 2010 Remedial Progress Report Page 4-22
Figure 4-11 Time-Series Plot of Sulfate in BSG1177A, B, and C and BSG1201 (See 4.1.1)
1996 1997 1998 1999 2000 2001 2002 2003 2004 2005 2006 2007 2008 2009 2010 20110
5000
10000
15000
20000
25000
30000
35000
BSG1177A SO4BSG1177B SO4BSG1177C SO4BSG1201 SO4BSG1177A DTW
Screened Intervals and D
epth to Water (feet below
ground surface)0
100
200
300
400
500
600
700
800
900
1000
1100
1200
A
B
C
Sulfa
te (m
g/l)

Kennecott Utah Copper Environmental Restoration Group
South Facilities Groundwater April 2011 2010 Remedial Progress Report Page 4-23
Figure 4-12 Time-Series Plot of Sulfate in BSG1119A, B, and C (See 4.1.1)
1996 1997 1998 1999 2000 2001 2002 2003 2004 2005 2006 2007 2008 2009 2010 20110
2000
4000
6000
8000
10000
12000
BSG1119A SO4BSG1119B SO4BSG1119C SO4BSG1119B DTW
Screened Intervals and D
epth to Water (feet below
ground surface)0
100
200
300
400
500
600
700
800
900
1000
1100
1200
A
B
C
Sul
fate
(mg/
l)

Kennecott Utah Copper Environmental Restoration Group
South Facilities Groundwater April 2011 2010 Remedial Progress Report Page 4-24
Figure 4-13 Time-Series Plot of Sulfate in BSG2782A, B, and C and BSG2784 (See 4.1.1)
1996 1997 1998 1999 2000 2001 2002 2003 2004 2005 2006 2007 2008 2009 2010 2011 0
5000
10000
15000
20000
25000
30000
35000
40000
BSG2782A SO4 BSG2782B SO4BSG2782C SO4BSG2782A DTW BSG2784 SO4
Screened Intervals and D
epth to Water (feet below
ground surface)
0
100
200
300
400
500
600
700
800
900
1000
1100
1200
A
B
C
Sul
fate
(mg/
l)
PU
MP
ING
STA
RTE
D A
T B
SG27
84

Kennecott Utah Copper Environmental Restoration Group
South Facilities Groundwater April 2011 2010 Remedial Progress Report Page 4-25
Figure 4-14 Time-Series Plot of Sulfate in BSG1179A, B, and C and P241B (See 4.1.1)
1996 1997 1998 1999 2000 2001 2002 2003 2004 2005 2006 2007 2008 2009 2010 20110
5000
10000
15000
20000
25000
30000
BSG1179A SO4BSG1179B SO4BSG1179C SO4BSG1179A DTW P241B SO4
Screened Intervals and D
epth to Water (feet below
ground surface)0
100
200
300
400
500
600
700
800
900
1000
1100
1200
A
P
B
C
Sul
fate
(mg/
l)
PUM
PIN
G S
TAR
TED
AT
BSG
2784

Kennecott Utah Copper Environmental Restoration Group
South Facilities Groundwater April 2011 2010 Remedial Progress Report Page 4-26
Figure 4-15 Time-Series Plot of Sulfate in BSG2783A, B, and C (See 4.1.1)
1996 1997 1998 1999 2000 2001 2002 2003 2004 2005 2006 2007 2008 2009 2010 2011 0
5000
10000
15000
20000
25000
BSG2783A SO4 BSG2783B SO4BSG2783C SO4BSG2783B DTW
Screened Intervals and D
epth to Water (feet below
ground surface)
0
100
200
300
400
500
600
700
800
900
1000
1100
1200
A
B
C
Sul
fate
(mg/
l)
PUM
PIN
G S
TAR
TED
AT
BSG
2784

Kennecott Utah Copper Environmental Restoration Group
South Facilities Groundwater April 2011 2010 Remedial Progress Report Page 4-27
Figure 4-16 Time-Series Plot of Sulfate in BSG2777A, B, and C (See 4.1.1)
1996 1997 1998 1999 2000 2001 2002 2003 2004 2005 2006 2007 2008 2009 2010 20110
5000
10000
15000
20000
25000
BSG2777A SO4BSG2777B SO4BSG2777A DTW
Screened Intervals and D
epth to Water (feet below
ground surface)0
100
200
300
400
500
600
700
800
900
1000
1100
1200
A
B
Sul
fate
(mg/
l)
PUM
PIN
G S
TAR
TED
AT
BSG
2784

Kennecott Utah Copper Environmental Restoration Group
South Facilities Groundwater April 2011 2010 Remedial Progress Report Page 4-28
Figure 4-17 Time-Series Plot of Sulfate in B2G1157A, B, and C and B2G1193 (See 4.1.2)
1996 1997 1998 1999 2000 2001 2002 2003 2004 2005 2006 2007 2008 2009 2010 20110
1000
2000
3000
4000
5000
6000
7000
8000
B2G1157A SO4B2G1157B SO4B2G1157C SO4B2G1193 SO4B2G1157B DTW
Screened Intervals and D
epth to Water (feet below
ground surface)
0
100
200
300
400
500
600
700
800
900
1000
1100
1200
A
B
C
Sul
fate
(mg/
l)

Kennecott Utah Copper Environmental Restoration Group
South Facilities Groundwater April 2011 2010 Remedial Progress Report Page 4-29
Figure 4-18 Time-Series Plot of Sulfate in BFG1156A through F (See 4.1.2)
1996 1997 1998 1999 2000 2001 2002 2003 2004 2005 2006 2007 2008 2009 2010 20110
500
1000
1500
2000
2500
BFG1156A SO4BFG1156B SO4BFG1156C SO4BFG1156D SO4BFG1156E SO4BFG1156F SO4BFG1156B DTW
Screened Intervals and D
epth to Water (feet below
ground surface)0
100
200
300
400
500
600
700
800
900
1000
1100
1200
A
B
C
D
E
F
Sul
fate
(mg/
l)

Kennecott Utah Copper Environmental Restoration Group
South Facilities Groundwater April 2011 2010 Remedial Progress Report Page 4-30
Figure 4-19 Time-Series Plot of Sulfate in BFG1155A through F and B2G1200 (See 4.1.2)
1996 1997 1998 1999 2000 2001 2002 2003 2004 2005 2006 2007 2008 2009 2010 20110
200
400
600
800
1000
1200
1400
BFG1155A SO4BFG1155B SO4BFG1155C SO4BFG1155D SO4BFG1155E SO4BFG1155F SO4BFG1155C DTWBFG1200 SO4
Screened Intervals and D
epth to Water (feet below
ground surface)0
100
200
300
400
500
600
700
800
900
1000
1100
1200
A
B
C
D
E
F
Sul
fate
(mg/
l)

Kennecott Utah Copper Environmental Restoration Group
South Facilities Groundwater April 2011 2010 Remedial Progress Report Page 4-31
Figure 4-20 Time-Series Plot of Sulfate in BFG1195A and B (See 4.1.2)
1996 1997 1998 1999 2000 2001 2002 2003 2004 2005 2006 2007 2008 2009 2010 20110
200
400
600
800
1000
1200
1400
1600
1800
BFG1195A SO4BFG1195B SO4BFG1195A DTW
Screened Intervals and D
epth to Water (feet below
ground surface)0
100
200
300
400
500
600
700
800
900
1000
1100
1200
A
B
Sul
fate
(mg/
l)

Kennecott Utah Copper Environmental Restoration Group
South Facilities Groundwater April 2011 2010 Remedial Progress Report Page 4-32
Figure 4-21 Time-Series Plot of Sulfate in P277 (See 4.1.2)
1996 1997 1998 1999 2000 2001 2002 2003 2004 2005 2006 2007 2008 2009 2010 20110
200
400
600
800
1000
1200
1400
1600
1800
2000
P277 SO4P277 DTW
Screened Interval and D
epth to Water (feet below
ground surface)0
100
200
300
400
500
600
700
800
900
1000
1100
1200
P
Sul
fate
(mg/
l)

Kennecott Utah Copper Environmental Restoration Group
South Facilities Groundwater April 2011 2010 Remedial Progress Report Page 4-33
Figure 4-22 Time-Series Plot of Sulfate in B2G1194A and B (See 4.1.2)
1996 1997 1998 1999 2000 2001 2002 2003 2004 2005 2006 2007 2008 2009 2010 20110
500
1000
1500
2000
B2G1194A SO4B2G1194B SO4B2G1194A DTW
Screened Intervals and Depth to W
ater (feet below ground surface)
0
100
200
300
400
500
600
700
800
900
1000
1100
1200
A
B
Sulfa
te (m
g/l)

Kennecott Utah Copper Environmental Restoration Group
South Facilities Groundwater April 2011 2010 Remedial Progress Report Page 4-34
Figure 4-23 Time-Series Plot of Sulfate in B3G1197A, B, and C (See 4.1.2)
1996 1997 1998 1999 2000 2001 2002 2003 2004 2005 2006 2007 2008 2009 2010 20110
50
100
150
200
250
300
350
B3G1197A SO4B3G1197B SO4B3G1197C SO4B3G1197A DTW
Screened Intervals and D
epth to Water (feet below
ground surface)0
100
200
300
400
500
600
700
800
900
1000
1100
1200
A
B
C
Sul
fate
(mg/
l)

Kennecott Utah Copper Environmental Restoration Group
South Facilities Groundwater April 2011 2010 Remedial Progress Report Page 4-35
Figure 4-24 Time-Series Plot of Sulfate in P241C (See 4.1.3)
1996 1997 1998 1999 2000 2001 2002 2003 2004 2005 2006 2007 2008 2009 2010 20110
200
400
600
800
1000
1200
P241C SO4P241C DTW
Screened Intervals and D
epth to Water (feet below
ground surface)
0
100
200
300
400
500
600
700
800
900
1000
1100
1200
C
Sul
fate
(mg/
l)

Kennecott Utah Copper Environmental Restoration Group
South Facilities Groundwater April 2011 2010 Remedial Progress Report Page 4-36
Figure 4-25 Time-Series Plot of Sulfate in BSG1148A, B, and C (See 4.1.3)
1996 1997 1998 1999 2000 2001 2002 2003 2004 2005 2006 2007 2008 2009 2010 20110
500
1000
1500
2000
2500
3000
3500
BSG1148A SO4BSG1148B SO4BSG1148C SO4BSG1148A DTW
Screened Intervals and D
epth to Water (feet below
ground surface)0
100
200
300
400
500
600
700
800
900
1000
1100
1200
A
B
C
Sul
fate
(mg/
l)

Kennecott Utah Copper Environmental Restoration Group
South Facilities Groundwater April 2011 2010 Remedial Progress Report Page 4-37
Figure 4-26 Time-Series Plot of Sulfate in BSG1133A, B, and C (See 4.1.3)
1996 1997 1998 1999 2000 2001 2002 2003 2004 2005 2006 2007 2008 2009 2010 20110
1000
2000
3000
4000
5000
BSG1133A SO4BSG1133B SO4BSG1133C SO4BSG1133B DTW
Screened Intervals and Depth to W
ater (feet below ground surface)
0
100
200
300
400
500
600
700
800
900
1000
1100
1200
A
B
C
Sulfa
te (m
g/l)
DRY

Kennecott Utah Copper Environmental Restoration Group
South Facilities Groundwater April 2011 2010 Remedial Progress Report Page 4-38
Figure 4-27 Time-Series Plot of Sulfate in BSG1132A, B, and C (See 4.1.3)
1996 1997 1998 1999 2000 2001 2002 2003 2004 2005 2006 2007 2008 2009 2010 20110
500
1000
1500
2000
2500
3000
BSG1132A SO4BSG1132B SO4BSG1132C SO4BSG1132A DTW
Screened Intervals and Depth to W
ater (feet below ground surface)
0
100
200
300
400
500
600
700
800
900
1000
1100
1200
A
B
C
Sul
fate
(mg/
l)

Kennecott Utah Copper Environmental Restoration Group
South Facilities Groundwater April 2011 2010 Remedial Progress Report Page 4-39
Figure 4-28 Time-Series Plot of Sulfate in W363 (See 4.1.4)
1996 1997 1998 1999 2000 2001 2002 2003 2004 2005 2006 2007 2008 2009 2010 2011100
120
140
160
180
200
W363 SO4
Screened Interval and D
epth to Water (feet below
ground surface)0
100
200
300
400
500
600
700
800
900
1000
1100
1200
W
Sul
fate
(mg/
l)

Kennecott Utah Copper Environmental Restoration Group
South Facilities Groundwater April 2011 2010 Remedial Progress Report Page 4-40
Figure 4-29 Time-Series Plot of Sulfate WJG1154A, B, and C (See 4.1.4)
1996 1997 1998 1999 2000 2001 2002 2003 2004 2005 2006 2007 2008 2009 2010 20110
100
200
300
400
500
600
700
WJG1154A SO4WJG1154B SO4WJG1154C SO4WJG1154B DTW
Screened Intervals and D
epth to Water (feet below
ground surface)0
100
200
300
400
500
600
700
800
900
1000
1100
1200
A
B
C
Sul
fate
(mg/
l)

Kennecott Utah Copper Environmental Restoration Group
South Facilities Groundwater April 2011 2010 Remedial Progress Report Page 4-41
Figure 4-30 Time-Series Plot of Sulfate in WJG1170A, B, and C (See 4.1.4)
1996 1997 1998 1999 2000 2001 2002 2003 2004 2005 2006 2007 2008 2009 2010 20110
100
200
300
400
500
600
WJG1170A SO4WJG1170B SO4WJG1170C SO4WJG1170B DTW
Screened Intervals and D
epth to Water (feet below
ground surface)
0
100
200
300
400
500
600
700
800
900
1000
1100
1200
A
B
C
Sul
fate
(mg/
l)
DRY

Kennecott Utah Copper Environmental Restoration Group
South Facilities Groundwater April 2011 2010 Remedial Progress Report Page 4-42
Figure 4-31 Time-Series Plot of Sulfate in WJG1171A, B, and C (See 4.1.4)
1996 1997 1998 1999 2000 2001 2002 2003 2004 2005 2006 2007 2008 2009 2010 20110
20
40
60
80
100
120
140
160
180
200
WJG1171A SO4WJG1171B SO4 WJG1171C SO4 WJG1171A DTW
Screened Intervals and D
epth to Water (feet below
ground surface)0
100
200
300
400
500
600
700
800
900
1000
1100
1200
A
B
C
Sul
fate
(mg/
l)


Kennecott Utah Copper Environmental Restoration Group
South Facilities Groundwater April 2011 2010 Remedial Progress Report Page 4-45
Figure 4-34 Time-Series Plot of Aluminum in SRG946 (See 4.2)
1996 1997 1998 1999 2000 2001 2002 2003 2004 2005 2006 2007 2008 2009 2010 2011
Sul
fate
(mg/
L)
0
5000
10000
15000
20000
25000
30000
35000
SRG946 SO4SRG946 DTW
Screened Interval and D
epth to Water (feet below
ground surface)0
100
200
300
400
500
600
700
800
900
1000
1100
1200
S

Kennecott Utah Copper Environmental Restoration Group
South Facilities Groundwater April 2011 2010 Remedial Progress Report Page 4-46
Figure 4-35 Time-Series Plot of Aluminum in ECG1115A, B, and C (See 4.2)
1996 1997 1998 1999 2000 2001 2002 2003 2004 2005 2006 2007 2008 2009 2010 20110
5000
10000
15000
20000
25000
30000
35000
40000
45000
50000
ECG1115A SO4ECG1115B SO4ECG1115C SO4ECG1115A DTW
Screened Intervals and D
epth to Water (feet below
ground surface)0
100
200
300
400
500
600
700
800
900
1000
1100
1200
A
B
C
Sul
fate
(mg/
l)

Kennecott Utah Copper Environmental Restoration Group
South Facilities Groundwater April 2011 2010 Remedial Progress Report Page 4-47
Figure 4-36 Time-Series Plot of Aluminum in ECG1146 and ECG1124A, B, and C (See 4.2)
1996 1997 1998 1999 2000 2001 2002 2003 2004 2005 2006 2007 2008 2009 2010 20110
500
1000
1500
2000
2500
3000
3500
ECG1124A AlECG1124B AlECG1124C AlECG1146 AlECG1124B DTW
Alu
min
um (m
g/l)
Screened Intervals and D
epth to Water (feet below
ground surface)
0
100
200
300
400
500
600
700
800
900
1000
1100
1200
A
B
C

Kennecott Utah Copper Environmental Restoration Group
South Facilities Groundwater April 2011 2010 Remedial Progress Report Page 4-48
Figure 4-37 Time-Series Plot of Aluminum in ECG1128A (See 4.2)
1996 1997 1998 1999 2000 2001 2002 2003 2004 2005 2006 2007 2008 2009 2010 20110
5000
10000
15000
20000
25000
30000
35000
40000
ECG1128A SO4ECG1128B SO4ECG1128C SO4ECG1128A DTW
Screened Intervals and D
epth to Water (feet below
ground surface)0
100
200
300
400
500
600
700
800
900
1000
1100
1200
A
B
C
Sulfa
te (m
g/l)
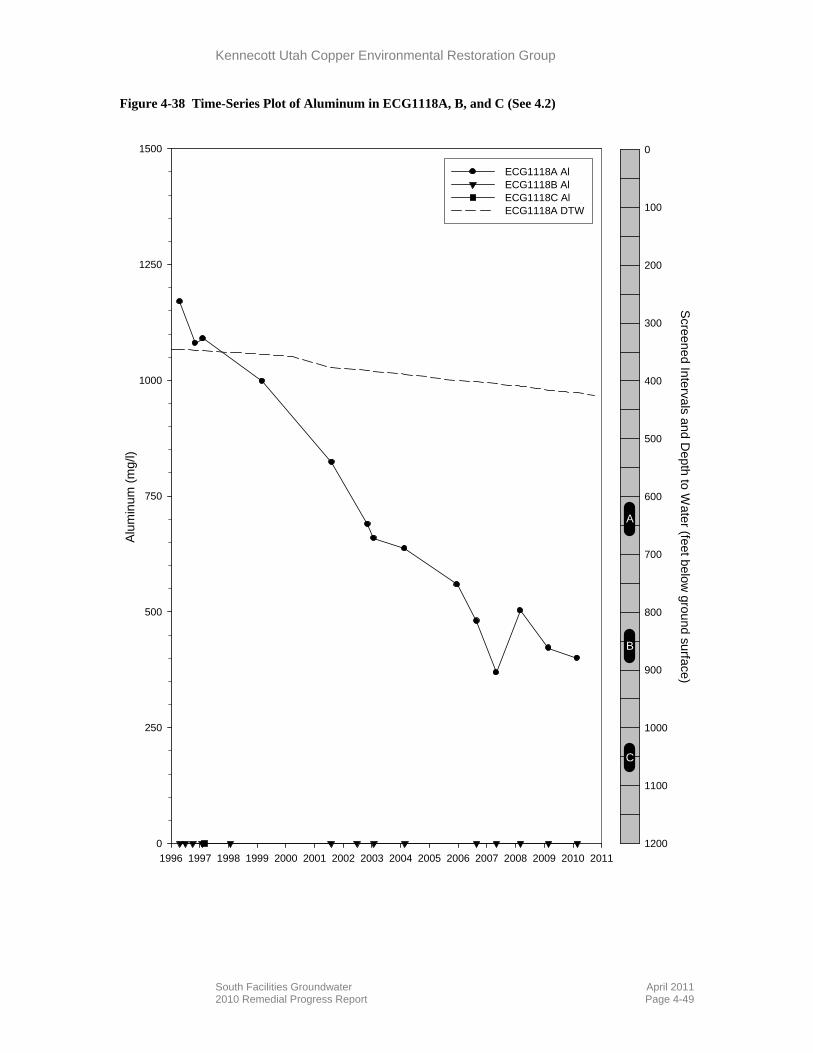
Kennecott Utah Copper Environmental Restoration Group
South Facilities Groundwater April 2011 2010 Remedial Progress Report Page 4-49
Figure 4-38 Time-Series Plot of Aluminum in ECG1118A, B, and C (See 4.2)
1996 1997 1998 1999 2000 2001 2002 2003 2004 2005 2006 2007 2008 2009 2010 2011
Alu
min
um (m
g/l)
0
250
500
750
1000
1250
1500
ECG1118A AlECG1118B AlECG1118C AlECG1118A DTW
Screened Intervals and D
epth to Water (feet below
ground surface)0
100
200
300
400
500
600
700
800
900
1000
1100
1200
A
B
C

Kennecott Utah Copper Environmental Restoration Group
South Facilities Groundwater April 2011 2010 Remedial Progress Report Page 4-50
Figure 4-39 Time-Series Plot of Aluminum in BSG1201 (See 4.2)
1996 1997 1998 1999 2000 2001 2002 2003 2004 2005 2006 2007 2008 2009 2010 2011
Alu
min
um (m
g/l)
0
100
200
300
400
500
600
700
BSG1201 AlBSG1177A DTW
Screened Intervals and D
epth to Water (feet below
ground surface)
0
100
200
300
400
500
600
700
800
900
1000
1100
1200
A
B
C

Kennecott Utah Copper Environmental Restoration Group
South Facilities Groundwater April 2011 2010 Remedial Progress Report Page 4-51
Figure 4-40 Time-Series Plot of Aluminum in BSG2782A, B, and C and BSG2784 (See 4.2)
1996 1997 1998 1999 2000 2001 2002 2003 2004 2005 2006 2007 2008 2009 2010 2011
Alu
min
um (m
g/l)
0
200
400
600
800
1000
1200
1400
1600
1800
2000
BSG2782A Al BSG2782B Al BSG2782C Al BSG2782A DTW BSG2784 Al
Screened Intervals and D
epth to Water (feet below
ground surface)
0
100
200
300
400
500
600
700
800
900
1000
1100
1200
A
B
C
PUM
PIN
G S
TAR
TED
AT
BSG
2784

Kennecott Utah Copper Environmental Restoration Group
South Facilities Groundwater April 2011 2010 Remedial Progress Report Page 4-52
Figure 4-41 Time-Series Plot of Aluminum in BSG1119B (See 4.2)
1996 1997 1998 1999 2000 2001 2002 2003 2004 2005 2006 2007 2008 2009 2010 2011
Al (
mg/
L)
0
10
20
30
40
50
60
pH
4.2
4.4
4.6
4.8
5.0
5.2
5.4
5.6
5.8
6.0
6.2
6.4
BSG1119B AlBSG1119B pHBSG1119B DTW
Screened Intervals and D
epth to Water (feet below
ground surface)
0
100
200
300
400
500
600
700
800
900
1000
1100
1200
A
B
C

Kennecott Utah Copper Environmental Restoration Group
South Facilities Groundwater April 2011 2010 Remedial Progress Report Page 4-53
Figure 4-42 Time-Series Plot of Aluminum in BSG2777A and B (See 4.2)
1996 1997 1998 1999 2000 2001 2002 2003 2004 2005 2006 2007 2008 2009 2010 20110
50
100
150
200
BSG2777A AlBSG2777B AlBSG2777A DTW
Screened Intervals and D
epth to Water (feet below
ground surface)0
100
200
300
400
500
600
700
800
900
1000
1100
1200
A
B
Alu
min
um (m
g/l)
PUM
PIN
G S
TAR
TED
AT
BSG
2784


Kennecott Utah Copper Environmental Restoration Group
South Facilities Groundwater April 2011 2010 Remedial Progress Report Page 5-1
5. Groundwater Elevation
KUC performs annual water level measurements at about 195 wells in the greater
Zone A area during September through early October. KUC uses the water level data
to monitor the response of the alluvial groundwater system to on-going aquifer
remediation activities and nearby municipal groundwater extraction. These data also
provide insight into the relationship between groundwater recharge, storage, and
discharge in the principal alluvial aquifer system.
The results of the water level measurements for 2010 are presented in Appendix B.
These water level measurements were corrected for fluid density effects on
potentiometric head. Groundwater with elevated total dissolved solid concentrations
has a higher specific gravity than do fresh waters. Consequently, corrections to
measured water levels were performed to convert the measured hydraulic heads to
equivalent fresh-water hydraulic heads. In most portions of the aquifer, where TDS
concentrations are moderate, the density corrections applied to water levels are small,
generally less than one foot. In areas where groundwater TDS concentrations are
elevated appreciably, such as within the plume core, the density corrections may be
on the order of several feet.
5.1 Groundwater Gradients A contour map of water level elevations in the upper portion of the alluvial aquifer in
the Zone A plume area for September 2010 is presented on Figure 5-1. Data from
pumping wells were omitted from the contouring dataset unless the well had not been
pumped for a sufficient amount of time for the water level to recover from localized
pumping effects. Some wells along the western margin of the alluvial aquifer that are
screened in shallow bedrock were also used in the creation of the water level contour
maps. The contour lines shown in Figure 5-1 were generated using the computer
program Surfer 8 by Golden Software, Inc.
As shown on Figure 5-1, the hydraulic gradient in the upper portion of the alluvial
aquifer is from upland recharge areas in the west toward lower elevation regions to
the east, nearer the center of the southwestern Jordan Valley. The hydraulic gradient
in the alluvial aquifer is steep (approximately 0.056 or 300 feet per mile) from the
east side mine waste-rock dumps to approximately 1,700 feet east of Highway 111.
The groundwater gradient then flattens considerably for a distance of approximately
4,000 feet eastward before again becoming appreciably steeper to the west of KUC’s
barrier wells (B2G1193 and BFG1200). The gradient is again flatter from the
production wells east to eastern margin of Zone A plume area with a gradient of about
0.005 (40 feet per mile). The variability in the hydraulic gradient may be due in part
to lateral heterogeneity in hydraulic conductivity of the alluvial sediments in the
basin, as was observed during KUC well drilling activities in the area.

Kennecott Utah Copper Environmental Restoration Group
South Facilities Groundwater April 2011 2010 Remedial Progress Report Page 5-2
The influence of groundwater pumping from KUC’s production wells is apparent in
deflections of the contour lines near the KUC production wells. The water level
contours show a general deflection for a relatively large area at and upgradient of acid
extraction well ECG1146, in the western portion of the acid plume, indicating that
water from that area is being captured at ECG1146.
The other area showing a deflection of the water contours is centered near extraction
wells BFG1200 and B2G1193. Both wells were pumped during 2010 but at variable
rates due to motor problems at BFG1200. This area along with the West Jordan Well
Field depicts a large area of ground water extraction. West Jordan regularly pumps
their three wells during the months of May through September, depending on water
needs. This same area has experienced heavy pumping for a number of years.
Extraction well LTG1147 was pumped for most of 2010 and LTG1139 was pumped less
than 25 percent of the time during 2010. Both are located along 11800 South. A
relative large deflection in the water level contours is especially apparent at LTG1139
due to timing of measurements verses pumping.
Large vertical hydraulic gradients were generally not observed in the Zone A plume
area (away from pumping wells) during 2010. Moderate vertical gradients were
observed in some localized areas. The lack of appreciable vertical hydraulic gradients
is consistent with the generally unconfined condition in the alluvial aquifer system in
the project area.
5.2 One-Year Water-Level Elevation Changes A map showing the contoured change in water levels in the upper portion of the
alluvial aquifer system in the greater Zone A area between September 2009 and
September 2010 is presented on Figure 5-2. For zones of increasing and decreasing
water levels, changes were contoured on one-foot intervals from 0 to 10 feet of change
and 5 feet intervals for changes of more than 10 feet.
Water levels as measured from September 2009 to September 2010 along the
Eastside Collection and Butterfield Canyon have generally declined from less than
one foot t0 to about one foot. Water level declines are attributed to limited recharge
and from pumping east and down-gradient from these areas.
Notable water level declines of up to two feet near the mouth of Bingham Canyon are
apparent. Near Bingham Canyon, the decrease is likely due the addition of another
extraction well in the mouth of Bingham Canyon to assist with alluvial extraction for
this area.
Comparison of select spring water levels with fall water levels in individual wells
indicates notable seasonal variability in areas along the western margin of the alluvial
aquifer, demonstrating the influence of the annual recharge event to water levels in

Kennecott Utah Copper Environmental Restoration Group
South Facilities Groundwater April 2011 2010 Remedial Progress Report Page 5-3
the alluvial aquifer. Appreciable seasonal fluctuations in water levels in wells further
eastward are generally not apparent.
Water levels in the Bingham reservoirs area show some variation with September
2009 to September 2010. Monitoring wells located immediately upgradient of the
reservoirs all decreased less than one foot, which include P248A, B and C while
LRG912 decreased 1.48 feet but LRG911 increased 1.98 feet. Water levels north of the
reservoir system decreased up to 1.5 feet from September 2009 to September 2010.
Between September 2009 and September 2010, water levels in the western portion of
the acid plume, in the vicinity of acid extraction well ECG1146, decreased from 1 to 12
feet. The amount of decrease is proportional to the distance from the extraction well.
Because pumping at ECG1146 did not take place until late May/June 2010, the area of
water level decline did not reach as far northwest or south as has been seen in past
years when the annual measurements were collected in September. Consequently,
wells ECG1117A (+7.98 ft) and P208B (+6.05 ft) showed increasing water levels due
to the previous year (2009) partial year pumping.
Water levels continued to decline in the eastern portion of the acid plume area near
acid extraction wells BSG1201 and BSG2784 from September 2009 to September
2010. Partial-year pumping occurred at both wells with very minor pumping in the
first quarter of 2010. BSG1201 was pumped for most of the last half of 2010 and
BSG2784 was pumped from the last part of March through the end of 2010.
Monitoring wells within one-quarter mile of the two acid extraction wells and within
the principal alluvial aquifer showed the water declining between 1 to 8 feet.
Pumping both acid wells for this area appears to have caused a fairly consistent water
decline within a quarter mile upgradient and adjacent to the extraction wells. These
monitoring wells including BSG1148A and B, BSG1177A, B and C, BSG1179A, B and C,
BSG1180B and C, BSG1196B and C, BSG2777A and B, BSG2782A, B and C and
BSG2783A B and C all show a decline of 6 to 8 feet. Certain monitoring wells,
including WJG1169A, COG1175A, B2G1176A and COG1178A, all located more than
half a mile northerly from BSG1201, show water levels declines of 4 to 6 feet.
Monitoring wells P273 and BSG1153A and B, located about three quarter mile
southwest of extraction well BSG1201 showed declines of 0 to 4 feet. BSG1119B,
located on the leading edge of the acid plume showed decline 3.39 feet.
For the barrier well area, water levels in the immediate vicinity of extraction wells
B2G1193 and BFG1200 decreased generally 2 to 3 feet from September 2009 to
September 2010. These changes are due to the continuous extraction from the two
KUC wells and continued seasonal extraction by West Jordan. Monitoring well
BFG1136B, located approximately 2,350 feet northwest of extraction well B2G1193
had the largest water level decline for this area at 5.24 feet which was the only level
for this area that declined by more than3 feet. At locations further north from
B2G1193 and BFG1200, including the West Jordan well field area, water levels
declined from 1 to 3 feet between September 2009 and September 2010. Water levels
in the barrier well LTG1147 area, which was pumped for most of 2010, declined 2 to 7

Kennecott Utah Copper Environmental Restoration Group
South Facilities Groundwater April 2011 2010 Remedial Progress Report Page 5-4
feet. Monitoring wells immediately adjacent to LTG1147 declined by 4 to 5 feet.
HMG1123A, located one-half mile east of LTG1147 showed the biggest decline at 6.92
feet. It appears that pumping at BSG2784 may influence the water level at
HMG1123A.
Water levels in the BSG1139 clean water extraction well area responded from
September 2009 to September 2010 to the partial-year pumping with monitoring
wells upgradient declining from 2 to 10 feet and wells downgradient declining 2 to 6
feet.
KUC’s monitoring at four wells indicates water level changes in the Herriman area
from September 2009 to September 2010. Three sites showed a declining water table
while one had no change. LTG1167A, located approximately one mile northwest of
Herriman, declined 2.64 feet; P267B and HMG1856, located on the northwest edge of
Herriman, declined 1.89 ft and 2.08 feet respectively; and W403, located one-quarter
mile south of Herriman remained the same.
KUC measures water levels for more than 12 monitoring wells in the western portion
of Zone B including the Daybreak area extending to about 2200 West. From
September 2009 to September 2010, water levels for this area varied by up to 2.1 feet
with one exception. The water level at P255B increased 4.54 ft . P255B is adjacent to
the Welby Jacobs Canal and an irrigated field where historic water levels have shown
similar variances.
5.3 Water Level Changes from 1996 to 2010 Figure 5-3 shows changes in water levels in the upper portion of the alluvial aquifer
system from 1996 to 2010. Data from 1996 used to create this map are reported in
Appendix B. The year 1996 represents the initiation of remedial pumping at
extraction well ECG1146, and Figure 5-3 shows, in part, the long-term effects of
remedial pumping on the alluvial aquifer system. However, multiple hydrodynamic
stressors influence water level changes during this time including the discontinuation
of artificial recharge from the Bingham Reservoir System (which occurred from 1965
to 1990), improvements in water capture by the eastside collection system in the
1990s, pumping by KUC at wells K60 and K109 prior to 1996, municipal extractions
in West Jordan and Herriman, and variations in precipitation and natural recharge.
Most of the water level responses indicated on Figure 5-3 are similar to those
apparent in the September 2009 to September 2010 plot (Figure 5-2), but,
expectedly, larger in magnitude. The largest area of water table decline is centered
adjacent to acidic extraction well ECG1146. Monitoring well ECG1124B, located 150
feet north of ECG1146, has declined more than 144 feet from September 1996 to
September 2010. The area of influence from pumping at ECG1146 is elongated from
north to south and the minus 100-foot contour encompasses approximately 90 acres.
Transmissivity for this area is relatively low as compared to the pumping areas east

Kennecott Utah Copper Environmental Restoration Group
South Facilities Groundwater April 2011 2010 Remedial Progress Report Page 5-5
near the eastern acidic extraction wells and in the sulfate extraction area
encompassing B2G1193 and BFG1200.
In the eastern portion of the low pH plume where acidic extraction wells BSG1201
and BSG2784 are located, the maximum water table decline is centered in a north-
south area over approximately a two mile area including monitoring site BFG1198 on
the north and LTG1147 on the south. The decline for this area is greater than 80 feet
from September 1996 through September 2010. The majority of decline for this area
occurred after 2003 when pumping was initiated at BSG1201. LTG1147 extraction
appears to extend the area of pumping influence south for approximately one-half
mile.
For the area that includes sulfate extraction wells B2G1193 and BFG1200, the water
level decline from September 1996 through September 2010 is as much as 70 feet.
For this area, there is less of a pronounced centered area or sink at the pumping wells,
which reflects the higher transmissivity for this area.
The combined effect of pumping from the sulfate and acidic extraction wells as shown
on Figure 5.3 influences a large area. The 50-foot water level decline contour interval
encompasses approximately 6,133 acres. This large area of decline is also influenced
from ground water extraction from private and municipal wells in the West Jordan
and Herriman areas.


Kennecott Utah Copper Environmental Restoration Group
South Facilities Groundwater April 2011 2010 Remedial Progress Report Page 6-1
6. Subsidence
KUC measures ground surface elevation in Zone A to assess possible ground
subsidence caused by groundwater extraction from the plume area. KUC monitored
ground elevation at eight survey sites in May 2010.
The specific well sites selected for survey control are shown on Figure 6-1 and located
as follows: western edge of the acid plume area (K105 and ECG1116); in the acid
plume and adjacent to the west-most acid extraction well (ECG1124); 1,000 feet east
of the eastern acid extraction well (BSG1180); and three wells (BSG1137, BFG1156a
and WJG1170) within a 4,500 foot radius of the two sulfate extraction wells (B2G1193
and BFG1200) located north of Bingham Creek. The monitoring well sites (survey
locations) located near the acid and sulfate extraction wells also coincides with the
greatest observed decrease in water elevation. Each well has a cement pad that
surrounds the steel surface casing and each pad has a steel bolt cemented into it. The
steel bolt was the survey point for six of the wells. The seventh well (K105) was
surveyed on top of the steel surface casing. The land survey monument measured in
2009 and in previous years is called 1973 West, located near the northwest corner of
Section 15, in Township 3 South, Range 2 West, which is on the northern edge of the
plume area.
The sites were surveyed using a global positioning system (GPS) unit (Leica System
530). The degree of accuracy of this GPS unit is approximately 0.25 centimeters
(0.098 inches or 0.008 feet). The survey data utilize NAD83 (North American Datum
of 1983) and NAVD88 (North American Vertical Datum of 1988).
Ground elevation measurements over time are reported in Table 6-1 and shown on
Figure 6-2. Small variations in elevation measurements are attributed to variability
inherent in measurement systems. There are no ground elevations changes that KUC
attributes to groundwater-extraction induced subsidence.

Kennecott Utah Copper Environmental Restoration Group
South Facilities Groundwater April 2011 2010 Remedial Progress Report Page 6-2
Table 6-1 Subsidence Survey Data (Elevation Feet AMSL) Survey
Site 12/19/02 Survey
5/8/09 Survey
6/5/10 Survey
2009-10 Difference
2002-10 Difference
ECG1116 5318.519 5318.5717 5318.5729 + 0.0012 + 0.0539 ECG1124 5250.985 5250.9955 5251.0407 + 0.0452 + 0.0557 BSG1137 4941.591 4941.6297 4941.6344 + 0.0047 + 0.0434
BFG1156A 4997.262 4997.3696 4997.3885 + 0.0189 + 0.1265 WJG1170 4968.166 4968.1561 4968.2007 +0.0446 + 0.0347 BSG1180 5078.004 5078.0651 5078.0749 + 0.0098 + 0.0709
K105 5341.950 5342.0798 5342.1172 + 0.0374 + 0.1672 1973 West --- 5205.4466 5205.4873 + 0.0407 NA


Kennecott Utah Copper Environmental Restoration Group
South Facilities Groundwater April 2011 2010 Remedial Progress Report Page 6-4
Figure 6-2 Time-Series Plots of Ground Elevation Measurements
ECG1116
02 03 04 05 06 07 08 09 10 11
Ele
vatio
n
5318.45
5318.50
5318.55
5318.60
5318.65
ECG1124
02 03 04 05 06 07 08 09 10 11
Ele
vatio
n
5250.90
5250.95
5251.00
5251.05
5251.10
BSG1137
02 03 04 05 06 07 08 09 10 11
Ele
vatio
n
4941.50
4941.55
4941.60
4941.65
4941.70
BFG1156A
02 03 04 05 06 07 08 09 10 11
Ele
vatio
n
4997.20
4997.25
4997.30
4997.35
4997.40

Kennecott Utah Copper Environmental Restoration Group
South Facilities Groundwater April 2011 2010 Remedial Progress Report Page 6-5
Figure 6-2 Continued
WJG1170
02 03 04 05 06 07 08 09 10 11
Ele
vatio
n
4968.00
4968.05
4968.10
4968.15
4968.20
BSG1180
02 03 04 05 06 07 08 09 10 11
Ele
vatio
n
5077.95
5078.00
5078.05
5078.10
5078.15
K105
02 03 04 05 06 07 08 09 10 11
Ele
vatio
n
5341.90
5341.95
5342.00
5342.05
5342.10
5342.15
1973 West
04 05 06 07 08 09 10 11
Ele
vatio
n
5205.30
5205.35
5205.40
5205.45
5205.50

Kennecott Utah Copper Environmental Restoration Group
South Facilities Groundwater April 2011 2010 Remedial Progress Report Page 7-1
7. Tailings Chemistry
KUC manages groundwater extracted from the acid plume and other mining-affected
waters in the tailings pipeline and the North Tailings Impoundment. Other waters
managed in this circuit include meteoric drainage from the Eastside Collection
System, RO concentrate from treatment of the Zone A sulfate plume, and water from
dewatering of the mine pit. Acid plume water, meteoric leach water, and RO
concentrate are commingled in and pumped through the Wastewater Disposal Pump
Station (WDPS) to the beginning of the tailings pipeline. The mine dewatering flows
are pumped directly to the process circuit.
KUC adds lime at the Copperton Concentrator to maintain a high pH during ore
processing and the Bingham Canyon ore also naturally contains carbonate minerals.
The high alkalinity of the tailings process water serves to neutralize the acidity in the
low pH waters added to the tailings line from the WWDPS. The small volume of
metal and gypsum precipitates that result are co-deposited within a much larger mass
of tailings in the tailings impoundment. KUC monitors the chemistry of the tailings
system to assure that acidic plume waters and other mining-affected waters do not
adversely impact the process water system or the long-term acid-generating potential
of the tailings.
7.1 Flow and Tailings pH KUC continuously monitors pH at the North Splitter Box (NSB) and flow through the
WDPS. Daily data for 2010 are reported in Appendix C. These data are plotted on
Figure 7-1 using a 7-day rolling average. Also plotted is ore throughput through the
Copperton Concentrator, which directly correlates to tailings production reporting to
the tailings line. The correlations between WDPS flow, mill throughput, and tailings
pH are readily apparent in these plots.
The monitoring data show that the tailings process circuit maintained the pH at
North Splitter Box above pH 6.7 for every day measured in 2010, except for a no-data
period from January 17 to January 31 when Waste Water Disposal Pump Station and
the acid wells were not running and 3 days in August, when the measured pH was 6.6.
KUC thus met the management criterion listed in Appendix A of the OM&R Plan
which specifies that pH at the North Splitter Box be greater than or equal to 6.7 for
90% of the time over a calendar year.
7.2 Tailings Chemistry As specified by the monitoring program described in Appendix A of the OM&R Plan,
KUC collects aqueous metals concentrations in tailings at NSB to confirm that the
geochemical processes identified during the Remedial Design investigations are
maintained.

Kennecott Utah Copper Environmental Restoration Group
South Facilities Groundwater April 2011 2010 Remedial Progress Report Page 7-2
There are no numeric criteria for the specific chemical conditions – other than pH,
alkalinity, and neutralization potential (NP) – within the process circuit. Inspection
of the data presented in Appendix C shows that the pH-driven solubility controls on
dissolved metals identified in laboratory and field-scale pilot testing continue to
operate.
7.3 UPDES Permit Compliance KUC maintained compliance with UPDES discharge limits for metals concentrations
during 2010.
7.4 Tailings Neutralization Potential KUC monitors NP monthly in general mill tailings (GMT), which provides tailings
neutralization characteristics prior to introduction of acid water flows, and NP and
aqueous alkalinity at the North Splitter Box (NSB), which shows the characteristics of
reacted tailings and the availability of aqueous neutralization potential. KUC uses
these data to measure operation against management criteria and assess the impact
of acid water neutralization on the long-term acid rock drainage potential of the
tailings.
Monthly and 6-month rolling average NP and aqueous alkalinity data are presented
in Table 7 1 and 7-2 respectively. The data indicate that there are some months in
which the NP value at NSB is greater than that at GMT and other months in which GMT
is greater. However, in all cases the NP is greater than 5 tons CaCO3 eq/kt. Monthly
aqueous alkalinity at NSB was greater than 10 mg CaCO3 eq/l in all months of 2010.
KUC thus met the management criteria listed in Appendix A of the OM&R Plan.

Kennecott Utah Copper Environmental Restoration Group
South Facilities Groundwater April 2011 2010 Remedial Progress Report Page 7-3
Table 7-1 2010 Tailing NP (t CaCO3/kt)
Monthly 6-Month Average
Date GMT NSB GMT NSB Jan-10 22 22 39 40 Feb-10 30 20 40 40
Mar-10 35 34 42 41 Apr-10 15 23 41 41 May-10 22 36 26 28 Jun-10 26 31 25 28 Jul-10 19 21 25 28
Aug-10 21 25 23 28 Sep-10 31 33 22 28 Oct-10 20 26 23 29 Nov-10 32 26 25 27 Dec-10 9 15 22 24
Table 7-2 2009 Aqueous Alkalinity (mg CaCO3/l) Monthly 6-Month Average
Date GMT NSB GMT NSB Jan-10 22 68 41 36 Feb-10 25 56 41 44
Mar-10 31 28 41 48 Apr-10 17 5 40 39 May-10 26 11 24 39 Jun-10 385 413 84 97 Jul-10 197 239 114 125
Aug-10 39 88 116 131 Sep-10 32 76 116 139 Oct-10 36 45 119 145 Nov-10 34 87 121 158 Dec-10 58 471 68 168

Kennecott Utah Copper Environmental Restoration Group
South Facilities Groundwater April 2010 2010 Remedial Progress Report Page 7-4
Figure 7-1 2010 Tailings Circuit Monitoring Data (7-Day Average)
Jan Feb Mar Apr May Jun Jul Aug Sep Oct Nov Dec Jan
Tons
Per
Hou
r or G
allo
ns P
er M
inut
e
0
1000
2000
3000
4000
5000
6000
7000
8000
9000
10000
pH
6
7
8
9
10
11Concentrator Throughput (TPH)Acidic Water Pumping (GPM)Tailings pH at North Splitter Box

Kennecott Utah Copper Environmental Restoration Group
South Facilities Groundwater April 2011 2010 Remedial Progress Report Page 8-1
8. References
Environmental Protection Agency and Utah Department of Environmental Quality,
2000, Record of Decision, KUC South Zone, Operable Unit 2, Southwest Jordan River
Valley Groundwater Plumes, December 13, 130 p.
Environmental Protection Agency, 2003, Explanation of Significant Differences,
Kennecott South Zone, OU2, June 23, 6 p.
Environmental Protection Agency, 2007, Explanation of Significant Differences,
Kennecott South Zone, OU2, June, 5 p.
Kennecott Utah Copper Corporation (KUC), 2002. Final Design for Remedial Action
at South Facilities Groundwater, December 2002.
Kennecott Utah Copper Corporation (KUC), 2010a, Groundwater Characterization
and Monitoring Plan, Revision 7, March.
Kennecott Utah Copper Corporation (KUC), 2010b, Standard Operating Procedures
for Water Sampling, Revision 5, March.
Kennecott Utah Copper Corporation (KUC), 2010c, Quality Assurance Project Plan
for the Groundwater Characterization and Monitoring Plan, Revision 6, March.
Kennecott Utah Copper Corporation (KUC), 2009, Operation, Maintenance and
Remediation Plan for South Facilities Groundwater (Version 2, approved April).

Kennecott Utah Copper Environmental Restoration Group
South Facilities Groundwater April 2011 2010 Remedial Progress Report
Appendix A
Groundwater Chemistry Data

Kennecott Utah Copper | Environmental Restoration Group
Table A-1 Water Quality Data 2009-2010pH Cond Temp DTW TDS Ca-T Mg-T Na-T K-T SO4 Cl-T F Alk Ag Acidity Al-D As-D Ba-D Cd-D Cr-D Cu-D Fe-D Pb-D Mn-D Hg-T Ni-D Se-D Zn-Dsu uS/cm C Feet mg/l mg/l mg/l mg/l mg/l mg/l mg/l mg/l mg/l as CaCO3 mg/l mg/l as CaCO3 mg/l mg/l mg/l mg/l mg/l mg/l mg/l mg/l mg/l mg/l mg/l mg/l mg/l
B1G1120A 5/12/2009 3.59 8270 15 351.56 11000 440 2870 80 9.6 7340 218 NM <5 NM NM 245.00 0.016 NM 0.790 <0.01 12.000 0.80 0.019 186.000 NM 7.670 0.016 27.700
B1G1120A 5/11/2010 3.72 8630 13.0 357.15 11000 442 1330 117 6.6 6770 213 NM <5 NM NM <0.02 <0.005 NM <0.001 <0.01 <0.02 0.73 <0.005 <0.01 0.0015 <0.03 0.019 <0.01
B1G1120B 5/12/2009 6.58 8540 16 350.97 12500 517 2000 245 13.0 8510 151 NM 378 NM NM 0.04 0.010 NM 0.003 <0.01 0.025 <0.02 <0.005 19.000 NM 0.190 0.007 0.041
B1G1120B 5/11/2010 6.68 10300 14.0 356.83 13500 486 2000 218 8.2 9380 164 NM 379 NM NM <0.02 0.008 NM 0.003 <0.01 0.046 <0.02 <0.005 20.5 0.049 0.24 0.006 0.043
B1G951 1/5/2009 3.42 10510 11 65.30 17100 414 1830 131 6.0 14100 222 NM <5 NM 4510 615.00 0.009 NM 0.350 0.027 46.680 115.00 <0.005 126.000 NM 7.720 0.022 52.000
B1G951 4/21/2009 3.52 10680 15 65.12 16800 421 1740 135 5.8 11600 217 NM <5 NM 4240 615.00 0.020 NM 0.360 0.030 45.640 109.00 <0.005 130.000 NM 7.050 0.028 49.400
B1G951 4/5/2010 3.33 10630 13 64.77 15700 391 1540 117 4.0 11200 234 NM <5 NM 3010 598 0.01 NM 0.36 0.025 45.2 93.9 <0.005 125 NM 7.08 0.012 52.4
B2G1157B 2/16/2009 6.87 7850 13 448.56 9270 461 1390 97 9.2 7030 162 NM 389 NM NM <0.02 0.008 0.023 <0.001 <0.01 0.026 <0.02 <0.005 <0.01 NM <0.03 0.006 0.035
B2G1157B 4/7/2009 6.76 6950 15 444.11 9290 476 1430 89 7.2 6610 156 NM 392 NM NM <0.02 0.007 0.021 <0.001 <0.01 0.025 <0.02 <0.005 <0.01 NM <0.03 0.005 0.031
B2G1157B 7/13/2009 6.70 5630 18 448.23 9430 453 1410 93 9.1 6540 152 NM 382 NM NM <0.02 0.006 0.022 <0.001 <0.01 <0.02 <0.02 <0.005 0.018 NM <0.03 0.004 0.022
B2G1157B 10/13/2009 6.85 7700 15 451.07 9220 485 1480 96 8.6 6440 165 NM 393 NM NM <0.02 0.007 0.024 <0.001 <0.01 0.025 <0.02 <0.005 0.410 NM <0.03 0.004 0.015
B2G1157B 2/15/2010 6.86 7440 14 446.03 9040 453 1380 101 7.5 6270 168 NM 384 NM NM <0.02 0.009 0.024 <0.001 <0.01 0.028 <0.02 <0.005 1.05 0.0032 0.032 0.004 0.03
B2G1157B 4/8/2010 6.89 7110 15 442.22 9300 466 1400 88 5.1 6850 191 NM 387 NM NM <0.02 0.006 0.022 <0.001 <0.01 0.025 <0.02 <0.005 1.74 0.0033 0.044 0.005 0.022
B2G1157B 7/13/2010 6.60 7550 17.0 449.20 9460 465 1420 97 6.9 6530 170 NM 364 NM NM 0.032 0.006 0.023 0.001 <0.01 0.022 <0.02 <0.005 3.18 0.0025 0.052 0.005 0.042
B2G1157B 10/4/2010 6.78 8080 15.0 453.43 9100 457 1350 87 6.1 6080 161 NM 380 NM NM <0.02 0.106 0.08 <0.001 <0.01 <0.02 <0.02 <0.005 0.174 0.0027 <0.03 0.005 <0.01
B2G1157C 2/20/2009 7.34 1400 14 451.00 1030 180 61 41 3.3 506 116 NM 169 NM NM <0.02 <0.005 0.100 <0.001 <0.01 <0.02 <0.02 <0.005 <0.01 NM <0.03 <0.002 <0.01
B2G1157C 4/6/2009 7.52 1330 15 445.86 1030 175 55 35 3.0 474 103 NM 170 NM NM <0.02 <0.005 0.097 <0.001 <0.01 <0.02 <0.02 <0.005 <0.01 NM <0.03 <0.002 <0.01
B2G1157C 7/17/2009 7.14 1081 18 451.56 860 149 49 38 2.8 316 98 NM 162 NM NM <0.02 <0.005 0.088 <0.001 <0.01 <0.02 <0.02 <0.005 <0.01 NM <0.03 <0.002 <0.01
B2G1157C 10/12/2009 7.50 1205 16 453.45 844 146 51 37 3.3 337 103 NM 167 NM NM <0.02 <0.005 0.096 <0.001 <0.01 <0.02 <0.02 <0.005 <0.01 NM <0.03 <0.002 <0.01
B2G1157C 2/16/2010 7.45 1080 14 447.47 676 123 42 35 2.7 274 104 NM 164 NM NM <0.02 0.006 0.1 <0.001 <0.01 <0.02 <0.02 <0.005 <0.01 <0.0002 <0.03 <0.002 <0.01
B2G1157C 4/12/2010 7.47 979 14 443.43 654 113 40 32 2.8 232 100 NM 166 NM NM <0.02 <0.005 0.11 <0.001 <0.01 <0.02 <0.02 <0.005 <0.01 <0.0002 <0.03 <0.002 <0.01
B2G1157C 7/16/2010 7.03 796 18.0 450.47 476 79 30 30 2.4 102 94 NM 160 NM NM <0.02 <0.005 0.093 <0.001 <0.01 <0.02 <0.02 <0.005 <0.01 <0.0002 <0.03 <0.002 0.014
B2G1157C 10/5/2010 7.45 753 16.0 457.12 520 79 27 28 2.5 101 91 NM 165 NM NM <0.02 <0.005 0.091 <0.001 <0.01 <0.02 <0.02 <0.005 <0.01 <0.0002 <0.03 <0.002 <0.01
B2G1176A 12/14/2009 4.54 4960 13 442.86 5200 454 595 90 9.2 3280 183 NM <5 NM NM 26.60 0.008 NM 0.250 <0.01 0.080 <0.02 0.007 53.500 NM 1.840 0.008 4.110
B2G1176A 12/15/2010 7.02 3640 14.0 443.65 3700 687 190 85 5.5 2000 159 NM 253 NM NM <0.02 <0.005 NM <0.001 <0.01 <0.02 <0.02 <0.005 <0.01 <0.0002 0.036 0.005 <0.01
B2G1176B 12/11/2009 6.93 3820 13 442.51 3690 696 198 92 5.2 2310 153 NM 262 NM NM <0.02 <0.005 NM <0.001 <0.01 <0.02 <0.02 <0.005 <0.01 NM 0.036 0.006 <0.01
B2G1193 2/3/2009 NM NM NM NA NM 462 281 81 4.9 1920 206 0.1 210 NM NM NM NM 0.024 <0.001 NM <0.02 0.02 <0.005 0.160 NM NM NM 0.017
B2G1193 2/17/2009 7.13 2900 16 390.63 3170 444 265 76 4.4 1980 216 0.2 208 NM NM 0.05 <0.005 0.020 <0.001 <0.01 <0.02 0.92 <0.005 0.200 NM <0.03 0.003 0.074
B2G1193 4/17/2009 7.07 3430 15 390.63 3090 430 260 76 4.6 2000 209 0.1 195 NM NM <0.02 <0.005 0.021 <0.001 <0.01 <0.02 5.06 <0.005 0.210 NM <0.03 0.004 0.091
B2G1193 7/22/2009 7.28 3230 19 390.63 3350 439 252 73 2.1 1910 190 0.1 193 NM NM <0.02 <0.005 0.021 <0.001 <0.01 <0.02 1.89 <0.005 0.220 NM <0.03 0.004 0.031
B2G1193 11/19/2009 7.10 3560 15 390.63 3090 437 265 75 5.2 2000 204 0.1 194 NM NM <0.02 <0.005 0.022 <0.001 <0.01 <0.02 8.15 <0.005 0.350 NM <0.03 0.004 0.056
B2G1193 1/26/2010 6.45 3610 15 390.63 3050 413 252 72 4.4 1970 201 0.2 193 NM NM <0.02 <0.005 0.023 <0.001 <0.01 <0.02 5.9 <0.005 0.36 0.0002 <0.03 0.003 0.06
B2G1193 4/12/2010 6.98 3060 15 390.63 3020 409 247 70 4.7 1810 213 0.2 190 NM NM <0.02 <0.005 0.023 <0.001 <0.01 <0.02 6.1 <0.005 0.37 0.0003 <0.03 0.004 0.052
B2G1193 4/22/2010 7.04 3470 15.0 460.67 2940 408 241 70 4.2 1640 193 0.1 192 NM NM <0.02 <0.005 0.022 <0.001 <0.01 <0.02 6 <0.005 0.36 0.0022 <0.03 0.004 0.066
B2G1193 6/17/2010 6.97 3510 15.0 470.31 3090 400 257 75 4.4 1680 202 0.2 200 <0.001 NM <0.02 <0.005 0.022 <0.001 <0.01 <0.02 2.99 <0.005 0.36 0.0003 <0.03 0.004 0.038
B2G1193 7/13/2010 6.74 3150 16.0 390.63 3170 420 267 78 4.6 1790 198 0.1 215 NM NM <0.02 <0.005 0.022 <0.001 <0.01 <0.02 <0.02 <0.005 0.351 0.0002 <0.03 0.004 <0.01
B2G1193 11/12/2010 6.94 3380 13.0 390.63 3120 425 266 73 4.6 1840 222 0.2 211 NM NM <0.02 <0.005 0.023 <0.001 <0.01 <0.02 <0.02 <0.005 0.491 0.0002 <0.03 0.004 0.016
B2G1194A 12/2/2009 7.15 1989 13 382.26 1290 242 73 64 4.2 544 255 NM 205 NM NM <0.02 <0.005 NM <0.001 <0.01 <0.02 <0.02 <0.005 <0.01 NM <0.03 0.004 <0.01
B2G1194A 12/7/2010 7.26 1863 14.0 383.26 1320 248 73 58 3.5 491 270 NM 191 NM NM <0.02 <0.005 NM <0.001 <0.01 <0.02 <0.02 <0.005 <0.01 <0.0002 <0.03 0.004 <0.01
B2G1194B 12/1/2009 7.14 2270 14 382.38 1940 332 106 78 5.0 1050 255 NM 206 NM NM <0.02 <0.005 NM <0.001 <0.01 <0.02 <0.02 <0.005 <0.01 NM <0.03 0.004 <0.01
B2G1194B 12/7/2010 7.21 2270 14.0 383.73 1860 340 106 70 4.4 959 212 NM 195 NM NM <0.02 0.005 NM <0.001 <0.01 <0.02 <0.02 <0.005 <0.01 <0.0002 <0.03 0.004 <0.01
B3G1197A 11/30/2009 7.31 828 13 347.23 766 128 45 42 3.0 298 104 NM 163 NM NM <0.02 <0.005 NM <0.001 <0.01 <0.02 <0.02 <0.005 <0.01 NM <0.03 0.002 <0.01
B3G1197A 12/6/2010 7.54 1051 13.0 343.00 704 119 42 44 3.2 259 108 NM 163 NM NM <0.02 <0.005 NM <0.001 <0.01 <0.02 <0.02 <0.005 <0.01 <0.0002 <0.03 0.002 <0.01
B3G1197B 11/30/2009 7.57 564 14 346.95 442 128 45 42 3.0 64 113 NM 159 NM NM <0.02 0.009 NM <0.001 <0.01 <0.02 <0.02 <0.005 <0.01 NM <0.03 <0.002 <0.01
B3G1197B 12/6/2010 7.62 734 14.0 342.61 412 70 27 31 3.0 61 112 NM 161 NM NM <0.02 0.01 NM <0.001 <0.01 <0.02 <0.02 <0.005 <0.01 <0.0002 <0.03 <0.002 <0.01
BFG1155C 4/29/2009 7.37 1936 15 407.27 1510 273 91 63 4.0 728 214 NM 186 NM NM NM <0.005 0.026 <0.001 <0.01 <0.02 <0.02 <0.005 <0.01 NM <0.03 NM <0.01
BFG1155D 4/29/2009 7.29 1418 15 408.25 1050 183 61 49 3.3 509 123 NM 153 NM NM NM 0.007 0.032 0.005 <0.01 NM <0.02 <0.005 1.700 NM 0.120 NM 0.990
BFG1155E 4/27/2009 7.58 696 14 408.82 388 63 25 32 2.5 60 95 NM 160 NM NM NM 0.006 0.074 <0.001 <0.01 <0.02 NM <0.005 <0.01 NM <0.03 NM <0.01
BFG1155F 4/24/2009 7.15 637 15 408.23 388 61 26 31 2.7 47 89 NM 163 NM NM NM 0.007 0.080 <0.001 <0.01 <0.02 <0.02 <0.005 <0.01 NM <0.03 NM <0.01
BFG1156B 4/14/2009 7.03 2970 14 422.27 2860 513 152 82 4.3 1690 204 NM 198 NM NM <0.02 <0.005 NM <0.001 0.010 <0.02 <0.02 <0.005 <0.01 NM <0.03 0.004 <0.01
BFG1156B 4/16/2010 7.12 2830 16 419.38 2810 506 149 75 5.2 1550 186 NM 180 NM NM <0.02 <0.005 NM <0.001 <0.01 <0.02 <0.02 <0.005 <0.01 <0.0002 <0.03 0.004 <0.01
BFG1156C 4/17/2009 7.09 2290 12 421.60 1860 346 100 70 3.8 1030 255 NM 199 NM NM <0.02 <0.005 NM <0.001 <0.01 <0.02 <0.02 <0.005 0.019 NM <0.03 0.004 <0.01
BFG1156C 4/16/2010 7.12 2300 16 419.77 1970 346 102 72 4.3 896 230 NM 200 NM NM <0.02 <0.005 NM <0.001 <0.01 <0.02 <0.02 <0.005 <0.01 <0.0002 <0.03 0.004 <0.01
BFG1156D 3/13/2009 6.98 2400 13 423.63 2140 370 114 65 4.0 1230 148 NM 158 NM NM 0.14 <0.005 NM <0.001 <0.01 0.032 <0.02 <0.005 0.014 NM <0.03 0.004 0.015
BFG1156D 4/13/2010 7.28 2560 13 419.58 2390 427 130 67 4.6 1430 162 NM 163 NM NM <0.02 <0.005 NM <0.001 <0.01 <0.02 <0.02 <0.005 <0.01 <0.0002 <0.03 0.004 <0.01
BFG1168A 9/15/2009 7.15 1874 17 469.22 1390 270 76 67 3.5 598 240 NM 199 NM NM NM <0.005 0.020 <0.001 <0.01 <0.02 NM <0.005 NM NM NM 0.003 0.072
BFG1168A 9/17/2010 7.15 2140 17.0 473.75 1640 304 80 69 3.5 694 282 NM 205 NM NM NM <0.005 0.017 <0.001 <0.01 <0.02 NM <0.005 NM <0.0002 NM 0.003 <0.01
BFG1168B 9/15/2009 7.38 2360 17 468.97 2020 378 111 67 4.1 1090 230 NM 185 NM NM NM <0.005 0.020 <0.001 <0.01 <0.02 NM <0.005 NM NM NM 0.004 <0.01
BFG1168B 9/14/2010 7.12 2490 17.0 473.36 1970 361 105 66 4.0 1090 227 NM 189 NM NM NM <0.005 0.019 <0.001 <0.01 <0.02 NM <0.005 NM <0.0002 NM 0.003 <0.01
BFG1195A 12/10/2009 6.86 3040 13 451.92 2640 479 136 84 4.4 1490 203 NM 230 NM NM <0.02 <0.005 NM <0.001 <0.01 <0.02 <0.02 <0.005 <0.01 NM <0.03 0.005 <0.01
BFG1195A 12/9/2010 7.11 2860 14.0 451.81 2660 494 145 91 4.9 1390 222 NM 205 NM NM <0.02 <0.005 NM <0.001 <0.01 <0.02 <0.02 <0.005 <0.01 <0.0002 <0.03 0.004 <0.01
BFG1195B 12/10/2009 7.16 2900 12 450.41 2420 434 121 71 4.4 1370 189 NM 205 NM NM <0.02 <0.005 NM <0.001 <0.01 <0.02 <0.02 <0.005 <0.01 NM <0.03 0.004 <0.01
BFG1195B 12/10/2010 7.14 2790 13.0 452.33 2550 460 129 75 4.4 1330 202 NM 235 NM NM <0.02 <0.005 NM <0.001 <0.01 <0.02 <0.02 <0.005 <0.01 <0.0002 0.03 0.005 <0.01
BFG1198B 11/4/2009 7.12 2400 15 426.63 1990 366 102 71 5.6 1070 257 NM 193 NM NM <0.02 <0.005 NM <0.001 <0.01 <0.02 NM <0.005 <0.01 NM <0.03 0.004 <0.01
BFG1200 2/3/2009 NM NM NM NA NM 280 90 60 4.0 758 185 0.1 177 NM NM NM NM 0.034 <0.001 NM <0.02 0.03 <0.005 <0.01 NM NM NM 0.031
BFG1200 2/20/2009 7.19 1993 15 NA 1560 264 85 58 3.9 745 183 0.1 173 NM NM <0.02 0.006 0.033 <0.001 <0.01 <0.02 <0.02 <0.005 <0.01 NM <0.03 0.003 0.013
BFG1200 4/17/2009 7.43 2000 16 NA 1500 256 81 55 3.5 708 180 0.1 172 NM NM <0.02 0.006 0.030 <0.001 <0.01 <0.02 <0.02 <0.005 <0.01 NM <0.03 0.003 0.019
BFG1200 7/24/2009 7.00 1830 20 NA 1460 262 84 57 3.7 712 166 0.1 175 NM NM <0.02 0.006 0.032 <0.001 <0.01 <0.02 <0.02 <0.005 <0.01 NM <0.03 0.003 <0.01
2010 Compliance Monitoring Wells2010 Compliance Extraction Wells
WELL DATE
NM = Not Measured
South Facilities Groundwater2010 Remedial Progress Report Brown highlights are 2010 extraction wells and blue highlights are 2010 compliance monitoring wells
April 2011A-1

Kennecott Utah Copper | Environmental Restoration Group
pH Cond Temp DTW TDS Ca-T Mg-T Na-T K-T SO4 Cl-T F Alk Ag Acidity Al-D As-D Ba-D Cd-D Cr-D Cu-D Fe-D Pb-D Mn-D Hg-T Ni-D Se-D Zn-Dsu uS/cm C Feet mg/l mg/l mg/l mg/l mg/l mg/l mg/l mg/l mg/l as CaCO3 mg/l mg/l as CaCO3 mg/l mg/l mg/l mg/l mg/l mg/l mg/l mg/l mg/l mg/l mg/l mg/l mg/lWELL DATE
BFG1200 11/19/2009 7.74 1953 16 NA 1430 258 86 58 4.2 707 171 0.1 180 NM NM <0.02 0.005 0.035 <0.001 <0.01 <0.02 NM <0.005 <0.01 NM <0.03 0.003 0.024
BFG1200 1/26/2010 7.36 2050 14 NA 1410 245 80 55 3.6 707 172 0.1 175 NM NM 0.034 0.006 0.035 <0.001 <0.01 0.016 <0.02 <0.005 <0.01 <0.0002 <0.03 0.003 0.021
BFG1200 6/17/2010 7.20 1998 16.0 510.60 1460 244 84.2 58 3.8 625 185 0.1 178 <0.001 NM <0.02 0.006 0.03 <0.001 <0.01 <0.02 <0.02 <0.005 <0.01 <0.0002 <0.03 0.003 0.024
BFG1200 7/15/2010 7.16 1934 18.0 NA 1470 252 82 62 3.5 697 186 0.1 171 NM NM <0.02 0.006 0.032 <0.001 <0.01 <0.02 <0.02 <0.005 <0.01 <0.0002 <0.03 0.004 0.019
BFG1200 12/2/2010 7.13 1786 15.0 NA 1540 263 85 56 3.6 724 199 0.1 177 NM NM <0.02 0.017 0.084 <0.001 <0.01 <0.02 <0.02 <0.005 0.013 <0.0002 <0.03 0.004 <0.01
BRG287 6/4/2009 7.20 3860 17 290.30 2720 520 130 132 10.0 802 651 NM 421 NM NM NM <0.005 0.040 <0.001 <0.01 <0.02 NM <0.005 NM NM NM 0.007 <0.01
BRG287 12/17/2009 6.53 3440 12 290.47 2540 480 115 108 9.8 798 679 NM 430 NM NM NM 0.007 0.041 <0.001 <0.01 0.028 NM <0.005 NM NM NM 0.007 <0.01
BRG287 6/15/2010 6.83 3460 17.0 291.38 2530 502 126 126 9.9 743 696 NM 408 NM NM NM <0.005 0.039 <0.001 <0.01 <0.02 NM <0.005 NM NM NM 0.006 <0.01
BRG287 11/24/2010 7.65 3440 11.0 292.25 2860 517 125 120 9.9 794 663 NM 463 NM NM NM 0.006 0.042 <0.001 <0.01 <0.02 NM <0.005 NM NM NM 0.006 <0.01
BRG921 6/19/2009 6.89 2420 16 314.18 1840 308 82 109 5.9 679 298 NM 260 NM NM NM <0.005 0.029 <0.001 <0.01 <0.02 NM <0.005 NM NM NM <0.002 <0.01
BRG921 12/4/2009 6.94 2310 11 315.08 1670 288 77 101 6.0 679 279 NM 262 NM NM NM <0.005 0.028 <0.001 <0.01 <0.02 NM <0.005 NM NM NM NM <0.01
BRG921 5/20/2010 6.89 1910 13.0 315.87 1640 287 78 114 6.7 607 290 NM 268 NM NM NM <0.005 0.027 <0.001 <0.01 <0.02 NM <0.005 NM <0.0002 NM 0.002 <0.01
BRG921 11/18/2010 7.03 2350 13.0 316.77 1490 285 75 98 5.3 632 295 NM 261 NM NM NM 0.005 0.029 <0.001 <0.01 <0.02 NM <0.005 NM <0.0002 NM <0.002 <0.01
BRG999 2/10/2009 6.73 1936 12 246.72 1340 252 62 64 6.7 521 237 NM 209 NM NM NM 0.009 0.042 <0.001 <0.01 <0.02 NM <0.005 NM NM NM 0.002 <0.01
BRG999 9/18/2009 6.87 1766 16 248.36 1250 229 60 63 6.5 509 229 NM 213 NM NM NM <0.005 0.040 <0.001 <0.01 <0.02 NM <0.005 NM NM NM NM <0.01
BRG999 2/5/2010 6.93 1881 12 248.95 1230 234 61 63 7.0 462 223 NM 215 NM NM NM 0.006 0.041 <0.001 <0.01 <0.02 NM <0.005 NM NM NM <0.002 <0.01
BRG999 9/16/2010 6.82 1785 16.0 250.05 1250 236 58 59 6.3 490 228 NM 212 NM NM NM <0.005 0.042 <0.001 <0.01 <0.02 NM <0.005 NM NM NM 0.002 <0.01
BSG1119B 2/12/2009 4.76 7940 13 461.32 8920 419 1230 90 11.0 6360 191 NM <5 NM NM 53.80 0.012 NM 0.737 <0.01 0.083 <0.02 0.006 127.000 NM 4.770 0.009 2.140
BSG1119B 9/14/2009 4.69 6850 16 463.51 8750 420 1200 90 10.0 6210 185 NM <5 NM NM 50.20 0.012 NM 0.750 <0.01 0.090 <0.02 0.007 148.000 NM 5.380 0.034 2.120
BSG1119B 3/26/2010 4.63 7010 13 462.38 8300 454 1210 104 13 6310 187 NM <5 NM NM <0.1 0.011 NM 0.690 <0.01 0.076 36.7 0.006 <1e-005 0.0042 <0.05 NM <0.02
BSG1119B 9/13/2010 4.51 6990 18.0 466.08 8150 424 1100 81 9.2 5300 188 NM <5 NM NM 42.7 0.012 NM 0.661 <0.01 0.08 <0.02 0.006 118 0.0038 4.15 0.009 2.21
BSG1125B 9/22/2009 7.35 1811 17 342.85 1090 201 60 59 3.2 179 367 NM 147 NM NM NM <0.005 NM <0.001 <0.01 <0.02 NM <0.005 <0.01 NM <0.03 NM <0.01
BSG1125B 12/1/2010 7.32 1755 13.0 351.17 1230 192 56 52 3.5 190 396 NM 146 NM NM NM <0.005 NM <0.001 <0.01 <0.02 <0.02 <0.005 <0.01 NM <0.03 0.008 <0.01
BSG1125C 9/22/2009 7.52 917 16 344.30 454 94 28 41 2.1 46 128 NM 205 NM NM NM <0.005 NM <0.001 <0.01 <0.02 NM <0.005 <0.01 NM <0.03 NM <0.01
BSG1125C 12/1/2010 7.53 870 13.0 352.58 500 86 26 38 2.3 42 132 NM 200 NM NM NM <0.005 NM <0.001 <0.01 <0.02 <0.02 <0.005 <0.01 NM <0.03 <0.002 <0.01
BSG1130A 9/2/2009 7.25 1824 17 360.10 1200 235 63 61 3.4 451 216 NM 231 NM NM <0.03 1.005 NM <0.001 <0.01 <0.02 <0.02 <0.005 <0.01 NM <0.04 0.003 <0.01
BSG1130A 11/15/2010 7.91 11730 14.0 -0.10 1190 222 60 57 3.8 410 200 NM 238 NM NM <0.02 <0.005 NM <0.001 <0.01 <0.02 <0.02 <0.005 <0.01 <0.0002 <0.03 0.003 <0.01
BSG1130B 9/1/2009 7.27 1280 17 363.40 736 128 44 48 2.8 147 198 NM 183 NM NM <0.02 <0.005 NM <0.001 <0.01 <0.02 <0.02 <0.005 <0.01 NM <0.03 0.004 <0.01
BSG1130B 11/15/2010 8.00 11290 13.5 -0.20 730 126 43 47 3.3 143 206 NM 184 NM NM <0.02 <0.005 NM <0.001 <0.01 <0.02 <0.02 <0.005 <0.01 <0.0002 <0.03 0.002 <0.01
BSG1132A 3/16/2009 7.11 2070 14 377.85 1590 275 86 73 3.7 637 274 NM 198 NM NM <0.02 <0.005 NM <0.001 <0.01 <0.02 <0.02 <0.005 <0.01 NM <0.03 0.005 <0.01
BSG1132A 5/7/2009 7.10 2020 16 375.75 1550 281 85 69 3.7 668 265 NM 195 NM NM <0.02 <0.005 NM <0.001 <0.01 <0.02 <0.02 <0.005 <0.01 NM <0.03 NM <0.01
BSG1132A 7/27/2009 7.03 2010 18 378.00 1540 285 87 70 3.6 644 244 NM 191 NM NM <0.02 <0.005 NM <0.001 <0.01 <0.02 <0.02 <0.005 <0.01 NM <0.03 0.005 <0.01
BSG1132A 10/16/2009 7.23 2070 15 380.98 1550 281 90 73 4.2 640 272 NM 204 NM NM NM NM NM NM NM NM NM NM NM NM NM NM NM
BSG1132A 2/12/2010 7.27 2090 13 379.00 1450 271 83 72 3.7 593 267 NM 197 NM NM <0.02 0.005 NM <0.001 <0.01 <0.02 <0.02 <0.005 <0.01 <0.0002 <0.03 0.005 <0.01
BSG1132A 8/13/2010 6.89 2000 16.0 379.72 1530 265 83 67 3.7 632 283 NM 199 NM NM <0.02 <0.005 NM <0.001 <0.01 <0.02 <0.02 <0.005 <0.01 <0.0002 <0.03 0.005 <0.01
BSG1132B 3/16/2009 7.01 2900 14 376.62 2790 470 151 73 4.6 1540 160 NM 226 NM NM <0.02 <0.005 NM <0.001 0.011 <0.02 <0.02 <0.005 <0.01 NM <0.03 0.004 <0.01
BSG1132B 5/7/2009 7.07 2810 16 377.12 2720 495 158 74 4.9 1610 166 NM 227 NM NM <0.02 <0.005 NM <0.001 <0.01 <0.02 <0.02 <0.005 <0.01 NM <0.03 NM <0.01
BSG1132B 7/27/2009 6.89 2860 18 379.42 2720 495 158 75 4.6 1560 156 NM 217 NM NM <0.02 <0.005 NM <0.001 <0.01 <0.02 <0.02 <0.005 <0.01 NM <0.03 0.004 <0.01
BSG1132B 10/19/2009 7.13 2910 15 382.53 2690 489 163 78 5.5 1570 168 NM 225 NM NM <0.02 <0.005 NM <0.001 <0.01 <0.02 <0.02 <0.005 <0.01 NM <0.03 0.004 <0.01
BSG1132B 2/11/2010 7.22 2970 14 380.35 2610 466 152 77 5.0 1540 166 NM 223 NM NM <0.02 <0.005 NM <0.001 <0.01 <0.02 <0.02 <0.005 <0.01 <0.0002 <0.03 0.004 <0.01
BSG1132B 8/13/2010 6.81 2730 16.0 381.36 2620 456 151 73 4.9 1510 180 NM 225 NM NM <0.02 <0.005 NM <0.001 <0.01 <0.02 <0.02 <0.005 <0.01 <0.0002 <0.03 0.004 <0.01
BSG1133B 3/13/2009 7.13 3260 14 415.62 3250 508 214 83 5.2 2030 142 NM 283 NM NM <0.02 <0.005 NM <0.001 <0.01 <0.02 1.76 <0.005 <0.01 NM <0.03 0.005 <0.01
BSG1133B 5/1/2009 6.95 3230 15 414.97 3360 551 236 87 5.8 1990 142 NM 293 NM NM <0.02 0.010 NM <0.001 0.014 <0.02 <0.02 <0.005 <0.01 NM <0.03 0.004 0.010
BSG1133B 8/21/2009 7.08 2800 18 416.91 3250 542 237 87 5.8 2080 145 NM 279 NM NM <0.02 <0.005 NM <0.001 <0.01 <0.02 <0.02 <0.005 <0.01 NM <0.03 0.004 <0.01
BSG1133B 10/12/2009 7.30 3310 15 418.74 3120 496 220 83 5.8 1930 133 NM 281 NM NM <0.02 <0.005 NM <0.001 <0.01 <0.02 <0.02 <0.005 <0.01 NM <0.03 0.004 <0.01
BSG1133B 1/18/2010 7.23 3120 13 419.08 2820 454 203 77 4.8 1780 122 NM 270 NM NM <0.02 <0.005 NM <0.001 <0.01 <0.02 NM <0.005 <0.01 <0.0002 <0.03 0.003 <0.01
BSG1133B 4/12/2010 7.25 3080 16 415.48 3190 499 228 81 5.7 2010 148 NM 279 NM NM <0.02 <0.005 NM <0.001 <0.01 <0.02 <0.02 <0.005 <0.01 <0.0002 <0.03 0.004 <0.01
BSG1133B 7/21/2010 7.13 3130 17.0 0.00 3200 498 237 91 5.2 1950 125 NM 268 NM NM <0.02 <0.005 NM <0.001 <0.01 <0.02 <0.02 <0.005 <0.01 <0.0002 <0.03 0.004 0.015
BSG1133B 11/5/2010 7.18 3020 15.0 420.77 2740 423 199 74 5.2 1590 127 NM 260 NM NM <0.02 <0.005 NM <0.001 <0.01 <0.02 <0.02 <0.005 <0.01 <0.0002 <0.03 0.005 <0.01
BSG1135B 7/13/2009 7.19 960 19 212.15 578 104 34 40 3.2 70 153 0.1 198 NM NM <0.02 <0.005 0.150 <0.001 <0.01 <0.02 <0.02 <0.005 <0.01 NM <0.03 0.002 <0.01BSG1135B 8/24/2010 7.32 1028 16.0 279.07 598 101 33 40 3.2 69 166 <0.1 199 NM NM <0.02 <0.005 0.149 <0.001 <0.01 <0.02 <0.02 <0.005 <0.01 <0.0002 <0.03 0.002 <0.01BSG1137A 4/17/2009 7.01 1340 13 357.70 820 158 47 45 2.8 267 213 NM 174 NM NM <0.02 <0.005 NM <0.001 <0.01 <0.02 <0.02 <0.005 <0.01 NM <0.03 0.003 <0.01
BSG1137A 11/17/2009 7.48 1228 14 361.76 780 149 44 44 2.6 222 192 NM 177 NM NM <0.02 <0.005 NM <0.001 <0.01 <0.02 NM <0.005 <0.01 NM <0.03 0.003 <0.01
BSG1137A 6/15/2010 7.43 1290 16.0 357.57 796 150 46 49 2.6 236 204 NM 172 NM NM <0.02 <0.005 NM <0.001 <0.01 <0.02 <0.02 <0.005 <0.01 <0.0002 <0.03 0.003 <0.01
BSG1137A 11/16/2010 7.38 1240 14.0 363.42 754 143 44 45 2.8 220 191 NM 177 NM NM <0.02 <0.005 NM <0.001 <0.01 <0.02 <0.02 <0.005 <0.01 <0.0002 <0.03 0.002 <0.01
BSG1148A 9/10/2009 6.45 4220 17 455.36 4530 701 335 118 6.5 2780 167 NM 307 NM NM 0.42 <0.005 NM 0.013 <0.01 <0.02 <0.02 <0.005 5.920 NM 0.210 0.005 <0.01
BSG1148A 8/13/2010 6.83 4310 15.0 463.20 4020 517 307 110 6.0 2500 185 NM 315 NM NM 0.03 <0.005 NM 0.016 <0.01 0.028 <0.02 <0.005 6.16 0.0007 0.195 0.004 0.046
BSG1148B 5/1/2009 5.96 3210 15 455.77 3410 426 310 65 5.6 2220 130 NM 101 NM NM <0.02 <0.005 NM 0.043 <0.01 <0.02 <0.02 <0.005 24.300 NM 0.800 NM 0.650
BSG1148B 8/17/2010 6.08 3560 19.5 462.9 3600 420 329 69 5.9 2320 146 NM 93 NM NM 6.04 <0.005 NM 0.058 <0.01 <0.02 <0.02 <0.005 24 0.0008 0.972 0.005 0.913
BSG1177A 3/9/2009 4.56 5040 11 444.43 5330 472 526 170 9.8 3390 175 NM <5 NM NM 49.80 0.007 NM 0.240 <0.01 0.110 0.09 0.028 351.000 NM 1.880 0.009 77.000
BSG1177A 3/16/2010 5.70 4460 14 446.00 4500 489 436 153 6.9 2900 179 NM 78 NM NM 4.513 0.006 NM 0.145 <0.01 0.021 <0.02 <0.005 19.9 0.0006 0.82 0.006 1.05
BSG1177B 2/25/2009 3.71 10380 14 446.86 14700 410 1970 98 8.5 12200 148 NM <5 NM NM 306.00 0.016 NM 1.170 <0.01 12.000 0.25 0.006 206.000 NM 9.810 0.023 30.700
BSG1177B 3/24/2010 3.81 10720 14 445.84 14400 432 1840 96 7.6 10600 146 NM <5 NM NM 376 0.013 NM 1.00 <0.01 16.6 5.58 0.007 193 0.0053 8.65 NM 40.9
BSG1177C 2/24/2009 7.17 2420 14 437.28 1990 359 114 47 4.7 1200 123 NM 207 NM NM <0.02 <0.005 NM <0.001 <0.01 <0.02 <0.02 <0.005 <0.01 NM <0.03 0.004 0.014
BSG1177C 3/26/2010 7.05 2590 13 439.36 2340 434 139 53 5.8 1410 129 NM 225 NM NM <0.02 <0.005 NM <0.001 <0.01 <0.02 <0.02 <0.005 <0.01 0.0007 <0.03 <0.002 0.013
BSG1179A 6/23/2009 3.65 9840 16 443.67 13200 405 1810 93 14.0 10500 174 NM <5 NM NM 258.00 0.020 NM 0.640 0.021 6.310 0.18 0.026 199.000 NM 5.580 0.016 25.900
BSG1179A 9/9/2010 3.57 9900 15.0 451.45 13400 422 1800 78 12 5980 175 NM <5 NM NM 274 0.016 NM 0.688 0.015 6.54 0.109 0.028 194 0.0051 6.26 0.022 23.4
BSG1179B 6/24/2009 4.38 5430 18 0.00 5840 452 675 93 10.0 4070 149 NM <5 NM NM 45.71 0.006 NM 0.170 <0.01 0.450 0.02 0.019 35.900 NM 1.580 0.009 4.820
BSG1179B 9/9/2010 4.43 5220 15.0 454.91 5526 470 669 80 8.0 3750 144 NM <5 NM NM 38.1 0.006 NM 0.141 <0.01 0.496 0.026 0.018 32.3 0.0047 1.31 0.01 4.35
NM = Not Measured
South Facilities Groundwater2010 Remedial Progress Report Brown highlights are 2010 extraction wells and blue highlights are 2010 compliance monitoring wells
April 2011A-2

Kennecott Utah Copper | Environmental Restoration Group
pH Cond Temp DTW TDS Ca-T Mg-T Na-T K-T SO4 Cl-T F Alk Ag Acidity Al-D As-D Ba-D Cd-D Cr-D Cu-D Fe-D Pb-D Mn-D Hg-T Ni-D Se-D Zn-Dsu uS/cm C Feet mg/l mg/l mg/l mg/l mg/l mg/l mg/l mg/l mg/l as CaCO3 mg/l mg/l as CaCO3 mg/l mg/l mg/l mg/l mg/l mg/l mg/l mg/l mg/l mg/l mg/l mg/l mg/lWELL DATE
BSG1179C 6/23/2009 3.39 13410 16 451.23 22700 411 2520 63 8.8 16200 153 NM <5 NM 6250 1030.00 0.027 NM 0.530 0.013 62.800 193.00 0.005 197.000 NM 11.860 NM 78.200
BSG1179C 9/10/2010 3.43 13050 14.0 459.57 21900 431 2290 48 6.5 14100 153 NM <5 NM 5000 952 0.017 NM 0.541 <0.01 59.3 185 0.005 184 0.0038 11.2 0.029 73.3
BSG1180A 2/12/2009 7.05 3990 12 418.73 3700 635 203 135 5.0 2280 167 NM 307 NM NM <0.02 <0.005 NM <0.001 <0.01 <0.02 <0.02 <0.005 0.012 NM 0.036 0.006 0.013
BSG1180A 2/24/2010 6.92 3620 11 421.13 3590 622 194 123 4.8 2060 167 NM 318 NM NM <0.02 <0.005 NM <0.001 <0.01 <0.02 <0.02 <0.005 <0.01 NM <0.03 0.007 <0.01
BSG1180B 4/2/2009 3.88 10340 12 421.70 13500 398 2000 129 13.0 10300 154 NM <5 NM 820 120.00 0.020 NM 0.650 0.014 1.170 0.03 0.024 160.000 NM 6.800 NM 16.700
BSG1180B 3/1/2010 3.99 10440 14 422.51 13300 405 1910 134 14 10300 151 NM <5 NM 656 113 0.018 NM 0.62 0.011 1 0.057 0.024 140 0.032 5.69 0.02 14.7
BSG1180C 4/2/2009 6.65 4250 12 417.81 4650 602 423 107 5.1 2790 187 NM 435 NM NM 0.64 <0.005 NM 0.039 0.011 <0.02 NM <0.005 24.300 NM 0.736 NM 0.089
BSG1180C 3/11/2010 6.81 4300 13 419.43 4470 661 419 130 5.1 2670 186 NM 462 NM NM 0.322 <0.005 NM 0.03 <0.01 <0.02 <0.02 <0.005 19.3 0.09 0.54 0.007 0.067
BSG1196B 6/9/2009 6.44 5410 15 409.27 6630 472 902 115 6.2 5210 148 NM 249 NM NM <0.02 <0.005 NM 0.006 <0.01 <0.02 <0.02 <0.005 1.590 NM 0.052 0.006 0.036
BSG1196B 5/12/2010 6.47 5820 13.0 411.82 6810 464 933 100 1.9 4610 146 NM 248 NM NM <0.02 <0.005 NM 0.009 <0.01 0.024 <0.02 <0.005 2.62 0.0018 0.084 0.006 0.032
BSG1196C 6/9/2009 6.78 5510 15 408.92 6690 572 750 197 6.6 4250 154 NM 403 NM NM 0.22 <0.005 NM 0.022 <0.01 <0.02 <0.02 <0.005 10.500 NM 0.430 0.006 0.057
BSG1196C 5/12/2010 6.37 6680 14.0 411.06 8560 512 1120 154 7.3 5730 164 NM 283 NM NM 7.22 <0.005 NM 0.18 <0.01 0.03 <0.02 <0.005 72.5 0.093 2.52 0.007 0.58BSG1201 2/24/2009 3.78 10090 15 NA 13900 404 1580 101 11.0 10400 158 72.3 <5 NM 2600 367.00 0.030 0.011 0.650 <0.01 18.200 26.70 0.021 164.000 NM 6.060 0.015 34.500BSG1201 4/17/2009 3.75 10170 14 NA 13500 407 1550 100 9.1 10100 167 70.8 <5 NM 2530 341.00 0.020 <0.01 0.580 <0.01 17.300 25.90 0.018 144.000 NM 7.690 0.017 33.300BSG1201 7/22/2009 3.58 9770 19 NA 14000 443 1670 100 5.1 10600 151 71.9 <5 NM 2260 371.00 0.018 <0.01 0.610 <0.01 15.720 23.70 0.018 156.000 NM 6.680 0.020 32.100
BSG1201 11/19/2009 3.82 9530 15 NA 12800 425 1560 107 12.0 10100 161 65.9 <5 NM 2460 370.88 0.014 <0.01 0.620 <0.01 16.170 NM 0.016 160.000 NM 6.860 0.021 33.210BSG1201 6/17/2010 3.69 8720 16 NA 11500 432 1250 91 11.0 11500 165 62.5 <5 NM 1640 325.00 0.012 0.011 0.451 <0.01 17.100 34.90 0.021 118.000 0.0210 5.220 0.017 32.6BSG1201 7/13/2010 3.48 9640 17.0 NA 13800 419 1530 106 9.2 9280 169 67.4 <5 NM 2500 347 0.017 <0.01 0.595 <0.01 15.2 24.4 0.017 151 0.0061 6.29 0.023 30.7BSG1201 11/10/2010 3.70 9190 14.0 NA 12600 412 1460 100 11 8540 173 62.7 <5 NM 1760 346 0.01 <0.01 0.602 <0.01 17 28 0.016 141 0.006 6.66 0.017 31.1BSG2777A 4/30/2009 4.41 14940 15 394.14 23700 419 3910 158 11.0 18900 156 NM <5 NM 741 123.50 0.026 <0.01 1.650 <0.01 0.120 0.10 0.028 442.000 NM 14.780 0.015 10.660BSG2777A 11/12/2009 4.42 14600 14 395.12 22900 378 3680 144 14.0 21300 154 NM <5 NM 952 125.00 0.047 <0.01 1.460 <0.01 0.110 0.08 <5e-005 411.000 NM 13.380 0.015 <0.02BSG2777A 5/6/2010 4.43 15700 13.0 397.12 23200 401 3710 145 13 15600 152 NM <5 NM 447 116 0.014 0.012 1.24 <0.01 0.13 0.062 0.026 391 0.009 14.4 0.017 9.34BSG2777A 11/11/2010 4.40 14840 13.0 403.25 22900 400 3550 145 11 15700 160 NM <5 NM 444 108 0.157 <0.01 1.61 <0.01 0.644 0.332 <5e-005 406 <0.0002 14.4 0.014 11.2BSG2777B 3/25/2009 7.30 956 13 389.34 624 106 35 33 2.5 182 107 NM 185 NM NM <0.02 <0.005 0.030 <0.001 <0.01 <0.02 <0.02 <0.005 <0.01 NM <0.03 0.002 <0.01BSG2777B 5/7/2010 7.36 953 15.0 397.57 550 104 34 36 2.6 105 97 NM 176 NM NM <0.02 <0.005 0.033 <0.001 <0.01 <0.02 <0.02 <0.005 <0.01 <0.0002 <0.03 0.003 <0.01BSG2778A 6/3/2009 6.71 4630 17 377.87 5370 739 541 131 7.3 3670 133 NM 270 NM NM <0.02 <0.005 0.028 <0.001 0.013 <0.02 NM <0.005 <0.01 NM <0.03 0.005 0.019BSG2778A 10/8/2010 6.59 6420 14.0 385.87 7210 588 941 105 7.3 4900 130 NM 236 NM NM <0.02 <0.005 0.031 0.002 <0.01 0.026 <0.02 <0.005 1.74 0.026 0.05 0.005 0.027BSG2778B 6/4/2009 7.53 1236 17 369.63 896 157 53 54 4.5 446 78 NM 153 NM NM 0.02 <0.005 0.109 <0.001 <0.01 <0.02 NM <0.005 <0.01 NM <0.03 0.003 <0.01BSG2778B 10/7/2010 7.54 1468 15.0 377.48 1090 190 65 52 4.6 569 85 NM 184 NM NM <0.02 <0.005 0.111 <0.001 0.011 <0.02 <0.02 <0.005 <0.01 0.0003 <0.03 0.003 0.011BSG2779A 6/1/2009 6.58 4020 17 400.00 4410 556 447 85 5.8 2960 167 NM 190 NM NM <0.02 <0.005 NM <0.001 0.012 <0.02 <0.02 <0.005 0.012 NM <0.03 0.004 0.012BSG2779A 10/30/2009 6.71 4220 12 425.11 4260 513 418 75 5.6 2860 161 NM 184 NM NM <0.02 <0.005 NM <0.001 <0.01 <0.02 <0.02 <0.005 0.027 NM <0.03 0.003 <0.01BSG2779A 5/14/2010 6.69 3820 15.0 419.42 4270 506 413 70 6.1 2700 158 NM 175 NM NM <0.02 <0.005 NM <0.001 <0.01 <0.02 <0.02 <0.005 <0.01 <0.0002 <0.03 0.003 0.014BSG2779A 11/12/2010 6.71 4040 14.0 426.71 4060 502 401 67 5.4 2640 180 NM 201 NM NM <0.02 <0.005 NM <0.001 <0.01 <0.02 <0.02 <0.005 <0.01 <0.0002 <0.03 0.003 0.013BSG2779B 6/2/2009 7.15 3260 16 420.82 3460 637 202 94 5.4 2030 154 NM 256 NM NM <0.02 <0.005 NM <0.001 0.012 <0.02 <0.02 <0.005 <0.01 NM <0.03 0.004 <0.01BSG2779B 11/3/2009 7.16 3210 15 425.82 3380 618 189 87 5.6 2140 159 NM 254 NM NM <0.02 <0.005 NM <0.001 <0.01 <0.02 NM <0.005 <0.01 NM <0.03 0.004 <0.01BSG2779B 5/17/2010 7.13 3120 16.0 420.03 3340 596 184 86 5.4 1910 146 NM 251 NM NM <0.02 <0.005 NM <0.001 <0.01 <0.02 <0.02 <0.005 <0.01 <0.0002 <0.03 0.004 <0.01BSG2779B 11/15/2010 8.00 11290 13.5 NA 3290 590 180 82 5.1 1910 157 NM 253 NM NM <0.02 <0.005 NM <0.001 <0.01 <0.02 <0.02 <0.005 <0.01 <0.0002 <0.03 0.003 <0.01BSG2779C 6/1/2009 7.30 680 17 430.00 432 69 27 29 2.5 59 91 NM 157 NM NM <0.02 <0.005 NM <0.001 0.011 <0.02 <0.02 <0.005 <0.01 NM <0.03 0.002 <0.01BSG2779C 11/3/2009 7.57 703 15 431.53 416 64 25 28 2.6 59 98 NM 156 NM NM <0.02 0.005 NM <0.001 <0.01 <0.02 NM <0.005 <0.01 NM <0.03 <0.002 <0.01BSG2779C 5/14/2010 7.54 695 15.0 424.27 408 69 26 28 2.6 53 95 NM 156 NM NM <0.02 0.007 NM <0.001 0.012 <0.02 <0.02 <0.005 <0.01 <0.0002 <0.03 <0.002 <0.01BSG2779C 11/12/2010 7.51 708 14.0 432.62 398 66 26 28 2.5 61 103 NM 158 NM NM <0.02 <0.005 NM <0.001 <0.01 <0.02 <0.02 <0.005 <0.01 <0.0002 <0.03 <0.002 <0.01BSG2782A 5/22/2009 3.50 16920 16 419.18 32800 449 3630 74 24.0 27000 159 194.0 <5 NM 9550 NM NM NM NM NM NM NM NM NM NM NM 0.049 NMBSG2782A 11/24/2009 3.65 17880 13 432.63 31000 391 3240 65 24.0 24700 170 174.0 <5 NM 8280 1540.00 0.041 NM 1.230 0.022 53.600 0.06 0.068 420.000 NM 17.800 0.052 119.000BSG2782A 5/5/2010 3.62 14180 14.0 427.52 24300 428 2570 57 20 16500 161 141 <5 NM 5210 1010 0.033 NM 0.94 0.014 33.2 1.57 0.052 307 0.011 13.1 0.043 82.4BSG2782A 11/9/2010 3.65 11370 12.0 431.72 17900 457 1940 69 16 12100 159 113.8 <5 NM 3060 712 0.023 NM 0.7 0.016 25.3 0.51 0.042 216 0.011 9.63 0.034 58.3BSG2782B 5/22/2009 4.26 6520 16 419.00 7510 436 937 98 11.0 5590 122 28.5 <5 NM 383 48.10 0.010 NM 0.550 <0.01 0.067 <0.02 0.022 93.200 NM 2.960 0.011 4.650BSG2782B 11/20/2009 3.99 5770 13 423.62 6750 481 890 94 12.0 4320 116 23.0 <5 NM 255 36.90 0.009 NM 0.470 <0.01 0.071 0.03 0.020 71.800 NM 2.540 0.012 4.280BSG2782B 5/4/2010 4.09 6070 13.0 422.78 6970 437 851 94 10 3880 120 24.3 <5 NM 183 36 0.01 NM 0.47 <0.01 0.066 <0.02 0.021 71.3 0.0026 2.46 0.011 4.36BSG2782B 11/9/2010 4.18 5670 12.0 429.11 6530 412 734 84 12 3990 112 28.0 <5 NM 202 41.6 0.017 NM 0.5 <0.01 0.07 <0.02 0.022 75.9 NM 2.63 0.01 4.74BSG2782C 5/19/2009 3.75 17880 16 425.85 33200 444 4830 135 19.0 25800 165 226.0 <5 NM 5010 655.00 0.052 NM 2.260 0.025 12.200 0.50 0.028 661.000 NM 29.700 0.058 70.700BSG2782C 11/24/2009 3.93 19510 13 432.80 30700 401 4550 144 20.0 24100 168 198.0 <5 NM 3400 595.00 0.032 NM 2.430 0.013 7.010 0.28 0.026 670.000 NM 28.100 0.060 56.400BSG2782C 5/5/2010 3.85 18780 14.0 431.83 33100 422 4510 126 19 21300 159 197 <5 NM 2390 565 0.037 NM 2.43 0.013 6.64 0.27 0.026 657 0.02 27.4 0.065 54.2BSG2782C 11/10/2010 3.85 18520 12.0 438.03 31700 423 4580 138 18 21800 172 196.8 <5 NM 2470 553 0.032 NM 2.62 0.016 7.81 0.27 0.024 693 0.017 29 0.055 52.2BSG2783A 5/28/2009 7.10 1948 17 371.08 1530 279 77 54 4.1 613 218 0.1 169 NM NM <0.02 <0.005 NM <0.001 <0.01 <0.02 <0.02 <0.005 <0.01 NM <0.03 0.003 <0.01BSG2783A 11/11/2009 7.20 1935 15 373.81 1440 264 72 49 4.5 640 214 0.1 172 NM NM <0.02 <0.005 NM <0.001 <0.01 <0.02 <0.02 <0.005 <0.01 NM <0.03 0.003 <0.01BSG2783A 5/26/2010 7.24 2000 15 376.46 1550 288 79 53 4.2 649 216 0.1 169 NM NM <0.02 <0.005 NM <0.001 <0.01 <0.02 <0.02 <0.005 <0.01 <0.0002 <0.03 0.003 <0.01BSG2783A 10/18/2010 7.17 2150 15.0 381.75 1580 318 90 59 4.4 810 253 0.1 173 NM NM <0.02 <0.005 NM <0.001 <0.01 <0.02 <0.02 <0.005 <0.01 <0.0002 <0.03 NM <0.01BSG2783B 5/28/2009 3.80 12600 17 373.53 19500 439 2890 107 19.0 15000 176 124.0 <5 NM NM 311.00 0.036 NM 1.290 0.015 0.230 0.35 0.035 317.000 NM 14.050 0.039 39.020BSG2783B 11/11/2009 3.85 12620 16 376.34 18100 410 2630 96 18.0 13600 177 107.0 <5 NM NM 307.00 0.024 NM 1.190 0.010 0.250 <0.02 0.032 322.000 NM 12.550 0.048 36.800BSG2783B 5/27/2010 3.83 12530 17.0 378.87 19100 444 2750 109 11 11900 159 99.6 <5 NM NM 310 0.02 NM 1.17 <0.01 0.23 0.3 0.034 321 0.0086 12.6 0.055 36.5BSG2783B 10/19/2010 3.89 12150 16.0 384.02 17300 398 2380 95 16 13600 194 96.2 <5 NM NM 266 0.021 NM 1.11 0.012 0.254 0.23 0.032 293 0.0081 11.3 NM 32.9BSG2783C 5/29/2009 7.38 1181 17 369.88 882 159 47 39 2.9 308 110 0.2 200 NM NM 0.04 <0.005 NM <0.001 0.011 <0.02 <0.02 <0.005 0.025 NM <0.03 <0.002 <0.01BSG2783C 11/10/2009 7.18 1154 15 372.57 750 137 43 35 2.9 290 107 0.2 208 NM NM <0.02 <0.005 NM <0.001 <0.01 <0.02 <0.02 <0.005 <0.01 NM <0.03 <0.002 <0.01BSG2783C 5/26/2010 7.37 1152 15 374.60 828 145 45 38 2.5 268 109 0.2 202 NM NM <0.02 <0.005 NM <0.001 <0.01 <0.02 <0.02 <0.005 <0.01 <0.0002 <0.03 0.002 <0.01BSG2783C 10/18/2010 7.35 1202 15.0 380.27 780 153 47 40 2.7 333 120 0.2 198 NM NM <0.02 <0.005 NM <0.001 <0.01 <0.02 <0.02 <0.005 <0.01 <0.0002 <0.03 NM <0.01BSG2784 4/17/2009 3.75 10830 14 NA 15800 453 1960 74 10.0 11600 183 96.5 <5 NM 2860 394.00 0.027 <0.01 0.795 <0.01 12.830 1.29 0.032 217.000 NM 10.230 0.024 38.300BSG2784 11/19/2009 3.80 10060 14 NA 14200 440 1650 68 12.0 11500 174 87.2 <5 NM 2910 440.42 0.020 <0.01 0.770 <0.01 12.800 NM 0.030 217.000 NM 8.600 0.028 40.200BSG2784 3/31/2010 3.76 10780 13 NA 14800 424 1660 65 12 10500 176 86.9 0 NM 2170 477 0.021 0.01 0.82 <0.01 15.61 1.47 0.033 218 0.0058 7.74 0.014 45.6BSG2784 6/17/2010 3.84 10920 15.0 NA 16200 401 1900 75 8.3 10000 180 90.8 <5 NM 1770 404.98 0.02 <0.01 0.85 <0.01 11.67 1.23 0.028 243 0.0086 9.41 0.027 36.8BSG2784 7/15/2010 3.73 11270 17.0 NA 16600 435 1940 93 12 15100 181 92.3 <5 NM 1690 370 0.019 <0.01 0.872 <0.01 10.9 1.156 0.028 219 0.0083 8.92 0.029 34.3BSG2784 11/10/2010 3.72 10610 14.0 NA 15400 442 1930 76 12 10600 179 92.4 <5 NM 1820 361 0.026 0.011 0.894 <0.01 12.08 1.26 0.029 219 0.0087 9.82 0.027 34.9COG1149A 3/11/2009 7.18 1354 12 129.06 820 151 48 29 3.5 26 345 NM 153 NM NM NM <0.005 0.190 <0.001 <0.01 <0.02 <0.02 <0.005 <0.01 NM <0.03 0.002 <0.01COG1149A 5/5/2009 7.24 1294 12 128.95 810 142 46 29 3.4 25 337 NM 154 NM NM NM <0.005 0.210 <0.001 <0.01 <0.02 <0.02 <0.005 <0.01 NM <0.03 NM <0.01COG1149A 8/3/2009 6.96 902 16 121.98 902 156 48 30 3.5 25 344 NM 154 NM NM NM <0.005 0.200 <0.001 <0.01 <0.02 <0.02 <0.005 <0.01 NM <0.03 <0.002 <0.01COG1149A 11/6/2009 7.26 1346 14 129.18 834 139 45 27 3.4 25 353 NM 153 NM NM NM <0.005 0.210 <0.001 <0.01 <0.02 <0.02 <0.005 <0.01 NM <0.03 NM <0.01COG1149A 2/22/2010 7.28 1321 11 129.51 802 154 49 32 4.0 29 338 NM 157 NM NM NM <0.005 0.21 <0.001 <0.01 <0.02 <0.02 <0.005 <0.01 NM <0.03 <0.002 <0.01COG1149A 4/26/2010 7.38 1245 13.0 129.76 798 141 47 30 2.9 25 321 NM 155 NM NM NM <0.005 0.21 <0.001 <0.01 <0.02 <0.02 <0.005 <0.01 NM <0.03 <0.002 <0.01
NM = Not Measured
South Facilities Groundwater2010 Remedial Progress Report Brown highlights are 2010 extraction wells and blue highlights are 2010 compliance monitoring wells
April 2011A-3

Kennecott Utah Copper | Environmental Restoration Group
pH Cond Temp DTW TDS Ca-T Mg-T Na-T K-T SO4 Cl-T F Alk Ag Acidity Al-D As-D Ba-D Cd-D Cr-D Cu-D Fe-D Pb-D Mn-D Hg-T Ni-D Se-D Zn-Dsu uS/cm C Feet mg/l mg/l mg/l mg/l mg/l mg/l mg/l mg/l mg/l as CaCO3 mg/l mg/l as CaCO3 mg/l mg/l mg/l mg/l mg/l mg/l mg/l mg/l mg/l mg/l mg/l mg/l mg/lWELL DATE
COG1149A 8/31/2010 7.23 1294 13.0 129.93 794 140 48 32 3.5 24 336 NM 152 NM NM NM 0.006 0.2 <0.001 <0.01 <0.02 <0.02 <0.005 <0.01 NM <0.03 <0.002 <0.01COG1149A 11/1/2010 7.17 1349 13.0 130.26 900 143 48 32 3.5 26 351 NM 156 NM NM NM <0.005 0.208 <0.001 <0.01 <0.02 <0.02 <0.005 <0.01 NM <0.03 <0.002 <0.01COG1149B 3/11/2009 7.47 813 13 152.40 464 88 32 15 4.8 11 160 NM 163 NM NM NM 0.006 0.260 <0.001 <0.01 <0.02 <0.02 <0.005 <0.01 NM <0.03 0.003 <0.01COG1149B 5/5/2009 7.50 794 14 154.44 512 86 31 15 4.8 10 161 NM 165 NM NM NM 0.006 0.290 <0.001 0.014 <0.02 <0.02 <0.005 <0.01 NM <0.03 NM <0.01COG1149B 8/3/2009 7.30 829 17 152.95 518 92 33 16 5.0 10 160 NM 161 NM NM NM 0.006 0.271 <0.001 0.012 <0.02 <0.02 <0.005 <0.01 NM <0.03 0.002 <0.01COG1149B 11/6/2009 7.58 808 14 153.20 524 80 31 15 4.7 10 168 NM 163 NM NM NM 0.006 0.290 <0.001 0.011 <0.02 <0.02 <0.005 <0.01 NM <0.03 NM <0.01COG1149B 2/22/2010 7.50 804 11 153.15 498 87 33 16 5.3 12 161 NM 163 NM NM NM 0.006 0.29 <0.001 0.011 <0.02 <0.02 <0.005 <0.01 NM <0.03 0.003 <0.01COG1149B 4/26/2010 7.55 769 13.0 153.28 492 83 32 16 4.2 10 149 NM 163 NM NM NM 0.006 0.29 <0.001 0.012 <0.02 <0.02 <0.005 <0.01 NM <0.03 0.002 <0.01COG1149B 8/31/2010 7.42 802 15.0 154.12 524 81 31 16 4.7 9 158 NM 161 NM NM NM 0.008 0.288 <0.001 0.012 <0.02 <0.02 <0.005 <0.01 NM <0.03 <0.002 <0.01COG1149B 11/1/2010 7.36 811 13.0 154.50 542 82 31 17 4.7 9 159 NM 164 NM NM NM 0.007 0.287 <0.001 0.013 <0.02 <0.02 <0.005 <0.01 NM <0.03 0.002 <0.01COG1152A 12/11/2009 5.72 5320 12 208.00 4760 550 446 216 6.8 2810 598 NM 102 NM NM <0.02 <0.005 NM 0.013 <0.01 <0.02 <0.02 <0.005 20.200 NM 0.330 0.009 0.030COG1152A 9/23/2010 5.50 5330 16.0 210.82 5000 543 445 211 6.1 3000 663 NM 82 NM NM <0.02 0.006 NM 0.015 <0.01 <0.02 <0.02 <0.005 22.5 0.0002 0.384 0.008 0.032COG1172 8/5/2009 7.77 647 13 69.64 364 66 32 25 1.1 64 33 NM 235 NM NM NM 0.005 0.054 <0.001 <0.01 <0.02 NM <0.005 NM NM NM NM <0.01COG1175B 8/26/2009 3.93 6830 18 410.67 7420 437 878 88 6.9 4880 183 NM <5 NM NM NM 0.014 NM 0.540 NM 9.380 NM 0.026 NM NM NM 0.002 26.400COG1175B 8/16/2010 3.84 6460 17.0 416.17 7380 420 811 85 12 4470 193 NM <5 NM NM 82.5 0.013 NM 0.5 0.01 8.9 0.072 0.023 131 0.002 5.51 0.018 23.4COG1178A 7/13/2009 7.00 2210 19 303.97 1580 258 81 67 4.2 306 496 0.1 144 NM NM <0.02 <0.005 0.034 <0.001 <0.01 <0.02 <0.02 <0.005 <0.01 NM <0.03 0.005 <0.01
COG1178A 7/12/2010 7.30 2130 17.0 362.82 1670 264 86 72 4.4 297 505 0.1 143 NM NM <0.02 0.005 0.032 <0.001 <0.01 <0.02 <0.02 <0.005 <0.01 <0.0002 <0.03 0.006 <0.01COG1178B 3/27/2009 7.23 2270 13 355.20 1630 267 87 70 4.4 311 517 NM 151 NM NM <0.02 <0.005 0.036 <0.001 <0.01 <0.02 <0.02 <0.005 <0.01 NM <0.03 0.005 <0.01COG1204A 5/26/2009 7.44 665 15 773.38 412 56 27 41 1.4 34 61 NM 227 NM NM <0.1 <0.005 0.190 <0.001 <0.01 <0.02 <0.02 <0.005 <1e-005 NM <0.03 <0.002 <0.01COG1204A 10/21/2009 7.60 659 12 772.26 372 55 28 45 1.4 25 66 NM 230 NM NM <0.02 <0.005 0.210 <0.001 <0.01 <0.02 <0.02 <0.005 <0.01 NM <0.03 <0.002 <0.01COG1204A 4/19/2010 7.45 682 15 771.10 374 53 26 47 2.0 36 65 NM 226 NM NM <0.02 <0.005 0.21 <0.001 <0.01 <0.02 <0.02 <0.005 <0.01 NM <0.03 <0.002 <0.01COG1204A 9/1/2010 7.37 687 16.0 770.88 396 55 28 44 1.6 33 66 NM 230 NM NM <0.02 <0.005 0.203 <0.001 <0.01 <0.02 <0.02 <0.005 <0.01 NM <0.03 <0.002 <0.01COG1204B 5/27/2009 7.47 730 15 773.47 462 75 35 29 1.4 115 41 NM 224 NM NM <0.02 <0.005 0.100 <0.001 <0.01 <0.02 <0.02 <0.005 <0.01 NM <0.03 0.002 0.013COG1204B 8/12/2009 7.42 752 20 771.92 434 74 36 32 1.6 123 41 NM 224 NM NM <0.01 0.006 0.097 <0.001 <0.01 <0.02 <0.02 <0.005 <0.01 NM <0.03 NM 0.011COG1204B 9/30/2009 7.41 741 10 772.33 456 73 35 30 2.0 125 39 NM 227 NM NM <0.02 <0.005 0.098 <0.001 <0.01 <0.02 <0.02 <0.005 <0.01 NM <0.03 0.002 0.018COG1204B 10/22/2009 7.52 743 12 771.98 464 73 36 32 1.3 128 41 NM 228 NM NM <0.02 <0.005 0.100 <0.001 <0.01 <0.02 <0.02 <0.005 <0.01 NM <0.03 0.002 0.015COG1204B 4/20/2010 7.33 743 15 771.21 462 83 38 31 1.3 131 39 NM 225 NM NM <0.02 <0.005 0.088 <0.001 <0.01 <0.02 <0.02 <0.005 <0.01 NM <0.03 0.002 0.016COG1204B 9/2/2010 7.37 809 15.0 770.52 392 79 39.5 35 1.6 150 41 NM 224 NM NM <0.02 <0.005 0.083 <0.001 <0.01 <0.02 <0.02 <0.005 <0.01 NM <0.03 <0.002 0.019ECG1100A 4/16/2009 6.48 4160 13 87.25 3910 632 316 83 5.6 2430 93 NM 568 NM NM NM 0.005 0.021 <0.001 <0.01 <0.02 NM <0.005 NM NM NM 0.004 2.590ECG1100A 11/12/2009 6.39 4430 13 86.15 4140 691 338 79 5.6 2620 95 NM 549 NM NM NM <0.005 0.022 <0.001 <0.01 <0.02 NM <0.005 NM NM NM 0.004 3.470ECG1100A 2/23/2010 6.43 4530 14 88.5 4340 663 354 81 5.7 2550 89 NM 549 NM NM NM <0.005 0.022 <0.001 <0.01 <0.02 NM <0.005 NM NM NM 0.004 3.78ECG1100A 3/4/2010 6.35 4440 14 88.57 4320 668 362 85 6.1 2380 97 NM 551 NM NM NM 0.005 0.022 <0.001 <0.01 <0.02 NM <0.005 NM NM NM 0.005 NMECG1100A 4/6/2010 6.21 4510 12 89.21 4350 681 376 86 6.3 2690 113 NM 568 NM NM NM 0.006 0.02 <0.001 <0.01 <0.02 NM <0.005 NM NM NM 0.004 3.89ECG1100A 5/5/2010 6.41 4540 15.0 89.35 4430 663 353 80 6.0 2510 96 NM 582 NM NM NM <0.005 0.021 <0.001 <0.01 0.022 NM <0.005 NM NM NM 0.004 3.74ECG1100A 5/17/2010 6.24 4070 15.0 92.7 4230 611 334 82 6.5 2430 89 NM 549 NM NM NM <0.005 0.02 <0.001 <0.01 0.043 NM <0.005 NM NM NM 0.004 3.3ECG1100A 5/17/2010 6.34 4280 15.0 89.43 4380 638 343 85 6.1 2660 94 NM 572 NM NM NM <0.005 0.022 <0.001 <0.01 0.063 NM <0.005 NM NM NM 0.004 3.53ECG1100A 5/18/2010 6.30 3490 14.0 94.25 3920 579 321 82 5.9 2300 87 NM 519 NM NM NM <0.005 0.02 <0.001 0.02 <0.02 NM <0.005 NM NM NM 0.004 3.04ECG1100A 5/19/2010 6.24 3650 14.0 92.13 3830 561 314 82 5.6 2170 89 NM 521 NM NM NM <0.005 0.02 <0.001 0.014 <0.02 NM <0.005 NM NM NM 0.004 2.91ECG1100A 5/20/2010 6.29 3900 13.5 89.41 3800 528 292 80 5.6 2260 90 NM 506 NM NM NM 0.005 0.019 <0.001 <0.01 <0.02 NM <0.005 NM NM NM 0.004 3.04ECG1100A 5/21/2010 6.29 3990 15.0 89.50 3770 570 308 74 5.9 2100 90 NM 521 NM NM NM <0.005 0.02 <0.001 <0.01 <0.02 NM <0.005 NM NM NM 0.004 2.99ECG1100A 6/2/2010 6.38 4400 15.0 89.37 4330 642 347 82 5.6 2560 98 NM 569 NM NM NM 0.009 0.022 0.002 <0.01 <0.02 NM <0.005 NM NM NM 0.004 3.75ECG1100A 7/9/2010 6.31 4120 15.0 86.30 4160 644 348 86 5.7 2530 96 NM 245 NM NM NM <0.005 0.02 <0.001 <0.01 <0.02 NM <0.005 NM NM NM 0.004 3.43ECG1100A 8/3/2010 6.39 4240 16.0 85.95 4330 670 321 82 5.7 2570 92 NM 586 NM NM NM <0.005 0.02 <0.001 <0.01 <0.02 NM <0.005 NM NM NM 0.004 3.27ECG1100A 9/14/2010 6.26 4330 16.0 86.58 4440 703 361 83 5.7 2910 101 NM 587 NM NM NM 0.005 0.021 <0.001 0.01 <0.02 NM <0.005 NM NM NM 0.005 4.03ECG1100A 10/1/2010 6.25 4550 15.5 87.13 4670 720 373 82 5.8 2710 97 NM 587 NM NM NM 0.006 0.018 <0.001 0.011 <0.02 NM <0.005 NM NM NM 0.005 4.13ECG1100A 11/4/2010 6.36 4420 14.0 87.45 4710 691 382 90 6.4 2950 102 NM 579 NM NM NM 0.005 0.026 <0.001 <0.01 0.021 NM <0.005 NM NM NM 0.004 4.31ECG1100B 4/16/2009 7.77 550 15 81.42 306 54 23 19 1.3 65 38 NM 159 NM NM NM <0.005 0.049 <0.001 <0.01 <0.02 NM <0.005 NM NM NM <0.002 <0.01ECG1100B 11/12/2009 7.72 562 15 79.65 296 53 22 18 1.3 69 38 NM 158 NM NM NM <0.005 0.048 <0.001 <0.01 <0.02 NM <0.005 NM NM NM <0.002 <0.01ECG1100B 4/6/2010 7.85 566 15 82.97 300 54 24 19 1.5 67 35 NM 157 NM NM NM <0.005 0.048 <0.001 <0.01 <0.02 NM <0.005 NM NM NM <0.002 <0.01ECG1100B 10/1/2010 7.69 559 16.0 81.34 374 57 23 19 1.3 67 40 NM 155 NM NM NM <0.005 0.045 <0.001 <0.01 <0.02 NM <0.005 NM NM NM <0.002 <0.01ECG1106A 7/9/2010 7.45 754 17.0 110.20 440 69 28 27 1.4 68 73 NM 198 NM NM NM 0.005 0.099 <0.001 <0.01 <0.02 NM <0.005 NM NM NM <0.002 0.018ECG1106B 7/9/2010 7.59 640 17.0 109.85 314 59 23 22 1.3 65 49 NM 174 NM NM NM <0.005 0.075 <0.001 <0.01 <0.02 NM <0.005 NM NM NM <0.002 <0.01ECG1113A 11/4/2009 7.20 2370 15 96.37 2020 401 91 63 6.1 1100 186 NM 286 NM NM <0.02 <0.005 NM <0.001 <0.01 <0.02 NM <0.005 <0.01 NM <0.03 0.002 <0.01ECG1113A 9/23/2010 7.29 2440 16.0 97.90 2180 411 90 63 5.0 1120 179 NM 284 NM NM <0.02 0.005 NM <0.001 <0.01 <0.02 NM <0.005 <0.01 NM <0.03 0.002 <0.01ECG1114A 10/5/2009 7.48 1015 16 45.45 674 77 31 58 13.0 42 202 NM 168 NM NM NM <0.005 0.230 <0.001 <0.01 <0.02 <0.02 <0.005 <0.01 NM <0.03 <0.002 <0.01ECG1114A 9/28/2010 7.21 1022 18.0 47.30 656 86 32 59 13 39 214 NM 177 NM NM NM 0.005 0.247 <0.001 <0.01 <0.02 <0.02 <0.005 <0.01 <0.0002 <0.03 <0.002 <0.01ECG1114B 9/29/2009 7.63 435 18 390.18 234 44 15 13 2.4 25 44 NM 119 NM NM NM 0.010 0.221 <0.001 <0.01 <0.02 0.03 <0.005 0.010 NM <0.03 <0.002 <0.01ECG1114B 9/21/2010 7.44 430 17.0 391.42 232 43 15 14 2.5 25 46 NM 124 NM NM NM 0.011 0.235 <0.001 <0.01 <0.02 0.023 <0.005 0.011 <0.0002 <0.03 <0.002 <0.01ECG1115A 2/2/2009 3.42 19300 14 NA 38400 462 3970 61 6.8 28700 197 NM <5 NM NM 1950.00 0.027 NM 0.640 0.026 104.000 514.00 <0.005 255.000 NM 18.300 0.033 124.000ECG1115A 3/12/2010 3.41 19820 15 409.93 38000 441 3940 59 7.6 28400 201 NM <5 NM NM 1770 0.036 NM 0.63 0.046 93.1 492 <0.005 248 0.0015 18.4 <0.002 116ECG1115B 2/2/2009 4.29 21800 14 NA 37900 443 6050 136 19.0 29100 162 NM <5 NM NM 372.00 0.040 NM 1.310 <0.01 0.120 0.29 0.005 926.000 NM 42.300 0.053 19.600ECG1115B 3/12/2010 4.34 22200 15 414.10 38100 415 5870 123 17 29000 168 NM <5 NM NM 367 .049 NM 1.350 <0.01 0.200 0.400 0.007 944 0.041 43.9 0.059 19.6ECG1115C 2/3/2009 3.46 24000 14 437.33 47200 479 6190 95 38.0 41700 172 NM <5 NM NM 1680.00 0.070 NM 1.850 0.018 96.100 0.67 0.021 1020.000 NM 40.800 0.089 189.000ECG1115C 3/15/2010 3.60 24000 15 417.00 47500 446 5640 78 30 34100 175 NM <5 NM NM 1610 0.086 NM 1.85 0.03 97.1 1.77 0.017 980 0.013 40.7 0.089 182ECG1115D 2/5/2009 7.76 605 14 411.57 30000 53 20 33 7.0 48 75 NM 148 NM NM <0.02 <0.005 NM <0.001 0.012 <0.02 <0.02 <0.005 <0.01 NM <0.03 0.005 <0.01ECG1116B 6/15/2009 7.08 3190 15 393.35 3170 613 164 80 20.0 1910 261 NM 209 NM NM <0.02 <0.005 0.031 <0.001 0.011 <0.02 <0.02 <0.005 <0.01 NM <0.03 <0.002 0.024ECG1116B 8/2/2010 7.04 3300 16.0 392.96 3260 639 165 85 20 1820 249 NM 215 NM NM <0.02 <0.005 0.031 <0.001 <0.01 <0.02 <0.02 <0.005 <0.01 <0.0002 NM 0.003 0.011ECG1117A 8/31/2009 3.67 9430 18 403.06 12200 430 1470 116 <0.5 9120 179 NM <5 NM 2090 284.00 0.010 NM 0.520 0.013 17.200 40.10 <0.005 193.000 NM 6.580 0.014 26.500ECG1117A 8/4/2010 3.56 8660 17.0 388.61 2320 426 1280 108 6.1 7690 201 NM <5 NM 1300 277 0.008 NM 0.482 0.015 17.3 39.9 <0.005 169 0.016 6.17 0.014 26.6ECG1117B 8/10/2009 7.06 4240 18 399.57 4350 774 267 80 9.7 2670 156 NM 479 NM NM 0.07 <0.005 NM <0.001 <0.01 <0.02 <0.02 <0.005 0.043 NM 0.031 NM 0.012ECG1117B 8/5/2010 6.99 3960 17.0 382.35 4250 797 274 80 9.4 2510 154 NM 505 NM NM <0.02 <0.005 NM <0.001 0.012 <0.02 <0.02 <0.005 <0.01 0.036 0.04 0.007 <0.01ECG1118A 2/24/2009 3.46 9510 14 417.95 12700 427 1360 105 6.9 9050 177 NM <5 NM NM 422.00 0.018 NM 0.530 <0.01 26.200 59.20 <0.005 163.000 NM 7.230 0.014 40.400ECG1118A 2/23/2010 3.49 9290 13 421.86 12400 429 1300 102 1.0 8180 192 NM <5 NM 2420 400 0.012 NM 0.51 <0.01 24.6 52.4 <0.005 146 NM 6.23 0.016 37.4ECG1118B 2/24/2009 7.28 2050 14 410.38 1640 276 90 53 9.0 1020 76 NM 153 NM NM 0.02 <0.005 NM <0.001 <0.01 <0.02 <0.02 <0.005 <0.01 NM <0.03 0.003 <0.01ECG1118B 2/23/2010 7.36 2250 13 416.57 1840 317 103 56 9.8 1140 77 NM 161 NM NM <0.02 <0.005 NM <0.001 <0.01 <0.02 <0.02 <0.005 <0.01 NM <0.03 0.003 <0.01ECG1121A 8/6/2009 3.59 11180 18 435.12 16500 419 1840 118 9.0 12300 206 NM <5 NM 2570 494.00 0.021 NM 0.820 <0.01 28.400 19.00 <0.005 255.000 NM 9.970 NM 4.500ECG1121A 8/3/2010 3.56 11070 18.0 440.79 15900 424 1720 115 11 11000 168 NM <5 NM 2190 473 0.015 NM 0.777 0.01 25.9 20.4 <0.005 247 0.0061 9.45 0.033 40.57ECG1121B 8/5/2009 7.02 4180 18 437.13 4210 782 256 102 8.9 2590 161 NM 311 NM NM <0.02 <0.005 NM <0.001 <0.01 <0.02 <0.02 <0.005 0.032 NM <0.03 NM <0.01ECG1124A 4/29/2010 3.62 10550 13.0 366.80 15000 424 1670 90 6.6 9150 227 NM <5 NM NM 574 0.011 NM 0.3 <0.01 35.4 0.73 0.006 92.6 0.0065 6.37 0.015 44.1
NM = Not Measured
South Facilities Groundwater2010 Remedial Progress Report Brown highlights are 2010 extraction wells and blue highlights are 2010 compliance monitoring wells
April 2011A-4

Kennecott Utah Copper | Environmental Restoration Group
pH Cond Temp DTW TDS Ca-T Mg-T Na-T K-T SO4 Cl-T F Alk Ag Acidity Al-D As-D Ba-D Cd-D Cr-D Cu-D Fe-D Pb-D Mn-D Hg-T Ni-D Se-D Zn-Dsu uS/cm C Feet mg/l mg/l mg/l mg/l mg/l mg/l mg/l mg/l mg/l as CaCO3 mg/l mg/l as CaCO3 mg/l mg/l mg/l mg/l mg/l mg/l mg/l mg/l mg/l mg/l mg/l mg/l mg/lWELL DATE
ECG1124B 6/12/2009 6.62 918 17 397.25 614 84 43 37 4.5 403 43 NM 73 NM NM 0.06 <0.005 NM 0.002 0.029 0.020 <0.02 <0.005 2.090 NM 0.076 0.020 0.160ECG1124B 4/29/2010 6.27 2710 13.0 357.02 2570 296 247 55 7.8 1490 50 NM 62 NM NM 0.8 <0.005 NM 0.024 0.014 0.37 0.47 <0.005 20.3 0.0018 0.793 0.046 2.12ECG1124C 6/15/2009 7.82 497 15 376.04 280 41 12 35 4.0 89 39 NM 93 NM NM <0.02 <0.005 NM <0.001 0.043 <0.02 <0.02 <0.005 <0.01 NM <0.03 0.015 <0.01ECG1124C 4/30/2010 8.03 483 13.0 351.67 298 40 12 36 4.4 84 39 NM 93 NM NM <0.02 <0.005 NM <0.001 0.038 <0.02 <0.02 <0.005 <0.01 <0.0002 <0.03 0.019 <0.01ECG1128A 11/9/2009 4.00 8010 13 326.43 9660 444 1070 76 13.0 6310 234 NM <5 NM NM 157.21 0.012 NM 1.010 <0.01 3.500 0.09 0.054 163.780 NM 6.270 0.018 36.990ECG1128A 11/4/2010 3.85 6400 14.0 330.22 7750 419 845 81 14 4220 230 NM <5 NM NM 125 0.01 NM 0.785 <0.01 3.17 0.06 0.054 130 0.0049 4.76 0.012 27.19ECG1128B 11/9/2009 7.60 904 13 321.69 484 84 30 28 3.5 105 125 NM 157 NM NM <0.02 <0.005 NM <0.001 <0.01 <0.02 <0.02 <0.005 0.013 NM <0.03 0.003 <0.01ECG1128B 11/4/2010 7.41 848 14.0 330.20 490 84 29 29 3.4 104 133 NM 153 NM NM <0.02 <0.005 NM <0.001 <0.01 <0.02 <0.02 <0.005 <0.01 <0.0002 <0.03 0.002 <0.01ECG1131A 6/23/2009 6.89 4080 15 316.92 3240 625 189 85 5.3 1460 557 NM 214 NM NM <0.02 <0.005 NM <0.001 <0.01 <0.02 <0.02 <0.005 <0.01 NM <0.03 0.003 0.012ECG1144A 7/29/2009 3.33 7700 18 418.53 9790 473 1070 87 3.8 6530 177 NM <5 NM NM 314.00 0.010 NM 0.240 <0.01 20.130 40.30 <0.005 85.400 NM 4.060 0.012 26.500ECG1144A 8/10/2010 3.60 7010 17.0 424.61 8070 409 745 81 5.6 4930 191 NM <5 NM NM 259 0.007 NM 0.219 <0.01 17.2 28.7 <0.005 53.3 0.008 2.69 0.014 18.1ECG1144B 7/29/2009 4.03 7960 18 371.64 9950 443 1290 51 11.0 7050 92 NM <5 NM NM 184.00 0.017 NM 0.470 <0.01 20.870 0.94 0.009 243.000 NM 8.550 0.024 31.500ECG1144B 8/10/2010 4.02 10630 17.0 356.65 14500 376 1670 59 13 9430 100 NM <5 NM NM 327 0.013 NM 0.762 0.012 32.8 1.6 <0.005 342 0.0014 11.1 0.042 34.5ECG1145A 12/14/2009 3.85 8060 13 377.90 10200 406 1170 79 10.0 7190 205 NM <5 NM 1810 206.00 0.008 NM 1.030 <0.01 18.300 0.16 0.055 213.000 NM 7.860 0.016 45.700ECG1145A 11/3/2010 3.77 7550 14.0 375.48 9800 408 1060 86 12 6260 229 NM <5 NM 1030 190 0.009 NM 1.09 0.015 17.6 0.178 0.063 208 0.0038 8.21 0.013 47.2ECG1145B 12/15/2009 5.97 5240 12 372.42 5660 489 661 84 10.0 3370 153 NM 337 NM 106 3.72 <0.005 NM 0.076 <0.01 0.167 0.06 <0.005 67.600 NM 1.490 0.008 2.610ECG1145B 11/3/2010 6.20 5120 14.0 372.17 5460 505 615 84 9.1 3650 161 NM 362 NM <10 3.51 <0.005 NM 0.068 <0.01 0.19 0.085 <0.005 58.4 0.0027 1.16 0.006 2.04ECG1145C 12/16/2009 6.93 3360 13 370.21 3060 529 188 53 8.1 1810 142 NM 369 NM NM <0.02 <0.005 NM <0.001 <0.01 <0.02 <0.02 <0.005 <0.01 NM <0.03 0.006 <0.01ECG1145C 11/2/2010 6.77 3410 15.0 367.80 3140 549 201 60 8.4 1740 147 NM 363 NM NM <0.02 <0.005 NM <0.001 <0.01 <0.02 <0.02 <0.005 <0.01 0.0034 <0.03 0.005 <0.01ECG1146 2/17/2009 3.51 14410 16 264.00 24600 421 2680 74 8.2 18900 196 137.0 <5 NM 6220 940.80 0.041 <0.01 0.810 0.010 54.070 153.00 <0.005 317.000 NM 10.300 0.028 80.600ECG1146 5/12/2009 3.58 14690 16 407.80 24300 440 2870 80 9.6 18200 175 142.0 <5 NM 5810 942.00 0.040 <0.01 0.760 <0.01 60.200 152.00 <0.005 316.000 NM 14.000 0.035 78.100ECG1146 9/1/2009 3.40 14230 17 264.00 22700 421 2520 89 11.0 17200 172 130.0 <5 NM 5280 812.00 0.031 <0.01 0.810 <0.01 57.480 117.50 <0.005 303.000 NM 12.750 0.032 70.500ECG1146 11/19/2009 3.63 15130 16 264.00 26300 426 2690 80 12.0 18500 186 134.0 <5 NM 6690 936.00 0.028 <0.01 0.790 <0.01 58.530 NM <0.005 307.000 NM 14.270 0.035 79.000ECG1146 6/17/2010 3.51 15420 15.0 264.00 24700 416 2770 76 9.6 20400 193 134 <5 NM 4550 927.827 0.028 <0.01 0.818 <0.01 60.1 121 <0.005 311 0.0093 14.03 0.041 80.06ECG1146 7/27/2010 3.56 15040 19.0 264.00 26000 416 2760 77 13 23900 180 141.6 <5 NM 4740 938 0.026 <0.01 0.719 <0.01 64.6 169 <0.005 279 0.024 13.5 0.045 76.6ECG1146 11/10/2010 3.52 14050 14.0 264.00 23800 423 2670 80 10 14800 196 132.2 <5 NM 4740 918 0.025 <0.01 0.854 <0.01 68 149 <0.005 305 0.01 15.1 0.034 83.8ECG1182A 8/14/2009 8.10 953 19 51.16 504 31 12 132 2.8 79 108 NM 212 NM NM <0.02 <0.005 NM <0.001 <0.01 <0.02 <0.02 <0.005 0.033 NM <0.03 <0.002 <0.01ECG1182A 8/10/2010 8.24 838 22.0 50.35 430 23 8.5 129 2.5 70 95 NM 198 NM NM <0.02 <0.005 NM <0.001 <0.01 <0.02 <0.02 <0.005 <0.01 0.041 <0.03 <0.002 <0.01ECG1182B 8/14/2009 7.21 1087 21 44.47 632 97 41 38 3.4 110 128 NM 239 NM NM <0.02 0.007 NM <0.001 <0.01 <0.02 0.53 <0.005 0.038 NM <0.03 <0.002 <0.01ECG1182B 8/10/2010 7.16 1040 21.0 44.45 572 93 41 38 3.3 106 124 NM 253 NM NM <0.02 0.007 NM <0.001 <0.01 <0.02 0.86 <0.005 0.041 0.03 <0.03 <0.002 <0.01ECG1183A 5/29/2009 6.86 3560 16 43.31 2780 444 115 177 7.5 641 804 NM 293 NM NM NM 0.006 NM <0.001 NM <0.02 NM <0.005 NM NM NM 0.004 <0.01ECG1183A 11/24/2009 6.80 4082 14 45.40 2550 388 105 158 7.8 571 812 NM 286 NM NM NM 0.005 NM <0.001 NM <0.02 NM <0.005 NM NM NM 0.004 <0.01ECG1183A 5/17/2010 6.81 3600 15.0 42.62 2460 429 117 177 8.7 588 800 NM 292 NM NM NM <0.005 NM <0.001 NM <0.02 NM <0.005 NM NM NM 0.004 <0.01ECG1183A 11/22/2010 6.86 3540 11.5 45.70 2440 423 114 162 7.7 530 834 NM 284 NM NM NM 0.008 NM <0.001 NM <0.02 NM <0.005 NM NM NM 0.004 <0.01ECG1183B 5/29/2009 7.08 2200 17 33.55 1460 215 73 90 8.8 142 563 NM 184 NM NM NM 0.005 NM <0.001 NM <0.02 NM <0.005 NM NM NM 0.003 <0.01ECG1183B 11/24/2009 7.15 2540 14 35.06 1440 195 71 87 9.0 150 539 NM 182 NM NM NM <0.005 NM <0.001 NM <0.02 NM <0.005 NM NM NM 0.003 <0.01ECG1183B 5/17/2010 7.44 2210 18.0 33.37 1420 210 78 99 10 145 527 NM 184 NM NM NM <0.005 NM <0.001 NM <0.02 NM <0.005 NM NM NM 0.003 <0.01ECG1183B 11/22/2010 7.12 2210 10.0 35.40 1410 214 75 91 8.9 144 579 NM 183 NM NM NM 0.007 NM <0.001 NM <0.02 NM <0.005 NM NM NM 0.002 <0.01ECG1184 6/2/2009 7.09 1368 13 28.72 924 141 61 57 2.6 284 111 NM 291 NM NM <0.02 <0.005 0.022 <0.001 <0.01 <0.02 <0.02 <0.005 <0.01 NM <0.03 0.003 <0.01ECG1184 7/21/2010 6.80 1184 15.0 NA 780 130 60 59 2.6 252 105 NM 277 NM NM <0.02 <0.005 0.023 <0.001 <0.01 <0.02 <0.02 <0.005 <0.01 NM <0.03 <0.002 <0.01ECG1185 9/11/2009 3.23 8410 17 144.61 12100 389 1180 109 5.1 8350 243 NM <5 NM 3150 527.00 0.015 <0.01 0.250 0.150 200.000 0.22 0.210 759.000 NM 4.270 NM 475.700ECG1185 9/14/2010 3.66 8190 16.5 144.61 11000 312 984 89 4.7 7290 210 NM <5 NM 2420 411 0.011 <0.01 0.212 0.015 173 0.22 0.176 64.3 NM 4.05 0.016 43.3ECG1186 1/14/2009 7.10 2010 12 48.22 1380 240 55 109 4.1 348 379 NM 183 NM NM <0.02 <0.005 0.034 <0.001 <0.01 <0.02 <0.02 <0.005 <0.01 NM <0.03 <0.002 <0.01ECG1186 4/8/2009 7.14 2080 13 48.32 1440 221 54 111 4.0 330 380 NM 180 NM NM <0.02 <0.005 0.033 <0.001 <0.01 <0.02 <0.02 <0.005 <0.01 NM <0.03 <0.002 <0.01ECG1186 7/10/2009 6.85 2080 15 49.23 1360 232 54 109 4.4 331 379 NM 178 NM NM <0.02 <0.005 0.033 <0.001 <0.01 <0.02 <0.02 <0.005 <0.01 NM <0.03 <0.002 <0.01ECG1186 10/2/2009 7.00 1912 13 49.57 1360 215 53 107 5.3 320 372 NM 179 NM NM <0.02 0.008 0.034 <0.001 <0.01 <0.02 <0.02 <0.005 <0.01 NM <0.03 <0.002 <0.01ECG1186 1/11/2010 7.05 1963 12 50.22 1280 222 55 112 4.6 323 369 NM 183 NM NM <0.02 <0.005 0.036 <0.001 <0.01 <0.02 <0.02 <0.005 <0.01 NM <0.03 <0.002 <0.01ECG1186 4/16/2010 7.05 2040 14 50.60 1410 214 52.1 106 4.3 301 370 NM 179 NM NM <0.02 <0.005 0.035 <0.001 <0.01 <0.02 <0.02 <0.005 <0.01 NM <0.03 <0.002 <0.01ECG1186 8/2/2010 6.94 2080 15.5 51.11 1240 225 53 103 4.9 302 358 NM 179 NM NM <0.02 <0.005 0.036 <0.001 <0.01 <0.02 <0.02 <0.005 <0.01 NM <0.03 <0.002 <0.01ECG1186 11/8/2010 6.99 1955 12.0 51.78 1270 215 53 108 4.4 299 392 NM 181 NM NM <0.02 <0.005 0.039 <0.001 <0.01 <0.02 <0.02 <0.005 <0.01 NM <0.03 0.003 <0.01ECG1187 2/3/2009 7.02 2150 12 66.30 1490 263 64 77 5.0 188 546 0.3 157 NM NM <0.02 <0.005 0.140 <0.001 <0.01 <0.02 0.08 <0.005 <0.01 NM <0.03 0.004 <0.01ECG1187 3/10/2009 6.98 2180 12 66.57 1420 247 64 78 4.7 181 511 0.2 155 NM NM <0.02 <0.005 0.140 <0.001 <0.01 <0.02 <0.02 <0.005 <0.01 NM <0.03 0.004 <0.01ECG1187 4/2/2009 7.29 2260 13 66.38 1460 232 61 77 4.7 179 554 0.3 158 NM NM <0.02 <0.005 0.150 <0.001 <0.01 <0.02 <0.02 <0.005 <0.01 NM <0.03 NM <0.01ECG1187 5/1/2009 7.26 2240 13 66.70 1430 245 63 77 4.9 184 529 0.2 163 NM NM <0.02 <0.005 0.150 <0.001 <0.01 <0.02 <0.02 <0.005 <0.01 NM <0.03 0.003 <0.01ECG1187 6/18/2009 7.08 2280 15 66.90 1650 246 64 80 5.3 176 537 0.3 161 NM NM <0.02 <0.005 0.150 <0.001 <0.01 <0.02 <0.02 <0.005 <0.01 NM <0.03 0.003 <0.01ECG1187 7/7/2009 6.98 2250 16 66.92 1510 250 64 77 4.3 187 535 0.3 162 NM NM <0.02 <0.005 0.140 <0.001 <0.01 <0.02 <0.02 <0.005 <0.01 NM <0.03 0.002 <0.01ECG1187 8/4/2009 6.97 2250 17 67.59 1480 262 67 81 5.1 186 540 0.2 157 NM NM <0.02 <0.005 0.150 <0.001 <0.01 <0.02 <0.02 <0.005 <0.01 NM <0.03 0.003 <0.01ECG1187 9/9/2009 7.16 2190 16 67.44 1560 245 64 78 5.4 195 523 0.2 160 NM NM <0.02 0.009 0.140 <0.001 <0.01 <0.02 <0.02 <0.005 <0.01 NM <0.03 0.004 <0.01ECG1187 10/1/2009 7.21 2040 13 67.67 1430 247 66 78 6.0 194 529 0.2 163 NM NM <0.02 <0.005 0.150 <0.001 <0.01 <0.02 <0.02 <0.005 <0.01 NM <0.03 0.004 <0.01ECG1187 11/10/2009 7.22 2280 14 67.80 1400 242 63 72 5.2 197 519 0.2 164 NM NM <0.02 <0.005 0.150 <0.001 <0.01 <0.02 <0.02 <0.005 <0.01 NM <0.03 0.003 <0.01ECG1187 12/4/2009 7.12 2180 12 67.82 1460 241 65 78 5.2 201 505 0.2 163 NM NM <0.02 0.005 0.140 <0.001 <0.01 <0.02 <0.02 <0.005 <0.01 NM <0.03 NM <0.01ECG1187 1/11/2010 7.22 2180 13 68.08 1400 252 64 78 5.0 205 510 0.2 161 NM NM <0.02 <0.005 0.15 <0.001 <0.01 <0.02 <0.02 <0.005 <0.01 NM <0.03 0.003 <0.01ECG1187 4/20/2010 6.92 2290 15 68.41 1270 255 64 76 4.8 192 486 0.2 160 NM NM <0.02 <0.005 0.142 <0.001 <0.01 <0.02 <0.02 <0.005 <0.01 NM <0.03 0.003 <0.01ECG1187 7/23/2010 7.02 2170 15.0 69.07 1620 259 66 80 5.2 198 500 0.3 170 NM NM <0.02 <0.005 0.143 <0.001 <0.01 <0.02 <0.02 <0.005 <0.01 NM <0.03 0.004 <0.01ECG1187 10/27/2010 7.06 2210 13 69.75 1376 259 67 81 4.9 200 531 0.2 163 NM NM <0.02 <0.005 0.151 <0.001 <0.01 <0.02 <0.02 <0.005 <0.01 <0.0002 <0.03 0.003 <0.01ECG1188 1/8/2009 6.83 4000 12 47.66 3480 626 130 224 6.1 1850 522 0.2 274 NM NM <0.02 <0.005 0.027 <0.001 <0.01 <0.02 <0.02 <0.005 <0.01 NM <0.03 <0.002 0.011ECG1188 4/14/2009 6.93 4110 14 47.98 3440 607 133 235 6.1 1660 543 0.3 270 NM NM <0.02 <0.005 0.026 <0.001 <0.01 <0.02 <0.02 <0.005 <0.01 NM <0.03 <0.002 <0.01ECG1188 7/14/2009 6.94 4160 15 48.80 3520 620 132 236 6.6 1610 488 0.2 266 NM NM <0.02 <0.005 0.027 <0.001 <0.01 <0.02 <0.02 <0.005 <0.01 NM <0.03 <0.002 <0.01ECG1188 10/19/2009 6.69 4030 15 49.06 3440 632 141 247 7.5 1670 526 0.2 268 NM NM <0.02 <0.005 0.026 <0.001 <0.01 <0.02 <0.02 <0.005 <0.01 NM <0.03 <0.002 <0.01ECG1188 1/7/2010 6.98 4090 13 49.60 3330 625 133 228 6.9 1620 539 0.2 273 NM NM <0.02 <0.005 0.027 <0.001 <0.01 <0.02 <0.02 <0.005 <0.01 NM <0.03 <0.002 <0.01ECG1188 4/7/2010 6.85 3860 13 50.27 3410 620 134 229 6.9 1600 567 0.2 278 NM NM <0.02 0.006 0.026 <0.001 <0.01 <0.02 <0.02 <0.005 <0.01 NM <0.03 <0.002 <0.01ECG1188 7/28/2010 6.76 4080 15.5 50.60 3320 623 132 237 6.5 1690 508 0.2 272 NM NM <0.02 <0.005 0.026 <0.001 <0.01 <0.02 <0.02 <0.005 <0.01 NM 0.033 <0.002 <0.01ECG1188 10/6/2010 6.74 4150 14.0 50.93 3380 620 132 228 7.1 1540 521 0.2 271 NM NM <0.02 <0.005 0.027 <0.001 <0.01 <0.02 <0.02 <0.005 <0.01 NM <0.03 <0.002 <0.01ECG1189 1/13/2009 7.40 5120 12 226.27 624 101 32 30 4.7 13 213 0.3 130 NM NM <0.02 <0.005 0.360 <0.001 <0.01 <0.02 <0.02 <0.005 <0.01 NM <0.03 <0.002 <0.01ECG1189 4/14/2009 7.43 1010 13 225.60 616 97 32 30 4.7 13 226 0.3 127 NM NM <0.02 <0.005 0.360 <0.001 <0.01 <0.02 <0.02 <0.005 <0.01 NM <0.03 <0.002 <0.01ECG1189 7/10/2009 7.25 1008 17 226.05 628 96 31 28 4.7 12 226 0.3 125 NM NM <0.02 <0.005 0.360 <0.001 <0.01 <0.02 <0.02 <0.005 <0.01 NM <0.03 <0.002 <0.01ECG1189 10/19/2009 7.31 993 15 225.95 612 102 33 31 5.3 14 221 0.3 130 NM NM <0.02 <0.005 0.360 <0.001 <0.01 <0.02 <0.02 <0.005 <0.01 NM <0.03 <0.002 <0.01ECG1189 1/4/2010 7.22 995 12 226.47 598 96 31 30 5.3 13 229 0.2 131 NM NM <0.02 <0.005 0.37 <0.001 <0.01 <0.02 <0.02 <0.005 <0.01 NM <0.03 <0.002 <0.01ECG1189 4/15/2010 7.54 1012 14 226.3 670 96 30 27 4.6 13 196 0.3 129 NM NM <0.02 <0.005 0.35 <0.001 <0.01 <0.02 <0.02 <0.005 <0.01 NM <0.03 <0.002 <0.01
NM = Not Measured
South Facilities Groundwater2010 Remedial Progress Report Brown highlights are 2010 extraction wells and blue highlights are 2010 compliance monitoring wells
April 2011A-5

Kennecott Utah Copper | Environmental Restoration Group
pH Cond Temp DTW TDS Ca-T Mg-T Na-T K-T SO4 Cl-T F Alk Ag Acidity Al-D As-D Ba-D Cd-D Cr-D Cu-D Fe-D Pb-D Mn-D Hg-T Ni-D Se-D Zn-Dsu uS/cm C Feet mg/l mg/l mg/l mg/l mg/l mg/l mg/l mg/l mg/l as CaCO3 mg/l mg/l as CaCO3 mg/l mg/l mg/l mg/l mg/l mg/l mg/l mg/l mg/l mg/l mg/l mg/l mg/lWELL DATE
ECG1189 8/2/2010 7.49 1034 15.0 226.37 584 103 32 28 5.7 12 216 0.3 143 NM NM <0.02 <0.005 0.368 <0.001 <0.01 <0.02 <0.02 <0.005 <0.01 NM <0.03 <0.002 <0.01ECG1189 10/6/2010 7.42 979 13.0 224.42 668 98 31 28 4.7 11 253 0.3 127 NM NM <0.02 <0.005 0.376 <0.001 <0.01 <0.02 <0.02 <0.005 <0.01 NM <0.03 <0.002 <0.01ECG1190 1/9/2009 7.11 1327 12 135.28 912 171 45 27 3.2 66 321 NM 159 NM NM 0.17 <0.005 0.180 <0.001 <0.01 0.021 <0.02 <0.005 <0.01 NM <0.03 <0.002 0.010ECG1190 4/14/2009 7.22 1380 14 135.14 876 156 45 28 2.9 59 322 NM 159 NM NM <0.02 <0.005 0.180 <0.001 <0.01 <0.02 <0.02 <0.005 <0.01 NM <0.03 0.002 <0.01ECG1190 7/14/2009 7.05 1390 16 135.72 824 155 43 26 3.3 55 283 NM 154 NM NM <0.02 <0.005 0.170 <0.001 <0.01 <0.02 <0.02 <0.005 <0.01 NM <0.03 <0.002 <0.01ECG1190 10/19/2009 7.23 1377 15 135.98 940 162 46 29 3.2 67 321 NM 152 NM NM <0.02 <0.005 0.170 <0.001 <0.01 <0.02 <0.02 <0.005 <0.01 NM <0.03 <0.002 <0.01ECG1190 1/7/2010 7.12 1390 12 136.57 844 158 43 26 2.9 56 341 NM 159 NM NM <0.02 <0.005 0.183 <0.001 <0.01 <0.02 <0.02 <0.005 <0.01 NM <0.03 0.002 <0.01ECG1190 4/15/2010 7.12 1412 15 136.95 978 155 44 27 3.1 55 295 NM 159 NM NM <0.02 <0.005 0.18 <0.001 <0.01 <0.02 <0.02 <0.005 <0.01 NM <0.03 <0.002 <0.01ECG1190 7/28/2010 7.18 1436 16.0 137.22 950 158 44 27 3.2 55 316 NM 154 NM NM <0.02 <0.005 0.172 <0.001 <0.01 <0.02 <0.02 <0.005 <0.01 NM <0.03 0.002 <0.01ECG1190 10/6/2010 7.28 1378 14.0 137.57 934 159 44 27 2.9 52 359 NM 159 NM NM <0.02 0.005 0.179 <0.001 <0.01 <0.02 <0.02 <0.005 <0.01 NM <0.03 <0.002 <0.01ECG1203 6/8/2009 3.39 9620 14 NA 16000 440 1340 62 3.2 11600 131 NM <5 NM NM 850.00 0.012 <0.01 0.220 0.138 310.000 14.66 <0.005 74.400 NM 3.920 0.022 56.200ECG299 6/18/2009 6.37 2920 18 167.56 2500 286 187 139 10.0 1440 265 NM 56 NM NM NM <0.005 0.012 0.005 <0.01 0.135 NM <0.005 NM NM NM <0.002 0.320ECG299 12/18/2009 5.82 3430 12 168.48 2960 338 257 161 12.0 1820 216 NM 29 NM NM NM <0.005 0.012 0.008 <0.01 0.250 NM <0.005 NM NM NM 0.002 0.500ECG299 2/23/2010 6.61 3000 12 168.80 2460 276 198 134 9.7 1430 257 NM 54 NM NM NM <0.005 0.013 0.006 <0.01 0.19 NM <0.005 NM NM NM <0.002 0.36ECG299 3/4/2010 6.41 2230 13 168.7 2570 315 221 145 11 1510 269 NM 54 NM NM NM <0.005 0.013 0.007 <0.01 0.22 NM <0.005 NM NM NM <0.002 0.39ECG299 4/6/2010 5.19 3520 9 169.0 2720 263 165 114 9.4 1520 228 NM 47 NM NM NM <0.005 0.016 0.005 <0.01 0.17 NM <0.005 NM NM NM <0.002 0.3ECG299 5/5/2010 6.31 3380 19.0 168.95 2790 314 222 136 10 1580 242 NM 48 NM NM NM <0.005 0.014 0.007 <0.01 0.33 NM <0.005 NM NM NM 0.002 0.46ECG299 11/23/2010 5.98 3200 13.0 169.35 2890 319 227 145 9.8 1730 242 NM 35 NM NM NM <0.005 0.014 0.007 <0.01 0.283 NM <0.005 NM NM NM <0.002 0.468ECG902 6/4/2009 7.07 1712 15 183.15 1040 191 54 81 5.0 280 264 NM 217 NM NM NM <0.005 0.083 <0.001 <0.01 <0.02 NM <0.005 NM NM NM 0.003 <0.01ECG902 12/17/2009 6.97 1599 13 184.43 980 168 50 73 5.0 263 248 NM 227 NM NM NM <0.005 0.090 <0.001 <0.01 <0.02 NM <0.005 NM NM NM <0.002 <0.01ECG902 6/4/2010 6.97 1698 16.0 185.25 1080 170 48 70 4.4 272 256 NM 220 NM NM NM <0.005 0.084 <0.001 <0.01 <0.02 NM <0.005 NM NM NM 0.002 <0.01ECG902 10/22/2010 6.86 1618 15.0 185.95 972 179 51 74 5.0 253 259 NM 216 NM NM NM NM NM NM NM NM NM NM NM NM NM <0.002 NMECG905 6/2/2009 6.27 2650 15 217.30 2310 404 98 87 7.5 1270 131 NM 168 NM NM NM <0.005 0.025 <0.001 <0.01 <0.02 NM <0.005 NM NM NM 0.002 <0.01ECG905 12/17/2009 6.40 2490 13 216.60 2130 385 93 84 8.1 1210 140 NM 178 NM NM NM <0.005 0.026 <0.001 <0.01 <0.02 NM <0.005 NM NM NM 0.002 <0.01ECG905 6/4/2010 6.41 2600 15.0 218.40 2290 395 91 81 7.2 1280 136 NM 166 NM NM NM <0.005 0.025 <0.001 <0.01 <0.02 NM <0.005 NM NM NM 0.003 0.021ECG905 10/22/2010 6.23 2600 14.0 218.50 2160 404 93 84 7.7 1210 142 NM 168 NM NM NM NM NM NM NM NM NM NM NM NM NM NM NMECG906 5/18/2009 6.99 4440 15 111.63 4090 737 167 269 12.0 2020 421 NM 463 NM NM NM 0.007 0.025 <0.001 <0.01 <0.02 NM <0.005 NM NM NM <0.002 <0.01ECG906 11/5/2009 7.20 4370 14 112.58 4100 723 166 281 13.0 2120 421 NM 487 NM NM NM <0.005 0.024 <0.001 <0.01 <0.02 NM <0.005 NM NM NM 0.002 <0.01ECG906 3/26/2010 7.31 4700 11 113.25 4120 743 168 275 13 2220 406 NM 453 NM NM NM <0.005 0.023 <0.001 <0.01 <0.02 NM <0.005 NM NM NM <0.002 <0.01ECG906 8/27/2010 7.08 4380 15.0 113.95 4030 687 163 267 13 2290 398 NM 449 NM NM NM 0.005 0.025 <0.001 <0.01 <0.02 NM <0.005 NM NM NM 0.002 <0.01ECG906 11/8/2010 7.16 4560 11.0 114.32 4160 735 166 270 12 2190 404 NM 467 NM NM NM <0.005 0.025 <0.001 <0.01 <0.02 NM <0.005 NM NM NM 0.003 <0.01ECG907 5/18/2009 6.88 2580 16 111.77 1670 313 71 64 6.7 238 576 NM 228 NM NM NM 0.008 0.120 <0.001 <0.01 <0.02 NM <0.005 NM NM NM 0.003 <0.01ECG907 12/3/2009 7.33 2650 12 103.31 1640 314 74 68 7.1 267 554 NM 230 NM NM NM <0.005 0.110 <0.001 <0.01 <0.02 NM <0.005 NM NM NM 0.003 <0.01ECG907 6/10/2010 7.09 2420 13.0 113.92 1820 292 67 61 6.5 270 574 NM 169 NM NM NM 0.013 0.046 <0.001 <0.01 <0.02 NM <0.005 NM NM NM 0.079 0.012ECG907 11/11/2010 7.13 2480 12.5 114.94 1700 315 71 64 6.6 276 579 NM 232 NM NM NM <0.005 0.11 <0.001 <0.01 <0.02 NM <0.005 NM NM NM 0.003 <0.01ECG916 5/26/2009 7.97 1202 17 38.25 670 52 36 135 6.3 205 147 NM 187 NM NM NM <0.005 0.015 <0.001 <0.01 <0.02 NM <0.005 NM NM NM 0.218 <0.01ECG916 12/15/2009 7.98 1123 11 39.17 668 44 36 138 6.1 198 148 NM 185 NM NM NM <0.005 0.016 <0.001 <0.01 <0.02 NM <0.005 NM NM NM <0.002 <0.01ECG916 5/25/2010 8.46 1142 17.0 40.52 720 50 35 129 7.9 195 150 NM 184 NM NM NM 0.005 0.014 <0.001 <0.01 <0.02 NM <0.005 NM NM NM <0.002 <0.01ECG916 11/19/2010 7.87 1163 14.0 40.16 694 51 36 129 5.9 197 152 NM 193 NM NM NM <0.005 0.016 <0.001 <0.01 <0.02 NM <0.005 NM NM NM <0.002 <0.01ECG917 1/7/2009 7.14 1798 12 130.53 1180 216 52 86 4.8 156 437 NM 190 NM NM <0.02 <0.005 0.130 <0.001 <0.01 <0.02 <0.02 <0.005 <0.01 NM <0.03 0.002 <0.01ECG917 4/8/2009 7.15 1921 13 130.70 1290 196 50 83 4.5 139 421 NM 191 NM NM <0.02 <0.005 0.130 <0.001 <0.01 <0.02 <0.02 <0.005 <0.01 NM <0.03 0.003 <0.01ECG917 7/10/2009 7.11 1937 15 131.90 1230 212 52 87 5.3 137 428 NM 187 NM NM <0.02 <0.005 0.127 <0.001 <0.01 <0.02 <0.02 <0.005 <0.01 NM <0.03 <0.002 <0.01ECG917 10/28/2009 7.08 1818 12 132.24 1180 201 51 86 5.1 35 164 NM 195 NM NM <0.02 <0.005 0.127 <0.001 <0.01 <0.02 <0.02 <0.005 <0.01 NM <0.03 0.002 <0.01ECG917 2/2/2010 7.00 1964 13 132.85 1150 202 51 88 4.6 135 428 NM 194 NM NM <0.02 <0.005 0.13 <0.001 <0.01 <0.02 <0.02 <0.005 <0.01 NM <0.03 0.002 <0.01ECG917 4/6/2010 6.94 1837 12 133.38 1200 197 48 78 4.4 135 438 NM 194 NM NM <0.02 <0.005 0.12 <0.001 <0.01 <0.02 <0.02 <0.005 <0.01 NM <0.03 0.002 <0.01ECG917 7/6/2010 7.06 1883 16.0 133.75 1130 197 51 84 4.6 125 428 NM 199 NM NM <0.02 <0.005 0.123 <0.001 <0.01 <0.02 <0.02 <0.005 <0.01 NM <0.03 0.002 <0.01ECG917 10/14/2010 7.06 1911 16.0 134.28 1180 202 52 89 4.7 131 458 NM 198 NM NM <0.02 <0.005 0.133 <0.001 <0.01 <0.02 <0.02 <0.005 <0.01 NM <0.03 0.002 <0.01ECG922 5/22/2009 7.22 1608 15 115.33 1010 166 52 46 2.9 96 361 NM 180 NM NM <0.02 <0.005 0.061 <0.001 <0.01 <0.02 <0.02 <0.005 <0.01 NM <0.03 <0.002 <0.01ECG922 3/26/2010 7.41 1630 12 117.06 1060 166 53 47 3.3 94 362 NM 178 NM NM <0.02 <0.005 0.062 <0.001 <0.01 <0.02 <0.02 <0.005 <0.01 NM <0.03 <0.002 <0.01ECG923 5/18/2009 7.23 1670 15 109.91 902 120 19 165 3.8 88 335 NM 215 NM NM NM 0.012 0.140 <0.001 <0.01 <0.02 NM <0.005 NM NM NM <0.002 <0.01ECG923 12/3/2009 7.62 1700 12 104.92 896 114 18 172 4.0 99 314 NM 226 NM NM NM 0.006 0.130 <0.001 <0.01 <0.02 NM <0.005 NM NM NM 0.002 <0.01ECG923 5/25/2010 7.48 1603 15.0 109.61 930 116 17 168 5.0 90 303 NM 220 NM NM NM 0.006 0.13 <0.001 <0.01 <0.02 NM <0.005 NM NM NM 0.002 <0.01ECG923 11/23/2010 7.46 1613 12.0 103.10 884 116 18 167 3.8 95 333 NM 232 NM NM NM 0.006 0.132 <0.001 <0.01 <0.02 NM <0.005 NM NM NM 0.002 <0.01ECG924 1/14/2009 6.45 5260 13 33.38 4560 648 346 267 13.0 2420 542 NM 431 NM NM NM <0.005 0.029 0.002 <0.01 <0.02 NM <0.005 NM NM NM <0.002 0.073ECG924 4/3/2009 6.76 5480 11 32.90 4640 600 328 271 13.0 2380 522 NM 428 NM NM NM <0.005 0.027 0.002 <0.01 <0.02 NM <0.005 NM NM NM <0.002 0.085ECG924 7/9/2009 6.55 5380 15 31.20 4640 623 334 266 14.0 2280 552 NM 415 NM NM NM <0.005 0.027 0.002 <0.01 <0.02 NM <0.005 NM NM NM 0.002 0.072ECG924 10/28/2009 6.65 4900 11 32.13 4500 628 341 270 15.0 2300 582 NM 437 NM NM NM 0.008 0.028 0.002 <0.01 <0.02 NM <0.005 NM NM NM <0.002 0.088ECG924 1/28/2010 6.70 5340 12 33.95 4530 603 327 264 13 2500 551 NM 426 NM NM NM 0.005 0.028 0.002 <0.01 <0.02 NM <0.005 NM NM NM <0.002 0.078ECG924 4/13/2010 6.57 5420 13.5 32.65 4590 622 332 264 14 2370 540 NM 423 NM NM NM 0.005 0.028 0.002 <0.01 <0.02 NM <0.005 NM NM NM <0.002 0.074ECG924 7/22/2010 6.49 4730 16.0 31.47 4580 603 315 253 13 2250 513 NM 213 NM NM NM 0.006 0.028 0.002 <0.01 <0.02 NM <0.005 NM NM NM <0.002 0.081ECG924 11/9/2010 6.33 5240 11.5 32.69 4520 607 322 271 14 2270 548 NM 435 NM NM NM 0.012 0.03 0.002 <0.01 <0.02 NM <0.005 NM NM NM <0.002 0.085ECG925 1/7/2009 6.82 3220 13 36.00 2500 451 113 200 5.6 940 610 NM 331 NM NM NM 0.006 0.030 <0.001 <0.01 <0.02 NM <0.005 NM NM NM 0.003 <0.01ECG925 4/3/2009 6.92 3550 12 35.11 2520 426 105 192 5.5 831 588 NM 335 NM NM NM <0.005 0.030 <0.001 <0.01 <0.02 NM <0.005 NM NM NM 0.004 <0.01ECG925 7/9/2009 6.74 3960 15 33.66 2830 506 125 215 6.5 991 651 NM 353 NM NM NM <0.005 0.033 <0.001 <0.01 <0.02 NM <0.005 NM NM NM 0.004 <0.01ECG925 10/28/2009 6.81 3430 11 36.38 2510 465 118 200 7.1 881 652 NM 335 NM NM NM 0.006 0.031 <0.001 <0.01 <0.02 NM <0.005 NM NM NM 0.003 <0.01ECG925 1/28/2010 6.83 3550 13 35.67 2450 428 102 182 5.2 862 605 NM 332 NM NM NM <0.005 0.03 <0.001 <0.01 <0.02 NM <0.005 NM NM NM 0.004 <0.01ECG925 4/7/2010 6.46 3240 13 35.22 2420 431 106 184 5.8 806 629 NM 327 NM NM NM <0.005 0.03 <0.001 <0.01 <0.02 NM <0.005 NM NM NM 0.004 <0.01ECG925 7/22/2010 6.65 3390 16.0 35.81 2770 465 118 185 5.4 923 582 NM 319 NM NM NM 0.006 0.033 <0.001 <0.01 <0.02 NM <0.005 NM NM NM 0.004 0.01ECG925 11/9/2010 6.55 3410 12.0 37.11 2430 434 104 188 5.9 803 578 NM 328 NM NM NM 0.012 0.032 <0.001 <0.01 <0.02 NM <0.005 NM NM NM 0.004 <0.01ECG931 2/24/2009 6.93 7630 14 51.35 5260 930 208 323 15.0 552 2230 NM 209 NM NM NM <0.005 0.092 <0.001 <0.01 <0.02 NM <0.005 NM NM NM 0.010 <0.01ECG931 8/14/2009 6.70 7460 16 50.78 5310 851 199 326 15.0 507 2310 NM 206 NM NM NM <0.005 0.085 <0.001 <0.01 <0.02 NM <0.005 NM NM NM 0.012 <0.01ECG931 2/16/2010 6.72 7810 14 51.55 4690 907 208 338 15 487 2310 NM 206 NM NM NM 0.007 0.088 <0.001 <0.01 <0.02 NM <0.005 NM NM NM <0.002 <0.01ECG931 8/5/2010 6.88 7480 15.0 51.34 4540 899 207 322 15 486 2330 NM 209 NM NM NM 0.006 0.086 <0.001 <0.01 0.128 NM <0.005 NM NM NM 0.011 0.098ECG932 1/7/2009 7.07 1061 13 85.55 646 120 52 30 3.2 159 135 NM 249 NM NM NM <0.005 0.031 <0.001 <0.01 <0.02 NM <0.005 NM NM NM <0.002 <0.01ECG932 8/13/2009 7.36 1114 18 83.85 666 115 50 32 3.3 147 133 NM 247 NM NM NM <0.005 0.030 <0.001 <0.01 <0.02 NM <0.005 NM NM NM NM <0.01ECG932 2/16/2010 7.92 1153 13 85.90 604 111 50 32 3.1 147 136 NM 253 NM NM NM <0.005 0.031 <0.001 <0.01 <0.02 NM <0.005 NM NM NM <0.002 <0.01ECG932 4/7/2010 6.95 1081 15 86.08 660 115 51 31 3.1 135 138 NM 255 NM NM NM <0.005 0.029 <0.001 <0.01 <0.02 NM <0.005 NM NM NM <0.002 <0.01ECG932 11/11/2010 7.01 1063 11.0 86.28 654 116 48 29 3.0 145 139 NM 251 NM NM NM <0.005 0.032 <0.001 <0.01 <0.02 NM <0.005 NM NM NM <0.002 <0.01ECG933 6/10/2010 6.25 2080 14.0 122.10 1640 246 71 89 4.1 813 173 NM 151 NM NM NM <0.005 NM 0.054 <0.01 <0.02 NM <0.005 NM NM NM 0.003 4.68
NM = Not Measured
South Facilities Groundwater2010 Remedial Progress Report Brown highlights are 2010 extraction wells and blue highlights are 2010 compliance monitoring wells
April 2011A-6

Kennecott Utah Copper | Environmental Restoration Group
pH Cond Temp DTW TDS Ca-T Mg-T Na-T K-T SO4 Cl-T F Alk Ag Acidity Al-D As-D Ba-D Cd-D Cr-D Cu-D Fe-D Pb-D Mn-D Hg-T Ni-D Se-D Zn-Dsu uS/cm C Feet mg/l mg/l mg/l mg/l mg/l mg/l mg/l mg/l mg/l as CaCO3 mg/l mg/l as CaCO3 mg/l mg/l mg/l mg/l mg/l mg/l mg/l mg/l mg/l mg/l mg/l mg/l mg/lWELL DATE
ECG934 5/19/2009 6.94 1385 15 116.81 870 158 54 55 3.2 328 97 NM 288 NM NM NM <0.005 0.034 <0.001 <0.01 <0.02 NM <0.005 NM NM NM 0.013 0.019ECG934 11/25/2009 7.07 1483 12 119.90 868 153 52 53 3.3 320 99 NM 291 NM NM NM 0.005 0.032 <0.001 <0.01 <0.02 NM <0.005 NM NM NM <0.002 0.011ECG934 5/26/2010 6.91 1353 14.0 117.6 960 160 55 56 3.2 306 98 NM 286 NM NM NM <0.005 0.033 <0.001 <0.01 <0.02 NM <0.005 NM NM NM <0.002 0.011ECG934 10/19/2010 7.00 1343 12.0 120.20 872 153 52 52 3.2 296 112 NM 305 NM NM NM <0.005 0.034 <0.001 <0.01 <0.02 NM <0.005 NM NM NM NM 0.014ECG935 5/8/2009 6.80 3400 12 52.85 2740 411 174 183 6.1 1420 226 NM 391 NM NM NM <0.005 0.023 <0.001 <0.01 <0.02 NM <0.005 NM NM NM 0.004 <0.01ECG935 12/2/2009 7.16 3770 15 53.23 2880 398 168 185 6.8 1460 207 NM 394 NM NM NM <0.005 0.023 <0.001 <0.01 <0.02 NM <0.005 NM NM NM 0.003 <0.01ECG935 5/28/2010 6.91 3630 14.5 52.91 2910 412 183 196 6.6 1450 227 NM 387 NM NM NM <0.005 0.025 <0.001 <0.01 0.025 NM <0.005 NM NM NM 0.003 0.051ECG935 10/19/2010 6.78 3490 14.5 53.02 2980 438 187 184 7.0 1520 239 NM 387 NM NM NM <0.005 0.023 <0.001 <0.01 <0.02 NM <0.005 NM NM NM NM <0.01ECG936 5/8/2009 6.43 4380 13 47.80 4000 564 278 205 5.2 2330 259 NM 310 NM NM NM 0.013 0.011 <0.001 <0.01 <0.02 NM <0.005 NM NM NM 0.003 0.019ECG936 12/2/2009 6.92 5020 9 42.68 4010 548 267 216 6.0 2280 260 NM 312 NM NM NM 0.014 0.012 <0.001 <0.01 <0.02 NM <0.005 NM NM NM <0.002 0.016ECG936 5/28/2010 6.73 4430 12.5 47.90 4060 552 280 218 5.7 2260 265 NM 322 NM NM NM 0.014 0.013 <0.001 <0.01 <0.02 NM <0.005 NM NM NM <0.002 0.052ECG936 10/19/2010 6.61 4360 12.0 47.80 3970 555 272 206 5.8 2330 320 NM 314 NM NM NM 0.012 0.011 <0.001 <0.01 <0.02 NM <0.005 NM NM NM NM 0.021ECG937 5/19/2009 6.84 1666 17 242.15 1050 195 47 81 2.8 400 172 NM 269 NM NM NM <0.005 0.020 <0.001 <0.01 <0.02 NM <0.005 NM NM NM <0.002 0.014ECG937 10/28/2009 7.08 1719 12 243.00 1050 195 48 85 3.1 392 187 NM 266 NM NM NM <0.005 0.020 <0.001 <0.01 <0.02 NM <0.005 NM NM NM <0.002 0.013ECG937 5/26/2010 6.92 1617 14.0 243.08 1110 197 50 87 3.2 344 174 NM 263 NM NM NM <0.005 0.02 <0.001 <0.01 <0.02 NM <0.005 NM NM NM <0.002 0.012ECG937 10/15/2010 6.70 1625 15.0 243.54 1000 194 48 86 2.7 384 195 NM 267 NM NM NM <0.005 0.02 <0.001 <0.01 <0.02 NM <0.005 NM NM NM NM 0.014ECG938 5/19/2009 7.00 1302 15 214.30 784 132 48 71 2.3 216 141 NM 301 NM NM NM 0.010 0.026 <0.001 <0.01 <0.02 NM <0.005 NM NM NM <0.002 0.018ECG938 10/28/2009 7.16 1366 10 215.80 792 139 48 74 2.6 211 145 NM 303 NM NM NM 0.009 0.025 <0.001 <0.01 <0.02 NM <0.005 NM NM NM <0.002 <0.01ECG938 5/26/2010 7.06 1297 14.0 214.6 840 136 49 72 2.7 195 137 NM 294 NM NM NM 0.009 0.025 <0.001 <0.01 <0.02 NM <0.005 NM NM NM <0.002 <0.01ECG938 10/15/2010 7.13 1279 14.0 215.68 728 131 48 74 2.4 214 150 NM 330 NM NM NM 0.011 0.025 <0.001 <0.01 <0.02 NM <0.005 NM NM NM NM <0.01EPG1165A 7/22/2009 7.04 1278 18 244.04 772 158 48 46 2.5 176 206 0.1 194 NM NM NM <0.005 0.073 <0.001 <0.01 <0.02 <0.02 <0.005 0.220 NM <0.03 0.003 0.035
EPG1165A 7/6/2010 7.25 1292 16.0 253.98 828 151 46 42 2.6 166 200 0.1 196 NM NM NM <0.005 0.05 <0.001 <0.01 <0.02 <0.02 <0.005 <0.01 NM <0.03 0.003 <0.01EPG2780B 8/27/2009 7.50 763 18 180.18 408 51 29 48 3.8 56 117 NM 151 NM NM <0.02 <0.005 NM <0.001 <0.01 <0.02 <0.02 <0.005 <0.01 NM <0.03 0.004 <0.01EPG2780B 11/22/2010 7.58 748 15.0 180.75 442 54 30 48 3.5 55 119 NM 156 NM NM <0.02 0.009 NM <0.001 0.01 <0.02 <0.02 <0.005 <0.01 <0.0002 <0.03 <0.002 <0.01EPG2781A 11/23/2009 6.21 4870 14 209.22 4370 603 401 148 6.9 2510 359 NM 549 NM NM 0.20 <0.005 NM 0.020 <0.01 <0.02 <0.02 <0.005 7.610 NM 0.350 0.006 0.770EPG2781A 12/17/2010 6.22 4730 12.0 208.70 4590 596 385 146 6.9 2270 360 NM 547 NM NM 0.178 <0.005 NM 0.02 <0.01 0.022 <0.02 <0.005 6.73 <0.0002 0.321 0.006 0.792EPG2781B 11/23/2009 6.25 6270 14 209.00 6200 530 861 130 6.3 3760 243 NM 959 NM NM <0.02 <0.005 NM <0.001 <0.01 <0.02 <0.02 <0.005 0.215 NM 0.058 0.002 0.031EPG2781B 12/17/2010 6.37 6030 12.0 208.57 6480 525 786 120 8.4 3440 238 NM 970 NM NM <0.02 <0.005 NM <0.001 <0.01 0.026 <0.02 <0.005 0.231 0.001 0.068 <0.002 0.038EPG2785A 9/2/2009 6.53 4930 17 204.32 5120 624 514 152 8.2 2990 155 NM 749 NM NM NM <0.005 0.017 0.002 <0.01 <0.02 NM <0.005 NM NM NM 0.005 0.032EPG2785A 11/19/2010 6.39 4920 13.0 201.81 5020 614 474 130 7.9 2650 164 NM 760 NM NM NM <0.005 0.019 <0.001 <0.01 <0.02 NM <0.005 NM NM NM 0.004 0.018EPG2785B 9/2/2009 6.39 4640 17 196.82 4360 710 292 202 7.4 2360 334 NM 522 NM NM NM <0.005 0.021 <0.001 <0.01 <0.02 NM <0.005 NM NM NM 0.008 0.011EPG2785B 11/19/2010 6.43 4710 13.0 194.46 4350 696 274 174 6.9 2190 362 NM 504 NM NM NM <0.005 0.023 <0.001 <0.01 <0.02 NM <0.005 NM NM NM 0.007 <0.01HMG1122A 11/16/2009 7.22 1411 12 330.08 996 195 55 45 3.1 350 145 NM 250 NM NM <0.02 <0.005 NM <0.001 <0.01 <0.02 <0.02 <0.005 <0.01 NM <0.03 0.002 <0.01HMG1122A 9/24/2010 6.98 1524 16.0 335.31 1130 186 51 42 3.3 346 166 NM 287 NM NM NM <0.005 NM <0.001 <0.001 <0.001 <0.02 <0.005 <0.01 NM <0.03 0.003 <0.01HMG1123A 6/30/2009 7.27 2330 18 329.90 1770 312 81 74 5.4 667 294 0.2 216 NM NM NM <0.005 0.026 <0.001 <0.01 <0.02 <0.02 <0.005 <0.01 NM <0.03 0.006 <0.01
HMG1123A 12/23/2009 7.38 2210 12 334.68 1560 316 85 74 6.0 669 290 0.2 223 NM NM NM <0.005 0.028 <0.001 <0.01 <0.02 <0.02 <0.005 <0.01 NM <0.03 0.006 <0.01HMG1123A 6/15/2010 7.33 2330 16.0 336.8 1570 301 78 74 5.2 665 295 0.2 216 NM NM NM <0.005 0.027 <0.001 <0.001 <0.001 <0.02 <0.005 <0.01 NM <0.03 0.005 <0.01HMG1123A 7/9/2010 7.08 2050 16.0 337.35 1560 309 85 74 5.5 642 296 0.1 210 NM NM NM <0.005 0.027 <0.001 <0.01 <0.02 <0.02 <0.005 <0.01 NM <0.03 0.006 <0.01HMG1126B 5/8/2009 7.35 1417 13 324.07 1000 198 52 47 3.0 397 130 0.1 269 NM NM NM <0.005 0.052 <0.001 <0.01 <0.02 <0.005 <0.01 NM <0.03 NM <0.01HMG1126B 7/31/2009 7.07 1242 17 325.92 1010 209 55 49 3.0 390 123 0.1 271 NM NM NM <0.005 0.046 <0.001 <0.01 <0.02 <0.02 <0.005 <0.01 NM <0.03 0.002 <0.01HMG1126B 5/18/2010 7.35 1397 14.0 331.55 1040 196 53 51 3.4 386 121 0.1 272 NM NM NM <0.005 0.047 <0.001 <0.01 <0.02 <0.02 <0.005 <0.01 NM <0.03 0.002 <0.01HMG1126B 7/12/2010 7.32 1423 16.0 332.00 986 203 55 51 3.1 384 125 0.1 267 NM NM NM <0.005 0.047 <0.001 <0.01 <0.02 <0.02 <0.005 <0.01 NM <0.03 0.002 <0.01HMG1134B 11/16/2009 7.71 445 12 205.37 230 30 12 38 2.5 22 53 NM 116 NM NM NM <0.005 NM <0.001 NM <0.02 NM <0.005 NM NM NM <0.002 <0.01HMG1134B 9/3/2010 7.63 472 16.0 205.20 240 29 11 41 2.6 23 56 0.2 115 NM NM NM <0.005 0.088 <0.001 NM <0.02 NM <0.005 NM NM <0.03 <0.002 <0.01HMG1134C 9/3/2010 8.03 472 16.0 203.41 230 16 3.5 63 2.0 24 52 NM 95 NM NM NM 0.007 0.083 <0.001 NM <0.02 NM <0.005 NM NM <0.03 <0.002 <0.01K72 2/27/2009 7.27 1723 13 215.00 1050 170 50 67 5.9 141 359 0.2 183 NM NM NM NM 63.000 NM NM NM 0.09 NM NM NM NM 0.002 NMK72 4/8/2009 7.07 1705 13 215.00 1210 173 50 68 5.4 142 374 0.2 181 NM NM NM <0.005 0.062 <0.001 <0.01 <0.02 0.11 <0.005 <0.01 NM <0.03 0.002 <0.01K72 7/14/2009 6.88 1705 14 215.00 972 176 51 72 6.0 135 339 0.2 174 NM NM NM <0.005 0.064 <0.001 <0.01 <0.02 0.15 <0.005 <0.01 NM <0.03 <0.002 <0.01K72 11/20/2009 7.02 1789 13 215.00 1100 181 51 71 5.7 128 377 NM 169 NM NM NM <0.005 0.065 <0.001 <0.01 <0.02 0.29 <0.005 0.019 NM <0.03 0.002 0.010K72 2/16/2010 7.23 1762 13 144.40 936 167 49 71 5.5 138 364 0.2 177 NM NM NM 0.005 0.066 <0.001 <0.01 <0.02 0.58 <0.005 0.011 NM <0.03 0.002 <0.01K72 4/15/2010 7.14 1734 14 215.00 1160 172 50 68 6.3 138 323 0.2 184 NM NM NM <0.005 0.063 <0.001 <0.01 <0.02 NM <0.005 <0.01 NM <0.03 0.002 <0.01K72 7/28/2010 7.00 1694 14.0 215.00 1390 175 50 70 5.8 134 354 0.2 178 NM NM NM <0.005 0.064 <0.001 <0.01 <0.02 0.137 <0.005 0.018 NM <0.03 0.002 <0.01K72 10/22/2010 7.13 1705 13.0 215.00 982 171 49 67 5.6 132 371 0.2 181 NM NM NM <0.005 0.066 <0.001 <0.01 <0.02 0.155 <0.005 <0.01 NM <0.03 0.003 <0.01K83 1/23/2009 3.85 10670 16 NA 18100 413 1840 99 2.8 21000 184 NM <5 NM 5720 NM 0.013 <0.01 0.290 0.023 374.000 0.50 0.110 129.000 NM 7.880 0.022 91.200K83 2/20/2009 3.83 11780 15 NA 18000 389 1750 99 4.7 21900 197 NM <5 NM 5430 NM 0.025 <0.01 0.300 0.028 325.000 0.45 0.110 103.000 NM 7.260 0.021 72.400K83 3/20/2009 4.01 11710 17 NA 17400 383 1760 103 4.5 13500 193 NM <5 NM 5980 NM 0.020 <0.01 0.290 0.029 317.000 0.46 0.120 105.000 NM 6.910 0.027 70.100K83 4/28/2009 4.29 11010 15 NA 17600 401 1760 95 0.7 13600 197 NM <5 NM 5082 NM 0.019 <0.01 0.280 0.025 331.000 0.63 0.120 117.000 NM 6.720 0.019 80.900K83 5/22/2009 3.63 10830 18 NA 18100 407 1830 104 2.8 13300 193 NM <5 NM 5040 NM 0.018 <0.01 0.290 0.029 302.000 0.52 0.120 95.500 NM 6.330 0.021 62.400K83 6/24/2009 4.61 10760 17 NA 16800 368 1590 100 3.1 12800 219 NM <5 NM 4770 NM 0.016 <0.01 0.300 0.019 308.000 0.75 0.069 106.000 NM 6.530 0.019 68.500K83 8/4/2009 3.73 12610 16 30.54 19400 468 1900 117 3.0 14300 282 NM <5 NM 4290 891.00 0.018 <0.01 0.350 0.040 348.000 1.02 0.058 117.000 NM 6.620 0.027 75.000K83 9/22/2009 3.69 12580 15 37.10 20000 456 2040 103 0.9 14100 224 NM <5 NM 5480 NM 0.020 <0.01 0.380 0.023 373.000 1.15 0.058 125.000 NM 7.010 NM 85.500K83 10/21/2009 3.62 10130 14 48.28 18400 379 1750 94 4.2 13200 205 NM <5 NM 6470 NM 0.014 <0.01 0.310 0.037 389.000 0.68 0.081 126.000 NM 5.170 0.020 86.500K83 11/24/2009 3.80 8990 13 NA 17000 361 1660 94 5.1 17000 191 NM <5 NM 4720 NM 0.011 <0.01 0.290 0.025 317.000 0.58 0.110 103.000 NM 5.980 0.022 67.500K83 1/13/2010 3.72 7960 11 NA 16000 349 1510 84 <0.5 11500 167 NM <5 NM 5640 NM 0.013 <0.01 0.28 0.028 278 0.5 0.15 94.3 NM 5.52 0.023 61K83 2/18/2010 3.88 9660 11 NA 14900 326 1380 80 2.9 11700 180 NM <5 NM 3670 NM 0.011 <0.01 0.25 0.032 260 1.04 0.13 89.8 NM 5.16 0.02 55.9K83 4/22/2010 3.57 9920 10.0 NA 14100 336 1370 91 4.8 8330 176 NM <5 NM 3120 NM 0.012 <0.01 0.23 0.018 269 0.47 0.13 95.2 NM 5.3 0.018 59.7K84 5/14/2009 3.81 7120 15 57.53 8910 437 959 147 2.7 6010 235 NM <5 NM NM NM 0.008 <0.01 0.200 <0.01 40.900 NM 0.007 NM NM NM NM 31.800LRG910 6/4/2009 6.96 2180 16 80.96 1560 283 77 81 3.4 812 168 NM 165 NM NM <0.02 <0.005 0.019 <0.001 <0.01 <0.02 NM <0.005 <0.01 NM <0.03 0.004 <0.01LRG910 12/18/2009 6.96 2050 13 79.83 1510 287 82 80 4.1 806 170 NM 168 NM NM <0.02 <0.005 0.020 <0.001 <0.01 <0.02 <0.02 <0.005 <0.01 NM <0.03 0.004 <0.01LRG910 5/20/2010 7.01 2100 14.0 79.35 1540 263 77 84 4.5 724 165 NM 165 NM NM <0.02 <0.005 0.021 <0.001 <0.01 <0.02 <0.02 <0.005 <0.01 <0.0002 <0.03 0.004 <0.01LRG910 5/25/2010 7.05 2060 15.0 79.67 1590 275 79 79 4.6 765 173 NM 165 NM NM <0.02 <0.005 0.02 <0.001 <0.01 <0.02 <0.02 <0.005 <0.01 <0.0002 <0.03 0.004 <0.01LRG910 11/12/2010 6.96 2020 13.0 80.75 1550 272 75 75 3.3 763 179 NM 167 NM NM <0.02 <0.005 0.021 <0.001 <0.01 <0.02 <0.02 <0.005 <0.01 <0.0002 <0.03 0.003 <0.01LRG911 1/6/2009 7.23 2690 10 126.57 2480 460 130 63 10.0 1570 169 NM 187 NM NM <0.02 <0.005 0.023 <0.001 <0.01 <0.02 <0.02 <0.005 <0.01 NM <0.03 0.004 0.032LRG911 8/11/2009 7.11 2960 19 126.78 2470 461 131 66 10.0 1570 160 NM 186 NM NM 0.04 0.005 0.022 <0.001 <0.01 <0.02 <0.02 <0.005 0.012 NM <0.03 NM 0.028LRG911 3/26/2010 7.03 2950 14 126.4 2520 478 137 67 11 1510 158 NM 187 NM NM <0.02 <0.005 0.023 <0.001 <0.01 <0.02 <0.02 <0.005 <0.01 0.0023 <0.03 0.004 0.018LRG911 4/6/2010 6.69 2890 11 123.72 2550 478 134 62 11 1500 178 NM 193 NM NM <0.02 <0.005 0.024 <0.001 <0.01 <0.02 <0.02 <0.005 <0.01 <0.0002 <0.03 0.005 0.011LRG911 11/12/2010 7.12 2900 13.0 124.30 2580 480 139 65 11 1470 176 NM 196 NM NM <0.02 <0.005 0.026 <0.001 <0.01 <0.02 <0.02 <0.005 <0.01 <0.0002 <0.03 0.004 0.012LRG912 1/6/2009 3.66 5550 12 99.12 6460 429 612 158 7.9 4950 234 NM NM NM 1140 151.00 <0.005 <0.01 0.220 <0.01 41.680 0.09 <0.005 37.100 NM 2.550 0.013 23.200
NM = Not Measured
South Facilities Groundwater2010 Remedial Progress Report Brown highlights are 2010 extraction wells and blue highlights are 2010 compliance monitoring wells
April 2011A-7

Kennecott Utah Copper | Environmental Restoration Group
pH Cond Temp DTW TDS Ca-T Mg-T Na-T K-T SO4 Cl-T F Alk Ag Acidity Al-D As-D Ba-D Cd-D Cr-D Cu-D Fe-D Pb-D Mn-D Hg-T Ni-D Se-D Zn-Dsu uS/cm C Feet mg/l mg/l mg/l mg/l mg/l mg/l mg/l mg/l mg/l as CaCO3 mg/l mg/l as CaCO3 mg/l mg/l mg/l mg/l mg/l mg/l mg/l mg/l mg/l mg/l mg/l mg/l mg/lWELL DATE
LRG912 4/22/2009 3.77 5740 15 99.04 6530 439 612 158 7.8 5000 227 NM <5 NM 1130 152.00 0.006 <0.01 0.220 <0.01 40.960 0.12 <0.005 36.800 NM 2.350 0.011 22.800LRG912 4/6/2010 3.62 6190 13 99.08 6900 423 647 151 8.4 4530 208 NM <5 NM 924 202 0.005 <0.01 0.24 <0.01 55.4 0.12 <0.005 45.8 0.0003 2.83 0.01 29.1LTG1139 2/24/2009 7.25 903 21 110.30 534 69 24 44 10.0 33 153 0.3 160 0 NM <0.02 0.007 0.140 <0.001 <0.01 <0.02 <0.02 <0.005 0.017 NM <0.03 <0.002 <0.01LTG1139 4/30/2009 7.21 887 18 110.30 548 78 27 42 7.9 34 164 0.3 159 <0.001 NM <0.02 <0.005 0.140 <0.001 <0.01 <0.02 <0.02 <0.005 <0.01 NM <0.03 <0.002 <0.01LTG1139 8/13/2009 7.35 8.75 20 110.30 570 74 26 42 8.9 35 159 0.3 161 <0.001 NM <0.02 <0.005 0.140 <0.001 <0.01 <0.02 <0.02 <0.005 <0.01 NM <0.03 NM <0.01LTG1139 11/19/2009 7.54 946 19 110.30 504 75 27 47 10.0 32 159 0.3 162 <0.001 NM <0.02 <0.005 0.139 <0.001 <0.01 <0.02 NM <0.005 <0.01 NM <0.03 <0.002 <0.01LTG1139 1/26/2010 7.24 947 20.5 110.30 526 68 24 53 13 33 161 0.3 161 <0.001 NM <0.02 <0.005 0.14 <0.001 <0.01 <0.02 0.055 <0.005 <0.01 <0.0002 <0.03 <0.002 <0.01LTG1139 6/18/2010 7.49 891 20.0 211.8 534 71 25 43 9.9 31 160 0.3 158 <0.001 NM <0.02 <0.005 0.136 <0.001 <0.01 <0.02 <0.02 <0.005 <0.01 <0.0002 <0.03 <0.002 <0.01LTG1139 7/15/2010 7.30 907 19.0 110.30 550 75 27 50 9.4 34 169 0.3 157 0.001 NM <0.02 <0.005 0.135 <0.001 <0.01 <0.02 0.037 <0.005 0.01 <0.0002 <0.03 <0.002 <0.01LTG1139 11/19/2010 7.22 921 17.0 110.30 560 82 27 43 8.7 35 172 0.3 165 <0.001 NM <0.02 <0.005 0.151 <0.001 <0.01 <0.02 0.044 <0.005 0.014 <0.0002 <0.03 <0.002 <0.01LTG1140A 6/29/2009 7.32 2380 20 214.19 1660 279 87 87 7.7 654 297 0.2 196 NM NM NM <0.005 NM <0.001 <0.01 <0.02 <0.02 <0.005 <0.01 NM <0.03 0.003 0.011LTG1140A 8/5/2010 7.24 2190 19.5 225.72 1480 272 83 79 7.2 579 295 0.3 173 NM NM NM <0.005 NM <0.001 <0.01 0.313 <0.02 <0.005 0.264 NM 0.038 <0.002 0.297LTG1140B 7/1/2009 7.49 880 18 226.25 520 78 28 36 6.2 37 147 0.3 159 NM NM NM <0.005 NM <0.001 <0.01 <0.02 <0.02 <0.005 <0.01 NM <0.03 <0.002 <0.01LTG1140B 8/5/2010 7.36 909 19.0 226.45 534 83 31 39 6.5 37 160 0.3 161 NM NM NM <0.005 NM <0.001 <0.01 <0.02 <0.02 <0.005 <0.01 NM <0.03 <0.002 <0.01LTG1147 2/3/2009 NM NM NM NA NM 304 83 97 6.0 646 301 0.2 240 NM NM NM NM 0.026 <0.001 NM <0.02 0.05 <0.005 <0.01 NM NM NM 0.035LTG1147 2/17/2009 7.46 2280 15 312.88 1600 285 76 90 5.3 605 320 0.2 238 NM NM <0.02 <0.005 0.022 <0.001 <0.01 <0.02 <0.02 <0.005 <0.01 NM <0.03 0.003 0.022LTG1147 4/17/2009 7.41 2330 15 312.88 1550 279 75 88 5.3 589 309 0.2 229 NM NM <0.02 <0.005 0.023 <0.001 <0.01 <0.02 <0.02 <0.005 0.028 NM <0.03 0.003 0.020LTG1147 7/24/2009 7.12 2040 19 312.88 1500 277 71 84 5.3 592 285 0.2 228 NM NM <0.02 <0.005 0.022 <0.001 <0.01 <0.02 <0.02 <0.005 <0.01 NM <0.03 0.004 <0.01LTG1147 11/19/2009 7.51 2270 14 312.88 1430 265 69 84 5.6 552 282 0.2 238 NM NM <0.02 <0.005 0.023 <0.001 <0.01 <0.02 NM <0.005 <0.01 NM <0.03 0.003 <0.01LTG1147 1/28/2010 7.60 2150 13.5 312.88 1450 250 65 80 5.2 547 275 0.2 230 NM NM <0.02 0.005 0.024 <0.001 <0.01 0.023 <0.02 <0.005 <0.01 0.0005 <0.03 0.004 0.021LTG1147 4/22/2010 7.40 2130 15.0 447.3 1380 259 68 80 5.2 503 269 0.2 232 NM NM <0.02 <0.005 0.024 <0.001 <0.01 <0.02 <0.02 <0.005 <0.01 0.0023 <0.03 0.004 <0.01LTG1147 7/15/2010 7.14 2030 17.0 312.88 1360 247 65 83 5.0 507 273 0.2 220 NM NM 0.037 <0.005 0.022 <0.001 <0.01 <0.02 <0.02 <0.005 0.024 <0.0002 <0.03 0.004 0.016LTG1147 11/19/2010 6.98 2070 14.0 312.88 1450 261 68 75 5.1 528 287 0.2 232 NM NM <0.02 <0.005 0.025 <0.001 <0.01 <0.02 <0.02 <0.005 <0.01 <0.0002 <0.03 0.003 <0.01LTG1167B 11/5/2010 6.96 1756 14.0 215.34 1170 218 68 74 3.8 428 189 NM 276 NM NM NM <0.005 NM <0.001 NM <0.02 NM <0.005 NM NM NM 0.003 <0.01LTG1191 1/14/2009 6.49 4990 13 24.95 4470 566 369 243 7.7 2400 428 NM 300 NM NM NM <0.005 NM 0.047 <0.01 <0.02 Trace <0.005 0.019 NM 0.087 0.005 6.460LTG1191 4/3/2009 6.53 4630 12 24.21 4510 531 349 244 7.6 2460 442 NM 300 NM NM NM <0.005 NM 0.047 <0.01 <0.02 <0.02 <0.005 <0.01 NM 0.088 0.006 6.510LTG1191 8/13/2009 6.62 5310 15 23.00 4560 556 359 259 7.9 2400 487 NM 295 NM NM NM 0.006 NM 0.048 <0.01 0.022 <0.02 <0.005 <0.01 NM 0.083 NM 6.130LTG1191 10/7/2009 6.61 4630 14 24.36 4540 547 352 242 9.3 2550 480 NM 296 NM NM NM <0.005 NM 0.046 <0.01 0.021 NM <0.005 0.016 NM 0.080 0.007 NMLTG1191 3/30/2010 7.35 899 19 20.59 522 78 27 37 7.2 35 152 NM 156 NM NM NM <0.005 NM <0.001 <0.01 <0.02 0.039 <0.005 <0.01 <0.0002 <0.03 <0.002 <0.01LTG1191 4/13/2010 6.71 5070 14 24.57 4470 555 352 234 8.9 2460 438 NM 287 NM NM NM <0.005 NM 0.043 <0.01 <0.02 <0.02 <0.005 <0.01 <0.0002 0.078 0.006 5.19LTG1191 7/20/2010 6.58 4580 15.0 24.53 4370 557 351 247 7.8 2290 444 NM 292 NM NM NM <0.005 NM 0.039 <0.01 <0.02 <0.02 <0.005 <0.01 <0.0002 0.075 0.006 5.57LTG1191 10/1/2010 6.58 4880 16.0 24.98 4450 564 349 229 7.5 2380 477 NM 301 NM NM NM <0.005 NM 0.044 <0.01 0.023 <0.02 <0.005 <0.01 <0.0002 0.075 0.006 5.65P190B 6/8/2009 6.89 1391 16 325.30 942 181 54 46 3.2 251 233 0.1 207 NM NM 0.09 <0.005 NM <0.001 <0.01 NM 0.25 <0.005 0.014 NM <0.03 0.004 0.570P190B 6/2/2010 7.28 1527 15.0 325.33 954 163 51 44 2.7 227 227 0.1 213 NM NM <0.02 0.006 NM 0.002 <0.01 NM 0.37 <0.005 0.011 <0.0002 <0.03 0.003 0.63P192B 7/21/2009 7.73 688 18 298.30 400 44 18 77 1.8 87 77 0.3 152 NM NM NM <0.005 0.039 <0.001 <0.01 <0.02 NM <0.005 NM NM NM <0.002 0.190P192B 7/8/2010 7.72 647 17.0 297.65 372 38 15 67 2.2 60 81 0.2 153 NM NM NM <0.005 0.054 <0.001 <0.01 <0.02 NM <0.005 NM <0.0002 <0.03 0.003 0.141P193B 6/2/2010 7.58 611 16.0 295.81 356 44 20 41 2.4 40 73 NM 162 NM NM NM <0.005 0.08 0.001 <0.01 <0.02 NM <0.005 NM <0.0002 NM <0.002 0.16P194A 7/19/2010 7.48 748 17.0 235.54 438 73 23 43 2.7 90 82 NM 151 NM NM NM <0.005 0.068 <0.001 <0.01 <0.02 NM <0.005 NM NM NM <0.002 0.181P194B 7/10/2009 7.55 590 20 235.97 366 53 19 40 2.3 41 76 0.2 166 NM NM NM <0.005 0.084 <0.001 <0.01 <0.02 <0.02 <0.005 <0.01 NM <0.03 <0.002 0.069P194B 6/9/2010 7.64 622 17.0 235.47 360 48 18 37 2.6 37 73 0.2 165 NM NM NM <0.005 0.085 <0.001 0.01 <0.02 <0.02 <0.005 <0.01 <0.0002 <0.03 <0.002 0.059P194B 7/7/2010 7.66 606 17.0 236.10 324 54 20 41 2.5 38 74 0.2 159 NM NM NM <0.005 0.082 <0.001 0.012 <0.02 <0.02 <0.005 <0.01 <0.0002 <0.03 <0.002 0.078P197B 10/26/2009 7.15 2410 13 439.50 1920 349 98 68 4.3 903 286 NM 205 NM NM <0.02 <0.005 NM <0.001 <0.01 <0.02 <0.02 <0.005 <0.01 NM <0.03 0.005 <0.01P197B 11/16/2010 7.08 2340 13.0 438.04 1830 333 97 71 3.8 825 297 NM 202 NM NM <0.02 <0.005 NM <0.001 <0.01 <0.02 <0.02 <0.005 <0.01 <0.0002 <0.03 0.004 <0.01P208B 6/22/2009 5.59 5020 14 371.23 5840 438 736 98 7.7 4040 183 NM 73 NM NM 1.40 0.010 NM 0.230 0.012 0.083 <0.02 <0.005 35.800 NM 1.870 0.006 11.500P208B 6/14/2010 5.63 5360 14.0 346.18 5720 451 732 97 7.4 4100 183 NM 82 NM NM 1.17 0.006 NM 0.216 <0.01 0.074 <0.02 <0.005 33.2 0.0013 2.08 0.006 10.6P209B 6/11/2009 6.83 3430 15 438.94 3560 655 189 107 5.0 2080 213 NM 228 NM NM <0.02 <0.005 NM <0.001 0.011 <0.02 <0.02 <0.005 <0.01 NM <0.03 0.003 0.015P209B 12/13/2010 6.87 3490 14.0 446.95 3390 610 175 98 5.0 1870 230 NM 240 NM NM <0.02 <0.005 NM <0.001 <0.01 <0.02 <0.02 <0.005 <0.01 <0.0002 0.039 0.005 0.01P220 6/19/2009 7.20 2420 15 76.50 1630 165 54 303 6.4 569 265 NM 374 NM NM NM 0.013 0.039 <0.001 <0.01 <0.02 NM <0.005 NM NM NM <0.002 <0.01P220 11/20/2009 7.17 2500 14 77.72 1670 192 57 296 6.4 558 261 NM 396 NM NM NM 0.011 0.040 <0.001 <0.01 <0.02 NM <0.005 NM NM NM <0.002 <0.01P220 5/25/2010 7.17 2530 15.0 79.48 1750 173 55 304 7.4 582 271 NM 394 NM NM NM 0.013 0.036 <0.001 <0.01 <0.02 NM <0.005 NM NM NM <0.002 <0.01P220 10/21/2010 7.06 2580 15.0 80.27 1730 197 60 280 6.1 615 265 NM 400 NM NM NM 0.013 0.042 <0.001 <0.01 <0.02 NM <0.005 NM NM NM NM <0.01P225 1/15/2009 7.06 1370 12 62.38 896 152 41 69 4.5 236 196 NM 217 NM NM NM 0.007 0.130 <0.001 <0.01 <0.02 NM <0.005 NM NM NM <0.002 <0.01P225 8/20/2009 6.89 1446 15 64.54 836 152 43 71 4.7 232 193 NM 210 NM NM NM <0.005 0.122 <0.001 <0.01 <0.02 NM <0.005 NM NM NM <0.002 <0.01P225 6/15/2010 6.87 1480 15.0 66.0 872 148 41 73 4.1 236 203 NM 218 NM NM NM 0.005 0.117 <0.001 <0.01 <0.02 NM <0.005 NM NM NM <0.002 <0.01P225 11/5/2010 7.03 1411 14.0 67.08 880 151 42 69 4.8 225 210 NM 221 NM NM NM 0.006 0.128 <0.001 <0.01 <0.02 NM <0.005 NM NM NM <0.002 <0.01P228 1/30/2009 6.63 6370 12 27.23 6660 460 909 158 5.9 4260 311 NM 132 NM NM NM <0.005 0.010 0.020 <0.01 0.096 NM <0.005 NM NM NM <0.002 1.480P228 4/9/2009 6.32 6460 12 24.30 6800 443 900 154 5.8 4550 324 NM 136 NM NM NM <0.005 <0.01 0.021 <0.01 0.148 NM <0.005 NM NM NM <0.002 1.760P228 8/6/2009 6.00 6210 16 23.22 6530 452 873 146 5.8 4640 246 NM 110 NM NM NM <0.005 <0.01 0.019 <0.01 0.120 NM <0.005 NM NM NM NM 1.510P228 10/20/2009 6.28 6010 13 25.52 6520 462 898 149 4.7 4250 259 NM 131 NM NM NM <0.005 <0.01 <0.001 <0.01 <0.02 NM <0.005 NM NM NM <0.002 <0.01P228 1/12/2010 6.32 6130 13 25.50 6570 443 869 150 6.0 4640 255 NM 130 NM NM NM <0.005 <0.01 0.019 <0.01 0.127 NM <0.005 NM NM NM <0.002 1.49P228 4/20/2010 6.00 6260 14.5 26.70 6580 450 885 153 6.8 4340 251 NM 126 NM NM NM <0.005 <0.01 0.017 <0.01 0.11 NM <0.005 NM NM NM <0.002 1.47P228 7/16/2010 5.96 6010 16.0 23.03 6330 427 850 143 5.2 4350 244 NM 117 NM NM NM <0.005 0.01 0.017 <0.01 0.113 NM 0.012 NM NM NM <0.002 1.38P228 10/21/2010 6.00 6040 13.0 26.14 6360 443 848 144 5.8 4790 237 NM 118 NM NM NM <0.005 0.01 0.017 <0.01 0.131 NM <0.005 NM NM NM NM 1.54P241B 6/16/2009 3.70 7450 16 446.60 9570 442 1070 68 8.5 7010 112 NM <5 NM NM 258.00 0.014 NM 0.390 0.011 11.030 3.13 0.008 129.000 NM 4.530 0.013 24.100P241B 9/8/2010 3.62 6320 16.0 454.03 7450 455 848 62 5.8 4550 120 NM <5 NM NM 162 0.008 NM 0.316 <0.01 7.37 1.976 0.006 85.5 0.0026 2.96 0.012 15.58P241C 2/5/2009 7.24 2520 13 348.57 2120 394 105 64 5.4 1060 285 NM 175 NM NM <0.02 <0.005 NM <0.001 <0.01 <0.02 <0.02 <0.005 <0.01 NM <0.03 0.005 <0.01P241C 4/8/2009 7.21 2430 14 350.04 2200 387 106 66 5.5 1030 279 NM 176 NM NM <0.02 <0.005 NM <0.001 <0.01 <0.02 <0.02 <0.005 <0.01 NM <0.03 0.005 <0.01P241C 8/18/2009 7.21 2700 16 352.85 2120 406 109 66 5.8 1090 285 NM 181 NM NM <0.02 <0.005 NM <0.001 <0.01 <0.02 <0.02 <0.005 <0.01 NM <0.03 0.005 <0.01P241C 10/7/2009 7.25 2500 14 353.73 2180 394 106 65 6.1 1090 264 NM 180 NM NM <0.02 <0.005 NM <0.001 <0.01 <0.02 <0.005 <0.01 NM <0.03 0.005 <0.01P241C 1/13/2010 7.20 2640 13 355.14 2100 410 110 67 5.6 1100 254 NM 182 NM NM <0.02 <0.005 NM <0.001 0.01 <0.02 <0.02 <0.005 <0.01 0.0005 <0.03 0.005 <0.01P241C 5/27/2010 7.18 2670 15.0 357.14 2220 416 116 71 6.2 1100 227 NM 178 NM NM <0.02 <0.005 NM <0.001 <0.01 <0.02 <0.02 <0.005 <0.01 <0.0002 <0.03 0.005 <0.01P241C 8/20/2010 7.20 2660 17.0 360.00 2140 396 107 66 5.6 1120 266 NM 190 NM NM <0.02 <0.005 NM <0.001 <0.01 <0.02 <0.02 <0.005 <0.01 <0.0002 <0.03 0.006 <0.01P241C 11/23/2010 7.33 2650 12.0 362.44 2220 414 109 65 5.6 1080 284 NM 180 NM NM <0.02 <0.005 NM <0.001 <0.01 <0.02 <0.02 <0.005 <0.01 <0.0002 <0.03 0.005 <0.01P242 5/14/2009 4.33 5080 15 173.03 5020 535 447 206 9.7 2340 537 NM <5 NM NM NM 0.007 NM 0.280 NM 11.120 NM <0.005 NM NM NM 0.012 NMP242 9/24/2010 4.25 5190 15.0 174.65 4900 515 395 180 9.4 2520 525 NM <5 NM NM NM NM NM NM NM 11.92 NM NM NM 0.0002 NM NM NMP244A 2/19/2009 4.55 10620 10 46.53 8790 718 853 522 9.4 3120 2850 NM <5 NM 254 40.00 0.013 NM 0.190 0.048 2.240 0.20 0.009 40.600 NM 1.750 0.006 4.100P244A 4/3/2009 4.30 11090 6 45.43 9060 700 841 588 8.9 2880 2920 NM <5 NM 277 39.60 <0.005 NM 0.200 0.030 2.160 0.15 0.006 43.900 NM 1.680 0.007 4.490P244A 7/24/2009 4.09 14600 29 44.20 11200 1350 636 1240 10.0 2730 4380 NM <5 NM 287 48.00 0.010 NM 0.140 0.010 2.040 0.09 0.016 29.100 NM 1.160 0.008 3.660
NM = Not Measured
South Facilities Groundwater2010 Remedial Progress Report Brown highlights are 2010 extraction wells and blue highlights are 2010 compliance monitoring wells
April 2011A-8

Kennecott Utah Copper | Environmental Restoration Group
pH Cond Temp DTW TDS Ca-T Mg-T Na-T K-T SO4 Cl-T F Alk Ag Acidity Al-D As-D Ba-D Cd-D Cr-D Cu-D Fe-D Pb-D Mn-D Hg-T Ni-D Se-D Zn-Dsu uS/cm C Feet mg/l mg/l mg/l mg/l mg/l mg/l mg/l mg/l mg/l as CaCO3 mg/l mg/l as CaCO3 mg/l mg/l mg/l mg/l mg/l mg/l mg/l mg/l mg/l mg/l mg/l mg/l mg/lWELL DATE
P244A 10/30/2009 4.54 14500 9 49.65 19500 2680 551 2950 34.0 1390 9890 NM <5 NM 477 77.00 <0.005 NM 0.220 <0.01 2.290 0.05 0.020 21.800 NM 0.970 0.011 3.920P244A 1/29/2010 4.52 15730 7 45.16 11400 1280 639 1420 18 2300 4600 NM <5 NM 295 48 0.006 NM 0.13 0.011 1.78 0.063 0.012 28.8 0.0003 0.98 0.008 3.95P244A 4/8/2010 4.33 12840 12 45.65 8770 1040 798 870 15 2280 3500 NM <5 NM 229 40 0.008 NM 0.16 0.037 1.98 0.17 0.015 33.6 0.0002 1.28 0.007 4.26P244A 7/27/2010 4.22 19100 22.0 44.72 13600 1220 611 1258 12 7500 5540 NM <5 NM 209 45.3 <0.005 NM 0.13 0.015 1.73 0.083 0.012 26.3 0.0013 1.04 0.01 3.35P244A 11/5/2010 3.90 16830 16.0 45.45 12500 1210 593 1509 16 1580 5570 NM <5 NM 222 45.7 0.012 NM 0.159 0.037 1.75 0.16 0.016 26.6 0.0004 1.04 0.008 3.29P244B 1/13/2009 6.80 7650 13 50.23 6580 1130 277 384 9.0 2120 1620 NM 535 NM NM <0.02 <0.005 0.025 0.001 <0.01 <0.02 <0.02 <0.005 0.032 NM 0.045 0.005 0.012P244B 2/19/2009 7.12 8210 14 50.30 6690 1050 279 434 9.4 2200 1810 NM 499 NM NM <0.02 <0.005 0.024 <0.001 <0.01 <0.02 <0.02 <0.005 0.023 NM 0.053 0.004 0.023P244B 3/10/2009 6.78 7390 12 50.27 6020 1040 277 437 7.1 1960 1670 NM 511 NM NM <0.02 <0.005 0.022 <0.001 <0.01 <0.02 <0.02 <0.005 0.020 NM 0.054 0.005 0.025P244B 4/2/2009 6.90 7740 13 50.13 6210 983 262 383 7.6 1950 1660 NM 520 NM NM <0.02 <0.005 0.022 <0.001 <0.01 <0.02 <0.02 <0.005 0.023 NM 0.045 NM 0.016P244B 5/1/2009 6.99 7660 15 48.27 5770 992 259 380 8.9 1980 1670 NM 520 NM NM <0.02 <0.005 0.022 <0.001 0.012 <0.02 <0.02 <0.005 0.020 NM 0.054 0.005 0.022P244B 7/24/2009 6.65 7370 16 47.82 6160 1080 262 388 8.4 2080 1470 NM 504 NM NM <0.02 <0.005 0.022 <0.001 <0.01 <0.02 <0.02 <0.005 0.026 NM <0.03 0.005 0.016P244B 10/30/2009 6.78 7550 13 48.50 5990 1020 265 368 12.0 2040 1560 NM 505 NM NM <0.02 <0.005 0.022 0.001 <0.01 <0.02 <0.02 <0.005 0.029 NM 0.039 0.004 0.015P244B 1/29/2010 6.87 7860 13 49.30 5970 1020 268 379 10 2010 1650 NM 518 NM NM <0.02 <0.005 0.022 0.001 <0.01 <0.02 <0.02 <0.005 0.035 NM 0.053 0.004 0.016P244B 4/8/2010 6.78 7750 13.5 49.75 5920 1030 267 362 7.6 1980 1780 NM 509 NM NM <0.02 <0.005 0.022 0.001 <0.01 <0.02 <0.02 <0.005 0.03 NM 0.05 0.005 0.015P244B 7/27/2010 6.65 7400 16.0 48.59 6000 1050 277 383 11 1890 1590 NM 489 NM NM <0.02 <0.005 0.021 0.001 <0.01 <0.02 <0.02 <0.005 0.022 NM 0.056 0.004 0.014P244B 11/4/2010 6.60 7720 15.0 49.57 6440 987 275 434 9.3 1920 1820 NM 480 NM NM <0.02 <0.005 0.024 <0.001 <0.01 <0.02 <0.02 <0.005 0.018 NM 0.044 0.004 0.021P244C 1/13/2009 7.08 5120 13 54.22 4250 791 183 196 10.0 1400 890 NM 457 NM NM <0.02 <0.005 0.052 <0.001 <0.01 <0.02 <0.02 <0.005 <0.01 NM <0.03 0.003 0.011P244C 2/19/2009 7.10 5390 13 54.20 4340 793 181 174 9.8 1410 980 NM 478 NM NM <0.02 <0.005 0.054 <0.001 <0.01 <0.02 <0.02 <0.005 <0.01 NM 0.038 0.003 <0.01P244C 3/10/2009 6.93 5000 11 54.07 3990 779 177 177 9.4 1390 982 NM 469 NM NM <0.02 <0.005 0.049 <0.001 <0.01 <0.02 <0.02 <0.005 <0.01 NM 0.036 0.004 <0.01P244C 4/2/2009 7.02 5300 13 53.88 4130 720 169 167 9.5 1330 1010 NM 480 NM NM <0.02 <0.005 0.050 <0.001 <0.01 <0.02 <0.02 <0.005 <0.01 NM 0.033 NM <0.01P244C 5/1/2009 6.97 5260 14 52.29 3950 780 175 170 9.6 1290 957 NM 481 NM NM <0.02 <0.005 0.051 <0.001 <0.01 <0.02 <0.02 <0.005 <0.01 NM 0.041 0.003 <0.01P244C 7/24/2009 6.88 4770 17 51.07 3450 714 161 173 8.9 1200 876 NM 419 NM NM <0.02 <0.005 0.047 <0.001 <0.01 <0.02 <0.02 <0.005 <0.01 NM <0.03 0.004 <0.01P244C 11/12/2009 6.89 5220 13 52.52 4000 777 164 162 9.3 1190 967 NM 446 NM NM <0.02 <0.005 0.048 <0.001 <0.01 <0.02 <0.02 <0.005 <0.01 NM 0.033 0.003 <0.01P244C 2/2/2010 6.93 5330 12 53.55 3920 811 191 188 11 1340 990 NM 468 NM NM <0.02 <0.005 0.05 <0.001 <0.01 <0.02 <0.02 <0.005 <0.01 NM 0.042 0.004 <0.01P244C 4/8/2010 7.00 5460 14 53.75 4190 805 186 168 9.4 1430 1090 NM 484 NM NM <0.02 <0.005 0.047 <0.001 <0.01 <0.02 <0.02 <0.005 <0.01 NM 0.037 0.004 <0.01P244C 7/27/2010 6.92 5180 16.5 52.18 3890 813 184 181 11 1250 937 NM 437 NM NM <0.02 <0.005 0.045 <0.001 <0.01 <0.02 <0.02 <0.005 <0.01 NM 0.041 0.004 <0.01P244C 11/4/2010 6.88 5460 14.0 53.51 4160 811 183 187 13 1380 1070 NM 463 NM NM <0.02 <0.005 0.048 <0.001 <0.01 <0.02 <0.02 <0.005 <0.01 NM 0.038 0.004 <0.01P248A 1/26/2009 4.30 2190 11 88.48 1650 200 135 57 4.2 923 234 5.3 <5 NM 135 15.20 <0.005 0.010 0.026 <0.01 5.910 0.03 0.015 4.730 NM 0.354 0.004 3.110P248A 5/28/2009 4.16 2080 16 88.35 1820 210 141 57 4.1 921 212 2.1 <5 NM 163 16.10 <0.005 <0.01 0.024 <0.01 6.090 0.03 0.014 4.440 NM 0.310 0.002 3.000P248A 8/4/2009 4.01 2130 15 88.70 1570 203 136 56 4.0 945 226 4.5 <5 NM 159 16.20 <0.005 <0.01 0.024 <0.01 6.230 <0.02 0.015 4.410 NM 0.310 0.003 3.140P248A 12/14/2009 4.42 2140 12 87.95 1600 195 136 63 4.1 965 227 6.7 <5 NM 150 17.65 <0.005 <0.01 0.023 <0.01 6.540 <0.02 0.014 4.870 NM 0.310 0.003 3.350P248A 3/22/2010 4.15 2220 13 88.20 1610 192 129 60 3.8 838 234 NM <5 NM 92 15.13 <0.005 <0.01 0.023 <0.01 5.86 <0.02 0.014 4.37 <0.0002 0.3 0.019 3.15P248A 6/14/2010 4.32 2160 14.0 88.17 1620 194 128 59 4.0 789 235 3.6 <5 NM 80 14.3 <0.005 <0.01 0.025 <0.01 5.81 <0.02 0.014 4.18 0.0004 0.302 0.003 3.04P248A 9/21/2010 4.41 2140 15.0 89.15 1720 195 128 54 3.9 804 236 5.0 <5 NM 110 14.55 <0.005 <0.01 0.024 <0.01 5.77 <0.02 0.014 4.58 0.115 0.317 0.003 2.89P248A 11/16/2010 4.36 2080 13.0 89.24 1460 194 127 55 4.1 722 223 3.1 NM NM 143 14.96 <0.005 <0.01 0.024 <0.01 5.86 <0.02 0.014 4.46 <0.0002 0.306 <0.002 3.06P248B 1/26/2009 6.48 2980 10 88.88 2790 403 227 60 9.3 1800 123 NM 143 NM 151 0.56 <0.005 0.013 0.029 <0.01 0.800 0.03 <0.005 7.460 NM 0.346 0.002 2.690P248B 8/4/2009 6.59 2990 19 89.11 2720 398 229 64 9.0 1740 124 NM 161 NM 10 <0.02 <0.005 0.016 0.002 <0.01 0.120 <0.02 <0.005 0.027 NM <0.03 <0.002 0.150P248B 3/22/2010 6.51 3110 13 86.62 2810 398 230 63 8.7 1790 121 NM 142 NM <10 0.15 <0.005 0.012 0.025 <0.01 0.48 NM <0.005 NM <0.0002 0.3 <0.002 NMP248B 9/21/2010 6.60 2680 15.0 89.42 2590 373 200 57 8.3 1820 123 NM 182 NM <10 0.199 <0.005 0.014 0.021 <0.01 0.446 <0.02 <0.005 3.65 <0.0002 0.251 0.002 2.06P248C 1/26/2009 6.60 1328 11 85.08 910 153 61 35 3.5 417 136 NM 129 NM NM <0.02 <0.005 0.018 0.002 <0.01 0.150 <0.02 <0.005 0.031 NM <0.03 <0.002 0.170P248C 8/4/2009 6.43 1312 16 85.38 940 165 62 37 3.4 407 135 NM 162 NM NM NM NM NM NM NM NM NM NM NM NM NM NM NMP248C 3/22/2010 6.54 1343 13 85.21 878 150 61 36 2.8 398 132 NM 126 NM NM <0.02 <0.005 0.017 0.002 <0.01 0.127 <0.02 <0.005 0.029 <0.0002 <0.03 <0.002 0.157P248C 9/21/2010 6.32 1280 15.0 86.15 932 148 59 35 3.2 440 138 NM 135 NM NM 0.034 0.005 0.019 0.002 <0.01 0.126 <0.02 <0.005 0.024 <0.0002 <0.03 <0.002 0.241P258A 5/3/2010 7.11 3060 14.0 -9.08 2340 315 117 238 7.1 1050 365 NM 231 NM NM NM <0.005 NM <0.001 NM <0.02 NM <0.005 NM NM NM 0.02 <0.01P264 5/15/2009 5.90 4370 15 400.04 4990 411 588 73 5.5 3290 124 NM 85 NM NM 1.18 0.023 0.012 0.063 <0.01 <0.02 0.07 <0.005 91.700 NM NM NM 0.050P267B 12/3/2010 7.32 1732 12.0 216.20 1120 219 59 54 4.6 218 348 NM 240 NM NM NM <0.005 0.064 <0.001 <0.01 <0.02 NM <0.005 NM NM NM 0.004 <0.01P272 5/26/2009 7.58 3930 15 79.50 3470 637 166 193 12.0 1680 314 NM 460 NM NM NM <0.005 0.026 <0.001 <0.01 <0.02 NM <0.005 NM NM NM <0.002 <0.01P272 11/24/2009 6.59 4260 15 79.95 3490 590 157 189 13.0 1800 366 NM 506 NM NM NM 0.006 0.026 <0.001 <0.01 <0.02 NM <0.005 NM NM NM <0.002 <0.01P272 5/11/2010 6.57 4350 12.0 79.68 3670 622 169 201 13 1710 387 NM 452 NM NM NM <0.005 0.026 <0.001 <0.01 0.025 NM <0.005 NM NM NM <0.002 0.018P272 11/19/2010 7.45 4040 12.0 80.20 3600 638 172 196 13 1630 414 NM 463 NM NM NM <0.005 0.026 <0.001 <0.01 0.023 NM <0.005 NM NM NM <0.002 0.016P273 8/28/2009 6.98 3670 17 307.08 2890 570 173 81 5.4 1120 745 NM 144 NM NM <0.02 <0.005 0.021 <0.001 <0.01 <0.02 <0.02 <0.005 <0.01 NM <0.03 0.005 <0.01P273 8/11/2010 6.90 3490 16.0 305.52 2850 540 159 77 5.4 1180 742 NM 153 NM NM <0.02 <0.005 0.021 <0.001 <0.01 <0.02 <0.02 <0.005 <0.01 <0.0002 <0.03 0.006 <0.01P277 7/22/2009 7.05 2640 20 388.21 2410 415 125 85 3.5 1360 229 NM 186 NM NM <0.02 <0.005 0.014 <0.001 <0.01 <0.02 <0.02 <0.005 <0.01 NM <0.03 0.004 <0.01P277 7/15/2010 7.00 2460 17.5 390.55 1940 339 101 81 3.8 974 246 NM 174 NM NM <0.02 <0.005 0.014 <0.001 <0.01 <0.02 <0.02 <0.005 <0.01 <0.0002 <0.03 0.004 <0.01SRG946 1/5/2009 3.54 13030 11 124.18 24600 407 2630 196 5.0 18600 171 NM <5 NM 6370 953.00 0.015 NM 0.460 0.060 63.300 47.10 <0.005 211.000 NM 11.500 0.032 72.300SRG946 4/20/2009 3.49 14140 15 123.43 23700 435 2650 215 5.4 17700 185 NM <5 NM 6230 900.00 0.033 NM 0.500 0.069 62.700 36.70 <0.005 209.000 NM 11.160 0.027 67.700SRG946 4/5/2010 3.36 14610 13 123.64 24000 414 2610 216 6.0 17900 221 NM <5 NM 4510 940 0.016 NM 0.58 0.058 74.6 30.9 <0.005 247 0.0003 11.8 0.017 78.9W185 11/20/2009 7.03 1009 11 135.00 652 119 30 43 6.1 96 178 NM 198 NM NM NM <0.005 NM <0.001 NM 0.069 NM <0.005 NM NM NM 0.002 0.070W185 12/6/2010 7.23 933 9.0 135.00 564 96 25 47 7.1 55 140 NM 229 NM NM NM <0.005 NM <0.001 NM <0.02 NM <0.005 NM NM NM <0.002 0.012W189 7/21/2009 6.77 846 20 200.00 478 88 33 42 2.4 93 122 0.1 164 NM NM NM <0.005 0.056 <0.001 NM <0.02 NM <0.005 NM NM NM <0.002 0.130W189 7/7/2010 7.48 863 18.0 200.0 494 82 32 40 3.0 81 131 0.1 159 NM NM NM 0.006 0.056 <0.001 NM <0.02 NM <0.005 NM <0.0002 <0.03 <0.002 0.065W22 3/25/2009 7.43 1344 12 31.00 896 164 46 42 4.4 232 169 NM 283 0 NM <0.02 <0.005 NM <0.001 <0.01 <0.02 <0.02 <0.005 <0.01 NM <0.03 0.003 0.011W22 6/25/2009 6.93 1272 15 31.00 938 166 49 49 4.7 214 167 NM 284 <0.001 NM <0.02 <0.005 NM <0.001 <0.01 <0.02 <0.02 <0.005 <0.01 NM <0.03 <0.002 <0.01W22 9/28/2009 6.90 1319 14 31.00 854 153 45 44 4.6 218 162 NM 284 <0.001 NM <0.02 0.005 NM <0.001 <0.01 <0.02 <0.02 <0.005 <0.01 NM <0.03 0.002 <0.01W22 12/23/2009 7.31 1372 13 31.00 840 165 50 47 5.3 231 167 NM 289 <0.001 NM <0.02 0.005 NM <0.001 <0.01 <0.02 <0.02 <0.005 <0.01 NM <0.03 0.003 <0.01W22 3/29/2010 7.14 1341 13 31.00 902 166 49 47 4.8 240 168 NM 281 <0.001 NM <0.02 0.006 NM <0.001 <0.01 0.032 <0.02 <0.005 <0.01 NM <0.03 0.002 0.022W22 6/18/2010 7.19 1349 14.0 31.00 910 166 49 46 4.3 225 172 NM 295 <0.001 NM <0.02 <0.005 NM <0.001 <0.01 <0.02 <0.02 <0.005 <0.01 NM <0.03 0.002 <0.01W22 9/27/2010 7.06 1418 15.0 31.00 886 163 48 51 5.3 209 167 NM 284 0.003 NM <0.02 <0.005 NM <0.001 <0.01 <0.02 <0.02 <0.005 <0.01 NM <0.03 0.002 <0.01W22 12/20/2010 7.04 1330 13.0 31.00 906 159 46 45 5.1 205 175 NM 289 <0.001 NM <0.02 <0.005 NM <0.001 <0.01 <0.02 <0.02 <0.005 <0.01 NM <0.03 0.002 <0.01W27 4/6/2010 6.88 2780 15 NA 1750 282 66 166 6.7 211 661 NM 293 NM NM NM 0.006 NM <0.001 NM <0.02 NM <0.005 NM NM NM 0.009 0.27W31 3/18/2010 7.41 917 13 140.00 540 88 35 30 7.2 30 166 NM 189 <0.001 NM NM 0.008 0.16 <0.001 <0.01 <0.02 NM <0.005 NM <0.0002 NM 0.002 <0.01W31 6/7/2010 7.56 882 16.0 0.00 604 83 30 28 7.0 30 153 NM 188 NM NM NM 0.007 0.183 <0.001 <0.01 <0.02 NM <0.005 NM <0.0002 NM 0.002 <0.01W31 8/30/2010 7.43 744 15.0 140.00 564 84 32 30 8.4 30 153 NM 192 0.006 NM NM 0.009 0.19 <0.001 <0.01 <0.02 NM <0.005 NM <0.0002 NM <0.002 <0.01W31 10/28/2010 7.53 933 12 140 606 93 34 29 7.3 31 170 NM 193 0.001 NM NM 0.017 0.197 <0.001 <0.01 <0.02 NM <0.005 NM <0.0002 NM <0.002 <0.01W363 6/30/2009 6.97 1024 17 184.00 602 96 36 44 3.0 114 160 NM 161 NM NM <0.02 0.010 NM <0.001 <0.01 <0.02 <0.02 <0.005 <0.01 NM <0.03 0.003 0.014W363 9/24/2009 7.24 930 13 184.00 564 90 33 40 3.1 112 161 NM 155 NM NM <0.02 0.011 NM <0.001 <0.01 <0.02 <0.02 <0.005 <0.01 NM <0.03 0.002 0.017W363 6/3/2010 7.24 810 17.4 94.7 664 92 33 40 2.6 110 173 NM 156 NM NM <0.02 0.007 NM <0.001 <0.01 <0.02 <0.02 <0.005 <0.01 <0.0002 <0.03 0.002 0.036W363 9/9/2010 7.01 1017 16.7 184.00 592 96 36 42 2.9 109 168 NM 161 NM NM <0.02 0.014 NM <0.001 <0.01 0.023 <0.02 <0.005 <0.01 <0.0002 <0.03 0.002 0.027W387 9/9/2010 6.57 1172 17.4 251.03 726 108 38 55 3.2 53 247 NM 157 NM NM <0.02 0.01 NM <0.001 <0.01 0.022 <0.02 <0.005 <0.01 <0.0002 <0.03 0.002 0.032
NM = Not Measured
South Facilities Groundwater2010 Remedial Progress Report Brown highlights are 2010 extraction wells and blue highlights are 2010 compliance monitoring wells
April 2011A-9

Kennecott Utah Copper | Environmental Restoration Group
pH Cond Temp DTW TDS Ca-T Mg-T Na-T K-T SO4 Cl-T F Alk Ag Acidity Al-D As-D Ba-D Cd-D Cr-D Cu-D Fe-D Pb-D Mn-D Hg-T Ni-D Se-D Zn-Dsu uS/cm C Feet mg/l mg/l mg/l mg/l mg/l mg/l mg/l mg/l mg/l as CaCO3 mg/l mg/l as CaCO3 mg/l mg/l mg/l mg/l mg/l mg/l mg/l mg/l mg/l mg/l mg/l mg/l mg/lWELL DATE
W408 9/18/2009 6.82 1221 21 220.00 836 157 47 48 4.6 235 175 NM 287 NM NM NM 0.011 NM <0.001 NM 0.025 NM <0.005 NM NM NM NM 0.036W408 12/20/2010 7.00 1293 7.0 220.00 892 159 46 44 4.8 207 175 NM 286 NM NM NM <0.005 NM <0.001 NM <0.02 NM <0.005 NM NM NM 0.002 0.173W41A 3/25/2009 6.98 1340 8 13.00 920 155 53 52 2.7 257 138 0.8 299 NM NM NM <0.005 NM <0.001 NM <0.02 NM <0.005 NM NM NM 0.003 0.086W41A 6/25/2009 6.42 1683 16 13.00 1250 177 67 113 3.7 264 297 0.3 298 NM NM NM <0.005 NM <0.001 NM <0.02 NM <0.005 NM NM NM 0.004 0.130W41A 9/28/2009 7.11 1271 21 13.00 854 133 50 65 3.2 249 125 0.2 295 NM NM NM <0.005 NM <0.001 NM <0.02 NM <0.005 NM NM NM 0.002 0.046W41A 12/23/2009 6.80 1185 6 13.00 750 123 51 63 3.2 223 104 0.3 318 NM NM NM <0.005 NM <0.001 NM <0.02 NM <0.005 NM NM NM 0.002 0.074W41A 3/29/2010 6.93 1209 8 13.00 802 128 50 55 3.0 237 113 0.2 292 NM NM NM <0.005 NM <0.001 NM 0.021 NM <0.005 NM NM NM 0.003 0.097W41A 6/18/2010 7.51 1087 14.0 13.00 684 112 30 46 9.2 79 186 0.7 209 NM NM NM <0.005 NM <0.001 NM <0.02 NM <0.005 NM NM NM 0.002 0.02W420 6/30/2009 7.15 1222 17 0.00 738 109 42 58 3.9 37 259 NM 151 NM NM NM 0.009 0.140 <0.001 <0.01 <0.02 NM <0.005 NM NM NM NM <0.01W420 9/24/2009 7.25 1120 13 0.00 686 101 39 50 3.9 37 265 NM 153 NM NM NM 0.010 0.150 <0.001 <0.01 <0.02 NM <0.005 NM NM NM 0.003 0.039WJG1154A 1/22/2009 7.27 1309 14 338.63 840 153 52 48 3.5 362 140 0.2 157 NM NM <0.02 0.008 0.025 <0.001 <0.01 <0.02 <0.02 <0.005 <0.01 NM <0.03 0.003 <0.01WJG1154A 4/3/2009 7.28 1267 14 335.37 880 143 46 45 3.3 313 143 0.2 156 NM NM <0.02 0.008 0.024 <0.001 <0.01 <0.02 <0.02 <0.005 <0.01 NM <0.03 0.003 <0.01
WJG1154A 7/28/2009 7.01 1244 18 341.31 848 145 48 46 3.0 292 144 0.2 150 NM NM <0.02 0.008 0.025 <0.001 <0.01 <0.02 <0.02 <0.005 <0.01 NM <0.03 0.003 <0.01WJG1154A 10/13/2009 7.55 1229 16 344.80 844 146 50 48 3.7 312 139 0.2 159 NM NM <0.02 0.009 0.024 <0.001 <0.01 <0.02 <0.02 <0.005 <0.01 NM <0.03 0.002 0.110WJG1154A 2/5/2010 7.21 1234 15 339.39 784 141 47 46 3.2 303 143 0.2 161 NM NM <0.02 0.008 0.025 <0.001 <0.01 <0.02 <0.02 <0.005 <0.01 NM <0.03 0.002 <0.01WJG1154A 4/13/2010 7.55 1183 16 333.81 776 133 43 42 3.2 294 128 0.2 156 NM NM <0.02 0.008 0.023 <0.001 <0.01 <0.02 <0.02 <0.005 <0.01 <0.0002 <0.03 0.002 <0.01WJG1154A 7/9/2010 7.30 1138 19.0 339.18 750 135 44 44 3.0 265 142 0.2 152 NM NM <0.02 0.008 0.033 <0.001 <0.01 <0.02 <0.02 <0.005 <0.01 <0.0002 <0.03 0.002 <0.01WJG1154A 11/22/2010 7.49 1157 15.0 344.98 800 131 44 46 3.2 277 134 0.2 161 NM NM <0.02 0.012 0.026 <0.001 <0.01 <0.02 <0.02 <0.005 0.011 <0.0002 <0.03 <0.002 <0.01WJG1154B 1/22/2009 7.41 1263 15 338.58 808 141 48 45 3.5 352 135 NM 149 NM NM NM <0.005 NM <0.001 NM <0.02 NM <0.005 NM NM NM 0.002 <0.01
WJG1154B 7/30/2009 7.19 1254 19 341.66 946 157 53 48 3.4 360 138 0.2 150 NM NM NM <0.005 0.062 <0.001 NM <0.02 NM <0.005 NM NM <0.03 0.003 <0.01WJG1154B 2/5/2010 7.40 1340 15 339.40 880 155 53 47 3.7 368 145 0.2 156 NM NM NM <0.005 0.067 <0.001 NM <0.02 NM <0.005 NM NM <0.03 0.003 <0.01WJG1154B 7/20/2010 7.32 1362 18.0 340.20 946 159 55 50 3.8 386 133 0.2 155 NM NM NM <0.005 0.063 <0.001 NM <0.02 NM <0.005 NM <0.0002 <0.03 0.002 0.022WJG1154C 1/20/2009 7.47 821 16 338.75 474 76 30 53 3.4 125 90 NM 179 NM NM <0.02 0.012 NM <0.001 <0.01 <0.02 <0.02 <0.005 <0.01 NM <0.03 0.002 <0.01WJG1154C 7/30/2009 7.28 745 19 342.34 474 71 27 48 2.9 102 90 NM 176 NM NM <0.02 0.011 NM <0.001 <0.01 <0.02 <0.02 <0.005 <0.01 NM <0.03 <0.002 <0.01WJG1154C 2/8/2010 7.48 817 16 339.20 478 71 28 51 3.1 104 94 NM 181 NM NM <0.02 0.013 NM <0.001 <0.01 <0.02 <0.02 <0.005 <0.01 NM <0.03 <0.002 <0.01WJG1154C 8/9/2010 7.42 762 19.0 344.77 460 67 28 51 3.3 90 81 NM 182 NM NM <0.02 0.012 NM <0.001 <0.01 <0.02 <0.02 <0.005 <0.01 <0.0002 <0.03 <0.002 <0.01WJG1169B 4/7/2009 7.17 2140 14 416.66 1600 271 80 78 3.7 507 390 0.1 173 NM NM <0.02 <0.005 0.026 <0.001 <0.01 <0.02 <0.02 <0.005 <0.01 NM <0.03 0.004 <0.01WJG1169B 7/29/2009 7.23 2190 16 16.50 1600 275 81 79 3.8 463 376 0.1 166 NM NM 0.03 0.006 0.026 <0.001 <0.01 <0.02 <0.02 <0.005 <0.01 NM <0.03 0.004 <0.01WJG1169B 7/9/2010 7.25 2120 17.0 421.73 1450 272 83 82 3.8 471 384 0.1 169 NM NM <0.02 0.005 0.024 <0.001 <0.01 <0.02 <0.02 <0.005 <0.01 <0.0002 <0.03 0.003 0.013WJG1170B 5/7/2009 7.43 1056 16 391.04 794 133 48 44 4.8 339 117 NM 146 NM NM <0.02 0.012 NM <0.001 <0.01 <0.02 NM <0.005 <0.01 NM <0.03 NM <0.01WJG1170B 6/21/2010 7.46 1168 17.0 391.30 842 133 47 43 4.6 337 121 NM 157 NM NM <0.02 0.01 NM <0.001 <0.01 <0.02 <0.02 <0.005 <0.01 <0.0002 <0.03 0.002 <0.01WJG1170B 9/7/2010 7.27 1254 16.0 401.00 870 150 53 46 5.0 388 121 NM 145 NM NM <0.02 0.011 NM <0.001 <0.01 <0.02 <0.02 <0.005 <0.01 <0.0002 <0.03 0.003 <0.01WJG1170C 9/7/2010 7.43 661 18.0 401.30 372 63 25 31 2.8 49 88 NM 158 NM NM <0.02 0.012 NM <0.001 <0.01 <0.02 <0.02 <0.005 <0.01 <0.0002 <0.03 <0.002 <0.01WJG1171A 7/20/2009 7.28 927 18 323.69 680 107 35 38 2.2 172 114 NM 151 NM NM <0.02 0.005 NM <0.001 <0.01 <0.02 <0.02 <0.005 <0.01 NM <0.03 <0.002 <0.01WJG1171A 2/9/2010 7.49 978 14 315.53 594 104 35 39 2.7 169 124 NM 154 NM NM <0.02 0.006 NM <0.001 <0.01 <0.02 <0.02 <0.005 <0.01 NM <0.03 0.002 <0.01WJG1171A 11/30/2010 7.55 988 14.0 323.48 658 101 34 38 2.8 169 120 NM 151 NM NM <0.02 0.006 NM <0.001 <0.01 <0.02 <0.02 <0.005 <0.01 <0.0002 <0.03 0.002 <0.01WJG1171B 3/25/2009 7.49 625 14 312.37 376 57 22 27 2.3 46 76 NM 160 NM NM <0.02 0.001 NM <0.001 <0.01 <0.02 NM <0.005 <0.01 NM <0.03 <0.002 <0.01
NM = Not Measured
South Facilities Groundwater2010 Remedial Progress Report Brown highlights are 2010 extraction wells and blue highlights are 2010 compliance monitoring wells
April 2011A-10

Kennecott Utah Copper Environmental Restoration Group
South Facilities Groundwater April 2011 2010 Remedial Progress Report
Appendix B
Groundwater Level Monitoring Data

Kennecott Utah Copper | Environmental Restoration Group
Well Sept 1996 April 2003 Sept 2003 April 2004 Sept 2004 April 2005 Sept 2005 April 2006 Sept 2006 April 2007 Sept 2007 Sept 2008 Sept 2009 Sept 2010ABC01 5248.52 5247.67 5246.12 5245.22 5244.5 5244.31 5244.44 5245.30 5245.40 5245.18 5244.50 5243.13 5242.30 5241.48ABC02 5154.91 5150.22 5149.94 BLOCKED BLOCKED BLOCKED BLOCKED BLOCKED BLOCKED BLOCKED BLOCKED BLOCKED 5141.92 5139.43ABC03 4525.27 4519.87 4519.23 4518.16 4517.67 4517.04 4516.67 ABANDONED ABANDONED ABANDONED ABANDONED ABANDONED ABANDONED ABANDONEDABC04 5147.90 5146.69 BLOCKED BLOCKED BLOCKED BLOCKED BLOCKED BLOCKED BLOCKED BLOCKED BLOCKED 5138.62 5137.95 5136.17ABC04A 5170.00 5153.68 BLOCKED BLOCKED BLOCKED BLOCKED BLOCKED BLOCKED BLOCKED BLOCKED BLOCKED BLOCKED BLOCKED BLOCKEDABC05 4734.26 NM 4702.51 4694.36 4687.92 4681.10 4676.73 4673.73 4670.48 4671.15 4687.92 4658.38* 4652.92 4647.06ABC06 5016.32 5041.58 5045.02 5035.31 5010.05 5026.24 5034.36 5028.81 5017.41 5022.52 5010.05 4992.78 4967.48 4960.87ABC07 5252.31 5250.12 5248.79 5247.95 5247.21 5247.21 5247.46 5248.97 5248.53 5248.11 5247.21 5246.09 5245.49 5244.96ABC08 4602.38 4590.58 4597.64 4590.38 4595.73 4589.81 4594.53 ABANDONED ABANDONED ABANDONED ABANDONED ABANDONED ABANDONED ABANDONEDB1G1120A 4830.22 4811.64 4809.02 4806.25 4805.52 4801.96 4799.65 4796.60 4794.77 4792.25 4805.52 4784.63 4787.69 4772.71B1G1120B 4831.46 NM 4810.32 NM 4806.6 NM 4802.44 NM 4796.97 NM 4806.60 4786.42 4780.23 4774.41B1G1120C 4832.13 NM 4810.83 NM 4807.25 NM 4802.29 NM 4796.47 NM 4807.25 4786.25 4780.24 4774.25B1G951 5177.92 5176.07 5175.75 5176.23 5174.98 5175.38 5175.76 5176.54 5176.42 5176.32 5174.98 5174.45 5174.33 5173.68B2G1157A 4621.07 4589.2 4581.33 4587.25 4582.16 4593.45 4581.24 4589.70 4574.63 4576.30 4582.16 4559.90 DRY DRYB2G1157B 4622.82 NM 4579.43 NM 4579.96 4593.77 4579.69 NM 4573.06 NM 4579.96 4561.76 4560.16 4557.64B2G1157C 4622.17 NM 4578.62 NM 4577.67 4593.81 4576.53 NM 4570.82 NM 4577.67 4558.22 4556.49 4553.05B2G1176A Not Drilled Yet 4704.75 4701.96 4694.05 4688.11 4680.45 4675.77 4672.95 4669.74 4669.39 4688.11 4658.72 4651.68 4647.17B2G1176B Not Drilled Yet NM 4702.55 NM 4688.61 NM 4676.21 NM 4670.16 NM 4688.61 4659.00 4651.94 4646.83B2G1176C Not Drilled Yet NM 4702.96 NM 4689.05 NM 4676.73 NM 4670.63 NM 4689.05 4658.62 4652.74 4647.63B2G1193 Not Drilled Yet NM NM NM 4569.09 NM 4561.20 NM NM NM NM NM 4539.47 4527.38B2G1194A Not Drilled Yet 4593.7 NM 4591.05 4583.64 4591.82 4586.89 4588.99 4579.44 4582.17 4583.64 4568.85 4566.88 4565.11B2G1194B Not Drilled Yet NM NM NM 4583.58 NM 4586.96 NM 4579.35 NM 4583.58 4568.71 4566.71 4564.87B3G1197A Not Drilled Yet 4599.66 NM 4595.29 4589.76 4592.71 4592.19 4592.28 4585.27 4582.17 4589.76 4575.30 4572.75 4571.19B3G1197B Not Drilled Yet NM NM NM 4591.46 NM 4592.33 NM 4585.22 NM 4591.46 4575.27 4572.69 4571.17B3G1197C Not Drilled Yet NM NM NM 4592.13 NM 4592.64 NM 4585.28 NM 4592.13 4575.27 4572.75 4571.26BFG1136A 4730.71 4703.85 DRY DRY DRY DRY DRY DRY DRY DRY DRY DRY DRY DRYBFG1136B 4730.90 NM 4700.43 4692.68 4686.48 4679.31 4673.10 4671.40 4668.49 4667.37 4686.48 4657.68 4651.18 4645.94BFG1136C 4731.37 NM 4700.65 NM 4686.72 NM 4673.52 NM 4668.93 NM 4686.72 4657.85 4651.38 4646.34BFG1155B 4613.77 4588.84 4579.31 4586.89 4579.02 4590.83 4582.20 4587.73 4573.71 4577.55 4579.02 4562.98 DRY DRYBFG1155C 4611.01 NM 4578.26 NM 4578.01 NM 4581.20 NM 4572.84 NM 4578.01 4562.51 4561.84 4559.36BFG1155D 4619.46 NM 4577.9 NM 4577.65 NM 4580.98 NM 4572.46 NM 4577.65 4561.05 4559.81 4558.10BFG1155E 4619.50 NM 4578.75 NM 4578.23 NM 4581.38 NM 4572.46 NM 4578.23 4560.38 4557.77 4557.24BFG1155F 4619.79 NM 4578.8 NM 4578.41 NM 4581.62 NM 4573.03 NM 4578.41 4561.21 4558.58 4557.31BFG1156A 4619.72 4590.22 DRY DRY DRY DRY DRY DRY DRY DRY DRY DRY DRY DRYBFG1156B 4619.55 NM 4581.97 4588.38 4581.61 4591.63 4583.61 4588.40 4575.12 4578.71 4581.61 4564.81 4562.99 4561.12BFG1156C 4620.78 NM 4583.05 NM 4582.8 NM 4584.57 NM 4577.04 NM 4582.80 4565.97 4564.17 4562.36BFG1156D 4620.10 NM 4582.63 NM 4582.31 NM 4584.29 NM 4576.57 NM 4582.31 4565.48 4563.70 4561.82BFG1156E 4620.28 NM 4583.48 NM 4583.57 NM 4587.43 NM 4579.44 NM 4583.57 4568.12 4563.78 4561.88BFG1156F 4620.36 NM 4583.14 NM 4582.12 NM 4584.63 NM 4576.99 NM 4582.12 4565.87 4564.05 4561.94BFG1168A 4733.15 4706.44 4702.81 4695.09 4688.86 4681.50 4674.70 4673.54 4670.60 4669.39 4688.86 4659.89 4652.84 4647.82BFG1168B 4733.44 NM 4703.16 NM 4689.2 NM 4674.98 NM 4670.96 NM 4689.20 4660.21 4653.20 4648.17BFG1168C 4733.62 NM 4703.22 NM 4689.33 NM 4675.03 NM 4671.16 NM 4689.33 4660.43 4653.40 4648.36BFG1195A Not Drilled Yet 4589.97 4581.35 4588.13 4581.37 4592.33 4582.67 4588.68 4575.18 4577.84 4581.37 4563.86 4562.18 4560.05BFG1195B Not Drilled Yet NM 4581.59 NM 4581.54 NM 4582.78 NM 4575.42 NM 4581.54 4564.04 4562.30 4560.16BFG1198A Not Drilled Yet 4706.08 4702.33 NM 4688.36 4681.08 4674.26 4673.20 4670.30 4669.15 4688.36 4659.57 DRY DRYBFG1198B Not Drilled Yet NM 4702.51 NM 4688.59 NM 4674.50 NM 4670.48 NM 4688.59 4659.69 4652.80 4647.79BFG1198C Not Drilled Yet NM 4702.64 NM 4688.78 NM 4674.65 NM 4670.69 NM 4688.78 4659.99 4653.12 4648.12BFG1200 4487.25 NM NM 4548.55 NM NM 4513.14 NM NM NM NM NM 4400.91 4476.30BRG286 5580.55 NM 5569.4 5568.59 5569.37 5569.77 5574.47 5575.15 5573.09 5577.55 5569.37 5572.09 5571.03 5569.12BRG287 5349.53 NM 5340.96 5339.96 5338.55 5337.82 5342.95 5343.30 5346.26 5345.12 5338.55 5338.31 5335.59 5334.38BRG288 5346.60 5345.96 5344.95 5344.1 5344.25 5345.49 5349.68 5351.59 5356.01 5356.54 5353.52 5348.54 5353.83 5349.56BRG289 5346.41 5345.62 5344.62 5343.85 5343.95 5345.36 5349.66 5351.35 5356.09 5356.30 5353.21 5347.41 5353.87 5349.66BRG290 5317.73 5314.51 5313.12 5311.35 5310.62 5309.98 5312.23 5313.56 5315.36 5315.87 5310.62 5311.18 5310.65 5309.25BRG291A 5538.33 5527.34 5525.41 5526.98 5527.72 5529.84 5532.22 5531.90 5532.95 5529.22 5527.72 5524.38 5525.43 5524.32BRG919 5602.87 5599.41 5598.44 5600.17 5601.05 5602.36 5603.19 5602.81 5603.83 5602.00 5601.05 5601.01 5602.06 5601.23
Table B-1 Water Elevation Data 1996, 2003-2010
South Facilities Groundwater2010 Remedial Progress Report
April 2011B-1

Kennecott Utah Copper | Environmental Restoration Group
Well Sept 1996 April 2003 Sept 2003 April 2004 Sept 2004 April 2005 Sept 2005 April 2006 Sept 2006 April 2007 Sept 2007 Sept 2008 Sept 2009 Sept 2010BRG920 5540.63 5530.2 5528.3 5536.44 5534.55 5544.54 5540.83 5543.55 5540.08 5533.91 5534.55 5531.25 5534.53 5533.26BRG921 5333.68 5324.81 5322.75 5320.58 5317.59 5316.60 5318.39 5319.26 5320.74 5320.68 5317.59 5315.85 5313.67 5311.74BRG999 5333.06 5323.74 5321.67 5319.45 5318.2 5317.29 5318.78 5320.39 5321.10 5321.14 5318.20 5316.39 5314.39 5312.69BSG1119A 4648.58 4620.15 4615.97 4615.01 4611.38 4610.44 4606.79 4605.45 4601.07 4598.41 4611.38 4589.64 DRY DRYBSG1119B 4650.84 NM 4616.71 NM 4613.26 NM 4608.82 NM 4603.10 NM 4613.26 4590.74 4586.45 4583.06BSG1119C 4741.05 NM 4715.71 NM 4707.68 NM 4698.69 NM 4692.39 NM 4707.68 4683.22 4676.85 4672.48BSG1125A 4735.89 4712.5 4707.97 4698.72 4691.75 4686.03 4684.64 4682.27 NM DRY DRY DRY DRY DRYBSG1125B 4735.81 NM 4707.4 NM 4691.53 NM 4684.43 NM NM NM 4691.53 4665.84 4657.97 4650.70BSG1125C 4735.96 NM 4705.94 NM 4690.46 NM 4682.58 NM NM NM 4690.46 4662.46 4656.44 4649.11BSG1130A 4636.18 4605.08 4601.84 4601.71 4599.52 4598.31 4598.54 4596.50 4594.29 4592.42 4599.52 4585.24 4581.80 4580.30BSG1130B 4633.41 NM 4598.19 NM 4595.82 NM 4596.24 NM 4591.15 NM 4595.82 4581.50 4578.39 4576.84BSG1130C 4631.02 NM 4595.8 NM 4593.77 NM 4595.44 NM 4589.25 NM 4593.77 4579.18 4576.48 4574.91BSG1132A 4627.63 4598.96 4591.72 4595.37 4590.07 4594.65 4591.27 4592.28 4585.47 4586.02 4590.07 4575.43 4572.71 4570.88BSG1132B 4626.80 NM 4590.61 NM 4589.02 NM 4590.94 NM 4584.40 NM 4589.02 4574.17 4571.60 4569.65BSG1132C 4623.45 NM 4586.61 NM 4584.79 NM 4587.37 NM 4580.23 NM 4584.79 4569.51 4567.42 4565.25BSG1133A 4633.99 4609.55 4599.54 4600.58 4597.14 4598.63 4595.70 4595.03 4590.84 4589.35 4597.14 4581.52 DRY DRYBSG1133B 4634.98 NM 4600.33 NM 4597.79 4599.80 4596.24 NM 4591.03 NM 4597.79 4580.26 4576.45 4574.17BSG1133C 4623.55 NM 4586.27 NM 4584.17 NM 4585.79 NM 4579.05 NM 4584.17 4568.02 4565.65 4563.43BSG1135A 4637.84 4607.17 4604.89 4603.14 4601.74 4599.64 4600.64 4598.36 4597.38 4595.04 4601.74 NM DRY DRYBSG1135B 4635.65 NM 4601.33 NM 4598.72 NM 4598.47 NM 4594.18 NM 4598.72 4585.03 4582.01 4580.40BSG1135C 4629.39 NM 4594.35 NM 4592.41 NM 4594.11 NM 4588.16 NM 4592.41 4578.05 4575.52 4574.03BSG1137A 4627.75 4599.61 4592.97 4595.84 4591.36 4593.27 4593.03 4591.90 4587.51 4587.34 4591.36 4577.97 4575.04 4573.35BSG1137B 4625.46 NM 4591.18 NM 4589.45 NM 4593.41 NM 4586.05 NM 4589.45 4576.36 4573.69 4572.07BSG1137C 4624.32 NM 4590.42 NM 4588.57 NM 4592.31 NM 4585.49 NM 4588.57 4575.59 4573.04 4571.47BSG1148A 4736.19 NM 4706.23 4697.5 4690.89 4684.62 4681.67 4679.86 4675.74 4674.40 4690.89 4663.08 4657.05 4649.49BSG1148B* 4736.09 NM 4704.74 NM 4689.67 NM 4679.91 NM 4673.94 NM 4689.67 4660.68 4655.97 4648.16BSG1148C* 4735.77 NM 4704.56 NM 4689.77 NM 4679.77 NM 4673.26 NM 4689.77 4660.21 4655.30 4649.06BSG1153A 4776.70 4767.71 4765.97 4762.25 4761.42 NM 4751.44 4748.74 4747.18 4745.13 4761.42 4739.35 4733.60 DRYBSG1153B 4743.53 NM 4727.42 NM 4741.41 NM 4745.13 NM 4750.89 NM 4750.81 4745.30 4749.47 4748.85BSG1153C 4853.21 NM 4776.8 NM 4777.65 NM 4785.33 NM 4793.66 NM 4784.86 4784.61 4785.17 4780.72BSG1177A 4730.63 4706.71 4697.83 4689.39 4683.42 4676.04 4671.96 4669.16 4666.21 4666.21 4683.42 4654.44 4649.61 4645.27BSG1177B 4732.41 NM 4698.8 NM 4684.22 NM 4672.41 NM 4666.45 NM 4684.22 4654.41 4649.35 4646.05BSG1177C 4735.53 NM 4706.25 NM 4691.98 NM 4680.14 NM 4674.12 NM 4691.98 4661.97 4656.53 4650.68BSG1179A 4732.71 NM 4704.21 4695.72 4689.07 4682.72 4679.31 4677.18 4673.85 4672.32 4689.07 4661.40 4655.43 4648.05BSG1179B 4732.27 NM 4702.99 NM 4688.24 NM 4677.51 NM 4671.21 NM 4688.24 4657.37 4653.17 4646.05BSG1179C 4734.12 NM 4704.36 NM 4689.54 NM 4674.41 NM 4672.32 NM 4689.54 4658.59 4654.21 4647.31BSG1180A 4729.60 4706.79 4700.56 4692.07 4685.83 4678.59 4674.34 4671.68 4668.56 4668.66 4685.83 4655.45 4649.89 4644.38BSG1180B 4731.31 NM 4701.99 NM 4687.06 NM 4675.45 NM 4669.27 NM 4687.06 4656.53 4651.61 4646.06BSG1180C 4733.39 NM 4704.1 NM 4689.84 NM 4678.32 NM 4671.79 NM 4689.84 4659.31 4654.12 4648.18BSG1196A 4723.17 4706.4 4700.31 4691.96 DRY DRY DRY DRY DRY DRY DRY DRY DRY DRYBSG1196B 4723.76 NM 4700.79 NM 4686.33 4679.03 4674.76 4672.05 4668.95 4668.97 4686.33 4655.76 4651.23 4644.81BSG1196C 4726.16 NM 4702.9 NM 4688.05 NM 4676.18 NM 4670.25 DRY 4688.05 4656.74 4652.31 4646.56BSG1201 Not Drilled Yet NM 4669.07 4675.02 4669.47 4664.09 4659.78 NM NM NM NM NM 4625.27 4646.08BSG2777A Not Drilled Yet Not Drilled Yet Not Drilled Yet Not Drilled Yet Not Drilled Yet Not Drilled Yet Not Drilled Yet Not Drilled Yet 4673.24 4676.64 4673.67 4662.48 4658.82 4650.86BSG2777B Not Drilled Yet Not Drilled Yet Not Drilled Yet Not Drilled Yet Not Drilled Yet Not Drilled Yet Not Drilled Yet Not Drilled Yet 4675.42 NM 4672.65 4661.35 4657.57 4650.26BSG2778A Not Drilled Yet Not Drilled Yet Not Drilled Yet Not Drilled Yet Not Drilled Yet Not Drilled Yet Not Drilled Yet Not Drilled Yet 4786.13 4784.70 4782.05 4776.50 4770.33 4764.62BSG2778B Not Drilled Yet Not Drilled Yet Not Drilled Yet Not Drilled Yet Not Drilled Yet Not Drilled Yet Not Drilled Yet Not Drilled Yet 4793.73 NM 4789.13 4783.80 4777.69 4771.60BSG2779A Not Drilled Yet Not Drilled Yet Not Drilled Yet Not Drilled Yet Not Drilled Yet Not Drilled Yet Not Drilled Yet Not Drilled Yet 4620.84 4586.86 4585.67 4585.68 4579.47 4577.56BSG2779B Not Drilled Yet Not Drilled Yet Not Drilled Yet Not Drilled Yet Not Drilled Yet Not Drilled Yet Not Drilled Yet Not Drilled Yet 4590.96 4592.07 4584.86 4584.85 4578.55 4576.46BSG2779C Not Drilled Yet Not Drilled Yet Not Drilled Yet Not Drilled Yet Not Drilled Yet Not Drilled Yet Not Drilled Yet Not Drilled Yet 4584.86 NM 4577.13 4577.14 4571.67 4569.16BSG2782A Not Drilled Yet Not Drilled Yet Not Drilled Yet Not Drilled Yet Not Drilled Yet Not Drilled Yet Not Drilled Yet Not Drilled Yet 4674.88 4672.41 4674.77 4660.84 4659.18 4650.23BSG2782B Not Drilled Yet Not Drilled Yet Not Drilled Yet Not Drilled Yet Not Drilled Yet Not Drilled Yet Not Drilled Yet Not Drilled Yet 4672.28 NM 4674.67 4661.39 4652.02 4652.02BSG2782C Not Drilled Yet Not Drilled Yet Not Drilled Yet Not Drilled Yet Not Drilled Yet Not Drilled Yet Not Drilled Yet Not Drilled Yet NM NM 4676.55 4660.85 4667.68 4651.55BSG2783A Not Drilled Yet Not Drilled Yet Not Drilled Yet Not Drilled Yet Not Drilled Yet Not Drilled Yet Not Drilled Yet Not Drilled Yet 4677.72 4677.40 4675.06 4664.37 4660.19 4652.13BSG2783B Not Drilled Yet Not Drilled Yet Not Drilled Yet Not Drilled Yet Not Drilled Yet Not Drilled Yet Not Drilled Yet Not Drilled Yet 4673.90 4674.90 4675.35 4664.69 4660.31 4652.64BSG2783C Not Drilled Yet Not Drilled Yet Not Drilled Yet Not Drilled Yet Not Drilled Yet Not Drilled Yet Not Drilled Yet Not Drilled Yet 4678.00 4677.90 4676.51 4665.12 4661.09 4653.52COG1149A 5240.65 NM NM NM 5238.72 5238.32 5238.54 5237.40 5237.09 NM 5236.68 5235.81 5235.38 5234.30
South Facilities Groundwater2010 Remedial Progress Report
April 2011B-2

Kennecott Utah Copper | Environmental Restoration Group
Well Sept 1996 April 2003 Sept 2003 April 2004 Sept 2004 April 2005 Sept 2005 April 2006 Sept 2006 April 2007 Sept 2007 Sept 2008 Sept 2009 Sept 2010COG1149B 5214.97 NM NM NM 5213.32 NM 5213.63 NM 5214.97 NM 5214.13 5212.92 5211.37 5210.21COG1149C 5213.69 NM NM NM 5212.49 NM 5212.96 NM 5213.69 NM 5212.83 5211.39 5211.77 5364.95COG1150A 5213.46 5214.63 5214.31 5213.66 5213.86 5214.12 5214.66 5215.35 5215.10 NM 5214.20 5212.89 5210.99 5217.46COG1150B 5213.20 NM 5213.54 NM 5213.11 NM 5213.81 NM 5214.33 NM 5213.42 5211.98 5210.35 5227.68COG1150C 5035.22 NM 5039.13 NM 5043.71 NM 5050.23 NM 5055.14 NM 5056.15 5056.18 5056.19 5209.93COG1151A 5221.97 NM NM 5220.71 5220.41 5219.96 5220.25 5219.59 5219.55 5219.89 5219.90 5218.94 5218.33 5207.39COG1151B 5233.56 NM NM NM 5231.9 NM 5222.07 NM 5230.52 NM 5230.24 5229.18 5228.57 5174.50COG1151C 5213.08 NM NM NM 5213.55 NM 5213.88 NM 5214.53 NM 5213.65 5212.36 5211.01 5202.50COG1151D 5210.88 NM NM NM 5211.2 NM 5211.67 NM 5212.45 NM 5211.47 5209.91 5208.48 5171.13COG1152A 5178.70 NM NM 5175.41 5175.79 5175.18 5176.65 5177.09 5177.65 5177.70 5176.97 5175.24 5176.15 5232.83COG1152B 5209.14 NM NM NM 5205.52 NM 5205.54 NM 5205.70 NM 5205.11 5203.59 5204.30 5227.35COG1152C 5175.61 NM NM NM 5174.59 NM 5175.04 NM 5175.67 NM 5175.32 5173.24 5172.28 5220.01COG1158A 5237.93 5238.7 5238.13 5237.23 5236.83 5236.64 5237.82 5235.66 5235.39 NM 5234.99 5234.08 5233.56 DRYCOG1158B 5227.30 NM 5229.97 NM 5229.67 NM 5229.72 NM 5229.41 NM 5229.18 5228.41 5227.90 4785.27COG1158C 5222.27 NM 5222.71 NM 5222.26 NM 5222.73 NM 5222.93 NM 5222.45 5221.43 5220.50 4785.99COG1175A 4844.45 4825.11 4822.43 4819.32 4817.27 4814.08 4811.48 4808.93 4806.96 4804.37 4802.15 4796.61 4789.81 4786.84COG1175B 4845.20 NM 4823.08 NM 4817.93 NM 4812.10 NM 4807.52 NM 4802.79 4797.21 4791.35 4786.93COG1175C 4846.28 NM 4823.84 NM 4818.93 NM 4812.87 NM 4808.27 NM 4803.45 4797.94 4792.13 4787.03COG1178A 4847.41 4827.54 4824.86 4821.7 4819.89 4816.40 4813.79 4811.20 4809.09 4806.23 4804.24 4798.63 4792.93 4792.93COG1178B 4847.54 NM 4824.92 NM 4819.63 NM 4813.87 NM 4809.15 NM 4804.21 4798.64 4793.01 4793.01COG1178C 4847.67 NM 4825.06 NM 4819.76 NM 4813.98 NM 4809.27 NM 4804.38 4798.79 4793.12 4793.12COG918 5219.30 NM NM NM 5219.07 NM NM 5220.58 5220.74 5220.91 5219.53 5218.08 NM NMCPG950 5144.20 NNM NM NM NM 5140.54 5146.55 5141.31 5142.53 5140.36 5140.46 5137.31 5135.45 5154.02ECG1112A 5242.10 NM NM NM 5239.4 NM NM 5240.15 5243.07 5242.45 5241.17 5240.72 NM NMECG1112B 5255.63 NM NM NM 5252.61 NM NM NM 5255.02 NM 5253.54 5252.80 NM NMECG1113A 5174.57 5172.39 5171.84 5171.03 5170.26 5169.19 5168.48 5167.82 5167.40 5166.86 5166.51 5165.05 5163.50 5161.84ECG1113B 5141.45 NM 5143.65 NM 5139.66 NM 5139.99 NM 5137.18 NM 5133.23 5130.22 5128.33 5125.50ECG1113C 5143.17 NM 5144.92 NM 5140.68 NM 5141.20 NM 5138.28 NM 5134.13 5131.19 5129.45 5124.62ECG1114A 5330.38 5328.5 5327.31 5325.77 5324.94 5323.81 5324.06 5323.80 5324.28 5323.79 5323.60 5321.49 5319.60 5317.83ECG1114B 4985.46 NM 4979.55 NM 4978.81 4978.29 4978.17 4977.58 4977.19 4976.41 4976.05 4974.54 4974.51 4973.53ECG1115A 4987.44 4946.96 4945.42 4937.51 4927.49 4910.61 4898.46 NM 4877.01 4867.42 4863.86 4852.33 4869.94 4872.05ECG1115B 4995.06 NM 4948.99 NM 4930.81 NM 4900.03 NM 4880.41 NM 4869.00 4855.83 4874.70 4875.33ECG1115C 4995.93 NM 4948.7 NM 4931.24 NM 4903.18 NM 4882.37 NM 4871.45 4843.38 4877.91 4872.00ECG1115D 5000.88 NM 4958.33 NM 4939.96 NM 4910.67 NM 4891.10 NM 4877.95 4866.90 4883.92 4886.12ECG1115E 4933.83 NM 4932.44 NM 4931.73 NM 4932.73 NM 4932.60 NM 4932.13 4931.99 4931.03 4930.20ECG1116A 4979.03 4938.31 4937.55 DRY DRY DRY DRY DRY DRY DRY DRY DRY DRY DRYECG1116B 4979.18 NM 4940.94 4936.01 4929.84 4924.87 4922.86 4921.64 4920.76 4920.37 4920.50 4921.49 4920.66 4920.59ECG1116C 5118.19 NM 5117.15 NM 5114.8 NM 5115.13 Dry 5113.15 NM 5110.37 5105.36 5105.10 5102.90ECG1117A 4984.54 4945.98 4943.76 4936.03 4926.05 4908.71 4896.41 4883.83 4875.70 4865.80 4861.57 4851.12 4866.94 4874.92ECG1117B 4994.69 NM 4952.91 NM 4935.08 NM 4905.26 NM 4885.22 NM 4871.41 4860.22 4874.45 4878.20ECG1117C 4999.57 NM 4958.96 NM 4941.35 NM 4911.63 NM 4891.61 NM 4876.93 4866.90 4879.70 4884.34ECG1118A 4842.88 4804.76 4803.79 4798.54 4794.74 4791.94 4789.02 4786.14 4783.96 4781.60 4779.03 4771.68 4767.48 4761.38ECG1118B 4846.47 NM 4805.18 NM 4798.83 NM 4793.16 NM 4787.94 NM 4782.85 4777.48 4771.36 4765.15ECG1118C 4847.31 NM 4807.55 NM 4802.04 NM 4796.04 NM 4790.74 NM 4785.83 4780.63 4774.56 4775.97ECG1121A 4826.43 4808.36 4806.48 4803.27 4800.29 4797.57 4795.23 4792.47 4789.93 4787.75 4785.60 4779.79 4773.48 4767.71ECG1121B 4827.77 NM 4807.01 NM 4801.4 NM 4795.36 NM 4789.85 NM 4785.02 4779.53 4773.43 4767.59ECG1121C 4827.98 NM 4807.16 NM 4801.52 NM 4795.42 NM 4790.28 NM 4785.49 4779.91 4773.79 4767.97ECG1124A 4979.71 4938.69 4937.78 4929.35 4917.36 4899.38 4880.61 4872.33 DRY NM DRY DRY DRY DRYECG1124B 5008.04 NM 4935.66 NM 4912.98 NM 4886.55 NM 4864.87 4855.59 4865.23 4839.16 4875.22 4863.69ECG1124C 4998.44 NM 4955.68 NM 4937.23 NM 4907.90 NM 4888.26 NM 4874.36 4864.00 4880.81 4883.30ECG1128A 4981.67 4936.06 4934.65 4926.24 4915.13 4897.55 4885.71 4873.66 4865.47 4856.44 4855.55 4839.42 4868.18 4862.37ECG1128B 4967.87 NM 4932.08 NM 4916.66 NM 4891.45 NM 4873.44 NM 4861.55 4849.46 4872.16 4867.83ECG1128C 4991.72 NM 4940.6 NM 4920.71 NM 4890.65 NM 4870.75 NM 4859.44 4843.78 4874.23 4866.79ECG1131A 4915.09 4905.21 4903.83 4900.22 4897.72 4891.28 4886.09 4880.92 4876.95 4872.00 4869.18 4864.76 4864.38 4866.76ECG1131B 4937.28 NM 4913.07 NM 4882.39 NM 4890.51 NM 4869.05 NM 4858.50 4849.69 4862.88 4861.67ECG1131C 4951.90 NM 4920.14 NM 4905.79 NM 4891.13 NM 4868.43 NM 4854.09 4843.66 4862.27 4859.68ECG1142A 4993.80 4944.45 4943.49 4933.69 4923.63 4905.85 4893.24 4880.81 4872.92 4862.64 4862.22 4845.77 4875.53 4868.60
South Facilities Groundwater2010 Remedial Progress Report
April 2011B-3

Kennecott Utah Copper | Environmental Restoration Group
Well Sept 1996 April 2003 Sept 2003 April 2004 Sept 2004 April 2005 Sept 2005 April 2006 Sept 2006 April 2007 Sept 2007 Sept 2008 Sept 2009 Sept 2010ECG1142B 4981.68 NM 4967.92 NM 4961.3 NM 4948.83 NM 4938.44 NM 4929.37 4925.65 4922.07 4926.84ECG1142C 4966.43 NM 4963.76 NM 4961.73 NM 4959.43 NM 4955.81 NM 4951.11 4947.75 4944.55 4942.00ECG1143A 5057.68 5051.49 5052.95 5053.13 5049.58 5048.24 5048.05 5047.50 5044.74 5042.91 5039.14 5032.48 5028.11 5022.72ECG1143B 5007.25 NM 5050.78 NM 5025.48 NM 5041.24 NM 5025.61 NM 5000.92 5002.79 4993.01 4981.79ECG1143C 5043.05 NM 5076.99 NM 5048.94 NM 5068.01 NM 5052.68 NM 5029.82 5038.17 5026.05 5019.32ECG1144A 4860.65 4847.78 4845.8 4843.91 4842.48 4839.77 4837.41 4834.37 4832.03 4829.46 4826.94 4820.45 4809.78 4804.99ECG1144B 4987.18 NM 4942.32 NM 4922.41 NM 4891.86 4880.38 4871.22 4860.90 4860.67 4844.98 4868.93 4889.64ECG1144C 4989.43 NM 4946.67 NM 4928.33 NM 4898.76 NM 4877.79 NM 4860.38 4852.97 4870.56 4872.37ECG1145A 4980.60 4935.64 4934.72 4925.62 4915.23 4897.70 4885.49 4872.99 4864.96 4854.42 4852.60 4837.98 4867.00 4861.67ECG1145B 4988.25 NM 4937.76 NM 4916.54 NM 4887.29 4875.23 4867.55 NM 4859.70 4839.84 4872.61 4862.56ECG1145C 4990.46 NM 4940.27 NM 4920.11 NM 4890.11 NM 4869.86 NM 4860.64 4842.36 4872.89 4865.86ECG1146 4991.52 4921.8 4921.28 4908.4 4898.52 4880.32 4867.55 4856.71 4847.39 4834.30 NM 4817.36 4870.22 4848.28ECG1182A NM 5571.77 5571.76 5567.55 5567.23 5565.93 5567.37 5569.85 5562.27 5567.48 5567.29 5563.20 5566.59 5569.21ECG1182B 5579.53 NM 5574.82 NM 5574.33 5576.40 5576.33 5576.99 5575.98 5576.76 5574.53 5574.07 5574.49 5575.29ECG1183A 5421.43 5418.56 5417.16 5421.02 5419.11 5421.57 5420.73 5424.93 5419.32 5419.02 5417.47 5417.28 5417.54 5417.22ECG1183B 5431.62 NM 5427.85 NM 5429.15 NM 5430.39 NM 5429.69 NM 5428.02 5427.72 5427.74 5427.39ECG1184 5410.65 5414.45 5404.15 5413.79 5404.19 NM 5404.72 5427.93 5404.22 5414.97 5403.05 5404.92 5405.67 5404.62ECG1186 5329.04 5327.98 5326.78 5325.3 5324.71 5323.41 5323.28 5323.02 5323.22 5322.96 5322.84 5321.14 5319.29 5317.58ECG1187 5333.39 5331.08 5329.99 5328.45 5327.66 5326.31 5326.09 5325.85 5325.92 5325.65 5325.64 5324.01 5322.13 5320.36ECG1188 5327.49 5326.77 5319.59 5324.16 5323.53 5322.41 5322.29 5322.08 5322.24 5321.94 5321.83 5320.10 5318.32 5316.69ECG1189 5158.27 NM 5156.72 5156.37 5156.65 5156.54 5156.42 5156.41 5156.15 5156.19 5156.32 5155.12 5155.83 5155.87ECG1190 5281.33 5280.45 5279.65 5278.66 5278.19 5277.43 5277.05 5276.43 5276.33 5275.50 5275.03 5273.75 5272.44 5271.05ECG1199A 5333.02 5328.03 5326.88 5325.43 5324.73 5323.53 5323.38 5323.12 5323.32 5323.05 5322.93 5324.23 5319.40 5317.68ECG1199B 5316.58 NM 5314.24 NM 5314.19 NM 5313.86 NM 5313.47 NM 5312.89 5312.20 5312.00 DRYECG1199C 5332.90 NM 5326.74 NM 5324.58 NM 5323.22 NM 5323.16 NM 5322.76 5321.08 5319.26 5317.56ECG1199D 5332.92 NM 5327.06 NM 5324.62 NM 5323.25 NM 5323.21 NM 5323.09 5321.03 5319.27 5317.58ECG1199E 5332.42 NM 5326.81 NM 5324.68 NM 5323.31 NM 5323.27 NM 5322.86 5321.19 5319.63 5317.63ECG1199F 5332.66 NM 5326.97 NM 5324.84 NM 5323.47 NM 5323.43 NM 5323.01 5321.34 5319.50 5317.79ECG1199G 5332.64 NM 5326.48 NM 5324.32 NM 5323.30 NM 5323.13 NM 5322.64 5321.09 5319.27 5317.29ECG293 5261.76 5259.57 5258.21 5257.63 5256.85 5256.86 5257.08 5258.48 5258.05 5257.60 5257.17 5255.93 5255.19 5254.71ECG294 5284.46 5278.13 5276.6 5275.18 5275.64 5275.04 5278.77 5283.70 5281.09 5279.17 5277.42 5276.94 5275.46 5273.92ECG295B 5271.66 5266.79 5265.57 5264.69 5265.09 5266.13 5269.32 5278.19 5270.99 5268.62 5266.58 5264.88 5266.22 5263.71ECG296 5295.36 5292.44 BLOCKED BLOCKED BLOCKED BLOCKED BLOCKED BLOCKED BLOCKED BLOCKED 5290.35 NM BLOCKED BLOCKEDECG297 5306.85 5302.47 5301.53 5300.62 5300.35 5301.02 5303.01 5304.42 5305.18 5304.55 5303.01 5301.29 5302.14 5300.10ECG299 5331.09 5321.82 5319.88 5317.58 5316.43 5315.42 5316.94 5317.84 5318.95 5317.65 5318.05 5314.75 5312.72 5311.00ECG900 5331.70 5322.61 5320.61 5318.38 5317.1 5316.07 5317.44 5318.47 5319.61 5318.33 5318.71 5315.42 5313.29 5311.59ECG901 5331.29 5322.43 5320.39 5318.1 5316.91 5315.88 5317.27 5318.28 5319.44 5319.54 5318.55 5315.24 5313.12 5311.43ECG902 5354.50 BLOCKED BLOCKED BLOCKED 5339.71 5337.67 5337.90 5338.49 5339.56 5338.76 5339.63 5336.65 5334.13 5332.19ECG903 5502.29 5472.96 5470.06 5466.37 5465.51 5463.66 5469.85 5468.89 5472.98 5470.92 5467.76 5461.84 5458.70 5456.27ECG904 5368.07 5348.2 5346.9 5349.54 5347.4 5356.20 BLOCKED BLOCKED BLOCKED BLOCKED 5348.60 NM BLOCKED BLOCKEDECG905 5387.85 5374.7 5367.76 5368.35 5368.9 5376.32 5378.70 5378.43 5379.61 5375.83 5373.30 5368.28 5367.99 5365.86ECG906 5330.62 5328.82 5327.59 5325.94 5325.35 5324.28 5324.46 5324.42 5324.79 5324.40 5324.07 5321.87 5319.90 5318.19ECG907 5331.98 5328.81 5327.6 5325.97 5325.16 5323.79 5323.80 5323.79 5324.25 5323.80 5323.56 5321.28 5319.08 5317.06ECG908 5578.84 5576.98 5574.58 5577.96 NM 5579.57 5580.73 5580.81 5581.50 5579.79 5580.26 5578.98 5579.49 5579.34ECG909 5487.95 5473.78 5473.04 5475.24 5476.53 5484.97 5485.17 5485.23 5485.28 5479.74 5476.35 5473.25 5476.54 5474.21ECG915 NM NM NM NM NM NM NM NM NM NM BLOCKED NM NM NMECG916 5563.59 5564.17 5562.08 5563.58 LID DAMAGE 5562.16 5563.36 5567.24 5570.42 5566.35 5567.77 5568.23 5568.66 5567.97ECG917 5348.03 5346.82 5345.29 5342.9 5341.85 5340.46 5340.06 5340.05 5340.36 5340.06 5339.90 5337.08 5334.60 5332.52ECG922 5331.80 5328.94 5328.08 5326.12 5325.36 5324.00 5324.08 5323.93 5324.37 5323.87 5323.64 5321.45 5319.30 5317.47ECG923 5424.97 5413.84 5411.25 5408.05 5408.2 5408.15 5411.58 5410.70 5413.54 5411.63 5409.67 5405.10 5404.48 5403.36ECG924 5557.24 5555.9 5555.82 5557.69 5556.77 5557.74 5557.06 5557.88 5556.87 5557.05 5556.37 5556.35 5556.79 5556.55ECG925 5521.01 5520.45 5517.19 5521.7 5518.77 5523.50 5520.78 5524.38 5520.43 5521.36 5518.32 5517.75 5518.21 5517.59ECG926 5509.85 5509.5 5507.61 5512.58 5508.5 5514.28 5509.65 5514.90 5509.23 5511.81 5508.07 5507.89 5508.72 5508.04ECG928 5425.10 5413.17 5411.1 5407.85 5408.11 5408.08 5411.57 5410.71 5413.54 5411.56 5409.55 5405.00 5404.55 5403.33ECG931 5571.38 5569.16 5568.48 5573.06 5569.62 5573.35 5570.36 5572.66 5570.02 5569.54 5568.75 5568.51 5568.71 5568.61ECG932 5635.16 5630.45 5628.68 5630.36 NM 5629.20 5631.60 5631.92 5631.58 5631.00 5630.04 5628.79 5629.44 5628.03ECG933 5577.79 5572.99 5572.15 5573.51 5571.79 5573.47 5573.03 5574.07 5572.72 5573.52 5571.71 5571.22 5571.45 5571.37
South Facilities Groundwater2010 Remedial Progress Report
April 2011B-4

Kennecott Utah Copper | Environmental Restoration Group
Well Sept 1996 April 2003 Sept 2003 April 2004 Sept 2004 April 2005 Sept 2005 April 2006 Sept 2006 April 2007 Sept 2007 Sept 2008 Sept 2009 Sept 2010ECG934 5584.37 5577.88 5576.57 5578.89 5576.52 5578.77 5578.25 5579.57 5578.07 5579.07 5576.55 5576.05 5576.34 5576.12ECG935 5708.74 NM 5707.58 5708.85 5707.84 5709.31 5708.09 5709.65 5708.02 5708.31 5707.57 5707.46 5707.70 5707.64ECG936 5845.18 5840.33 BLOCKED BLOCKED 5841.88 BLOCKED BLOCKED BLOCKED BLOCKED BLOCKED BLOCKED BLOCKED BLOCKED 5840.02ECG937 5809.25 5802.93 5802 5802.1 5801.37 5802.07 5802.27 5804.42 5803.80 5803.58 5802.45 5801.12 5800.86 5800.19ECG938 5983.73 5984.42 5982.51 5983.42 5982.31 5984.25 5983.92 5985.53 5983.87 5983.84 5982.57 5982.22 5982.47 5982.52ECG939 5983.43 5984.31 5982.22 5983.29 NM 5984.20 NM NM NM BLOCKED BLOCKED BLOCKED BLOCKED BLOCKEDECG940 6072.47 6081.07 6075.73 6080 6076.25 6087.84 6077.79 6088.91 6078.80 6079.52 6076.83 6077.59 6078.21 6078.91ECG952 5136.02 5142.54 5142.25 5142.08 5131.29 5130.98 5131.02 5131.31 5120.56 5130.18 5128.74 5125.61 5124.98 5123.22EPG1165A 4632.91 4602.68 4598.88 4599.21 4596.56 4597.25 4596.81 4594.98 4592.22 4590.72 4586.79 4589.84 4586.92 4585.35EPG1165B 4631.52 NM 4597.03 NM 4595.02 NM 4595.77 NM 4590.68 NM 4584.98 4585.85 4584.05 4583.50EPG1165C 4628.73 NM 4594.17 NM 4592.28 NM 4594.27 NM 4588.32 NM 4582.27 4585.08 4582.56 4581.06EPG1166 4574.70 4583.61 4561.65 4584.42 4563.35 4586.76 4566.13 4589.39 4568.65 4587.56 4564.24 4564.21 4566.66 4568.05EPG1689 4603.67 NM NM NM NM 4602.27 4603.27 4604.80 4605.73 4606.71 4607.55 4607.55 4607.90 4608.99EPG2780A Not Drilled Yet NM NM NM NM NM NM NM NM DRY 4579.28 4580.15 4580.08 4580.96EPG2780B Not Drilled Yet NM NM NM NM NM NM NM NM 4594.06 4590.50 4589.36 4590.63 4592.84EPG2781A Not Drilled Yet NM NM NM NM NM NM NM NM 4594.64 4604.20 4601.97 4601.40 4602.15EPG2781B Not Drilled Yet NM NM NM NM NM NM NM NM NM 4601.93 4602.59 4602.18 4602.90HMG1122A 4737.86 4715.53 4710.95 4702.72 4696.63 4690.98 4691.06 4685.85 4684.51 4680.37 4679.72 4673.45 4663.87 4657.34HMG1122B 4736.94 NM 4709.26 NM 4694.88 NM 4689.33 NM 4682.71 NM 4678.25 4671.57 4662.36 4655.78HMG1122C 4761.21 NM 4750.62 NM 4743.39 NM 4739.59 NM 4735.83 NM 4732.52 4728.63 4723.49 4719.30HMG1123A 4736.48 4713.46 4708.5 4699.77 4692.73 4687.57 4687.93 4685.62 4681.09 4677.37 4677.13 4669.78 4660.42 4653.50HMG1123B 4736.48 NM 4707.85 NM 4692.78 NM 4686.99 NM 4680.17 NM 4676.24 4668.36 4659.72 4652.81HMG1123C 4736.32 NM 4707.08 NM 4692.09 NM 4685.33 NM 4678.59 NM 4674.73 4666.20 4658.54 4651.48HMG1126A 4753.35 4731.73 4723.74 4722.5 4716.91 4711.02 4709.31 4706.57 4702.78 4698.91 4696.67 DRY DRY DRYHMG1126B 4752.18 NM 4727.17 NM 4716.31 4710.68 4709.08 4706.37 4702.48 4698.68 4696.49 4691.60 4683.59 4678.04HMG1126C 4748.44 NM 4722.12 NM 4709.22 NM 4703.73 NM 4696.82 NM 4691.87 4685.91 4676.51 4670.21HMG1134A 4641.35 4612.23 4610.35 4607.47 4606.45 DRY DRY DRY DRY DRY DRY DRY DRY DRYHMG1134B 4636.26 NM 4602.09 NM 4599.75 4599.44 4599.09 4597.26 4594.99 4593.19 4589.95 4585.98 4582.94 4582.41HMG1134C 4632.13 NM 4598.04 NM 4596.46 NM 4596.45 NM 4592.16 NM 4587.03 4583.53 4581.30 4581.15HMG1163A 4591.75 4575.29 NM 4575.27 4587.94 4574.69 4585.01 4574.99 4584.30 4575.34 4585.02 4586.44 4586.75 4585.41HMG1163B 4592.10 NM NM NM 4588.36 NM 4585.40 NM 4585.35 NM 4585.41 4586.36 4586.31 4585.83HMG1163C 4496.49 NM NM NM 4491.28 NM 4489.20 NM 4488.85 NM 4489.68 4489.86 4490.00 4490.43HMG1163Z 4590.48 NM NM NM 4586.92 NM NM NM 4584.32 NM 4583.91 NM NM NMHMG1164A NM NM ABANDONED ABANDONED ABANDONED ABANDONED ABANDONED ABANDONED ABANDONED ABANDONED ABANDONED ABANDONED ABANDONED ABANDONEDHMG1856 4787.21 NM 4773.78 NM NM 4764.81 4760.07 4760.85 4755.01 4756.67 4751.41 4749.61 4747.81 4745.73K105 5118.05 5113.93 5113.19 5113.02 5115.75 5115.28 5115.28 5115.29 5115.05 5114.90 5114.71 5114.2* 5112.64 5112.08K106 4732.30 4703.73 4702.98 4695.32 4689.26 4681.89 4677.52 4673.91 4671.26 4669.70 4667.14 4664.19 DRY DRYK120 5148.13 5139.32 5138.91 5138.77 5146.52 NM 5146.59 5147.08 5151.00 5150.86 5151.54 5147.59 5149.00 5147.02K201 4639.79 4609.7 NM NM 4605.63 4603.37 4603.93 4601.93 4601.31 NM ABANDONED ABANDONMENT ABANDONED ABANDONEDK26 4981.80 DRY DRY DRY DRY DRY DRY DRY DRY NM DRY DRY DRY DRYK70 5325.43 5324.15 5322.75 5321.15 BLOCKED 5319.32 5319.41 5322.72 5319.62 5319.20 5318.93 DRY DRY DRYK72 5261.26 BLOCKED 5259.69 BLOCKED BLOCKED BLOCKED BLOCKED BLOCKED BLOCKED BLOCKED BLOCKED DRY NM NMK84 5175.89 5174.81 5174.29 NM 5172.67 5174.02 5173.49 5175.59 5175.35 5175.26 5174.23 NM 5173.12 5172.66LRG910 5244.87 5242.07 5241.25 5241.36 5240.27 5240.72 5240.73 5243.24 5242.65 5242.76 5241.65 5240.92 5240.91 5241.12LRG911 5204.38 5201.64 5201.2 5201.3 5201.12 5201.09 5201.50 5201.52 5201.44 5201.77 5202.04 5202.30 5202.61 5204.59LRG912 5223.61 5222.68 5222.23 5221.54 5221.48 5221.79 5222.29 5222.96 5223.34 5223.12 5222.39 5221.27 5222.27 5220.79LRG914 5258.69 5256.47 5254.8 5253.56 5252.78 NM 5252.81 5253.88 5253.95 5253.64 5252.88 5251.55 BLOCKED 5249.87LTG1127A 5181.04 5172.72 5171.63 5170.32 5169.5 5168.69 5169.27 5171.21 5171.73 5171.23 5170.20 5167.28 5165.03 5163.24LTG1127B 5186.91 NM 5178.32 NM 5176.28 NM 5175.86 NM 5177.80 NM 5176.43 5173.36 5172.41 5169.15LTG1127C 5185.53 NM 5182.29 NM 5180.22 NM 5179.55 NM 5178.45 NM 5176.81 5174.96 5170.70 5170.06LTG1129A 5030.52 5029.21 5031.65 5031.71 5025.95 5025.60 5026.68 5027.15 5021.54 5020.39 5014.64 5005.61 5002.91 4997.62LTG1129B 5015.45 NM 5043.68 NM 5013 NM 5033.87 NM 5016.65 NM 4986.35 4992.40 4980.67 4961.23LTG1129C 5018.61 NM 5047.18 NM 5010.72 NM 5036.99 NM 5019.44 NM 4980.94 4993.38 4974.80 4947.44LTG1138A 4740.39 4716.82 4696.71 4685.77 DRY DRY 4690.84 NM DRY NM DRY DRY DRY DRYLTG1138B 4740.84 NM 4688.23 NM 4669.13 4664.14 4690.84 4689.03 4672.39 4668.74 4680.55 4669.47 4640.09 4635.99LTG1138C 4740.87 NM 4693.63 NM 4675.67 NM 4691.13 NM 4675.78 NM 4680.68 4670.03 4645.90 4642.12LTG1138D 4741.26 NM 4695.82 NM 4678.01 NM 4691.85 NM 4677.21 NM 4681.54 4671.00 4648.09 4644.35
South Facilities Groundwater2010 Remedial Progress Report
April 2011B-5

Kennecott Utah Copper | Environmental Restoration Group
Well Sept 1996 April 2003 Sept 2003 April 2004 Sept 2004 April 2005 Sept 2005 April 2006 Sept 2006 April 2007 Sept 2007 Sept 2008 Sept 2009 Sept 2010LTG1138E 4741.27 NM 4696.6 NM 4678.86 NM 4689.82 NM 4677.54 NM 4681.50 4670.95 4648.81 4645.03LTG1138F 4739.07 NM 4704 NM 4688.01 NM 4687.75 NM 4678.26 NM 4677.41 4666.88 4655.50 4650.16LTG1139 5003.60 5039.22 5044.55 NM 5013.53 5026.61 5032.41 5025.64 5016.03 4970.62 5007.05 5009.72 5002.31 4992.61LTG1140A 4998.66 5040.63 5044.17 5034.85 5014.97 5029.55 5033.85 5031.00 5015.32 5017.41 4988.55 4991.27 4981.94 4972.34LTG1140B 4991.52 NM 5044.43 NM 5015.37 NM 5034.18 NM 5016.25 NM 4988.52 4991.67 4981.15 4969.54LTG1140C 5018.43 NM 5046.64 NM 5016.54 NM 5035.98 NM 5018.69 NM 4985.82 4991.32 4976.32 4956.49LTG1140D 5042.00 NM 5075.6 NM 5048.01 NM 5066.54 NM 5051.14 NM 5028.56 5035.53 5024.55 5017.84LTG1141A 5033.57 5031.65 5034.23 5034.31 5028.2 NM 5029.12 5029.51 5023.50 5022.31 5016.19 DRY DRY DRYLTG1141B 4976.41 NM 5043.8 NM 5015.54 NM 5033.69 NM 5016.40 NM NM 4991.47 NM NMLTG1141C 5017.77 NM 5046.19 NM 5016.24 NM 5035.54 NM 5018.31 NM 4985.99 4991.24 4985.15 4957.13LTG1147 4741.06 4716.52 NM NM NM 4621.30 4692.06 NM NM NM NM NM 4608.42 4590.62LTG1167A 4923.06 4903.6 4902.3 4900.64 4900.93 4898.83 4903.25 4903.35 4908.75 4904.70 4904.02 4896.70 4893.09 4890.45LTG1167B 4919.21 NM 4904.39 NM 4903.09 4901.85 4904.49 4905.89 4907.66 4903.62 4904.63 4899.67 4895.82 4893.41LTG1167C 4921.78 NM 4906.26 NM 4905.23 NM 4906.99 NM 4910.72 NM 4907.63 4902.49 4899.12 4897.88LTG1191 Not Drilled Yet 5307.78 5307.23 5308.65 5307.64 5310.35 5310.50 5310.45 5308.23 5308.56 5307.54 5306.98 5306.21 5306.75LTG929A 5213.49 5209.01 5206.81 5208.37 5211.77 5211.85 5214.36 5211.73 5212.97 5210.80 5209.84 5208.87 5209.53 5209.74LTG929B 5211.37 NM 5204.38 NM 5206.42 NM 5210.32 Dry 5209.59 DRY 5206.30 5205.18 5203.20 5202.84P190A 4632.97 DRY DRY DRY DRY DRY DRY DRY DRY NM DRY DRY DRY DRYP190B 4631.72 4601.02 4597.05 4598.61 4594.67 4595.94 4594.97 4594.18 4590.35 4589.44 4584.53 4580.92 NM 4580.95P191A DRY DRY DRY DRY DRY DRY DRY DRY DRY NM DRY DRY DRY DRYP191B 4622.68 4594.74 4586.49 4592.12 4585.05 4593.09 4587.73 4590.01 4580.56 4582.67 4573.65 4569.93 4567.91 4566.12P192A 4633.73 DRY DRY DRY DRY DRY DRY DRY DRY NM DRY DRY DRY DRYP192B 4625.79 4599.62 4591.87 4596.28 4593.66 4597.41 4596.61 4596.55 4590.35 4591.78 NM 4585.10 4582.39 4580.90P193A 4636.74 DRY DRY DRY DRY DRY DRY DRY DRY NM ABANDONED ABANDONED ABANDONED ABANDONEDP193B 4623.35 NM 4590.64 4595.72 4587.86 4591.91 4591.66 4591.45 4584.80 4586.69 4578.57 4575.02 4572.36 4570.93P194A 4631.47 4601.95 4598.05 4598.63 4595.98 4596.65 4596.43 4594.48 4591.85 4590.35 NM 4594.74 4591.82 4590.25P194B 4631.46 NM 4597.69 NM 4595.62 NM 4596.26 NM 4591.47 NM NM 4594.75 4592.04 4590.35P197B 4620.56 4590.08 4580.86 4588.04 4582.52 4592.97 4585.01 Dry 4576.95 DRY 4569.53 4565.02 4564.12 4562.02P208A 4972.60 4936.36 4936.53 4928.76 4923.16 DRY DRY DRY DRY DRY DRY DRY DRY DRYP208B 4979.41 NM 4932.97 NM 4916 4899.09 4887.36 4875.22 4867.49 4857.40 4855.14 4842.23 4867.90 4873.95P209B 4740.80 4706.1 4701.55 4693.58 4695.79 4688.09 4684.12 4680.54 4677.39 4676.89 4672.49 4666.29 4659.86 4654.31P211A 4887.50 4893.07 4892.06 4890.78 4878.16 4876.42 4875.89 4875.30 4875.72 4874.35 4873.70 4869.69 4865.54 4863.15P211B 4888.01 NM 4892.88 NM 4878.52 NM 4876.21 NM 4875.99 NM 4873.90 4869.88 4865.78 4863.44P212A 5001.22 5039.45 5043.09 5034.36 5027 5037.59 5043.53 5030.10 5026.82 5013.99 4992.63 4992.66 4988.76 4975.64P212B 5014.97 NM 5044.66 NM 5025.24 5028.99 5043.83 NM 5016.42 NM 4988.39 4990.44 4977.22 4965.14P214A 5422.97 5416.07 5419.36 5422.06 5420.88 5423.13 5422.30 5418.86 5421.14 5420.83 5419.96 5420.13 5419.93 5419.95P220 5517.09 5484.64 5481.65 5478.09 5476.72 5474.57 5477.43 5478.31 5481.06 5480.58 5478.80 5473.06 5468.85 5466.07P225 5472.70 5447.94 5444.62 5440.57 5439.12 5437.00 5439.40 5439.65 5441.53 5439.73 5439.11 5434.15 5430.83 5428.44P228 5761.83 5759.7 5758.67 5763.95 5760.91 5763.34 5761.98 5764.29 5761.76 5762.48 5759.35 5759.63 5760.68 5759.92P231 5311.38 5307.37 5306.68 5307.91 5306.9 5309.77 5309.89 5309.99 5308.71 5308.08 DRY DRY DRY DRYP239 5902.37 NM NM NM NM 5906.52 5901.78 5904.63 5901.31 5900.09 5896.94 5897.30 5899.65 5897.48P240B 4591.05 NM NM 4595.48 4592.58 4596.48 4593.73 4597.73 4594.30 4597.85 4594.17 NM BLOCKED BLOCKEDP241A 4731.28 DRY DRY DRY DRY DRY DRY DRY DRY NM DRY DRY DRY DRYP241B 4736.03 4708.7 4702.5 4693.95 4688.9 NM 4678.36 4675.84 4672.51 4671.95 4668.97 4660.20 4654.32 4646.49P241C 4735.56 4713.27 4710.18 4700.47 4690.73 4684.51 4682.32 4679.73 4676.05 4673.73 4671.55 4663.08 4656.57 4648.97P242 5185.46 NM 5181.76 5180.59 5181.43 5180.85 5183.07 5183.16 NM 5183.88 NM 5180.83 NM NMP243 5337.88 5334.28 5333.47 5332.1 5334.88 5333.87 5333.66 5333.22 5332.99 5332.96 5332.99 5332.06 5330.83 5414.24P244A 5630.54 5627.92 5627.76 5629.64 5630.76 5631.68 5631.44 5630.91 5630.69 5629.64 5628.74 5628.88 5629.83 5628.99P244B 5617.29 NM 5623.53 NM 5628.77 NM 5629.57 NM 5625.89 NM 5623.80 5624.03 5624.99 5624.11P244C 5616.40 NM 5619.38 NM 5628.03 NM 5629.84 NM 5623.40 NM 5619.95 5620.18 5621.27 5620.29P245 5471.19 5439.59 5434.23 5439.67 5438.36 5440.46 5446.14 5450.96 5452.34 5447.86 5444.11 5437.89 5435.33 5433.37P247A 4436.84 4421.1 4425.43 4418.26 4428.19 4418.04 4425.39 4419.42 4423.55 4418.48 4423.12 4421.57 4421.42 4420.16P248A 5252.83 5255.36 5250.13 5250.06 5249.62 5250.21 5250.28 5252.86 5250.79 5250.21 5248.29 5248.99 5248.65 5248.05P248B 5254.75 NM 5251.06 NM 5251.52 NM 5252.09 NM 5252.72 NM 5250.23 5250.85 5250.51 5249.86P248C 5261.77 NM 5255.04 NM 5257.36 NM 5257.77 Dry 5258.63 DRY 5256.08 5256.42 5255.89 5255.21P249A 4852.93 4828.14 DRY DRY DRY DRY DRY DRY DRY BLOCKED DRY DRY DRY DRYP249B 4852.96 NM 4827.81 NM NM NM NM NM NM NM BLOCKED BLOCKED BLOCKED BLOCKED
South Facilities Groundwater2010 Remedial Progress Report
April 2011B-6

Kennecott Utah Copper | Environmental Restoration Group
Well Sept 1996 April 2003 Sept 2003 April 2004 Sept 2004 April 2005 Sept 2005 April 2006 Sept 2006 April 2007 Sept 2007 Sept 2008 Sept 2009 Sept 2010P252A 4428.06 NM NM 4415.6 4421.31 4416.06 4418.42 4417.22 4419.45 4416.76 4419.04 4419.37 4417.87 4417.70P252B 4425.69 NM NM NM 4416.5 4413.23 4415.58 NM 4416.64 NM 4416.24 4416.01 4415.16 4414.81P252C 4428.94 NM NM NM 4419.26 4415.97 4418.24 NM 4419.36 NM 4419.00 4418.67 4417.98 4417.80P253A 4424.82 4412.96 4417.47 4410.79 4417.01 4410.55 4414.93 4411.47 4415.54 4411.02 4415.52 4414.47 4413.40 4412.34P253B 4415.09 NM 4415.15 NM 4414.83 NM 4413.06 NM 4413.43 NM 4413.02 4412.21 4411.35 4410.38P254A 4586.20 4576.9 4585.37 4576.52 4583.98 4575.95 4583.95 ABANDONED ABANDONED NM NM NM NM NMP254B 4590.73 NM 4590.45 NM 4590.13 NM 4590.07 ABANDONED ABANDONED NM NM NM NM NMP255A 4656.55 4627.71 4646.62 4626.26 4649.17 4625.40 4646.19 4626.00 4656.76 4630.47 4650.25 4651.81 4651.47 4656.01P255B 4654.97 NM 4642.99 NM 4644.86 NM 4642.39 NM 4651.34 NM 4646.21 4647.25 4642.60 4644.49P256 4602.82 4583.18 4597.67 4585 4596.64 4591.43 4594.92 4583.13 4595.80 4583.85 4595.21 4597.48 BLOCKED BLOCKEDP257 4647.26 4620.29 4623.5 4617.7 4621.61 4616.65 4622.28 4617.10 4624.54 4617.43 4626.95 4626.72 4630.00 4629.92P259 4423.48 4412.87 4413.8 4410.63 4416.26 4410.58 4414.42 4411.50 4415.31 4411.01 4415.24 4414.44 4413.73 4412.28P260 4598.96 4596.64 4599.3 4597.15 4600.07 4597.93 4601.19 4598.67 4602.08 4598.77 4601.35 4601.15 4602.44 4602.70P261 4608.15 4609.33 NM NM 4610.5 4611.30 4612.45 4614.73 4613.40 4616.56 4613.09 4613.02 4614.22 4614.20P262 4448.58 DRY 4439.5 DRY 4439.25 DRY DRY DRY DRY NM DRY DRY DRY DRYP263 4603.94 4594.58 4594.78 4589.41 4597.12 4588.86 4595.95 4589.38 4597.50 4590.15 4598.06 4598.56 4597.38 4598.63P264 4819.57 4802.76 4800.37 4797.23 4794.86 4791.11 4788.54 NM 4783.54 4781.00 4778.87 4773.43 4767.58 4762.20P267B 4788.73 4782.74 4779.27 4784.05 4777.3 4775.62 4769.00 4770.81 4763.84 NM 4756.88 4754.97 4753.61 4751.72P268 4907.53 4901.57 4900.08 4898.74 4898.22 4896.29 4895.02 NM 4893.46 4893.03 4897.05 DRY DRY DRYP269 DRY 5038.38 5041.8 5037.08 DRY DRY 5033.15 5032.92 DRY DRY DRY DRY DRY DRYP270 5388.54 5391.81 5381.31 5386.64 5380.7 5390.53 5385.23 5392.33 5383.63 5387.76 5379.32 5382.66 5385.00 5382.86P271 5440.34 5438.86 5438.05 5440.48 5438.66 5440.86 5440.02 5440.20 5439.61 5439.08 5438.45 5438.27 5438.49 5438.42P272 5540.28 5526.25 5524.86 5526.56 5526.66 5535.15 5534.89 5538.67 5534.66 5531.21 5528.83 5526.87 5527.44 5526.64P273 4918.79 NM NM 4906.14 4904.35 4900.15 4897.87 4893.61 4901.13 4887.81 4885.79 4881.58 4880.44 4880.54P274 5083.38 5082.36 5082.18 5081.99 5079.51 5081.31 5081.18 5081.15 5080.95 5080.72 5080.65 5079.93 5079.66 5079.07P277 4735.26 4708.83 4703.81 4696.78 4691.26 4685.28 4684.75 4677.87 4675.34 4674.51 4673.06 4664.92 4659.48 5238.26P279 4980.07 4939.48 4938.39 4930.37 4919.92 4902.57 4890.47 DRY DRY NM DRY DRY DRY 4655.03RVG1164Z NM ABANDONED ABANDONED ABANDONED ABANDONED ABANDONED ABANDONED ABANDONED ABANDONED ABANDONED ABANDONED ABANDONED ABANDONED ABANDONEDSRG945 5153.20 5151.48 NM 5150.96 NM 5149.46 5149.38 5150.41 5149.80 5149.63 5147.90 5145.18 5144.99 5143.15SRG946 5173.40 5168.76 NM 5165.58 NM 5165.61 5168.88 NM NM NM NM 5166.23 5168.48 5164.90W131A 4665.02 4634.22 4630.85 4630.24 4625.66 ABANDONED ABANDONED ABANDONED ABANDONED NM ABANDONED ABANDONED ABANDONED ABANDONEDW32 NM NM NM NM NM 5108.86 NM NM NM NM NM 5077.53 5072.51 5325.45W403 4801.32 4805.78 4806.26 4807.61 4795.88 4798.22 4785.71 4794.75 4781.42 4786.18 4775.68 4775.27 4776.77 4776.77WJG1154A 4612.49 4592.78 4584.4 4590.15 4577.53 4589.40 4585.00 4587.43 4575.07 4581.68 4568.38 4564.16 4562.72 4559.96WJG1154B 4612.58 NM 4580.21 NM 4577.56 NM 4584.30 NM 4575.15 NM 4568.45 4564.16 4562.69 4559.84WJG1154C 4613.23 NM 4584.4 NM 4577.12 NM 4584.11 NM 4575.31 NM 4568.86 4564.25 4562.83 4559.22WJG1169A 4733.58 4707.61 4704.4 4696.63 4690.9 4683.45 4678.41 4674.98 4672.16 4670.15 4667.74 4662.13 4654.47 DRYWJG1169B 4733.66 NM 4704.5 NM 4691.03 NM 4678.74 NM 4672.30 NM 4667.72 4662.24 4654.62 4650.27WJG1169C 4733.72 NM 4704.56 NM 4691.1 NM 4678.78 NM 4672.39 NM 4667.84 4662.23 4654.71 4650.33WJG1170A 4617.61 4591.93 4580.4 4589.35 4578.68 4589.91 4584.34 4587.26 4575.28 4580.45 4568.33 4566.03 DRY DRYWJG1170B 4617.64 NM 4580.25 NM 4578.38 NM 4584.07 NM 4575.09 NM 4568.24 4563.92 4562.50 4560.12WJG1170C 4617.77 NM 4580.11 NM 4578.28 NM 4583.65 NM 4574.89 NM 4567.94 4563.70 4562.21 4559.83WJG1171A 4607.15 4595.93 4576.65 4592.79 4573.28 4588.92 4588.90 4590.50 4573.56 4586.02 4566.27 4562.75 4559.76 4558.37WJG1171B 4604.75 NM 4576.36 NM 4572.47 NM 4588.83 NM 4571.21 NM 4565.65 4562.63 4558.38 4556.92WJG1171C 4604.23 NM 4576.4 NM 4572.42 NM 4589.04 BLOCKED 4570.93 BLOCKED 4565.68 4562.73 4558.15 4556.71WJG1980 4609.64 4592.75 4578.34 4592.94 4570.89 4589.49 4579.83 4586.60 NM NM NM NM NM NMWJG1981 4616.26 BLOCKED BLOCKED BLOCKED BLOCKED BLOCKED BLOCKED BLOCKED BLOCKED NM BLOCKED NM NM NMWJG2453 4591.02 4595.23 NM 4592.38 NM 4586.73 NM 4590.45 NM NM NM NM NM NMNM = Not MeasuredAll data density corrected.*=corrected from 2008 Data
South Facilities Groundwater2010 Remedial Progress Report
April 2011B-7

Kennecott Utah Copper Environmental Restoration Group
South Facilities Groundwater April 2011 2010 Remedial Progress Report
Appendix C
Tailings Monitoring Data

Kennecott Utah Copper | Environmental Restoration Group
DateTailings pH at North Splitter
Box (su)
Acid Water Pumping through
WDPS (gpm)
Concentrator Throughput
(TPH)
01/01/10 8.0 3654 761001/02/10 7.9 731 774701/03/10 9.7 1369 609001/04/10 9.6 2138 672601/05/10 8.0 3405 609101/06/10 8.3 2526 713801/07/10 8.0 3684 801201/08/10 8.0 3530 767901/09/10 8.1 3602 799901/10/10 8.0 3553 672901/11/10 7.9 3295 843501/12/10 7.5 3254 806801/13/10 7.5 3464 809901/14/10 7.2 3455 813801/15/10 Bad Data 3501 635801/16/10 Bad Data 3454 775401/17/10 Bad Data 3411 801301/18/10 Bad Data 3357 751201/19/10 Bad Data 1136 727501/20/10 Bad Data 77 664501/21/10 Bad Data 78 406801/22/10 Bad Data 2337 648301/23/10 Bad Data 3690 599401/24/10 Bad Data 3331 592501/25/10 Bad Data 3907 566201/26/10 Bad Data 4255 641001/27/10 Bad Data 3927 555601/28/10 Bad Data 3675 366501/29/10 Bad Data 3738 694901/30/10 Bad Data 3543 829401/31/10 7.8 3797 811902/01/10 7.7 3838 827302/02/10 7.8 3824 829302/03/10 8.0 3820 833802/04/10 7.7 3821 614902/05/10 7.8 3872 826602/06/10 7.8 3872 656702/07/10 8.0 3871 824002/08/10 8.0 3580 809202/09/10 12.3 3272 811602/10/10 12.1 3311 612802/11/10 8.1 3419 822102/12/10 8.2 3447 807902/13/10 8.0 3540 799002/14/10 8.0 3594 720802/15/10 8.2 3486 7386
Table C-1 Daily Tailings Monitoring Data 2010
South Facilities Groundwater2010 Remedial Progress Report
April 2011C-1

Kennecott Utah Copper | Environmental Restoration Group
DateTailings pH at North Splitter
Box (su)
Acid Water Pumping through
WDPS (gpm)
Concentrator Throughput
(TPH)
02/16/10 7.9 3557 611502/17/10 8.0 3406 699802/18/10 8.0 3256 824202/19/10 8.3 3086 646602/20/10 8.0 3120 762302/21/10 8.0 3106 770302/22/10 7.7 3067 538002/23/10 7.2 3065 562002/24/10 8.0 3065 539002/25/10 7.9 2631 557302/26/10 8.3 2696 563702/27/10 8.6 2635 790102/28/10 8.0 2647 794103/01/10 7.9 2634 780403/02/10 8.0 2634 819103/03/10 8.3 2062 781803/04/10 7.9 2679 675503/05/10 8.2 2673 648503/06/10 8.0 2589 804103/07/10 8.4 2575 785503/08/10 8.2 860 786803/09/10 Bad Data 73 617503/10/10 10.0 79 717003/11/10 10.0 1034 689003/12/10 8.5 2588 534303/13/10 8.5 2628 748503/14/10 8.4 2608 767003/15/10 8.5 2647 746803/16/10 8.5 726 764003/17/10 8.0 2304 1203/18/10 8.3 2644 538003/19/10 8.5 2232 742603/20/10 8.7 1769 749803/21/10 8.7 1719 730103/22/10 8.7 1743 495403/23/10 8.5 1764 553403/24/10 8.5 1244 462703/25/10 10.0 73 579503/26/10 10.0 1171 814603/27/10 8.6 2614 835903/28/10 8.7 2567 808803/29/10 8.7 2388 820303/30/10 8.3 2850 746603/31/10 8.3 2648 828304/01/10 8.5 2643 837004/02/10 7.9 2427 425404/03/10 8.3 2433 704504/04/10 8.5 2479 6844
South Facilities Groundwater2010 Remedial Progress Report
April 2011C-2

Kennecott Utah Copper | Environmental Restoration Group
DateTailings pH at North Splitter
Box (su)
Acid Water Pumping through
WDPS (gpm)
Concentrator Throughput
(TPH)
04/05/10 8.6 2502 656204/06/10 8.5 2485 501904/07/10 8.7 2618 787004/08/10 8.4 2442 510304/09/10 8.9 2377 802404/10/10 8.8 2365 633204/11/10 8.9 2351 690904/12/10 8.5 2455 778004/13/10 8.5 2739 763804/14/10 8.6 2484 686504/15/10 8.6 2307 818404/16/10 8.2 2312 694104/17/10 8.2 2301 826404/18/10 8.5 1628 573904/19/10 9.2 63 734004/20/10 7.5 65 784604/21/10 9.5 69 760004/22/10 9.6 75 751904/23/10 9.5 74 838804/24/10 9.5 71 833904/25/10 9.6 71 838304/26/10 9.7 71 851904/27/10 9.8 2106 824504/28/10 8.4 4197 805504/29/10 7.7 3976 666304/30/10 7.8 3973 765305/01/10 7.9 4035 840205/02/10 8.1 4193 577105/03/10 8.1 4102 832105/04/10 8.2 4416 751305/05/10 8.1 1207 811205/06/10 9.6 79 574805/07/10 9.7 78 788905/08/10 9.7 74 454105/09/10 9.7 72 793605/10/10 9.7 2747 798105/11/10 7.8 4358 797305/12/10 7.9 4418 606605/13/10 7.9 4298 801505/14/10 7.8 4276 745905/15/10 7.8 4305 804605/16/10 7.9 4268 798205/17/10 7.8 4171 784105/18/10 7.9 1205 760105/19/10 9.4 69 788105/20/10 9.3 68 803905/21/10 9.4 68 747005/22/10 9.5 72 6856
South Facilities Groundwater2010 Remedial Progress Report
April 2011C-3

Kennecott Utah Copper | Environmental Restoration Group
DateTailings pH at North Splitter
Box (su)
Acid Water Pumping through
WDPS (gpm)
Concentrator Throughput
(TPH)
05/23/10 9.6 73 772205/24/10 9.6 75 769505/25/10 9.5 1398 773505/26/10 7.9 4467 564705/27/10 8.1 4262 505005/28/10 7.8 4588 655005/29/10 7.8 4889 754505/30/10 8.2 4638 696305/31/10 7.9 4798 596906/01/10 7.9 4891 583806/02/10 8.0 4886 772806/03/10 7.6 4796 803806/04/10 8.0 4721 798206/05/10 8.0 4766 802806/06/10 8.5 4750 798406/07/10 7.8 4298 764606/08/10 8.0 4748 742906/09/10 8.0 4650 725306/10/10 8.0 4659 751906/11/10 8.0 4643 812306/12/10 8.1 4776 806006/13/10 7.9 4649 712106/14/10 7.8 79 524806/15/10 8.0 0 606/16/10 8.3 0 306/17/10 8.5 68 1106/18/10 8.6 4302 463406/19/10 7.7 3728 2106/20/10 7.5 5238 307706/21/10 7.6 4804 566106/22/10 8.0 4638 608606/23/10 7.9 4653 718706/24/10 7.7 4624 802606/25/10 7.6 4621 802006/26/10 7.8 4221 598506/27/10 7.8 3995 718106/28/10 8.1 3978 800506/29/10 7.9 3947 802506/30/10 8.0 3909 810207/01/10 7.9 3908 556807/02/10 7.8 3707 817107/03/10 8.1 3647 801107/04/10 7.8 3693 797107/05/10 8.1 3659 802107/06/10 8.1 2548 645207/07/10 7.8 3694 587907/08/10 7.9 3630 462107/09/10 8.0 3639 6028
South Facilities Groundwater2010 Remedial Progress Report
April 2011C-4

Kennecott Utah Copper | Environmental Restoration Group
DateTailings pH at North Splitter
Box (su)
Acid Water Pumping through
WDPS (gpm)
Concentrator Throughput
(TPH)
07/10/10 7.9 3593 803307/11/10 8.2 3522 718407/12/10 8.0 2794 727807/13/10 8.0 3596 812107/14/10 7.8 3583 802807/15/10 7.9 3502 798707/16/10 8.1 3664 795807/17/10 8.0 3821 797607/18/10 8.1 3761 706907/19/10 8.1 3773 830707/20/10 8.2 3709 703407/21/10 7.9 3685 662307/22/10 7.9 3607 720607/23/10 8.3 3564 700307/24/10 8.1 3593 693107/25/10 8.2 3668 813907/26/10 8.0 3873 788907/27/10 8.5 4164 599207/28/10 8.3 4602 761507/29/10 8.0 4700 599707/30/10 8.5 4761 760007/31/10 7.9 4765 599308/01/10 8.2 4806 701508/02/10 7.9 4757 791008/03/10 7.9 4794 735008/04/10 8.0 4734 735308/05/10 7.9 4862 699408/06/10 8.1 4671 750608/07/10 8.0 4673 759508/08/10 8.1 4646 802408/09/10 8.0 4614 782008/10/10 7.9 4618 766808/11/10 7.6 4601 779508/12/10 6.3 4570 574508/13/10 6.4 4374 797308/14/10 6.7 3748 749608/15/10 6.7 3190 628208/16/10 7.1 3587 644008/17/10 6.4 3233 701308/18/10 6.7 3454 586608/19/10 6.7 3381 631508/20/10 7.3 2489 584908/21/10 7.4 4135 782408/22/10 7.3 4118 558108/23/10 7.2 4103 780508/24/10 7.9 4147 713008/25/10 8.0 4104 639808/26/10 8.3 4110 6036
South Facilities Groundwater2010 Remedial Progress Report
April 2011C-5

Kennecott Utah Copper | Environmental Restoration Group
DateTailings pH at North Splitter
Box (su)
Acid Water Pumping through
WDPS (gpm)
Concentrator Throughput
(TPH)
08/27/10 8.4 4178 824808/28/10 8.0 4119 818308/29/10 8.1 4107 799308/30/10 8.0 4166 598608/31/10 7.2 4096 300609/01/10 6.8 3698 416509/02/10 7.6 3972 356809/03/10 8.1 3937 490209/04/10 7.8 3934 689309/05/10 7.8 3954 826309/06/10 7.9 3972 786909/07/10 8.2 3931 738609/08/10 8.0 3854 789509/09/10 8.1 3706 705809/10/10 8.1 4535 712409/11/10 7.9 4034 674009/12/10 8.1 3909 641809/13/10 8.3 4057 714209/14/10 7.1 4457 743509/15/10 6.8 2097 757909/16/10 8.1 4258 574309/17/10 7.1 4393 595509/18/10 7.2 4483 790109/19/10 7.4 4445 772309/20/10 7.4 4495 749109/21/10 6.9 4454 748509/22/10 7.0 4122 749709/23/10 7.1 3390 605109/24/10 7.1 3805 726209/25/10 7.3 3787 753109/26/10 7.3 3764 547709/27/10 7.3 3574 609509/28/10 7.1 No Data 441309/29/10 7.0 No Data 462209/30/10 7.0 No Data 595610/01/10 6.8 No Data 608510/02/10 7.0 No Data 806510/03/10 7.0 No Data 819310/04/10 7.2 3767 753810/05/10 8.1 3932 283910/06/10 8.4 4206 813010/07/10 8.1 4104 746010/08/10 8.2 4092 601210/09/10 8.2 4134 552910/10/10 8.0 4093 764710/11/10 7.9 4096 697410/12/10 8.2 4074 683210/13/10 8.4 3898 6637
South Facilities Groundwater2010 Remedial Progress Report
April 2011C-6

Kennecott Utah Copper | Environmental Restoration Group
DateTailings pH at North Splitter
Box (su)
Acid Water Pumping through
WDPS (gpm)
Concentrator Throughput
(TPH)
10/14/10 7.7 4105 515810/15/10 8.4 4080 733110/16/10 8.2 4093 691510/17/10 8.2 4048 809710/18/10 8.2 4067 780210/19/10 7.6 4073 700810/20/10 8.0 4018 391810/21/10 7.8 4034 566010/22/10 7.8 4018 535710/23/10 7.8 3958 667710/24/10 7.8 3695 730810/25/10 8.4 1814 668110/26/10 8.0 1778 736710/27/10 8.0 1665 599210/28/10 7.8 1705 602310/29/10 8.3 1594 333410/30/10 8.4 1930 573810/31/10 8.1 1744 756511/01/10 8.3 1595 543211/02/10 8.4 1780 724811/03/10 8.4 3040 819811/04/10 7.9 3763 769311/05/10 7.9 3980 791311/06/10 7.7 4022 689711/07/10 7.9 3988 684311/08/10 7.9 3707 752111/09/10 8.0 3688 598711/10/10 8.1 2345 802411/11/10 8.0 3840 651711/12/10 8.0 4595 625711/13/10 7.4 4088 737411/14/10 8.1 3712 764011/15/10 8.3 3324 756211/16/10 8.3 2877 676911/17/10 8.0 3203 723311/18/10 7.9 3385 661411/19/10 8.5 3294 798611/20/10 8.3 0 757311/21/10 8.2 0 784411/22/10 8.2 0 719611/23/10 8.9 3164 694311/24/10 8.7 3828 600111/25/10 7.9 3405 424111/26/10 8.5 3345 598711/27/10 8.9 3389 643211/28/10 8.9 3343 643011/29/10 8.7 3138 609311/30/10 8.8 3100 6544
South Facilities Groundwater2010 Remedial Progress Report
April 2011C-7

Kennecott Utah Copper | Environmental Restoration Group
DateTailings pH at North Splitter
Box (su)
Acid Water Pumping through
WDPS (gpm)
Concentrator Throughput
(TPH)
12/01/10 8.8 3105 400712/02/10 8.4 3106 626212/03/10 8.6 3849 741112/04/10 7.6 4160 594112/05/10 8.2 3447 788712/06/10 8.4 3196 748112/07/10 8.7 2618 748012/08/10 8.7 3522 703212/09/10 8.6 2133 704512/10/10 8.5 2104 522712/11/10 8.3 4794 803212/12/10 8.3 3863 826012/13/10 8.7 2234 698712/14/10 8.7 2109 767812/15/10 8.2 1070 577612/16/10 9.3 1116 559112/17/10 7.3 3889 564012/18/10 7.2 4017 822112/19/10 8.0 3537 809312/20/10 7.8 3419 827412/21/10 8.9 3436 830912/22/10 9.2 2916 741912/23/10 9.1 4935 658912/24/10 9.0 3918 729012/25/10 9.4 3637 699612/26/10 9.2 3554 797012/27/10 9.4 2242 777512/28/10 8.3 2078 774812/29/10 8.0 2444 773512/30/10 8.0 2780 582112/31/10 7.4 5004 4784
South Facilities Groundwater2010 Remedial Progress Report
April 2011C-8

Kennecott Utah Copper | Envionmental Restoration Group
Site DatepH SU
TDS (mg/L)
Alk (mg/L as CaCO3)
Ca-T (mg/L)
Mg-T (mg/L)
Cl (mg/L)
SO4 (mg/L)
Al-D (mg/L)
Cd-D (mg/L)
Cu-D (mg/L)
Fe-D (mg/L)
Mn-D (mg/L)
Zn-D (mg/L)
BCP2739 1/13/2010 8.63 7270 63 904 147 2230 2480 <0.1 0.004 0.039 <0.02 0.5 0.031BCP2739 2/18/2010 8.42 6950 55 872 154 2170 2520 <0.1 0.005 0.044 <0.02 0.72 0.022BCP2739 3/17/2010 8.58 7070 60 864 143 2180 2420 0.055 0.006 0.042 <0.02 0.44 0.036BCP2739 4/22/2010 8.39 6820 49 931 128 2260 2370 0.027 0.004 0.039 <0.02 0.22 0.015BCP2739 5/20/2010 8.40 6900 39 867 115 2110 2380 <0.1 0.004 0.027 <0.02 0.26 <0.01BCP2739 6/24/2010 8.19 7170 47 904 136 2410 2490 <0.1 0.001 0.068 <0.02 0.27 0.021BCP2739 7/21/2010 8.42 7650 44 929 95.4 2300 2490 0.038 0.005 0.041 <0.02 0.354 0.023BCP2739 8/19/2010 7.82 7860 46 987 110 2660 2680 0.033 0.006 0.066 <0.02 0.366 0.018BCP2739 9/21/2010 8.64 7510 33 969 112 2800 2690 <0.1 0.006 0.021 <0.02 0.41 0.015BCP2739 9/23/2010 7.39 8200 49 991 119 2830 2500 <0.1 0.006 0.099 <0.02 0.59 0.014BCP2739 10/21/2010 8.11 7660 42 899 124 2590 2580 <0.1 0.006 0.074 <0.02 0.5 0.026BCP2739 11/18/2010 8.19 7130 48 900 137 2220 2370 <0.1 0.005 0.054 <0.02 0.54 0.028BCP2739 12/9/2010 8.08 7310 58 944 143 2260 2420 <0.1 0.004 0.051 <0.02 0.5 0.022BCP2750 1/13/2010 9.81 7010 21 988 79 2160 2430 <0.1 <1e-005 <0.015 <0.02 <1e-005 <0.02BCP2750 2/18/2010 9.78 6740 21 1010 62 2190 2470 <0.1 <1e-005 <0.015 <0.02 <1e-005 <0.02BCP2750 3/17/2010 9.68 6760 22 947 88 2120 2260 <0.1 <1e-005 <0.015 <0.02 <1e-005 <0.02BCP2750 4/22/2010 9.47 6620 28 1050 41 2260 2320 <0.1 <1e-005 <0.015 <0.02 <1e-005 <0.02BCP2750 5/20/2010 9.31 6840 24 1000 52 2020 2130 <0.1 <1e-005 <0.015 <0.02 <1e-005 <0.02BCP2750 6/24/2010 9.46 7070 22 983 69 2340 2600 <0.1 <1e-005 <0.015 <0.02 <1e-005 <0.02BCP2750 7/21/2010 9.19 6490 163 1060 29 2100 2430 <0.1 <1e-005 <0.015 <0.02 <1e-005 <0.02BCP2750 8/19/2010 9.65 7190 33 1130 9.1 2530 2520 0.1 <0.005 <0.015 0.021 <0.005 <0.02BCP2750 9/23/2010 7.40 7810 27 1100 39 2720 2420 <0.1 <1e-005 <0.015 <0.02 <1e-005 <0.02BCP2750 10/21/2010 9.40 7100 36 1060 31.4 2460 2480 <0.1 <1e-005 0.036 <0.02 <1e-005 <0.02BCP2750 11/18/2010 9.61 6560 71 1070 61 2140 2200 <0.1 <1e-005 0.025 <0.02 <1e-005 <0.02BCP2750 12/9/2010 9.40 6660 188 1050 88 2370 2380 <0.1 <1e-005 <0.015 <0.02 <1e-005 <0.02BYP2535 1/13/2010 8.14 8360 70 1160 271 2010 3530 0.18 0.004 <0.02 <0.02 1.75 0.016MCP2536 1/13/2010 8.11 8210 68 1130 270 1960 3460 0.24 <1e-005 <0.015 <0.02 1.61 <0.02MCP2536 2/18/2010 7.97 8180 56 950 355 1980 3370 <0.1 <1e-005 <0.015 0.068 3.82 <0.02MCP2536 3/17/2010 9.45 6380 28 780 110 1940 2420 <0.1 <1e-005 <0.015 <0.02 <1e-005 <0.02MCP2536 4/22/2010 9.41 2650 <5 291 13 790 956 <0.1 <1e-005 <0.015 0.02 <1e-005 <0.02MCP2536 5/20/2010 8.56 6620 11 895 49 1960 2310 <0.1 <1e-005 <0.015 <0.02 0.01 <0.02MCP2536 6/24/2010 7.67 7580 413 829 336 2010 3170 0.19 <1e-005 <0.015 0.29 6.92 <0.02MCP2536 7/21/2010 7.79 6510 239 958 38 2080 2500 <0.1 <1e-005 <0.015 0.19 0.036 <0.02MCP2536 8/19/2010 8.43 6890 88 1130 121 2250 2510 <0.1 <1e-005 <0.015 <0.02 0.34 <0.02MCP2536 9/23/2010 7.40 7610 76 886 306 2280 3320 <0.1 <1e-005 <0.015 <0.02 6.71 <0.02MCP2536 10/21/2010 7.41 6970 45 859 319 1980 3260 <0.1 <1e-005 0.022 0.152 12.8 <0.02MCP2536 11/18/2010 7.39 7620 87 898 432 1710 3370 0.115 <0.01 <0.015 0.256 22 0.021MCP2536 12/9/2010 9.44 7030 471 1020 82 2290 2410 <0.1 <1e-005 <0.015 0.038 <1e-005 <0.02
Table C-2 Monthy Tailings Aqueous Chemistry Monitoring Data 2010
South Facilities Groundwater2010 Remedial Progress Report
April 2011C2-1


