73
Appendix 1 Kent County Council Quarterly Performance Report Quarter 1 2014/15 Produced by: KCC Business Intelligence E-mail: [email protected] Phone: 01622 221985

Appendix 1
Kent County Council
Quarterly Performance Report
Quarter 1
2014/15
Produced by: KCC Business Intelligence E-mail: [email protected] Phone: 01622 221985

Appendix 1
1
Table of Contents
Key 2 Executive Summary 3 Customer Services and Contact 8 Economic Development 16 Environment, Planning and Enforcement 20 Highways and Transportation 23 Waste Management 27 Libraries, Registration and Archives 30 Education, Quality and Standards 32 Education, Planning and Access 37 Early Help and Preventative Services 40 Children’s Safeguarding 44 Corporate Parenting 49 Adult Social Care 54 Public Health 60 Corporate Risk Register 64 Organisational Development 68

Appendix 1
2
Key to KPI Ratings used
This report includes 40 Key Performance Indicators (KPIs), where progress is assessed against Targets which are set at the start of the financial year through the Council’s Strategic Priority Statements. Progress against Target is assessed by RAG (Red/Amber/Green) ratings. Progress is also assessed in terms of Direction of Travel (DoT) through use of arrows.
GREEN Target has been achieved or exceeded
AMBER Performance at acceptable level, below Target but above Floor
RED Performance is below a pre-defined Floor Standard *
Performance has improved relative to targets set
Performance has worsened relative to targets set
Performance has remained the same relative to targets set
N/A Not available * Floor Standards represent the minimum level of acceptable performance.
Key to Activity Indicator Graphs Alongside the Key Performance Indicators this report includes a number of Activity Indicators which present demand levels for services or other contextual information. Graphs for activity indicators are shown either with national benchmarks or in many cases with Upper and Lower Thresholds which represent the range we expect activity to fall within. Thresholds are based on past trends and other benchmark information. If activity falls outside of the Thresholds, this is an indication that demand has risen above or below expectations and this may have consequences for the council in terms of additional or reduced costs. Activity is closely monitored as part of the overall management information to ensure the council reacts appropriately to changing levels of demand.
Data quality note All data included in this report for the current financial year is provisional unaudited data and is categorised as management information. All current in-year results may therefore be subject to later revision.

Appendix 1
3
Executive Summary (1)
Customer Services and Contact KPI Summary GREEN AMBER RED
Customer Services and Contact 2 1 1
TOTAL 2 1 1
The percentage of calls answered by Contact Point (KCC’s call centre) was behind target during the last quarter, due to increased length of call duration and staff shortages. Despite this the caller satisfaction with Contact Point advisors remained very high. Complaints handling and percentage of residents feeling informed both improved in the quarter. Call volumes handled by Contact Point continue to show reductions over time with increased digital take-up and use of the web-site by residents. However, average handling time for calls have been constantly increasing over time as routine simple enquiries and transactions are dealt with online, and with Contact Point now dealing with a higher proportion of more complex calls for services such as Adult Social Care and Specialist Children’s Services. Top three Services for contacts to Contact Point
Figures in thousands of telephone calls 3 months to June 2014
12 Months to June 2014
Adult Social Care 42 140 Highway Services 28 125 Specialist Children’s Services 27 90
Top three Transactions completed online – 3 months to June 2014
Number of
transactions completed
Percentage completed
Online/Digital Renew a library book (count of books renewed) 185,444 95%
Report a Highways Fault 23,729 43%
Book a Birth/Death Registration appointment 8,493 50%

Appendix 1
4
Executive Summary (2)
Growth, Environment and Transport KPI Summary GREEN AMBER RED Economic Development 2 1
Environment, Planning and Enforcement 1
Highways and Transportation 4
Waste Management 2
Libraries, Registration and Archives 1 1
TOTAL 9 2 1 Economic Development: Cumulative committed job creation from the Regional Growth Fund and other Economic Development activity remains ahead of target, as does approval of applications for the Expansion East Kent Fund. Although approval of applications for the Tiger and Escalate schemes was lower than expected in the most recent quarter, there are sufficient applications in the pipeline to bring this combined scheme back on track during the next quarter. There are good signs of economic recovery across a range of external context indicators. Environment, Planning and Enforcement: Business mileage for all KCC staff showed an increase during the last financial year compared to a target set for a 5% reduction, which has had a negative impact on our achievement of carbon emission reductions. Highways and Transportation: Operational targets for timeliness of Highways Maintenance works continues to be ahead of target as does resident satisfaction with routine works and programmed schemes. Following an exceptionally high level of requests for maintenance works during the quarter to March 2014, work in progress levels are now back within the expected normal range due to extra activity in the quarter to June to address the previous high levels of demand. Waste Management: Performance for diversion of waste from landfill and recycling levels achieved at Household Waste Recycling Centres both remain ahead of target. Waste tonnage however has increased for the third consecutive quarter and is now above expected levels. Libraries, Registration and Archives: Results for the new satisfaction surveys for Libraries, Registration and Archives were ahead of target for Registrations but behind target for Libraries. Visitor numbers and book issues have both been low and below expectations so far this year, with the number of ceremonies conducted at similar levels to last year.
Appendix 1
5
Executive Summary (3)
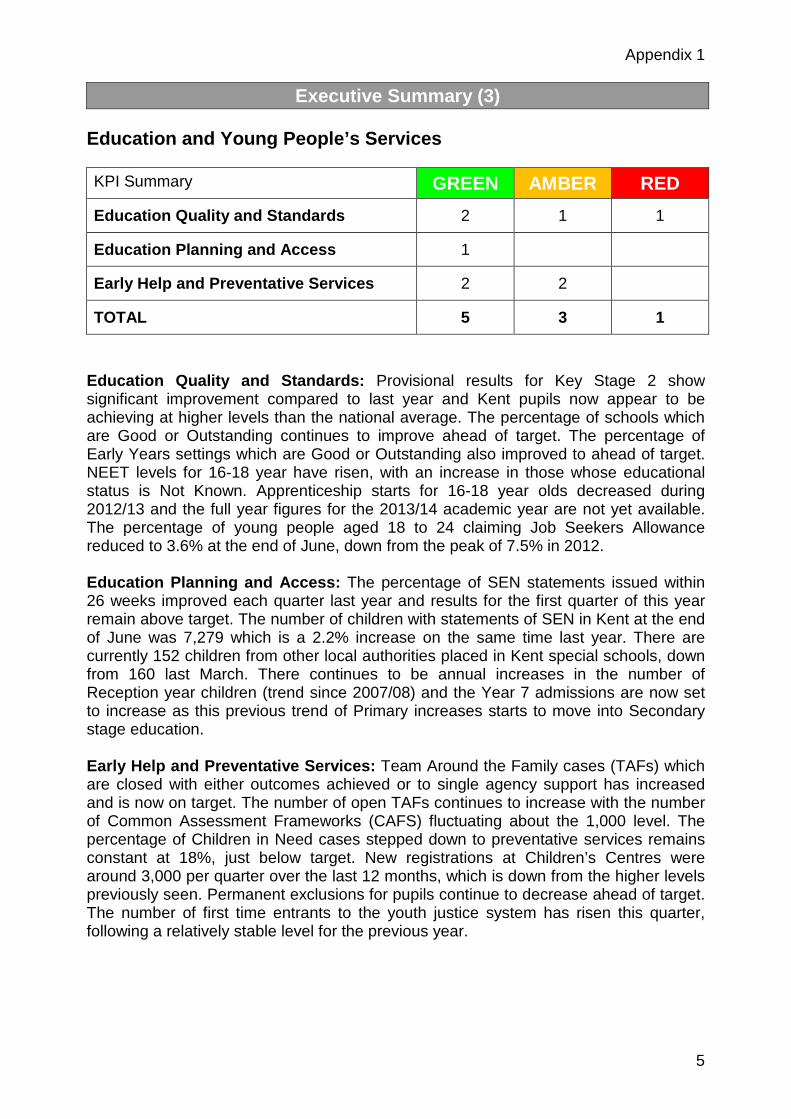
Education and Young People’s Services KPI Summary GREEN AMBER RED Education Quality and Standards 2 1 1
Education Planning and Access 1
Early Help and Preventative Services 2 2
TOTAL 5 3 1 Education Quality and Standards: Provisional results for Key Stage 2 show significant improvement compared to last year and Kent pupils now appear to be achieving at higher levels than the national average. The percentage of schools which are Good or Outstanding continues to improve ahead of target. The percentage of Early Years settings which are Good or Outstanding also improved to ahead of target. NEET levels for 16-18 year have risen, with an increase in those whose educational status is Not Known. Apprenticeship starts for 16-18 year olds decreased during 2012/13 and the full year figures for the 2013/14 academic year are not yet available. The percentage of young people aged 18 to 24 claiming Job Seekers Allowance reduced to 3.6% at the end of June, down from the peak of 7.5% in 2012. Education Planning and Access: The percentage of SEN statements issued within 26 weeks improved each quarter last year and results for the first quarter of this year remain above target. The number of children with statements of SEN in Kent at the end of June was 7,279 which is a 2.2% increase on the same time last year. There are currently 152 children from other local authorities placed in Kent special schools, down from 160 last March. There continues to be annual increases in the number of Reception year children (trend since 2007/08) and the Year 7 admissions are now set to increase as this previous trend of Primary increases starts to move into Secondary stage education. Early Help and Preventative Services: Team Around the Family cases (TAFs) which are closed with either outcomes achieved or to single agency support has increased and is now on target. The number of open TAFs continues to increase with the number of Common Assessment Frameworks (CAFS) fluctuating about the 1,000 level. The percentage of Children in Need cases stepped down to preventative services remains constant at 18%, just below target. New registrations at Children’s Centres were around 3,000 per quarter over the last 12 months, which is down from the higher levels previously seen. Permanent exclusions for pupils continue to decrease ahead of target. The number of first time entrants to the youth justice system has risen this quarter, following a relatively stable level for the previous year.

Appendix 1
6
Executive Summary (4)
Social Care, Health and Well Being KPI Summary GREEN AMBER RED Children’s Safeguarding 1 1 1
Corporate Parenting 2 1
Adult Social Care 3 2 1
Public Health 3
TOTAL 9 4 2 Children’s Safeguarding: There continues to be high vacancy rates for qualified social workers, with 20.1% of the posts being filled by Agency staff. The percentage of Case File Audits judged as adequate or better declined in the quarter following work to ensure consistent judgements are being applied. Referrals to the service reduced slightly in the quarter but remain high and the number of Children in Need cases also decreased, remaining within the expected range. The number of children with Child Protection Plans increased slightly and numbers are at the higher end of the expected range. The number of children who become subject to a Child Protection Plan for a second or subsequent time continues to be at optimal best practice levels. Corporate Parenting: The adoption rate at 25.2% for the first quarter of the year was significantly ahead of target. The percentage of children in KCC Foster Care is above target and use of Independent Fostering Agencies decreased this quarter. Placement stability for children who have been in care for more than two and a half years is currently below target. The number of Kent Children in Care reduced by 27 in the quarter to 1,597, and the number of Children in Care placed in Kent by other Local Authorities increased to 1,261. Adult Social Care: Challenging stretch targets have been set for the year to drive continuous performance improvement. There has been good improvement in the number of contacts resolved at first point of contact, although the rating for the indicator dropped from Green to Amber, due to the level of the stretch target for this indicator. The number of clients with a Telecare service and the number of enablement referrals both continue to increase ahead of target. There was a significant reduction in new admissions for older people to residential and nursing care in the quarter. Results for the new indicator for Promoting Independence Reviews completed were significantly below target and this is expected to improve to target level from October. Public Health: Targets for delivery of NHS Health Checks, smoking quits and access to sexual health (GUM) services were all met. There has been with a reduction in the gap in premature mortality between Thanet and Sevenoaks in recent years. Teenage pregnancy (under-18 year old conceptions rate) continues to reduce and the proportion of children within the healthy weight range was higher in Kent than national proportions in 2012 and 2013.

Appendix 1
7
Executive Summary (5)
Corporate Risks
Low Risk Medium Risk High Risk
Current risk level 0 9 5
Target risk level 4 10 0 A summary of mitigating actions for current High Risk areas is provided below with further details of progress against mitigating actions for all corporate risks provided later in this report. Management of adult social care demand: The Care Act is likely to have considerable impact on demand for services. A Care Act Programme has been established to ensure KCC is well placed to deliver its new responsibilities and that Kent residents who need social care, their carers and local providers are able to take advantage of the new developments. Initial analysis has also been conducted to identify the likely extent of demand for Deprivation of Liberty Assessments, another potential source of increased demand. Management of demand on specialist children’s services: A programme to deliver integrated Early Help and Preventative Services for 0-19 year olds and their families is underway. Diagnostic work has been conducted with the aid of an efficiency partner, aiming to ensure an improved and measurable impact of Early Help Services on Specialist Children’s Services demand. A design phase is now being developed. Future operating environment for local government: Local authorities nationally are facing increasing pressures as public sector austerity measures will continue well into the next parliament. KCC’s response is its “Facing the Challenge” Transformation Programme, which is continuing apace with progress updates regularly reported to County Council. Work undertaken so far includes completion of phase 1 service reviews and market engagement, the launch of a new Leadership and Management Framework to address identified gaps in key skills and the establishment of four change portfolios to enable a clear and single view of all the change activity taking place across the council. Health & Social Care Integration - Better Care Fund (BCF): Government announced in July 2014 that over 25% of the total BCF monies are being held back and ring-fenced to support acute hospital trusts where BCF activity fails to achieve targets to reduce emergency hospital admissions, which moves the burden of risk from hospitals into other sectors such as social care. KCC is assessing the implications of this change and will contribute to the integrated plan being submitted to the Kent Health and Wellbeing Board in September. Delivery of 2014/15 savings: With public sector austerity measures ongoing, KCC still needs to make ongoing year-on-year savings to balance its books, which is becoming increasingly challenging. Management action plans are being devised to address potential budget issues in several areas.

Appendix 1
8
Customer Service and Contact - Overview
Cabinet Member Bryan Sweetland Director Barbara Cooper (Interim)
The percentage of calls answered by Contact Point (KCC’s call centre) was behind target during the last quarter, due to increased length of call duration and staff shortages. Despite this the caller satisfaction with Contact Point advisors remained very high. Complaints handling and percentage of residents feeling informed both improved in the quarter. Indicator Description
Previous Status
Current Status DOT
Percentage of phone calls to Contact Point which were answered GREEN RED
Caller satisfaction with Contact Point advisors AMBER GREEN Percentage of complaints responded to within timescale AMBER AMBER Percentage of residents who feel informed about council services AMBER GREEN
To address staff shortages in Contact Point, recruitment has been undertaken for replacement staff, with 12 new staff employed, and following induction and training they will be fully deployed on call answering in August. There is acknowledgement that current transformation activity across the council is increasing telephone contact volumes in the short term for some service areas, with a need to better coordinate internal and external public messages to minimise additional contacts being generated. Meetings have been held with key services, to improve the quality and timeliness of communication regarding proposed changes to services. The Unified Communications programme and the relocation of staff under the New Ways of Working programme are also having an impact on call volumes being handled by Contact Point in the short term, as staff direct-dial phone numbers change. Current technology supporting Contact Point is outdated and a new Cloud telephony system has been procured and is currently in the implementation phase. This will improve caller experience, call quality and the resilience of the service, including increasing the potential for home working. An End to End Customer Services review is in hand to identify where improvements can be made to reduce call volumes and call handling times, by making better use of technology, both on the KCC web-site and within internal business processes. Any follow up actions will be taken forward in the context of a new council-wide Customer Service Policy, currently being drafted for County Council approval. Contact Point and Digital Services together form Lot 3 of a Notice for Competitive Dialogue, placed in the Official Journal of the European Union (OJEU). The Pre-Qualification Questionnaire stage closed on 31st July.

Appendix 1
9
Customer Service and Contact - KPIs
Percentage of phone calls to Contact Point which were answered RED
7580859095
100
Mar 13 Jun 13 Sep 13 Dec 13 Mar 14 Jun 14 Sep 14
Target Actual Mar 13 Jun 13 Sep 13 Dec 13 Mar 14 Jun 14 Sep 14 Actual 95% 97% 97% 97% 96% 82% Target 90% 90% 90% 90% 90% 90% 90%
Our performance in call answering at Contact Point was at a low level behind target in the quarter. Performance was affected by long call duration and a current staff shortage. There was continuing high demand for services such as highways and increasing contacts resulting from consultation exercises and service changes such as the HomeCare re-tender for Adult Social Care. Additional staff have been recruited to ensure sufficient resource is available to match current demand levels and performance should improve from August. Percentage of callers to Contact Point who rated the advisor who dealt with their call as good ***
GREEN
85
90
95
100
Mar 13 Jun 13 Sep 13 Dec 13 Mar 14 Jun 14 Sep 14Target Actual
Mar 13 Jun 13 Sep 13 Dec 13 Mar 14 Jun 14 Sep 14 Actual 93% 95% 94% 94% 94% 97% Target 96% 96% 96% 96% 96% 95% 95%
Despite the low answer rate by Contact Point in the quarter, customer satisfaction with the Advisor remains very high. There has been a great deal of feedback relating to the excellence of the Advisors for their customer service skills and knowledge of Council services. *** Note that the indicator definition has changed this year. Last year callers were asked about the overall service delivered, but for this year the question is specifically about the Contact Point advisor.

Appendix 1
10
Customer Service and Contact - KPIs
Percentage of complaints responded to within timescale AMBER
70
75
80
85
90
Mar 13 Jun 13 Sep 13 Dec 13 Mar 14 Jun 14 Sep 14Target Actual
Mar 13 Jun 13 Sep 13 Dec 13 Mar 14 Jun 14 Sep 14 Actual 85% 86% 89% 79% 81% 84% Target 85% 85% 85% 85% 85% 85% 85% Complaints are now being responded to close to the target level after two quarters of lower performance on this indicator.
Percentage of residents who feel informed about council services GREEN
25
35
45
55
65
Mar 13 Jun 13 Sep 13 Dec 13 Mar 14 Jun 14 Sep 14Target Actual
Mar 13 Jun 13 Sep 13 Dec 13 Mar 14 Jun 14 Sep 14 Actual 45% 48% 47% 52% 47% 50% Target 55% 55% 55% 55% 55% 50% 50% The percentage of residents who feel informed increased in the quarter and was at the target level set for the year. 16-24 year-olds feel much more informed than any other age group. Results are from a telephone tracker survey with a sample size of 600 residents each quarter. Data is weighted by demographic information.

Appendix 1
11
Customer Service and Contact – Contact Activity
Call volumes handled by Contact Point continue to show reductions over time with increased digital take-up and use of the KCC web-site by residents. However average handling time for calls have been constantly increasing over time as routine simple enquiries and transactions are dealt with online, and with Contact Point now dealing with a higher proportion of more complex calls. Average call handling time per call increased 15% in the last 12 months, whereas the number of calls handled only reduced by 8.5% (this quarter compared to same quarter last year). Website visitor numbers in the quarter were at their lowest level since the quarter to December 2012. Reasons for this are currently unknown, although there is evidence from some services that residents are finding the information they want more quickly on our new website which went live in March, reducing the need for repeat visits. We expect the web-site visits to show increased traffic as the year progresses and further enhancements are made to the online offer.
Number of phone calls responded to by Contact Point - by quarter
160,000
180,000
200,000
220,000
240,000
260,000
Mar 12 Sep 12 Mar 13 Sep 13 Mar 14 Sep 14 Mar 15Actual Lower Threshold Upper Threshold
Average call handling time by Contact Point - by quarter
120
150
180
210
240
Mar 12 Sep 12 Mar 13 Sep 13 Mar 14 Sep 14 Mar 15Actual
Number of visits to the KCC web-site each quarter (in thousands)
800
1,000
1,200
1,400
1,600
Mar 12 Sep 12 Mar 13 Sep 13 Mar 14 Sep 14 Mar 15Actual Lower Threshold Upper Threshold

Appendix 1
12
Customer Service and Contact – Contact Activity
Number of phone calls and e-mails to Contact Point by service area (thousands)
Note that figures for the period July to September 2013 are not directly comparable to the subsequent figures as the phone numbers were changed in October 2013. Although Contact Point dealt with 12.7% less enquiries than the previous quarter and on an annual basis overall contacts were down 6.8% year on year, as noted above, average call handling times have increased 15% year on year. Nearly all services are experiencing reduced telephone volumes year on year, with the major exceptions being Adult Social Care and Children’s Social Care, where for both services the digital offer is currently very limited. Both services are now also dealing with fewer phone calls directly and more phone calls for these services are now initially being handled within Contact Point. The increase in Adult Social Care calls volumes in the last two quarters has also been driven by the Home Care tender, with many calls being received specifically on this issue.
Service area Jul - Sep
Oct - Dec
Jan - Mar
Apr - Jun Total Prev.
Year Adult Social Care 36 25 37 42 140 116 Highway Services 30 30 39 28 125 110 Children’s Social Services 14 23 27 27 90 53 Main Enquiry Line 21 16 17 12 67 85 Education and Early Years 16 14 14 15 59 85 Registration Services 16 15 15 11 57 71 Libraries and Archives 20 13 12 10 54 82 Blue Badges 11 8 9 9 38 48 Transport Services 17 7 7 6 37 49 Other services 11 9 9 7 37 70 Speed awareness 9 8 9 9 34 28 Adult Education 12 7 7 5 32 33 Waste & recycling 5 4 4 4 17 19 Total Calls (thousands) 217 177 207 185 787 849 e-mails handled 9 10 14 8 41 39 Total Contacts (thousands) 226 187 221 193 828 888
Numbers will not add exactly due to rounding. Previous year data is for the 12 months to June 2013. Phone calls for the Social Fund (KSAS) are not included in the above figures. Out of hours calls are allocated 75% to children’s social care, 15% for Highways and 10% Other.

Appendix 1
13
Customer Service and Contact – Digital Takeup
The table below shows the digital/online transaction completions for Key Service Areas during the quarter April 2014 to June 2014.
Transaction type Percentage
Online Transactions Completed
Renew a library book ** 95% 185,444
Report a Highways Fault 43% 23,729
Book a Birth/Death Registration appointment 50% 8,493
Book a Speed Awareness Course *** 75% 7,003
Apply for or renew a Blue Badge 27% 6,535
Apply for a Young Person’s Travel Pass 77% 4,464
Report a Public Right of Way Fault 48% 2,470
Apply for a Concessionary Bus Pass **** 13% 1,647
Apply for a HWRC recycling voucher 85% 888
Apply for Regional Growth Fund loan ***** 100% 695 ** Library issue renewals transaction data is currently based on individual loan
items and not count of borrowers. *** Speed Awareness transaction data is for April and May only. **** Concessionary Bus pass transaction data is for June only. ***** Regional Growth Fund figures are cumulative since the start of the scheme.

Appendix 1
14
Customer Service and Contact – Complaints monitoring
After showing a reduction quarter on quarter for over a period of a year, the numbers of complaints received have been increasing in the last two quarters and are now close to the previous peak period of the quarter to September 2012. Increases in complaints are driven mostly by Highways and Transportation which generates the most complaints from residents. Following the flooding earlier in the year and the damage to the highway network we have also received a high volume of complaints relating to processing of insurance claims from residents for damage caused as a result of the poor condition on the road network.
Number of complaints received each quarter
0200400600800
1,0001,200
Mar 12 Sep 12 Mar 13 Sep 13 Mar 14 Sep 14 Mar 15
On a rolling 12 month basis, for the year to June 2014 the number of complaints showed a 13.9% increase compared to the year to March 2014.
Service 12 mths to Mar 14
12 mths to Jun 14
Quarter to Mar 14
Quarter to Jun 14
Highways and Transportation 1,069 1,189 416 380 Insurance Claims 27 175 0 161 Adult Social Services 387 452 122 149 Waste Management 211 269 69 113 Specialist Children’s Services 332 295 73 52 Libraries, Archives and Registrations 205 186 56 47
Adult Education 103 108 13 18 Country parks 23 32 4 18 Education Services 24 30 7 8 Gateways and Contact Point 54 47 30 4 KSAS 30 33 20 3 Finance/procurement 27 26 17 0 Youth Services 24 16 0 0 Other Services 65 81 15 32 Total Complaints 2,581 2,939 842 985

Appendix 1
15
Customer Service and Contact – Complaints monitoring
Complaints analysis by service area
Highways & Transportation - There was an 8.7% decrease in the number of complaints received in this quarter. The issues this quarter related to vegetation, the Safe and Sensible Street lighting scheme, and accessing the National Driver Alertness courses. The service also received 90 compliments in the same period down from 134 the previous quarter. Insurance claims – Complaints were up in the quarter due to a substantial increase in the number of pothole claims being received which were subsequently rejected. Adult Social Services – Complaints were up in the quarter with key issues relating to disputed decisions, an incorrect billing-run and poor communications with relatives and service users. Other complaints related to quality of service delivery. The service had 190 compliments in the quarter up from 165 the previous quarter. Specialist Children’s Services – Complaints were down 28.7% in the quarter. The majority of complaints this quarter were around disputed decisions concerning looked after children. Other main themes raised were around information, i.e. lack of or incorrect information. Lack of support was the next issue raised, followed by financial assessments. There were 13 compliments in the quarter down from 19 the previous quarter.

Appendix 1
16
Economic Development - Overview
Cabinet Member Mark Dance Director Barbara Cooper
Committed job creation which will result from Regional Growth Fund (RGF) and other activity continues to be ahead of expectations, now at 5,938 jobs created or safeguarded since April 2013, with most of these RGF jobs to be delivered by March 2016. Indicator Description
Previous Status
Current Status DOT
Jobs committed to be created and safeguarded by Regional Growth Fund and other funds GREEN GREEN Percentage of Expansion East Kent funds committed at Board approval stage GREEN GREEN Percentage of Tiger and Escalate loan funds committed at Board approval stage AMBER AMBER
Loan approval in the quarter was high for Expansion East Kent at £5.0 million, with the scheme well on target to approve sufficient loans to fully utilise the fund within the scheme lifetime. Loans approved for Tiger and Escalate at £2.5m in the quarter, although encouraging was insufficient to bring the scheme into the target trajectory to utilise all of the funds by the scheme end date of March 2015. However with over £5m of pipeline applications for Tiger and Escalate, the forecast is that the scheme will be back on trajectory for quarter 2. The general state of the Kent economy continues to show good improvement with JSA claimant rates now down to levels not seen since 2008. Positive news in the quarter was the Government announcement on the 7 July of the Local Growth Fund allocations for Local Enterprise Partnerships (LEPs). The South East LEP allocation includes £6m to support a Kent and Medway Growth Hub which was a proposal in the Strategic Economic Plan. Ashford district is now included within the Expansion East Kent programme, which means that all Kent districts now have access to Regional Growth Fund (RGF) loan funding programmes. On 23rd July, two additional financial support products within the programme were launched. These products are:-
• Small Business Boost Fund - a loan scheme specifically to support small businesses and will cover Ashford, Canterbury, Dover, Shepway and Thanet. The scheme will offer 0% interest free loans of up to £50,000 to help start-ups, small businesses and social enterprises develop new or expand existing products or services. The loans must lead to jobs growth.
• The Discovery Park Incubator Scheme - an equity scheme to help attract new technology based companies to the Discovery Park Enterprise Zone with a particular focus on sustainable energy and life science businesses.

Appendix 1
17
Economic Development - KPIs
Committed jobs to be created or safeguarded through Regional Growth Fund and other schemes (cumulative since April 2013)
GREEN
0
2,000
4,000
6,000
8,000
Jun 13 Sep 13 Dec 13 Mar 14 Jun 14 Sep 14 Dec 14Target (YTD) Actual (YTD)
Jun 13 Sep 13 Dec 13 Mar 14 Jun 14 Sep 14 Dec 14 YTD 1,243 2,532 3,603 4,477 5,938 Target 500 1,250 2,350 4,050 4,650 5,250 5,850 Committed jobs will convert to actual jobs for RGF once funds are released and utilised by the businesses who receive the loan. The indicator includes jobs committed from Regional Growth Fund schemes, Escalate, Marsh Million and the activity of Locate In Kent. Job creation from the Regional Growth Fund is identified at contract stage. The RGF committed jobs will be realised between 2013 and 2019 with the majority delivered by March 2016.
Profile of expected dates for jobs to be created/safeguarded for RGF funds which have reached full contract stage
0
1,000
2,000
3,000
4,000
Mar 13 Mar 14 Mar 15 Mar 16 Mar 17 Mar 18 Mar 19Target
Mar 13 Mar 14 Mar 15 Mar 16 Mar 17 Mar 18 Mar 19 Total 205 1,018 2,106 2,560 2,755 2,909 2,951 Annual 205 814 1,088 453 195 154 42 So far the RGF applications which have reached full contract stage have committed to create/safeguard nearly 3,000 jobs. On this basis with 60% of funds so far approved by the Board we can expect over 5,000 to be ultimately created/safeguarded by RGF loans (not including any recycling of loan funds following re-payment).

Appendix 1
18
Economic Development - KPIs
Percentage of Expansion East Kent funds with Board approval to progress to Contract Stage (cumulative since start of the scheme)
GREEN
020406080
100
Jun 13 Sep 13 Dec 13 Mar 14 Jun 14 Sep 14 Dec 14Target (YTD) Actual (YTD)
Jun 13 Sep 13 Dec 13 Mar 14 Jun 14 Sep 14 Dec 14 YTD 32% 40% 53% 54% 68% Target 60% 67% 74%
The amount of loans to the scheme is showing a steady increase ahead of expectations. At the end of June £23.6m out of the available £35m fund had reached Board approval stage with 1,886 jobs committed to be created/safeguarded. To date £9.7m of the agreed loans had been released. At the end of June there were also pipeline applications valued at £6.5m with the potential for a further 641 jobs to be created/safeguarded. Direct private sector investment leverage of £42.2m has also been generated to date.
Percentage of Tiger/Escalate loan funds with Board approval to progress to Contract Stage (cumulative since start of the scheme)
AMBER
020406080
100
Jun 13 Sep 13 Dec 13 Mar 14 Jun 14 Sep 14 Dec 14Target (YTD) Actual (YTD)
Jun 13 Sep 13 Dec 13 Mar 14 Jun 14 Sep 14 Dec 14 YTD 8% 19% 24% 34% 47% Target 50% 67% 84%
The amount of loans to the scheme is showing a steady increase, but this is behind expectations. At the end of June £9.4m out of the available £20m fund had reached Board approval stage with 1,089 jobs committed to be created/safeguarded. To date £4.0m of the agreed loans had been released. At the end of June there were also pipeline applications valued at £5.6m with the potential for a further 766 jobs to be created/safeguarded, so the forecast for the next quarter is positive. Direct private sector investment leverage of £15.4m has also been generated to date.

Appendix 1
19
Economic Development – Activity Indicators
The following indicators provide information on the general state of the Kent economy in comparison to the regional and national averages. Employment rates continue to show an encouraging increase both nationally and in Kent after a number of years of decline and stagnation during the global recession. Employment rates in Kent remain above the national average and below the regional average. Similarly JSA claimant counts have shown significant reduction over the last 15 months and have now returned to levels not seen since 2008. Business start-up data for 2013 will not be available until the autumn.
Percentage of population aged 16 to 64 in employment
687072747678
Jun 08 Jun 09 Jun 10 Jun 11 Jun 12 Jun 13 Jun 14Kent Nat. Ave. South East
Percentage of population aged 16 to 64 claiming JSA
01
2
3
4
5
Jun 08 Jun 09 Jun 10 Jun 11 Jun 12 Jun 13 Jun 14
Kent Nat. Ave. South East
Business Start Ups per 10,000 population aged 18 to 64
60
65
70
75
80
2007 2008 2009 2010 2011 2012 2013Kent Nat. Ave.

Appendix 1
20
Environment, Planning and Enforcement - Overview
Cabinet Member David Brazier Director Paul Crick
Business mileage for all KCC staff increased during last financial year against a target for reduction, which has had a negative impact on our carbon emissions reduction target. All services have committed to reducing business mileage in line with the annual 5% reduction target and this is included in their annual Sustainability & Climate Change action plans for 2014/15. Some services have highlighted that due to a focus on increasing traded services and transformation support (e.g. ICT) they may struggle to achieve a decrease. Indicator Description
Previous Status
Current Status DOT
Business mileage per member of staff (FTE basis) RED RED This has been an exciting first quarter for this completely new Division, which saw the coming together of a very broad range of strategic and frontline services encompassing the Transport and Development Planning services, Planning Applications, Sustainability and Climate Change, Flood Risk and Natural Environment, Heritage Conservation, Regulatory Services, Community Safety, Gypsy and Traveller unit, Sport and Physical Activity unit, Country Parks and Emergency Planning. As part of the “Facing the Challenge” Kent Scientific Services was part of the first tranche of reviews, and during this quarter it was agreed that the service should continue as an in-house service with an emphasis on adopting a more commercial model. Work has begun on the two reviews in Phase 2 Community Safety and Regulatory Services, and Countryside Access (including Country Parks) with terms of reference agreed and the review managers appointed. Positive news in the quarter was the Government announcement on the 7 July of the Local Growth Fund allocations for Local Enterprise Partnerships (LEPs). The South East LEP allocation includes £6m to support a Kent and Medway Growth Hub which was a proposal in the Strategic Economic Plan.

Appendix 1
21
Environment, Planning and Enforcement - KPIs
Business mileage per member of KCC staff (full time equivalent basis) per quarter
RED
250
300
350
400
450
Mar 13 Jun 13 Sep 13 Dec 13 Mar 14 Jun 14 Sep 14Target Actual
Mar 13 Jun 13 Sep 13 Dec 13 Mar 14 Jun 14 Sep 14 Actual 357 395 383 410 407 Target 355 339 375 364 The annual target is for a 5% reduction in business mileage. This was previously applied at the total mileage level, but for 2014/15 the target is now being applied across the County Council at the per FTE level. In the year to March 2014 there was a 9% increase at the FTE level (0.8% increase at the total level). Reasons for the increase included: ICT staff engaged on Unified Communication project, Finance staff providing an increase in services sold to schools, increases due to Public Health staff transferring in from the NHS, and increases due to the winter storms and flooding affecting Highways, emergency planning, community safety and social care.

Appendix 1
22
Environment, Planning and Enforcement – Activity Indicators
The following indicators provide information on some of the external context and factors within which the Division operates. The number of annual Housing completions remains below the pre-recession levels and reached a low in the year to March 2013. Data for the year to March 2014 will be available during autumn. Total incidents of recorded crime have been on a downward trajectory for several years but showed an increase in the last year for the first time since the year to March 2007.
Net Housing Completions by year
0
2,000
4,000
6,000
8,000
Mar 08 Mar 09 Mar 10 Mar 11 Mar 12 Mar 13 Mar 14
Total incidents of recorded crime by year
80,000
90,000
100,000
110,000
Mar 08 Mar 09 Mar 10 Mar 11 Mar 12 Mar 13 Mar 14

Appendix 1
23
Highways and Transportation - Overview
Cabinet Member David Brazier Director John Burr
Performance remains above target for our four key measures and work in progress levels are now just within the expected range, following an exceptional increase in the previous quarter as a result of the flooding in the early part of the year. Indicator Description
Previous Status
Current Status DOT
Percentage of routine potholes repaired in 28 days GREEN GREEN Percentage of routine highway repairs reported by residents completed within 28 days GREEN GREEN Percentage of satisfied callers for Kent Highways 100 call back survey GREEN GREEN Resident satisfaction with completed Highways schemes (survey)
GREEN GREEN A challenging first quarter of 2014/15 has seen significant efforts to keep up with customer demand and repair roads after the damage caused by the wet winter weather. We have been successful in bids to central government from the Pothole Repair Fund, the Local Sustainable Transport Fund and the Local Growth Fund (including £10.2m for A28 Chart Road, £4.5m for Maidstone’s Bridge Gyratory improvements and a host of other local improvements). We are now engaged in Phase 2 of the Facing the Challenge Programme via the SEN Assessment Support and Transport service change project and this is moving forward well. We have recently appointed a new Head of Public Transport, Phil Lightowler and he will take up his post in September. We delivered three of our 2014/15 Strategic Priority Statement priorities in this quarter including publishing a new Casualty Reduction Strategy, delivered an increased surface dressing programme to seal roads we have repaired after the wet winter damage and implemented the new Combined Community Grant. The new Young Persons Travel Pass was launched in June. A successful re-tendering process for both soft landscaping and road resurfacing work will deliver improved service at no increased cost. We are in the final stages of delivering a key phase of the Safe and Sensible Streetlighting project which will deliver significant energy and carbon savings. The next phase is to develop proposals to convert the entire stock of streetlights to LED with control mechanisms that will deliver a further 60% energy and carbon savings, less faults, less customer contacts and significantly reduced maintenance costs. Within the major capital programme, local pinch fund schemes at Poorhole Lane, Thanet and North Farm, Tunbridge Wells will start on site in the summer and are due to be completed in May 2015. We are working with the Highways Agency and DfT to reach agreement on the delivery programme, with the Highways Agency promoting the full junction scheme.

Appendix 1
24
Highways and Transportation - KPIs
Percentage of routine pothole repairs within 28 days GREEN
80
85
90
95
100
Mar 13 Jun 13 Sep 13 Dec 13 Mar 14 Jun 14 Sep 14Target Actual
Mar 13 Jun 13 Sep 13 Dec 13 Mar 14 Jun 14 Sep 14 Actual 89% 91% 94% 96% 92% 97% Target 90% 90% 90% 90% 90% 90% 90% The good result for the quarter was assisted by the recent improved dry weather conditions. The latest Find and Fix programme was delivered by the end of May with the full £3 million spend being achieved. Repairs to potholes will continue to be delivered with a focus on quality first time permanent repairs. Additional grant funding from the government by way of the Severe Weather Grant and the Pothole grant will see further highway repairs delivered throughout the coming months.
Percentage of routine highway repairs reported by residents completed within 28 days
GREEN
80
85
90
95
Mar 13 Jun 13 Sep 13 Dec 13 Mar 14 Jun 14 Sep 14Target Actual
Mar 13 Jun 13 Sep 13 Dec 13 Mar 14 Jun 14 Sep 14 Actual 94% 92% 93% 92% 90% 90% Target 90% 90% 90% 90% 90% 90% 90% Performance remained just on target for the quarter despite the recent high demand levels and large volumes of work to complete. We will continue to monitor this indicator on a weekly basis to ensure that any issues arising are addressed and to ensure no further slippage from target.

Appendix 1
25
Highways and Transportation - KPIs
Percentage of satisfied callers for Kent Highways and Transportation, 100 call back survey
GREEN
5060708090
100
Mar 13 Jun 13 Sep 13 Dec 13 Mar 14 Jun 14 Sep 14Target Actual
Mar 13 Jun 13 Sep 13 Dec 13 Mar 14 Jun 14 Sep 14 Actual 78% 84% 83% 87% 89% 78% Target 75% 75% 75% 75% 75% 75% 75%
Performance remains above target but is lower than the last quarter with this quarter’s result reflecting the seasonal focus of the survey towards soft landscape issues as enquiries about this service increase at this time of year. Customers have not been completely satisfied with our response to grass, weeds and hedge/tree enquiries. We are working hard with land owners, as well as our own contractors, to ensure high quality work and that, where necessary, vegetation is managed appropriately by the land owner. We are planning a second weed spray later in the year.
Resident satisfaction with completed Highways schemes (survey)
GREEN
50
60
70
80
90
Mar 13 Jun 13 Sep 13 Dec 13 Mar 14 Jun 14 Sep 14Target Actual
Mar 13 Jun 13 Sep 13 Dec 13 Mar 14 Jun 14 Sep 14 Actual 81% 70% 79% 81% 77% Responses 551 61 518 373 53
Satisfaction continues to be above the 75% target level. The volume of survey cards returned from residents in this quarter was low and we are working closely with our contractor Amey to ensure a representative sample of schemes are selected for survey and that the response rates from residents are increased. Each quarter a sample of sites where repair schemes have been completed, such as roadway resurfacing, or junction improvements are selected for resident surveys to obtain views on the information provided, and the speed and quality of the works.

Appendix 1
26
Highways and Transportation – Activity Indicators
Customer demand in the quarter was at the higher end of expectations but significantly down from the exceptional high level seen in the previous quarter. Current enquiries are mainly due to soft landscaping issues but also for potholes repairs following the wet winter. We have worked hard to reduce the number of outstanding and unresolved customer enquiries and work in progress has fallen considerably from 10,845 to 8,117 over the last quarter. Ensuring we meet our customer standard response times remains a key focus for all staff and we recognise we still have more to do to reduce the level of work in progress into the middle of expected range.
Number of enquiries raised for action - by quarter
15,000
25,000
35,000
45,000
Mar 12 Sep 12 Mar 13 Sep 13 Mar 14 Sep 14 Mar 15Actual Lower Threshold Upper Threshold
Open enquiries work in progress (Routine and Programmed works)
4,000
6,000
8,000
10,000
12,000
Mar 12 Sep 12 Mar 13 Sep 13 Mar 14 Sep 14 Mar 15Actual Lower Threshold Upper Threshold

Appendix 1
27
Waste Management - Overview
Cabinet Member David Brazier Director John Burr
Performance remains above target for our two key measures, with demand levels currently increasing. Total waste tonnage collected has been increasing for three consecutive quarters. Indicator Description
Previous Status
Current Status DOT
Percentage of municipal waste recycled or converted to energy and not taken to landfill GREEN GREEN Percentage of waste recycled and composted at Household Waste Recycling Centres GREEN GREEN
Local growth in waste tonnage is reflected across the country, and is likely to be a function of both the continued economic growth in the UK, and the extremely favourable growing conditions during the unusually mild and moist first half of 2014 which had a big impact on composting tonnage. Despite this increase in waste tonnage, our systems for diverting waste for use as a resource coped well, with levels of recycling and composting continuing to improve as a proportion of overall waste, with a decline in waste disposed of at landfill. The percentage of municipal waste not taken to landfill has risen in the quarter, and at 85.6% is above target. This is in large part due to the improvement in performance at the Allington energy from waste (EfW) plant, where the operators have made significant investments in recent month in order to improve operational efficiency. The percentage of waste recycled and composted at our own Household Waste Recycling Centres continues to improve, rising to 72.3% which was also above target. We have been engaged in a number of key procurements during the quarter, with innovative contracts driving reduced prices for the processing of both garden waste and mixed recyclables to deliver the savings requirements set out in the medium term financial plan. Our key Strategic Priorities Statement project to mobilise a new range of contracts for 12 of our Household Waste Recycling Centres and Waste Transfer stations is on track with the evaluation of tenders currently taking place and with award anticipated in August 2014. Progress on our other key projects such as the redevelopment of the Sittingbourne Household Waste Recycling Centre is moving forward well. We are also developing satisfaction surveys of customers who use our Household Waste Recycling Centres to help us understand and improve the customer experience and results will be reported later in the year. The new organisational structure and maximising the benefits of the merger with Highways & Transportation will take a big step forward in September when the Waste Management team will move to Invicta House to work alongside Highways & Transportation colleagues.

Appendix 1
28
Waste Management - KPIs
Percentage of municipal waste recycled or converted to energy and not taken to landfill
GREEN
50
60
70
80
90
Mar 11 Mar 12 Mar 13 Mar 14 Jun 14 Sep 14 Dec 14Target South East Actual
Mar 11 Mar 12 Mar 13 Mar 14 Jun 14 Sep 14 Dec 14 Actual 71% 78% 79% 83% 86% Target 80% 83% 84% 85% Further improvements in recycling performance are anticipated through the new Gravesham Borough Council (GBC) kerbside collection scheme, which commenced in June 2014. An increase of 10% in diversion from landfill within the district is anticipated. New contracts for Household Waste Recycling Centres commencing in November 2014 will prioritise diversion of waste from landfill, and a measurable further improvement in performance is anticipated. Percentage of waste recycled and composted at Household Waste Recycling Centres (HWRC)
GREEN
686970717273
Mar 11 Mar 12 Mar 13 Mar 14 Jun 14 Sep 14 Dec 14Target Actual
Mar 11 Mar 12 Mar 13 Mar 14 Jun 14 Sep 14 Dec 14 Actual 69.9% 71.8% 71.9% 72.1% 72.3% Target 71.8% 72% 72% 72% Despite a significant increase in HWRC tonnage, opportunities for recycling and composting were maximised, enabling an improvement in recycling and composting performance.
Appendix 1
29
Waste Management – Activity Indicators
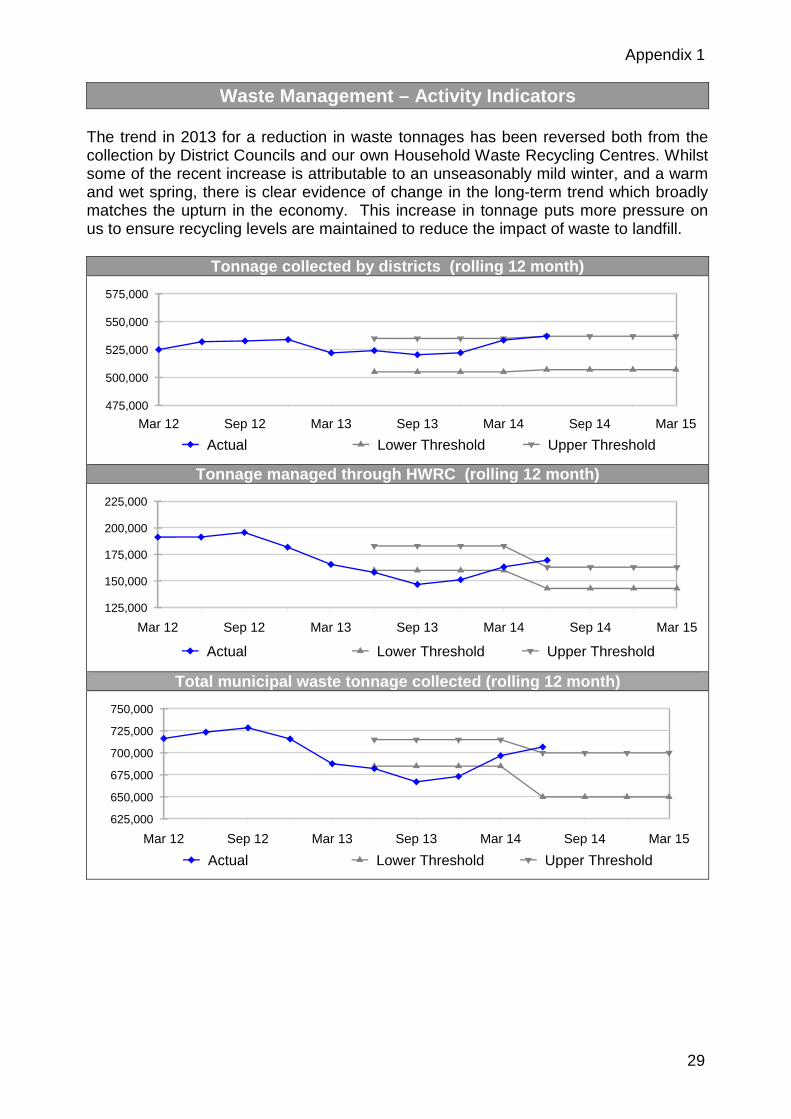
The trend in 2013 for a reduction in waste tonnages has been reversed both from the collection by District Councils and our own Household Waste Recycling Centres. Whilst some of the recent increase is attributable to an unseasonably mild winter, and a warm and wet spring, there is clear evidence of change in the long-term trend which broadly matches the upturn in the economy. This increase in tonnage puts more pressure on us to ensure recycling levels are maintained to reduce the impact of waste to landfill.
Tonnage collected by districts (rolling 12 month)
475,000
500,000
525,000
550,000
575,000
Mar 12 Sep 12 Mar 13 Sep 13 Mar 14 Sep 14 Mar 15Actual Lower Threshold Upper Threshold
Tonnage managed through HWRC (rolling 12 month)
125,000
150,000
175,000
200,000
225,000
Mar 12 Sep 12 Mar 13 Sep 13 Mar 14 Sep 14 Mar 15
Actual Lower Threshold Upper Threshold
Total municipal waste tonnage collected (rolling 12 month)
625,000
650,000
675,000
700,000
725,000
750,000
Mar 12 Sep 12 Mar 13 Sep 13 Mar 14 Sep 14 Mar 15
Actual Lower Threshold Upper Threshold

Appendix 1
30
Libraries, Registrations and Archives - Overview
Cabinet Member Mike Hill Head of Service Cath Anley
We have recently launched new customer satisfaction surveys in for all areas of our service. Satisfaction rates to date are: Libraries and Archives 91.7% (surveys received since 1st March 2014) Birth and Death Registration 97.0% (surveys received since 1st April 2014) Ceremonies 100.0% (surveys received since 1st April 2014) Indicator Description
Previous Status
Current Status DOT
Satisfaction with Libraries and Archives New indicator AMBER
Satisfaction with Birth and Death registrations New indicator GREEN
The slow but relatively steady transfer from traditional library usage (physical visits and issues) to use of our online services continues. However, library issues and visits were lower in the quarter than expected, with issue levels seriously affected by our inability to supply libraries with new stock due to the premise move of our business support team. Work has continued to review Library, Registration and Archive services, with particular focus on ensuring that services deliver what our customers want as efficiently as possible. Major pieces of work that support this are: the Future Library Service Review, the Market Testing Review as part of Facing the Challenge, a review of ICT business systems that support our work to deliver better digital access for customers and better integration with other KCC systems; and the service review of Registration Services. In May this year we achieved our best ever result when we were reassessed for the Customer Service Excellence Award on behalf of the Cabinet Office. As part of New Ways of Working, during the first quarter of the year we have been moving part of our business support activity from Kings Hill, Gibson Drive, to new much smaller and more cost effective premises. Delays have meant that we have been required to vacate the old premises but have not been able to transfer all teams into the new premises. This has meant we have been unable to send new books to our branches for some weeks and we believe this has reduced our volume of issues. Following the launch of the new KCC web-site in March, Libraries, Registration and Archives now have 33 pages down from 952 and we have seen a noticeable reduction in site traffic for the service. What is unclear is whether the reduction in web hits is because customers are finding what they want more quickly, or because they cannot find what they want. We have seen no increase in customer complaints on this subject and phone call volumes have not increased, which indicates that the former is more likely. There has also been a significant increase in the percentage of on-line Registration bookings from 39% in April to 57% in June, indicating that the new web-site is helping to drive digital take-up.

Appendix 1
31
Libraries, Registrations and Archives – Activity Indicators
Although we anticipated a continued decrease in issues and visits (the latter as our digital offer improves), our issues have been seriously affected by our inability to supply our libraries with new stock during this quarter (see above). The number of ceremonies conducted at just over 600 a month is running at a similar rate to the same time last year.
Average number of book issues from Kent libraries per day
14,000
16,000
18,000
20,000
Mar 12 Sep 12 Mar 13 Sep 13 Mar 14 Sep 14 Mar 15Actual Lower Threshold Upper Threshold
Average number of visits to Kent libraries per day
16,000
18,000
20,000
22,000
Mar 12 Sep 12 Mar 13 Sep 13 Mar 14 Sep 14 Mar 15Actual Lower Threshold Upper Threshold Number of ceremonies conducted (monthly counts)
0
300
600
900
1,200
Mar 13 Jun 13 Sep 13 Dec 13 Mar 14 Jun 14

Appendix 1
32
Education Quality and Standards - Overview
Cabinet Member Roger Gough Director Sue Rogers
The percentage of schools which are Good or Outstanding continues to improve, ahead of the target trajectory and the percentage of Early Years settings which are Good or Outstanding has improved ahead of target in the quarter. The percentage of 16-18 year olds who are NEET has risen since last quarter to 6.3% and this is partly due to a rise in the Not Knowns. Apprenticeship starts for 16-18 year olds decreased slightly for last academic year and full year figures for the current academic year are not yet available. The percentage of young people aged 18 to 24 claiming Job Seekers Allowance was at 3.6% at the end of June, down from the peak of 7.5% in 2012. Indicator Description
Previous Status
Current Status DOT
Percentage of schools with Good or Outstanding Ofsted inspection judgements GREEN GREEN Percentage of Early Years settings with Good or Outstanding Ofsted inspection judgements AMBER GREEN Percentage of 16-18 years olds not in education, employment or training (NEETs) AMBER RED
Apprenticeship starts for 16-18 year olds AMBER AMBER The School Improvement Service continues to focus on Narrowing the Gap for Kent’s most vulnerable groups, especially those in receipt of Pupil Premium, as well as encouraging the developing collaborative groups of schools to have more impact on their own schools’ development and improvement. Priority continues to be given to improving the number of schools rated outstanding and good, reducing the number of schools in an Ofsted category of concern, and raising attainment at all key stages. The key priorities for the Early Years and Childcare Service are ensuring the availability of Free Early Education places for Two Years Olds, supporting as many providers as possible to be good or outstanding, improving outcomes for all children and narrowing achievement gaps in the Early Years Foundation, and introducing and supporting the establishment of collaborations of early years providers to support their continuous improvement. The Skills & Employability Service continues to give priority to increasing participation for all young people to age 18, through apprenticeships, vocational and technical education provision. Work is underway to review processes for data collection and verification of the destination and participation status for young people up to age 18, to reduce the number of Not Knowns and the amount of individual tracking required. The first KIASS Re-engage programmes are underway this summer in all districts and these will provide young people with a single point of access to a tailored range of opportunities available from training providers, employers and other KCC partners. Places will be available for those who are NEET or identified by schools/colleges as being 'at risk' of NEET.

Appendix 1
33
Education Quality and Standards – Pupil Attainment
Cabinet Member Roger Gough Director Sue Rogers
Pupil Attainment – Annual Figures This section will be updated when 2014 attainment results become available. Early provisional figures for 2014 have been added for Key Stage Two. Indicator Description
Previous Year
Current Year DOT
Percentage of pupils achieving 5+ A*- C GCSE, including English and Maths 63.1% NA Percentage of pupils achieving level 4 and at Key Stage 2 in Reading, Writing and Maths 74% 79% Attainment gap for children with Free School Meals at Key Stage 4 (GCSE) 34.5% NA Attainment gap for children with Free School Meals at Key Stage 2 25% NA
Early provisional figures for KS2 show a 5% rise in Kent to 79%, 1% above an early provisional national figure of 78%. Both these figures are subject to change once further results become available. For 2013, results at GCSE improved by 1.8% to 63.1%. Kent also saw a significant reduction in the number of secondary schools below floor standard, down from 15.3% to 6.3%. Key Stage 2 pupil attainment improved by 2% to 74%, which was 1% behind the national average of 75%. The achievement gap for children with Free School Meals increased in the year at Key Stage 4 and was unchanged at Key Stage 2.

Appendix 1
34
Education Quality and Standards - KPIs
Percentage of schools with Good or Outstanding Ofsted inspection judgements
GREEN
50
60
70
80
90
Aug 11 Aug 12 Aug 13 Dec 13 Mar 14 Jun 14 Aug 14Target Nat. Ave. Actual
Aug 11 Aug 12 Aug 13 Dec 13 Mar 14 Jun 14 Aug 14 YTD 59.5% 59.5% 71.4% 73.4% 73.9% 74.6% Target 64% 72% 73% 74% 75% Performance in this area continues to improve at a good rate ahead of target. At the end of June there were 421 schools (75%) that are Good or Outstanding. There are 29 schools without a current inspection judgement. The number of schools Requiring Improvement continues to reduce and we now have 112 schools Requiring Improvement. However, there are 31 schools (26 Primary and 5 Secondary) judged Inadequate by Ofsted, which is being addressed by working closely with all schools in category who are working to a Local Authority Statement of Action. These schools are held to account for progress against this plan every six weeks.
Percentage of Early Years settings with Good or Outstanding Ofsted inspection judgements
GREEN
657075808590
Aug 10 Aug 11 Aug 12 Aug 13 Mar 14 Jun 14 Aug 14Target Nat. Ave. Actual
Aug 10 Aug 11 Aug 12 Aug 13 Mar 14 Jun 14 Aug 14 YTD 76% 78% 79% 82% 84% 90% Target 85% 86.5% 88% The percentage of Early Years settings which are judged Good or Outstanding continues to rise, and moved ahead of target in the last quarter.

Appendix 1
35
Education Quality and Standards – KPIs
Percentage of 16-18 years olds not in education, employment or training (NEETs)
RED
0
2
4
6
8
Dec 11 Dec 12 Dec 13 Mar 14 Jun 14 Sep 14 Dec 14Target Nat. Ave. Actual
Dec 11 Dec 12 Dec 13 Mar 14 Jun 14 Sep 14 Dec 14 YTD 6.7% 6.3% 5.9% 6.0% 6.3% Target 5% 5% 4% 4% 4% The NEETs percentage increased in the quarter, which was partly a result of an increase in the numbers of Not Knowns which is a seasonal pattern due to lapsed statuses towards the end of the academic year. In June, 99 16-18 year olds left the NEET cohort, while 112 joined the NEET cohort. Kent is ranked 7th among our statistical neighbours for NEET. The increase in Not Knowns impacts the NEET percentages as a number of Not Knowns are apportioned into the NEET percentages according to DfE methodology. Not Knowns in Kent are above the England average but slightly below the average for our statistical neighbours. Percentage of 16-18 years old who start an apprenticeship AMBER
0
2
4
6
8
2009 2010 2011 2012 2013 2014 2015Target Nat. Ave. Actual
2009 2010 2011 2012 2013 2014 2015 Actual 3.1% 3.6% 4.1% 4.8% 4.5% Target 4.5% 5.1% 5.0% 5.6% There was a decrease in the number of starts in academic year 2012/13, both locally and nationally. The decrease seen in Kent was considerably less than the national average decrease. Funding has been provided by the National Apprenticeship Scheme to address this fall in apprenticeships. Partial year data for 2013/14 suggests the number of apprenticeships starts in Kent may be at similar levels to the previous year.

Appendix 1
36
Education Quality and Standards – Activity Indicators
The percentage of young people aged 18 to 24 claiming Job Seekers Allowance has shown a good reduction, now at 3.6% compared to the peak of 7.5% seen in March 2012. Primary schools in Kent now have 14.7% of pupils eligible for Free School Meals, down from 16.6% last year and below the national average of 18.0%. At secondary school level 12.1% of pupils in Kent are eligible for Free School Meals, down from 13.5% last year and below the national average of 15.7%.
Percentage of young people aged 18 to 24 claiming JSA
0
2
4
6
8
10
Jun 11 Dec 11 Jun 12 Dec 12 Jun 13 Dec 13 Jun 14Actual Lower Threshold Upper Threshold
Percentage of primary school children eligible for Free School Meals
12
14
16
18
20
22
2010 2011 2012 2013 2014Actual Nat. Ave.
Percentage of secondary school children eligible for Free School Meals
8
10
12
14
16
18
2010 2011 2012 2013 2014Actual Nat. Ave.

Appendix 1
37
Education Planning and Access - Overview
Cabinet Member Roger Gough Director Kevin Shovelton
The percentage of Statements of Special Educational Need (SEN) issued within 26 weeks improved each quarter last year. Figures for the first quarter of this year are down by 1% to 94% which is 2% above the target. The number of children with a Statements of SEN in Kent at the end of June was 7,279, which is a 2.2% increase on the same time last year. There are currently 152 children from other local authorities placed in Kent special schools, down from 160 last March. Indicator Description
Previous Status
Current Status DOT
Percentage of SEN statements issued within 26 weeks (excluding exceptions to the rule) GREEN GREEN
The number of Reception Year pupils within Kent schools has increased by 8.1% in the last three 3 years to 17,362 children in January 2014. For Year 7 pupil numbers were decreasing up to 2012/13 but have now started to increase, and we expect they will continue to do so as the previous years of primary stage increases now start to move into secondary schools, and total secondary school numbers will not start to increase from 2016. The Area Education Officers and the Fair Access team have worked together over the past quarter to ensure that every Kent child has been offered a school place for September 2014. The challenging context this year is that unprecedented levels of inward migration into Kent since September 2013 have been higher than forecast and have reduced the surplus of school places to below the recognised operating surplus of 5% in seven of the twelve Kent Districts for Reception Year admissions. Additional school places have been created for September 2014 to ensure that there are sufficient places. Revised forecasts and District Plans for new school places are being devised to be set out in a revised Education Commissioning Plan for Members’ consideration in September. SEN Services and the Educational Psychology Service (KEPS) have been preparing for the implementation of the most significant legislative SEND (Special Education Needs and Disability) changes for 30 years in September 2014. The introduction of the Education, Health and Care Plans, which replace Statements of SEN, and the provision of a ‘Local Offer’ will commence in September. The SEN Assessment and Placement Service has been restructured during the past quarter to enable us to deliver the new changes and to provide 4 area teams which align with other Education and Young People’s services locally. KEPS, the SEN Service and the Fair Access teams have all been involved in Transformation Reviews as part of ‘Facing the Challenge’. KEPS are involved in both Phase 1 (as part of the EduKent suite of Services) and Phase 2, while SEN and Fair Access are involved in Phase 2 Reviews which are focussed on SEN, SEN Transport and School Admissions.

Appendix 1
38
Education Planning and Access - KPIs
Percentage of SEN statements issued within 26 weeks (excluding exceptions to the rule)
GREEN
7580859095
100
Mar 13 Jun 13 Sep 13 Dec 13 Mar 14 Jun 14 Sep 14Target Nat. Ave. Actual
Mar 13 Jun 13 Sep 13 Dec 13 Mar 14 Jun 14 Sep 14 YTD 84% 87% 91% 94% 95% 94% Target 87% 90% 90% 90% 90% 92% 92% Performance improved significantly during the last financial year and the results are now well-above target.

Appendix 1
39
Education Planning and Access – Activity Indicators
Kent schools have the same proportion of pupils with statements of SEN as the national average, which has been a consistent 2.8% for several years. There are currently 152 children from other local authorities placed in Kent special schools, down from 160 last March. Data for 2014 will be published in September. The number of Reception Year pupils has been on a steady increase since 2007, with 17,362 pupils in January 2014, 8.1% higher than 3 years ago. The number of Year 7 pupils has been decreased for a number of years with 15,719 pupils in January 2014, 2.9% lower than 3 years ago. The number of Year 7 pupils increased slightly between 2013 and 2014 and larger increases are expected each year in future years as the previous trend of increases in primary now starts to move into the secondary stage. In the last three years total primary school pupil numbers have increased 6.3% and total secondary school pupil numbers have decreased by 1.7%. Total secondary school numbers are forecast to begin increasing in 2016.
Percentage of pupils in Kent schools with SEN Statements
2.52.62.72.82.93.0
2009 2010 2011 2012 2013 2014
Actual Nat. Ave.
Number of pupils in Reception year (Kent state funded schools)
15,000
16,000
17,000
18,000
2009 2010 2011 2012 2013 2014
Number of pupils in Year 7 (Kent state funded schools)
15,000
16,000
17,000
18,000
2009 2010 2011 2012 2013 2014

Appendix 1
40
Early Help and Preventative Services - Overview
Cabinet Member Peter Oakford/Mike Hill Director Florence Kroll
There has been continued improvement in percentage of Team Around the Family cases (TAFs) which are closed with either outcomes achieved or to single agency support, now on target. The number of open TAFs continues to increase with the number of Common Assessment Frameworks (CAFS) fluctuating about the 1,000 level each quarter. The percentage of Children in Need cases stepped down to Preventative Services remains constant at 18%, just below target. New registrations at Children’s Centres are around 3,000 per quarter over the last 12 months, down from the higher levels previous seen, due to the closure of some centres, and new hub arrangements settling in. Permanent exclusions continue to decrease ahead of target, with the number (rolling 12 months) now down to 79. The number of first time entrants to the youth justice system has risen this quarter following a relatively stable level for the previous year. Indicator Description
Previous Status
Current Status DOT
Percentage of TAFs closed with outcomes achieved or to single agency support AMBER GREEN Percentage of children in need cases stepped down to preventative services AMBER AMBER Percentage of pupils permanently excluded from school GREEN GREEN Number of first time entrants to youth justice system GREEN AMBER
The Early Help & Preventative Services Division was established in April 2014 to provide services to vulnerable children, young people and families. An Early Help and Preventative Services Prospectus has been published setting out the vision and rationale for change, in order to achieve better outcomes, and a One Year Early Help Plan (2014/15) has been developed to provide focus and measure positive outcomes for children, young people and families, setting out the key priorities, targets and actions for the new Division. In July a decision was taken to work with Newton Europe on a Service Redesign of the Division. Staff will be actively engaged in this design phase with the aim of achieving system redesign that will reduce demand for Specialist Children’s Services. Work is progressing on reviewing three interrelated processes to help improve identification of families and young people in need of support, and to improve the support provided:
• The step-up/step-down protocol between Early Help and Specialist Children’s Services,
• Missing Children procedures, and • the CAF assessment process.

Appendix 1
41
Early Help and Preventative Services - KPIs
Percentage of TAFs closed with outcomes achieved or to single agency support
GREEN
020406080
100
Mar 13 Jun 13 Sep 13 Dec 13 Mar 14 Jun 14 Sep 14Target Actual
Mar 13 Jun 13 Sep 13 Dec 13 Mar 14 Jun 14 Sep 14 Actual 53% 61% 56% 74% 74% 77% Target 70% 73% 75% 75% 77% 79%
Closer monitoring the TAF process during the last year has led to better tracking of cases, reducing drift and ensuring outcomes and reasons for closing cases are now properly recorded. At September 2013 the breakdown of case closures had included 13% due to data quality work, 10% where consent was withdrawn and 15% with transfer to Specialist Children’s Services. In the quarter to June 2014 the figures were 0% data quality, 9% consent withdrawn and 14% transferred to Specialist Children’s Services. Schools have been the lead agency in nearly 50% of these new cases.
Percentage of children in need cases stepped down to Early Help & Preventative Services
AMBER
0
10
20
30
Mar 13 Jun 13 Sep 13 Dec 13 Mar 14 Jun 14 Sep 14Target Actual
Mar 13 Jun 13 Sep 13 Dec 13 Mar 14 Jun 14 Sep 14 Actual 21% 23% 18% 18% 18% 18% Target 20% 20% 20% 20% 20% 20% 20% The percentage of cases closed in Specialist Children’s Services that are stepped down to Early Help and Preventative Services has remained at 18% for the last four quarters. Following the restructure and a new increased focus on early help, this figure is targeted to rise over the next year.

Appendix 1
42
Early Help and Preventative Services - KPIs
Percentage of pupils permanently excluded from school (rolling 12 month total)
GREEN
0.000.020.040.060.080.100.12
Jun 12 Jun 13 Sep 13 Dec 13 Mar 14 Jun 14 Sep 14Target Nat. Ave. Actual
Jun 12 Jun 13 Sep 13 Dec 13 Mar 14 Jun 14 Sep 14 Actual 0.10% 0.07% 0.07% 0.06% 0.05% 0.04% Target 0.10% 0.09% 0.07% 0.06% 0.06% 0.06% 0.04%
There were 79 permanent exclusions in the last 12 months which is a significant improvement on the academic year 2011/12 when there were 210 permanent exclusions. In the quarter Thanet was the highest overall excluding district. Thanet had the highest level of primary school exclusions. Primary exclusions range from 14 in Thanet to none in Ashford, Dartford, Dover, Gravesham, Maidstone and Sevenoaks. Secondary exclusions range from 13 in Maidstone to none in Ashford and Tunbridge Wells. Number of first time entrants to youth justice system (rolling 12 month total)
AMBER
0200400600800
1,0001,200
Mar 13 Jun 13 Sep 13 Dec 13 Mar 14 Jun 14 Sep 14Target Nat. Ave. Actual
Mar 13 Jun 13 Sep 13 Dec 13 Mar 14 Jun 14 Sep 14 Actual 807 711 719 702 698 758 Target 800 790 780 770 681 663 The number of first term entrants increased in the last quarter after being relatively stable for the previous year. Kent Police have maintained their commitment to the diversion of children and young people from the youth justice system and this commitment has been supported by the triage process in each of the four youth offending teams. The triage process screens those cases diverted from the youth justice system by the Police, to ensure that appropriate assessment and a preventative intervention is put in place where risks of offending are highlighted. The last quarter is subject to change due to the delay in notifications from the police.

Appendix 1
43
Early Help and Preventative Services – Activity Indicators
The number of cases with a current open Team Around the Family continues to rise and was 2,685 at the end of June. The number of Common Assessment Frameworks completed fluctuated during the last year and in the quarter to June 2014 there were 993 assessments, down from 1,008 for the same quarter last year. The number of new registrations at Children’s Centres has been lower in the last year compared to previous number, with figures impacted by closures and moves to HUB models. There were 2,661registrations in the quarter down from 4,999 in the quarter to June 2012.
Number of cases with a current open Team Around the Family (TAF)
1,500
1,750
2,000
2,250
2,500
2,750
Jun 12 Sep 12 Dec 12 Mar 13 Jun 13 Sep 13 Dec 13 Mar 14 Jun 14
Number of Common Assessment Frameworks completed by quarter
0
250
500
750
1,000
1,250
Jun 12 Sep 12 Dec 12 Mar 13 Jun 13 Sep 13 Dec 13 Mar 14 Jun 14
Number of new registrations at Children’s Centres by quarter
0
1,000
2,000
3,000
4,000
5,000
Jun 12 Sep 12 Dec 12 Mar 13 Jun 13 Sep 13 Dec 13 Mar 14 Jun 14
Appendix 1
44
Children’s Safeguarding - Overview
Cabinet Member Peter Oakford Director Philip Segurola
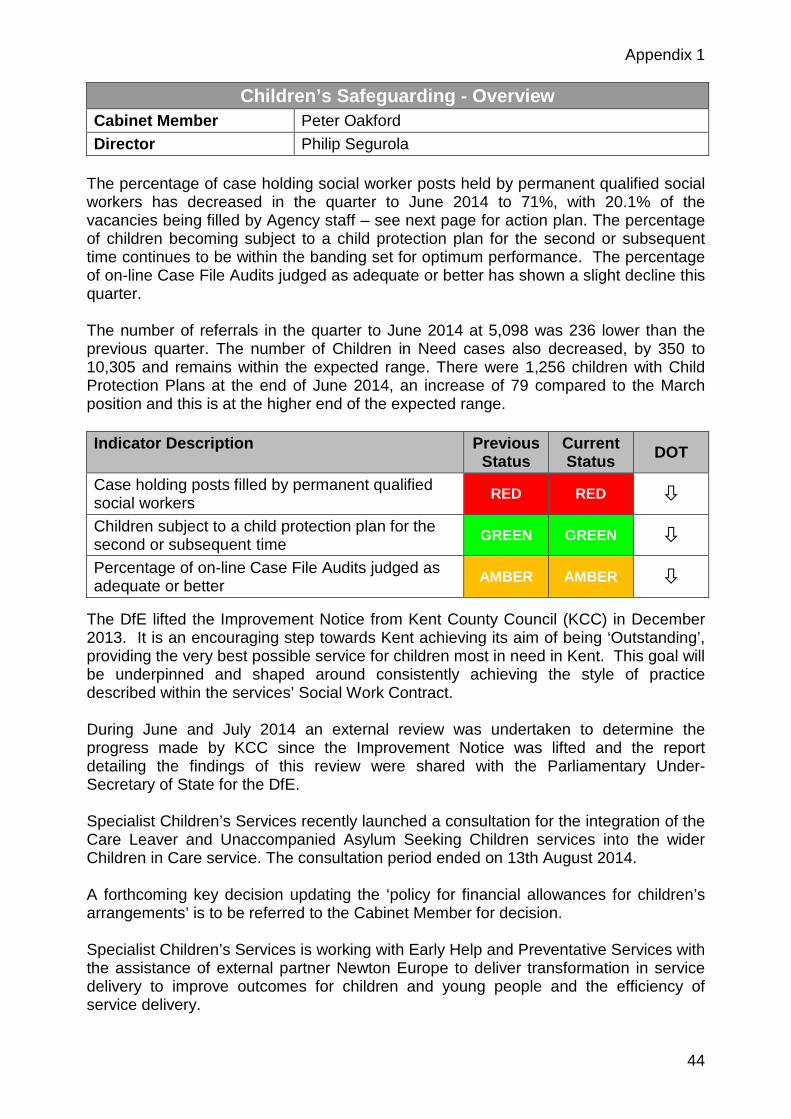
The percentage of case holding social worker posts held by permanent qualified social workers has decreased in the quarter to June 2014 to 71%, with 20.1% of the vacancies being filled by Agency staff – see next page for action plan. The percentage of children becoming subject to a child protection plan for the second or subsequent time continues to be within the banding set for optimum performance. The percentage of on-line Case File Audits judged as adequate or better has shown a slight decline this quarter. The number of referrals in the quarter to June 2014 at 5,098 was 236 lower than the previous quarter. The number of Children in Need cases also decreased, by 350 to 10,305 and remains within the expected range. There were 1,256 children with Child Protection Plans at the end of June 2014, an increase of 79 compared to the March position and this is at the higher end of the expected range. Indicator Description
Previous Status
Current Status DOT
Case holding posts filled by permanent qualified social workers RED RED Children subject to a child protection plan for the second or subsequent time GREEN GREEN Percentage of on-line Case File Audits judged as adequate or better AMBER AMBER
The DfE lifted the Improvement Notice from Kent County Council (KCC) in December 2013. It is an encouraging step towards Kent achieving its aim of being ‘Outstanding’, providing the very best possible service for children most in need in Kent. This goal will be underpinned and shaped around consistently achieving the style of practice described within the services’ Social Work Contract. During June and July 2014 an external review was undertaken to determine the progress made by KCC since the Improvement Notice was lifted and the report detailing the findings of this review were shared with the Parliamentary Under-Secretary of State for the DfE. Specialist Children’s Services recently launched a consultation for the integration of the Care Leaver and Unaccompanied Asylum Seeking Children services into the wider Children in Care service. The consultation period ended on 13th August 2014. A forthcoming key decision updating the ‘policy for financial allowances for children’s arrangements’ is to be referred to the Cabinet Member for decision. Specialist Children’s Services is working with Early Help and Preventative Services with the assistance of external partner Newton Europe to deliver transformation in service delivery to improve outcomes for children and young people and the efficiency of service delivery.

Appendix 1
45
Children’s Safeguarding - Overview
Action Plan Update for the Recruitment and Retention of Qualified Social Workers Action
Dates Expected Outcome
Recruiting Newly Qualified Social Workers (NQSWs), through advertising on recruitment micro-site, competency based application and assessment process and cross area panel interviews.
Round 1 - April/May/June 2014 Round 2 - October/ November 2014
Good quality graduates appointed across the teams. Success to date includes 43 NQSW appointed.
Launch of new branding for 3 month recruitment campaign to recruit Team Managers, Qualified Social Workers, and Senior Practitioners.
May to July 2014 Good quality candidates appointed to fill underlying vacancies.
Review success for the overseas recruitment campaign in Ireland.
July 2014
Maximise opportunity of the campaign.
Overseas Recruitment in India
This project has been running from November 2013
Appointments to be made in July and project success reviewed.
Council Member Summit Held in July Identification of a number of areas to focus on, including targeted recruitment activity and a review of retention initiatives and payments. These areas will be added to the future Action Plan.

Appendix 1
46
Children’s Safeguarding - KPIs
Percentage of case holding posts filled by permanent qualified social workers
RED
50
60
70
80
90
Mar 13 Jun 13 Sep 13 Dec 13 Mar 14 Jun 14 Sep 14Target Actual
Mar 13 Jun 13 Sep 13 Dec 13 Mar 14 Jun 14 Sep 14 Actual 82% 80% 76% 76% 74% 71%* Target - - - - - 78.5% 81%
Recruitment and retention of qualified social workers remains difficult in current market conditions. Agency staff are being used to fill 20.1% of the vacancies to ensure average caseloads per social worker remain manageable, currently 14.9 cases for children in care teams and 22.9 for other teams. See previous page for the action plan update. * The definition and source for this indicator changed from April 2014, so latest figure is not directly comparable with previous figures.
Percentage of children becoming subject to a child protection plan for the second or subsequent time
GREEN
0
5
10
15
Mar 13 Jun 13 Sep 13 Dec 13 Mar 14 Jun 14 Sep 14Target Actual (YTD)
Mar 13 Jun 13 Sep 13 Dec 13 Mar 14 Jun 14 Sep 14 YTD 10.8% 10.9% 9.7% 8.6% 8.0% 9.2% Target 10% 10% 10% 10% 10% 10% 10% Performance for this measure remains within the optimum range set. Between April and June 2014, 413 children became subject to a Child Protection Plan, and 38 of these had been subject to a Child Protection Plan within the previous plan 24 months.

Appendix 1
47
Children’s Safeguarding - KPIs
Percentage of on-line Case File Audits judged adequate or better AMBER
70
80
90
100
Mar 13 Jun 13 Sep 13 Dec 13 Mar 14 Jun 14 Sep 14Target Actual
Mar 13 Jun 13 Sep 13 Dec 13 Mar 14 Jun 14 Sep 14 Actual - 95% 91% 89% 87% 86% Target - 100% 100% 100% 100% 100% 100% The drop in performance is a result of work undertaken to analyse the grading of the on-line case file audits against the findings from the separate Quality Audits which are completed by Independent Reviewing Officers (IROs) and Child Protection (CP) Chairs. Bringing together the separate auditing processes has created a broader consensus of thresholds for judgements and has improved consistency of grading.

Appendix 1
48
Children’s Safeguarding – Activity Indicators
The number of referrals decreased in the last quarter, from 5,334 to 5,098. The reported numbers of referrals has increased since September following a change of practice with the implementation of Liberi, with Domestic Abuse Notifications now recorded as Referrals. The Number of Children in Need decreased in the last quarter to 10,305. This figure includes Care Leavers who are over the age of 18 who have been included in the figure to match the definitions used by the DfE in their publication of national data. They are included here so that comparative rates can be used as the guide. Kent’s current rate has remained within the guide range. The number of children with Child Protection Plans increased to 1,256 this quarter. The guide range has been increased for 2014/15 which is reflective of national increases in children subject to a Child Protection Plan.
Quarterly number of Referrals
2,000
3,000
4,000
5,000
6,000
Mar 12 Sep 12 Mar 13 Sep 13 Mar 14 Sep 14 Mar 15Actual Lower Threshold Upper Threshold
Number of Children in Need (quarter-end count)
6,000
8,000
10,000
12,000
14,000
Mar 12 Sep 12 Mar 13 Sep 13 Mar 14 Sep 14 Mar 15Actual Lower Threshold Upper Threshold
Number of children with Child Protection Plans (quarter-end count)
500
750
1,000
1,250
1,500
Mar 12 Sep 12 Mar 13 Sep 13 Mar 14 Sep 14 Mar 15Actual Lower Threshold Upper Threshold

Appendix 1
49
Corporate Parenting - Overview
Cabinet Member Peter Oakford Director Philip Segurola
The percentage of care leavers who were adopted in the quarter was 25.2% (57 children) significantly ahead of target. The percentage of children in care who have been in the same placement for the last two years was 63.7%, a slight decrease from the year out-turn position for 2013/14. At 65%, the percentage of our looked after children in KCC Foster Care is above target and increasing. The number of indigenous Children in Care has remained fairly static over the last year and at the end of June 2014 was 1,597, a decrease of 27 children from the March 2014 position of 1,624. The number of these children placed with Independent Fostering Agencies decreased again this quarter down to 268. The number of Children in Care placed in Kent by other Local Authorities has increased to 1,261, the highest number since April 2012. Indicator Description
Previous Status
Current Status DOT
Percentage of children leaving care who are adopted GREEN GREEN Children in Care in same placement for the last 2 last years AMBER AMBER Percentage Kent children in care in KCC foster care GREEN GREEN
Listening to the views of children and young people in care is at the centre of the Council’s agenda. A report on this matter, supported by a Children in Care DVD and the outcomes of the ‘Your Voice Matters’ survey were presented to County Council in July 2014. See next page for more details. As stated in the Children’s Safeguarding section of this report, during June and July 2014 an external review was undertaken to determine the progress made by KCC since the Improvement Notice was lifted. This included a review by Jonathan Pearce (previous Chair of the Adoption Sub-Group) which focussed on the Adoption Service’s improvement journey. The progress report asserted that ‘there continues to be a strong drive, aspiration and ambition among the leaders, managers and staff to keep the service on a course of continuous improvement, and to achieve successful outcomes for the children, parents and families that are affected by the service’s work.’ The partnership, and relationship between both the Member-led Corporate Parenting Panel, and multi-agency officer led Kent Corporate Parenting Group continues to improve and develop, ensuring a shared agenda of priorities. The Council’s positive focus and active approach to its Corporate Parenting responsibilities was recently exemplified by the number of elected Council Members recently signing up to Kent’s Care Leavers Charter and the Kent Pledge for Children in Care.

Appendix 1
50
Corporate Parenting – Views of children and young people
Children and young people’s views Listening to the views of children and young people in care is at the centre of the Council’s agenda. A report on this matter, supported by a Children in Care DVD and the outcomes of the ‘Your Voice Matters’ survey was presented to County Council in July 2014. The paper was written by one of KCC’s Apprentice Participation Workers with the Virtual School Kent (herself a care leaver). The evidence presented demonstrated that there have been a number of positive impacts from the recent service Improvement Programme, whilst also indicating some areas to develop. The ‘Your Voice Matters’ survey was undertaken in Spring 2014 and 326 children and young people responded. Positive feedback from the survey included:
• Most children know who their social worker is, and can talk to them about problems.
• The majority of children feel they can speak to a caring adult if they are unhappy or have a problem.
• The majority of young children said they get help from their teacher to learn. • 98% of children aged 7 to 15 are happy or sometimes happy living with their
current family/foster carer. Areas for improvement included:
• 29% of children did not know how to speak to their Independent Reviewing Officer.
• Many children said they did not have a copy of their care plan. • A quarter of care leavers did not know who their Support Worker was.
Another important issue raised in the Children in Care DVD was the need for stability of placements and social worker. The outcomes and findings of the above report, DVD and survey will be acted upon and will help shape future improvements in how Specialist Children’s Services are delivered.

Appendix 1
51
Corporate Parenting - KPIs
Percentage of children leaving care who are adopted GREEN
0
10
20
30
Mar 13 Jun 13 Sep 13 Dec 13 Mar 14 Jun 14 Sep 14Target Stat. N. Actual (YTD)
Mar 13 Jun 13 Sep 13 Dec 13 Mar 14 Jun 14 Sep 14 YTD 12% 17% 17% 17% 17% 25% Target 13% 13% 13% 13% 13% 13% 13% High performance on adoptions continues to be maintained with 57 children being adopted in the first quarter of 2014/15. This compares to 40 for the same period of 2013/14, and 24 in 2012/13. Work continues to focus on the recruitment of sufficient adopters, and with partners to improve the timeliness of adoptions by reducing delays in the process.
Children in Care in same placement for the last 2 last years (for those in care for 2 and half years or more)
AMBER
40
50
60
70
80
Mar 13 Jun 13 Sep 13 Dec 13 Mar 14 Jun 14 Sep 14Target Nat. Ave. Actual (YTD)
Mar 13 Jun 13 Sep 13 Dec 13 Mar 14 Jun 14 Sep 14 YTD 69% 68% 66% 66% 67% 64% Target - 70% 70% 70% 70% 70% 70% This indicator is a measure of placement stability for those that have been looked after for at least two and a half years, and have been in the same placement for at least two years. Placement stability has shown a drop in the most recent quarter and a report has been commissioned by the Corporate Parenting Panel to analyse the reasons for placement moves. The highest range of stability is in the 9-12 age group, and stability decreases slightly for those aged 13 and above.

Appendix 1
52
Corporate Parenting - KPIs
Percentage Kent children in care in KCC foster care placements (excluding UASC)
GREEN
50
55
60
65
70
Mar 13 Jun 13 Sep 13 Dec 13 Mar 14 Jun 14 Sep 14Target Actual
Mar 13 Jun 13 Sep 13 Dec 13 Mar 14 Jun 14 Sep 14 Actual 62% 63% 62% 62% 63% 65% Target - - - - 60% 60% 60% One of the strategic priorities for Specialist Children’s Services is to find permanence and stability for children in care via in-house foster care. Performance for the first quarter of 2014/15 improved on the March 2014 position and was above target.

Appendix 1
53
Corporate Parenting – Activity Indicators
The number of indigenous Children in Care has decreased in the last quarter to 1,597. This is the lowest number since February 2012. The number of Children in Care placed in Kent by other Local Authorities has increased to 1,261, which is the highest number since April 2012. The number of children placed with Independent Fostering Agencies continues to decrease. There were 268 children placed with Independent Fostering Agencies as at the end of June 2014.
Number of indigenous Children in Care (quarter-end count)
1,000
1,200
1,400
1,600
1,800
Mar 12 Sep 12 Mar 13 Sep 13 Mar 14 Sep 14 Mar 15Actual Lower Threshold Upper Threshold
Number of other local authority children in care placed into Kent
1,000
1,100
1,200
1,300
Mar 12 Sep 12 Mar 13 Sep 13 Mar 14 Sep 14 Mar 15Actual Lower Threshold Upper Threshold
Number of children in independent fostering agency placements
200
250
300
350
400
Mar 12 Sep 12 Mar 13 Sep 13 Mar 14 Sep 14 Mar 15Actual

Appendix 1
54
Adult Social Care - Overview
Cabinet Member Graham Gibbens Corporate Director Andrew Ireland
Performance improved in the quarter for four of the indicators, but due to new stretch targets having been set for new financial year, for one indicator this improvement also resulted in a drop from a Green to an Amber rating. The number of clients with a Telecare service continues to increase ahead of target and in the quarter there was a noticeable reduction in new admissions for older people to residential and nursing care. The new indicator for Promoting Independence Reviews completed is currently below target although is improving month on month. Performance will be much improved from 1 October when other areas of the Transformation Programme are completed. Indicator Description
Previous Status
Current Status DOT
Percentage of contacts resolved at first point of contact GREEN AMBER Number of new clients referred to an enablement service AMBER GREEN
Number of clients receiving a Telecare service GREEN GREEN Number of Promoting Independence Reviews completed
New Indicator RED
Number of admissions to permanent residential or nursing care for older people AMBER GREEN
Clients still independent after enablement GREEN AMBER We have been working on Phase 1 of Adult Transformation Programme since 2012, when the initial assessment work was started. Design work has led to implementation which is now well underway, supported by our external partner Newton Europe. Phase 1 of the Adults Transformation Programme is successfully focussing on making better use of existing systems and embedding the culture of promoting service user independence, whilst establishing the foundations for future transformation. This has been mainly focused on the Older People Physical Disability division. Ongoing activity such as Health and Social Care Integration has continued and new legislation has meant the need for a new Care Act programme to comply with the new legislation. The Phase 1 work of the KCC and Newton Europe partnership on the ‘sandbox optimisation project’ was highly commended for ‘Innovation in Social Care’ at the 2014 Municipal Journal awards. In order to decide what will be included in Phase 2 of the Transformation Programme, Newton Europe were commissioned to carry out a 6 week assessment starting in June, focusing on Health and Social Care integration and clients with a Learning Disability. The assessment will inform a design and planning stage, including working with Clinical Commissioning Groups to identify ways to deliver service user benefits and savings through joint working.

Appendix 1
55
Adult Social Care - KPIs
Percentage of contacts resolved at point of contact AMBER
01020304050
Mar 13 Jun 13 Sep 13 Dec 13 Mar 14 Jun 14 Sep 14Target Actual
Mar 13 Jun 13 Sep 13 Dec 13 Mar 14 Jun 14 Sep 14 YTD 26% 29% 28% 37% 36% 39% Target 25% 25% 27% 29% 30% 40% 45%
A key priority for Adult Social Care is to respond to more people’s needs at the point of contact, through better information, advice and guidance, or provision of equipment where appropriate. Although performance in March was on target, and has since improved, as stretching targets for improvement have been set for this year, current performance is now very slightly behind target.
Number of new clients referred to an enablement service GREEN
1,000
1,500
2,000
2,500
Mar 13 Jun 13 Sep 13 Dec 13 Mar 14 Jun 14 Sep 14Target Actual
Mar 13 Jun 13 Sep 13 Dec 13 Mar 14 Jun 14 Sep 14 YTD 1,809 1,750 1,691 1,957 1,968 2,209 Target 2,100 2,100 2,100 2,100 2,100 2,100 2,200
During the last quarter we achieved our highest level to date for the number of clients referred to enablement. More clients are now expected to receive an enablement service, with a stronger focus on short term interventions, to reduce the need to provide long term care packages.

Appendix 1
56
Adult Social Care - KPIs
Number of clients receiving a Telecare service GREEN
0
1,000
2,000
3,000
4,000
Mar 13 Jun 13 Sep 13 Dec 13 Mar 14 Jun 14 Sep 14Target Actual
Mar 13 Jun 13 Sep 13 Dec 13 Mar 14 Jun 14 Sep 14 Actual 1,596 1,937 2,276 2,754 3,238 3,637 Target 1,300 1,525 1,750 1,975 2,200 3,331 3,424
The number of people in receipt of a Telecare service continues to exceed target. Telecare is being promoted as a key mechanism for supporting people to live independently at home, including within Personal Budgets. The availability of new monitoring devices (for dementia for instance) is expected to increase the usage and benefits of telecare. Awareness training continues to be delivered to staff to ensure we optimise the opportunities for supporting people with more complex and enabling teletechnology solutions. Number of Promoting Independence Reviews completed (new indicator)
RED
0
500
1,000
1,500
2,000
Mar 13 Jun 13 Sep 13 Dec 13 Mar 14 Jun 14 Sep 14Target Actual
Mar 13 Jun 13 Sep 13 Dec 13 Mar 14 Jun 14 Sep 14 Actual 1,028 Target 1,872 1,872
The percentage of reviews completed for the quarter to June 2014 was 55% of the target, however there was improvement each month. The current phase of the Transformation programme involves the staffing consultation, mobilisation of home care and staff reduction and these issues are influencing performance in the short term. This should be resolved from the 1 October 2014. Discussions continue to take place on a regular basis to ensure that any operational issues are identified and resolved.

Appendix 1
57
Adult Social Care - KPIs
Number of admissions to permanent residential and nursing care for older people (rolling 12 month totals)
GREEN
1,3001,4001,5001,6001,7001,800
Mar 13 Jun 13 Sep 13 Dec 13 Mar 14 Jun 14 Sep 14Target Actual
Mar 13 Jun 13 Sep 13 Dec 13 Mar 14 Jun14 Sep 14 Actual 1,619 1,707 1,651 1,651 1,628 1,482 Target 1,560 1,560 1,560 1,560 1,560 1,560 1,560
The number of new admissions to residential or nursing care for people aged 65+ reduced ahead of target during the last quarter.
Clients still independent after enablement service AMBER
30
40
50
60
Mar 13 Jun 13 Sep 13 Dec 13 Mar 14 Jun 14 Sep 14Target Actual
Mar 13 Jun 13 Sep 13 Dec 13 Mar 14 Jun14 Sep 14 Actual 41% 43% 46% 48% 51% 47% Target 50% 50% 50% 50% 50% 50%
Performance in the latest quarter was down from the quarter to March. Previous to this performance had been continually improving each quarter since March 2013. This indicator supports the evaluation of the effectiveness of the Enablement service in supporting independence, by preventing or reducing the need for more expensive services in the future.

Appendix 1
58
Adult Social Care – Activity Indicators
The general trend over the last 6 years both nationally and locally has been for reduced levels of local authority funded residential and nursing care placements. Continuing to reduce the number of these placements is a priority and will be achieved by supporting more to live independently through use of enablement services and independence reviews. At March 2014 the number of residential and nursing care placements funded by KCC was higher per head of population than at March 2013. However, data to June 2014 shows a reduction to the level seen previously in March 2013, and the early indications for financial year 2014/15 is that we will see further reductions in placements by March 2015.
Residential care placements per 1,000 older people
10
12
14
16
18
Mar 08 Mar 09 Mar 10 Mar 11 Mar 12 Mar 13 Mar 14Actual Nat. Ave.
Nursing care placements per 1,000 older people
4
5
6
7
8
Mar 08 Mar 09 Mar 10 Mar 11 Mar 12 Mar 13 Mar 14Actual Nat. Ave.
Residential and nursing care per 10,000 adults (age 18 to 64)
14
16
17
19
20
22
Mar 08 Mar 09 Mar 10 Mar 11 Mar 12 Mar 13 Mar 14Actual Nat. Ave.

Appendix 1
59
Adult Social Care – Activity Indicators
The number of hours of domiciliary care provided has reduced over time. Provision of enablement services, promoting independence reviews and telecare services are helping to reduce the demand levels for domiciliary care. Over the last 12 months usage of domiciliary care has been relatively stable around the 540,000 level every quarter. The budget assumptions for 2014/15 assume this will reduce by over 45% to less than 300,000 for the quarter to March 2015. See Financial Monitoring Report for more information on this indicator. The number of clients with Direct Payments is expected to increase about 9% over the same time period.
Hours of domicilary care provided for older people (by quarter)
300,000
360,000
420,000
480,000
540,000
600,000
Mar 12 Sep 12 Mar 13 Sep 13 Mar 14 Sep 14 Mar 15Actual Lower Threshold Upper Threshold
Number of clients who receive an on-going Direct Payment
2,500
2,700
2,900
3,100
3,300
3,500
Mar 12 Sep 12 Mar 13 Sep 13 Mar 14 Sep 14 Mar 15Actual Lower Threshold Upper Threshold

Appendix 1
60
Public Health - Overview
Cabinet Member Graham Gibbens Director Andrew Scott-Clark (Interim)
Performance of the key Public Health commissioned services continued to improve in last quarter. Targets for delivery of NHS Health Checks, smoking quits and access to sexual health (GUM) services were all met. There has been a reduction in the gap in premature mortality (all causes under-75 years old) between Thanet (high deprivation district) and Sevenoaks (low deprivation district). Teenage pregnancy (under-18 year old conceptions rate) has also been decreasing and fell below the national rate in 2012. The proportion of children within the healthy weight range was higher in Kent than national proportions in 2012 and 2013. Indicator Description
Previous Status
Current Status DOT
Percentage completion of NHS health checks for target population aged 40 to 74 AMBER GREEN Number of smokers successfully quitting, having set a quit date AMBER GREEN Proportion of clients accessing GUM offered an appointment to be seen within 48 hours GREEN GREEN
The improvement on NHS Health Checks has been achieved following a concentrated focus on performance and contract management of the provider commissioned to deliver the programme. The target for the quarter to September is more stretching as providers will be expected to deliver significantly more checks as a result of the large volume of invites sent out in the first quarter. Reducing smoking rates across the county continues to be a high priority for Public Health. The smoking cessation service met the target for the proportion of smokers setting a quit date who go on to quit smoking successfully. Further service development is needed to ensure that smoking cessation programmes remain relevant and targeted in a rapidly changing environment which includes increasing use of electronic cigarettes. To address this, Public Health has commissioned a review of stop smoking services in Kent which will report in the coming weeks. This review will inform the development of future commissioning intentions on smoking which will need to ensure that services are targeted more effectively at reducing health inequalities and reducing smoking in pregnancy. Kent drug and alcohol action team (KDAAT) are in the process of transferring to Public Health. A related performance indicator will be added to future reports. Public Health is adopting an innovative commissioning approach to addressing the critical priorities in 2014/15, including integrating commissioning and service delivery wherever possible and maximising the public health impact of other KCC services.

Appendix 1
61
Public Health - KPIs
Percentage of annual target population with completed NHS Health checks each quarter
GREEN
0
5
10
15
Mar 13 Jun 13 Sep 13 Dec 13 Mar 14 Jun 14 Sep 14Target Nat. Ave. Actual
Mar 13 Jun 13 Sep 13 Dec 13 Mar 14 Jun 14 Sep 14 Actual 10.5% 7.3% 9.9% 7.8% 12.0% 11.3% Target 12% 12% 12% 12% 13% 10% 13% The target of 50% of the eligible population to receive a health check has been split across the year to take into account the impact of delivery following 2013/14 and planned activity surrounding invites. During the quarter to June 2014, 37,053 invites were sent, which is an increase on the number sent for the same time last year, which was 19,761 invites. Actual checks delivered at 10,074 in the quarter was also a significant increase on the same time last year (6,455).
Number of smokers successfully quitting, having set a quit date GREEN
40
45
50
55
60
Mar 13 Jun 13 Sep 13 Dec 13 Mar 14 Jun 14 Sep 14Target Nat. Ave. Actual
Mar 13 Jun 13 Sep 13 Dec 13 Mar 14 Jun 14 Sep 14 Actual 47% 50% 50% 51% 57% Target 52% 52% 52% 52% 52% 52% In Q4 2013/14 the proportion of people achieving a 4-week quit via the smoking cessation service was 57% compared to a target of 52%. 2,885 people set a date during the quarter and 1,653 achieved the 4-week quit. The full year figures for 2013/14 were 11,769 people setting a quit date, with 6,131 achieving a 4-week quit (52%).

Appendix 1
62
Public Health – KPIs
Proportion of clients accessing GUM offered an appointment to be seen within 48 hours
GREEN
9092949698
100
Mar 13 Jun 13 Sep 13 Dec 13 Mar 14 Jun 14 Sep 14Target Nat. Ave. Actual
Mar 13 Jun 13 Sep 13 Dec 13 Mar 14 Jun 14 Sep 14 Actual 98% 97.8% 96.6% 97.4% 99.9% Target 95% 95% 95% 95% 95% 95% 95% Community Sexual Health services continue to exceed target for access with almost 100% of service users seen within the expected 48 hour timeframe. Public Health is currently working with providers to ensure that CCG location data can be presented in future reports.

Appendix 1
63
Public Health – Activity Indicators
The gap in premature mortality (all causes under-75 years old) between Thanet and Sevenoaks districts has decreased in recent years, although it should be noted that there are other measures for health inequality which may give different indications. Under-18 year old conceptions rate have also been decreasing and the proportion of children within the healthy weight range (both Year R and Year 6) is higher than national proportions in 2012 and 2013.
Mortality from all causes per 100,000 population aged under 75
150
250
350
450
2005 2006 2007 2008 2009 2010 2011 2012Sevenoaks Thanet
Conceptions per 1,000 females aged 15 to 17
2025303540
2008 2009 2010 2011 2012 2013Kent Nat. Ave.
Percentage of children with healthy weight - reception year
7274767880
2009 2010 2011 2012 2013Kent Nat. Ave.
Percentage of children with healthy weight – year 6
6264666870
2009 2010 2011 2012 2013Kent Nat. Ave.

Appendix 1
64
Corporate Risk Register - Overview
A new Risk has been added to the Corporate Risk Register during quarter 1 2014/15, CRR19 relating to implementation of the Care Act 2014. A Care Act Programme has been established to ensure KCC is well placed to deliver its new responsibilities and that Kent residents who need social care, their carers and local providers are able to take advantage of the new developments. Two risk ratings have increased during the last quarter CRR 9 – Health & Social Care Integration (Better Care Fund) and CRR 13 – Delivery of 2014/15 savings. The register will continue to evolve in the coming months as a result of the more formal annual refresh taking place during quarter 2. Risk No. Risk Title Current
Rating Target Rating
CRR 1 Data and Information Management 9 9
CRR 2 Safeguarding 15 10
CRR 3 Access to resources to aid economic growth and enabling infrastructure 12 8
CRR 4 Civil Contingencies and Resilience 12 8
CRR 7 Governance & Internal Control 12 8
CRR 9 Health & Social Care integration (Better Care Fund) 16 12
CRR 10(a) Management of Adult Social Care Demand 20 12
CRR 10(b) Management of Demand – Specialist Children’s Services 20 12
CRR 12 Welfare Reform changes 12 9
CRR 13 Delivery of 2014/15 savings 16 4
CRR 14 Procurement 9 6
CRR 17 Future operating environment for local government 20 10
CRR 18 Public Services Network – compliance with Code of Connection security standards 8 4
CRR 19 Implementation of the Care Act 2014 15 6
Low Risk Medium Risk High Risk
Rating = 1 to 6 Rating = 8 to 15 Rating = 16 to 25

Appendix 1
65
Corporate Risk Register – Mitigating Actions (1)
There were 14 actions listed to mitigate elements of Corporate Risks that were due for completion or review up to the end of June 2014 and updates have been provided for 13 actions due for completion or review by September 2014. Due Date for Completion
Actions Completed
Actions Closed
Actions Outstanding
Regular Review
June 2014 5 1 2 6
September 2014 2 2 6 3 A summary of progress against mitigating actions is provided below. CRR1 - Data and Information Management Outstanding: A large proportion of our staff have now undertaken the mandatory Information Governance training. The Information Resilience and Transparency team is working with Human Resources to determine which staff are yet to complete the training, to enable targeting of further efforts.
CRR2 - Safeguarding Outstanding: The ‘Annex A’ peer review has been deferred until October 2014, as a result of issues with availability of data and the reviewing Local Authority. Preparations are in progress in readiness for the review.
Regular Review: The Ofsted Action Plan has been presented to both the Children’s Social Care and Health Cabinet Committee, and the Kent Safeguarding and Looked After Children Improvement Board. This is part of KCC Specialist Children’s Services Improvement Notice 6 monthly review. A new template for the second phase of the Ofsted Action Plan has been designed to drive consistency of practice and move Specialist Children’s Services forward towards ‘Good’.
Regular Review: Audit of Children in Need (CIN) cases to be undertaken. All May – July 2014 peer-review audits will focus on CIN cases. Outcomes of the audit will be presented to the Specialist Children’s Services Divisional Management Team in September for scrutiny, challenge and management oversight.
CRR3 - Access to Resources to aid Economic Growth and Enabling Infrastructure
Completed: The Strategic Economic Plan was submitted to Government on 31st March. The Growth Deal allocation was announced in July, allocating £442 million to the South East (of which £133 million is for specific identified schemes in Kent and Medway).

Appendix 1
66
Corporate Risk Register – Mitigating Actions (2)
Summary of progress against mitigating actions (continued). CRR4 - Civil Contingencies and Resilience Outstanding: A claim for emergency financial assistance from Government to aid funding of recovery in Kent following Christmas/New Year storms and floods has been made – KCC is awaiting a response from Government.
Completed: Lessons learnt from recent severe weather were reported to Cabinet on 7th July 2014, with 17 recommendations for improvement approved.
Regular Review: The Customer Relationship Management (CRM) project has been paused, subject to endorsement by the Business Capability Portfolio Board and Transformation Advisory Group. The CRM project Board is in position and ready to progress this work and Ciber-MS Development partner is on standby.
CRR7 - Governance and Internal Control Outstanding: Decision making guidance is being developed for publication on our intranet site. Design and functionality of the decision page is making good progress.
In Place: Democratic Services officer support is available for managers to seek guidance at an early stage on the appropriate route for decisions to be taken.
Regular Review: Face to face training on decision making processes continues. It is anticipated that the e-learning resource will be available in September 2014.
CRR9 - Better Care Fund (Health & Social Care integration) Outstanding: Clarification of governance arrangements for pooled budgets with Clinical Commissioning Groups via the Health & Wellbeing Board – a report will be taken to the Health & Wellbeing Board in September 2014.
Regular Review: A series of summits have been arranged to support engagement and work between adult and children’s health services and Kent Clinical Commissioning Groups.
CRR10a - Management of Adult Social Care Demand Completed: A Care Act Implementation Programme has been established and was reported to the Adults Transformation Board on 23rd July 2014. Initial analysis to identify the likely extent of demand for Deprivation of Liberty assessments under the Mental Capacity Act has been completed, with further, more detailed work in progress.
CRR10b - Management of Demand – Specialist Children’s Services Completed: Scoping of the diagnostic work, with the aid of the efficiency partner, for Specialist Children’s Services and Preventative Services has been completed and is now moving into the Design phase.

Appendix 1
67
Corporate Risk Register – Mitigating Actions (3) Summary of progress against mitigating actions (continued). CRR12 - Welfare Reform Changes Regular Review: Close monitoring of demand and performance of Kent Support and Assistance Service (KSAS) to inform planning of future programme. An evaluation of KSAS has been undertaken and outcomes will be reported to Cabinet.
CRR13 - Delivery of 2014/15 Savings Regular Review: Management action plan being devised to address potential 2014/15 budget issues in children’s services programme - efficiency partner has completed the scoping work for Phase 1.
CRR14 - Procurement Outstanding: A “Commissioning” work stream within the Business Capability Change Portfolio has been established to deliver the recommendations set out in the May 2014 County Council paper Facing the Challenge: Towards a Strategic Commissioning Authority, with developments to be reported in autumn 2014.
CRR17 - Future Operating Environment for Local Government Outstanding: Further development of Change Portfolio arrangements. All four of the change portfolios have been established with draft terms of reference set. Further developments around governance, dependencies and reporting of financial performance are being progressed.
Completed: Staff development and Leadership & Management frameworks established to further develop key skills, including commercial acumen and contract management, across the organisation as an essential enabler of transformation.
Regular Review: Indicative cash limits have been agreed in support of the production of a three year spending plan. Interventions have been developed to improve professional capacity and capability of project and programme delivery as a distinct skill set within KCC. Application made for corporate membership of the Association of Project Management. Maturity assessment undertaken and the results communicated to the business in August 2014. Project Management modules have now been incorporated into the e-learning gateway. The Project Management Community Forum has been established.
CRR18 - Public Sector Network – Compliance with Code of Connection Regular Review: An action plan has been developed in readiness for the restart of the 2014/15 annual assessment process.

Appendix 1
68
Organisational Development
Cabinet Member Gary Cooke Director Amanda Beer
Indicator Summary Staffing numbers decreased by 72.9 FTE between March 2014 and the end of June 2014, which follows a relatively static level between September 2013 and March 2014. Twelve month rolling sickness levels rose very slightly between March and June 2014, to 6.9 days lost per FTE. Rolling turnover increased slightly, to 12.9%, between March and June 2014 and there were 30 redundancies in the first quarter of 2014/15 and 15 of these were compulsory. There has been a slight rise in the percentage of staff aged 25 or under. The numbers of ‘active’ disciplinary, grievance and harassment cases are higher than in March 2014, as are the number of employment tribunals but numbers are similar to the same time last year. Organisation Development and People Plan Highlights from the last quarter include continuing work with service managers to identify critical roles and future successors. Also work has started to support managers and teams to change the way we do things in ways that will benefit the customer. A Future Managers Programme is being developed for launch. The Human Resources Advisory Team continues to support significant change activity across divisions and business units. Workforce Planning Following the successful completion of the workforce planning pilots in 2013/14, targeted interventions have now begun in using the templates developed to support managers identify the critical roles, people and skills that will be required to deliver future services and to support the ‘Facing the Challenge’ transformation plan. Managers, particularly at Head of Service level and above, will be able to identify critical roles and develop succession plans and will be in a better position to understand, as a minimum, the roles critical to business delivery. Managers will be in a better position to assess the capabilities of their staff and can have better quality conversations on how to enhance capabilities and address any gaps. The key deliverable is that workforce planning is integrated with business planning. Further development work will take place in 2014/15 to embed the approach and to begin phase 2, which will take a more strategic focus and develop an external partnership approach to ensure partner organisations providing KCC services also consider workforce planning. This will also include ensuring the approaches compliment the Organisation Design methodology being rolled out. The way we do things We are currently working with a number of divisions, services and smaller teams to change the way they do things (culture). We have representation from every Directorate and are using a high participation, high engagement approach, to bring about sustainable transformational change that supports both service delivery and Facing the Challenge. This works includes working in collaboration with colleagues in Property and ICT to deliver the New Ways of Working projects.

Appendix 1
69
Organisational Development
Staff Awards Staff continue to be recognised for their contributions through staff awards. During this quarter 28 internal nominations have been received, 23 for individuals and 5 for teams across all directorates, and 13 external nominations, 9 individual and 4 team, again across all directorates. Following feedback from Directorates we are working to encourage more nominations, through trialling peer to peer nominations and working with Internal Communications to promote specific Staff Award nomination days. We are also working with Skills and Employability to recognise contribution from Apprentices. Apprentices The Apprentice pay and progression framework was launched on 1st April and contained the new KCC Apprentice Guidance for Managers. The framework provides a clear (and increased) pay structure for apprentices with the aim to attract and retain more talented young people and encourage progression into higher and advanced level apprenticeships. In 2014/15, further work will be undertaken to support the Skills and Employability division in delivering on this agenda in an integrated way. The New Kent Manager In April of this year we launched the New Kent Manager which has a 7 module format. As at March 2014 we had 494 managers who had achieved their Kent Manager Standard accreditation and this increased to 539 managers by the end of June, which is 25% of all eligible managers. The percentage of eligible managers have now completed at least one module is 41%. Managers continue to evidence learning, skills and knowledge as part of the programme with supporting development opportunities continually reviewed to ensure we have the management skills in place to support the ‘Facing the Challenge’ transformation plan. The Kent 360 As part of the Leadership and Development strategy we are seeking a holistic view of the skills and attributes of KCCs leaders and managers. All Kent managers have been invited to take part in issuing The Kent 360 to their own managers, peers, customers and staff. As at 31 July 800 managers have requested individual feedback which will inform discussion and decisions on further development, self-reflective elements of the New Kent Manager system and directorate and organisational profiles. Change Activity An approach to Organisation Design has been developed for KCC and a programme to communicate this is now underway. There continues to be a significant level of change activity in divisions and business units and the Human Resources Advisory Team is supporting over 100 projects of varying size and complexity. Major on-going activity includes ‘Facing the Challenge’ – market engagement and service reviews, the Adult Transformation programme, the 0 -25 Transformation programme New Ways of Working programme, total Facilities Management programme, ICT pay and reward review, and various transfers of services both in and out of KCC. Significant activity has been targeted to prepare and support managers to deliver the transformation agenda and the self-sufficiency agenda.

Appendix 1
70
Organisational Development - Indicators
Number of full time equivalent (FTE) staff employed
7,000
8,000
9,000
10,000
11,000
Mar 10 Mar 11 Mar 12 Mar 13 Mar 14 Jun 14 Sep 14Actual
Mar 10 Mar 11 Mar 12 Mar 13 Mar 14 Jun 14 Sep 14 Actual 10,531 10,061 9,187 8,875 8,162 8,089 The FTE level has decreased again this quarter, following the general downward trend noted over recent years. Data is reported as count at each quarter end. Casual Relief, Sessional and Supply (CRSS) staff are not included. Schools staff are not included.
Average number of days of sickness per FTE (rolling 12 month figures)
56789
10
Mar 10 Mar 11 Mar 12 Mar 13 Mar 14 Jun 14 Sep 14
Mar 10 Mar 11 Mar 12 Mar 13 Mar 14 Jun 14 Sep 14 Actual 8.6 7.8 7.8 7.4 6.8 6.9 Although the 12 month rolling sickness level rose slightly from March to June 2014, the figure is still notably lower than in previous years. Data is reported as average days sick per FTE for the past 12 months. Sickness relating to CRSS staff is included in the count of days lost.

Appendix 1
71
Organisational Development - Indicators
Turnover - percentage of staff leaving as a percentage of headcount
0
5
10
15
20
Mar 10 Mar 11 Mar 12 Mar 13 Mar 14 Jun 14 Sep 14
Mar 10 Mar 11 Mar 12 Mar 13 Mar 14 Jun 14 Sep 14 Actual 11.3% 14.1% 16.1% 18.3% 12.1% 12.9% Turnover has increased slightly over recent months, but is still well below the March 2013 peak. Data is reported as a rolling 12 month rate. Casual Relief, Sessional and Supply (CRSS) staff are not included. Schools staff are not included.
Percentage of staff (headcount basis) aged 25 or under
5
6
7
8
9
Mar 10 Mar 11 Mar 12 Mar 13 Mar 14 Jun 14 Sep 14
Mar 10 Mar 11 Mar 12 Mar 13 Mar 14 Jun 14 Sep 14 Actual 8.0 7.6 6.7 6.9 7.0 7.1 The proportion of staff aged 25 or under has increased marginally in the first quarter. Although there has been a gradual rise over the last two years, the figure is still below the March 2010 figure.

Appendix 1
72
Organisational Development - Indicators
Disciplinaries, Grievances and Employment Tribunals (currently active)
Trend Data – snapshot Jun 13 Sept 13 Dec 13 Mar 14 Jun 14
Disciplinaries 32 35 35 24 31
Grievances 9 5 5 3 10
Harassment 3 4 2 1 3
Performance & Capability - Performance - Ill Health
24 72
15 76
15 66
24 69
18 72
Employment Tribunals 5 6 5 6 9
TOTAL CASES 145 141 128 127 143 Data Notes: Data is reported as the number of cases open being dealt with at quarter end.
Health and Safety Incidents
Trend Data Previous Years Current Financial Year Mar 12 Mar 13 Mar 14 Jun 14 Sep 14 Dec 14 Mar 15
Incidents reported 1,350 1,620 1,591 323
Days lost 1,027 943 676 72 Data Notes: Schools staff are included. Data is reported as quarter totals for current year and full year counts for previous year.
Reporting of Injuries, Diseases and Dangerous Occurrences Regulations (RIDDOR)
Trend Data Previous Years Current Financial Year Mar 12 Mar 13 Mar 14 Jun 14 Sep 14 Dec 14 Mar 15
Major injury incidents 6 5 3 1
Over 7 day injuries N/A 25 24 4
Data Notes: Data is reported as quarter totals for current year and full year counts for previous year. The requirement to report to the Health and Safety Executive injury incidents resulting in over 3 days lost time/unable to perform normal duties, has changed to over 7 days.


![Quarterly Performance Review [Company Update]](https://static.documents.pub/doc/80x56/577c7f061a28abe054a2ec36/quarterly-performance-review-company-update.jpg)


