Page 1
1
TheGraduate!Network’sBridgingTheTalentGapInitiative
TheGraduate!Network’sBridgingTheTalentGapInitiative
www.bridgingthetalentgap.org
Kentucky – Bridging The Talent Gap TalentAlignmentSurveyReport
SubmittedMay2017
DanAshPhDZachZimmerman
Page 2
K Y SHRM TA LENT A L IGNMENT SURVEY R EPORT P AGE 2
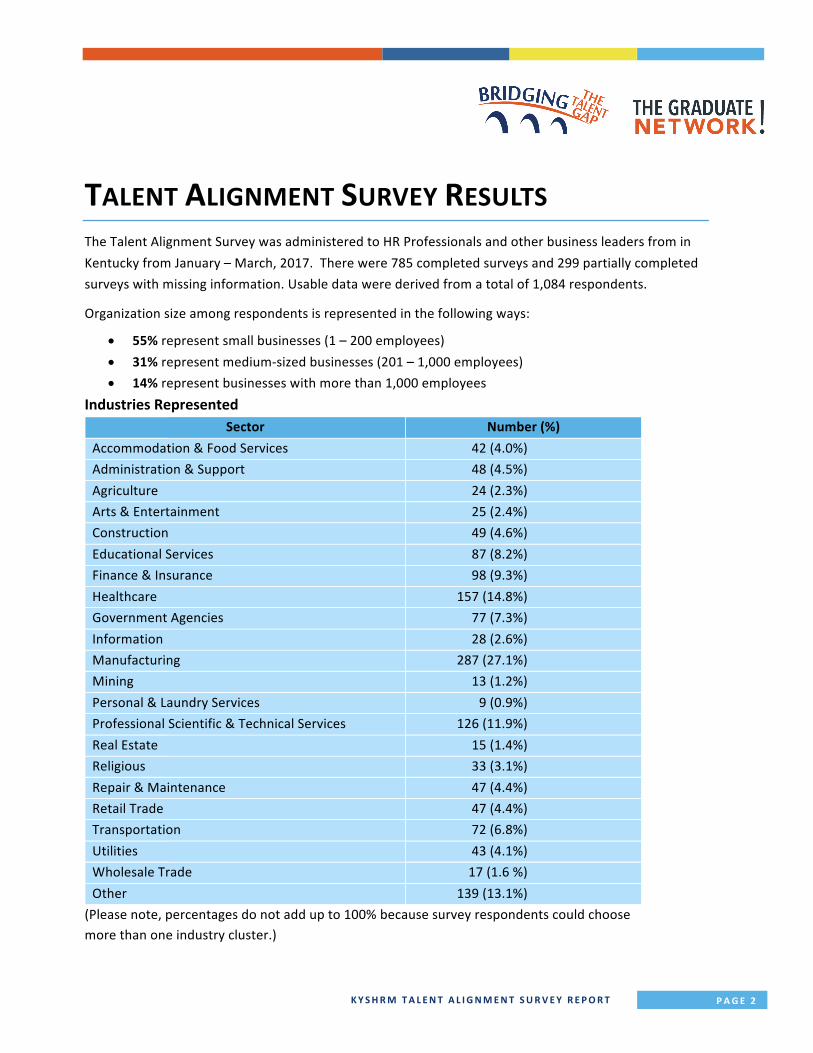
TALENTALIGNMENTSURVEYRESULTSTheTalentAlignmentSurveywasadministeredtoHRProfessionalsandotherbusinessleadersfrominKentuckyfromJanuary–March,2017.Therewere785completedsurveysand299partiallycompletedsurveyswithmissinginformation.Usabledatawerederivedfromatotalof1,084respondents.
Organizationsizeamongrespondentsisrepresentedinthefollowingways:
• 55%representsmallbusinesses(1–200employees)• 31%representmedium-sizedbusinesses(201–1,000employees)• 14%representbusinesseswithmorethan1,000employees
IndustriesRepresentedSector Number(%)
Accommodation&FoodServices 42(4.0%)Administration&Support 48(4.5%)Agriculture 24(2.3%)Arts&Entertainment 25(2.4%)Construction 49(4.6%)EducationalServices 87(8.2%)Finance&Insurance 98(9.3%)Healthcare 157(14.8%)GovernmentAgencies 77(7.3%)Information 28(2.6%)Manufacturing 287(27.1%)Mining 13(1.2%)Personal&LaundryServices 9(0.9%)ProfessionalScientific&TechnicalServices 126(11.9%)RealEstate 15(1.4%)Religious 33(3.1%)Repair&Maintenance 47(4.4%)RetailTrade 47(4.4%)Transportation 72(6.8%)Utilities 43(4.1%)WholesaleTrade 17(1.6%)Other 139(13.1%)
(Pleasenote,percentagesdonotaddupto100%becausesurveyrespondentscouldchoosemorethanoneindustrycluster.)
Page 3
K Y SHRM TA LENT A L IGNMENT SURVEY R EPORT P AGE 3
ExecutiveSummaryoftheFindings
CommunityLandscape
• Atotalof68%ofsurveyrespondentsdescribedtheeconomicconditionsintheircommunityaspositive.Oftheindustriesmostrepresentedinthesurvey,realestateheldthemostoptimisticview(87%positive).Conversely,theleastoptimisticindustryamongthosemostrepresentedwasminingwith38%holdingapositiveviewofthecommunity’seconomicconditions.
• Amongthetopthreeindustriesrepresentedinthesurvey,70%ofrespondentsinvolvedinmanufacturingviewedeconomicconditionsintheircommunityaspositive.57%ofhealthcareorganizationsand75%ofprofessional,scientificandtechnicalservicesorganizationsheldsimilarviews.
• 81%reportthattheirrespectivecompaniesarepreparingformoderatetohighgrowthinthenext3-5years.Amongindustriesmostrepresentedinthesurvey,wholesalewasthemostlikelytoanticipategrowth,with94%ofrespondentsexpectingmoderateorfastgrowth.53%ofgovernmentwastheleastlikelytoanticipategrowth.
• Amongthetopthreeindustriesrepresentedinthesurvey,86%ofrespondentsinvolvedinmanufacturinganticipatedgrowth.79%ofhealthcareorganizationsand80%ofprofessional,scientificandtechnicalservicesorganizationsheldsimilarviews.
HiringLandscape
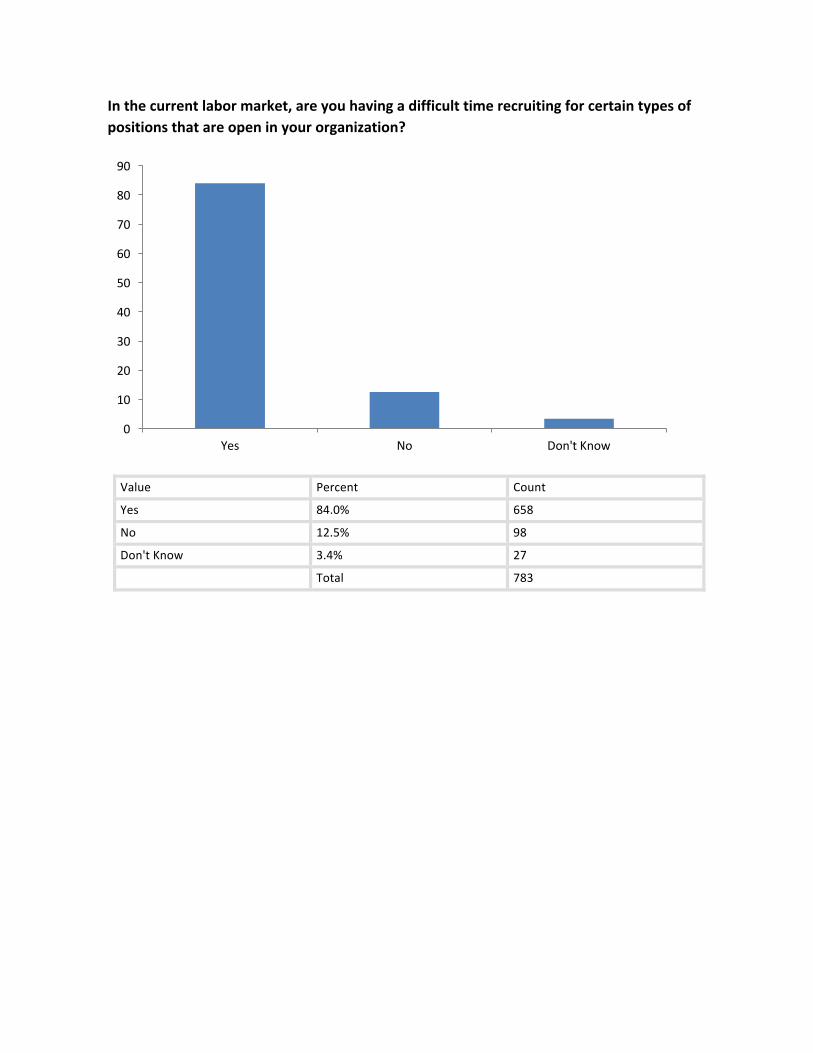
• Amongthosecurrentlyhiring,84%indicatedthatrecruitingqualifiedworkersisdifficult.
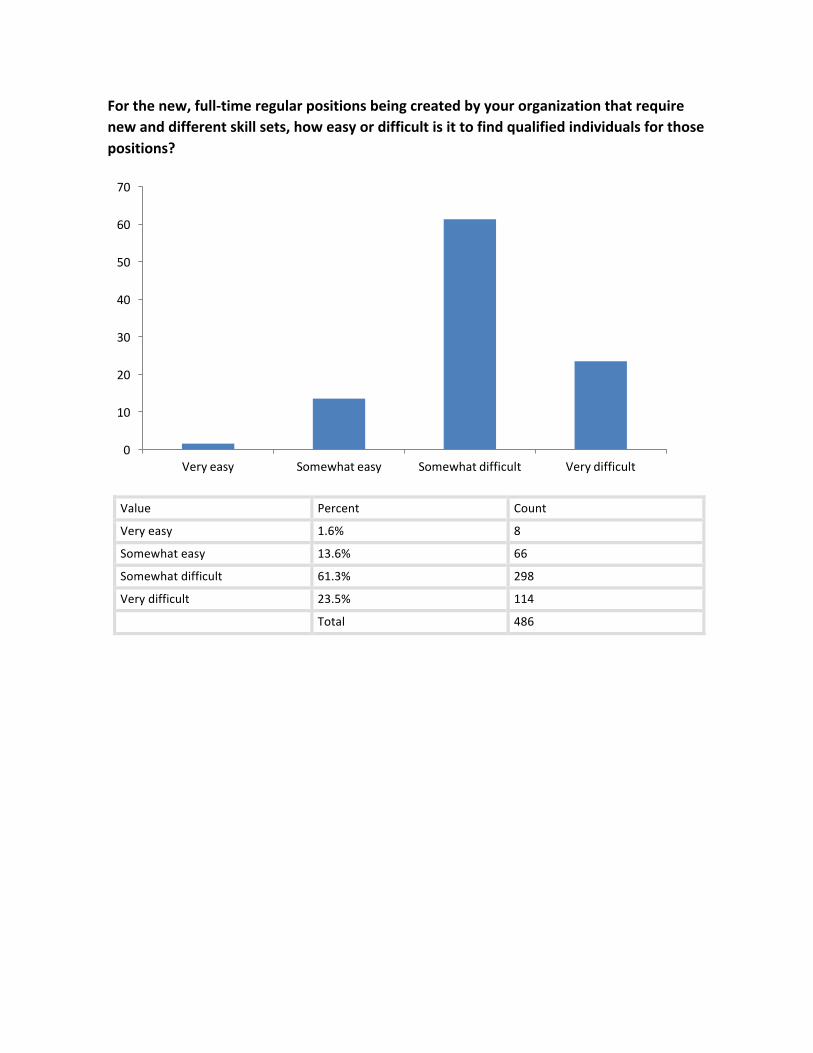
• Forrespondentshiringfornewfull-timeregularpositionsrequiringnewanddifferentskills,85%reportitsomewhatorverydifficulttofindqualifiedindividualsfornewregularjobsrequiringnewanddifferentskillsets.
• 77%ofthebusinesscommunityiscurrentlyhiringforfull-time,regularstaff.Amongthosecurrentlyhiringforfulltimepositions,86%arehiringnon-managementhourlyemployeeswhile11%arehiringexecutivelevelmanagement.
• Amongthosecurrentlyhiring,32%areinvolvedinnewhiresfordirectreplacementsthatrequireneworupdatedskills,while26%ofrespondentsarehiringfornewpositionsthatrequireneworupdatedskills.
Page 4
K Y SHRM TA LENT A L IGNMENT SURVEY R EPORT P AGE 4
• Amongapplicablerespondents,thejobsfoundmostdifficulttofillincludehigh-skillmedical(nurses,doctors,specialists)(85%somewhatorverydifficult),skilledtrades(electricians,carpenters,machinists,mechanics,welders,plumbers)(85%somewhatorverydifficult),andengineers(83%somewhatorverydifficult).
• Somewhatorveryeasypositionstofillamongapplicablerespondentsincludeadministrativesupportstaff(64%),customerservicerepresentatives(52%)andHRprofessionals(46%).
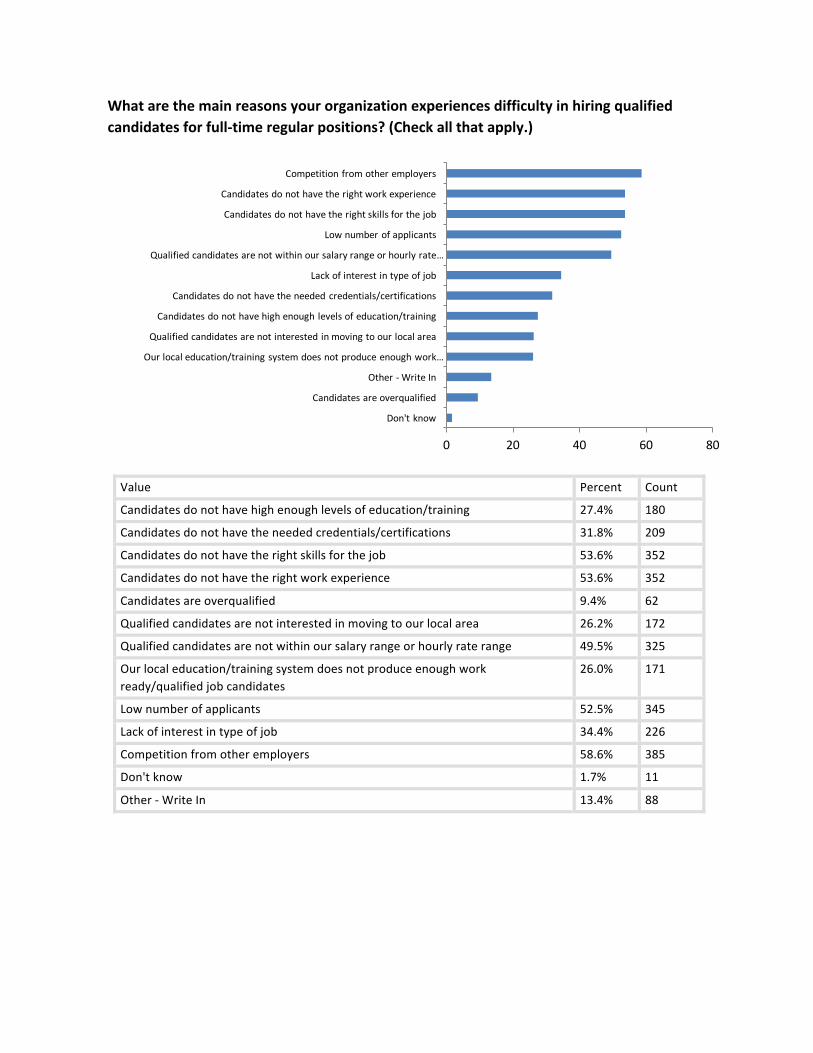
• Themainreasonsrespondentsexperiencedifficultyinhiringincludecompetitionfromotheremployers(59%),candidatesnothavingtherightworkexperience(54%),andcandidatesnothavingtherightskillsforthejob(54%).Only26%ofrespondentsidentifiedtheideathatlocaleducation/trainingsystemdoesproduceenoughworkready/qualifiedcandidatesasamainreasonforsuchdifficulty.
SkillNeedsLandscape
• Acrossallbasicskills,respondentsreportedthat69%ofhighschooldiplomaholdersintheirlaborpoolpossessedtheskillsneededfortheirjob.Thisfigurewas80%fortechnical/communitycollegegraduatesand88%forfour-yearcollegegraduates.Thebasicskillexperiencingthegreatestincreaseinrespondents’opinionswaswrittenEnglishwithanincreaseinthepercentof“yes”responsesof28percentagepointsfromhighschooldiplomaholderstothosewithafour-yearcollegedegree.
• Amongbasicskillsconsidered,spokenEnglishwasratedwiththegreatestproportionofyesresponsesamongthelaborpoolwithahighschooldiploma(86%).Amongtwo-yeardegreeholders,spokenEnglish,also,wasratedwiththepercentageofyesresponses(88%).Forfour-yeardegreeholdersinthelaborpool,spokenEnglishwasagainidentifiedwiththehighestpercentageofyesresponses(92%).
• Acrossallacademicknowledgeandskills,respondentsreportedthat25%ofhighschooldiplomaholdersintheirlaborpoolpossessedtheskillsneededfortheirjobs.Thisfigurewas33%fortechnical/communitycollegegraduatesand52%forfour-yearcollegegraduates.Theacademicknowledge/skillexperiencingthegreatestincreaseinrespondents’opinionswasgovernment/economicswithanincreaseinthepercentof“yes”responsesof38percentagepointsfromhighschooldiplomaholderstothosewithafour-yearcollegedegree.
• Amongacademicknowledgeandskillsconsidered,history/geographywasratedwiththegreatestproportionofyesresponsesamongthelaborpoolwithahighschooldiploma(33%).Amongtwo-yeardegreeholders,sciencereceivedthegreatest
Page 5
K Y SHRM TA LENT A L IGNMENT SURVEY R EPORT P AGE 5
percentageofyesresponses(50%).Forfour-yeardegreeholdersinthelaborpool,sciencewasalsoidentifiedwiththehighestpercentageofyesresponses(63%).
• Acrossallappliedskills,respondentsreportedthat42%ofhighschooldiplomaholdersintheirlaborpoolpossessedtheskillsneededfortheirjobs.Thisfigurewas64%fortechnical/communitycollegegraduatesand77%forfour-yearcollegegraduates.Theappliedskillexperiencingthegreatestincreaseinrespondents’opinionswasleadershipwithanincreaseinthepercentof“yes”responsesof47percentagepointsfromhighschooldiplomaholderstothosewithafour-yearcollegedegree.
• Amongappliedskillsconsidered,diversitywasratedwiththegreatestproportionofyesresponsesamongthelaborpoolwithahighschooldiploma(56%).Amongtwo-yeardegreeholders,informationtechnologyapplicationwasratedwiththepercentageofyesresponses(77%).Forfour-yeardegreeholdersinthelaborpool,informationtechnologyapplicationagainwasidentifiedwiththehighestpercentageofyesresponses(82%).
LearningLandscape
• TheeducationcredentialwiththehighestnumberofrespondentsexpectingincreasedneedoverthenextfiveyearswastheBachelor’sdegreewith41%oforganizationsreportinganticipatedincreasedneeds.Workerswitha(n)industry/professionalassociationcredentialoccupiedthesamelevelofanticipatedneedwith41%oforganizationsprojectingincreasedneedinthefuture.
• Supportforlearningwasmixedacrossrespondents.59%providefinancialsupporttopursuecollegelevelcourses,55%offerfinancialsupportforlearning/trainingthatisnotcollegecoursework,82%provideon-the-joblearningortraining,53%providesupportinnon-financialways.6%reportthattheirorganizationdoesnotprovideanyoftheseeducationbenefits.
• Respondentsofferavarietyofmethodssupportingeducation.Amongthosemostoftenidentifiedincludeflexibleworkschedulingtoaccommodateemployees’classes(71%),advisetoemployeesonwhichdegreeswillbenefittheircareer(44%),publicrecognitionofemployeeswhograduateorachievesignificanteducationalmilestones(44%),andmakingofficetechnologyavailabletoemployeesforstudying/schoolworkafterscheduledworkhours(34%).
• Onaverage51%offinancialbenefitsofferedtoemployeesisutilizedannually.Themainreasonsgivenforlearningbenefitsnotbeingutilizedmorefullyinvolveworkersbeingtoobusyorcommittedotherwisetopursuelearning(71%),followedbylackofincentivesorbenefitsintheorganizationforpursuinglearning,andlackof
Page 6
K Y SHRM TA LENT A L IGNMENT SURVEY R EPORT P AGE 6
promotionbymanagement(30%).6%ofrespondentssaidthatworkersdonotneedadditional
• 50%ofrespondentsindicatedthattheydidnotcurrentlyworkwithalocaleducationprovidertoassessskillgapsthatcanbeaddressedthrougheducationalinstitutions’programofferingsandcurricula.
• 73%ofrespondentswhodonotcurrentlypartnerwitheducationinstitutionseitherdefinitelyorpossiblymightconsiderdoingso.Anadditional13%saytheymightconsidersuchapartnershipinthefuture.
• Educationwasconsideredinfluentialinhelpingrespondentsachievetheirorganizationalgoals.Onascaleof1–100theaverageratingwas72acrossallorganizationalgoals,withalowof69ontheaverageforrecruitmentofnewemployees,andahighof75ontheaveragefor[increasingcustomer/clientsatisfaction.Aratingof1wouldindicatenoinfluenceandaratingof100wouldindicatethateducationisveryinfluential.
NOTE:Thesedataarepreliminary,representingasnapshotofcommunitiesataspecifictime.Datawilllikelychangewithadditionalsurveycompletions.Uptodateinformationcanbeseenonourinteractivedatadashboardathttps://www.bridgingthetalentgap.org/dashboard/.Useofanyofthesedatainexternalorinternalpublicationsshouldbenotedasfollows:“KentuckySocietyforHumanResourceManagement,TheGraduate!NetworkBridgingTheTalentGapProject.2017.TheTalentAlignmentSurvey.”[Note:somesurveyquestionscontainedintheTalentAlignmentSurveyarefromSocietyforHumanResourceManagement’s(SHRM’s)“LocalSkillsShortages”surveyandwereusedwithpermissionfromSHRM.]Forquestionsoradditionalinformation,pleasecontactBridgettStrickler,DirectorofNetworkEngagementandCo-PrincipalInvestigator,[email protected]
Page 7
K Y SHRM TA LENT A L IGNMENT SURVEY R EPORT
AppendixTheKentuckySHRM-BridgingTheTalentGapSurvey2017
Approximatelyhowmanypeopleareemployedbyyourorganization,full-timeandpart-time,atyourworklocation?(Pleaseexcludeoutsidecontractorsfromyourcount.)
Value Percent Count
Self-employed 3.2% 37
1-10employees 10.1% 117
11-50employees 13.7% 158
51-200employees 28.2% 326
201-500employees 20.6% 238
501-1,000employees 10.1% 117
1,001-5,000employees 8.7% 101
5,001-10,000employees 2.1% 24
Morethan10,000employees 3.2% 37
Total 1,155
0 5 10 15 20 25 30
Self-employed
1- 10employees
11- 50employees
51- 200employees
201- 500employees
501- 1,000employees
1,001- 5,000employees
5,001- 10,000employees
Morethan10,000employees
Page 8
K Y SHRM TA LENT A L IGNMENT SURVEY R EPORT
ThissurveyclassifiesindustriesaccordingtoamodifiedversionoftheNAICScodingsystemdefinedbytheUSCensusBureau.Pleaseselectuptofiveindustriesfortheorganizationforwhichyouareprovidinginput.
Value Percent Count
AccommodationandFoodServices 4.1% 44
AdministrativeandSupportandWasteManagementandRemediationServices 4.5% 48
Agriculture,Forestry,FishingandHunting 2.2% 24
Arts,Entertainment,andRecreation 2.4% 26
Construction 4.5% 49
EducationalServices 8.3% 89
FinanceandInsurance 9.2% 99
HealthCareandSocialAssistance 14.7% 158
GovernmentAgencies 7.3% 79
Information 2.6% 28
Manufacturing 27.1% 292
Mining 1.2% 13
PersonalandLaundryServices 0.8% 9
Professional,Scientific,andTechnicalServices 12.2% 131
RealEstateandRentalandLeasing 1.4% 15
Religious,Grantmaking,Civic,Professional,andSimilarOrganizations 3.1% 33
RepairandMaintenance 4.5% 48
RetailTrade 4.4% 47
TransportationandWarehousing 7.0% 75
Utilities 4.0% 43
WholesaleTrade 1.6% 17
Other-WriteIn 13.0% 140
Page 9
K Y SHRM TA LENT A L IGNMENT SURVEY R EPORT
Overall,howwouldyoudescribetheeconomicconditionsinyourcommunityorarea?
Value Percent Count
Extremelynegative 1.5% 16
Negative 5.4% 58
Somewhatnegative 15.2% 165
Neithernegativenorpositive 9.9% 107
Somewhatpositive 35.6% 385
Positive 30.1% 326
Extremelypositive 2.3% 25
Total 1,082
0 5 10 15 20 25 30 35 40
Extremelynegative
Negative
Somewhatnegative
Neithernegativenorpositive
Somewhatpositive
Positive
Extremelypositive
Page 10
K Y SHRM TA LENT A L IGNMENT SURVEY R EPORT
Overthenext3to5years,whatisyourorganization’sprojectedgrowth?
Value Percent Count
Fastdecline-lossofjobsand/orpossiblyofbusiness 0.8% 9
Moderatedecline 2.6% 28
NoGrowth 11.9% 129
Moderategrowth 66.6% 721
Fastgrowth 14.0% 152
Don'tknow 4.0% 43
Total 1,082
0 10 20 30 40 50 60 70
Fastdecline- lossofjobsand/orpossiblyofbusiness
Moderatedecline
NoGrowth
Moderategrowth
Fastgrowth
Don'tknow
Page 11
K Y SHRM TA LENT A L IGNMENT SURVEY R EPORT
Isyourorganizationcurrentlyhiringforanyofthefollowing?
Yes No
Count Count
Full-timeregularstaff 828 249
Part-timeregularstaff 415 657
Temporarystaff(nooptiontobecomefull-timeorpart-timestaff) 319 754
Temporary-to-regularstaff 374 698
Page 12
K Y SHRM TA LENT A L IGNMENT SURVEY R EPORT
Atwhatlevel(s)isyourorganizationcurrentlyhiringfull-timeregularstaff?(Checkallthatapply.)
Value Percent Count
Executive/uppermanagement(e.g.,CEO,CFO) 10.9% 88
Othermanagement(e.g.,directors,managers) 42.6% 343
Non-managementsalariedemployees 55.5% 447
Non-managementhourlyemployees 86.1% 694
0
10
20
30
40
50
60
70
80
90
100
Executive/uppermanagement(e.g.,
CEO,CFO)
Othermanagement(e.g.,directors,managers)
Non-managementsalariedemployees
Non-managementhourlyemployees
Page 13
K Y SHRM TA LENT A L IGNMENT SURVEY R EPORT
Howwouldyoudescribethetypesofthefull-timeregularpositionsyourorganizationiscurrentlyhiring?(Checkallthatapply)
Value Percent Count
Directreplacementsofexistingpositions—requiringnonewskills 81.6% 656
Newdutiesaddedtoexistingpositions—requiringsomeadditionalnewskills 31.8% 256
Completelynewpositions—butnotrequiringnewskillsets. 35.1% 282
Completelynewpositions—requiringnewskillsets 25.6% 206
0
10
20
30
40
50
60
70
80
90
Directreplacementsofexistingpositions—
requiringnonewskills
Newdutiesaddedtoexistingpositions—requiringsome
additionalnewskills
Completelynewpositions—butnot
requiringnewskillsets.
Completelynewpositions—requiring
newskillsets
Page 14
K Y SHRM TA LENT A L IGNMENT SURVEY R EPORT
HasyourorganizationhiredanyworkersfromoutsidetheU.S.inanattempttofillkeyfull-timeregularpositionsthathavebeendifficulttofillwithU.S.workers?
Value Percent Count
Yes 18.3% 147
No,butweareconsidering 4.9% 39
No,butwehaveplanstodosointhenext12months 0.7% 6
No 67.7% 544
Don'tknow 8.3% 67
Total 803
0
10
20
30
40
50
60
70
80
Yes No,butweareconsidering
No,butwehaveplanstodosoin
thenext12months
No Don'tknow
Page 15
K Y SHRM TA LENT A L IGNMENT SURVEY R EPORT
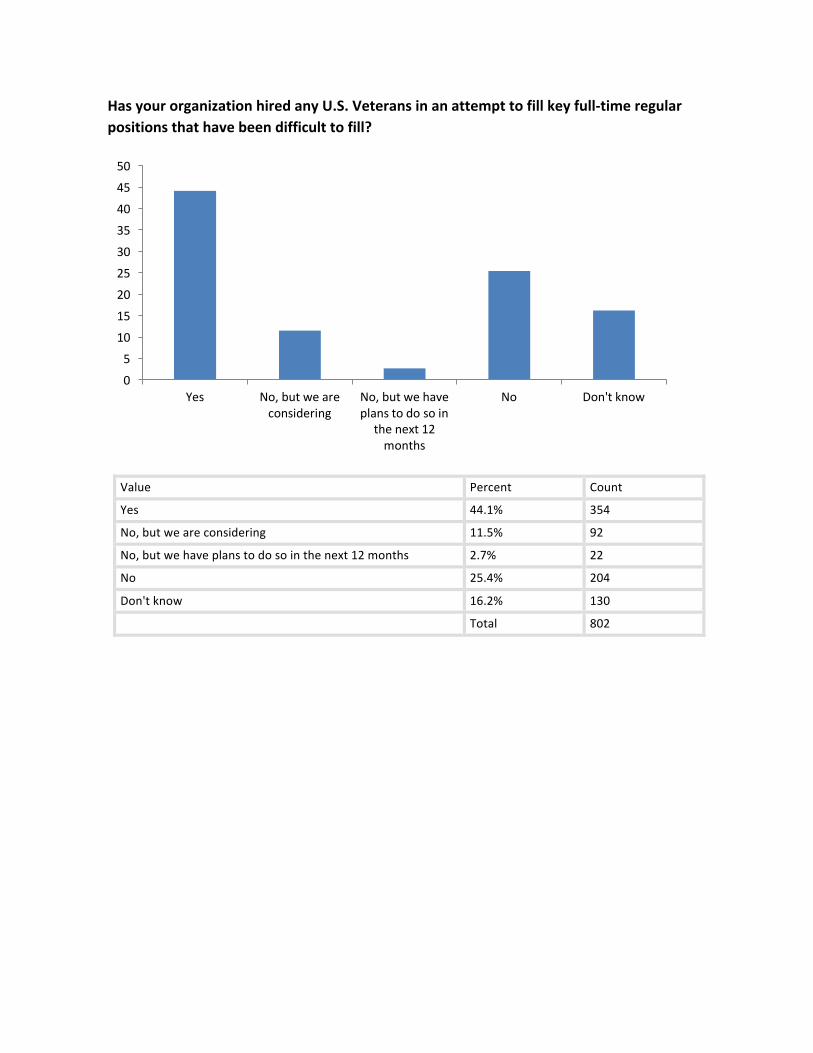
HasyourorganizationhiredanyU.S.Veteransinanattempttofillkeyfull-timeregularpositionsthathavebeendifficulttofill?
Value Percent Count
Yes 44.1% 354
No,butweareconsidering 11.5% 92
No,butwehaveplanstodosointhenext12months 2.7% 22
No 25.4% 204
Don'tknow 16.2% 130
Total 802
05101520253035404550
Yes No,butweareconsidering
No,butwehaveplanstodosoin
thenext12months
No Don'tknow
Page 16
K Y SHRM TA LENT A L IGNMENT SURVEY R EPORT
Inthecurrentlabormarket,areyouhavingadifficulttimerecruitingforcertaintypesofpositionsthatareopeninyourorganization?
Value Percent Count
Yes 84.0% 658
No 12.5% 98
Don'tKnow 3.4% 27
Total 783
0
10
20
30
40
50
60
70
80
90
Yes No Don'tKnow
Page 17
K Y SHRM TA LENT A L IGNMENT SURVEY R EPORT
Forthenew,full-timeregularpositionsbeingcreatedbyyourorganizationthatrequirenewanddifferentskillsets,howeasyordifficultisittofindqualifiedindividualsforthosepositions?
Value Percent Count
Veryeasy 1.6% 8
Somewhateasy 13.6% 66
Somewhatdifficult 61.3% 298
Verydifficult 23.5% 114
Total 486
0
10
20
30
40
50
60
70
Veryeasy Somewhateasy Somewhatdifficult Verydifficult
Page 18
K Y SHRM TA LENT A L IGNMENT SURVEY R EPORT
Howeasyordifficulthasitbeentofillthefollowingjobcategoriesforfull-timeregularpositions?
Veryeasy
Somewhateasy
Somewhatdifficult
Verydifficult
Notapplicable
Count Count Count Count Count
AccountingandFinanceProfessionals 20 198 203 60 299
AdministrativeSupportStaff 68 305 178 30 201
CustomerServiceRepresentatives 35 183 160 44 360
Drivers 16 66 90 54 556
Engineers 5 41 110 126 500
High-SkillMedical(nurses,doctors,specialists) 7 20 59 100 596
HourlyLaborers 38 155 222 123 244
HRProfessionals 27 156 173 37 388
ManagersandExecutives 13 145 298 101 226
ProductionOperators 19 70 150 71 472
SalesRepresentatives 11 95 121 72 482
Scientists 4 15 37 40 685
SkilledTrades(electricians,carpenters,machinists,mechanics,welders,plumbers)
7 59 146 207 362
RespondentEnteredItems(verbatim)AdmissionRep 0 1 0 0 0
Architects 0 0 0 1 0
Attorneys 1 0 0 0 0
Barbers 0 0 0 1 0
BusinessAnalyst-I.T. 0 0 0 1 0
CNAs 0 0 0 2 0
CallCenterReps 0 0 1 0 0
CaseManagement 0 0 1 0 0
CertifiedNurseAssistant(CNA) 0 0 1 0 0
CertifiedNursingAssistants 0 0 0 1 0
CertifiedSurgicalAssistants 0 0 0 1 0
ClaimsAnalystswithhealthcarecertifications 0 0 0 1 0
CollectonSpecialists 0 0 0 1 0
CommercialPropertyManagers 0 0 0 1 0
Computer/Technology 0 0 0 1 0
ControlsEngineer 0 0 0 1 0
Cooksandservers 0 0 0 1 0
Dependabletemporaryassociates 0 0 0 1 0
DeputyJailers 0 0 0 1 0
Detailer/Drafter 0 0 0 1 0
Page 19
K Y SHRM TA LENT A L IGNMENT SURVEY R EPORT
Dietary/Kitchen 0 0 0 1 0
DirectCareProviders 0 0 1 0 0
DirectSupportProfessionals 0 0 0 1 0
EarlyChildhoodEducationTeachersages1-12years 0 0 0 1 0
Education 0 0 0 1 0
EducationStaff(Teachers,InstuctionalAssistants) 0 0 0 1 0
EnrollmentandMatchsupportSpecialists 0 0 1 0 0
ExtensionAgents 0 1 0 0 0
FoodandBeverageEmployees-bothcookandservers 0 0 0 1 0
ForkliftDrivers/MaterialHandlers 0 0 0 1 0
ForkliftOperators 0 0 0 1 0
HVAC&plumberswithjourneymanlicense 0 0 0 1 0
HealthcareSupportServices 0 0 1 0 0
HighSkilledClinicalStaff(CMA's,RMA',sLPN's) 0 0 0 1 0
Hospitality 0 0 1 0 0
Housekeeping 0 0 1 0 0
HumanServices/RNs 0 0 1 0 0
IT 0 0 2 2 0
ITProfessionals 0 0 0 1 0
ITprofessional 1 0 0 0 0
InformationTechnologyManagers 0 0 0 1 0
Instructors 0 0 1 0 0
Instructorsinspecializedfields 0 0 0 1 0
Insurance/Mortgage 0 0 0 1 0
Janitorial 0 0 1 0 0
KitchenDesigners 0 0 1 0 0
LPN 0 0 0 1 0
LandSurveyor 0 0 0 1 0
LegalSecretaries 0 0 0 1 0
LicensedClinicians/MentalHealthTherapists 0 0 0 1 0
Machinist-Tool&Die 0 0 1 0 0
MedicalAssistant/PharmacyTech/CallCenter 0 0 1 0 0
MedicalCollectionSpecialists 0 0 0 1 0
MortgageLendingStaff 0 0 0 1 0
N/A 0 0 0 0 1
NursesandC.N.As 0 0 0 1 0
Painttintedandstainmatching 0 0 1 0 0
Part-timehourly 0 0 0 1 0
PhilanthropyProfessionals 0 0 0 1 0
Physicians 0 0 0 1 0
Page 20
K Y SHRM TA LENT A L IGNMENT SURVEY R EPORT
PoliceRecruit 0 1 0 0 0
ProcessOperators 0 0 0 1 0
Programmers 0 0 0 1 0
ProjectManagers 0 1 0 0 0
PublicAdministrators 1 0 0 0 0
RegistrationClerks 0 0 1 0 0
ReseidentialTreatmentSpecialists 0 0 1 0 0
ShippingDockHelpers 0 0 0 1 0
SocialServiceWorkers 0 0 1 0 0
SocialWorkers 0 0 1 0 0
SoftwareDevelopers 0 0 0 1 0
Softwaredevelopers 0 0 0 1 0
SpecializedITpositions,high-levelfinancepositions 0 0 0 1 0
SupplyChain 0 1 0 0 0
SystemsAdministrators 0 0 0 1 0
TalentDevelopmentSpecialists 0 0 1 0 0
TeamLead/Trainer 0 0 1 0 0
TechnicalProfessionals(i.e.developers,systemsengineers) 0 0 1 0 0
TechnicalSystemsAnalysts 0 0 1 0 0
Technicians 0 0 0 1 0
Tellers 0 0 0 1 0
ValidationSpecialists(regardingPharmaindustry) 0 0 0 1 0
Warehouse 0 0 0 1 0
Weareastaffingagency,soI'malwayslookingfortemporarylightindustriallabor,nurses,etc.
0 0 1 0 0
casemanagement 0 0 1 0 0
directserviceproviders 0 0 0 1 0
entrylevelhealthcare 0 0 0 1 0
entrylevel-minimumwagetypepositions 0 0 0 1 0
heavyequipment/mobilecrane&shearoperators 0 0 0 1 0
security 0 1 0 0 0
welders 0 0 1 0 0
Page 21
K Y SHRM TA LENT A L IGNMENT SURVEY R EPORT
Whatarethemainreasonsyourorganizationexperiencesdifficultyinhiringqualifiedcandidatesforfull-timeregularpositions?(Checkallthatapply.)
Value Percent Count
Candidatesdonothavehighenoughlevelsofeducation/training 27.4% 180
Candidatesdonothavetheneededcredentials/certifications 31.8% 209
Candidatesdonothavetherightskillsforthejob 53.6% 352
Candidatesdonothavetherightworkexperience 53.6% 352
Candidatesareoverqualified 9.4% 62
Qualifiedcandidatesarenotinterestedinmovingtoourlocalarea 26.2% 172
Qualifiedcandidatesarenotwithinoursalaryrangeorhourlyraterange 49.5% 325
Ourlocaleducation/trainingsystemdoesnotproduceenoughworkready/qualifiedjobcandidates
26.0% 171
Lownumberofapplicants 52.5% 345
Lackofinterestintypeofjob 34.4% 226
Competitionfromotheremployers 58.6% 385
Don'tknow 1.7% 11
Other-WriteIn 13.4% 88
0 20 40 60 80
Don'tknow
Candidatesareoverqualified
Other- WriteIn
Ourlocaleducation/trainingsystemdoesnotproduceenoughwork…
Qualifiedcandidatesarenotinterestedinmovingtoourlocalarea
Candidatesdonothavehighenoughlevelsofeducation/training
Candidatesdonothavetheneededcredentials/certifications
Lackofinterestintypeofjob
Qualifiedcandidatesarenotwithinoursalaryrangeorhourlyrate…
Lownumberofapplicants
Candidatesdonothavetherightskillsforthejob
Candidatesdonothavetherightworkexperience
Competitionfromotheremployers
Page 22
K Y SHRM TA LENT A L IGNMENT SURVEY R EPORT
Pleaseestimatethepercentageofopenfull-timeregularpositionsatyourorganizationoverthelast12monthsforeachofthefollowingcategories.Allthenumbersyouenterneedtoaddupto100.
Item AveragePercent
TotalResponses
Nominimumeducationrequirements 16.2% 659
Minimumhigh-schooldiplomaorequivalent 46.0% 840
Minimumofatechnicalcollegeorcommunitycollegecredential 21.2% 735
Minimumofabachelor'sdegree 28.2% 825
Minimumofanadvanceddegree(e.g.,Masters,PhD,MD,JD,etc.) 10.1% 639
Page 23
K Y SHRM TA LENT A L IGNMENT SURVEY R EPORT
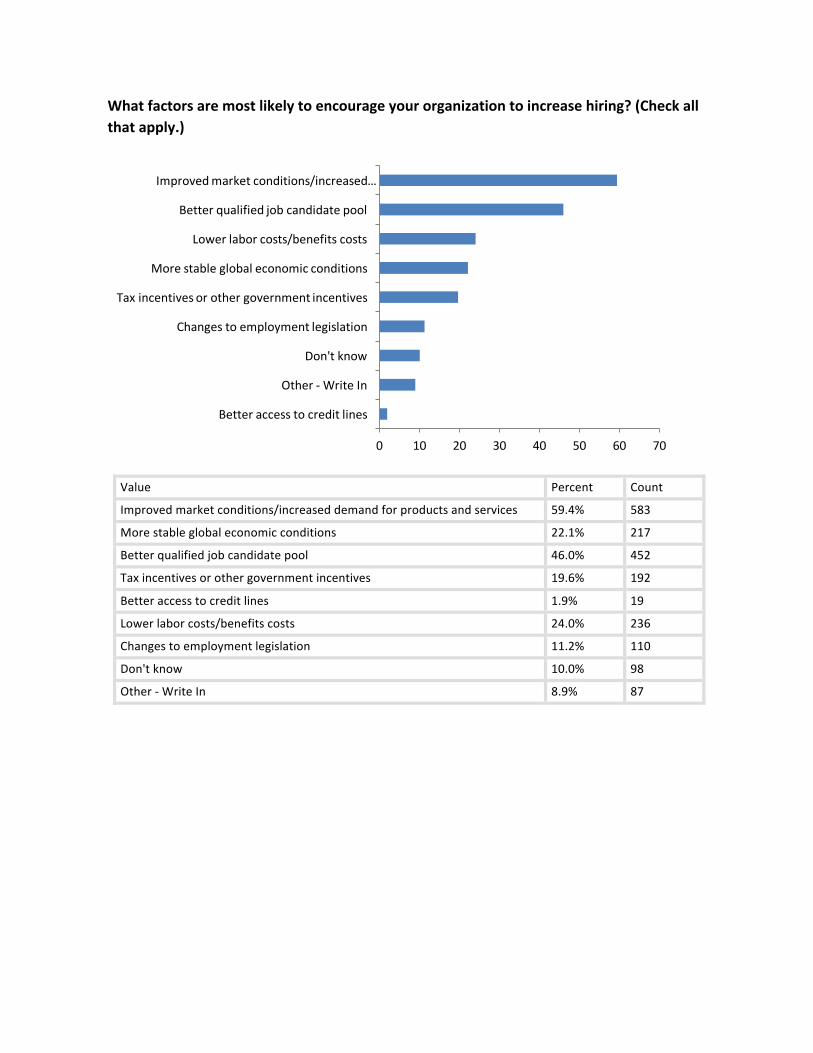
Whatfactorsaremostlikelytoencourageyourorganizationtoincreasehiring?(Checkallthatapply.)
Value Percent Count
Improvedmarketconditions/increaseddemandforproductsandservices 59.4% 583
Morestableglobaleconomicconditions 22.1% 217
Betterqualifiedjobcandidatepool 46.0% 452
Taxincentivesorothergovernmentincentives 19.6% 192
Betteraccesstocreditlines 1.9% 19
Lowerlaborcosts/benefitscosts 24.0% 236
Changestoemploymentlegislation 11.2% 110
Don'tknow 10.0% 98
Other-WriteIn 8.9% 87
0 10 20 30 40 50 60 70
Betteraccesstocreditlines
Other- WriteIn
Don'tknow
Changestoemploymentlegislation
Taxincentivesorothergovernmentincentives
Morestableglobaleconomicconditions
Lowerlaborcosts/benefitscosts
Betterqualifiedjobcandidatepool
Improvedmarketconditions/increased…
Page 24
K Y SHRM TA LENT A L IGNMENT SURVEY R EPORT
Foreachbasicskillbelow,selectwhetherornottheeducationleveloftherecruitmentandcurrentworkerlaborpoolgenerallypossessesthatskill.Pleaseanswerallitemsbyclickingonthedrop-downboxandmakingyourselection.
Highschoolgraduates
Technicalcollege/Communitycollegegraduates
Four-yearcollegegraduates
Count Count Count
Engineering/Technical
Yes 122 387 449
No 378 135 83
Don'tknow 100 109 108
Notapplicable 252 219 214
Englishlanguage(spoken)
Yes 699 682 726
No 78 54 29
Don'tknow 38 38 32
Notapplicable 38 75 64
Readingcomprehension(inEnglish)
Yes 601 637 703
No 141 77 41
Don'tknow 62 56 43
Notapplicable 44 75 62
WrittenEnglish(grammar,spelling,etc.)
Yes 471 581 686
No 279 143 70
Don'tknow 59 51 39
Notapplicable 47 74 56
ForeignLanguages
Yes 83 70 154
No 304 289 217
Don'tknow 155 175 171
Notapplicable 305 310 306
Government/Economics
Yes 110 173 323
No 248 170 88
Don'tknow 148 166 128
Notapplicable 343 335 306
History/Geography
Yes 151 160 243
No 160 137 85
Page 25
K Y SHRM TA LENT A L IGNMENT SURVEY R EPORT
Don'tknow 146 155 138
Notapplicable 395 394 382
Humanities/Arts
Yes 123 153 282
No 184 145 76
Don'tknow 166 168 133
Notapplicable 375 377 356
Mathematics
Yes 413 532 606
No 224 99 59
Don'tknow 114 93 71
Notapplicable 97 119 112
Science
Yes 169 267 352
No 204 108 72
Don'tknow 161 156 133
Notapplicable 317 315 291
Page 26
K Y SHRM TA LENT A L IGNMENT SURVEY R EPORT
Foreachbasicskillbelow,selectwhetherornottheeducationleveloftherecruitmentandcurrentworkerlaborpoolgenerallypossessesthatskill.Pleaseanswerallitemsbyclickingonthedrop-downboxandmakingyourselection.
Highschoolgraduates
Technicalcollege/Communitycollegegraduates
Four-yearcollegegraduates
Count Count Count
Diversity(e.g.,theabilitytoworkwellwithadiverseworkforceandcustomerbase)
Yes 448 515 627
No 215 126 62
Don'tknow 130 122 100
Notapplicable 51 78 55
InformationTechnologyApplication
Yes 350 580 633
No 291 78 58
Don'tknow 115 92 78
Notapplicable 86 91 77
Leadership
Yes 169 305 542
No 489 316 145
Don'tknow 125 147 106
Notapplicable 63 74 51
ProblemSolving
Yes 270 495 618
No 397 176 98
Don'tknow 134 103 82
Notapplicable 45 69 49
Teamwork/Collaboration
Yes 428 545 641
No 263 132 74
Don'tknow 114 99 80
Notapplicable 39 66 51
Writtencommunication
Yes 354 526 676
No 364 164 68
Don'tknow 81 82 48
Notapplicable 46 69 52
Page 27
K Y SHRM TA LENT A L IGNMENT SURVEY R EPORT
Howdoesyourorganizationmeasureemployees’skilland/orprofessionaldevelopmentdeficiencies?(Checkallthatapply.)
Value Percent Count
Employeesevaluatetheirownskillsanddevelopmentandidentifyareasforimprovement
33.9% 291
Individualskillsassessments(i.e.,tests) 39.8% 342
Jobperformanceevaluations(i.e.,usingperformancemetrics) 82.7% 710
On-the-jobinterviews 44.2% 380
Supervisor/managerobservation 87.7% 753
Teamskillsgapanalysis 10.5% 90
Notapplicable,myorganizationdoesnotmeasureemployees’skillsand/orprofessionaldevelopmentneeds
3.0% 26
Other-WriteIn 3.3% 28
Don'tknow 0.8% 7
0 10 20 30 40 50 60 70 80 90 100
Don'tknow
Notapplicable,myorganizationdoesnotmeasure…
Other- WriteIn
Teamskillsgapanalysis
Employeesevaluatetheirownskillsand…
Individualskillsassessments(i.e.,tests)
On-the-jobinterviews
Jobperformanceevaluations(i.e.,using…
Supervisor/managerobservation
Page 28
K Y SHRM TA LENT A L IGNMENT SURVEY R EPORT
Overthenext5years,doyouanticipatethatyourorganization’sneedforemployeesatthefollowingeducationlevelswillincrease,staythesameordecrease?
Increase Staythesame
Decrease N/A(Notneededcurrentlyorinnext5years)
Count Count Count Count
Aminimumofahighschooldiplomaorequivalent 282 434 43 61
Aminimumofanindustryorprofessionalassociationcredential 336 367 11 106
Aminimumofapost-secondarycertificate 248 430 16 128
Aminimumofatechnicalcollegediplomaorcertificate 306 387 12 116
AminimumofanAssociate’sdegree 237 447 16 120
AminimumofaBachelor’sdegree 334 390 12 80
Aminimumofanadvanceddegree(e.g.,Masters,PhD,MD,JD,etc.)
157 383 18 260
Page 29
K Y SHRM TA LENT A L IGNMENT SURVEY R EPORT
Whichofthefollowingistrueforyourorganization?(Selectallthatapply.)
Value Percent Count
Weprovidefinancialsupportforouremployeestopursuecollegelevelcourses.
58.3% 479
Weprovidefinancialsupportforouremployeestopursueeducation,learningortrainingprovidedbyoutsideagenciesthatisnotcollegecoursework.
54.9% 451
Weprovideon-the-jobinternaleducation,learningortrainingforouremployees.
81.0% 666
Weprovidesupportforouremployeestopursueeducation,learningortraininginotherwaysbesidesfinancialsupport.
52.4% 431
Other-WriteIn
2.8% 23
Noneoftheabove
5.5% 45
0 10 20 30 40 50 60 70 80 90
Noneoftheabove
Other- WriteIn
Weprovidesupportforouremployeestopursueeducation,learningortrainingi
Weprovideon-the-jobinternaleducation,learningortrainingforouremployees
Weprovidefinancialsupportforouremployeestopursueeducation,learningor
Weprovidefinancialsupportforouremployeestopursuecollegelevelcourses.
Page 30
K Y SHRM TA LENT A L IGNMENT SURVEY R EPORT
Forwhichofthefollowingdoesyourorganizationprovidefinancialbenefitsforeducation,learningortraining?(Selectasmanyasapply)
Value Percent Count
Allemployees 64.5% 379
Employeeswithidentifiedskillsand/orprofessionaldevelopmentdeficiencies 28.4% 167
Employeeswhorequestskillstrainingand/orprofessionaldevelopment 37.8% 222
Myorganizationdoesnotprovideorpayforskillstrainingand/orprofessionaldevelopmentforitsemployees
1.0% 6
Other-Pleasespecify 10.7% 63
Don'tknow 0.2% 1
0 10 20 30 40 50 60 70
Don'tknow
Other- Pleasespecify
Myorganizationdoesnotprovideorpayforskillstrainingand/orprofessional
Employeeswhorequestskillstrainingand/orprofessionaldevelopment
Employeeswithidentifiedskillsand/orprofessionaldevelopmentdeficiencies
Allemployees
Page 31
K Y SHRM TA LENT A L IGNMENT SURVEY R EPORT
Whatlocaleducation/traininggroupsdoesyourorganizationworkwithtotrainemployees?(Checkallthatapply.)
Value Percent Count
Technical/vocationalcollege 43.4% 255
Communitycollegeoruniversity 60.5% 356
Workforceboard 16.5% 97
Communitygroups 21.3% 125
Cooperativegroupofsimilarorganizations 23.6% 139
Other-WriteIn 17.0% 100
Don'tknow 12.8% 75
0 10 20 30 40 50 60 70
Don'tknow
Workforceboard
Other- WriteIn
Communitygroups
Cooperativegroupofsimilarorganizations
Technical/vocationalcollege
Communitycollegeoruniversity
Page 32
K Y SHRM TA LENT A L IGNMENT SURVEY R EPORT
Doesyourorganizationprovideanyofthefollowingmethodsofsupportingyouremployees’educationalgoals?(Pleaseselectallthatapply.)
Value Percent Count
Makeofficecomputers/technologyavailabletoemployeesforstudyingandschoolworkafterscheduledworkhours.
34.5% 148
Allowemployeestohavebreaksforstudywhileatwork. 19.8% 85
Allowflexibleworkschedulestoaccommodateemployees'classes. 71.3% 306
Invitehighereducationorotherlearningproviderstoyourorganization'slocationtotalkabouteducationalopportunities.
25.2% 108
Adviseemployeesonwhichdegreeswillbenefittheircareer. 44.3% 190
Publiclyrecognizeemployeeswhohavegraduatedorachievedsignificanteducationalmilestones.
44.1% 189
Other-WriteIn 4.4% 19
Don'tknow 6.8% 29
0 10 20 30 40 50 60 70 80
Other- WriteIn
Don'tknow
Allowemployeestohavebreaksforstudywhileatwork.
Invitehighereducationorotherlearningproviderstoyourorganization'slocat
Makeofficecomputers/technologyavailabletoemployeesforstudyingandschool
Publiclyrecognizeemployeeswhohavegraduatedorachievedsignificanteducatio
Adviseemployeesonwhichdegreeswillbenefittheircareer.
Allowflexibleworkschedulestoaccommodateemployees'classes.
Page 33
K Y SHRM TA LENT A L IGNMENT SURVEY R EPORT
Hasyourorganizationconsideredanyofthefollowingmethodsofsupportingyouremployees’educationalgoals?(Pleaseselectallthatapply.)
Value Percent Count
Makeofficecomputers/technologyavailabletoemployeesforstudyingandschoolworkafterscheduledworkhours.
6.7% 3
Allowemployeestohavebreaksforstudywhileatwork. 8.9% 4
Allowflexibleworkschedulestoaccommodateemployees'classes. 28.9% 13
Invitehighereducationorotherlearningproviderstoyourorganization'slocationtotalkabouteducationalopportunities.
4.4% 2
Adviseemployeesonwhichdegreeswillbenefittheircareer. 2.2% 1
Publiclyrecognizeemployeeswhohavegraduatedorachievedsignificanteducationalmilestones.
6.7% 3
Other-WriteIn 11.1% 5
Don'tknow 55.6% 25
0 10 20 30 40 50 60
Adviseemployeesonwhichdegreeswillbenefittheircareer.
Invitehighereducationorotherlearningproviderstoyourorganization'slocat
Makeofficecomputers/technologyavailabletoemployeesforstudyingandschool
Publiclyrecognizeemployeeswhohavegraduatedorachievedsignificanteducatio
Allowemployeestohavebreaksforstudywhileatwork.
Other- WriteIn
Allowflexibleworkschedulestoaccommodateemployees'classes.
Don'tknow
Page 34
K Y SHRM TA LENT A L IGNMENT SURVEY R EPORT
Doesyourorganizationworkwithlocaleducationandtrainingproviderstohelpthemassesslocalskillsgapsthatcanbeaddressedthroughtheirprogramofferingsandcurricula?
Value Percent Count
Yes 35.0% 287
No 50.1% 410
Don'tknow 14.9% 122
Total 819
0
10
20
30
40
50
60
Yes No Don'tknow
Page 35
K Y SHRM TA LENT A L IGNMENT SURVEY R EPORT
Whatlocaleducation/traininggroupsdoesyourorganizationworkwithtoassesslocalskillsgaps?(Checkallthatapply.)
Value Percent Count
Technical/vocationalcollege 65.5% 188
Communitycollegeoruniversity 66.6% 191
Workforceboard 34.5% 99
Communitygroups 34.1% 98
Cooperativegroupofsimilarorganizations 29.3% 84
Other-WriteIn 9.4% 27
Don'tknow 2.1% 6
0 10 20 30 40 50 60 70
Don'tknow
Other- WriteIn
Cooperativegroupofsimilarorganizations
Communitygroups
Workforceboard
Technical/vocationalcollege
Communitycollegeoruniversity
Page 36
K Y SHRM TA LENT A L IGNMENT SURVEY R EPORT
Howimportantiseachgoallistedbelowtoyourorganization'ssuccess?Foreachgoallistedbelow,movetheslidercontroltothelevelthatbestreflectsthisimportance.Ifyouthinktheimportanceforagivengoalisalreadydisplayed,thenclickontheslidercontrol.
Developmentofemployeeleadershipskills
Developmentofemployees'professionalskills
0
20
40
60
80
100
120
0 20 33 38 41 44 49 52 55 58 61 64 67 70 73 76 79 82 85 88 91 94 97 100
0
20
40
60
80
100
120
140
0 21 30 36 40 47 50 53 56 59 62 65 68 71 74 77 80 83 86 89 92 95 98
Page 37
K Y SHRM TA LENT A L IGNMENT SURVEY R EPORT
Employeeadvancementwithinyourorganization
Increasingcustomer/clientsatisfaction
0
10
20
30
40
50
60
70
80
90
1000 8 13
20
29
32
37
41
44
48
51
54
57
60
63
66
69
72
75
78
81
84
87
90
93
96
99
0
50
100
150
200
250
300
0 4 25
40
42
46
50
52
54
57
59
61
63
65
67
69
71
73
75
77
79
81
83
85
87
89
91
93
95
97
99
Page 38
K Y SHRM TA LENT A L IGNMENT SURVEY R EPORT
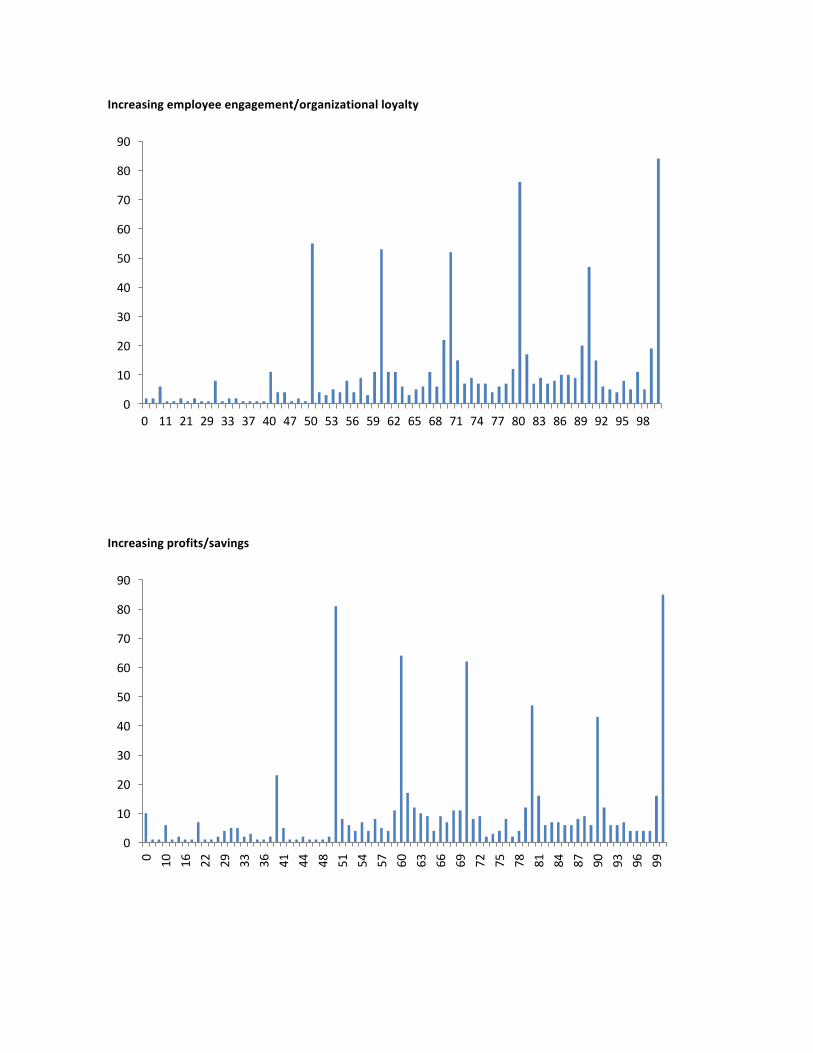
Increasingemployeeengagement/organizationalloyalty
Increasingprofits/savings
0
20
40
60
80
100
120
140
160
180
200
0 27 35 40 45 50 53 56 59 62 65 68 71 74 77 80 83 86 89 92 95 98
0
20
40
60
80
100
120
140
160
180
200
0 5 12
22
29
32
38
41
44
50
53
56
59
63
66
69
72
75
78
81
84
87
90
93
96
99
Page 39
K Y SHRM TA LENT A L IGNMENT SURVEY R EPORT
Increasingworkerproductivity
Recruitmentofnewemployees
0
20
40
60
80
100
120
140
160
180
1 19 39 45 48 51 54 57 60 63 66 69 72 75 78 81 84 87 90 93 96 99
0
20
40
60
80
100
120
140
0 10 20 30 35 39 43 49 53 56 59 62 65 68 71 74 77 80 83 86 89 92 95 98
Page 40
K Y SHRM TA LENT A L IGNMENT SURVEY R EPORT
Workerretention
0
50
100
150
200
250
0 10 22 40 44 48 51 54 57 60 63 66 69 72 75 78 81 84 87 90 93 96 99
Page 41
K Y SHRM TA LENT A L IGNMENT SURVEY R EPORT
Considertheimpactthatsuccessfuleducation,learningandtraininghaveonachievingyourorganization'sgoals.Foreachgoallistedbelow,movetheslidercontroltothelevelthatbestreflectstheinfluenceofyourorganization'seducationlearningandtrainingprogramsinachievingthatgoal.Ifyouthinktheinfluenceforagivengoalisalreadydisplayed,thenclickontheslidercontrol.
Developmentofemployeeleadershipskills
Developmentofemployees'professionalskills
0
10
20
30
40
50
60
70
80
90
0 10 28 31 40 44 47 50 53 56 59 62 65 68 71 74 77 80 83 86 89 92 95 98
0
10
20
30
40
50
60
70
80
90
0 10 30 38 42 47 51 55 58 61 64 67 70 73 76 79 82 85 88 91 94 97 100
Page 42
K Y SHRM TA LENT A L IGNMENT SURVEY R EPORT
Employeeadvancementwithinyourorganization
Increasingcustomer/clientsatisfaction
0
10
20
30
40
50
60
70
800 10
19
22
30
35
39
42
46
49
52
55
58
61
64
67
70
73
76
79
82
85
88
91
94
97
100
0
20
40
60
80
100
120
140
0 10
15
24
31
36
41
45
48
52
55
58
61
64
67
70
73
76
79
82
85
88
91
94
97
100
Page 43
K Y SHRM TA LENT A L IGNMENT SURVEY R EPORT
Increasingemployeeengagement/organizationalloyalty
Increasingprofits/savings
0
10
20
30
40
50
60
70
80
90
0 11 21 29 33 37 40 47 50 53 56 59 62 65 68 71 74 77 80 83 86 89 92 95 98
0
10
20
30
40
50
60
70
80
90
0 10
16
22
29
33
36
41
44
48
51
54
57
60
63
66
69
72
75
78
81
84
87
90
93
96
99
Page 44
K Y SHRM TA LENT A L IGNMENT SURVEY R EPORT
Increasingworkerproductivity
Recruitmentofnewemployees
0
10
20
30
40
50
60
70
80
90
100
0 16 28 32 40 45 48 52 55 58 61 64 67 70 73 76 79 82 85 88 91 94 97 100
0
10
20
30
40
50
60
70
80
90
0 10
14
19
22
25
29
34
37
40
46
49
52
55
58
61
64
67
70
73
76
79
82
85
88
91
94
97
100
Page 45
K Y SHRM TA LENT A L IGNMENT SURVEY R EPORT
Workerretention
0
20
40
60
80
100
1200 13
18
23
29
32
35
40
44
47
50
53
56
59
62
65
68
71
74
77
80
83
86
89
92
95
98
Page 46
K Y SHRM TA LENT A L IGNMENT SURVEY R EPORT
Approximatelywhatpercentofyourlearningbenefitsisutilizedannually?
0
10
20
30
40
50
60
0 10 20 30 40 50 60 70 80 90 100
Freq
uency
Percentage
Page 47
K Y SHRM TA LENT A L IGNMENT SURVEY R EPORT
Doesyourorganizationkeeptrackofanyofthefollowingoutcomesoflearning,education,ortraining?(Pleasecheckasmanyasareapplicable.)
Value Percent Count
Industry/professionalorganizationcertifications 54.8% 439
Post-secondarycertifications 37.2% 298
Collegecredentials 41.4% 332
Numberofhoursoflearningcompleted 37.0% 296
Other-WriteIn 5.9% 47
Wedonottrackanylearning,educationortrainingoutcomes 28.2% 226
0 10 20 30 40 50 60
Other- WriteIn
Wedonottrackanylearning,educationortrainingoutcomes
Numberofhoursoflearningcompleted
Post-secondarycertifications
Collegecredentials
Industry/professionalorganizationcertifications
Page 48
K Y SHRM TA LENT A L IGNMENT SURVEY R EPORT
Whydoyouthinkyourlearningbenefitsprogramisnotbeingutilizedmorefully?(Chooseasmanyasapply.)
Value Percent Count
Lackofinterestinourprograms 20.4% 163
Lackofknowledgeaboutourprograms 20.4% 163
Lackofpromotionbymanagement 21.9% 175
Workersdonotneedadditionalbenefitsinthisarea 4.3% 34
Workersaretoobusyorcommittedotherwisetopursuelearning 51.9% 415
Toodifficultforworkerstoaccessourbenefits 5.5% 44
Fewornooptionsforlearninginourarea 9.0% 72
Noincentivesorbenefitsinourorganizationforpursuinglearning 22.4% 179
Other-WriteIn 3.9% 31
Notapplicable 26.5% 212
0 10 20 30 40 50 60
Other- WriteIn
Workersdonotneedadditionalbenefitsinthisarea
Toodifficultforworkerstoaccessourbenefits
Fewornooptionsforlearninginourarea
Lackofinterestinourprograms
Lackofknowledgeaboutourprogams
Lackofpromotionbymanagement
Noincentivesorbenefitsinourorganizationforpursuinglearning
Notapplicable
Workersaretoobusyorcommittedotherwisetopursuelearning
Page 49
K Y SHRM TA LENT A L IGNMENT SURVEY R EPORT
Whatlevelofemployeemostoftentakesadvantageofyourlearningbenefits?
Value Percent Count
Entrylevelemployees 17.5% 140
Mid-levelemployees 44.4% 355
Executivelevelemployees 7.0% 56
Nodifferencesacrosslevelofemployee 14.9% 119
Notapplicable 16.1% 129
Total 799
0
5
10
15
20
25
30
35
40
45
50
Entrylevelemployees
Mid-levelemployees
Executivelevelemployees
Nodifferencesacrosslevelofemployee
Notapplicable
Page 50
K Y SHRM TA LENT A L IGNMENT SURVEY R EPORT P AGE 5 0
Wouldyourorganizationconsiderpartneringwithalocalpost-secondaryinstitutionorotherlearningprovidertosupporteducation,learningortrainingforyouremployees?
Value Percent Count
Yes,definitely 22.4% 179
Possibly,butIneedtolearnmoreaboutpartneringtomakeagooddecision 36.3% 290
Notatthistime,butImightbeinterestedinthefuture 10.6% 85
Notatthistimeanddonotanticipateanypartneringintheforeseeablefuture 11.1% 89
Ourorganizationalreadypartnerswithlocalcollegesorotherlearningproviders 14.4% 115
Other-WriteIn 5.1% 41
Total 799
0 5 10 15 20 25 30 35 40
Other- WriteIn
Notatthistime,butImightbeinterestedinthefuture
Notatthistimeanddonotanticipateanypartneringintheforeseeablefuture
Ourorganizationalreadypartnerswithlocalcollegesorotherlearningprovider
Yes,definitely
Possibly,butIneedtolearnmoreaboutpartneringtomakeagooddecision